MINNESOTA PROPERTY TAXES BY THE NUMBERS 2009 EDITION
|
|
|
- Richard Owens
- 6 years ago
- Views:
Transcription


1 MINNESOTA PROPERTY TAXES BY THE NUMBERS 2009 EDITION Jeff Van Wychen Minnesota 2020 Fellow April 2009
2 Table of Contents Executive Summary 1 Introduction-The Last Seven Years 5 Property Tax Data: 2002 to Conclusion: A Call for Accountability 19 Appendix A 20 Appendix B 23 References 26
3 Executive Summary Since 2002, Minnesota property taxes, in general, and homeowner property taxes, in particular, have increased rapidly. The cause of the statewide growth in property taxes is not growth in local government budgets. These property tax hikes are the result of state policies that require more public costs to be borne by property taxpayers and a larger share of total property taxes to be borne by homeowners. Of the 854 cities in Minnesota, 677 (79.3 percent) experienced an increase in per capita property taxes from 2002 to 2009, while 560 (65.6 percent) experienced an increase of ten percent or more. The average homestead * property tax among Minnesota cities has increased even more rapidly than per capita taxes. Of Minnesota s 854 cities, 746 (87.4 percent) saw an increase in the average homestead property tax from 2002 to 2009, while 530 (62.1 percent) experienced an increase of 20 percent or more. It is important to adjust for the impact of inflation when assessing changes in state and local government revenue over time so as to distinguish between real spending growth versus growth caused by erosion in the purchasing power of the dollar. In this report, all changes in tax and revenue amounts over time are adjusted for inflation in the cost of state and local government purchases, unless otherwise noted. Appendices A and B show growth from 2002 to 2009 in per capita property taxes and average homestead property taxes for all Minnesota cities with a population over 5,000. *A homestead refers to an owner-occupied housing unit. MN Property Taxes by the Numbers
4 On a statewide basis, the rapid growth in property taxes in Minnesota since 2002 cannot be attributed to growth in local government budgets. While the average Minnesota homestead property tax has increased by over 25 percent from 2002 to 2008, per capita county, city and township and per pupil school district revenue have all fallen. State Aid Cuts Force Property Taxes Up If growth in local government budgets does not explain the growth in property taxes, what does? State policies have caused property taxes, generally, and homestead property taxes, specifically, to increase rapidly since The primary cause of statewide property tax growth is reductions in state aid to local governments. From 2002 to 2008, state aid to local governments declined by $2.4 billion in 2008 dollars. In response to these aid reductions, local governments increased property taxes and cut spending, as illustrated below. On a statewide basis, local governments recovered slightly less than half of the $2.4 billion state aid reduction through property tax increases. The rest of the aid cut was made up for through cuts in funding for schools, roads, parks, public safety, and other public services. One thing is certain: the claim that statewide property tax growth in Minnesota since 2002 is the result of increased local government spending is demonstrably false. Growth in local spending could not have caused property tax increases during a period when local government budgets were shrinking. In fact, local governments have been tightening their belts much more than state government. Percent Change in Real Per Capita/Per Pupil State and Local FY (CY 02-08) Percent change from 6% 4% 2% 0% -2% -4% -6% -8% -10% -12% -14% -16% Government Revenue: FY 2003 to 2009 (CY 2002 to 2008) State revenues exclude federal recovery dollars -8.0% Total State Government Revenue (per capita) 3.2% Retained State Government Revenue** (per capita) -3.9% Total School District Revenue (per pupil) **Retained state government revenue is equal to total state government revenue minus transfers to local governments. Retained state revenue represents the dollars that the state keeps for state purposes, as opposed to sharing with local governments. 2 MN Property Taxes by the Numbers % Total City Revenue (per capita) -10.7% Total County Revenue* (per capita) *County revenue estimates incorporate an approximate adjustment for the partial state takeover of court administration costs. During the same period that state aid to local governments fell by $2.4 billion, the population that local governments must provide service to increased by approximately five percent (although statewide school enrollment declined by one percent). In addition, over this six year span, new testing requirements and higher standards were foisted on to school districts and additional state costs were shifted on to counties.
5 The basic pattern observed for all local governments is also apparent when we examine the three major levels of local government counties, cities, and school districts individually. For all three levels of government, cuts in state aid have caused both reduced funding for local services and higher property taxes. Homeowners Shoulder Higher Tax Burden However, state aid cuts do not explain why homestead property taxes have risen more rapidly than the average for all other types of property. The more rapid rate of growth in homestead property taxes since 2002 is largely attributable to repercussions of the state s 2001 tax act. Specifically: Changes in the rate at which various classes of property were assessed contributed to a shift of local taxes on to homesteads. While an initial increase in homestead property taxes in 2002 was prevented through the elimination of the general education property taxes, subsequent shifts in 2003 and 2004 were allowed to occur. The new market value homestead credit was structured in such a way that the amount of the credit would shrink as the taxable value of homesteads increased. As homestead taxable value increased, the amount of the credit fell and net homestead property taxes grew. In exchange for a sizeable reduction in local property taxes, the 2001 tax act imposed a new state property tax on businesses (and seasonal recreational properties). This state property tax was insulated from the state aid cuts that were pushing local property taxes upward. The fact that a portion of business property taxes were protected from the impact of state aid cuts is among the reasons that business property taxes have grown less rapidly than homestead property taxes since The phase-out of the limited market value program (i.e., a program that limits the rate of taxable value growth for homesteads and some other classes of property) contributed to homestead property tax increases in 2003 and for at least the next two years. Further compounding the growth in homestead property taxes are cuts in state funding for education, which have stimulated growth in referendum market value levies as school districts seek to replace declining state aid dollars. Referendum market value levies fall more heavily on homestead properties than do ordinary levies, thereby accelerating the rate of growth in homestead property taxes. MN Property Taxes by the Numbers
6 Fair, Progressive Tax Policy Needed State policymakers need to come clean about the true cause of rising property taxes in Minnesota. Since 2002, the rapid growth in property taxes, in general, and homestead property taxes, in particular, is primarily the result of state policies, not local spending decisions. True reform to the property tax and state aid systems will not come about until policymakers acknowledge or citizens compel them to acknowledge the real causes of property tax increases. Minnesota 2020 is calling on state leaders to stop large state aid cuts that result in additional increases to local property taxes and to fix state policies that shift a greater share of property taxes on to homeowners over time. At the same time, state leaders must ensure that Minnesota s tax system is fair and progressive by ensuring that a disproportionate share of the cost of public services and infrastructure is not borne by families with the least ability to pay. A fair tax system is needed in Minnesota to ensure a balanced budget, healthy communities, and a thriving statewide economy. 4 MN Property Taxes by the Numbers 2009
7 Introduction - The Last Seven Years Property taxes in Minnesota have increased well above the rate of inflation and population growth over the last seven years. For the most part, the growth in per capita property taxes since 2002 has not been the result of growth in local government spending, but of state aid cuts. Tax payable year 2002 is the baseline year in this analysis because it was a transitional year for Minnesota s property tax system. In the preceding year, the legislature enacted a series of changes to Minnesota s property tax system; tax payable year 2002 marked the first year these changes were implemented. To understand what has happened since 2002, it is important to understand the changes implemented in The most notable property tax changes enacted in that year were: 1. The elimination of the general education property tax through full state funding of general education. 2. The culmination of over a decade of class rate compression. 3. The creation of a new state property tax on business and seasonal recreational property. 4. The phase-out of the limited market value program. 5. The creation of the new homestead market value credit. The other major change that has profoundly influenced the level of property taxes since 2002 is a dramatic reduction in state aid to local governments. It is important to adjust for the impact of inflation when assessing changes in state and local government revenue over time so as to distinguish between real spending growth versus growth caused by erosion in the purchasing power of the dollar. Unless otherwise noted, all amounts in this analysis are adjusted for inflation in the cost of state and local government purchases. 1 Elimination of General Education Property Tax Perhaps the most prominent of the changes enacted in 2001 and implemented in 2002 was a shift in responsibility for funding general education away from local property taxes and into the state s general fund. In the same year, the state also reduced transit property taxes by assuming funding for transit operations, although the dollars involved in this takeover were small in comparison to the general education takeover. Through these swaps, state general fund spending increased while local property taxes fell significantly. Statewide net property taxes per capita fell by 12.1 percent, while the average residential homestead 2 property tax fell by 16.5 percent. While there were many other factors at work, the principle cause of the decline in property taxes from 2001 to 2002 was the state takeover of general education funding. However, the dark side of full state funding of general education soon became apparent. While the legislature leapt at the opportunity to eliminate the general education property tax, they declined to increase state taxes by the amount necessary to maintain the state funding commitment at the 2002 level. Since 2002 (school fiscal year 2003), state aid to school districts have fallen; in response, school property taxes increased. From tax payable year 2002 (corresponding to school fiscal year 2003) to 2008 (fiscal year 2009), state aid to school MN Property Taxes by the Numbers
8 districts fell by $1,292 per pupil in constant FY 2009 dollars, while school property taxes increased by $761 per pupil. 3 Homeowners were hit particularly hard by the decline in state aid to public schools. As state aid fell, school districts attempted to gain approval for new referendum levies to replace the decline in state aid. Many of these referendum levies were spread against what is referred to as referendum market value. Unlike other levies, levies spread against referendum market value afford no preferential tax treatment to homeowners; for this reason, an increase in referendum levies translates into a larger percentage increase in homestead taxes than business taxes. Total school referendum market value levies increased by 145 percent from 2002 to 2008 (corresponding to school fiscal years 2003 to 2009). 4 Class Rate Compression Another major feature of the tax changes enacted in 2001 and implemented in 2002 was the climax of more than a decade of class rate compression. A class rate refers to the percentage by which the value in a particular class of property is multiplied in order to determine the amount against which levies are actually spread. Because business property is subject to higher class rates than homestead property, businesses pay higher taxes per each dollar of land and building value than do homesteads. The primary goal of class rate compression is to reduce the disparity between the highest business class rate and the lowest homestead class rate. 5 The ratio of the highest business class rate to the lowest homestead class rate has gone from 5.25 to 1 in 1989 to 2 to 1 in 2002, where it remains today. A comparison of homestead and business class rates is not an accurate way to gauge the property tax disparity between homesteads and businesses for four reasons: 1. Unlike most states, Minnesota does not tax personal property (e.g., fixtures, equipment, and inventories). 6 Because personal property comprises a larger percentage of business value than of homestead value, businesses derive a greater benefit from the personal property exemption than do homesteads. A simple comparison of homestead and business class rates ignores the relative advantage that businesses receive as a result of the personal property exemption and thereby overstates business taxes relative to homestead taxes. 2. A comparison of the highest business class rate to the lowest homestead class rate overstates the overall business tax burden relative to homesteads because 13.1 percent of business value is assessed at a rate below the highest rate, while 4.8 percent of homestead value is assessed at a rate above the lowest rate (based on data for taxes payable in 2009). 3. A comparison of business and homestead class rates overlooks the fact that a significant percentage of property taxes are spread against referendum market value an alternative tax base which is not subject to class rates. For taxes payable in 2009, 12.2 percent of local levies are spread against referendum market value. By ignoring referendum market value levies, 7 a simple comparison of class rates again overstates business property taxes relative to homestead. 4. Homesteads receive some forms of tax relief that business properties do not. For example, homestead property taxes are reduced through the homestead market value credit and the homeowners property tax refund, and homestead taxable value is reduced through the limited market value program. A simple comparison of class rates ignores these additional forms of property tax relief that homesteads receive. 6 MN Property Taxes by the Numbers 2009
9 Even though class rate compression was based on a flawed comparison of the level of business and homestead property taxes, it nonetheless became a central theme of property tax reform from 1990 to The rationale of class rate compression was to discourage local government spending growth by shifting more of the total property tax burden on to homesteads. Lost on proponents of class rate compression was the fact that per capita county and city spending levels were essentially flat over the preceding decade 8, so to some extent compression was addressing a problem that did not exist. Class rate compression results in a shift of property taxes from business properties on to homesteads. However, in 2002 this shift was bought off through the elimination of the general education property tax and through the homestead market value credit, discussed below. In fact, homesteads enjoyed greater property tax relief than businesses in 2002 relative to However, residual effects of class rate compression that occurred in 2003 were not bought off. In 2003, homestead property taxes in the metropolitan area increased significantly because of the interaction between the class rate compression enacted in 2002 and the metropolitan tax base sharing program, commonly referred to as the fiscal disparity program. Because of a year lag in the tax base data used to make fiscal disparity calculations, the effects of class rate compression first implemented in 2002 did not affect fiscal disparity tax calculations until The shift of taxes on to metropolitan homesteads in 2003 resulting from this interaction was not bought off, resulting in homestead property tax increases in The property tax changes enacted in 2001 also resulted in reduction to rental (i.e., non-homestead residential properties and apartments) class rates, some of which did not occur until taxes payable in 2003 and The rental class rate reductions occurring in 2003 and 2004 produced a shift in tax burden on to homesteads and other non-rental properties that was not bought off through increased state aids or credits. Class rate compression also had a large impact on how state aid cuts that occurred after 2002 would affect homeowners. After the class rate compression enacted in 2001, homesteads comprised a much larger percentage of the local tax base. As local governments raised property taxes to replace a portion of the reduction in state aid, a larger share of the property tax increase fell on homeowners than would have been the case prior to the class rate compression enacted in A New State Property Tax The elimination of the general education property tax combined with class rate compression would have produced a huge windfall of business property tax relief in In order to reduce the magnitude of business property tax relief and to generate additional revenue for the state general fund, the state imposed on businesses a new state property tax. The new state tax also applied to seasonal recreational residential property, which also enjoyed substantial property tax relief in 2002 as the result of an exemption from school referendum levies. 10 In future years, growth in the state property tax was linked to inflation as measured by the implicit price deflator for state and local government purchases. However, the state levy was not linked to growth in the state s economy or population; consequently, the real (i.e., inflation adjusted) per capita state property tax levy on businesses actually declined from 2002 to The state property tax levy also helped to insulate a portion of business property taxes from the growth in local property taxes that was occurring as a result of the reduction in state aid. While homestead property taxes MN Property Taxes by the Numbers
10 were increasing, approximately 28 percent of statewide business property taxes were declining in real per capita dollars. The presence of the state property tax levy is one of the reasons why homestead property taxes have increased much more rapidly than business property taxes since Phase-Out of the Limited Market Value Program The limited market value (LMV) program was implemented, effective for taxes payable in 1994, in an attempt to protect owners of homestead, agricultural, and cabin property from tax increases resulting from rapid growth in value. 11 Under the LMV program, growth in the taxable value of eligibility property is limited to a percentage of the prior year taxable value or a portion of the assessed value growth from the prior year to the current year, whichever is greater. By restricting the rate of taxable value growth in a single year, the LMV program helps to spread over time the impact of property tax increases resulting from rapid escalation in property values. Assessors generally oppose programs such as LMV which result in properties being taxed at less than full market value. Assessors also point out that the LMV program can create tax fairness issues, since it can result in owners of identical properties, located in the same taxing jurisdictions, paying different property taxes. Proponents of LMV argue that the program simply cushions property owners from the effects of rapid valuation growth by spreading tax increases out over time; any tax unfairness resulting from LMV, they argue, is temporary. In 2001, the legislature sided with opponents of LMV and required that the program be gradually phased-out; during the phase-out period, caps on valuation growth would gradually be loosened, allowing for a more rapid rate of growth in the taxable value of eligible properties. Under the 2001 tax act, LMV would have been fully eliminated for taxes payable in 2008; however, given property tax increases driven by the rapid value growth experienced earlier in this decade, the legislature opted to extend the LMV program. Under current law, the LMV program will be fully eliminated for taxes payable in Paradoxically, the property taxes on most Minnesota homesteads are higher, not lower, because of the LMV program as currently constituted. By capping the value growth of some properties, the LMV program reduces the size of the total tax base, thereby producing higher tax rates. All properties not enjoying a taxable value reduction through LMV are paying higher property taxes as a result of these higher tax rates. Even at its peak, most homesteads in Minnesota enjoyed no taxable value reduction through the LMV program and thus would have been paying higher property taxes as a result of the program, all other things being equal. While most homesteads are paying higher property taxes as a result of the LMV program, the average tax increase among homeowners who are hurt by the program is only $21 per homeowner, while the average property tax reduction among homeowners that benefit from the program is $211 based on pay 2009 data. 12 Thus, the average tax increase among homeowners who are disadvantaged by the program is small in comparison to the tax reduction among homeowners who benefit. Since tax payable year 2006, the principle beneficiaries of the LMV program have been owners of timberland, agricultural, and cabin properties. Since 2006, aggregate homestead property taxes in Minnesota have increased, not decreased, as a result of the LMV program. However, this might not have been the case if the taxable value growth limits in effect in 2001 had been left in place. The phase-out of the LMV program which began in 2003 did contribute to an increase in the aggregate statewide residential homestead property taxes in 2003 and for at least the following two years. After that, it 8 MN Property Taxes by the Numbers 2009

11 is unclear if aggregate statewide homestead property taxes would have been higher or lower in the absence of the LMV phase-out enacted in The debate over LMV may ultimately be rendered moot by the slowing rate of growth and, in some instances, decline in property values. Homestead Market Value Credit The homestead market value credit was enacted in 2001 and implemented for taxes payable in 2002 as a replacement for the education homestead credit and as a way of preventing possible homestead property tax increases that could occur as a result of class rate compression. The amount of the homestead market value credit for a particular property is entirely dependent on the taxable value of the property. For the first $76,000 of homestead taxable value, the homestead market value credit equals 0.4 percent of the property value. Thus, a homestead with a taxable value of $76,000 would receive a homestead market value credit of $304 ($76,000 x 0.4%). As home values grow beyond $76,000, the credit shrinks at rate of 90 cents per every $1,000 of value until hitting zero at a value of $413,778; all homesteads with a value of $413,778 or more receive no homestead market value credit. Homestead taxable value grew significantly from 2002 to 2008 (assessment years 2001 to 2007) before leveling off in 2009 (assessment year 2008). This homestead value growth caused a significant decline in the market value credit. The graph on the following page shows the statewide growth in nominal (i.e., unadjusted for inflation) homestead taxable value in billions (left axis) and the corresponding decline in the nominal homestead market value credit in millions (right axis). From tax payable year 2002 to 2009, the nominal statewide homestead market value credit declined by $59 million or 18.2 percent. In constant 2009 dollars, the decline is $170 million or 39.1 percent. The decline in the credit amount is a direct function of the growth in taxable homestead value. As the amount of the homestead credit declines, the net homestead property tax increases by an equivalent amount. This is yet another feature of the 2001 tax act that has contributed to growth in homestead property taxes over time. MN Property Taxes by the Numbers


12 State Aid Cuts The 2001 tax act did not mandate state aid reductions in future years. However, the act did extend state spending commitments in ways that were unsustainable in the long term. With a governor committed to a no new tax agenda, broad based revenue increases were off the table and state budget reductions became inevitable. A disproportionate share of these budget reductions took the form of cuts in state aid to local governments. These state aid cuts are the primary cause of statewide property tax increases over the last six years. The graph below examines the change in statewide local government revenue, property taxes, and state aid in constant 2008 dollars since From 2002 to 2008, property taxes imposed by local governments increased by $1.2 billion in constant 2008 dollars. 13 However, this growth in property taxes cannot be attributed to growth in local government budgets; since 2002 total local government revenue declined by $1.4 billion. The primary cause of statewide property tax growth is reductions in state aid to local governments. From 2002 to 2008, state aid to local governments declined by $2.4 billion in constant 2008 dollars. The local property tax increase was sufficient to replace slightly less than half of the state aid cut. The balance of the state aid cut was dealt with by primarily cutting local budgets. 10 MN Property Taxes by the Numbers 2009
13 It should also be noted that at the same period that local government revenue fell by $1.4 billion, the population that local governments must provide service to increased by approximately five percent (although statewide school enrollment declined by one percent). In addition, over this six year span new testing requirements and higher standards were foisted on to school districts and additional state costs were shifted on to counties. 14 By aggregating all levels of local government together, a significant amount of detail is overlooked. However, the basic pattern observed in the above graph for all local governments is also apparent when we examine the three major levels of local government counties, cities, and school districts individually. For counties, per capita state aid is projected to fall by 28.8 percent from 2002 to This projected decline in aid is the principal cause of a 5.0 percent increase in per capita county property taxes and a 10.7 percent decline in total per capita county revenue. For cities, per capita state aid is projected to fall by 43.1 percent from 2002 to 2008, 15 contributing to a projected 9.7 percent growth in per capita city property taxes and a 13.7 percent decline in total per capita city revenue. For school districts, per pupil state aid is projected to fall by 13.3 percent from fiscal year (FY) 2003 to FY 2009 (corresponding to tax payable years 2002 to 2008). The state aid loss has driven a 48.6 percent increase in property taxes per pupil and a 3.9 percent decline in per pupil revenue. (The percentage increase in school property taxes is so high because school property taxes for 2002/2003 were extremely low due to the elimination of the general education property tax in 2002.) For all three levels of government, we see the same trend: cuts in state aid causing both reduced funding for local services and higher property taxes. MN Property Taxes by the Numbers

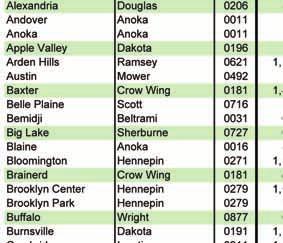
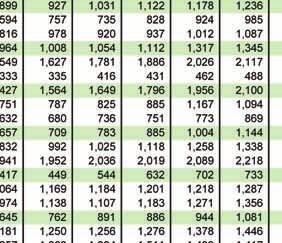
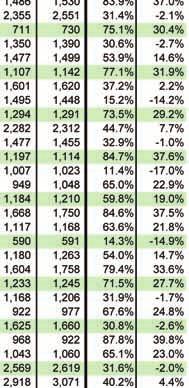
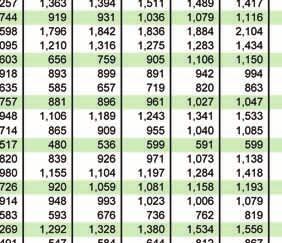
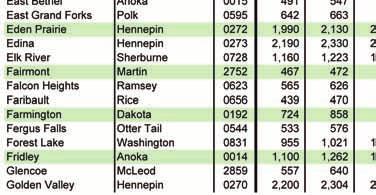
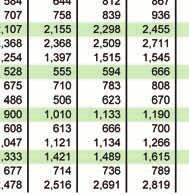
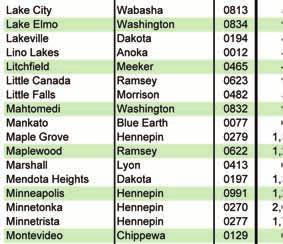
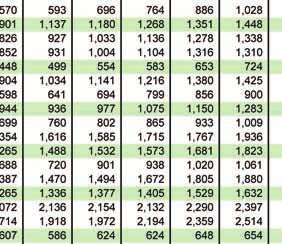
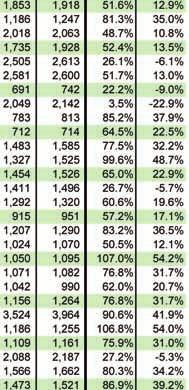
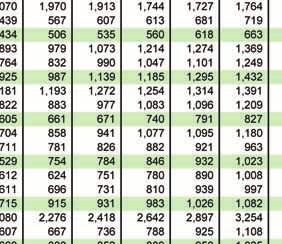
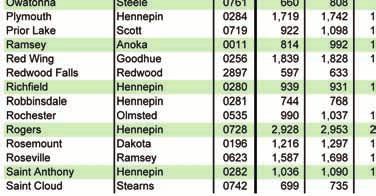
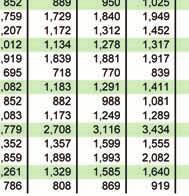
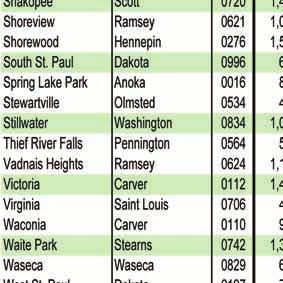
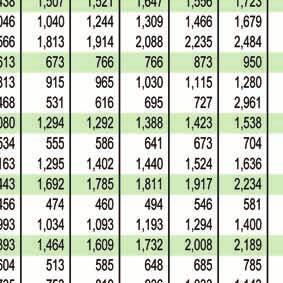
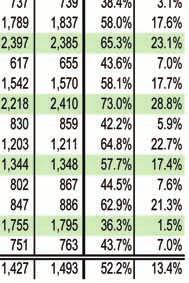
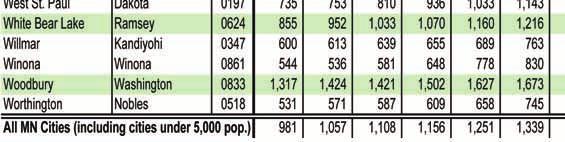
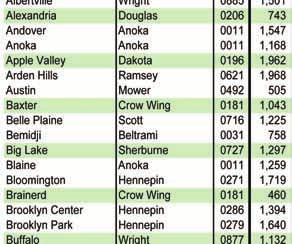
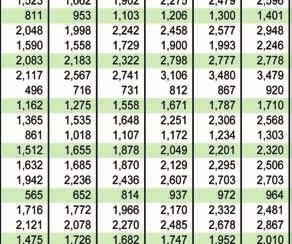
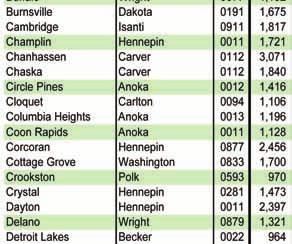
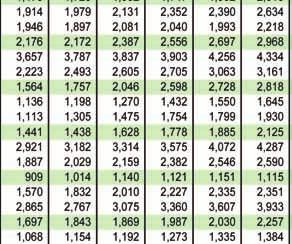
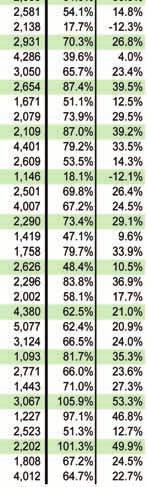
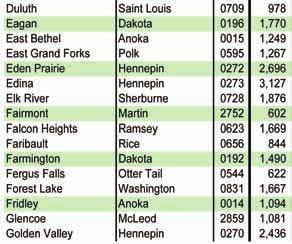
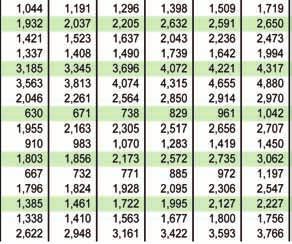
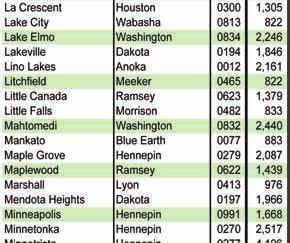
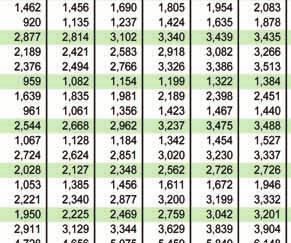
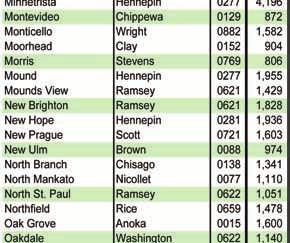
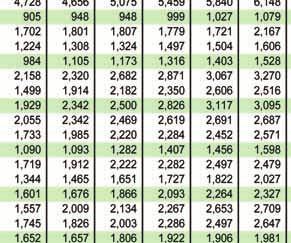
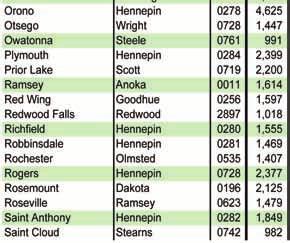
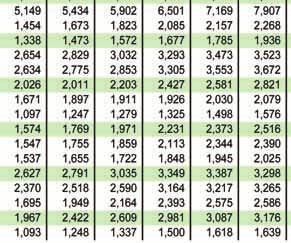
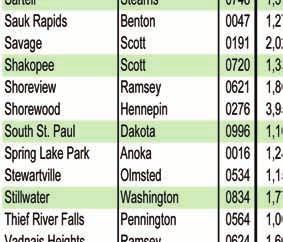
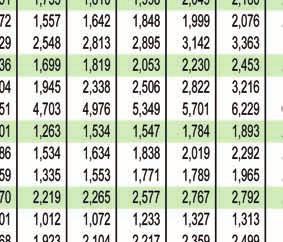
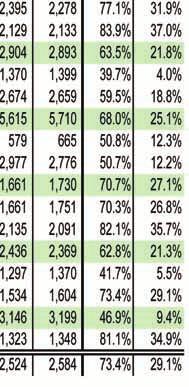
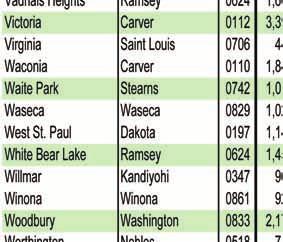
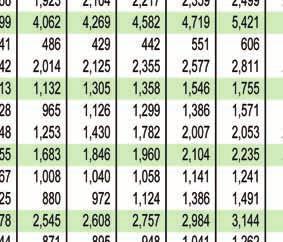
14 Property Tax Data: 2002 to 2009 The trends emphasized previously specifically, the implications of the 2001 tax act combined with subsequent reductions in state aid are the primary cause of property tax increases over the last seven years. An examination of property tax data reveals the magnitude of these property tax increases. The table in appendix A shows per capita property taxes in nominal dollars in all Minnesota cities with a population over 5,000 for the years 2002 through The final two columns in this table show the increase in property taxes in nominal and real (i.e., inflation adjusted) dollars per capita from 2002 to The table also shows the largest county (i.e., the county which contains the largest share of the city s property value) and the code of the largest school district for each city listed. (The property tax amounts listed are for the entire city, including portions that may lie outside the largest county and school district.) Property tax per capita is not a particularly useful way of measuring the property tax paid by a typical resident of a city, since included in the property tax total are business property taxes. A city with a large commercial/ industrial tax base may have a high level of per capita property taxes, but the tax on residents of the city might be relatively low because much of the tax is borne by business property. However, the per capita property tax does provide a reasonable way to gauge growth in property taxes relative to growth in the community. A perusal of the information in appendix A shows that of the 142 cities with a population over 5,000, 119 (83.8 percent) experienced an increase in per capita property taxes from 2002 to 2009, while 96 (67.6 percent) experienced an increase of ten percent or more. (A ten percent increase in real dollars over this period translates into a nominal increase of 47.7 percent.) The following graph shows the number of cities by the percent growth in per capita property taxes from 2002 to 2009, including all Minnesota cities (over and under 5,000 population). Of the 854 cities in Minnesota, 677 (79.3 percent) experienced an increase in per capita property taxes from 2002 to 2009, while 560 (65.6 percent) experienced an increase of 10 percent or more. A simple count of the number of cities can give a skewed picture of property tax increases because very small cities comprise a large percentage of the number of Minnesota cities. For example, while small cities (population under 5,000) comprise 83.4 percent of all Minnesota cities, they contain only 15.5 percent of the statewide city population. The graph below shows the percent of the statewide city population by the percent increase in per capita property taxes in the city in which they reside; for example, 22.8 percent of the population of Minnesota cities reside in cities that experienced a 10 to 20 percent increase in per capita property taxes from 2002 to This presentation of the information essentially weights cities by population. 12 MN Property Taxes by the Numbers 2009
15 Of the 4.3 million people that reside in Minnesota cities, 82.4 percent reside in cities that have experienced an increase in per capita property taxes from 2002 to 2009, while 65.9 percent reside in cities that have seen an increase of ten percent or more. There is tremendous variation in the circumstance of local governments across the state. In some jurisdictions, spending growth no doubt played a role in property tax increases. However, per capita revenue in the vast majority of Minnesota cities, counties, and school districts has declined since 2002 based on the most current information available. Large cuts in state aid to local governments explain why property taxes are increasing at the same time that local government revenue is falling. Focusing on Homesteads Homeowners have been particularly hard hit by rising property taxes. From 2002 to 2009 the average homestead property tax in Minnesota has increased by 29.8 percent. (Without adjusting for inflation, growth is 74.2 percent.) A major reason for property tax growth is state aid cuts; however, this factor by itself does not explain why homestead property taxes have risen more rapidly than the average for all types of property. As noted above, the more rapid rate of growth in homestead property taxes since 2002 is largely attributable to repercussions of the 2001 tax act, including the structure of the homestead market value credit and repercussions of class rate compression. An additional factor contributing to the rapid homestead property tax growth are large increases in referendum market value levies resulting from declining state aid to school districts. As noted above, referendum market value levies fall more heavily on homeowners than do ordinary levies, thereby contributing to a more rapid rate of growth in homestead property taxes. One factor that does not explain the rapid growth in homestead property taxes since 2002 or at least very little of it is growth in homestead values. While homestead values did grow from 2002 to 2009, growth in other types of value grew more rapidly on a statewide basis. Thus, on a statewide basis, there would have been no shift of tax burden on to homestead property resulting from value growth because the homestead share of taxable value declined from 2002 to Even before the decline in residential values in many parts of the state in the 2008 assessment for taxes payable in 2009, homestead value growth was not quite keeping MN Property Taxes by the Numbers
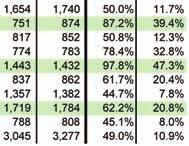
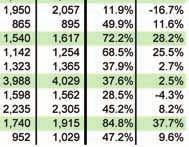
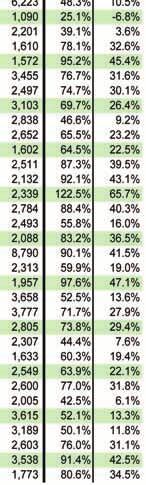
16 pace with the rest of the tax base. The table in appendix B shows the average homestead property tax in nominal dollars from 2002 to 2009 in all Minnesota cities with a population in excess of 5,000. The table further shows the growth in the average homestead tax in each city from 2002 to 2009 in nominal and real dollars. The table also shows the largest county (i.e., the county which contains the largest share of the city s taxable value) and the code of the largest school district for each city listed. (The homestead tax amounts listed are for the entire city, including portions that may lie outside the largest county and school district.) The information in appendix B shows that of the 142 cities with a population over 5,000, only 6 saw a decline in average real homestead property taxes from 2002 to The remaining 136 (95.8 percent) all saw increases; 101 (71.1 percent) of these cities saw increases in excess of 20 percent. (A 20 percent increase in real dollars over this period translates into a nominal increase of 61.1 percent.) The graph above shows the number of cities by the percent growth in average homestead property tax from 2002 to 2009 including all Minnesota cities (over and under 5,000 population). Of Minnesota s 854 cities, 746 (87.4 percent) saw an increase in the average homestead property tax from 2002 to 2009, while 530 (62.1 percent) experienced an increase of 20 percent or more. As noted above, simple count of the number of cities can give a skewed picture of property tax increases because small cities comprise a large percentage of the number of Minnesota cities. The graph on the following page shows the percent of the statewide city population by the percent change in the average homestead property tax in the city in which they reside; for example, 27.0 percent of the population of Minnesota cities resides in cities that experienced a 20 to 30 percent increase in average homestead property taxes from 2002 to This presentation essentially weights cities by population. Of the 4.3 million people that reside in Minnesota cities, 97.0 percent reside in cities than have seen an increase in average homestead property taxes from 2002 to 2009, while 71.5 percent reside in cities that have seen an increase of 20 percent or more. In some cities, a significant portion of homestead property tax increases could be due to growth in local spending. However, in general this is not the case. The graph below compares growth in the average 14 MN Property Taxes by the Numbers 2009

17 Minnesota homestead property tax since 2002 relative to the decline in the per capita revenue of counties and cities and the per pupil revenue of school districts. (This graph ends in 2008 because reliable forecasts of 2009 county, city, and school district revenue are not yet possible due to uncertainty involving potential state aid cuts in 2009.) From 2002 to 2008 (FY 2003 to FY 2009 for school districts), the average homestead property tax in Minnesota has increased by over 25 percent, while real per capita county and city/ town revenue and real per pupil school revenue have all declined. Clearly, the statewide growth in average homestead property taxes could not be driven by growth in local government revenues, since these revenues have decreased. commercial/industrial property tax growth over the last seven years. Homestead vs. Commercial/ Industrial Property Taxes A comparison of homestead and commercial/industrial property tax increases from 2002 to 2009 further underscores the magnitude of homestead property tax growth in Minnesota. The graph on the following page compares homestead and From 2002 to 2009, the rate of growth in total homestead property taxes is 39.6 percent more than five times greater than the rate of growth in commercial/industrial property taxes. A portion of the higher rate of growth in homestead property taxes is attributable to a more rapid rate of growth in homestead taxable value (driven in part by the phase-out of the limited market value program). From 2002 to 2009, homestead taxable MN Property Taxes by the Numbers
 increased by 29.")
18 value grew 1.5 times more rapidly than commercial/industrial taxable value. However, a 1.5 times faster rate of value growth is not sufficient to explain a five times greater growth rate in taxes. During the same period, the average homestead property tax (i.e., the total tax divided by the number of properties) increased by 29.8 percent, while average commercial/industrial property tax declined by 4.2 percent. The ways in which the 2001 tax act has contributed to increases in homestead property taxes are noted above. In addition, the 2001 tax act has partially insulated commercial/industrial property owners from increases in local property taxes resulting from state aid cuts through the creation of a separate state-imposed business property tax which has declined in real per capita dollars since Clearly, the reforms enacted in 2001 have been far more favorable for Minnesota businesses than for Minnesota homeowners. Trend from 2008 to 2009 As indicated in the graph on page 7, during most years from 2002 to 2008 property taxes have increased at the same time that total local revenues declined. Based on Price of Government (POG) data, 2009 could be an exception to this rule, although it is too soon to know this with certainty. One thing is reasonably clear: per capita property taxes should increase from 2008 to 2009 by about 5.5 percent based on the rate of inflation for 2009 as projected in February. 16 Based on February forecast POG data, per capita county and city revenue, and per pupil school district revenue are expected to increase in 2009, although at this point 2009 revenue amounts are based on projections. 16 MN Property Taxes by the Numbers 2009
19 Reasons for the increase in projected revenue include: Local governments are recouping a portion of the revenue losses that they have absorbed since Even after the projected revenue increase in 2009, total per capita local government revenue will be about 8.0 percent less than it was in 2002 based on POG projections. County and city revenues are deflated in 2008 due to $110 million in aid cuts imposed by the Governor. These cuts occurred in December at the very close of the county and city budget year. A reduction in 2008 revenue contributes to a larger percentage increase in revenue from 2008 to POG projections of local government revenue are based on current law. However, with a looming structural budget deficit of over $6 billion projected for the next fiscal biennium, it is largely expected that the state will cut back the current law aid level for local governments. Thus, projections of 2009 revenue growth are in part based on dollars that will probably not show up. As local governments were setting their levies (i.e., the dollars they will collect from property taxes), credit markets were collapsing, the national economy was in a free fall, and talk of more state aid cuts abounded. In this environment of uncertainty, local governments are likely to depend more heavily on a revenue source they can count on: the property tax. Even more uncertainty was introduced into county and city budgets with the enactment of levy limits in 2008, effective for taxes payable in At the insistence of Governor Pawlenty, the 2008 tax act placed restrictions on the authority of counties and cities to levy property taxes. Once levy limits are imposed, local governments have an incentive to levy the maximum allowable amount out of fear that the state will intervene and permanently eliminate any unused levy authority in future years. In this way, levy limits can actually push levies higher, not lower, as local governments are forced to second guess state attempts to micro-manage local finances. Because of levy limits combined with the likelihood of state aid cuts of unknown magnitude, local government finances are in a state of uncertainty. This uncertainty makes it more difficult to forecast local government revenues in 2009 and contributes to increased reliance on property taxes. With the bursting of the real estate bubble, the growth in homestead market values came to an abrupt halt for taxes payable in (Note that the values used to determine taxes payable in 2009 are based on values from January 1, 2008; thus, the subsequent decline in homestead values after January 1, 2008 are not reflected in 2009 property taxes.) This contributed to a lower rate of growth in homestead property taxes relative to other types of property. From 2008 to 2009, residential homestead property taxes are expected to increase by 3.3 percent, compared to a 6.1 percent growth rate in all property taxes. 17 However, even this growth in residential homestead property taxes is more than one would expect to see based on changes in value. From 2008 to 2009 (corresponding to the January 1, 2007 assessment to the January 1, 2008 assessment), the homestead share of statewide taxable market value fell 2.0 percent, 18 while the homestead share of statewide property taxes fell by just 1.2 percent. The decline in the homestead share of statewide property taxes did not keep pace with the decline in the homestead share of taxable value for at least two reasons. First, referendum market value levies increased by 10.0 percent from 2008 to 2009, more than double the rate of growth in ordinary tax capacity levies. As noted above, referendum market value levies fall more heavily on homesteads than do ordinary tax capacity levies; MN Property Taxes by the Numbers
20 the more rapid rate of growth in referendum market value levies contributes to a more rapid rate of growth in homestead property taxes. The continued erosion of per pupil state aid no doubt contributed to the growth in referendum market value levies. Second, businesses (and non-seasonal recreational residential properties) were insulated from the full extent of the growth in local levies through the state property tax. As noted above, the state property tax typically grows less rapidly than local property taxes because the state property tax is unaffected by cuts in aid to local government. This contributed to a less rapid rate of growth among business properties relative to homestead properties than would have been the case had the change in property taxes been based solely on changes in taxable value. The structure of the homestead market value credit did not contribute much to homestead property tax growth from 2008 to 2009 because statewide homestead values did not increase from January 1, 2007 (for taxes payable in 2008) to January 1, 2008 (for taxes payable in 2009) and thus the amount paid to homeowners through the homestead market value credit is not expected to decline from 2008 to This trend is illustrated in the graph on page MN Property Taxes by the Numbers 2009
21 Conclusion: A Call for Accountability When a taxpayer sees significant growth in property taxes over time, he assumes that his local governments are spending more. While this conclusion may be understandable, it is often wrong. Property taxes in Minnesota have grown rapidly from 2002 to 2009, but local governments do not have any more money to spend. Per capita county and city revenue and per pupil school district revenue are less today than they were seven years ago. The cause of this paradox rests in the nature of the state-local fiscal relationship. In Minnesota, state government has a de facto monopoly on dollars collected through the income and sales taxes. (While some local governments are allowed to impose a sales tax, such taxes are strictly regulated by the state and are generally allowed only for limited purposes and at rates far below the state sales tax rate.) In exchange for this monopoly, state government is to share a portion of its income and sales tax dollars with local governments in order to avoid excessive local dependence on the property tax. However, in recent years state aid to local governments has become a de facto slush fund that state leaders have used to solve their revenue problems. Have a large state budget deficit? Don t bother to increase state taxes; rather, disproportionately cut back on the dollars that the state shares with local governments. In this way, state leaders can posture as champions of no new taxes while compelling local governments to do the dirty work of raising property taxes while at the same time cutting funding for local services. From 2002 to 2008 (state fiscal year 2003 to 2009), state aid to Minnesota local governments has fallen by over $2 billion dollars. Approximately half of this aid cut was recovered through increases in local levies, thereby explaining much of the property tax growth since The other half of the state aid cut was recovered largely through reductions in local government revenue, thereby explaining cuts in funding for education, public safety, and infrastructure investments. Local property taxes have increased far more rapidly than state income and sales taxes because the state has solved its revenue problems on the backs of local governments and local property taxpayers through disproportionately large state aid cuts. Since 2002, Minnesota homeowners have been hit with a double whammy. Not only are property taxes increasing because of state aid cuts, but an increasing share of the property tax is being shifted on to homeowners due in large part to changes enacted in Class rate compression and the structure of the homestead market value credit have both contributed to increases in homestead property taxes. Further compounding the growth in homestead property taxes are cuts in state funding for education, which has stimulated growth in referendum market value levies as school districts seek to replace declining state aid dollars. Referendum market value levies fall more heavily on homestead properties than do ordinary levies, thereby accelerating the rate of growth in homestead property taxes. State policymakers need to come clean about the true cause of rising property taxes in Minnesota. Since 2002, the rapid growth in property taxes, in general, and homestead property taxes, in particular, is primarily the result of state policies, not local spending decisions. True reform to the property tax and state aid systems will not come about until policymakers acknowledge or citizens compel them to acknowledge the real causes of property tax increases. MN Property Taxes by the Numbers


22 20 MN Property Taxes by the Numbers 2009


23 MN Property Taxes by the Numbers


24 22 MN Property Taxes by the Numbers 2009


25 MN Property Taxes by the Numbers


26 24 MN Property Taxes by the Numbers 2009


27 MN Property Taxes by the Numbers
28 References 1 All inflation adjustments in this report are based on the implicit price deflator (IPD) for state and local government purchases, which is a better measure of inflation for the types of goods and services purchased by state and local governments than is the Consumer Price Index (CPI). The projected rate of inflation for 2009 is based on the February 2009 update to the state and local IPD. 2 A homestead is an owner-occupied housing unit. In discussing homestead values and property taxes, this report will focus on residential as opposed to agricultural homesteads. Residential homesteads comprise 96.3 percent of all taxable homestead market value in Minnesota. 3 Calculated using state aid data from the February 2009 Price of Government report and pupil unit counts (average daily membership) from the Minnesota Department of Education. 4 Calculated from Minnesota Department of Revenue data. 5 Class rate compression also focused on reducing the class rate disparity between rental property and homestead property. The primary focus of the discussion here is on the business-homestead class rate disparity, which is the largest disparity both in terms of the class rate gap and in terms of the amount of value involved. 6 The exception here is electrical generation machinery, which is taxed in Minnesota. Electrical generation machinery comprises less than two percent of taxable business value in the state. 7 For levies spread against referendum market value, businesses enjoy a tax advantage relative to homesteads because the tax advantage that businesses derive from the exemption of personal property still applies, while the preferential treatment that homesteads derive through the class rate system does not. For this reason, referendum market value levies impose a higher effective tax rate (i.e., property tax as a percentage of total real and personal market value) on homesteads than on businesses. 8 Based on annual city and county expenditure reports from the Office of the State Auditor adjusted for inflation, per capita total city expenditures declined by 0.9 percent and county expenditures declined by 0.1 percent from 1990 to A similar shift also occurred in 2003 in the taconite relief area due to an interaction between class rate compression and the taconite fiscal disparity program. However, because the value involved in the taconite fiscal disparity program is small in comparison to total taxable value, the shift on to homesteads was small. 10 Effective for taxes payable in 2006, the seasonal recreational portion of the state property tax base was separated from the business portion and subjected to a lower state tax rate. 11 The LMV program was later expanded to include timberland. A similar program was in place for tax payable years 1974 to Limited Market Value Report: 2008 Assessment Year Taxes Payable Minnesota Department of Revenue. [ state.mn.us/legal_policy/research_reports/content/2009_lmv.pdf] 13 Amounts in this section are calculated based on data from the February 2009 Price of Government (POG) report. POG data for 2007 and 2008 (FY 2008 and FY 2009) are estimates. 14 For example, the state has shifted responsibility for incarcerating short-term felony offenders to counties and mandated that counties pay ten percent of the medical assistance costs for nursing homes stays in excess of 90 days for people under age The decline in city aid from 2002 to 2008 is especially large in part because of a $66 million city aid unallotment (i.e., reduction) imposed by Governor Pawlenty in December of The rate of inflation for 2008 to 2009 based on the Implicit Price Deflator for State and Local Government Purchases is expected to be negative (i.e., we will have deflation in projected state and local government costs). Because of this, the inflation adjusted growth rate in property taxes reported in this analysis will be greater than the nominal (i.e., unadjusted for inflation) growth rate in taxes. 17 Ibid. 18The residential homestead share of statewide taxable tax capacity fell by 1.7 percent. 26 MN Property Taxes by the Numbers 2009

29
Executive Summary IV.The.Role.of.Property.Valuation V.Explaining.Homestead.Property.Tax.Growth... 22
 Table of ConTenTs Executive Summary......................................... 1 Recommendations:...................... 5 I..Introduction.............................................. 6 II..2002.Property.Tax.Changes....................................
Property Taxation 101 Updated August 2016
 Property Taxation 101 This guide is intended to describe the basics of Minnesota s property tax system. This system collected just over $6.7 billion in 2016 to help fund the services of schools, counties,
Minnesota University Avenue West, Suite 204, Saint Paul, MN
 Minnesota 2020 2324 University Avenue West, Suite 204, Saint Paul, MN 55114 www.mn2020.org All work on mn2020.org is licensed under a Creative Commons Attribution-No Derivative Works 3.0 Unported License.
Shifting Property Taxes:
 Shifting Property Taxes: A Case Study of Minnesota s Limited Market Value Presentation to Federation of Tax Administrators Revenue Estimated Conference Tax Research Division Minnesota Department of Revenue
Statewide General Property Tax October 2017 Special Update
 Statewide General Property Tax October 2017 Special Update October 2017 Special Update: The February 2017 forecast projected statewide property tax revenues for FY 2018 at $861.2 million, and FY 2019 at
Statewide General Property Tax December 2018 Update
 This document is made available electronically by the Minnesota Legislative Reference Library as part of an ongoing digital archiving project. http://www.leg.state.mn.us/lrl/lrl.asp Statewide General Property
Property Tax System Overview. Prepared for the Property Tax Working Group
 Property Tax System Overview Prepared for the Property Tax Working Group Property Tax Research 9/27/2010 Introduction Property tax in Minnesota is an ad valorem tax. This means that property is taxed
Overview of Property Taxes
 Overview of Property Taxes A Presentation to the Property and Local Tax Division January 2015 by Steve Hinze Pat Dalton Nina Manzi Joel Michael and Katherine Schill Fiscal Analysis Department Minnesota
2007 Minnesota Tax Incidence Study
 2007 Minnesota Tax Incidence Study (Using November 2006 Forecast) An analysis of Minnesota s household and business taxes. March 2007 2007 Minnesota Tax Incidence Study Analysis of Minnesota s household
PROPERTY VALUES AND TAXES IN SOUTHEAST WISCONSIN
 PROPERTY VALUES AND TAXES IN SOUTHEAST WISCONSIN September 2017 Rob Henken, President Maddie Keyes, Research Intern Jeff Schmidt, Data & Technology Director Sponsored by: T a b l e o f C o n t e n t s
2009 Minnesota Tax Incidence Study
 2009 Minnesota Tax Incidence Study (Using November 2008 Forecast) An analysis of Minnesota s household and business taxes. March 2009 For document links go to: Table of Contents 2009 Minnesota Tax Incidence
2003 Minnesota Tax Incidence Study
 2003 Minnesota Tax Incidence Study (Revised using February 2003 Forecast) An analysis of Minnesota s household and business taxes. March 2003 2003 Minnesota Tax Incidence Study Analysis of Minnesota s
Limited Market Value (LMV) A Study of Who Benefits and Who Pays. Presented by Dan Salomone, Commissioner February 2005
 A Study of Who Benefits and Who Pays. Presented by Dan Salomone, Commissioner February 2005") A Study of Who Benefits and Who Pays Presented by Dan Salomone, Commissioner February 2005 Presentation Outline LMV Background (Terms, Goals). The prevalence of LMV. The parcel level tax effects for homeowners
A Study of Who Benefits and Who Pays Presented by Dan Salomone, Commissioner February 2005 Presentation Outline LMV Background (Terms, Goals). The prevalence of LMV. The parcel level tax effects for homeowners
OVERVIEW MINNESOTA PROPERTY TAX SYSTEM AND SCHOOL DISTRICT LEVY PROCESS Payable 2008 Levy
 OVERVIEW OF MINNESOTA PROPERTY TAX SYSTEM AND SCHOOL DISTRICT LEVY PROCESS 2007 Payable 2008 Levy Division of Program Finance October 2008 TABLE OF CONTENTS Overview of the Minnesota Property Tax System...
OVERVIEW MINNESOTA PROPERTY TAX SYSTEM AND SCHOOL DISTRICT LEVY PROCESS Payable 2006 Levy
 OVERVIEW OF MINNESOTA PROPERTY TAX SYSTEM AND SCHOOL DISTRICT LEVY PROCESS 2005 Payable 2006 Levy Division of Program Finance March 2006 TABLE OF CONTENTS Overview of the Minnesota Property Tax System...
Local Road Funding History in Minnesota
 2007-26 Local Road Funding History in Minnesota Take the steps... Research...Knowledge...Innovative Solutions! Transportation Research Technical Report Documentation Page 1. Report No. 2. 3. Recipients
Contact Matt Massman, Lead Fiscal Analyst, at 651/ or or the relevant fiscal analyst identified below.
 FISCAL ISSUE BRIEF FY 2010-11 General Fund Budget Governor s Unallotments and Administrative Actions Amounts shown in this Issue Brief reflect unallotment activity prior to the November 2009 state budget
Fridley Public Schools, ISD 14
 Fridley Public Schools, ISD 14 Public Hearing for Taxes Payable in 2019 DECEMBER 18, 2018 PRESENTED BY: MATTHEW HAMMER, DIRECTOR OF FINANCE Agenda for Hearing 1. State Funding of Schools 2. Information
This publication is a slight revision of four news releases recently made available to Oregon newspapers.
 Understanding Oregon's Four 1986 Tax Initiatives This publication is a slight revision of four news releases recently made available to Oregon newspapers. Part 1. How Does the Current System Work? Part
Laws 2018, Chapter 205 (H.F. 947, 1 st Engrossment) Vetoed Omnibus Tax Bill
 Vetoed Omnibus Tax Bill") Tax Incidence Analysis Prepared by the Tax Research Division, Minnesota Department of Revenue August 30, 2018 Laws 2018, Chapter 205 (H.F. 947, 1 st Engrossment) Vetoed Omnibus Tax Bill The bill, which
Tax Incidence Analysis Prepared by the Tax Research Division, Minnesota Department of Revenue August 30, 2018 Laws 2018, Chapter 205 (H.F. 947, 1 st Engrossment) Vetoed Omnibus Tax Bill The bill, which
Hopkins Public Schools #270. December 5, 2017 Presented by John Toop Director of Business Services
 Hopkins Public Schools #270 Public Hearing for Taxes Payable in 2018 December 5, 2017 Presented by John Toop Director of Business Services Tax Hearing Presentation State Law Requires Public Meeting: Between
P roperty taxes are the only
 CHAPTER FOUR ILLINOIS PROPERTY TAXES The Total Illinois Property Tax Burden W hile property taxes have declined as a share of taxes nationwide, the share of state and local tax revenue derived from the
Continued TPP Reimbursement Critical to Preserving Long-Term Solvency of Highly Impacted School Districts
 Continued TPP Reimbursement Critical to Preserving Long-Term Solvency of Highly Impacted School Districts Situation Analysis State budget proposal eliminates Tangible Personal Property tax reimbursement
Socio-economic Series Changes in Household Net Worth in Canada:
 research highlight October 2010 Socio-economic Series 10-018 Changes in Household Net Worth in Canada: 1990-2009 introduction For many households, buying a home is the largest single purchase they will
Study of the Metropolitan Area Fiscal Disparities Program
 Study of the Metropolitan Area Fiscal Disparities Program Prepared for: MINNESOTA DEPARTMENT OF REVENUE February 13, 2012 (revised) Prepared by: 4701 Sangamore Road Suite S240 Bethesda, Maryland 20816
2011 Minnesota Tax Incidence Study
 2011 Minnesota Tax Incidence Study (Using February 2011 Forecast) An analysis of Minnesota s household and business taxes. March 2011 For document links go to: Table of Contents 2011 Minnesota Tax Incidence
Property taxes are the only major revenue source for which the Illinois state and local tax burden
 CHAPTER SEVEN ILLINOIS PROPERTY TAXES Property taxes are the only major revenue source for which the Illinois state and local tax burden exceeds the national average indicating a fundamental imbalance
2013 Minnesota Tax Incidence Study
 Revised April 24, 2013 to correct errors for taxes projected to 2015. Changes were made to each of the following: Executive Summary Chapter 1 Chapter 3 Tables 4-3, 4-4, and 4-5. Please discard earlier
Operating Referendum: Background Information and Trends Round Lake-Brewster Public Schools
 Operating Referendum: Background Information and Trends Round Lake-Brewster Public Schools ISD No. 2907 What is an Operating Referendum? An election ballot question that allows districts to generate additional
Would the Senate Democrats proposed excise tax on highcost employer-paid health insurance benefits be progressive?
 Citizens for Tax Justice December 11, 2009 Would the Senate Democrats proposed excise tax on highcost employer-paid health insurance benefits be progressive? Summary Senate Democrats have proposed a new,
GLOSSARY OF SCHOOL FINANCE TERMS
 GLOSSARY OF SCHOOL FINANCE TERMS Any study of school finance can be confusing because of the enormous number of technical terms used in describing the process. The following is a glossary of the terms
The Importance of Amendment 2: An Independent Analysis of the Effects of NOT Passing Amendment 2
 The Importance of Amendment 2: An Independent Analysis of the Effects of NOT Passing Amendment 2 By Florida TaxWatch The Eyes & Ears of Florida Taxpayers The Mission of Florida TaxWatch Research Institute
TOWN OF SUDBURY The Residential Exemption Report
 TOWN OF SUDBURY November 1, 2011 CONTENTS Executive Summary... 1 I. Introduction... 3 II. Residential Exemption Database Profile... 7 III. The Process... 11 IV. Tax Impact... 21 V. Current Senior Exemption
Minnesota University Avenue West, Suite 204, Saint Paul, MN Editing: Joe Sheeran Design & Layout: Rachel Weeks
 Minnesota 2020 2324 University Avenue West, Suite 204, Saint Paul, MN 55114 www.mn2020.org Editing: Joe Sheeran Design & Layout: Rachel Weeks All work published by Minnesota 2020 is licensed under a Creative
History of Local Government Aid to Cities Updated December 2017
 History of Local Government Aid to Cities Updated December 2017 1967: Tax Reform and Relief Act $170m in new revenue from new 3% sales and excise tax ¼ of the sales tax revenues to be distributed to local
THE BEST CHOICE FOR A PROSPEROUS TEXAS: A TEXAS-STYLE PERSONAL INCOME TAX
 THE BEST CHOICE FOR A PROSPEROUS TEXAS: A TEXAS-STYLE PERSONAL INCOME TAX October 2006 Contact: Dick Lavine, lavine@cppp.org F. Scott McCown, mccown@cppp.org INTRODUCTION This policy brief explains why
Property Taxes: A West Virginia Primer
 Property Taxes: A West Virginia Primer Aims of this Primer Property taxes provide revenue for the important public structures, services, and programs that enhance the quality of life for the people of
A History of the School Operating Levy Referendum
 A History of the School Operating Levy Referendum Money Matters 02-10 December 2002 Greg Crowe, Fiscal Analyst Fiscal Analysis Department Minnesota House of Representatives The Origins of the Operating
Loveland City Schools FY Revenue
 FREQUENTLY ASKED QUESTIONS 1. Where does the Loveland City School District revenue come from? In Ohio, the funding of schools is shared by the state and local school districts. The Ohio General Assembly
Controlling State Spending: A Responsible Alternative to TABOR
 Controlling State Spending: A Responsible Alternative to TABOR M. Kevin McGee Department of Economics UW Oshkosh Oshkosh WI 54901 mcgee@uwosh.edu November 2004 Proponents of TABOR the Taxpayer s Bill of
Truth in Taxation 2018 Proposed Property Tax Levy. Monticello Public Schools District Office December 4, :00 pm
 Truth in Taxation 2018 Proposed Property Tax Levy Monticello Public Schools District Office December 4, 2017 6:00 pm Truth in Taxation Timeline 2017 Payable 2018 Levy -For- 2018-2019 School Year -Or- FY2019
Contact Mark Misukanis, Senate Office of Fiscal Policy Analysis at or at
 This document is made available electronically by the Minnesota Legislative Reference Library as part of an ongoing digital archiving project. http://www.leg.state.mn.us/lrl/lrl.asp FISCAL ISSUE BRIEF
Fund Balance Adequacy. This chapter examines the adequacy of the trust fund balance for Minnesota s
 2 Fund Balance Adequacy SUMMARY For the last 30 years, Minnesota s unemployment insurance fund balance has not met the adequacy benchmarks used by the United States Department of Labor and others. To meet
A SHORT AND SIMPLE GLIMPSE AT THE PROPERTY TAX IN NEW JERSEY
 A SHORT AND SIMPLE GLIMPSE AT THE PROPERTY TAX IN NEW JERSEY Look at this bill. How come my property taxes are so high? In order to answer that question, you need to consider all the factors that go into
THE NORTH CAROLINA ECONOMIC OUTLOOK, 1 st QUARTER 2018
 THE NORTH CAROLINA ECONOMIC OUTLOOK, st QUARTER 8 Prepared by Dr. Michael L. Walden, William Neal Reynolds Distinguished Professor, Department of Agricultural and Resource Economics, North Carolina State
FLORIDA S PROPERTY TAX REFORM LEGISLATION: AN ECONOMIC REVIEW
 FLORIDA S PROPERTY TAX REFORM LEGISLATION: AN ECONOMIC REVIEW For FLORIDA ASSOCIATION OF REALTORS PREPARED BY: Regional Economic Research Institute Lutgert College of Business Florida Gulf Coast University
AUGUST 2012 An Update to the Budget and Economic Outlook: Fiscal Years 2012 to 2022 Provided as a convenience, this screen-friendly version is identic
 AUGUST 2012 An Update to the Budget and Economic Outlook: Fiscal Years 2012 to 2022 Provided as a convenience, this screen-friendly version is identical in content to the principal, printer-friendly version
The Productivity to Paycheck Gap: What the Data Show
 The Productivity to Paycheck Gap: What the Data Show The Real Cause of Lagging Wages Dean Baker April 2007 Center for Economic and Policy Research 1611 Connecticut Avenue, NW, Suite 400 Washington, D.C.
THE COSTS AND BENEFITS OF GROWTH: LAWRENCE, KS,
 THE UNIVERSITY OF KANSAS WORKING PAPERS SERIES IN THEORETICAL AND APPLIED ECONOMICS THE COSTS AND BENEFITS OF GROWTH: LAWRENCE, KS, 1990-2003 Joshua L. Rosenbloom University of Kansas and NBER May 2005
PROPOSED LOCAL GOVERNMENT REVENUE ENHANCEMENTS BY: LARRY N. ARFT, CITY MANAGER, CITY OF BELOIT, WISCONSIN JANUARY, 2009
 PROPOSED LOCAL GOVERNMENT REVENUE ENHANCEMENTS BY: LARRY N. ARFT, CITY MANAGER, CITY OF BELOIT, WISCONSIN JANUARY, 2009 General Introduction: Looking at the revenue base for local government in the State
Senate File 1209 (Pogemiller, D-Minneapolis) (passed and laid on the table 03/23/05)
 (passed and laid on the table 03/23/05)") Summary of 2005 Tax Provisions (Note: This document will be updated from time to time. Please check back periodically. Currently updated through 05.10.05.) The following tables summarize selected provisions
Summary of 2005 Tax Provisions (Note: This document will be updated from time to time. Please check back periodically. Currently updated through 05.10.05.) The following tables summarize selected provisions
SPENDING BOOM: THE ORIGINS OF WISCONSIN S 2003 FISCAL CRISIS. M Kevin McGee Department of Economics U Wisconsin Oshkosh October 2003
 SPENDING BOOM: THE ORIGINS OF SCONSIN S 2003 FISCAL CRISIS M Kevin McGee Department of Economics U Wisconsin Oshkosh October 2003 The State of Wisconsin weathered the 1990-91 recession relatively easily.
Economic & Revenue Forecast Tracking
 Economic & Revenue Forecast Tracking April 2011 Employment and Financial Statement Data through 03/11 503-378-3455 OEA.info@state.or.us http://www.oregon.gov/das/oea/index.shtml A. Macroeconomic Environment
Update of An Estimate of the State Intergovernmental Aid Costs of Tax Increment Financing
 This document is made available electronically by the Minnesota Legislative Reference Library as part of an ongoing digital archiving project. http://www.leg.state.mn.us/lrl/lrl.asp 1989 ~HOUSE RESEARCH
LETTER. economic THE CANADA / U.S. PRODUCTIVITY GAP: THE EFFECT OF FIRM SIZE FEBRUARY Canada. United States. Interest rates.
 economic LETTER FEBRUARY 2014 THE CANADA / U.S. PRODUCTIVITY GAP: THE EFFECT OF FIRM SIZE For many years now, Canada s labour productivity has been weaker than that of the United States. One of the theories
Governor s Supplemental Budget Tax Proposals Tax and Transportation Bills
 Tax Incidence Analysis Prepared by the Tax Research Division, Minnesota Department of Revenue May 9, 2017 (REVISED) Governor s Supplemental Budget Tax Proposals Tax and Transportation Bills Including Modifications
The House Proposal for Property Tax Relief & Reform HB 7001 & HJR 7089
 Current as of April 13, 2007 The House Proposal for Property Tax Relief & Reform HB 7001 & HJR 7089 Introduction Over the last several years, escalating property taxes have far outpaced Floridians ability
7 January Affordability of housing
 7 January 2015 MARKET ANALYTICS AND SCENARIO FORECASTING UNIT JOHN LOOS: HOUSEHOLD AND PROPERTY SECTOR STRATEGIST FNB HOME LOANS 011-6490125 john.loos@fnb.co.za THEO SWANEPOEL: PROPERTY MARKET ANALYST
Accelerating Deflation and Monetary Policy
 Accelerating Deflation and Monetary Policy Summary Deflation is proceeding at an accelerated pace due to the widening deflationary GDP gap. Eliminating deflation through economic stimulus by increasing
Report and Recommendations on Multi-family Property Assessment in Cook County
 Report and Recommendations on Multi-family Property Assessment in Cook County Prepared for The Cook County Board of Commissioners Prepared by Cook County Assessor James M. Houlihan January 2006 Report
Structural WISCONSIN S DEFICIT. The Wisconsin Legislature is currently. Our Fiscal Future at the Crossroads
 WISCONSIN S Structural DEFICIT Our Fiscal Future at the Crossroads The Robert M. La Follette School of Public Affairs University of Wisconsin Madison The Robert M. La Follette School of Public Affairs
Executive Overview and Summary: The Economic Effects of the 7% Assessment Cap in Cook County
 Institute of Government and Public Affairs 815 W. Van Buren Street Suite 525 Chicago, Illinois 60607 Executive Overview and Summary: The Economic Effects of the 7% Assessment Cap in Cook County Richard
The May Revision estimates that major General Fund revenues will be higher than
 Revenue Estimates The May Revision estimates that major General Fund revenues will be higher than at the Governor s Budget by $2.8 billion in 2010 11 and by $3.5 billion in 2011 12. When changes in accruals
Overview of Property Taxes. Presentation to House Property and Local Tax Division January 2017
 Overview of Property Taxes Presentation to House Property and Local Tax Division January 2017 State and Local Taxes ($32.9 billion in FY 2017) Individual Income 34% Property 28% Other Local Taxes 2% Sales
Property Tax Calculation Workbook
 Property Tax Calculation Workbook For Taxes Payable 2019 This workbook was updated January 2019. Please direct any questions or report any errors to PropTax.Admin@state.mn.us. Table of Contents Table of
THE NEW ECONOMY RECESSION: ECONOMIC SCORECARD 2001
 THE NEW ECONOMY RECESSION: ECONOMIC SCORECARD 2001 By Dean Baker December 20, 2001 Now that it is officially acknowledged that a recession has begun, most economists are predicting that it will soon be
PROPERTY VALUES AND TAXES IN SOUTHEAST WISCONSIN
 PROPERTY VALUES AND TAXES IN SOUTHEAST WISCONSIN September 2014 Jeff Schmidt, Researcher John Staskunas, Intern Rob Henken, President Sponsored by: TABLE OF CONTENTS INTRODUCTION... 3 Major Findings...
The Property Tax in New York State. Condition Report Prepared for the Education Finance Research Consortium December 2008
 The Property Tax in New York State Nelson A. Rockefeller Institute of Government 411 State Street Albany, New York 12203 Condition Report Prepared for the Education Finance Research Consortium December
Ric Battellino: Housing affordability in Australia
 Ric Battellino: Housing affordability in Australia Background notes for opening remarks by Mr Ric Battelino, Deputy Governor of the Reserve Bank of Australia, to the Senate Select Committee on Housing
Objectives for Chapter 24: Monetarism (Continued) Chapter 24: The Basic Theory of Monetarism (Continued) (latest revision October 2004)
 Chapter 24: The Basic Theory of Monetarism (Continued) (latest revision October 2004)") 1 Objectives for Chapter 24: Monetarism (Continued) At the end of Chapter 24, you will be able to answer the following: 1. What is the short-run? 2. Use the theory of job searching in a period of unanticipated
1 Objectives for Chapter 24: Monetarism (Continued) At the end of Chapter 24, you will be able to answer the following: 1. What is the short-run? 2. Use the theory of job searching in a period of unanticipated
Property Tax Inventory
 This document is made available electronically by the Minnesota Legislative Reference Library as part of an ongoing digital archiving project. http://www.leg.state.mn.us/lrl/lrl.asp Property Tax Inventory
TRUE FACTS AND FALSE PERCEPTIONS ABOUT FEDERAL DEFICITS" Remarks by Thomas C. Melzer Rotary Club of Springfield, Missouri December 6, 1988
 TRUE FACTS AND FALSE PERCEPTIONS ABOUT FEDERAL DEFICITS" Remarks by Thomas C. Melzer Rotary Club of Springfield, Missouri December 6, 1988 During the decade of the 1980s, the U.S. has enjoyed spectacular
HEA 1001 More than Property Tax Relief September 12, 2008
 HEA 1001 More than Property Tax Relief September 12, 2008 1 HEA 1001 More Than Property Tax Relief Expansion of Circuit Breaker Tax Credits Creates a financial interdependency of all local schools and
CROWE Policy Brief: Evidence on the Effects of Minnesota s Minimum Wage Increases
 CROWE Policy Brief: Evidence on the Effects of Minnesota s Minimum Wage Increases Noah Williams Center for Research on the Wisconsin Economy, UW-Madison June 20, 2018 Summary Beginning in 2014, the state
GENERAL FUND Revenues
 GENERAL FUND Revenues The General Fund is the general operating fund of the City and encompasses the major activities of the City excluding utilities. The activities of fire and police services, street
Measuring Total Employment: Are a Few Million Workers Important?
 June 1999 Federal Reserve Bank of Cleveland Measuring Total Employment: Are a Few Million Workers Important? by Mark Schweitzer and Jennifer Ransom Each month employment reports are eagerly awaited by
Understanding Adjustment Aid in New Jersey School Funding: A Case Study of Jersey City
 Understanding Adjustment Aid in New Jersey School Funding: A Case Study of Jersey City Danielle Farrie, PhD March 2018 One of the most misunderstood aspects of New Jersey s school funding formula is the
Chapter 4: A First Look at Macroeconomics
 Chapter 4: A First Look at Macroeconomics Principles of Macroeconomics I. Economics as a Social Science A. Economics is the social science that studies the choices that individuals, businesses, governments,
Miami County, Ohio FIVE-YEAR FINANCIAL FORECAST NOTES AND ASSUMPTIONS. For the Fiscal Years Ending June 30, 2013 through 2017
 Miami County, Ohio FIVE-YEAR FINANCIAL FORECAST NOTES AND ASSUMPTIONS For the Fiscal Years Ending June 30, 2013 through 2017 May 13, 2013 General The Ohio Constitution assigns the state the responsibility
Major State Aids &Taxes DATA ON WHERE THE AIDS GO AND WHERE THE TAXES COME FROM
 Major State Aids &Taxes A COMPARATIVE ANALYSIS, INCLUDING REGIONAL AND COUNTY DATA ON WHERE THE AIDS GO AND WHERE THE TAXES COME FROM Overview of Presentation I will cover three topics or questions: Why
2013 Omnibus Tax Bill
 Tax Incidence Analysis Prepared by the Tax Research Division, Minnesota Department of Revenue June 24, 2013 2013 Omnibus Tax Bill Chapter 143 (H.F. 677 as enacted on May 23, 2013) The 2013 Omnibus Tax
The Manufacturing Sector. Remarks of Dr. N. Gregory Mankiw Chairman, Council of Economic Advisers At the Exchequer Club.
 The Manufacturing Sector Remarks of Dr. N. Gregory Mankiw Chairman, Council of Economic Advisers At the Exchequer Club December 17, 2003 Today I would like to discuss the role of manufacturing in our economy.
1. Actual estimation may be more complex because of the use of statistical methods.
 Learning Objectives: Understand inflation Use terminology related to inflation Choose a base year Calculate constant dollars Choose a deflator MODULE 7 Inflation We use the term inflation to indicate the
Watershed District Levy Authority Modified $0 $0 $0 $0. Historical Society Expenditures for Cities/Towns $0 $0 $0 $0
 May 9, 2018 Property Taxes and Local Aids Only -- See Separate Analysis for State Taxes PROPERTY TAX Senate Omnibus Tax Bill Articles 4-7, 13-14 Yes No DOR Administrative X Costs/Savings *Costs incurred
ARLINGTON COUNTY, VIRGINIA
 ARLINGTON COUNTY, VIRGINIA County Board Agenda Item Meeting of November 14, 2006 DATE: November 8, 2006 SUBJECT: Fiscal Year (FY) 2008 Budget Guidance C. M. RECOMMENDATION: Provide guidance on the FY 2008
Implications of Fiscal Austerity for U.S. Monetary Policy
 Implications of Fiscal Austerity for U.S. Monetary Policy Eric S. Rosengren President & Chief Executive Officer Federal Reserve Bank of Boston The Global Interdependence Center Central Banking Conference
Table 1: Economic Growth Measures
 US Equities continued to advance in the second quarter, with the S&P 500 returning 5.2% for the quarter and 7.1% for the first half. Energy was by far the best performing sector in the quarter, returning
SPECIAL SCHOOL DISTRICT NO. 1 Board of Education
 SPECIAL SCHOOL DISTRICT NO. 1 Board of Education August 9, 2018 AMENDED RESOLUTION REGARDING SCHOOL DISTRICT QUESTIONS ON THE NOVEMBER 6, 2018 GENERAL ELECTION BALLOT WHEREAS, The Board of Directors of
Analysis of the HB 398 & SB 246 Changes to the CAUV Formula Howard Fleeter, Ohio Education Policy Institute December 7, 2016
 Senate Ways and Means Committee SB 36 Testimony Ohio School Boards Association Buckeye Association of School Administrators Ohio Association of School Business Officials March 8, 2017 Good morning, Chairman
Michigan s Experience With School Reform
 Michigan s Experience With School Reform Federation of Tax Administrators 2006 Revenue Estimation and Tax Research Conference September 2006 Jeffrey Guilfoyle, Director School Finance Reform In Michigan
Robert J. Schillerstrom. Chairman: DuPage County Board. Ad Hoc Committee on Residential Exemptions
 Robert J. Schillerstrom Chairman DuPage County Board Ad Hoc Committee on Residential Exemptions Committee Report September 2004 Committee Members: Chairman: Vice-Chairman: Grant Eckhoff Tom Bennington
B u d g e t B r i e f
 BUDGET PROJECT B u d g e t B r i e f February 1996 CAN CALIFORNIA AFFORD A 15% TAX CUT? OVERVIEW As part of his 1996-97 budget, Governor Wilson reintroduced his proposal for a 15% reduction in personal
Data Brief. Dangerous Trends: The Growth of Debt in the U.S. Economy
 cepr Center for Economic and Policy Research Data Brief Dangerous Trends: The Growth of Debt in the U.S. Economy Dean Baker 1 September 7, 2004 CENTER FOR ECONOMIC AND POLICY RESEARCH 1611 CONNECTICUT
How To Calculate A Property Tax
 Department of Property Records and Taxpayer Services How To Calculate A Property Tax This document gives instructions for calculating a property tax for the following property classifications: Residential
New Mexico Public School Funding through the Great Recession and Beyond
 Fiscal Policy Project New Mexico Public School Funding through the Great Recession and Beyond by Gerry Bradley, MA August 2016 The constitution of New Mexico provides for a system of free public schools
How To Calculate A Property Tax
 Department of Property Records and Taxpayer Services How To Calculate A Property Tax This document gives instructions for calculating a property tax for the following property classifications: Residential
System Failure: Michigan s Broken Municipal Finance Model. Prepared by: Frank W. Audia, Partner Denise A. Buckley, Associate
 System Failure: Michigan s Broken Municipal Finance Model Prepared by: Frank W. Audia, Partner Denise A. Buckley, Associate This report, written by Plante and Moran, PLLC at the request of the Michigan
TAX CUTS AND APPROPRIATIONS:
 TAX CUTS AND APPROPRIATIONS: SELECTED ISSUES PRESENTED TO HOUSE COMMITTEE ON WAYS AND MEANS LEGISLATIVE BUDGET BOARD STAFF February 2015 TOPICS ADDRESSED We were asked to provide information on the following:
Tax Reform: Informing the debate
 www.pwc.com.au Tax Reform: Informing the debate Bracket creep: Do we treat the symptoms or cure the disease? March 2016 Bracket creep: Do we treat the symptoms or cure the disease? Key points Dealing with
POLICY PERSPECTIVES BETTER, BUT STILL RISING STEADILY: AN UPDATE ON MUNICIPAL SPENDING IN METRO VANCOUVER HIGHLIGHTS
 BETTER, BUT STILL RISING STEADILY: AN UPDATE ON MUNICIPAL SPENDING IN METRO VANCOUVER HIGHLIGHTS Collectively, the 21 municipalities that comprise Metro Vancouver allocated $3.74 billion to operating or