TOWN OF SUDBURY The Residential Exemption Report
|
|
|
- Gertrude Green
- 5 years ago
- Views:
Transcription
1 TOWN OF SUDBURY November 1, 2011
2
3 CONTENTS Executive Summary... 1 I. Introduction... 3 II. Residential Exemption Database Profile... 7 III. The Process IV. Tax Impact V. Current Senior Exemption and Deferrals VI. Community Profiles VII. Administration VIII. Consequences Conclusion Updated for 2011 Page i
4
5 Executive Summary The prospect of easing the high property tax burden that certain residential property owners are facing through the adoption of a Residential Exemption is an option which must be examined and considered annually by the Board of Selectmen. The Residential Exemption provides a mechanism to redistribute the property tax burden within the residential class. It does not impact the Commercial, Industrial or Personal Property classes. Lower end assessments will generally see a property tax decrease, while higher end and non-qualifying properties will see an increase. The residential tax rate will rise in conjunction with a Residential Exemption. The results of the research and analysis project are integrated in The Residential Exemption Report. The statistics reported are based on FY 2011 assessment data. Our calculations are assuming the maximum exemption allowance, which is 20% of the average residential property assessment. The calculated amount of exemption for qualifying residential properties is $117,691. A majority of the 13 Residential Exemption communities have adopted the 20% exemption. A residential exemption database was produced whereby assessment and resident age were merged. A population sample was developed based on eligibility requirements as established in Chapter 59 Section 5C. An estimate of 5,061 residential properties was determined as meeting the ownership/occupancy requirements of the program. The exemption is not means based, and is not available to all residential property owners. Over 1,000 residential properties which do not meet the requisite eligibility criterion will involuntarily see a tax increase. The majority of qualifying residential properties will see a tax decrease. Non-qualifying and properties assessed greater than $711,200 will see a tax increase. The breakeven assessed valuation is $711,200. It is that point of valuation by which qualifying properties will experience neither a positive nor a negative impact due to this taxing scheme. Seniors with assessments greater than the breakeven point will be burdened with higher taxes. Updated for 2011 Page 1
6 Close to one-third of the qualified properties are owned by a resident over the age over 60. Sudbury seniors reside in homes with an average assessed value of $546,700. Not all seniors will qualify for the exemption. Regardless of income or assessment, if the ownership/occupancy requirement is not met, the property will be disqualified. Properties owned by a trust may not qualify. Sudbury s Local tax initiatives have provided means based assistance for the tax deferral, and personal exemption programs. Sudbury s demographic profile has little in common with the thirteen (13) communities which currently implement the program. Sudbury s population of nonowner occupied homes is relatively small. Virtually all communities with the exemption in place include a large population of non-owner occupied properties. There are serious tax equity issues associated with adoption of the Residential Exemption, and these must be given careful consideration. The Board of Selectmen must clearly define their goal when considering the exemption, and determine whether adoption of a Residential Exemption is the appropriate means to accomplish the desired end. Updated for 2011 Page 2
7 I. INTRODUCTION This report is a study of the impact of adopting a Residential Exemption for properties classified as residential in the Town of Sudbury. Residential properties are referred to in this report as Class I properties or parcels. Class I properties include single-family residences, apartments, multi-family units, condominiums and vacant land. In order to qualify for the Residential Exemption specific ownership and residency conditions must be met. Those requirements are discussed in Chapter III. Unlike personal exemptions which reduce the tax bill by statutory amounts, this provision reduces the property assessment by a fixed dollar amount of assessed value. It is therefore a property exemption. Adopting the Residential Exemption would allow the Selectmen to exempt from qualified Class I properties a percentage of the average assessed value of all Class I properties. The maximum allowable valuation exemption without special legislation is twenty (20%) percent of the average assessed value of all Class I properties, with no minimum. To show the effects of adopting the exemption, this report used Fiscal Year 2011 valuations and the Fiscal Year 2011 tax rate of $17.03 for Class I properties. For fiscal year 2011, the average assessed value of Class I properties was $588,454. Thus, if a residential exemption of 20% had been adopted for FY 2011, the assessments for all qualifying Class I properties would have been reduced by $117,691. If a residential exemption of 5% had been adopted, the assessments for qualifying Class I properties would have been reduced by $29,423. It is important to note that the exemption amount to be subtracted from the assessed valuation of qualifying Class I properties is a constant and not a percentage of an individual property assessment. To compensate for the reduction in valuations of Class I properties receiving the exemption, the tax rate for the residential class must increase. That is because the total taxes to be levied on Class I properties must remain within that class, and cannot be shifted onto properties classified as Commercial, Industrial or Personal. Currently, thirteen Massachusetts cities and towns have adopted the Residential Exemption. Historically, the exemption has been adopted in those communities with a high percentage of apartments and other investment property or seasonal homes. In general terms the exemption shifts real estate taxes onto Class I properties that are not occupied by the property owner as the owner s principal residence or are held for investment. Updated for 2011 Page 3
8 Of the 6,117 Class I properties in the Town, this report assumes 5,061 qualify for the Residential Exemption. To estimate the probable number of eligible properties, the following criteria were applied: 1. Only residential dwelling units may qualify (not vacant land, multi-family properties or apartments). 2. Only those residential properties whose owners are principally domiciled at the property may qualify. 3. Some residential properties held in Trust may not qualify. As intended by the application of a Residential Exemption, property owners not qualifying for the exemption would see higher real estate taxes. The tax rate on all Class I Properties must be increased to offset the reduced valuations of the qualifying Class I properties. This report will show that a Residential Exemption would have lowered FY2011 property taxes for those qualifying property owners with assessments below $711,200. This report will also show that qualifying property owners with assessments greater than the break even value would have had higher tax bills as a result of the requisite increase in the residential tax rate. Historical Perspective To understand the principles of the Residential Exemption it is important to have a basic understanding of how the ad valorem taxation as well as full and fair cash valuation system in Massachusetts has evolved. The Constitution of the Commonwealth of Massachusetts requires that taxation be proportionate and reasonable. Assessors have a statutory duty to assess all real and personal property at full and fair cash value. Conforming to provisions set forth in Massachusetts General Laws Chapter 59 Section 38, the Town of Sudbury s first revaluation was conducted in the year 1966 and then again for the 1970 tax year. As a result of the 1970 revaluation assessed valuations in the Town increased appreciably. Prior to 1974 there were wide variations in assessment practices in Massachusetts. Although a statutory requirement for all communities to assess at full and fair cash value was in place, it was not enforced. Those cities and towns adhering to the mandates of assessing properties at their full and fair cash valuation were penalized; the local aid formula and distributions were based on the equalized value of the community. Communities conforming to the regulations tended to have higher equalized values, and as a result received less state aid. Updated for 2011 Page 4
9 The Supreme Judicial Court s (SJC) 1974 landmark decision Town of Sudbury v. the Commissioner of Corporations and Taxation, (the Sudbury Decision) found in favor of Sudbury s contention that there were wide variations in local assessing practices, and that the Commissioner of Revenue was not enforcing the standard, thereby resulting in unfair local aid distributions. The SJC decision in the Sudbury case held that the Commissioner had both the power and the duty to direct assessors to maintain full and fair cash valuations. The effect of the Sudbury decision in communities practicing disproportionate assessing was to shift the tax burden from commercial, industrial and personal properties back to residential properties. In 1978, voters approved an amendment to the Massachusetts Constitution, which authorized the Legislature to classify real property into as many as four classes. In 1979, the General Court passed legislation authorizing the use of differential tax rates provided a community was certified as assessing its property at full and fair cash value. Chapter 797 of the Acts of amended Chapter 59 by inserting 5c which established the Residential Exemption (see Appendix F). The determination to implement differential tax rates is a local option that is made each year by the selectmen in a town or by the mayor and city council in a city. Once the Department of Revenue certifies that the municipality s values represent full and fair cash values and the properties are classified according to use, local officials are permitted to determine the proportion of the tax burden to be borne by each class of property. The Commissioner of Revenue annually determines the allowable limits of this shift for each community. Sudbury has classified its property types since 1981, and has also utilized dual tax rates since that time (see appendices (A) 1980 and (B) 1981 recap). Annually, the Board of Selectmen in the Town hold the Classification Hearing at which they vote on the share each of the property classes is to bear, and they also vote on three exemptions: the small commercial exemption, the open space exemption and the Residential Exemption. Historically Sudbury Selectmen have not adopted the Residential Exemption. Along with an indiscriminate redistribution of tax, the nay vote may have been due to such a high percentage of residential properties in the Town being owner-occupied. This option may, however, be a means to reduce property taxes for some of Sudbury s senior population since the valuations of homes owned and occupied by seniors tend to be in the lower two-thirds to three-quarters of all residential properties. It should be noted however, Sudbury has adopted, where permitted by law, generous options regarding the Senior Tax Deferral Program, and Town Meeting Updated for 2011 Page 5
10 has passed warrant articles increasing the maximum available allowances for statutory personal exemption relief. Citing the Sudbury decision as evidence, it is important to note that the Town has historically championed fair and equitable treatment for all. The Selectmen need to determine whether adopting a Residential Exemption will maintain that end. Updated for 2011 Page 6
11 II. RESIDENTIAL EXEMPTION DATABASE PROFILE In order to gain a sound understanding of how various population groups fit into assessed value ranges, a working database was constructed. This provided details of consequences various age clusters are likely to face resulting from the adoption of a Residential Exemption Program. We started with the Assessors 2011 real estate data and deleted all commercial, industrial, and exempt properties. We then removed vacant land, apartment buildings, and the assisted living facility. From the remaining residential data, certain properties held in Trust were also eliminated. From this database we were able to cross match mailing and location addresses. Any records that we reasonably assumed to be non-owner occupied were also eliminated. With the Assessors data in place, we compared our results with information from the Town Clerk s Office. The coordinated accounts matched assessment and resident data. We were able to determine the eldest resident in 4,976 of the 5,061 properties eligible for the Residential Exemption. (The eldest resident could not be determined in 85 properties.) It should be understood the data sample may be subject to unintended omissions, exclusions and duplications. Database Results Because the Residential Exemption does not recognize age or income it is important to note how various groups will be impacted. The data relative to age and assessed values are depicted in the following table and graphs. Updated for 2011 Page 7
12 Database Results Age Range Property Count Lowest Assessment Highest Assessment Average Assessment Median Assessment , , , , ,000 2,762, , , ,000 3,247, , , ,000 3,000, , , ,000 4,049, , , ,400 3,069, , , ,200 1,290, , , , , , ,300 NK* ,000 2,732, , ,900 Total 5061 *NK = Not Known The following Low and High Assessed Valuations graph illustrates the low and high assessment ranges grouped by age. Updated for 2011 Page 8
13 $4,500,000 $4,000,000 Low and High Assessed Valuations by Resident Age $3,500,000 $3,000,000 Assessed Value $2,500,000 $2,000,000 $1,500,000 Actual Lowest 2011 Assessment Within Age Range Actual Highest 2011 Assessment Within Age Range (Excludes Not Knowns) $1,000,000 $500,000 $ Age Range The following graph illustrates the average and median assessment ranges grouped by age. Updated for 2011 Page 9
14 $800,000 $700,000 Average and Median Assessed Valuations by Resident Age $600,000 Assessed Value $500,000 $400,000 $300,000 $200,000 Average 2011 Assessment Within Age Range Median 2011 Assessment Within Age Range (Excludes Not Knowns) $100,000 $ Age Range Updated for 2011 Page 10
15 III. THE PROCESS Determining the Eligible Accounts The method to determine eligibility begins with a review of the taxable accounts to ascertain a reasonable estimate of eligible candidates. Certain accounts are immediately rejected based upon their designated Class and/or use. These include: Commercial, Industrial and Personal Property which are not considered in the equation, as they are not part of the Residential Class I. As well, Vacant Land, Apartment Buildings, Assisted Living Centers and Daycare Facilities are not eligible. Within the Residential Class I there remain certain other parcels that are not eligible to receive the exemption as they do not meet the necessary ownership and occupancy requirement. Of Sudbury s total residential parcel count 6,117 we estimate that 5,061 parcels may qualify for exemption. This leaves 1,056 parcels that would not be eligible due to one or more of the following factors: A residential home which is not owner occupied; New construction which is unoccupied on January 1 st ; A residential home whose ownership is held in certain trust type. In some instances, property held in trust may not qualify. Trust ownership arrangements may adversely affect qualification for the Residential Exemption as well as other statutory exemptions. For estate planning purposes many seniors place their properties in a trust and inasmuch eliminate their individual ownership in the property. This may also eliminate their eligibility for the residential exemption. As a general rule, an applicant must be trustee and beneficiary to be eligible for exemption. The Department of Revenue issued a very comprehensive guideline on Trust eligibility associated with tax exemptions and deferrals. 1 The estimated 5,061 parcels that we identified as potentially eligible have the following characteristics: The principal residence of the owner on January 1 st ; Owned either individually, jointly, or in some cases as a trustee. For the purpose of all exemptions, the principal residence is the address from which the Massachusetts income tax return is filed. Using the criteria identified above we have estimated the number of Class I properties likely to receive the exemption, as well as the properties not likely to qualify. The ELIGIBLE/INELIGIBLE ACCOUNTS chart below details the results. 1 See Appendix C Updated for 2011 Page 11
16 ELLIGIBLE/INELIGIBLE ACCOUNTS Residential Taxable Property by Use (CLASS I) Use Code TOTAL ACCOUNTS Total Taxable Residential Assessments By Use (Class I) Elligible Ineligible ACCTS PERCENT ACCTS PERCENT Single Family Dwelling (SFD) 101 5,392 3,386,110,700 4,883 91% 509 9% Condominium ,889, % 59 30% 2 Homes on 1 Lot Misc 103, ,430, % 8 38% Two Family ,254, % 14 67% Three Family , % 0 0% Apartments 111, ,722, % 3 100% Vacant Land Mixed Use, Farm Homes TOTALS , ,816, % % ,798, % 26 62% 6,117 3,599,570,656 5,061 83% 1,056 17% Updated for 2011 Page 12
17 Classification of Assessments and Rates Classification of property by its use allows municipalities to allocate how much of the tax burden each class shall bear. Annually, a public hearing is held by the Board of Selectmen to determine the tax rates. Known as the Classification Hearing, the public is invited to express their opinion about the distribution of the taxes to be raised. Prior to the meeting, the Assessors stratify the taxable values by Class or usage type. There are four taxable classes of real property and one personal property class. Class I RESIDENTIAL All residential property uses Class II OPEN SPACE Vacant Land Class III COMMERCIAL Retail, Office, Class IV INDUSTRIAL Manufacturing, Mining Class V PERSONAL PROPERTY Business Items not permanently affixed to the real estate. The following are commonly used acronyms for these classes: RES OS CIP Residential property Open Space Commercial, Industrial and Personal Property classes Massachusetts ad valorem tax system is based on rates per thousand of assessed value. The allocated levy, when divided by the aggregate assessments by Class, yields a millage rate. This percentage when multiplied by 1,000 returns a tax dollar rate. Updated for 2011 Page 13
18 The following chart illustrates the results of fiscal year 2011 Classification Hearing. The RES rate was $17.03 and the CIP rate was $ If tax rates were not split, all classes would have paid on a rate of $ CIP s actual share was seven percent 7% of the total tax base. By increasing it with a factor of 1.28, their rate increased by $4.87 to $ Shifting an additional 28% of the levy onto CIP only reduced the residential tax rate by 37 cents to $ The reason for such a minor decrease to Class I is the amount of CIP tax base is quite small. In years when the real estate market is on the rise, CIP has even less weight to support residential taxes increases. Fiscal Year 2011 Tax Rates As Certified By the Department Of Revenue (DOR) 2 CLASSIFICATION TAXABLE VALUES TAX LEVY TAX RATE I RES 3,599,570,656 61,300, II OS N/A III, IV, PP CIP 274,711,172 6,117, TOTAL 3,874,281,828 67,418,506 N/A The RES levy of $61,300,688 Divided by The RES value of $3,599,570,656 Equals: When multiplied by 1,000 the result is The RES tax rate: $ Incorporating a RES exemption will reduce the total RES value taxed, and this is an acceptable outcome. Conversely, the required levy to be raised cannot change. If a residential exemption were to be adopted, the same amount of RES tax levy: $61,300,688 needs to be collected tax recap appendix D Updated for 2011 Page 14
19 Computation of the Residential Exemption Subsequent to the allocation of the tax, Selectmen may choose to adopt a residential exemption. This process begins with a calculation of the average assessment of all residential properties. The formula is based on simple division of the total value of all residential property types by the number of properties in the residential class. Residential Property Types Number of Accounts Class Value Totals 101: Single Family 5,392 3,386,110,700 Average Residential Assessment 102: Condominiums ,889,600 Misc Res: 21 22,430, : Two Family 21 12,254, : Three Family 1 548, : Apartments 3 17,722, & 106: Vacant Land ,816, : Mixed Use 42 22,798,656 (Value/Count = ) Average Residential 6,117 $ 3,599,570,656 $588,454 Assessed Value Even though all properties do not benefit from the exemption, the Average Assessed Value of ALL Residential Property provides the basis for determining the dollar amount of value to be exempted. Sudbury s FY 2011 average assessed value of all residential property is $588,454. Once the percentage is voted, it is multiplied by the average. Updated for 2011 Page 15
20 For Example: Average RES Value $588,454 Times Voted percentage 20% Equals = Value of the Exemption $117,691 With the exemption discount calculated, the new RES Taxable Value can be determined. The estimated accounts which are eligible for the exemption are Value of the Exemption $117,691 Times X Eligible Accounts 5061 Equals = Total Exemption Value $595,632,731 X Since each eligible property will receive a reduction in their assessment of $117,691 the total amount of exemption must be subtracted from the original RES taxable value to determine how much value remains to be taxed. Original RES Total Value $3,599,570,656 Minus Total Exemption Value 595,632,731 Equals = Adjusted Taxable RES Value $3,003,937,925 Given that the residential class assessment total is reduced in the example, collecting the same amount of levy is offset by applying a higher tax rate. The following chart depicts the Actual FY11 value and rate and the case in point Adjusted FY11 value and rate, assuming a 20% adoption. Updated for 2011 Page 16
21 FY11 Value & Rate Residential FY11 Value & Rate With Exemption Percent Voted 0% 20% Taxable Value $3,599,570,656 $3,003,937,517 Tax Levy* $61,300,688 $61,300,688 Tax Rate $17.03 $20.41 * The amount of tax levy to be raised by the RES Class is the same with or without the exemption Table of Example Percentages shows the corresponding exempt values and tax rates based upon various percentages. Table of Example Percentages Corresponding Example Residential Tax Percentage Relative Value Rates 5% 29, % 58, % 88, % 117, While discussion concentrates on a twenty percent exemption, the table on the following page demonstrates the full computation along with outcomes of several options. Updated for 2011 Page 17
22 RESIDENTIAL EXEMPTION CALCULATION Residential Average Total Total Eligible Exemption Exemption Total Value New Residential Total Residential Assessment Accounts Accounts Voted Amount Exempted Assessment Total Levy Tax Rate 588,454 6,117 5,061 0% 3,599,570,656 61,300,688 $ % 29, ,908,183 3,450,662,473 61,300,688 $ % 58, ,816,366 3,301,754,290 61,300,688 $ % 88, ,724,549 3,152,846,107 61,300,688 $ % 117, ,632,731 3,003,937,925 61,300,688 $20.41 Calculation of the Residential (RES) Tax Rate RES Tax Levy Total RES Value Rate of Tax times Tax Rate divided by equals equals 61,300,688 3,599,570, ,000 $17.03 Calculation of the Residential RES Exemption Total RES Value 3,599,570,656 divided by 6,117 Class I Accounts equals 588,454 Average RES Assessment times 20% Exemption Percent equals 117,691 Value from which to reduce eligible assessments times 5,061 Number of Eligible Accounts equals 595,632,731 Total Value Exempted Total RES Value Total Value Exempted Adjusted RES Total minus equals 3,599,570, ,632,731 3,003,937,925 Calculation of a 20% (RES) Exemption Tax Rate RES Tax Levy Adusted RES Total Rate of Tax times Tax Rate divided by equals equals 61,300,688 3,003,937, ,000 $20.41 Updated for 2011 Page 18
23 One of the documents submitted at the Classification Hearing is a worksheet illustrating the increase in a single family tax bill from the prior year. The changes are segregated by value increments and show dollar and percent changes. The average value of a Single Family Dwelling (SFD) and tax are highlighted. The following table has four sections. The top row lists FY10 values with taxes calculated by the FY10 rate of $ The next section shows the actual FY11 increase as calculated by the voted tax rate of $ The next section illustrates the shift in tax liability when a 20% RES Exemption, with a calculated rate of $20.41 is applied to qualifying properties. The final section indicates a 19.8% increase for non-qualifying RES accounts at the $20.41 tax rate. Updated for 2011 Page 19
24 FY11 Tax Implications of a Residential Exemption Regular Annual Tax for FY2010 FY10 Assessment $300,000 $400,000 $500,000 $600,000 $650,400 $800,000 $1,000,000 $1,500,000 $2,000,000 $2,500,000 FY10 Rate $16.08 $4,824 $6,432 $8,040 $9,648 $10,458 $12,864 $16,080 $24,120 $32,160 $40,200 Tax Increase from FY2010 to FY2011 RANGE OF VALUES UP TO UP TO UP TO UP TO UP TO UP TO UP TO UP TO UP TO UP TO 300K 400K 500K 600K 700K 800K 1.0M 1.5M 2.0M 2.5M ACCOUNTS* FY11 Assessment $289,668 $386,224 $482,780 $579,336 $628,000 $772,448 $965,560 $1,448,339 $1,931,119 $2,413,899 FY11 Rate $17.03 $4,933 $6,577 $8,222 $9,866 $10,695 $13,155 $16,443 $24,665 $32,887 $41,109 $ Difference % Difference Regular Annual Tax Differential Between FY 2010 and FY 2011 $109 $145 $182 $218 $236 $291 $363 $545 $727 $ % 2.3% 2.3% 2.3% 2.3% 2.3% 2.3% 2.3% 2.3% 2.3% Tax Impact Using a 20% Residential Exemption Value and Tax Rate Tax Differential Between FY2011 Regular Value and Exempted Value Exempt Value/Rate $171,977 $268,533 $365,089 $461,645 $510,309 $654,757 $847,869 $1,330,649 $1,813,429 $2,296,208 $117,691 $20.41 $3,509 $5,480 $7,450 $9,421 $10,414 $13,361 $17,302 $27,154 $37,006 $46,858 $ Difference % Difference ($1,424) ($1,097) ($771) ($445) ($281) $207 $859 $2,489 $4,119 $5, % 16.7% 9.4% 4.5% 2.6% 1.6% 5.2% 10.1% 12.5% 14.0% Tax Impact Using a 20% Residential Exemption Tax Rate Not Eligible Tax Differential Between FY2011 Regular Tax and RES Exemption Tax Rate Exempt Value/Rate $289,668 $386,224 $482,780 $579,336 $628,000 $772,448 $965,560 $1,448,339 $1,931,119 $2,413,899 $0 $20.41 $5,911 $7,882 $9,852 $11,822 $12,815 $15,763 $19,704 $29,556 $39,408 $49,260 $ Difference % Difference $978 $1,304 $1,630 $1,956 $2,121 $2,608 $3,260 $4,891 $6,521 $8, % 19.8% 19.8% 19.8% 19.8% 19.8% 19.8% 19.8% 19.8% 19.8% *There are also 15 residential properties valued at more than $2.5M; all counts exclude vacant land Updated for 2011 Page 20
25 IV. TAX IMPACT According to the voted percentage, for analysis purposes, our examples are assuming the maximum 20% allowable exemption percentage. The equivalent flat dollar value ($117,691) is subtracted from the assessed valuation of each qualifying property. Table of Comparative Valuation (below) depicts two sample properties (FY 2011 assessments) valued at opposite ends of the assessment spectrum and the likely assessment scenario IF: the 20% residential exemption was adopted. The first segment of the table shows the scenario for qualifying properties. The second segment of the table depicts the same two property value types however the homes are not owner occupied, and thus do not qualify to receive the reduction in assessed value. Table of Comparative Valuations Qualifying Properties with Residential Exemption FY 2011 Assessed Value: 400,000 1,000,000 (Minus) 20% RES Exemption: (117,691) (117,691) Taxable Valuation $282,309 $882,309 Non qualifying Properties No value Adjustment FY2011 Assessed Value: 400,000 1,000,000 20% RES Exemption (Not Applicable): FY2011 Taxable Valuation: $400,000 $1,000,000 Updated for 2011 Page 21
26 One way to look at the relative impact of the tax implication is to consider the tax rate which corresponds to the exemption. Home owners with high valuations would see their tax bill increase, while homeowners with lower valuations would see their tax bill decrease. The larger the exemption, the more pronounced the effect. ***The same residential tax rate will be imposed for all residential properties whether or not they qualify for the exemption. *** In other words, if a property does not qualify for exemption it too will be subject to the increased rate! The impact of applying taxes to the above example is demonstrated through the following assumptions. Adopted Percentage Corresponding Tax Rate 20% $20.41 The Expanded Table of Comparative Valuation demonstrates tax liability for the $400,000 and $1,000,000 properties. The first scenario Part (A) depicts the actual FY 2011 tax charged. Part (B) assumes both properties meet the requisite ownership and occupancy condition; and Part (C) assumes neither property is eligible. Expanded Table of Comparative Valuations (A) Actual FY11 Tax No Exemption Adopted 1. FY 2011 Assessed Value 400,000 1,000, Residential Actual Tax Rate FY 2011 Actual Tax $6,812 $17,030 Updated for 2011 Page 22
27 (B) Qualifying Property with Residential Exemption 1. FY 2011 Assessed Value 400,000 1,000, Minus RES Exemption (117,691) (117,691) 3. FY 2011 New Taxable Valuation 282, , % RES Exemption Tax Rate FY 2011 Resulting Tax 5,761 18, Tax Increase (Decrease) ($1,051) $975 (C) Non qualifying Property No value Adustment 1. FY 2011 Assessed Value 400,000 1,000, % Exemption Not Applicable 3. FY 2011 New Taxable Valuation 400,000 1,000, % RES Exemption Tax Rate FY 2011 Resulting Tax 8,163 20, Tax Increase $1,351 $3,377 These examples call attention to three very different tax implications. Part A represents the actual tax for FY11. It shows the annual tax of two assessments when a RES Exemption is not adopted. Notably, in the second scenario (Part B), each assessment is reduced by $117,691. However, with a rate increase from $17.03 to $20.41, the exempted value is not sufficient to reduce the tax of the higher assessed property. In fact, the consequences of the RES exemption produced a higher tax bill for this qualifying property. The remaining non-qualifying properties see no value reduction. Yet they will absorb the taxes of the redistributed levy through the higher tax rate. Part C shows the additional tax shifted onto these owners. The Tax Impact Tables on the following pages demonstrates how various ranges of value are impacted by the 20% adoption. Residential Impact On A Single Tax Bill Updated for 2011 Page 23
28 FY 2011 Value/ Tax Basis COUNT* Actual Value Actual Tax Value following 20% Exemption Res Exempt Tax RES Qualifying Tax Change Non Qualifying Tax Non Qualifying Tax Increase Average Single Family Home Value $17.03 $117,691 $20.41 $ ,000 3, ,309 1, (1,726.33) 4, ,000 4, ,309 2, (1,557.49) 5, ,000 5, ,309 3, (1,388.66) 6, , ,000 5, ,309 4, (1,219.82) 7, , ,000 6, ,309 5, (1,050.98) 8, , ,000 7, ,309 6, (882.14) 9, , ,000 8, ,309 7, (713.30) 10, , ,000 9, ,309 8, (544.46) 11, , ,000 10, ,309 9, (375.62) 12, , ,000 10, ,309 10, (281.07) 12, , ,000 11, ,309 10, (206.78) 13, , ,000 11, ,309 11, (37.94) 14, , ,000 12, ,309 12, , , ,000 13, ,309 13, , , ,000 15, ,309 15, , , ,000,000 17, ,309 18, , , ,200,000 20, ,082,309 22, , , , ,400,000 23, ,282,309 26, , , , ,600,000 27, ,482,309 30, , , , ,900,000 32, ,782,309 36, , , , ,200,000 37, ,082,309 42, , , , ,500,000 42, ,382,309 48, , , , Actual values greater than 2,5000,000 *Counts exclude vacant land Updated for 2011 Page 24
29 There is a point where the exemption has no impact on the tax bill. This is known as the breakeven. The following charts illustrate the breakeven points and tax implications of the four possible exemption percentages. Fiscal Year 2011 Value/ Tax Basis Average Single Family Value Breakeven Point Actual Value Tax Impact from a Residential Exemption of 20% Value following 20% Exemption Res Exempt Tax Non Qualifying Tax RES Qualifying Difference Non Qualifying Tax Increase Actual Tax , ,000 3, ,309 1, , (1,726.33) ,000 4, ,309 2, , (1,557.49) ,000 5, ,309 3, , (1,388.66) 1, ,000 5, ,309 4, , (1,219.82) 1, ,000 6, ,309 5, , (1,050.98) 1, ,000 7, ,309 6, , (882.14) 1, ,000 8, ,309 7, , (713.30) 1, ,000 9, ,309 8, , (544.46) 1, ,000 10, ,309 9, , (375.62) 2, ,000 10, ,309 10, , (281.07) 2, ,000 11, ,309 10, , (206.78) 2, ,000 11, ,309 11, , (37.94) 2, ,200 12, ,509 12, , (0.13) 2, ,300 12, ,609 12, , , ,000 12, ,309 12, , , ,000 13, ,309 13, , , ,000 15, ,309 15, , , ,000,000 17, ,309 18, , , ,200,000 20, ,082,309 22, , , , ,400,000 23, ,282,309 26, , , , ,600,000 27, ,482,309 30, , , , ,900,000 32, ,782,309 36, , , , ,200,000 37, ,082,309 42, , , , ,500,000 42, ,382,309 48, , , , Updated for 2011 Page 25
30 Fiscal Year 2011 Value/ Tax Basis Average Single Family Value Breakeven Point Actual Value Tax Impact from a Residential Exemption of 15% Actual Tax Value following 15% Exemption Res Exempt Tax Non Qualifying Tax RES Qualifying Difference Non Qualifying Tax Increase , ,000 3, ,732 2, , (1,233.60) ,000 4, ,732 3, , (1,112.95) ,000 5, ,732 4, , (992.30) ,000 5, ,732 5, , (871.65) ,000 6, ,732 6, , (751.01) ,000 7, ,732 7, , (630.36) 1, ,000 8, ,732 8, , (509.71) 1, ,000 9, ,732 8, , (389.06) 1, ,000 10, ,732 9, , (268.41) 1, ,000 10, ,732 10, , (200.85) 1, ,000 11, ,732 10, , (147.76) 1, ,000 11, ,732 11, , (27.11) 1, ,200 12, ,932 12, , (0.09) 1, ,300 12, ,032 12, , , ,000 12, ,732 12, , , ,000 13, ,732 13, , , ,000 15, ,732 15, , , ,000,000 17, ,732 17, , , ,200,000 20, ,111,732 21, , , , ,400,000 23, ,311,732 25, , , , ,600,000 27, ,511,732 29, , , , ,900,000 32, ,811,732 35, , , , ,200,000 37, ,111,732 41, , , , ,500,000 42, ,411,732 46, , , , Updated for 2011 Page 26
31 Fiscal Year 2011 Value/ Tax Basis Average Single Family Value Breakeven Point Actual Value Tax Impact from a Residential Exemption of 10% Actual Tax Value following 10% Exemption Res Exempt Tax Non Qualifying Tax RES Qualifying Difference Non Qualifying Tax Increase $17.03 $58,845 $ ,000 3, ,155 2,621 3, (785.31) ,000 4, ,155 3,549 4, (708.50) ,000 5, ,155 4,477 5, (631.70) ,000 5, ,155 5,406 6, (554.89) ,000 6, ,155 6,334 7, (478.09) ,000 7, ,155 7,262 8, (401.29) ,000 8, ,155 8,191 9, (324.48) ,000 9, ,155 9,119 10, (247.68) ,000 10, ,155 10,047 11, (170.87) ,000 10, ,155 10,567 11, (127.86) ,000 11, ,155 10,975 12, (94.07) ,000 11, ,155 11,904 12, (17.26) 1, ,200 12, ,355 12,112 13, (0.06) 1, ,300 12, ,455 12,114 13, , ,000 12, ,155 12,832 13, , ,000 13, ,155 13,760 14, , ,000 15, ,155 15,617 16, , ,000,000 17, ,155 17,474 18, , ,200,000 20,436 1,141,155 21,187 22, , ,400,000 23,842 1,341,155 24,900 25, , , ,600,000 27,248 1,541,155 28,613 29, , , ,900,000 32,357 1,841,155 34,183 35, , , ,200,000 37,466 2,141,155 39,753 40, , , ,500,000 42,575 2,441,155 45,323 46, , , Updated for 2011 Page 27
32 Fiscal Year 2011 Value/ Tax Basis Average Single Family Value Breakeven Point Actual Value Tax Impact from a Residential Exemption of 5% Actual Tax Value following 5% Exemption Res Exempt Tax Non Qualifying Tax RES Qualifying Difference Non Qualifying Tax Increase $17.03 $29,423 $ ,000 3, ,577 3,030 3, (375.71) ,000 4, ,577 3,919 4, (338.97) ,000 5, ,577 4,807 5, (302.22) ,000 5, ,577 5,695 6, (265.47) ,000 6, ,577 6,583 7, (228.73) ,000 7, ,577 7,472 7, (191.98) ,000 8, ,577 8,360 8, (155.24) ,000 9, ,577 9,248 9, (118.49) ,000 10, ,577 10,136 10, (81.75) ,000 10, ,577 10,634 11, (61.17) ,000 11, ,577 11,024 11, (45.00) ,000 11, ,577 11,913 12, (8.26) ,200 12, ,777 12,112 12, (0.03) ,300 12, ,877 12,113 12, ,000 12, ,577 12,801 13, ,000 13, ,577 13,689 14, ,000 15, ,577 15,466 15, ,000,000 17, ,577 17,242 17, ,200,000 20,436 1,170,577 20,795 21, ,400,000 23,842 1,370,577 24,348 24, , ,600,000 27,248 1,570,577 27,901 28, , ,900,000 32,357 1,870,577 33,231 33, , ,200,000 37,466 2,170,577 38,560 39, , , ,500,000 42,575 2,470,577 43,890 44, , , Updated for 2011 Page 28
33 Rescission of the Exemption Once a Residential Exemption is implemented, rescinding it can have serious consequences on some properties. Assuming no change to levy or assessments, properties with the lowest assessment would see their tax bill double. Homes above the breakeven point could see as much as 12.4% reduction. Rescinding the Residential Exemption on Qualifying Properties Previous Year Exempted Rescinded Exemption Impact Taxable Taxable Value Tax Value Tax Tax Change ,309 1, ,000 3, , % 132,309 2, ,000 4, , % 182,309 3, ,000 5, , % 232,309 4, ,000 5, , % 282,309 5, ,000 6, , % 332,309 6, ,000 7, % 382,309 7, ,000 8, % 432,309 8, ,000 9, % 482,309 9, ,000 10, % Average SFD 510,309 10, ,000 10, % 532,309 10, ,000 11, % 582,309 11, ,000 11, % Breakeven 593,509 12, ,200 12, % 593,609 12, ,300 12, (0.21) 0.0% 632,309 12, ,000 12, (130.89) 1.0% 682,309 13, ,000 13, (299.73) 2.2% 782,309 15, ,000 15, (637.41) 4.0% 882,309 18, ,000,000 17, (975.09) 5.4% 1,082,309 22, ,200,000 20, (1,650.44) 7.5% 1,282,309 26, ,400,000 23, (2,325.80) 8.9% 1,482,309 30, ,600,000 27, (3,001.15) 9.9% 1,782,309 36, ,900,000 32, (4,014.19) 11.0% 2,382,309 48, ,500,000 42, (6,040.25) 12.4% Updated for 2011 Page 29
34 Properties that had not qualified in the previous year would see a 16.5% reduction in their tax bill. As indicated this reduction would be redistributed to the previous beneficiaries of the exemption. Rescinding the Residential Exemption on Non Qualifying Properties Previous Year Exempted Rescinded Exemption Impact Taxable Taxable Value Tax Value Tax Tax Change ,000 4, ,000 3, (675.36) 250,000 5, ,000 4, (844.19) 300,000 6, ,000 5, (1,013.03) 350,000 7, ,000 5, (1,181.87) 400,000 8, ,000 6, (1,350.71) 450,000 9, ,000 7, (1,519.55) 500,000 10, ,000 8, (1,688.39) 550,000 11, ,000 9, (1,857.23) 600,000 12, ,000 10, (2,026.07) Average SFD 628,000 12, ,000 10, (2,120.62) 650,000 13, ,000 11, (2,194.90) 700,000 14, ,000 11, (2,363.74) Breakeven 711,200 14, ,200 12, (2,401.56) 711,300 14, ,300 12, (2,401.90) 750,000 15, ,000 12, (2,532.58) 800,000 16, ,000 13, (2,701.42) 900,000 18, ,000 15, (3,039.10) 1,000,000 20, ,000,000 17, (3,376.78) 1,200,000 24, ,200,000 20, (4,052.13) 1,400,000 28, ,400,000 23, (4,727.49) 1,600,000 32, ,600,000 27, (5,402.84) 1,900,000 38, ,900,000 32, (6,415.87) 2,500,000 51, ,500,000 42, (8,441.94) See pages for a discussion of Weymouth and Marlborough experiences in rescinding a Residential Exemption. Updated for 2011 Page 30
35 Market Value Changes Each year sales are analyzed and assessments are raised or lowered to meet the standards set forth in the Sudbury Decision. The sales are stratified by use, style, location and quality among many other observations. A computerized model is then updated from the conclusions within each set. While many properties experience similar changes, there are always variables which produce higher or lower valuations results in some groups. All properties may not see an equal assessment change in a future tax year. For example, let s examine the following chart with these assumptions. High and low assessments remained the same. Properties between $500,000 and $1,000,000 were lowered by 5% to meet market value. The levy did not change, yet the total taxable value dropped by 2.7%, and the tax rate increased by 2.8% to offset the loss. While mid-range properties experienced the greatest percentage of decrease, all other residential properties absorbed the cost. Updated for 2011 Page 31
36 Impact of Fluctuating Assessments on Qualifying Properties Previous Year Updated Assessment Taxable Taxable Value* Tax Value* Tax ,309 1, ,499 1, % 132,309 2, ,499 2, % 182,309 3, ,499 3, % 232,309 4, ,499 4, % 282,309 5, ,499 5, % 332,309 6, ,499 7, % 382,309 7, ,499 7, (240.10) 3.1% 432,309 8, ,999 8, (264.11) 3.0% 482,309 9, ,499 9, (288.12) 2.9% Average SFD 510,309 10, ,099 10, (301.57) 2.9% 532,309 10, ,999 10, (312.13) 2.9% 582,309 11, ,499 11, (336.14) 2.8% Original 593,509 12, ,139 11, (341.52) 2.8% Breakeven 593,609 12, ,234 11, (341.57) 2.8% 632,309 12, ,999 12, (360.15) 2.8% 682,309 13, ,499 13, (384.17) 2.8% 782,309 15, ,499 15, (432.19) 2.7% 882,309 18, ,499 17, (480.21) 2.7% 1,082,309 22, ,025,499 21, (576.25) 2.6% 1,282,309 26, ,285,499 26, % 1,482,309 30, ,485,499 31, % 1,782,309 36, ,785,499 37, , % 2,082,309 42, ,085,499 43, , % 2,382,309 48, ,385,499 50, , % *After 20% Exemption Impact Tax Change Impact on the Real Estate Market The Assessors Office is in contact with appraisers, developers and real estate agents on a regular basis. Of major concern is the deterioration of Sudbury market prices, lower demand for high-end construction and property taxes. Residential property taxes do in fact, influence property sales in Sudbury. The Assessor s Office staff has experienced an increase in the number of inquiries on Updated for 2011 Page 32
37 the subject of escalating property taxes in light of the current economic situation. The inquiries are concerning as many high end properties as lower end ones. Some consumers (potential purchasers as well as recent buyers) express their reluctance about relocating to Sudbury solely on the basis of high property taxes. While there may be good deals to be had in the real estate market in terms of short sales, foreclosures and the like, they do not accurately depict the Fair Market property values. Foreclosures and short sales are not eligible to be used in our property valuation sales analysis. Developers have had to sit on their high end inventory, and in numerous instances were compelled to dramatically reduce their asking prices. Sudbury saw a dramatic decrease in high end residential sale activity from 2009 on. High end properties having experienced the down market would be facing significant tax increases resulting in the implementation of a Residential Exemption. With the current economy, the impact of the exemption at this time could be another deterrent for purchasing high-end construction in Sudbury. Updated for 2011 Page 33
38 V. CURRENT SENIOR EXEMPTION AND DEFERRALS Currently seniors over the age of 60 receiving tax relief make up roughly 5% of the test population. There are programs for the legally blind, disabled veterans, surviving spouses, as well as income /asset based programs. Many of the applicants receiving personal exemption relief under Chapter 59 5 also qualify for and receive community surcharge relief. An additional group of seniors participate in the Town Senior Work Program. The Town of Sudbury last year granted $159,000 in tax relief under Chapter 59 5 exemption programs. Additionally $37,000 in Community Preservation funds were processed as exemptions. Tax relief from the deferral program is not included in the $159,000 figure. Deferred taxes are not exempt and are subject to payback with interest. The Town has seen a renewed interest in its popular Senior Tax Deferral Program. With the enactment of two home rule petitions, which provide less restrictive qualifications, there has been a significant increase in deferral accounts. In fiscal year 2003, the town held deferral on twelve (12) tax bills. These broader requirements have been in effect since fiscal Fiscal Year 2011 resulted in 74 Senior Tax Deferral applications. The table and graph on the following page illustrate actual FY 2011 exemption and deferral data. They detail the average of income to assessment for each program type and indicate the average age within each set. Actual assessments for each group range from the low of $214,000 to the high of $941,200. The ages shown range from 61 to 96 for this senior population. Note the program type identified as Senior Exemption requires applicants to be at least 65 years of age and of restricted financial means. Updated for 2011 Page 34


39 Type Count Average Assessed Value Average Income Average Age Average Household Size Senior Blind 1 311,800 40, Senior C P F Surcharge ,965 45, Senior Deferral ,591 36, Senior Disabled Veteran ,957 46, Senior Exemption ,125 24, Surviving Spouse or Senior 5 464,980 49, $500,000 Fiscal Year 2011 Means Reported Senior Exemptions and Tax Deferral Program Types $450,000 $400,000 $350,000 $300,000 $250,000 $200,000 Average Assessed Value Average Income $150,000 $100,000 $50,000 $0 Updated for 2011 Page 35
40 The average household size seniors receiving assistance: 1.55 The average age for exemption/deferral seniors: 78 The average income level is $40,031. While averages provide meaningful statistics, it must also be considered that approximately 3.2% of our need based applicants live in homes assessed over the break-even valuation. Consequently, if the 20% exemption were to be adopted, their tax liability would be significantly greater. Tax Impact on Exemption Recipients Fiscal Year 2011 Value/ Tax Basis Parcels with Other Tax Relief Actual Value Actual Tax Value following 20% Exemption Res Exempt Tax Non Qualifying Tax RES Qualifying Difference Non Qualifying Tax Increase , ,000 3, ,309 1, , (1,726.33) ,000 4, ,309 2, , (1,557.49) ,000 5, ,309 3, , (1,388.66) 1, ,000 5, ,309 4, , (1,219.82) 1, ,000 6, ,309 5, , (1,050.98) 1, ,000 7, ,309 6, , (882.14) 1, ,000 8, ,309 7, , (713.30) 1, ,000 9, ,309 8, , (544.46) 1, ,000 10, ,309 9, , (375.62) 2, Average Single Family Value 9 628,000 10, ,309 10, , (281.07) 2, ,000 11, ,309 10, , (206.78) 2, ,000 11, ,309 11, , (37.94) 2, Breakeven Point 711,200 12, ,509 12, , (0.13) 2, ,300 12, ,609 12, , , ,000 12, ,309 12, , , ,000 13, ,309 13, , , ,000 15, ,309 15, , , ,000,000 17, ,309 18, , , ,200,000 20, ,082,309 22, , , , Updated for 2011 Page 36
41 Minimum Tax and Assessments The majority of personal exemptions that qualifying applicants currently receive should not be greatly impacted with the adoption of the property exemption. That is with one exception; properties valued at the very low end of the assessment spectrum. Chapter 59 5C (Residential Exemption) allows for the exemption to be in addition to other exemptions allowable under section five; provided, however, that in no instance shall the taxable valuation of such property after all applicable exemptions be reduced below ten percent of its full and fair cash valuation. The following table identifies the minimum assessment required to generate a tax of at least ten percent of the total due when a 20% residential exemption is applied. Beyond the minimum tax of $266.85, where the personal exemption could not be utilized, some portion would be lost until the total adjusted tax supported minimum due and personal exemption granted. Minimum Assessment/Tax Minimum Actual Assessment/Tax Residential Exemption Value/Tax 10% Minimum (Adjusted) Assessment/Tax 130,767 2, ,691 2, , The full assessment must be at least 11.1% greater than the exemption amount Personal Exemption Tax Loss To Realize Full Value of All Minimum Tax Exemptions Before Minimum Minimum Personal Personal Personal Tax Tax Actual AV Exemption Exmption Exemption Required Required None ,767 Veteran ,369 Blind ,269 Senior , , ,771 It should be noted that as the required tax increases to allow for a personal exemption, so must the assessment upon which it is raised. Thus a higher value results in a higher minimum tax due. Updated for 2011 Page 37
42 Municipal Relief Act of 2010 Chapter 188 of the Acts of 2010 provides local options to Chapter 59, Section 5 which cities and towns may adopt. Many of the changes provide additional relief to the current allowances available under, Also, there is a provision to increase the maximum benefit under the current Senior Work program Chapter In addition, there are two new exemptions. Clause 56 allows assessors to exempt up to 100 percent of the real and personal property taxes assessed to Massachusetts national guardsmen and reservists for any fiscal year they are deployed overseas Clause 57 allows assessors to grant exemptions to seniors who qualify for the state circuit breaker income tax credit for their domicile. Exemptions would be up to the amount of the credit, but are subject to annual appropriation. This is an interesting option, which the Town of Wayland adopted via home rule petition in The Town of Wayland averages approximately 150 circuit breaker applications for exemption annually. The State does not provide reimbursement for any of the local options. While all the available options have great merit and will benefit certain segments of the population, the cost of adoption will be funded solely by the community Circuit Breaker Homeowners and renters age 65 and older who met income requirements and the assessment cap of $793,000 were eligible for a tax credit up to $930. The State provided a credit to those whose property tax exceeded 10% of their 2009 gross income. It is important to note however; this benefit may be jeopardized by the adoption of a residential exemption. An otherwise qualifying senior whose tax bill is reduced through the RES Exemption may no longer meet the 10% income criteria. Applying Wayland s statistics, at least 150 senior households would fit into this category. Calculating 150 (homes) times $930 shifts $139,500 from the State coffers to Sudbury s local citizenry. Impact on the Community Preservation Program: The CPA fund allocations should not vary dramatically in terms of total collections. What will change however, are the surcharge amounts applied to individual tax bills. The qualifying Class I properties will initially receive the valuation reduction allowable pursuant to the Residential Exemption, in addition to the automatic $100,000 CPF exemption. The end result being a lessened surcharge on the lower end properties, and a heightened surcharge on the higher end as well as nonqualifying properties. Updated for 2011 Page 38
43 Local Tax Initiatives Circuit Breaker Tax Credit In 1997, the Senior Tax Relief Committee was formed. Their studies had shown a disproportionate share of income went to property taxes, as seniors aged. They also considered the constraints of Proposition 2.5 and recognized that the cost of proposing local legislation would be born by the town. The goal of this committee was twofold: 1) provide relief to seniors of low and moderate income when property taxes exceeded ten percent of their income; 2) for the State to fund the program. This task force spearheaded the circuit breaker tax legislation, when it enlisted the aid of Councils on Aging to bus their seniors, enmasse, to the State House. With baskets of petitions and letters in hand, they asked their Legislators to support its passage. Senator Birmingham drafted the bill as proposed by Sudbury s committee and it was passed into law. PTERC In 2002, the Annual Town Meeting further addressed preferential tax treatment for seniors. Article 54, was a home rule petition which targeted seniors age 60 and older to receive a residential exemption. At the State level, the bill never left Local Ways and Means. Along with other concerns, there was no means test to determine need. Neither the Board of Selectmen nor the Board of Assessors favored the petition as written. Selectmen, in turn, established a committee to research of local taxation on seniors. Known as PTERC, the Property Tax Equity Review Committee performed a comprehensive study of the subject. In its findings, the report stated, PTERC has voted to recommend that the Selectmen NOT adopt the residential exemption. Sudbury should consider other measures that more precisely target the relief to those in need. 3 Special Acts Once again, Sudbury s common sense approach to taxation became the model for amendments to Chapter 59, 5, clause 41A Deferrals. Through its home rule petition, Chapter 320 of the Acts of 2002 allowed preferential qualifications for the Town s senior tax deferral program. It reduced the age requirement from 65 to 60; the interest rate from 8% to an annual amount not to exceed 8% and increased the income allowance from $40,000 to 60,000. The State has modeled its new local options on Sudbury s Special Act. With the creation of the Sudbury Tax Deferral Committee, an amendment to Chapter 320 of the Acts of 2002 was brought to the State. An important change allowed Sudbury to use the same incomes as those established in Circuit Breaker bill. Applicants can now rely on income limits to match those established for 3 Report to the selectmen from the Property Tax Equity Review Committee, December 11, 2003; Attachment E-Page 1; Para; 1. Updated for 2011 Page 39
44 qualifying married couples filing jointly according to the Circuit Breaker Income Tax Credit Program. The increased income levels per Chapter 458 of the Acts of 2008 have provided eligibility to a significantly larger senior base. Senior Property Tax Exemption At a Special Town Meeting held in January, 2011, Sudbury approved Article 2, which is a Home Rule Petition structured similar to one implemented in Hamilton, Massachusetts. It would provide a reduction in assessment for certain seniors over the age of sixty, whose primary residence is in Sudbury. The reduction would be calculated in a similar manner as the Residential Exemption, but is limited to approximately 200 applicants. The bill is currently numbered H3435 and assigned to the Joint Committee on Revenue (see Appendix G). At this time there has been at least one hearing by the committee. Updated for 2011 Page 40
45 VI. COMMUNITY PROFILES Fiscal Year 2011 Average Single Family Tax Bills Neighboring Communities Note: Community Fiscal 2011Tax Sudbury $10,695 Hudson $4,280 * Marlborough $4,224 * Framingham $5,197 * Maynard $5,517 * Natick $5,561 Stow $7,310 * Needham $7,719 Acton $9,049 Concord $11,074 * Wellesley $11,281 Wayland $11,471 * Lincoln $12,378 * Sherborn $13,119 Weston $15,835 State Average $4,537 *Located as a Direct Abutter to Sudbury Sudbury s average tax ranks between the averages in Acton and Concord. It rates the ninth highest in the State. Sudbury Profile The Commonwealth of Mass. Division of Local Services periodically publishes a profile of each community in the Commonwealth. Included herewith is the latest At a Glance Report for Sudbury. The report provides useful demographic information. We have included a map of Sudbury s abutting communities illustrating FY2011 average single family tax bills. There is no average single family tax bill information available for the 13 residential exemption communities. The Division of Local Services does not collect enough information to calculate an average singlefamily tax bill for those municipalities. Updated for 2011 Page 41

46 Updated for 2011 Page 42

47 Updated for 2011 Page 43

48 Updated for 2011 Page 44

49 Fiscal Year 2011 Average Single Family Tax Bills for Abutting Communities $11,074 $5,517 $7,310 $12,378 $4,210 Sudbury $10,695 $11,471 $4,280 $5,197 Updated for 2011 Page 45
50 Community Comments Assessor Offices from surrounding communities were asked why their towns did not adopt the exemption. Bedford cited administration issues and tax inequity. Acton spoke of the difficulty of redistributing taxes from recipients if the town changes its position. Concord struggles with this issue at their Classification Hearings, but consider it a blunt instrument for reducing tax burdens. All respondents commented that their community did not fit the profile for which the legislation was intended. Communities with a Residential Exemption Program in place were also contacted for the overall effect and impact of the Program. The towns of Barnstable and Tisbury responded. Excerpts from their observations are incorporated in the Administrative Considerations section of the report. Cities and Towns with the Residential Exemption Thirteen out of 351 Massachusetts Communities have a Residential Exemption Program in place. Sudbury s demographic profile differs from the community types currently utilizing the adoption. Cities and seasonal or resort communities characterize the areas currently employing a Residential Exemption Program. The majority of Sudbury s Class I (residential) properties are owner occupied homes; thus, a very limited inventory of non-owner occupied homes on which to shift the tax burden. The Town of Tisbury has many seasonal homes, and a small proportion of year round residents; therefore the exemption in this community shifts the burden to the seasonal properties The Town of Somerset has two power plants, which basically support the tax base. The exemption is used to further lower property taxes for those living in the community with the plants. The cities having adopted the exemption have a large number of apartments. The tax increase on the apartment buildings offset the taxes on the fewer single family homes. The Town of Weymouth and the city of Marlborough are the only municipalities to date which have made the decision to adopt the exemption and then reverse it a few years later. In Weymouth, the Program was in place from 1982 to It was a difficult undertaking to reverse it. Once the tax shift is in place there is an assumption (dependence) on maintaining or not significantly changing it. Updated for 2011 Page 46
51 The City of Marlborough did not vote a residential exemption in fiscal For many years they have incrementally reduced the percentage from a high of 13%. In fiscal 2010 the exemption was down to 3%. By fiscal 2011, the Mayor decided it was time to end the program. According to Daniel Brogie, Senior Assessor in Marlborough, they decided against the exemption as a matter of fairness. Contrary to what many in his community thought, the exemption was not simply a reduction taxes; it was a redistribution of the tax burden from one citizen to another. The city has no intention of adopting the exemption again. Nantucket utilizes an open space tax rate, as well as a CIP rate and residential rate. Somerset has adopted a 10% small commercial exemption in addition the RES exemption. Updated for 2011 Page 47
52 Comparison of Sudbury to the 13* Residential Exemption Communities Municipality FY11 Total Value Residential & Open Space % of Total Value CIP % of Total Value Residential Factor Selected CIP Shift RES Exemption Granted SUDBURY 3,874,281, % SOMERSET 2,422,775, % BARNSTABLE 12,987,343, % BROOKLINE 14,926,437, % CHELSEA 2,101,605, % EVERETT 3,276,697, % MALDEN 4,794,940, % NANTUCKET 17,208,429, % TISBURY 2,558,966, % WALTHAM 8,392,975, % WATERTOWN 4,893,342, % BOSTON 86,800,582, % CAMBRIDGE 24,162,077, % SOMERVILLE 8,297,876, % *Note: Change from last year s report - Marlborough previously used the Exemption but phased it out by FY11 (see discussion on previous page). The map on the following page shows the location of the Residential Exemption Communities relative to Sudbury. Updated for 2011 Page 48
53 13 Residential Exemption Communities and Sudbury Updated for 2011 Page 49
54 Census 2000 Demographic Profile Highlights SUDBURY General Characteristics Number Percent U.S. Total population 16,845 Male 8, % Female 8, % Median age 38.8 (X) 35.3 Under 5 years 1, % 18 years and over 11, % 65 years and over 1, % Household population 16, % Group quarters population % Average household size 3.02 (X) 2.59 Average family size 3.28 (X) 3.14 Total housing units 5,591 Occupied housing units 5, % Owner-occupied housing units 5, % Renter-occupied housing units % Vacant housing units % Population 25 years and over 10,824 High school graduate or higher 10, % Disability status (population 5 years and over) 1, % Median household income in 1999 (dollars) (X) Families below poverty level % Individuals below poverty level % Single-family owner-occupied homes 4,813 Median value (dollars) 422,400 (X) 119,600 Updated for 2011 Page 50
55 Comparative Demographics Median / Average Demographics By Community Type Residential Exemption Coastal Communities Characteristics Median Average Sudbury Actual Average Median Residential Exemption Cities Characteristics Total population 18,234 10,995 16,845 56, ,301 Total population Male 8,635 5,197 8,225 26,477 52,201 Male Female 9,599 5,798 8,620 29,625 56,100 Female Median age Median age Under 5 years ,489 2,812 5,756 Under 5 years 18 years and over 14,516 8,732 11,367 46,353 88, years and over 65 years and over 3,835 2,254 1,653 7,442 12, years and over Household Population 17,952 10,798 16,651 54, ,985 Household Population Group quarters population ,316 6,316 Group quarters population Average household size Average household size Average family size Average family size Total housing units 7,143 4,932 5,591 23,757 46,122 Total housing units Occupied housing units 6,987 4,317 5,505 23,108 44,196 Occupied housing units Owner-occupied housing units 5,723 3,392 5,077 9,809 15,842 Owner-occupied housing units Renter-occupied housing units 1, ,789 28,354 Renter-occupied housing units Vacant housing units 1,074 1, ,926 Vacant housing units Population 25 years and over 13,345 8,034 10,824 40,242 71,793 Population 25 years and over High school graduate or higher Disability status (population 5 years and over) 10,144 6,284 10,426 33,962 58,541 3,168 1,949 1,503 9,751 20,681 High school graduate or higher Disability status (population 5 years and over) Median household income 45,933 41, ,579 47,147 48,776 Median household income Families below poverty level ,587 Families below poverty level Individuals below poverty level Single-family owner-occupied homes ,148 16,070 5,309 3,121 4,813 4,434 7,090 Individuals below poverty level Single-family owner-occupied homes Median value (dollars) 178, , , , ,450 Median value (dollars) Updated for 2011 Page 51
56 Census 2000 Demographic Profile Highlights CAMBRIDGE General Characteristics Number Percent Total population 101,355 Male 49, Female 51, Median age 30.4 (X) Under 5 years 4, years and over 87, years and over 9, Household population 86, Group quarters population 14, Average household size 2.03 (X) Average family size 2.83 (X) Total housing units 44,725 Occupied housing units 42, Owner-occupied housing units 13, Renter-occupied housing units 28, Vacant housing units 2, Population 25 years and over 66,315 High school graduate or higher 59, Disability status (population 5 years and over) 13, Median household income in 1999 (dollars) (X) Families below poverty level 1, Individuals below poverty level 11, Single-family owner-occupied homes 4,453 Median value (dollars) 398,500 (X) Updated for 2011 Page 52
57 Census 2000 Demographic Profile Highlights EVERETT General Characteristics Number Percent Total population Male Female Median age 35.6 (X) Under 5 years years and over years and over Household population Group quarters population Average household size 2.45 (X) Average family size 3.11 (X) Total housing units Occupied housing units Owner-occupied housing units Renter-occupied housing units Vacant housing units Population 25 years and over High school graduate or higher Disability status (population 5 years and over) Median household income in 1999 (dollars) (X) Families below poverty level Individuals below poverty level Single-family owner-occupied homes 2812 Median value (dollars) (X) Updated for 2011 Page 53
58 Census 2000 Demographic Profile Highlights BOSTON General Characteristics Number Percent Total population 589,141 Male 283, Female 305, Median age 31.1 (X) Under 5 years 32, years and over 472, years and over 61, Household population 554, Group quarters population 35,077 6 Average household size 2.31 (X) Average family size 3.17 (X) Total housing units 251,935 Occupied housing units 239, Owner-occupied housing units 77, Renter-occupied housing units 162, Vacant housing units 12, Population 25 years and over 377,574 High school graduate or higher 297, Disability status (population 5 years and over) 120, Median household income in 1999 (dollars) (X) Families below poverty level 17, Individuals below poverty level 109, Single-family owner-occupied homes 30,467 Median value (dollars) 190,600 (X) Updated for 2011 Page 54
59 Census 2000 Demographic Profile Highlights CHELSEA General Characteristics Total population 35,080 Number Percent Male 17, Female 17, Median age 31.3 (X) Under 5 years 2, years and over 25, years and over 3, Household population 34, Group quarters population Average household size 2.87 (X) Average family size 3.5 (X) Total housing units 12,337 Occupied housing units 11, Owner-occupied housing units 3, Renter-occupied housing units 8, Vacant housing units Population 25 years and over 21,597 High school graduate or higher 12, Disability status (population 5 years and over) 9, Median household income in 1999 (dollars) (X) Families below poverty level 1, Individuals below poverty level 7, Single-family owner-occupied homes 1,057 Median value (dollars) 149,200 (X) Updated for 2011 Page 55
60 Census 2000 Demographic Profile Highlights WATERTOWN General Characteristics Total population 32,986 Number Percent Male 15, Female 17, Median age 36.7 (X) Under 5 years 1, years and over 28, years and over 5, Household population 31, Group quarters population 1, Average household size 2.17 (X) Average family size 2.86 (X) Total housing units 15,008 Occupied housing units 14, Owner-occupied housing units 6, Renter-occupied housing units 7, Vacant housing units Population 25 years and over 25,300 High school graduate or higher 22, Disability status (population 5 years and over) 5, Median household income in 1999 (dollars) (X) Families below poverty level Individuals below poverty level 2, Single-family owner-occupied homes 3,268 Median value (dollars) 270,600 (X) Updated for 2011 Page 56
61 Census 2000 Demographic Profile Highlights SOMERVILLE General Characteristics Total population 77,478 Number Percent Male 37, Female 39, Median age 31.1 (X) Under 5 years 3, years and over 65, years and over 8, Household population 74, Group quarters population 2, Average household size 2.38 (X) Average family size 3.06 (X) Total housing units 32,477 Occupied housing units 31, Owner-occupied housing units 9, Renter-occupied housing units 21, Vacant housing units Population 25 years and over 53,693 High school graduate or higher 43, Disability status (population 5 years and over) 14, Median household income in 1999 (dollars) (X) Families below poverty level 1, Individuals below poverty level 9, Single-family owner-occupied homes 2,712 Median value (dollars) 214,100 (X) Updated for 2011 Page 57
62 Census 2000 Demographic Profile Highlights TISBURY General Characteristics Total population 3,755 Number Percent Male 1, Female 1, Median age 42 (X) Under 5 years years and over 2, years and over Household population 3, Group quarters population Average household size 2.21 (X) Average family size 2.92 (X) Total housing units 2,720 Occupied housing units 1, Owner-occupied housing units 1, Renter-occupied housing units Vacant housing units 1, Population 25 years and over 2,723 High school graduate or higher 2, Disability status (population 5 years and over) Median household income in 1999 (dollars) (X) Families below poverty level Individuals below poverty level Single-family owner-occupied homes 933 Median value (dollars) 278,900 (X) Updated for 2011 Page 58
63 Census 2000 Demographic Profile Highlights BARNSTABLE General Characteristics Total population 222,230 Number Percent Male 105, Female 117, Median age 44.6 (X) Under 5 years 10, years and over 176, years and over 51, Household population 216, Group quarters population 5, Average household size 2.28 (X) Average family size 2.82 (X) Total housing units 147,083 Occupied housing units 94, Owner-occupied housing units 73, Renter-occupied housing units 21, Vacant housing units 52, Population 25 years and over 165,115 High school graduate or higher 151, Disability status (population 5 years and over) 42, Median household income in 1999 (dollars) (X) Families below poverty level 2, Individuals below poverty level 15, Single-family owner-occupied homes 67,021 Median value (dollars) 178,800 (X) Updated for 2011 Page 59
64 Census 2000 Demographic Profile Highlights BROOKLINE General Characteristics Total population 57,107 Number Percent Male 25, Female 31, Median age 34.5 (X) Under 5 years 2, years and over 47, years and over 7, Household population 55, Group quarters population 1, Average household size 2.18 (X) Average family size 2.86 (X) Total housing units 26,413 Occupied housing units 25, Owner-occupied housing units 11, Renter-occupied housing units 14, Vacant housing units Population 25 years and over 41,060 High school graduate or higher 39, Disability status (population 5 years and over) 7, Median household income in 1999 (dollars) (X) Families below poverty level Individuals below poverty level 5, Single-family owner-occupied homes 4,414 Median value (dollars) 599,500 (X) Updated for 2011 Page 60
65 Census 2000 Demographic Profile Highlights WALTHAM General Characteristics Total population 59,226 Number Percent Male 29, Female 30, Median age 34.2 (X) Under 5 years 2, years and over 50, years and over 7, Household population 53, Group quarters population 5, Average household size 2.29 (X) Average family size 3.01 (X) Total housing units 23,880 Occupied housing units 23, Owner-occupied housing units 10, Renter-occupied housing units 12, Vacant housing units Population 25 years and over 39,912 High school graduate or higher 34, Disability status (population 5 years and over) 9, Median household income in 1999 (dollars) (X) Families below poverty level Individuals below poverty level 3,752 7 Single-family owner-occupied homes 8,695 Median value (dollars) 250,800 (X) Updated for 2011 Page 61
66 Census 2000 Demographic Profile Highlights MALDEN General Characteristics Total population 56,340 Number Percent Male 27, Female 29, Median age 35.7 (X) Under 5 years 3, years and over 45, years and over 7, Household population 55, Group quarters population Average household size 2.42 (X) Average family size 3.13 (X) Total housing units 23,634 Occupied housing units 23, Owner-occupied housing units 9, Renter-occupied housing units 13, Vacant housing units Population 25 years and over 40,572 High school graduate or higher 33, Disability status (population 5 years and over) 11, Median household income in 1999 (dollars) (X) Families below poverty level Individuals below poverty level 5, Single-family owner-occupied homes 5,991 Median value (dollars) 176,100 (X) Updated for 2011 Page 62
67 Census 2000 Demographic Profile Highlights SOMERSET General Characteristics Total population 18,234 Number Percent Male 8, Female 9, Median age 43 (X) Under 5 years years and over 14, years and over 3, Household population 17, Group quarters population Average household size 2.57 (X) Average family size 2.98 (X) Total housing units 7,143 Occupied housing units 6, Owner-occupied housing units 5, Renter-occupied housing units 1, Vacant housing units Population 25 years and over 13,345 High school graduate or higher 10, Disability status (population 5 years and over) 3, Median household income in 1999 (dollars) (X) Families below poverty level Individuals below poverty level Single-family owner-occupied homes 5,309 Median value (dollars) 144,800 (X) Updated for 2011 Page 63
68 Census 2000 Demographic Profile Highlights NANTUCKET General Characteristics Total population 9,520 Number Percent Male 4, Female 4, Median age (years) 36.7 (X) Under 5 years years and over 7, years and over 1, Household population 8, Group quarters population Average household size 2.37 (X) Average family size 2.9 (X) Total housing units 9,210 Occupied housing units 3, Owner-occupied housing units 2, Renter-occupied housing units 1, Vacant housing units 5, Population 25 years and over 6,976 High school graduate or higher Disability status (population 5 years and over) 10 Median household income in 1999 (dollars) 55,522 (X) Families below poverty level (X) Individuals below poverty level Single-family owner-occupied homes 2,041 Median value (dollars) 577,500 (X) Updated for 2011 Page 64
69 VII. ADMINISTRATION Determining the logistics and educating the public on the change in equity of the new program will be time consuming. The intensive review the first year will incur additional costs to personnel in order to complete the preliminary qualification process. As the assessors serve as the gatekeepers for all exemptions, determining eligibility including a review of tax return data, examining trust documents etc. all contribute to the administrative burden which falls solely on the Assessor s Office. Ideally the cost of the Program should simply be a matter of redistributing the burden within the Class I properties. However, in anticipation of numerous appeals from property owners whose application for exemption was denied, or those simply appealing the increased tax resulting from the adoption; sufficient funds must be set aside for overlay. The overlay amounts are certified by the State and must be adequate to meet the anticipated demand. Comments from Barnstable and Tisbury Inserted herewith are excerpts from the Towns of Barnstable and Tisbury commenting on the impact and implementation of their Exemption Programs. Barnstable: The biggest procedural problem with this is that, like all exemptions, taxpayers have until 90 days after the actual tax bill is mailed to apply for the exemption. Since you have already done your recap and set your tax rate, any significant number of new applications can have a real negative impact on your overlay balance and you want to avoid this at all costs. The administrative impact on my office has been quite large. Having been given no additional staffing to handle it, it becomes another exemption to administer but this exemption has FAR more applicants than all the other exemptions put together. To put it in perspective, we had 678 total exemptions in FY10 for veterans, elderly, etc. The total number of residential exemptions in the same year was 14,905. Now, once you get a stable inventory of qualifications, it becomes a matter of coding and following them when they sell or change title after the first of the year, every year, but until you do, your foot and phone traffic will double or triple. Since they only have to qualify once, longer-range maintenance isn't too onerous. We, like Boston, require that they submit the front page of their prior year federal or state tax return (with social security numbers and dollar amounts blacked out, if they wish) along with the application. We've encountered numerous issues like having a P.O. Box list on the return or that they do not file a return at all, that require procedural Updated for 2011 Page 65
70 standards to be set by the Board of Assessors. Your biggest challenge will be qualification of taxpayers in a timely manner and, before I go into any other detail about the exemption, I will stress that if your Board of Selectmen decides to vote it in, BE ABSOLUTELY FIRM that it not be in effect until the following fiscal year. You will need at least a year to feel comfortable that you have a reasonable number of the potentially qualified properties on record. Tisbury: The application process is very time consuming. The biggest issue is trying to get applicants to get all documentation submitted. Second problem is determining eligibility for properties held in trust. Also if someone should sell and buy within the same town that the new parcel will not benefit from the exemption until after the eligibility date. Another issue is where we are a resort community we have non-residents that will change their domicile for the one year receive the exemption and go back to being domiciled somewhere else. Also have to check other real estate owned to see if they are benefiting from another exemption somewhere else. 4 4 Please see Appendix E letter from Brookline Assessors Updated for 2011 Page 66


71 VIII. CONSEQUENCES Previous areas of the report have cautioned that the exemption will provide a benefit to a number of property owners, while at the same time acting as a detriment to a different group of property owners. This segment will take a closer look at both the positive and the negative consequences. With a residential exemption the tax consequences on any individual property will depend on its position in one of three groups as follows: Group Eligible Properties with Assessed Values below the Breakeven Point Eligible Properties with Assessed Values above the Breakeven Point All Non-Qualifying Properties Tax Impact Tax Decrease Tax Increase Tax Increase The chart below shows the number of properties in each group for Fiscal Year FY 2011 Residential Property Counts 1,399 1,056 3,662 Eligible Properties Below Breakeven Eligible Properties Above Breakeven Non Qualifying Properties Based on the initial assumptions made in terms of eligibility as identified in Qualification & Eligibility, the following table projects the average FY 2011 tax decreases within specific valuation ranges for a 20% Residential Exemption. Updated for 2011 Page 67
72 Tax Decrease Table COUNT AVERAGE TAX DECREASE FY 2011 ASSESSMENT RANGE 16 $1, Up to $200, $1, $200,000 to $300, $1, $300,000 to $400,000 1,113 $ $400,000 to $500, $ $500,000 to $600, $ $600,000 to $700, $17.18 $700,000 to $711,200 3,662 Total Eligible Properties Below Breakeven In general, most owners who meet the prerequisites of the exemption will qualify for some relief; provided the assessed value is below the breakeven point. Many senior households with at least one eligible resident over the age of 60 will benefit. The average assessed value for such households is just $545,117. Equity Issues The exemption does not regard income, or the ability to pay The exemption does not distinguish between age groups It does not guarantee that a senior will pay less property taxes The exemption does not differentiate between excess users of Town services and infrastructure Citizen Costs The program does not distinguish between citizens with and without school age children. The Town will not have the ability to ensure that all seniors will benefit from the program s adoption. All nonresident home owners regardless of assessment will see tax increases. Updated for 2011 Page 68
73 Residential homeowners whose property title is held in certain Trusts will pay higher taxes. Other residential property owners including 437 vacant land owners will also likely see increased tax bills. Renters as a group are more likely to be in need of relief from property tax increases which would be passed on through higher rents 5. Non qualifying property types will see up to a 20% increase in their tax. Non-qualifying owners with limited income, sudden illness, job layoffs could see this financial stressor as the breaking point for remaining in their Sudbury home 17% of the Class I properties may not qualify. They will pay based on the original assessed value (non- exempt value), at the increased tax rate. The average assessed value for the group is $437,605, which will amount to an average increase of $1, in tax dollars. Of the remaining 83% likely to qualify, those above the break-even point include some of the seniors who receive income-based exemptions and deferrals. Redistribution of the Tax Real estate demand, housing and location preferences continually ebb and flow. These trends are mimicked in the annual property assessments. While the voted percent may be a constant each year, its adoption cannot guarantee a reduced tax bill for properties for which the assessments have moved above the breakeven point. Annual votes on the percentage of Exemption can fluctuate. Tax payers will have difficulty budgeting their property taxes Taxes held in escrow will see tremendous variations if the annual percent changes or assessment goes above the breakeven. Some owners may not be able to manage the mortgage swings, when the percentage or their assessment fluctuates or a future Board opts out of the program. Adopting the exemption can only be implemented after issuance of the preliminary tax bills. Therefore, a property owner whose tax assessment is above the breakeven point or does not qualify will see a substantially higher tax bill for the tax year that the program is voted. 5 According to United States Census Bureau data from the 2000 Census, the number of owner occupied housing units in Massachusetts exceeds the number of renter occupied housing units (1,508,248 and 935,332, respectively). However, the number of occupants below the poverty level living in rental units(186,552) far exceeds the number in owner occupied housing (54,345). To that extent that the tax burden on renters is increased by local adoption of the residential exemption. Important to note: renters are not eligible for personal exemption relief, such as blind, veterans, etc. Updated for 2011 Page 69
74 CONCLUSION For many years Sudbury town fathers tried to reverse the effect of split tax rates between CIP and RES properties. The tax shift works best with a large CIP base because it can absorb a significant amount of the levy. Sudbury relies on a very small commercial tax base to provide tax relief to its residential sector, when the preferred outcome has been minimal, at best. With a sometimes erratic real estate market it has become even more difficult to rely on CIP to offset the residential tax burden. In recent years, Sudbury Boards of Selectmen settled for equalizing levy increases to each of the classes as a best effort to un-ring the bell. When a community does not fit the profile for the category of tax relief, the residential exemption is a blunt instrument for attaining that purpose. As the reliance on the property tax to fund town services has grown, residents of modest means are finding it difficult to meet their tax demands and remain in Sudbury. Options to adjust the property tax burden are limited. The state defines the ways which we may adjust the impact of the property tax, and we have implemented many of these programs. Considering the current economic climate, it is important to recognize that not only are low and moderate income seniors struggling with their property tax burden, many non-seniors are feeling the financial pinch as well. There is continued evidence of overburdened younger property owners who purchased at the peak of the real estate boom. They too are finding it difficult. Short sales and foreclosures are occurring among the younger population and the higher end real estate market. For generations Town Fathers have been concerned with property tax equity. There is no right answer or simple solution when it comes to the issue of tax equity for all. A decision to adopt will have long term consequences for every citizen of Sudbury. Updated for 2011 Page 70

75 APPENDIX A Updated for 2011 Page 71


76 APPENDIX B Updated for 2011 Page 72

77 APPENDIX C Updated for 2011 Page 73

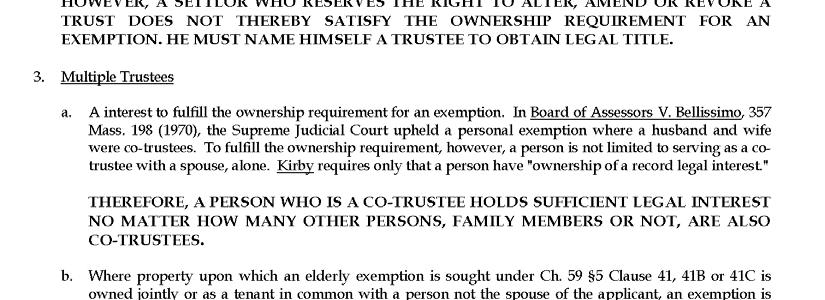
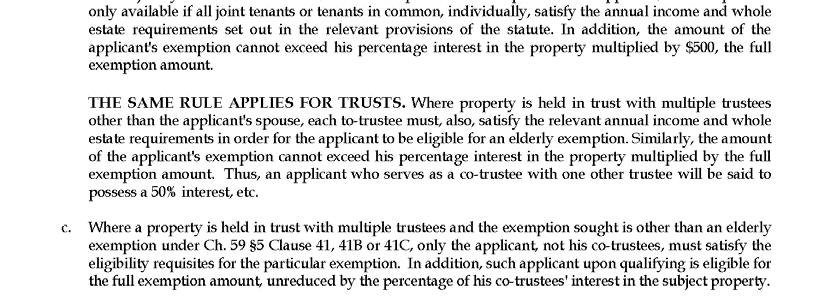
78 Updated for 2011 Page 74

79 Updated for 2011 Page 75

80 Updated for 2011 Page 76

81 Appendix D Updated for 2011 Page 77
82 Appendix E Updated for 2011 Page 78
83 Updated for 2011 Page 79


84 Appendix F Updated for 2011 Page 80
October 1, To The Honorable, the City Council:
 To The Honorable, the City Council: October 1, 2018 The establishment of the FY19 property tax rate by the Board of Assessors, subject to the approval of the Massachusetts Department of Revenue, is the
INFORMATION FOR THE MIDDLEBOROUGH TAXPAYER
 INFORMATION FOR THE MIDDLEBOROUGH TAXPAYER The Board of Assessors Anthony Freitas, Chairman Paula Burdick Frederick Eayrs and Barbara Erickson, M.A.A. Assessor/Appraiser Town of Middleborough Assessors
RE: TAX LEVY INFORMATION
 Board Member: October 14, 2010 RE: TAX LEVY INFORMATION Cook County Multiplier/Level of Assessments Over the past year, a fundamental change in the property tax assessment process for Cook County was enacted
A SHORT AND SIMPLE GLIMPSE AT THE PROPERTY TAX IN NEW JERSEY
 A SHORT AND SIMPLE GLIMPSE AT THE PROPERTY TAX IN NEW JERSEY Look at this bill. How come my property taxes are so high? In order to answer that question, you need to consider all the factors that go into
DAVENPORT CITY AND SCOTT COUNTY ASSESSOR OFFICES DRAFT CONSOLIDATION PLAN
 DAVENPORT CITY AND SCOTT COUNTY ASSESSOR OFFICES DRAFT CONSOLIDATION PLAN REQUESTED BY DAVENPORT CITY CONFERENCE BOARD AUGUST 2013 Study Overview The Mayor of Davenport requested that a working group of
FREQUENTLY ASKED QUESTIONS ASSESSOR S OFFICE
 FREQUENTLY ASKED QUESTIONS ASSESSOR S OFFICE Q: What do Assessors do? A: Assessors are required by Massachusetts law to value all real and personal property within their community. They value every property,
AGENDA BACKGROUND. Date: August 6, AGENDA ITEM: Discuss and review the Budget for the Fiscal Year PRESENTER:
 1 2 AGENDA BACKGROUND AGENDA ITEM: Discuss and review the Budget for the Fiscal Year 2018-2019. Date: August 6, 2018 PRESENTER: Matt Fielder, City Manager BACKGROUND: The purpose of this item is to discuss
Property Taxation 101 Updated August 2016
 Property Taxation 101 This guide is intended to describe the basics of Minnesota s property tax system. This system collected just over $6.7 billion in 2016 to help fund the services of schools, counties,
Office of Legislative Services Background Report THE UNIFORMITY CLAUSE AND REAL PROPERTY ASSESSMENT
 Office of Legislative Services Background Report THE UNIFORMITY CLAUSE AND REAL PROPERTY ASSESSMENT OLS Background Report No. 25 Prepared By: Local Government Date Prepared: January 10, 2000 New Jersey
AGENDA BACKGROUND. Date: August 7, AGENDA ITEM: Discuss and review the Budget for the Fiscal Year PRESENTER:
 1 2 AGENDA BACKGROUND AGENDA ITEM: Discuss and review the Budget for the Fiscal Year 2017-2018. Date: August 7, 2017 PRESENTER: Matt Fielder, City Manager BACKGROUND: The purpose of this item is to discuss
Real Estate Tax Credit for Persons Age 65 and Older (known as the Circuit Breaker Credit)
") The Official Website of the Department of Revenue (DOR) Department of Revenue About DOR Home Individuals Filing and Payment Information Guide to Personal Income Tax Credits Real Estate Tax Credit for Persons
The Official Website of the Department of Revenue (DOR) Department of Revenue About DOR Home Individuals Filing and Payment Information Guide to Personal Income Tax Credits Real Estate Tax Credit for Persons
Property Tax System Overview. Prepared for the Property Tax Working Group
 Property Tax System Overview Prepared for the Property Tax Working Group Property Tax Research 9/27/2010 Introduction Property tax in Minnesota is an ad valorem tax. This means that property is taxed
ASSEMBLY, No STATE OF NEW JERSEY. 208th LEGISLATURE INTRODUCED DECEMBER 3, 1998
 ASSEMBLY, No. STATE OF NEW JERSEY 0th LEGISLATURE INTRODUCED DECEMBER, Sponsored by: Assemblyman DONALD K. TUCKER District (Essex and Union) Co-Sponsored by: Assemblymen Caraballo, Cohen, Doria, Assemblywoman
HOUSE... No The Commonwealth of Massachusetts. HOUSE OF REPRESENTATIVES, November 6, 2017.
 HOUSE....... No. 4001 The Commonwealth of Massachusetts HOUSE OF REPRESENTATIVES, November 6, 2017. The committee on Revenue to whom were referred the petition (accompanied by bill, Senate, No. 1506) of
Overview of Property Taxes
 Overview of Property Taxes A Presentation to the Property and Local Tax Division January 2015 by Steve Hinze Pat Dalton Nina Manzi Joel Michael and Katherine Schill Fiscal Analysis Department Minnesota
H 5209 S T A T E O F R H O D E I S L A N D
 LC000 0 -- H 0 S T A T E O F R H O D E I S L A N D IN GENERAL ASSEMBLY JANUARY SESSION, A.D. 0 A N A C T RELATING TO TAXATION - LEVY AND ASSESSMENT OF LOCAL TAXES Introduced By: Representative Michael
Swampscott Board of Selectman
 Swampscott Board of Selectman 1 Agenda 2 FY2018 REVALUATION RESULTS COMP. 2017 v. 2018 Property Type Description FY 2017 Parcel Count FY 2017 Assessed Value FY 2018 Parcel Count FY 2018 Assessed Value
Fiscal Year 2018 Tax Bill Classification & Exemptions A REVIEW OF THE FISCAL YEAR 2018 PROPERTY TAX LEVY
 Fiscal Year 2018 Tax Bill Classification & s A REVIEW OF THE FISCAL YEAR 2018 PROPERTY TAX LEVY SHIFTING OPTIONS NOVEMBER 1 6, 2017 2 Fiscal 2018 Maximum Allowable Levy The levy limit increased by any
Plainfield Community Consolidated School District #202 LOCAL PROPERTY TAX TOPICS, INFORMATION, AND THE 2016 TAX
 Plainfield Community Consolidated School District #202 LOCAL PROPERTY TAX TOPICS, INFORMATION, AND THE 2016 TAX LEVY 1 Table of Contents I. Overview of the Tax Levy and Extension Process II. Calculating
Office of Legislative Services Background Report The Senior Citizens' and Disabled Persons' Property Tax Deduction
 Office of Legislative Services Background Report The Senior Citizens' and Disabled Persons' Property Tax Deduction OLS Background Report No. 34 Prepared By: Local Government Date Prepared: New Jersey State
OVERVIEW MINNESOTA PROPERTY TAX SYSTEM AND SCHOOL DISTRICT LEVY PROCESS Payable 2006 Levy
 OVERVIEW OF MINNESOTA PROPERTY TAX SYSTEM AND SCHOOL DISTRICT LEVY PROCESS 2005 Payable 2006 Levy Division of Program Finance March 2006 TABLE OF CONTENTS Overview of the Minnesota Property Tax System...
DATE ISSUED: 3/17/ of 16 UPDATE 104 CCG(LEGAL)-P
-P") Table of Contents Section I: Maintenance Taxes... 2 Tax Rate Cap... 2 Appraisal Roll... 2 Disaster Area... 3 Meeting on Budget and Proposed Tax Rate... 3 Tax Rate... 4 Effective Tax Rate... 5 Maintenance
Table of Contents Section I: Maintenance Taxes... 2 Tax Rate Cap... 2 Appraisal Roll... 2 Disaster Area... 3 Meeting on Budget and Proposed Tax Rate... 3 Tax Rate... 4 Effective Tax Rate... 5 Maintenance
This article shall be subject to a referendum on petition pursuant to Section 24 of the Municipal Home Rule Law.
 Chapter 119 TAXATION [HISTORY: Adopted by the Town Board of the Town of Conklin as indicated in article histories. Amendments noted where applicable.] Assessment Review Board See Ch. 8. Assessor See Ch.
Executive Overview and Summary: The Economic Effects of the 7% Assessment Cap in Cook County
 Institute of Government and Public Affairs 815 W. Van Buren Street Suite 525 Chicago, Illinois 60607 Executive Overview and Summary: The Economic Effects of the 7% Assessment Cap in Cook County Richard
PROPERTY ASSESSMENT AND TAXATION
 AUTHORITY The City and Borough of Juneau s authorization to levy a property tax is provided under Alaska State Statute Section 29.45. Under this section, the State requires the Assessor to assess property
UNDERSTANDING YOUR PROPERTY TAXES. Presentation to Meadville City Council February 20, 2019
 UNDERSTANDING YOUR PROPERTY TAXES Presentation to Meadville City Council February 20, 2019 This is your home 2 Your view of your home 3 A buyer s view 4 A lender s view 5 An appraiser s view 6 A tax assessor
Report Date: March 7, 2018 Contact: Grace Cheng Contact No.: RTS No.: VanRIMS No.: Meeting Date: March 14, 2018
 ADMINISTRATIVE REPORT Report Date: March 7, 2018 Contact: Grace Cheng Contact No.: 604.871.6654 RTS No.: 12285 VanRIMS No.: 08-2000-20 Meeting Date: March 14, 2018 TO: FROM: SUBJECT: Standing Committee
Property Tax 101. Amy Koethe Dakota County Property Taxation & Records Jeanne Vogt - Ehlers
 Property Tax 101 Amy Koethe Dakota County Property Taxation & Records Jeanne Vogt - Ehlers 1 Minnesota GFOA Conference Arrowwood Resort September 28, 2017 Overview Minnesota has one of the most complex
NYS BOARD OF REAL PROPERTY SERVICES RP-467-Ins (8/06)
") NYS BOARD OF REAL PROPERTY SERVICES RP-467-Ins (8/06) INSTRUCTIONS FOR THE APPLICATION FOR THE PARTIAL REAL PROPERTY TAX EXEMPTION FOR SENIOR CITIZENS EXEMPTION (AND FOR ENHANCED SCHOOL TAX RELIEF [STAR]
NYS BOARD OF REAL PROPERTY SERVICES RP-467-Ins (8/06) INSTRUCTIONS FOR THE APPLICATION FOR THE PARTIAL REAL PROPERTY TAX EXEMPTION FOR SENIOR CITIZENS EXEMPTION (AND FOR ENHANCED SCHOOL TAX RELIEF [STAR]
NYS BOARD OF REAL PROPERTY SERVICES
 NYS BOARD OF REAL PROPERTY SERVICES RP-467-Ins (9/08) LP INSTRUCTIONS FOR THE APPLICATION FOR THE PARTIAL REAL PROPERTY TAX EXEMPTION FOR SENIOR CITIZENS EXEMPTION (AND FOR ENHANCED SCHOOL TAX RELIEF [STAR]
GLOSSARY. Adopted Budget - The financial plan of revenues and expenditures for a fiscal year as adopted by the Board of County Commissioners.
 GLOSSARY Accrual A revenue or expense which gets recognized in the accounting period it is earned or incurred, even if it is received or paid in a subsequent period. Accrual Accounting - A system that
C.A.A.O School Legislative Update
 C.A.A.O School - 2017 Legislative Update Bills That DIDN T Pass EXEMPTIONS HB5391 An Act Concerning Veteran Homeowners And Real Property Taxes. - DEAD To permit municipalities to offer real property tax
GENERAL ASSEMBLY OF NORTH CAROLINA SESSION 1993 S 1 SENATE BILL May 25, 1994
 GENERAL ASSEMBLY OF NORTH CAROLINA SESSION S SENATE BILL Short Title: Repeal Intangibles Tax. Sponsors: Senators Kerr; and Albertson. Referred to: Finance. (Public) May, 0 0 A BILL TO BE ENTITLED AN ACT
FLORIDA S PROPERTY TAX REFORM LEGISLATION: AN ECONOMIC REVIEW
 FLORIDA S PROPERTY TAX REFORM LEGISLATION: AN ECONOMIC REVIEW For FLORIDA ASSOCIATION OF REALTORS PREPARED BY: Regional Economic Research Institute Lutgert College of Business Florida Gulf Coast University
Robert J. Schillerstrom. Chairman: DuPage County Board. Ad Hoc Committee on Residential Exemptions
 Robert J. Schillerstrom Chairman DuPage County Board Ad Hoc Committee on Residential Exemptions Committee Report September 2004 Committee Members: Chairman: Vice-Chairman: Grant Eckhoff Tom Bennington
ORDINANCE NUMBER 1107
 ORDINANCE NUMBER 1107 AN ORDINANCE OF THE CITY COUNCIL OF THE CITY OF PERRIS ACTING IN ITS CAPACITY AS THE LEGISLATIVE BODY OF COMMUNITY FACILITIES DISTRICT NO. 2002-1 (WILLOWBROOK) OF THE CITY OF PERRIS
SENIORS Clauses 41, 41B, 41C, 41C½
 Massachusetts Department of Revenue Division of Local Services Navjeet K. Bal, Commissioner Robert G. Nunes, Deputy Commissioner & Director of Municipal Affairs TAXPAYER S GUIDE TO LOCAL PROPERTY TAX EXEMPTIONS
Report and Recommendations on Multi-family Property Assessment in Cook County
 Report and Recommendations on Multi-family Property Assessment in Cook County Prepared for The Cook County Board of Commissioners Prepared by Cook County Assessor James M. Houlihan January 2006 Report
ARIZONA TAX: CURRENT ISSUES, 2006 AND 2007 LEGISLATION AND CASE LAW
 ARIZONA TAX: CURRENT ISSUES, 2006 AND 2007 LEGISLATION AND CASE LAW 2006 LEGISLATION By: Pat Derdenger, Partner Steptoe & Johnson LLP 201 East Washington Street, 16 th Floor Phoenix, Arizona 85004-2382
6/23/2008 NYLJ 9, (col. 5) Page 1 6/23/2008 N.Y.L.J. 9, (col. 5)
 Page 1 6/23/2008 N.Y.L.J. 9, (col. 5)") 6/23/2008 NYLJ 9, (col. 5) Page 1 New York Law Journal Volume 239 Copyright 2008 ALM Properties, Inc. All rights reserved. Monday, June 23, 2008 VACATION HOME EXCHANGES CLARIFIED The unanticipated implications
6/23/2008 NYLJ 9, (col. 5) Page 1 New York Law Journal Volume 239 Copyright 2008 ALM Properties, Inc. All rights reserved. Monday, June 23, 2008 VACATION HOME EXCHANGES CLARIFIED The unanticipated implications
Property Tax Calculation Workbook
 Property Tax Calculation Workbook For Taxes Payable 2019 This workbook was updated January 2019. Please direct any questions or report any errors to PropTax.Admin@state.mn.us. Table of Contents Table of
Guide To Your Property Taxes And Proposal A
 Guide To Your Property Taxes And Proposal A PROPOSAL A : WHAT ARE PROPERTY TAXES BASED ON? Prior to 1995, your taxes were calculated on SEV (State Equalized Value). SEV is the Assessed Value of the property
CITY COUNCIL SPECIAL MEETING Monday, November 28, 2016 SPECIAL MEETING
 CITY COUNCIL SPECIAL MEETING Monday, November 28, 216 ************* SPECIAL MEETING 1. COMMUNICATION, Council President Morad, to City Clerk/Clerk of the City Council Dennis W. Farias, calling a SPECIAL
Glossary of Property Tax Terms
 October 23, 2017 Glossary of Property Tax Terms Taxable Assessed Value: The assessed value of a parcel (or an entire assessment roll) against which the tax rate is applied to compute the tax due. Assessed
ORDINANCE NUMBER 1104
 ORDINANCE NUMBER 1104 AN ORDINANCE OF THE CITY COUNCIL OF THE CITY OF PERRIS ACTING IN ITS CAPACITY AS THE LEGISLATIVE BODY OF COMMUNITY FACILITIES DISTRICT NO. 2001-3 (NORTH PERRIS PUBLIC SAFETY) OF THE
Truth-in-Taxation Instructions for Payable 2019
 Truth-in-Taxation Instructions for Payable 2019 Key Points Public meetings must take place at 6:00 p.m. or later Certification of Compliance must be submitted on or before Dec. 28, 2018 Questions? Please
SENIORS Clauses 41, 41B, 41C, 41C½
 Michael J. Heffernan Commissioner of Revenue Sean R. Cronin Senior Deputy Commissioner TAXPAYER S GUIDE TO LOCAL PROPERTY TAX EXEMPTIONS SENIORS Clauses 41, 41B, 41C, 41C½ The Department of Revenue (DOR)
Town of Hempstead Industrial Development Agency and Valley Stream Union Free School District 30
 DIVISION OF LOCAL GOVERNMENT AND SCHOOL ACCOUNTABILITY REPORT OF EXAMINATION 2017M-233 Town of Hempstead Industrial Development Agency and Valley Stream Union Free School District 30 Green Acres Mall PILOT
MICHIGAN. Taxpayer s Guide
 MICHIGAN Taxpayer s Guide Dear Taxpayer: This booklet contains information for your 2018 Michigan property taxes and 2017 individual income taxes, homestead property tax credits, farmland and open space
TABOR, GALLAGHER, AND MILL LEVIES
 TABOR, GALLAGHER, AND MILL LEVIES FINANCIAL MANAGEMENT ASSISTANCE Department of Local Affairs 1313 Sherman Street, Room 521 Denver, Colorado 80203 303-866-2156 www.dola.colorado.gov TABOR, Gallagher and
RESOLUTION NUMBER 3305
 RESOLUTION NUMBER 3305 RESOLUTION OF INTENTION OF THE CITY COUNCIL OF THE CITY OF PERRIS TO ESTABLISH COMMUNITY FACILITIES DISTRICT NO. 2004-5 (AMBER OAKS II) OF THE CITY OF PERRIS AND TO AUTHORIZE THE
Chapter 134 TAXATION. Income Limits Beginning 7/1/07
 Chapter 134 TAXATION [HISTORY: Adopted by the Town Board of the Town of Skaneateles as indicated in article histories. Amendments noted where applicable.] ARTICLE I Senior Citizens Tax Exemption [Adopted
Establishing an Estimated Annual Tax Levy Ceiling for the Tax Year 2017.
 DATE: November 8, 2017 TO: FROM: SUBJECT: Honorable Mayor Jerry Smith City Council Anne Marie Gaura, City Manager Molly Talkington, Finance Director Establishing an Estimated Annual Tax Levy Ceiling for
ORDINANCE NUMBER 1174
 ORDINANCE NUMBER 1174 AN ORDINANCE OF THE CITY COUNCIL OF THE CITY OF PERRIS, COUNTY OF RIVERSIDE, STATE OF CALIFORNIA, ACTING IN ITS CAPACITY AS THE LEGISLATIVE BODY OF COMMUNITY FACILITIES DISTRICT NO.
CAROLE KEETON STRAYHORN,
 Truth-In-Taxation A Guide for Setting School District Tax Rates July 2006 CAROLE KEETON STRAYHORN, Texas Comptroller TEXAS PROPERTY TAX Truth-In-Taxation A Guide for Setting School District Tax Rates
Tax Computation Manual
 Tax Computation Manual 2010 Published by Property Tax Division 150-800-438 (Rev. 10-10) Table of Contents Introduction...ii Key Dates...iii Property Tax Computation Flowchart...iv Chapter 1 Certification
OVERVIEW MINNESOTA PROPERTY TAX SYSTEM AND SCHOOL DISTRICT LEVY PROCESS Payable 2008 Levy
 OVERVIEW OF MINNESOTA PROPERTY TAX SYSTEM AND SCHOOL DISTRICT LEVY PROCESS 2007 Payable 2008 Levy Division of Program Finance October 2008 TABLE OF CONTENTS Overview of the Minnesota Property Tax System...
Study of the Metropolitan Area Fiscal Disparities Program
 Study of the Metropolitan Area Fiscal Disparities Program Prepared for: MINNESOTA DEPARTMENT OF REVENUE February 13, 2012 (revised) Prepared by: 4701 Sangamore Road Suite S240 Bethesda, Maryland 20816
Crawford County, Ohio
 Financial Forecast For the Years Ended December 31, 2006, 2007, and 2008 Actual; Years Ending December 31, 2009, 2010, and 2011 Forecasted 12/1/2009 1 Financial Forecast Table of Contents Page Schedule
OVER THE PERIOD MARCH 2007 THROUGH APRIL
 101 ST ANNUAL CONFERENCE ON TAXATION REDUCING PROPERTY TAXES IN GEORGIA: DESCRIPTIONS AND ANALYSIS OF RECENT PROPOSALS John Matthews, David L. Sjoquist and John V. Winters, Georgia State University INTRODUCTION
3509. Tulane University -- Exemption Allocation Regulation
 3509. Tulane University -- Exemption Allocation Regulation A. This Regulation shall be titled and known as Tulane University Exemption Allocation Regulation. HISTORICAL NOTE: Promulgated by the Department
2009 Minnesota Tax Incidence Study
 2009 Minnesota Tax Incidence Study (Using November 2008 Forecast) An analysis of Minnesota s household and business taxes. March 2009 For document links go to: Table of Contents 2009 Minnesota Tax Incidence
The Omnibus Property Tax Relief and Reform Act
 The Omnibus Property Tax Relief and Reform Act As part his proposed Education, Labor, and Family Assistance Article VII budget bill (S-A/A1- A, Governor David A. Paterson has proposed repealing the Middle
2007 Minnesota Tax Incidence Study
 2007 Minnesota Tax Incidence Study (Using November 2006 Forecast) An analysis of Minnesota s household and business taxes. March 2007 2007 Minnesota Tax Incidence Study Analysis of Minnesota s household
Chapter 6 FINANCE AND TAXATION
 Chapter 6 FINANCE AND TAXATION Article I. In General Sec. 6-1. Tax payment--installments. Sec. 6-2. Same--Delinquency interest. Sec. 6-2.1. Returned checks. Sec. 6-3A. Exemptions from real property tax
Fiscal Analysis of the City of Palo Alto 2030 Comprehensive Plan
 Draft Report Fiscal Analysis of the City of Palo Alto 2030 Comprehensive Plan Prepared for: City of Palo Alto Prepared by: Economic & Planning Systems, Inc. February 17, 2017 EPS #151010 Table of Contents
* * * * * * * * * * * * * * * * * * * * * * * * * * * * * * * * * * * * * * * * * * * * * * * *
 BYLAW 6104 * * * * * * * * * A BYLAW OF THE CITY OF LETHBRIDGE TO AUTHORIZE THE LEVY OF TAX UPON ALL TAXABLE PROPERTY SHOWN ON THE PROPERTY ASSESSMENT AND TAX ROLLS AND THE SUPPLEMENTARY PROPERTY ASSESSMENT
CHAPTER 3 PROPOSITION 2½ AGENDA AND OBJECTIVES
 CHAPTER 3 PROPOSITION 2½ AGENDA AND OBJECTIVES A. PRESENTATION TOPICS 1. Definition and calculation of the annual levy limit. 2. Definition and calculation of new growth. 3. Definition and calculation
McCreary Veselka Bragg & Allen P.C. Attorneys at Law. A Guide for Setting Tax Rates
 McCreary Veselka Bragg & Allen P.C. Attorneys at Law A Guide for Setting Tax Rates TRUTH-IN-TAXATION 2018 for Our Clients We are pleased to present this easy-to-use guidebook to help you with this year
Georgia Department of Audits and Accounts Performance Audit Division Greg S. Griffin, State Auditor Leslie McGuire, Director
 Special Examination Report No. 12-25 January 2013 Georgia Department of Audits and Accounts Performance Audit Division Greg S. Griffin, State Auditor Leslie McGuire, Director Why we did this review This
SUBCHAPTER VIII. LOCAL GOVERNMENT SALES AND USE TAX.
 SUBCHAPTER VIII. LOCAL GOVERNMENT SALES AND USE TAX. Article 39. First One-Cent (1 ) Local Government Sales and Use Tax. 105-463. Short title. This Article shall be known as the First One-Cent (1 ) Local
Research Report April 2007
 Research Report April 2007 106 N. Bronough St. P.O. Box 10209 Tallahassee, FL 32302 (850) 222-5052 FAX (850) This report was initially released electronically before being printed in hardcopy format Mixed
DeSoto County, FL. FY 2017 Fire Rescue Non Ad Valorem Assessment Study. Revised Final Report. Revision Date: July 18, 2016.
 FY 2017 Fire Rescue Non Ad Valorem Assessment Study Revision Date: July 18, 2016 Prepared By: Burton & Associates 200 Business Park Circle, Suite 101 St Augustine, Florida 32095 Phone (904) 247-0787 Fax
SOUTH SHORE MUNICIPAL REVENUE 2012
 2012 MERC PUBLICATION SOUTH SHORE Cohesive Commercial Statistical Area MUNICIPAL REVENUE 2012 By Mary Phelan, M.B.A., C.P.A. Beverly Soriano, M.S., C.P.A. With assistance of MERC interns: Nicole Coccoluto,
COMMONWEALTH OF MASSACHUSETTS APPELLATE TAX BOARD. FORRESTALL ENTERPRISES, INC. v. BOARD OF ASSESSORS OF THE TOWN OF WESTBOROUGH
 COMMONWEALTH OF MASSACHUSETTS APPELLATE TAX BOARD FORRESTALL ENTERPRISES, INC. v. BOARD OF ASSESSORS OF THE TOWN OF WESTBOROUGH Docket Nos. F317708, F318861 Promulgated: December 4, 2014 These are appeals
Principal Residence The Basics
 Courtesy of Liviniuk Partaker Tetrault Wealth Management Group of RBC Dominion Securities August 12, 2010 Principal Residence The Basics A home is often the single largest purchase made by Canadians and
PROPERTY ASSESSMENT AND TAXATION
 AUTHORITY The City and Borough of Juneau s authorization to levy a property tax is provided under Alaska State Statute Section 29.45. Under this section, the State requires the Assessor to assess property
RESOLUTION NUMBER 3415
 RESOLUTION NUMBER 3415 A RESOLUTION OF THE CITY COUNCIL OF THE CITY OF PERRIS, ACTING AS THE LEGISLATIVE BODY OF COMMUNITY FACILITIES DISTRICT NO. 2001-3 (NORTH PERRIS PUBLIC SAFETY) OF THE CITY OF PERRIS,
2018 LOW INCOME SENIOR CITIZEN (RP-467) AND LOW INCOME DISABILITY (RP-459C) EXEMPTION APPLICATION AND RENEWAL CHECKLIST
 AND LOW INCOME DISABILITY (RP-459C) EXEMPTION APPLICATION AND RENEWAL CHECKLIST") 2018 LOW INCOME SENIOR CITIZEN (RP-467) AND LOW INCOME DISABILITY (RP-459C) EXEMPTION APPLICATION AND RENEWAL CHECKLIST Before bringing or mailing your application to the Assessor s Office, please ensure
2018 LOW INCOME SENIOR CITIZEN (RP-467) AND LOW INCOME DISABILITY (RP-459C) EXEMPTION APPLICATION AND RENEWAL CHECKLIST Before bringing or mailing your application to the Assessor s Office, please ensure
Why would the County need to borrow money to conduct a reassessment?
 Lackawanna County Reassessment Video Script-Final 9-29-17 LC Reassessment Video Script-Final.docx Estimated Time: 13:15 This November, every citizen of Lackawanna County will be presented with a unique
FY 12 Funding Sources General Fund
 The General Fund accounts for all financial transactions and resources in Prince William County other than those required to be accounted for in another Fund. Thus, the General Fund is the largest and
Q & A: HOW PROPERTY TAXES ARE DETERMINED
 Q & A: HOW PROPERTY TAXES ARE DETERMINED From the time of statehood until the 1930 s, property tax was the only major tax that supported most state and local government programs. Property tax continues
Property Tax and Value Workshop for State and Local Officials. December 13, 2012, 6:00 pm
 Property Tax and Value Workshop for State and Local Officials December 13, 2012, 6:00 pm Property Valuation Cycle The Assessor s Office works throughout the year to estimate the market value and determine
Member Town Financial Report Groton. January By: MARS Consulting Group
 Member Town Financial Report Groton January 2018 By: MARS Consulting Group Definitions Below Effort Shortfall the percentage increase applied to determine MLC as dictated by the fiscal year Chapter 70
Total state and local business taxes
 Total state and local business taxes State-by-state estimates for fiscal year 2014 October 2015 Executive summary This report presents detailed state-by-state estimates of the state and local taxes paid
TOWN OF PRESCOTT VALLEY
 TOWN OF PRESCOTT VALLEY Management Services Department WATER & SEWER RATE STUDY July 27, 2017 TOWN OF PRESCOTT VALLEY REPORT OF PROPOSAL TO REVISE CERTAIN WATER AND WASTEWATER RATES, FEES AND SERVICE CHARGES
A. Inflation Rate Used in the 2013 Capped Value Formula.
 89 (Rev. 01-11) RICK SNYDER GOVERNOR STATE OF MICHIGAN DEPARTMENT OF TREASURY LANSING ANDY DILLON STATE TREASURER BULLETIN NO. 11 of 2012 CHANGES FOR 2013 TO: FROM: RE: Assessors Equalization Directors
429 CMR 2.00: MANUFACTURING WORKFORCE TRAINING TAX INCREMENT FINANCING
 429 CMR 2.00: MANUFACTURING WORKFORCE TRAINING TAX INCREMENT FINANCING Section 2.01: Scope, Purpose, and Applicability 2.02: Definitions 2.03: Overview of the MWT-TIF Program 2.04: Designation of MWT-TIF
Qualified Farm Property Subtraction Report
 Qualified Farm Property Subtraction Report Report Date: February 27, 2017 February 27, 2017 The Honorable Greg Davids Chair, House Taxes Committee 585 State Office Building The Honorable Paul Marquart
Disabled and Over-65 Tax Limitation January 10, 2017
 Disabled and Over-65 Tax Limitation January 10, 2017 Purpose of Work Session Present Information on the Over 65 and Disabled Tax Limitation and estimated financial impacts 2 Tax Year 2016 Exemptions Exemptions
HUMBOLDT COUNTY: FINANCIAL TRENDS AND INDICATORS
 TECHNICAL REPORT UCED 98-09 HUMBOLDT COUNTY: FINANCIAL TRENDS AND INDICATORS UNIVERSITY OF NEVADA, RENO HUMBOLDT COUNTY: FINANCIAL TRENDS AND INDICATORS Prepared By: Peter Janson Ted E. Oleson, Jr and
TOWN OF FRYE ISLAND FINANCIAL REPORT DECEMBER 31, 2008
 TOWN OF FRYE ISLAND FINANCIAL REPORT DECEMBER 31, 2008 DECEMBER 31, 2008 TABLE OF CONTENTS INDEPENDENT AUDITORS' REPORT MANAGEMENT S DISCUSSION AND ANALYSIS BASIC FINANCIAL STATEMENTS Statement of Net
The House Proposal for Property Tax Relief & Reform HB 7001 & HJR 7089
 Current as of April 13, 2007 The House Proposal for Property Tax Relief & Reform HB 7001 & HJR 7089 Introduction Over the last several years, escalating property taxes have far outpaced Floridians ability
Total Compensation Systems, Inc.
 Merced Union High School District Actuarial Study of Retiree Health Liabilities Under GASB 74/75 Valuation Date: June 30, 2017 Measurement Date: June 30, 2017 Prepared by: Date: May 24, 2018 Table of Contents
2014 Property Values and Assessment Practices Report. Assessment Year 2013
 2014 Property Values and Assessment Practices Report Assessment Year 2013 Property Tax Division Minnesota Department of Revenue February 19, 2014 February 19, 2014 To Members of the Legislature of the
GLOSSARY OF SCHOOL FINANCE TERMS
 GLOSSARY OF SCHOOL FINANCE TERMS Any study of school finance can be confusing because of the enormous number of technical terms used in describing the process. The following is a glossary of the terms
Agency Income Guideline Revisions Note: SunTrust Mortgage specific overlays are underlined.
 Rental Income Correspondent Section 2.01 Agency Loan Programs- Guideline Standard Agency (non- AUS, DU & LPA) Agency Plus (DU & LPA) Texas Cash- Out Refi (DU) Income / Rental Income Non-AUS Eligible Properties
K. Government Structure and Finance
 K. Government Structure and Finance 1. Government Structure Legislative Leadership The activities of the county are overseen by a seven member Board of Supervisors elected for four-year terms. The responsibilities
U.S. Department of Housing and Urban Development Community Planning and Development
 U.S. Department of Housing and Urban Development Community Planning and Development Special Attention of: Notice: CPD 97-03 All Secretary's Representatives All State/Area Coordinators Issued: March 27,
Arizona Low Income Housing Tax Credit and Housing Trust Fund Economic and Fiscal Impact Report
 Arizona Low Income Housing Tax Credit and Housing Trust Fund Economic and Fiscal Impact Report Prepared for: Arizona Department of Housing January 2014 Prepared by: Elliott D. Pollack & Company 7505 East