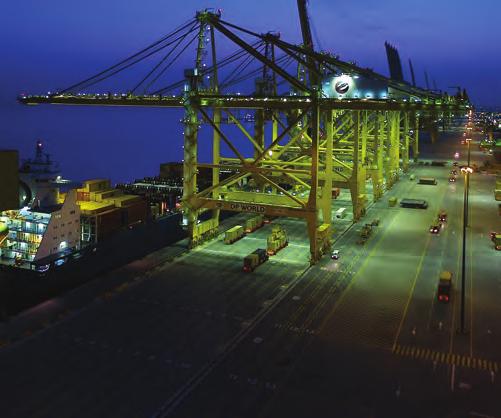
Connecting global markets
|
|
|
- Ginger Bailey
- 6 years ago
- Views:
Transcription


1 Connecting global markets Annual Report
2 BUSINESs overview 02 Financial highlights 04 Chairman s statement 08 review 10 Case study: DP World Callao 12 Chief Executive s review 18 Board of Directors Corporate governance 20 Report of the Directors 22 Corporate governance 28 Statement of Directors responsibilities FINaNCIal statements 29 Indpendent auditors report 30 Consolidated income statement 31 Consolidated statement of comprehensive income 32 Consolidated statement of financial position 34 Consolidated statement of changes in equity 36 Consolidated statement of cash flows 38 Notes to the consolidated financial statements
3 BUSINESS overview corporate governance FINANCIAL STATEMENTS Overview Our focus is on delivering profitable growth, improving EBITDA margins and driving cash generation in both the short term and long term. We remain confident about the long term outlook for the container terminal industry and our strong competitive position within it. Sultan Ahmed Bin Sulayem, Chairman 1
4 Financial highlights $3,078m Revenue growth of 9% $1,240m EBITDA growth of 16% 40.3% EBITDA margins $503m Profit before tax growth of 30% 2.26 cents Earnings per share growth of 12% 2
5 BUSINESS overview corporate governance FINANCIAL STATEMENTS 50 terminals 9 new developments and major expansions 3

6 Chairman s statement SultAN Ahmed Bin Sulayem, chairman saw a return to volume growth across almost all our terminals, albeit with different growth rates across regions. We saw both rapid recovery in global trade in those markets most affected by the decline in container volumes in, and a return to more modest growth in those markets which showed resilience during. Almost all of our container terminals around the world are back at or ahead of volumes last seen in 2008 which was a peak year for the global container terminal industry. The group has continued to invest in its portfolio during the last two years of global crisis and is seeing the benefit of this investment in these results. Management at our terminals took some tough decisions in 2008 and to successfully mitigate greater declines in profit as a result of the declines in container volumes. As volumes have returned, management remain focused on retaining the benefits of those actions which continued to be implemented through. This has resulted in the delivery of profit before tax in excess of $500 million 1 for the full year and EBITDA 2 margins in the second half of the year that matched those reported in All financial results are reported before separately disclosed items unless otherwise stated 2 Adjusted EBITDA and Adjusted EBITDA Margins will be referred to as EBITDA and EBITDA margins respectively throughout this document, Further information on Adjusted EBITDA can be found in Notes to Accounts, Note 6 Our full year reported revenue for our consolidated portfolio 3 in was $3,078 million, 9% ahead of last year as a result of the 9% increase in container volumes, improved container revenue per twenty foot equivalent unit (TEU) and a return to growth of non-container revenue. EBITDA increased 16% to $1,240 million with EBITDA margins of 40.3%, an improvement from 38.0% for the same period last year. Profit before tax of $503 million and profit after tax of $450 million are 30% and 35% ahead of the prior year respectively. In the Europe, Middle East and Africa region, we reported a better performance in the second half of than in the first half, with signs of a recovery in both ancillary (mainly storage) revenue and non-container revenue resulting in full year revenue in line with. Our continuing focus on costs drove EBITDA up 4% to $793 million. The Asia Pacific and Indian Subcontinent region reported results were impacted positively by a full year contribution from our new terminal in Saigon (Vietnam) which opened at the end of, and negatively from the revenue adjustment following the transfer of ATI Manila (Philippines) from being a consolidated terminal to the joint venture portfolio in the fourth quarter of. Excluding these major changes, like for like revenue, at constant currency, was 16% higher as a result of like for like volumes growing 10% and an increase in revenue per TEU. This increase in revenue, in combination with cost 3 28 of our 50 terminals are consolidated under IFRS 4
7 BUSINESS overview corporate governance FINANCIAL STATEMENTS Despite the recent challenging market environment, we have continued to invest for the long term. reductions and a substantial increase in the contributions from joint ventures and associates resulted in like for like EBITDA at constant currency increasing 22%. The Australia and Americas region has rebounded strongly from the challenging environment in delivering growth over both and Our new development in Callao (Peru) opened at the end of the first half of, contributing to the results for this region for the first time. The reported results have benefitted significantly from the strengthening Australian dollar against the US dollar. Revenue from our consolidated terminals increased 47% to $875 million following a volume growth of 35% in the region. Like for like revenue at constant currency was 29% higher as a result of the 23% increase in volume in the region and higher container revenue per TEU and a significant increase in non-container revenues. EBITDA was $271 million, almost double the prior year and, on a like for like basis at constant currency was 69% ahead of the prior year. Australia strategic partnership As announced in December and completed in March 2011, DP World and Citi Infrastructure Investors (CII), together with one of CII s major investors, announced their intention to form a strategic partnership in relation to DP World s five marine terminals in Australia. The strategic partnership, which formed a new joint venture company on completion of the transaction in March 2011, saw DP World monetise 75% of its shares whilst retaining a 25% shareholding in the new joint venture. The total proceeds of the transaction amount to A$1,483 million (USD 1,475 million). In addition, DP World has a long term agreement to provide management services to the Australian operation. Investment in our portfolio Our industry is a long-term one, with the average container terminal concession granted to DP World being in excess of 25 years. The senior management team spends a considerable amount of resource identifying, evaluating and executing incremental investment opportunities across the portfolio to enable us to meet our customers requirements in the future. Our confidence in the long term future of our operations saw us continue to add capacity throughout the challenging years of and. Indeed in we added an additional 12% new capacity to our global portfolio taking us to a gross capacity of 67 million TEU capacity across 50 terminals in 28 countries. The opening of Callao (Peru) in the middle of the year marked our first terminal on the West Coast of South America and we have been very pleased with how operations have evolved achieving close to 100% utilisation. In addition, our joint venture in Qingdao (China), which is a key terminal in our joint venture portfolio, completed a major expansion project. Over the last two years we have also been focused on building a new Gateway terminal at Vallarpadam, Cochin (India) and further expanding our terminal in Karachi (Pakistan). Both of these opened successfully in early 2011 and are already proving valuable additions to our portfolio where customers can benefit from modern purpose built port operations. Alongside these investments we have continued to invest in essential infrastructure including dredging and reclaiming land to build the quay wall at our 5


8 Doraleh Container Terminal, Djibouti Qingdao Container Terminal, China new development at London Gateway (UK). The works are progressing as planned. Despite the recent challenging market environment, we have continued to invest for the long term. Over the last three years we have added over 15 million TEU in gross capacity including over 6 million TEU of new consolidated capacity. When taking into account our pipeline of 9 new developments and expansion projects, which we are able to roll out in line with market demand, by 2020 we anticipate operating 54 terminals across our global portfolio with capacity reaching 95 million TEU. We continue to see exciting opportunities to not only expand our existing facilities but also from new concession opportunities. These will be added in line with market demand and will be subject to meeting established investment criteria. Whilst we are committed to expanding our portfolio to meet market needs, we intend to do so without increasing leverage (net debt to EBITDA) beyond 4.0 times in the current market environment. Strategy In the short term we continue to focus on ensuring our business is well positioned to respond to our customers more immediate requirements whilst maintaining a focus on incremental revenue generation and cost management to drive EBITDA margins. Taken together these will continue to drive improving cash generation and deliver profitable growth. Looking further out, growth in global trade is expected to continue and as shipping lines and traders are planning for the future, including bringing on larger vessels, so too must port operators. We will retain our ability to respond to growth opportunities alongside expansion of our existing facilities in response to our customers future requirements. We are committed to our core container handling business expecting to maintain approximately 80% of our revenues from container related activities in terminals that are located in either origin and destination markets, or in gateway locations. This provides a more stable and higher margin container revenue stream as was reflected in the resilience of our operational and financial performance in through the downturn. We expect to be generating approximately 75% of our future volumes from the faster growing emerging or frontier markets capturing the faster growth in trade. In addition, the continuation of the trend toward higher containerisation as investment is made across the logistics supply chain will help drive volumes through our portfolio. Our management team is also highly experienced in developing and operating container ports in emerging and frontier markets. We believe that operational excellence and innovation create opportunities to generate additional value out of our existing facilities. We continuously improve our operational efficiency thereby increasing the capacity of our existing facilities. We believe that this element of our strategy is one of the most cost-effective methods for increasing capacity at our existing facilities. In addition, we continually communicate with our customers and essential stakeholders in the port and shipping community to maximise the connectivity, responsiveness, accuracy and our speed of response to customers needs. Dividend The Board is recommending a full year dividend of 0.86 of a US cent per share (: 0.82 of a US cent per share) equating to a total dividend payment of $143 million (: $136 million). This 5% increase in total dividend reflects, inter alia, our confidence in our operational 6


9 BUSINESS overview corporate governance FINANCIAL STATEMENTS performance and the recovery in our markets, and the ability of DP World to generate cash over the longer term. Subject to approval by shareholders, the dividend will be paid on 16 May 2011 to ordinary shareholders on the register as at the close of business on 7 April 2011, with an ex-dividend date of 6 April Outlook Our focus remains on delivering profitable growth, improving EBITDA margins and driving cash generation in both the short term and long term through a combination of incremental revenue generation, improving efficiencies and cost management. We remain confident about the long term outlook for the container terminal industry and our strong competitive position within it. Sultan Ahmed Bin Sulayem Chairman Jebel Ali Terminal, UAE 7


10 review September Callao, Peru South America s largest and most modern container terminal on the west coast, DP World Callao, was officially inaugurated by Peruvian President Alan García Perez and DP World Chairman Sultan Ahmed Bin Sulayem. The port is situated close to Peru s capital city, Lima. October Sokhna, Egypt DP World entered into an agreement with the Red Sea Ports Authority to expand capacity at the new terminal at Sokhna Port, Egypt. The new basin, which is located at the southern end of the Suez Canal, will have a quay length of 1300metres and a capacity of 1.75 million TEU, more than doubling DP World Sokhna s existing capacity. Almost all of our container terminals around the world are back at, or ahead of, volumes last seen in 2008 which was a peak year for the global container terminal industry. 8


11 BUSINESS overview corporate governance FINANCIAL STATEMENTS The group has continued to invest in its portfolio during the last two years of global crisis and is seeing the benefit of this investment in these results. June Maputo, Mozambique DP World holds the concession to operate the container terminal at the port of Maputo. The concession for the port was extended to 2033 with an option to extend for a further ten years. December Fremantle, Australia DP World and Citi Infrastructure Investors (CII), together with one of CII s major investors, announced their intention to form a strategic partnership in relation to DP World s five marine terminals in Australia. The strategic partnership saw DP World monetise 75% of its shares whilst retaining a 25% shareholding in the new joint venture. In addition, DP World has a long term agreement to provide management services to the Australian operation. 9

12 Case study: DP World Callao Investing in emerging markets 10


13 BUSINESS overview corporate governance FINANCIAL STATEMENTS Callao, Peru is the ideal entry point for the west coast of South America a dynamic economy with a large local cargo market and strong trade growth, geographically well positioned and in need of significant infrastructure investment. Until, all containers in Callao had to be loaded or discharged using ships cranes, limiting the size of vessels at the port to a maximum of around 3,000 TEU. Today, with a berth draft of 16 metres, six super postpanamax gantry cranes and associated yard equipment, and a quay length of 650 metres, DP World Callao can handle two post-panamax vessels of around 8,000 TEU at the same time. Begun as a brownfield development in April 2008 and officially inaugurated in September, six months ahead of schedule, the terminal has a 24 hectare container stacking area, with 16.5 hectares reclaimed from the sea. Developing a modern terminal in Callao brings significant synergies to shipping services covering the west coast of South America, allowing the deployment of large vessels to cover both Peru and Chile in the same service. With the introduction of larger tonnage, we foresee further development of Callao both for origin and destination cargo and for transshipment cargo to secondary ports in Peru, Northern Chile and Ecuador. 11

14 Chief Executive s review Mohammed Sharaf, chief executive officer Our financial performance for the twelve months to 31 December reflects the return to container volume growth across our portfolio of 50 terminals together with an improvement in revenue per TEU, alongside continued cost management and improved operational efficiencies, resulting in a much improved financial performance in against. Our consolidated revenues have benefitted from the inclusion of a full year of revenues from Saigon (Vietnam) which opened in the fourth quarter of and Callao (Peru) which opened at the end of the first half of, offset by the exclusion of revenue from ATI Manila (Philippines) which has been accounted for as a joint venture since the fourth quarter of. In addition two terminals in Algeria joined the joint venture portfolio in. Our Australian terminals continue to be accounted for, as in previous years, as consolidated terminals within the Australia and Americas region for. As a global business, we are exposed to currency translation on our reported results. Over the year, the weakening US dollar had a small positive impact on EBITDA. The Australia and Americas region was the most impacted by this. Revenue for our consolidated portfolio 4 in was $3,078 million, 9% ahead of last year as a result of the 9% increase in container volumes resulting in utilisation of 80%, improved container revenue per TEU and a return to growth of non-container revenue. Containerised revenue accounted for 82% of our total revenue and was $2,512 million for the year, 10% ahead of the prior period following an improvement in container volumes and increases in revenue per TEU, most notably in Australia and India. After reporting a small decline in ancillary (mainly storage) revenue for the first half of the year as a result of prior year comparatives, we have now seen this ancillary revenue return to growth. Non-container revenue increased 5% to $566 million and accounted for 18% of total revenue in the period, driven by a much stronger second half as we saw this income stream return across all our regions in the second half of the year, albeit at a lower rate in the UAE region. Expenses 5 for the year were $1,978 million, 9% higher than the same period last year due to the 9% volume increase and the addition of new terminals into our portfolio. On a like for like basis, at constant currency, expenses only increased 8% against a like for like volume increase of 9%. Cost reductions were 2% for the year as a whole, from a combination of lower operating expenses and lower overhead expenses. As we reported during the year, our portfolio of terminals accounted for as joint ventures and associates performed very strongly against the prior period leading to a 97% increase in our share in profit from joint ventures and associates to $140 million. This was primarily driven by continued expansion of new capacity at our terminal in Qingdao (China) and, in part down to ATI Manila (Philippines) joining this portfolio. Excluding ATI Manila and the two Algerian terminals that joined the portfolio in, growth would still have been over 80% as volumes returned across Asia and Europe from the low base in. EBITDA increased 16% to $1,240 million with EBITDA margins of 40.3%, an improvement from 38.0% in. This margin improvement reflects the continued focus of our terminal managers to reduce costs from our operations and improve efficiencies, and represents a strong performance considering the contribution to 4 28 of our 50 terminals are consolidated under IFRS in 5 Expenses are net of other income and excluding depreciation and amortisation and net finance costs 12
15 BUSINESS overview corporate governance FINANCIAL STATEMENTS Cost controls and improved terminal efficiencies have driven a 16% growth in EBITDA to $1,240 million and EBITDA margins back above 40%. EBITDA from the higher margin non-container revenue is still lower than last year. Margins in the second half of were at 40.7% which compares favourably to margins at our peak in 2008 of 40.8%. Our profit for the year is ahead of expectations primarily as a result of lower net finance expenses on account of the repayment of debt in our Australian business towards the end of the year and a lower average cost of debt. Profit before tax of $503 million and profit after tax of $450 million are 30% and 35% ahead of the prior year respectively. With the decline in container volumes seen in, we have continued to adopt a prudent approach to capital expenditure with $937 million invested over the year. Over 55% of this is focused on investment in new capacity expansion and 30% on investment in existing terminals to improve efficiencies and production as well as in the medium to long-term revenue generation or cost saving opportunities. Callao (Peru) opened at the end of the first half of and is already performing beyond our expectations with Vallarpadam (India) and Karachi (Pakistan) opening in the first quarter of Alongside these investments we have continued to invest in essential infrastructure at our new development at London Gateway (UK). In line with our strategy of rolling out new capacity in line with market demand, DP World has continued to grow its portfolio throughout the challenging market environment of the last three years adding 6.6 million TEU consolidated capacity in that timeframe. Our total consolidated capacity at the end of was 35 million TEU, of which 23% has been added in the last three years. Highlights of results from DP World Limited and its subsidiaries full details on page 30 before separately disclosed items before separately disclosed items Consolidated Throughput (TEU) 27.8 million 25.6 million Revenue $3,078 million $2,821 million Share of JVs and Associates $140 million $71 million EBITDA (including JVs and Associates) $1,240 million $1,072 million EBITDA Margin (including JVs and Associates) 40.3% 38.0% Pre-tax profit from continuing businesses $503 million $387 million Adjusted net profit for the year $450 million $333 million Earnings per share (USD cent) (after separately disclosed items)


16 DP World Tarragona, Spain DP World Jebel Ali, UAE Review of regional trading for continuing operations Europe, Middle East and Africa The second half of saw a better performance than we reported in the first half of the year with signs of a recovery in both ancillary revenue and non-container revenue leading to full year revenue in line with and solid cost management driving EBITDA and EBITDA margins ahead of the prior year. As of 31 December, we had 25 terminals in the region, of which 13 were consolidated for financial reporting purposes. On average, terminals that contributed to revenue for the region experienced an increase in volume of 6% over the previous year as a result of organic growth and winning market share through improved efficiencies. Revenue from our consolidated terminals was flat at $1,742 million as the 6% growth in volumes and associated revenue was offset by a continuation of declines in ancillary (storage) revenue and non-container revenue from the UAE region. Our share of profit from joint ventures and associates continued to improve in the second half of the year delivering $10 million as those terminals benefitted from returning volumes and the full year contribution of our two terminals in Algeria which joined the portfolio in. EBITDA improved 4% to $793 million with margin improvement back to 45.5% as recorded in the peak year of The overall decline in ancillary container revenue and non-container revenue was mitigated by the continuation of substantial cost savings in this region. The UAE reported an increase in volumes of 4% to 11.6 million TEU with an increase in associated revenue in line with the volume increase. Total revenue for the full year declined 6% as a result of lower ancillary container (storage) and non-container revenue than the prior period which saw very high revenue during the first four months of. However, there has been much improvement in the second half of the year with both container revenue and non-container revenue showing growth over the same period last year. During the year, $448 million of our capital expenditure was spent in the Europe, Middle East and Africa region with a focus on improving efficiencies. Algiers and Djen-Djen (Algeria) and Maputo (Mozambique), where we have recently extended the concession, benefitted from new operating systems implemented in. Sokhna (Egypt), Tarragona (Spain) and Jeddah (KSA) also benefitted from investment in yard equipment which will drive greater productivity and benefit our customers by improving efficiency. During the year we began investing in the construction of essential infrastructure (including dredging and building the quay wall) at London Gateway (UK). Europe, Middle East and Africa before separately disclosed items before separately disclosed items Consolidated Throughput (TEU) 17.5 million 16.5 million Revenue $1,742 million $1,748 million Profit /(loss) from JV and Associates $10 million $(1.0) million EBITDA (including JV and Associates) $793 million $765 million EBITDA Margins 45.5% 43.8% Adjusted net profit for the year $557 million $531 million 14
 which opened at the end of, and the negative impact from the loss of revenue following the transfer of ATI")
17 BUSINESS overview corporate governance FINANCIAL STATEMENTS Control room, Jebel Ali Terminal, UAE Asia Pacific, Indian Subcontinent The Asia Pacific and Indian Subcontinent region results were positively impacted by a full year contribution from our new terminal in Saigon (Vietnam) which opened at the end of, and the negative impact from the loss of revenue following the transfer of ATI Manila (Philippines) from being a consolidated terminal to the joint venture portfolio in the fourth quarter of. As of 31 December, we had 16 operating terminals in the region, of which 7 were consolidated for financial reporting purposes. Terminals that contributed to like for like 6 revenue, at constant currency, experienced an increase in volume for the period of 10% compared with last year. Whilst reported revenues declined 3% in the year as a result of the transfer of ATI Manila, like for like revenue, at constant currency, was 16% higher as a result of like for like volumes growing 10% and an increase in revenue per TEU including additional revenue from storage across the region but notably in Karachi (Pakistan). Our Asia Pacific and Indian Subcontinent region contributes the majority of our share of profit from joint ventures and associates and this year reported $96 million profit against $48 million for last year. Excluding the contribution from ATI Manila, and at constant currency, the improved performance of the terminals in this portfolio resulted in an increase of 76% of our share of profit from joint ventures and associates and is well ahead of 2008 levels as volumes have grown significantly in the region. EBITDA increased 3% to $255 million with margin improvement to 55.3%, back above 2008 levels despite the adjustment for EBITDA for ATI Manila. On a like for like basis, at constant currency, EBITDA grew 22% despite the inflationary pressures in this region that impacted the positive impact of cost reduction coming through. $241 million of our capital expenditure was spent in the region focused on our new developments at Vallarpadam (India) and Karachi (Pakistan) which both opened in early Australia and Americas In December DP World and Citi Infrastructure Investors (CII), together with one of CII s major investors, announced their intention to form a strategic partnership to invest in, operate and manage DP World s five marine terminals in Australia. The strategic partnership, which formed a new joint venture company on completion of the transaction in March 2011, saw DP World monetise 75% of its shares whilst retaining a 25% shareholding in the new joint venture. In addition, DP World has an agreement to provide management services to the Australian operation. For the purposes of financial reporting, our ports in Australia are included, as in previous years, in the Australia and Americas region with all five container ports consolidated as in previous years. Asia Pacific, Indian Subcontinent before separately disclosed items before separately disclosed items Consolidated Throughput (TEU) 5.5 million 5.5 million Revenue $461 million $477 million Profit from JV and Associates $96 million $48 million EBITDA (including JV and Associates) $255 million $248 million EBITDA Margins 55.3% 52.0% Adjusted net profit for the year $156 million $172 million 6 Like for like excludes the contribution from new terminals and transfer of ATI Manila to a joint venture in 15
 $271 million $138 million EBITDA Margins 31.0% 23.")
 opened at the end of the first half of contributing to the results for this region for the first time.")
18 DP World Ho Chi Minh City, Vietnam DP World Caucedo, Dominican Republic Australia and Americas before separately disclosed items before separately disclosed items Consolidated Throughput (TEU) 4.8 million 3.5 million Revenue $875 million $596 million Profit from JV and Associates $35 million $24 million EBITDA (including JV and Associates) $271 million $138 million EBITDA Margins 31.0% 23.1% Adjusted net profit for the year $153 million $49 million The Australia and Americas region has rebounded strongly from the challenging environment in delivering growth over both and Our new development in Callao (Peru) opened at the end of the first half of contributing to the results for this region for the first time. The reported results have benefitted significantly from the strengthening Australian dollar. As of 31 December, we had 9 terminals in the region, of which 8 were consolidated for financial reporting purposes. In addition, P&O Maritime Services is accounted for in this region. On average, terminals that contributed to revenue experienced an increase in volume of 35% against the same period last year with volumes ahead of 2008 levels and well ahead of. Revenue from our consolidated terminals increased 47% to $875 million following the volume growth of 35% in the region. Like for like revenue at constant currency was 29% higher as a result of the 23% increase in volume in the region and higher container revenue per TEU and a significant increase in non-container revenues from bulk in Vancouver (Canada). Our reported share of profit from joint ventures and associates of $35 million increased 46% driven by improved performance from those operations in this portfolio and the increase in ownership at Caucedo (Dominican Republic) from 35% to 45%. EBITDA almost doubled to $271 million resulting in margins of 31% improving significantly from levels. Excluding the positive impact of currency, EBITDA increased 69% with all ports delivering EBITDA at levels higher than 2008 levels as cost cutting measures and efficiencies benefit those terminals as volumes return. $244 million of our capital expenditure was spent in the region primarily in association with our new development in Callao (Peru). Net finance costs Net finance costs at $279 million (before separately disclosed items) were somewhat lower than expected as a result of interest rates remaining at low levels throughout the year, a reduction in our total debt from $8.0 billion to $7.8 billion, and the additional interest income as a result of holding in excess of $2 billion cash throughout. Interest cover improved to 4.4 times 7. Profit attributable to non-controlling interests (minority interest) Profit attributable to non-controlling interests (minority interest) has increased from $37 million to $76 million due to the improved performance in those terminals that DP World does not wholly own, such as Doraleh (Djibouti), Southampton (UK) and Buenos Aires (Argentina). Our full year profit attributable to non-controlling interests of $37 million also included a $14 million tax liability in relation to our terminal in Buenos Aires which reduced the reported minority interest in. 7 Interest cover is calculated using EBITDA and net finance costs before separately disclosed items 16
19 BUSINESS overview corporate governance FINANCIAL STATEMENTS Our total consolidated capacity at the end of was 35 million TEU, of which 23% has been added in the last three years. Earnings per share (EPS) Earnings per share, which is reported after separately disclosed items, increased 12% against the prior year to 2.26 cent. Whilst profit after tax, after separately disclosed items, reported a 22% increase over the prior period, the lower growth in the reported EPS reflects the increase in minority interests as outlined above. Capital expenditure During the first six months of this year we completed our terminal at Callao (Peru) which opened towards the end of the first half and we continued to work towards completion of Vallarpadam (India) and Karachi (Pakistan), both of which opened in the first quarter of Alongside these projects, we have continued to invest in essential infrastructure at our new development at London Gateway (UK). Our $937 million of capital expenditure in the year has included further investment in improving terminal efficiency in many of our existing terminals including Chennai (India), Maputo (Mozambique) and Tarragona (Spain). We remain fully committed to meeting the long-term market demand for capacity expansion; however we continue to take a cautious approach, investing in new capacity in line with market demand. We maintain our guidance for capital expenditure of $2.5 billion between and 2012 inclusive, of which we have spent just under $1 billion in and anticipate in the region of $750 million in each of 2011 and Balance sheet Total assets increased to $19.4 billion from $19.0 billion as a result of terminal additions during the year. Cash flow Gross cash generation from operating activities was $1,108 million which is approaching our peak cash generation in 2008 of $1,204 million and 12% ahead of the same period in. Net debt We reported net debt as at 31 December of $5,253 million, made up of bank balances and cash of $2,520 million and gross debt of $7.8 billion. Long-term corporate bonds totalled $3.25 billion made up of $1.75 billion 30 year unsecured MTN due 2037 and $1.5 billion 10-year unsecured sukuk due In addition we have a fully drawn $3 billion syndicate loan facility due in October 2012 and $1.5 billion of debt at the subsidiary level. As at 31 December, leverage (net debt to EBITDA) was 4.2 times. The proceeds of the Australia monetisation were received on 11 March 2011 and will significantly reduce our net debt in 2011 and lower our leverage to below 3.5 times. This monetisation also ensures we are well positioned to repay the 2012 syndicate loan on or before maturity at the end of October 2012 and leaves us in a strong position with adequate flexibility around how we manage our balance sheet in the future. Mohammed Sharaf Chief Executive Officer Total equity increased to $8.5 billion from $8.0 billion at year end as a result of higher retained earnings and more favourable currency movements than in the prior year. 17


20 Board of Directors Sultan Ahmed Bin Sulayem Chairman Sultan Ahmed Bin Sulayem has served as Chairman of the Board of the Company since 30 May He was previously Chairman of Dubai World and in this role oversaw businesses in industries as diverse as real estate development, hospitality, retail, e-commerce and various commodities exchanges, as well as those associated with transportation and logistics. He has more than 25 years experience in the marine terminal industry, is Chairman of Port & Free Zone World FZE and is a leading Dubai and international businessman. A citizen of the United Arab Emirates, he is 55 years old. Jamal Majid Bin Thaniah Non-Executive Director and Vice Chairman Jamal Majid Bin Thaniah has served as a Director and Vice Chairman of the Company since 30 May 2007 and became a Non-Executive Director on 27 October. He joined Dubai Ports in 1981 and, from 2001, led Dubai Ports Authority. He is the Group Chief Executive Officer of Port & Free Zone World, and in this role he oversees P&O Ferries and Economic Zones World, which includes Jebel Ali Free Zone. He also serves as Vice Chairman of Istithmar World Holdings LLC and Istithmar World PJSC and as a Non-Executive Director of Etihad Rail (Abu Dhabi). A citizen of the United Arab Emirates, he is 52 years old. Sir John Parker ΔΦ Senior Independent Non-Executive Director and Vice Chairman Sir John Parker has served as an Independent Non- Executive Director and Vice Chairman of the Company since 30 May He also acts as Senior Independent Director and is Chairman of the Company s Nominations and Governance Committee and Chairman of the Company s Remuneration Committee. He serves as Chairman of National Grid plc and Chairman of Anglo American plc. He is also Non-Executive Director of Carnival plc, Carnival Corporation and EADS Airbus. He previously served as Chair of the Court of the Bank of England, Non-Executive Chairman of BVT, Joint Chairman of Mondi plc, Non-Executive Director and Deputy Chairman and, subsequently, Chairman of P&O and as Vice Chairman of Port & Free Zone World. He was a Member of the Prime Minister s Business Council for Britain.A British Citizen, he is 68 years old. Mohammed Sharaf Chief Executive Officer Mohammed Sharaf has served as Chief Executive Officer of the Group since 2005 and as a Director of the Company since 30 May He joined Dubai Ports Authority in 1992, and in 2001 he became Managing Director of DP World FZE. In this position, he oversaw the Group s growth into an international business and performed central roles in developing its first international operations at the terminals of Jeddah (Saudi Arabia), Constanta (Romania) and Vizag (India) and in developing its national operations at Jebel Ali and Port Rashid terminals. He began his shipping career at Holland Hook terminal in The Port of New York/New Jersey and has more than 20 years experience in the transport and logistics business. He is also Chairman of Tejari World FZ LLC.A citizen of the United Arab Emirates, he is 49 years old. 18


21 BUSINESS overview corporate governance FINANCIAL STATEMENTS Cho Ying Davy Ho ΔΦ Independent Non-Executive Director Cho Ying Davy Ho has served as an Independent Non- Executive Director of the Company since 30 May Having retired from many of his Swire Group positions, he continues to serve as Director of several Swire Group entities relating to properties and cold storage. He previously served as Director of Cathay Pacific Airways Limited, Modern Terminals Ltd. and Shekou Container Terminals Ltd. and as Chairman of the Shipping Committee of the Hong Kong General Chamber of Commerce. A British citizen, he is 63 years old. Yuvraj Narayan Chief Financial Officer Yuvraj Narayan has served as Chief Financial Officer of the Group since 2005 and as a Director of the Company since 9 August He joined DP World FZE in He serves as Non-Executive Director of Istithmar World PJSC and Non-Executive Director of IDFC Securities Limited. He previously served as ANZ Group s Head of Corporate and Project Finance for South Asia before becoming Chief Financial Officer of Salalah Port Services in Oman. He is a qualified Chartered Accountant and has a wealth of experience in the ports and international banking sectors. A citizen of the Republic of India, he is 54 years old. David Williams ΔΦ Independent Non-Executive Director David Williams has served as an Independent Non- Executive Director of the Company since 30 May He is also Chairman of the Company s Audit Committee. He is currently Joint Chairman of Mondi plc, a Non-Executive Director of Tullow Oil plc and Senior Independent Non-Executive Director of Meggitt plc. He previously served as a Non-Executive Director of P&O and Senior Independent Non-Executive Director of both Taylor Wimpey plc and George Wimpey plc. He has also served as a Non-Executive Director of Dewhirst Group plc and Medeva plc and as Finance Director of Bunzl plc. He is a qualified Chartered Accountant. A British Citizen, he is 65 years old. Member of the Nominations and Governance Committee Member of the Executive Committee Δ Member of the Audit Committee Φ Member of the Remuneration Committee 19
22 Report of the Directors The Directors present their report and accounts for the year ended 31 December. Principal activities The Business Overview on pages 2 to 17 describes the principal activities, operations, performance and financial position of the Group. The results of the Group are set out in detail on pages 30 to 37 and in the accompanying notes. The principal subsidiaries, joint ventures and associates are listed on pages 87 to 90. Principal changes in the group In January DP World announced its decision to proceed with construction of essential infrastructure that lays the foundation of the London Gateway facility. It acquired the remaining 1,000 acres of land for the London Gateway and Logistics Park and Shell s remaining interests in the project. DP World s new terminal in Callao, Peru, the largest on South America s west coast, officially opened for business at the end of the first half of. In June DP World s concession for the port of Maputo, Mozambique was extended for a further 15 years to 2033 with an option to extend for a further ten years. In October DP World entered into an agreement with the Red Sea Ports Authority to expand capacity at the new terminal at Sokhna Port, Egypt to more than double the terminal s existing capacity. As announced in December and completed in March 2011, DP World and Citi Infrastructure Investors (CII), together with one of CII s major investors, announced their intention to form a strategic partnership in relation to DP World s five marine terminals in Australia. The strategic partnership, which formed a new joint venture company on completion of the transaction in March 2011, saw DP World monetise 75% of its shares whilst retaining a 25% shareholding in the new joint venture. The total proceeds of the transaction amount to A$1,483 million (USD 1,475 million). In addition, DP World has a long term agreement to provide management services to the Australian operation. The first quarter of 2011 saw the opening of two new terminals, Terminal 2 at Port Qasim, Pakistan and Vallarpadam terminal at Cochin, India. Directors Details of the current Directors of the Company are given on pages 18 and 19 including their biographies and the dates of their appointment. The Company will seek approval of the appointment of Deepak Parekh as an Independent Non-Executive Director of the Company effective as from 22 March 2011 at the AGM to be held on 11 May In accordance with the existing Articles of Association, Directors would normally submit themselves for re-appointment by shareholders at the first Annual General Meeting (AGM) following their initial appointment to the Board and then at subsequent AGMs at least once every three years. In accordance with best practice guidelines, all Directors will offer themselves for re-appointment at the forthcoming AGM and will seek re-appointment annually thereafter. Details of the Directors remuneration and their interests in shares is given on pages 26 and 27 in the Corporate Governance Section of this Report. Financial instruments Details on the use of financial instruments and financial risk management are included in the Notes to Consolidated Financial Statements on pages 80 to 86. Results The Group s Consolidated Financial Statements for the year ended 31 December are shown on pages 30 to 37. Dividends The Directors recommend a final dividend in respect of the year ended 31 December of 0.86 of a US cent per share. Subject to approval by shareholders, the final dividend will be paid on 16 May 2011 to shareholders on the Register at close of business on 7 April Post-balance sheet events These events are disclosed in the Notes to Consolidated Financial Statements on page 90. Employees Our team of around 30,000 people continues to be as diverse as the communities and countries in which we operate. While we adhere to local labour regulations and statutes, we emphasise that we are one Company seeking common goals. To reinforce this, we implement where possible common approaches to reward, performance management and succession planning. These approaches are automatically applied to our top 110 employees (as determined by job size) and all terminal general managers. We use these frameworks to facilitate the delivery of business objectives and our values. For example, at local level at least one of the objectives that earns bonus must be linked to a safety measure. We apply our performance management process in a way that cascades the annual corporate business goals throughout the organisation. Our keen focus on learning and development is delivered through our DP World Institute. The Institute s programmes include a focus on operational and technical disciplines as well as leadership and individual development. Over 700 employees participated in the programmes during. 20
23 BUSINESS overview corporate governance FINANCIAL STATEMENTS Corporate social responsibility Environment In October, the Company became the first international terminal operator to join the renowned Carbon Disclosure Project, established since 2000, as a disclosure and reporting framework used by 3,000 of the world s largest companies to report their GHG emissions and climate change strategies. Community interaction Port operations are integral to the local community. The Company supports many forms of social and community programmes designed to engage with our workforce, stakeholders and local communities beyond the terminal boundary. All our initiatives add value to the Company today and in the future as those communities we are supporting today provide our employees for the future. Substantial shareholdings As at the date of this report, the Company has been notified that the following entity has an interest in the Company s shares amounting to 5% or more. Class Shares Percentage of class Port & Free Zone World FZE Ordinary 13,354,700, Going concern The Directors, having made enquiries, consider that the Company and the Group have adequate resources to continue in operational existence for the foreseeable future and therefore they consider it appropriate to adopt the going concern basis in preparing the accounts. Further details can be found under Note 2(c) to the consolidated financial statements. Audit information Having made the requisite enquiries, so far as the Directors in office at the date of the signing of this report are aware, there is no relevant audit information of which the auditors are unaware and each Director has taken all reasonable steps to make themselves aware of any relevant audit information and to establish that the auditors are aware of that information. Creditor payment policy The policy is to pay suppliers in accordance with terms and conditions agreed when the orders are placed. The international nature of the Group means that the Group adopts policies applicable to the jurisdictions of its operations. Articles of Association The Company s Articles of Association (the Articles ) set out the internal regulation of the Company and cover such matters as the rights of shareholders, the appointment and removal of Directors and the conduct of the Board and general meetings. Subject to DIFC Companies Law and the Articles, the Directors may exercise all the powers of the Company, and may delegate authorities to Committees and day-to-day management and decision making to individual Executive Directors. Details of the main Board Committees can be found on pages 23 to 25. Further to the Company s announcement of its commitment to seek a dual listing of its shares on the London Stock Exchange, shareholder approval will be sought at the AGM to be held on 11 May 2011 for the Company, conditional on the admission of the Company s entire issued share capital to (i) the Official List of the UK Financial Services Authority; and (ii) trading on the London Stock Exchange ( Admission ), to adopt amended articles of association to reflect certain aspects of the UK regulatory regime which will be applicable to the Company on Admission and to accommodate the use of depository interests to enable shareholders to settle and pay for interests in the Company s shares through the CREST trading system. Indemnity All Directors are entitled to indemnification from the Company to the extent permitted by the law against claims and legal expenses incurred in the course of their duties. Authority to purchase shares At the Company s AGM on 26 April, the Company was authorised to make market purchases of up to 581,000,000 ordinary shares (representing approximately 3.5% of the Company s issued share capital). No such purchases were made during. Shareholders will be asked to approve the renewal of a similar authority at the Company s AGM to be held on 11 May Auditors The auditors, KMPG LLP, have indicated their willingness to continue in office. A resolution to re-appoint them as auditors will be proposed at the AGM to be held on 11 May Share capital As at 31 December, the Company s issued share capital was US$1,660,000,000 comprising 16,600,000,000 ordinary shares of US$0.10 each. Annual General Meeting ( AGM ) DP World s AGM will be held on 11 May 2011 at The Wheelhouse, Jebel Ali Port, Dubai, United Arab Emirates. Full details are set out in the Notice of AGM. By order of the Board B Allinson Board Legal Adviser and Company Secretary 23 March
24 Corporate governance The Company is registered in the Dubai International Financial Centre (DIFC). During the financial year ended 31 December, the Company complied in all material respects with the corporate governance requirements applicable to it. The following is an explanation of the Company s corporate governance policies. Directors The Board of seven Directors manages the Company s business. The primary responsibility of the Board is to foster the long-term success of the Company. The Board is ultimately responsible for the management and is accountable for all operations of the Company. The Board met 11 times during the year either in person or via telephone or video conference. In addition, written resolutions (as provided by the Articles) were used as required for the approval of decisions that exceeded the delegated authorities provided to Executive Directors and Committees. Although there is a prescribed pattern of presentation to the Board, including matters specifically reserved for the Board s decision (which include strategy; the annual budget; dividends; major transactions; health, safety and environment policies; insurance and risk management; and internal controls), all Board meetings tend to have further subjects for discussion and decision taking. Board papers, including an agenda, are sent out in advance of the meetings. Board meetings are discursive in style and all Directors are encouraged to offer their opinions. The Board has delegated the following responsibilities to the management: the development and recommendation of strategic plans for consideration by the Board that reflect the longer term objectives and priorities established by the Board; implementation of the strategies and policies of the Group as determined by the Board; monitoring of the operating and financial results against plans and budgets; monitoring the quality of the investment process against objectives, prioritising the allocation of capital and technical resources; and developing and implementing risk management systems subject to the continuing oversight of the Board and the Audit Committee as set out on page 23. Details of the Directors of the Company are given on pages 18 and 19. The Board met 11 times during the year. Attendance at meetings during was as follows: Name Attendance Sultan Ahmed Bin Sulayem 9 of 11 Jamal Majid Bin Thaniah 9 of 11 Mohammed Sharaf 11 of 11 Yuvraj Narayan 11 of 11 Sir John Parker 10 of 11 David Williams 11 of 11 Cho Ying Davy Ho 10 of 11 Independent Non-Executive Directors Over one third of the Board comprises Independent Non-Executive Directors. The three Independent Non- Executive Directors ensure that the interests of minority shareholders are fairly and objectively represented. In order for the Independent Non-Executive Directors to contribute fully to the Board, and in particular to challenge the Executive Directors over strategic matters where appropriate, it is important that the Independent Non Executive Directors bring experience, probity and independence to the Board. Accordingly, the independence of the Independent Non-Executive Directors is considered annually. The Board believes the Independent Non-Executive Directors have retained independent character and judgement. The board considers that the varied and relevant experience of all the Independent Directors combines to provide an exceptional balance of skills and knowledge which is of great benefit to the Company. Roles of the Chairman, Chief Executive Officer and Senior Independent Director The positions of Chairman and Chief Executive Officer are held by separate individuals with separate roles and responsibilities which have been approved by the Board. The Chairman, in conjunction with the Senior Independent Director (SID) is responsible for leadership and effective management of the Board in all aspects of its role and its governance. The Chairman chairs the Board meetings ensuring, with the support of the SID, that the agendas are forward looking and that relevant business is brought to the Board for consideration in accordance with the schedule of matters reserved to the Board and that each Director has the opportunity to consider the matter brought to the meeting and to contribute accordingly. The Chief Executive Officer, as leader of the Company s executive team, retains responsibility for the leadership and day-to-day management of the Company and the execution of its strategy as approved by the Board. Sir John Parker has acted as SID since the IPO of the Company in His responsibilities include supporting the Chairman in the leadership of the Board and meeting with the Non-Executive Directors at least once a year to appraise the Chairman s performance and holding discussions with the Non-Executive Directors without the Executives present. He is also available to shareholders if they have concerns which contact through the normal channels of Chairman, Chief Executive Officer or Chief Financial Officer has failed to resolve or for which such contact is inappropriate. Board performance The Board has continued to build and develop its systems for the formal evaluation of its own performance and that of its Committees and individual Directors. The Senior Independent Director, Sir John Parker, assisted by the Board Legal Adviser and Company Secretary, led the evaluation process which was in the form of confidential interviews and a confidential survey completed by all the Directors in relation to the Board and all Committees of 22
25 BUSINESS overview corporate governance FINANCIAL STATEMENTS which they are a member. The Board survey focused on a number of key areas including Board processes, composition and size, content of Board meetings, role contribution and evaluation of Directors, information flow from and to management, relations with shareholders, strategy, induction, training and succession planning. The Board Legal Adviser and Company Secretary collated the survey results and incorporated these into an action plan for The results showed improvement on the previous year s Board and Board Committee performance. However, actions to be addressed over the coming year include: Training needs for individual Directors should be formally established on an annual basis; Improve and strengthen succession planning; Enhancement of the Non-Executive Directors familiarity and interaction with terminal operations. The Board will consider an independent review of its effectiveness once every three years as recommended by the UK Corporate Governance Code. All Directors have access to the Board Legal Adviser and Company Secretary and independent professional advice at the Company s expense, if necessary. Relations with shareholders The Company follows a policy of open communication with institutional and retail shareholders. As part of this effort, the Executive Directors regularly meet with analysts and investors and participate in conferences and road shows that attract prominent members of the international financial community. The SID is also available to shareholders in the event they feel it inappropriate to communicate via the Chairman, Chief Executive Officer or Chief Financial Officer. The Company holds an AGM open to all shareholders. The Company is committed to providing every investor with an annual report via the DP World website. The Company regularly updates the website with news and complies with applicable regulatory requirements regarding the release of pricesensitive information to NASDAQ Dubai with respect to the equity, bond and Sukuk listing and the London Stock Exchange with respect to the bond and Sukuk listing. Accountability The Board is responsible for the Group s system of internal control and for reviewing its effectiveness. The internal control system is designed to manage rather than eliminate the risk of failure to achieve business objectives, and can only provide reasonable and not absolute assurance against material mis-statement or loss. The system of internal control described below has been in place throughout the year. Board committees The Board has Remuneration, Audit and Nominations and Governance Committees, with formally delegated duties and responsibilities and written terms of references. The Board has also established an Executive Committee which is an operational committee to manage the Company s operations and to implement the strategic policies approved by the Board. From time to time, separate committees may be set up by the Board to consider specific issues when the need arises. Audit Committee The Audit Committee assists the Board in discharging its responsibilities with regard to financial reporting, external and internal audits and controls, including reviewing the Company s annual financial statements, reviewing and monitoring the extent of the non-audit work undertaken by external auditors, advising on the appointment of external auditors and reviewing the effectiveness of the Company s internal audit activities, internal controls and risk management systems. The ultimate responsibility for reviewing and approving the annual report and accounts and the half-yearly reports remains with the Board. The membership of the Audit Committee is composed of three members, all of whom are Independent Non-Executive Directors (namely Sir John Parker, David Williams and Cho Ying Davy Ho). The Audit Committee is chaired by David Williams whom the Board considers has appropriate financial expertise to fulfil this role. The Audit Committee meets formally at least four times a year and otherwise as required. Attendance at meetings was as follows during from a total of 4 meetings: Name Attendance Sir John Parker 3 of 4 David Williams 4 of 4 Cho Ying Davy Ho 4 of 4 In accordance with its terms of reference, the principal matters considered by the Audit Committee during included: A review of the level and constitution of external audit and non-audit fees and the independence and objectivity of external auditors; Monitoring and reviewing the effectiveness of internal audit activities, including discussions with the Vice President Internal Audit; Reviewing the effectiveness of the Company s financial reporting, internal controls and compliance with applicable legal requirements and monitoring risk and compliance procedures across the Company; Reviewing the Company s results statements, interim management statements and Annual Report and Accounts before publication and making appropriate recommendations to the Board following review; Reviewing accounting policies in light of international accounting developments; Receiving reports where appropriate in accordance with its terms of reference on business conduct issues, including any instances of alleged fraud and actions taken as a result of investigation. External and internal auditors are invited to attend the Audit Committee meetings, along with any other Director or member of staff considered necessary by the Committee to complete its work. The Committee meets 23
26 with external auditors and internal auditors without Executive Directors or members of staff present, as it considers appropriate (and at least once a year). The Audit Committee s remit includes the following: to review the form and content of the financial statements to be presented to shareholders of the Company at the half year and at the year end, and any other public announcement concerning the Company s financial position and if necessary, to challenge the actions and judgements of management in relation to them; to keep under review the scope and results of the external audit and the independence, effectiveness, resources and objectivity of the auditors; to review the effectiveness of the system of risk management and at least annually to carry out a review of the effectiveness of the system of internal controls and the process of risk management; to review management and internal audit reports on the effectiveness of the system of internal financial control including the year end financial reporting process and the Company s procedures for investigating concerns raised by members of staff, and to report its findings to the Board; to receive reports from the internal audit department and to monitor the quality of the department s work, ensuring that it was adequately resourced. Independence of external auditors The Audit Committee is responsible for recommending a firm of auditors of appropriate independence and experience and for the approval of all audit fees and terms of engagement. The committee s policy is to undertake a formal assessment of the auditors independence each year which includes: a review of non-audit services provided to the Group and related fees; discussion with the auditors of a written report detailing any relationships with the Company and any other parties that could affect independence or the perception of independence; a review of the auditors own procedures for ensuring the independence of the audit firm and partners and staff involved in the audit, including the regular rotation of the audit partner; and obtaining written confirmation from the auditors that, in their professional judgement, they are independent. The Audit Committee has implemented procedures relating to the provision of non-audit services by the Company s auditors. These include: the maintenance of a schedule of certain non-audit services, including consultancy and investment banking services; requiring the selection of providers of permitted non-audit services to be subject to a tender process, where appropriate; and requiring non-audit work and the fees involved to be approved in advance by the audit committee. KMPG LLP are appointed as external auditors to the Company and have confirmed their independence. Risk management process The Group risk management process, on which the review of effectiveness of the system of internal control and risk management is based, has the following key features: Through a series of interviews, management discussions and risk assessment workshops, all major businesses within the Group determine the most significant risks to the achievement of their business objectives. Appropriate risk management activity is then determined and any required action plans are implemented. This is a continual process, and may be associated with a variety of financial, operational and compliance matters including organisation structures, business strategies, disruption in information technology systems, competition, natural catastrophe and regulatory requirements; The risks and associated controls are summarised in the risk portfolios and are presented to the Board for review; At the year end, the regional management certifies that the risk management process is in place and an assessment has been conducted throughout their businesses and that appropriate internal control procedures are in place or in hand to manage the risks identified. Further details on the Risk Management Process can be found under Note 5 to the consolidated financial statements. Internal control The Board is responsible for maintaining a sound system of internal control and has established a control framework within which the Group operates and the Audit Committee has undertaken a review of the effectiveness of internal controls and process of risk management in accordance with its remit. The principal features and key high level control procedures include: An organisation structure which supports clear lines of communication and accountability and delegation of authority rules which specify responsibility; Business strategies are prepared at regional level and are approved by the Board. In addition, there are annual budgeting and strategic planning processes. Financial forecasts are prepared every quarter. Actual performance is compared to budget, latest forecast and prior year on a monthly basis. Significant variances are investigated and explained through normal monthly reporting channels; Key performance indicators are produced to summarise and monitor business activity; Evaluation and approval procedures for major capital expenditure and significant treasury transactions; Regular reviews of the effectiveness of the Group s health, safety, welfare, environment and security processes; The internal audit department provides additional assurance to the Board and the audit committee that key controls are operating as intended. The risk management process and the system of internal control are subject to continuous improvement. 24
27 BUSINESS overview corporate governance FINANCIAL STATEMENTS Nominations and Governance Committee The Nominations and Governance Committee assists the Board in discharging its responsibilities relating to the size and composition of the Board. It is also responsible for periodically reviewing the Board s structure and identifying potential candidates to be appointed as Directors as the need may arise. The Nominations and Governance Committee is responsible for evaluating the balance of skills, knowledge, experience and diversity on the Board and, in particular: identifying individuals qualified to become Board members; recommending individuals to be considered for election at the next Annual General Meeting of the Company or to fill vacancies and; preparing a description of the role and capabilities required for a particular appointment. The Nominations and Governance Committee is composed of five members, three of whom are Independent Non- Executive Directors (namely Sir John Parker, David Williams and Cho Ying Davy Ho) one of whom is a nonindependent Non-Executive Director (namely Jamal Majid Bin Thaniah) and one of whom is an Executive Director (namely Mohammed Sharaf). The chairman of the Nominations and Governance Committee is Sir John Parker. The Nominations and Governance Committee meets formally at least twice a year and otherwise as required. The Nominations and Governance Committee held 2 meetings in. Attendance at meetings during was as follows: Name Attendance Jamal Majid Bin Thaniah 2 of 2 Mohammed Sharaf 2 of 2 Sir John Parker 2 of 2 David Williams 2 of 2 Cho Ying Davy Ho 2 of 2 Remuneration Committee The Remuneration Committee determines and agrees with the Board the framework and broad policy for the remuneration of the Chief Executive Officer and Chief Financial Officer and other members of executive management. The policy of the Committee is to review remuneration on independent assessment and market practice. The remuneration of Independent Non-Executive Directors is a matter for the Chairman and executive members of the Board. No executive is involved in any decisions as to their own remuneration. The Remuneration Committee: determines and agrees with the Board, the Company s framework for remuneration; recommends and monitors the level and structure of remuneration to senior management; keeps under review its own performance, constitution and terms of reference; and considers other matters as referred to it by the Board. The membership of the Remuneration Committee is composed of three members, all of whom are Independent Non-Executive Directors (namely Sir John Parker, David Williams and Cho Ying Davy Ho). The chairman of the Remuneration Committee is Sir John Parker. The Remuneration Committee meets formally at least twice a year and otherwise as required. The Remuneration Committee held 5 meetings in. Attendance at meetings during was as follows: Name Attendance Sir John Parker 5 of 5 David Williams 5 of 5 Cho Ying Davy Ho 5 of 5 Executive Committee The Executive Committee has been in place since 2007 as an advisory Committee and was formally constituted as a Committee of the Board in February The Executive Committee has primary responsibility for the day-to-day management of the Company s operations and strategic policy implementation (such policies being established and approved by the Board). Matters for the consideration of the Executive Committee include: the financial, operational and safety performance of the Company and its businesses; development of strategy for consideration of the Board; implementation of Board strategy; consideration of bids to be submitted; approving expenditure and other financial commitments under the specific authorities delegated to it by the Board; adequacy and effectiveness of internal control and risk management for consideration by the Audit Committee and the Board; relations with shareholders and other key stakeholders, including staff, environmental interests and the media. The Executive Committee is composed of each of the Executive Directors, Mohammed Sharaf and Yuvraj Narayan and Senior Managers Anil Wats, Mohammed Al Muallem, Peter Wong and Anwar Wajdi*. The Executive Committee meets formally at least four times a year and otherwise as required. The Executive Committee held five meetings in. Attendance at meetings during was as follows: Name Attendance Mohammed Sharaf 5 of 5 Yuvraj Narayan 4 of 5 Anil Wats 5 of 5 Mohammed Al Muallem 4 of 5 Peter Wong 4 of 5 * Anwar Wajdi was appointed to the Executive Committee in February
28 Guidelines regarding insider trading The Company takes all reasonable steps to avoid the risk of insider trading. The Company has adopted processes to keep all members of staff informed about their duties with respect to handling of inside information, as well as dealings in DP World s shares. The Company has adopted a share dealing code which sets out the restrictions and close periods applicable to trading in securities. Memoranda and guidelines regarding dealings (either selling or buying) in shares have been circulated within the Company. The share dealing code applies to the Directors, Senior Managers and certain other of the Company s employees. Fraud The Company has a Fraud policy and a Fraud Incident Response Plan, which takes effect in the event of serious incidents to oversee case management and to ensure appropriate actions are taken. The Audit Committee receives an update at each meeting on all material frauds. The Audit Committee has reviewed the Company s whistle blowing procedures to ensure that arrangements are in place to enable company employees to raise concerns about possible improprieties on a confidential basis. Remuneration Executive reward policy The Company s reward policy for Executive Directors and senior management (Executive Committee and other experienced managers) is designed to allow the business to attract and retain top talent to deliver business goals and shareholder value. The fixed remuneration, allowances and benefit components reflect local practice in each of the geographies in which the Company operates, but are also set against common market policy positions. The variable component of the reward is standard across all geographies by job size, and reflects both business and individual performance. For Executive Directors and senior management based in Dubai, practice and policy reflect the structure of the Dubai pay market, whilst at the same time ensuring competitiveness on an international basis. Our target market position is between median and upper quartile on a total remuneration basis, with business performance above target rewarded through both short-term and long-term incentive plans. The overriding reward policy principal is to align reward against performance. The Company s annual incentive scheme therefore combines business financial performance and individual performance objectives. The three year rolling Long Term Incentive Plan (LTIP) reflects corporate financial performance measures only. Due to the maturity of the Company and the nature of the current stock market listing, all variable bonus plans are cash based. The Remuneration Committee reviews incentive schemes and their design on an annual basis. Base salaries are reviewed annually and take account of market pay movements, individual performance, relativity to market on an individual basis and the Company s ability to pay. Executive Directors service contracts and remuneration The Executive Directors remuneration structure follows the market practice in the UAE, and all payments are made tax free reflecting the UAE s status. Each of the Executive Directors is employed pursuant to a service agreement with the Group. Mohammed Sharaf Mohammed Sharaf s service agreement is with DP World FZE (a subsidiary of the Company). It can be terminated on six months notice by either party. In addition, DP World FZE can terminate the agreement, without notice, on payment of six months base salary. Mohammed Sharaf is entitled to receive a base salary and certain other benefits under his service agreement. His total remuneration for the year ended 31 December (which includes his base salary and these other benefits) was $988,427. Yuvraj Narayan Yuvraj Narayan s service agreement is with DP World FZE. It can be terminated on six months notice by either party. In addition, DP World FZE can terminate the agreement, without notice, on payment of six months base salary. Yuvraj Narayan is entitled to receive a base salary and certain other benefits under his service agreement. His total remuneration for the year ended 31 December (which includes his base salary and these other benefits) was $770,764. Incentive plans The Company has adopted a short-term and a long-term incentive plan for its Executive Directors and Senior Managers. The Company s short-term annual incentive plan, the Performance Delivery Plan, is based on performance against EBITDA and against individual objectives. The EBITDA component is worth 70% of the overall bonus value. The objectives, which are worth 30% of the overall bonus value, are particular to each individual role and can include financial based objectives and more qualitative ones. For the financial year ended, the bonus was worth a maximum of 75% of annual basic salary. The Performance Delivery Plan s financial component for the year 2011 has been reviewed from EBITDA to a Profit After Tax (PAT) measure with maximum bonus potential remaining the same as in. The Company operates a similar short-term scheme for the other members of senior management with awards varying in line with job size and geographies. This is then typically cascaded throughout the business units organisational levels in line with local policies. 26
29 BUSINESS overview corporate governance FINANCIAL STATEMENTS The Company s LTIP is based on a three year performance cycle and is a cash-based plan. The cycle is based on net operating profit after tax (NOPAT) as the measure. The 2008-, and cycles are based on an earnings per share measure linked to performance against corporate EBITDA targets. For the Executive Directors and the Chief Operating Officer, the and cycles are worth a maximum of 75% of average annual basic salary while the and cycles are worth a maximum of 100% of average annual basic salary. For other Senior Managers, the and cycles are worth a maximum of 50% of average annual basic salary while the and cycles are worth a maximum of 75% of average annual basic salary. The cycle has also been reviewed in line with the strategic direction of the Company and is based on two measures: 70% linked to a Return On Capital Employed (ROCE) measure and 30% linked to the same earnings per share measure described above. The maximum bonus potential remains the same as in the cycle. In addition to the Executive Directors and Senior Managers, employees performing the top 110 jobs (as determined by job size) are also eligible to participate in the LTIP in line with the same financial metrics as described for Executive Directors and Senior Managers above with varying levels of award in line with their job size. Sir John Parker received a Non-Executive Director fee of $463,394. David Williams received a Non-Executive Director fee of $123,572. Cho Ying Davy Ho received a Non-Executive Director fee of $100,370. The Non-Executive Directors are remunerated in GBP. The average GBP to USD rate in was (in : 1.566). The Chairman, Sultan Ahmed Bin Sulayem, and Non-Executive Vice Chairman, Jamal Majid Bin Thaniah are not remunerated by the Company. Directors interests in shares The following is a table of the Directors shareholdings: Shares held as at 1 Jan Shares held as at 31 Dec Change Mohammed Sharaf 564, ,431 Yuvraj Narayan 293, ,364 Sir John Parker 145, ,240 Post retirement benefits Mohammed Sharaf participates in the government pension scheme in line with local labour law. Yuvraj Narayan participates in an end of service benefit scheme in line with local labour law. Non-Executive Directors letters of appointment and fees The Non-Executive Directors do not have service contracts with the Company. Their terms of appointment are governed by letters of appointment. The Company has no contractual obligation to provide any benefits to any of the Non-Executive Directors upon termination of their directorship. Each Non-Executive Director s letter of appointment is with the Company and for a fixed term of three years. It can be terminated on six months notice by either party. Each Director is subject to annual re-election by the Shareholders at each AGM. For the year ended 31 December, the fees and other remuneration payable by the Company to each of the Non-Executive Directors, which includes remuneration for their services in being a member of, or chairing, a Board Committee are set out below: 27
30 Statement of Directors responsibilities in respect of the preparation of the consolidated financial statements The following statement, which should be read in conjunction with the Auditors responsibility section of the Independent auditors report, is made with a view to distinguishing the respective responsibilities of the Directors and of the Auditors in relation to the consolidated financial statements. The Directors are required to prepare consolidated financial statements for each financial year which give a true and fair view of the state of affairs of DP World Limited ( the Company ) and its subsidiaries (collectively referred to as the Group ) as at the end of the financial year and of the profit and loss for the financial year. The consolidated financial statements are prepared in accordance with International Financial Reporting Standards. In preparing the consolidated financial statements, the Directors are required to select appropriate accounting policies and then apply them consistently, make judgements and estimates that are reasonable and prudent and state whether all accounting standards which they consider to be applicable have been followed, subject to any material departures disclosed and explained in the consolidated financial statements. The Directors also use a going concern basis in preparing the consolidated financial statements unless this is inappropriate. The Directors have responsibility for ensuring that the Company keeps accounting records which disclose with reasonable accuracy at any time the financial position of the Company and which enable them to ensure that the consolidated financial statements comply with the applicable laws in the relevant jurisdiction. The Directors have general responsibility for taking such steps as are reasonably open to them to safeguard the assets of the Group and to prevent and detect fraud and other irregularities. 28
31 Business Review corporate governance FINANCIAL STATEMENTS Independent auditors report The Shareholders DP World Limited Report on the consolidated financial statements We have audited the accompanying consolidated financial statements of DP World ( the Company ) and its subsidiaries (collectively referred to as the Group ), which comprise the consolidated statement of financial position as at 31 December, and the consolidated statement of comprehensive income (comprising a separate consolidated income statement and a consolidated statement of comprehensive income), consolidated statements of changes in equity and cash flows for the year then ended, comprising a summary of significant accounting policies and other explanatory notes information. Management s responsibility for the financial statements Management is responsible for the preparation and fair presentation of these consolidated financial statements that give a true and fair view in accordance with International Financial Reporting Standards, and for such internal control as management determines is necessary to enable the preparation of consolidated financial statements that are free from material mis-statement, whether due to fraud or error. Auditors responsibility Our responsibility is to express an opinion on these consolidated financial statements based on our audit. We conducted our audit in accordance with International Standards on Auditing. Those standards require that we comply with relevant ethical requirements and plan and perform the audit to obtain reasonable assurance about whether the consolidated financial statements are free of material mis-statement. An audit involves performing procedures to obtain audit evidence about the amounts and disclosures in the consolidated financial statements. The procedures selected depend on our judgment, including the assessment of risks of material mis-statement of the consolidated financial statements, whether due to fraud or error. In making those risk assessments, we consider internal control relevant to the entity s preparation and fair presentation of the consolidated financial statements in order to design audit procedures that are appropriate in the circumstances, but not for the purpose of expressing an opinion on the effectiveness of the entity s internal control. An audit also includes evaluating the appropriateness of accounting policies used and reasonableness of accounting estimates made by management, as well as evaluating the overall presentation of the consolidated financial statements. We believe that the audit evidence we have obtained is sufficient and appropriate to provide a basis for our audit opinion. Opinion In our opinion, the consolidated financial statements give a true and fair view of the consolidated financial position of the Group as at 31 December, and of its consolidated financial performance and its consolidated cash flows for the year then ended in accordance with International Financial Reporting Standards. KPMG LLP Dubai 29
32 Consolidated income statement for the year ended 31 December Notes Year ended 31 December Year ended 31 December Before separately disclosed items Separately disclosed items (Note 11) Total Before separately disclosed items Separately disclosed items (Note 11) Total Revenue from operations 7 3,078, ,865 3,188,941 2,821, ,212 2,929,229 Cost of sales (2,126,965) (110,865) (2,237,830) (1,956,008) (108,212) (2,064,220) Gross profit 951, , , ,009 General and administrative expenses (329,576) (3,700) (333,276) (284,551) (20,755) (305,306) Other income 20,324 8,905 29,229 19,117 3,000 22,117 Share of profit from equity-accounted investees , ,447 71,307 (1,970) 69,337 Profit on sale/termination of business (net of tax) 11 13,200 13,200 44,276 44,276 Result from operating activities 782,062 18, , ,882 24, ,433 Finance income 9 89,395 89,395 72,950 12,542 85,492 Finance costs 9 (368,223) (17,583) (385,806) (356,728) (356,728) Net finance costs (278,828) (17,583) (296,411) (283,778) 12,542 (271,236) Profit before income tax 503,234 1, , ,104 37, ,197 Income tax expense 10 (53,174) (53,174) (54,441) 313 (54,128) Profit for the year 8 450,060 1, , ,663 37, ,069 Profit attributable to: Owners of the Company 373,741 1, , ,456 37, ,862 Non-controlling interests 76,319 76,319 37,207 37,207 Earnings per share ,060 1, , ,663 37, ,069 Basic and diluted earnings per share US cents The accompanying Notes 1 to 34 form an integral part of these consolidated financial statements. The independent auditors report is set out on page
33 company overview corporate governance FINANCIAL STATEMENTS Consolidated statement of comprehensive income for the year ended 31 December Notes Profit for the year 8 451, ,069 Other comprehensive income Effective portion of net changes in fair value of cash flow hedges (35,495) 26,652 Foreign exchange translation differences for foreign operations , ,603 Foreign exchange (loss)/profit recycled to consolidated income statement 500 (32,194) Net change in cash flow hedges reclassified to consolidated income statement 8,974 Net change in fair value of available-for-sale financial assets 16 1,139 13,745 Share in other comprehensive income of equity-accounted investees 500 Defined benefit plan actuarial gain/(losses) 24 55,100 (162,200) Income tax on other comprehensive income: Fair value of cash flow hedges 4,500 (1,700) Defined benefit plan actuarial gain/(losses) (1,100) 6,500 Other comprehensive income for the year, net of income tax 198, ,406 Total comprehensive income for the year 649, ,475 Total comprehensive income attributable to: Owners of the Company 588, ,075 Non-controlling interests 61,791 40, , ,475 1 This includes a significant portion of foreign exchange translation differences arising from the translation of goodwill and purchase price adjustments which are denominated in foreign currencies at the Group level. Furthermore, the translation differences arising on account of translation of the financial statements of foreign operations whose functional currencies are different from that of the Group s presentation currency on Group consolidation are also reflected here. There are no differences on translation from functional to presentation currency as the Companys functional currency is currently pegged to the presentation currency (refer to Note 2(d)). The accompanying Notes 1 to 34 form an integral part of these consolidated financial statements. The independent auditors report is set out on page
34 Consolidated statement of financial position as at 31 December Notes Assets Non-current assets Property, plant and equipment 12 5,086,217 4,859,200 Goodwill 13 1,670,301 2,424,689 Port concession rights 13 3,577,813 4,174,195 Investment in equity-accounted investees 15 3,474,113 3,453,833 Deferred tax assets 10 86, ,439 Other investments 16 65,868 65,289 Accounts receivable and prepayments 17 88,378 74,256 Total non-current assets 14,049,075 15,154,901 Current assets Inventories 52,797 59,700 Accounts receivable and prepayments , ,469 Bank balances and cash 18 2,519,616 2,910,066 Assets held for sale 28 2,084,840 28,400 Total current assets 5,310,469 3,805,635 Total assets 19,359,544 18,960,536 32
35 company overview corporate governance FINANCIAL STATEMENTS Consolidated statement of financial position continued as at 31 December Notes Equity Share capital 19 1,660,000 1,660,000 Share premium 20 2,472,655 2,472,655 Shareholders reserve 20 2,000,000 2,000,000 Retained earnings 1,823,491 1,584,804 Hedging and other reserves 20 (64,658) (49,864) Actuarial reserve 20 (249,700) (302,300) Translation reserve 20 40,074 (134,347) Total equity attributable to equity holders of the Company 7,681,862 7,230,948 Non-controlling interests 814, ,497 Total equity 8,495,926 8,037,445 Liabilities Non current liabilities Deferred tax liabilities 10 1,107,273 1,304,854 Employees end of service benefits 23 45,988 42,948 Pension and post-employment benefits , ,400 Interest bearing loans and borrowings 25 7,420,299 7,474,878 Accounts payable and accruals , ,763 Total non-current liabilities 9,116,612 9,438,843 Current liabilities Income tax liabilities 10 84, ,655 Bank overdrafts 18 3,000 11,500 Pension and post-employment benefits 24 14,500 45,400 Interest bearing loans and borrowings , ,091 Accounts payable and accruals , ,602 Liabilities held for sale ,193 Total current liabilities 1,747,006 1,484,248 Total liabilities 10,863,618 10,923,091 Total equity and liabilities 19,359,544 18,960,536 The accompanying Notes 1 to 34 form an integral part of these consolidated financial statements. The consolidated financial statements were authorised for issue on 23 March Mohammed Sharaf Chief Executive Officer Yuvraj Narayan Chief Financial Officer The independent auditors report is set out on page
36 Consolidated statement of changes in equity for the year ended 31 December Share capital Share premium Shareholders reserve Balance as at 1 January 1,660,000 2,472,655 2,000,000 Total comprehensive income for the year: Profit for the year Other comprehensive income: Foreign currency translation differences Foreign exchange recycled to consolidated income statement Effective portion of changes in fair value of cash flow hedges, net of tax Net changes in cash flow hedges recycled to consolidated income statement Net change in fair value of available-for-sale financial assets Defined benefit plan actuarial losses, net of tax Share in other comprehensive income of equity-accounted investees Total other comprehensive income Total comprehensive income for the year Transactions with owners, recorded directly in equity Dividends paid (refer to Note 21) Share-based payment transaction Total transactions with owners Transactions with non-controlling interests, recorded directly in equity Dividends paid Amounts contributed by non-controlling interests Total transactions with non-controlling interests Balance as at 31 December 1,660,000 2,472,655 2,000,000 Balance as at 1 January 1,660,000 2,472,655 2,000,000 Total comprehensive income for the year: Profit for the year Other comprehensive income: Foreign currency translation differences Foreign exchange recycled to consolidated income statement Effective portion of changes in fair value of cash flow hedges, net of tax Net change in fair value of available-for-sale financial assets Defined benefit plan actuarial losses, net of tax Total other comprehensive income Total comprehensive income for the year Transactions with owners, recorded directly in equity Dividends paid (refer to Note 21) Share based payment transactions Transfer of share based payments of previous year Transfer of other reserves Others Total transactions with owners Transactions with non-controlling interests, recorded directly in equity Dividends paid Amounts contributed by non-controlling interests Total transactions with non-controlling interests Balance as at 31 December 1,660,000 2,472,655 2,000,000 34
37 company overview corporate governance FINANCIAL STATEMENTS Retained earnings Attributable to equity holders of the Company Hedging and other reserves Actuarial reserve Translation reserve Total Non-controlling interests Total equity 1,584,804 (49,864) (302,300) (134,347) 7,230, ,497 8,037, , ,807 76, , , ,921 (9,250) 164, (24,317) (24,317) (6,678) (30,995) 8,974 8,974 8,974 1,139 1,139 1,139 52,600 52,600 1,400 54, (13,704) 52, , ,317 (14,528) 198, ,807 (13,704) 52, , ,124 61, ,915 (136,120) (136,120) (136,120) (1,090) (1,090) (1,090) (136,120) (1,090) (137,210) (137,210) (54,834) (54,834) (54,224) (54,224) 1,823,491 (64,658) (249,700) 40,074 7,681, ,064 8,495,926 1,366,482 (111,175) (153,300) (801,394) 6,433, ,994 7,173, , ,862 37, , , ,919 23, ,603 (32,194) (32,194) (32,194) 38,743 38,743 (13,791) 24,952 13,745 13,745 13,745 (149,000) (149,000) (6,700) (155,700) 52,488 (149,000) 668, ,213 3, , ,862 52,488 (149,000) 668, ,075 40, ,475 (114,540) (114,540) (114,540) 2,145 2,145 2,145 2,145 (2,145) (467) 467 5,000 5,000 5,000 (114,540) 8,823 (1,678) (107,395) (107,395) (17,474) (17,474) 43,577 43,577 26,103 26,103 1,584,804 (49,864) (302,300) (134,347) 7,230, ,497 8,037,445 35
38 Consolidated statement of cash flows for the year ended 31 December Notes Cash flows from operating activities Profit for the year 451, ,069 Adjustments for: Depreciation, amortisation and impairment 8 462, ,217 Net share of profit from equity-accounted investees (140,447) (69,337) Finance costs 9 385, ,728 Profit on sale of property, plant and equipment (866) (4,058) Net gain on sale of investment in subsidiaries and equity-accounted investees (13,200) (44,276) Finance income 9 (89,395) (85,492) Income tax expenses 10 53,174 54,128 Gross cash flow from operations 1,108, ,979 Change in inventories (265) (2,271) Change in accounts receivable and prepayments 69,811 (60,580) Change in accounts payable and accruals 169,132 (229,958) Change in provisions, pensions and post-employment benefits 10,115 (57,886) 1,357, ,284 Income taxes paid (82,139) (68,944) Net cash from operating activities 1,274, ,340 Cash flows from investing activities Additions to property, plant and equipment 12 (710,126) (828,234) Acquisition of land 12 (191,982) Proceeds from disposal of property, plant and equipment and port concession rights 16,169 11,755 Proceeds from sale of investment in subsidiaries 33,689 Proceeds from sale of investment in equity-accounted investees 16,834 43,711 Additions to port concessions rights 13 (226,606) (139,259) Interest received 79,217 75,636 Dividends received from equity-accounted investees 137, ,202 Additional investment in equity-accounted investees (16,535) (219,134) Net loan repaid by/(given to) equity-accounted investees 25,200 (40,853) Net cash used in investing activities (870,614) (915,487) 36
39 Business Review corporate governance FINANCIAL STATEMENTS Consolidated statement of cash flows continued for the year ended 31 December Notes Cash flows from financing activities Repayment of interest bearing loans and borrowings (617,517) (168,215) Drawdown of interest bearing loans and borrowings 439,748 2,600,020 Dividend paid to the owners of the Company (136,120) (114,540) Amounts contributed by non-controlling shareholders ,786 Interest paid (358,899) (357,204) Dividends paid to non-controlling shareholders (54,834) (17,474) Net cash (used in)/from financing activities (727,012) 1,963,373 Net (decrease)/increase in cash and cash equivalents (322,684) 1,620,226 Cash and cash equivalents as at 1 January 2,898,566 1,154,145 Effect of exchange rate fluctuations on cash held (8,366) 124,195 Cash and cash equivalents as at 31 December 18 2,567,516 2,898,566 Cash and cash equivalents comprise of the following: Bank balances and cash 2,519,616 2,910,066 Cash classified as held for sale 50,900 Bank overdrafts (3,000) (11,500) Cash and cash equivalents 2,567,516 2,898,566 The accompanying Notes 1 to 34 form an integral part of these consolidated financial statements. The independent auditors report is set out on page
40 Notes to consolidated financial statements (forming part of the financial statements) 1 Reporting entity DP World Limited (the Company ) was incorporated on 9 August 2006 as a Company Limited by Shares with the Registrar of Companies of the Dubai International Financial Centre ( DIFC ) under the Companies Law, DIFC Law No. 3 of The consolidated financial statements of the Company for the year ended 31 December comprise the Company and its subsidiaries (collectively referred to as the Group ) and the Group s interests in associates and jointly controlled entities. The Group is engaged in the business of international marine terminal operations and development, logistics and related services. Port & Free Zone World FZE (the Parent Company ) which originally held 100% of the Company s issued and outstanding share capital, made an initial public offer of 19.55% of its share capital to the public and as a result the Company was listed on the Nasdaq Dubai (formerly known as Dubai International Financial Exchange) with effect from 26 November Port & Free Zone World FZE is a wholly owned subsidiary of Dubai World Corporation (the Parent Group ), which is the ultimate holding company of the Group. The Company s registered office address is P.O. Box 17000, Dubai, United Arab Emirates. 2 Basis of preparation (a) Statement of compliance These consolidated financial statements have been prepared in accordance with International Financial Reporting Standards ( IFRS ) as issued by the International Accounting Standards Board ( IASB ) and the applicable requirements of the laws of Dubai International Financial Centre. The consolidated financial statements were approved by the Board of Directors on 23 March (b) Basis of measurement The consolidated financial statements have been prepared on the historical cost basis except for derivative financial instruments and available-for-sale financial assets which are measured at fair value. The methods used to measure fair values are discussed further in Note 4. (c) Funding and liquidity The Group s business activities, together with factors likely to affect its future development, performance and position are set out in the Chairman s Statement and Operating and Financial Review. In addition, Note 5 sets out the Group s objectives, policies and processes for managing the Group s financial risk including capital management and Note 29 provides details of the Group exposure to credit risk, liquidity risk and interest rate risk from financial instruments. The Board of Directors remain satisfied with the Group s funding and liquidity position. At 31 December, the Group had net debt of USD 5,253,130 thousand (: USD 5,059,403 thousand). The Group s credit facility covenants are currently well within the covenant limits. The Group generated gross cash of USD 1,108,288 thousand (: USD 991,979 thousand) from operating activities and its interest cover for the year is 4.2 times (: 4 times) (calculated using adjusted EBITDA and net interest expense). Based on the above, the Board of Directors have concluded that the going concern basis of preparation continues to be appropriate. (d) Functional and presentation currency The functional currency of the Company is UAE Dirhams. Each entity in the Group determines its own functional currency and items included in the financial statements of each entity are measured using that functional currency. These consolidated financial statements are presented in United States Dollars ( USD ), which in the opinion of management is the most appropriate presentation currency in view of the global presence of the Group. All financial information presented in USD is rounded to the nearest thousand. UAE Dirham is currently pegged to USD and there are no differences on translation from functional to presentation currency. (e) Use of estimates and judgements The preparation of consolidated financial statements in conformity with IFRSs requires management to make judgements, estimates and assumptions that affect the application of accounting policies and reported amounts of assets, liabilities, income and expenses. Actual results may differ from these estimates. Estimates and underlying assumptions are reviewed on an ongoing basis. Revisions to accounting estimates are recognised in the period in which the estimate is revised and in any future periods affected. 38
41 Business Review corporate governance FINANCIAL STATEMENTS (a) Judgements Information about critical judgements in applying accounting policies that have the most significant effect on the amounts recognised in the consolidated financial statements are as follows: (i) Provision for income taxes and deferred tax assets The Group is subject to income taxes in numerous jurisdictions. Significant judgement is required in determining the worldwide provision for income taxes. There are many transactions and calculations for which the ultimate tax determination is uncertain during the ordinary course of business. The Group recognises liabilities for anticipated tax claims based on estimates of whether additional taxes will be due. Where the final tax outcome of these matters is different from the amounts that were initially recorded, such differences will impact the income tax and deferred tax provisions in the period in which such determination is made. Deferred tax assets are recognised for all unused tax losses to the extent that it is probable that taxable profit will be available against which the losses can be utilised. Significant management judgement is required to determine the amount of deferred tax assets that can be recognised, based upon the likely timing and level of future taxable profits together with future tax planning strategies. (ii) Impairment of available-for-sale financial assets Equity investments are impaired when an objective evidence of impairment exists. A significant or prolonged decline in fair value of an investment is considered as objective evidence of impairment. The Group considers that generally a decline of 20% will be considered as significant and a decline of over 9 months will be generally considered as prolonged. (iii) Fair value of financial instruments Where the fair value of financial assets and financial liabilities recorded in the statement of financial position cannot be derived from active markets, they are determined using valuation techniques including the discounted cash flow model. The inputs to these models are taken from observable markets where possible, but where this is not feasible, a degree of judgement is required in establishing fair values. The judgements include considerations of inputs such as market risk, credit risk and volatility. (iv) Contingent liabilities There are various factors that could result in a contingent liability being disclosed if the probability of any outflow in settlement is not remote. The assessment of the outcome and financial effect is based upon management s best knowledge and judgement of current facts as at the reporting date. (b) Estimates Information about assumptions and estimation uncertainties that have significant risk of resulting in a material adjustment within the next financial year are as follows: (i) Useful life of property, plant and equipment and port concession rights with finite life The useful life of property, plant and equipment and port concession rights with finite life is determined by the Group s management based on their estimate of the period over which an asset or port concession rights is expected to be available for use by the Group. This estimate is reviewed and adjusted if appropriate at each financial year end. This may result in a change in useful economic lives and therefore depreciation and amortisation expense in future periods. (ii) Impairment testing of goodwill and port concession rights The Group determines whether goodwill and port concession rights with indefinite life are impaired at least on an annual basis. This requires an estimation of the value in use of the cash-generating units to which the goodwill is allocated or to which the port concession rights exist. Estimating the value in use requires the Group to make an estimate of the expected future cash flows from the cash-generating unit and also to choose a suitable discount rate in order to calculate the present value of those cash flows. (iii) Impairment of accounts receivable An estimate of the collectible amount of accounts receivable is made when collection of the full amount is no longer probable. For individually significant amounts, this estimation is performed on an individual basis. Amounts which are not individually significant, but which are past due, are assessed collectively and a provision applied according to the length of time past due, based on historical recovery rates. Any difference between the amounts actually collected in future periods and the amounts expected will be recognised in the consolidated income statement. (iv) Pension and post employment benefits The cost of defined benefit pension plans and other post employment benefits is determined using actuarial valuations. The actuarial valuation involves making assumptions about discount rates, expected rates of return on assets, future salary increases, mortality rates and future pension increases. Due to the long-term nature of these plans, such estimates are subject to significant uncertainty. (f) Change in accounting policies Overview As of 1 January, the Group has changed its accounting policies in the following areas: IFRS 3 (revised) Accounting for business combinations IAS 27 (revised) Accounting for acquisitions of non-controlling interests IAS 17 (amendment) Accounting for long-term leases of land 39
42 Notes to consolidated financial statements continued (forming part of the financial statements) 2 Basis of preparation continued (f) Change in accounting policies continued (i) Accounting for business combinations In respect of business combinations, costs related to the acquisition, other than those associated with the issue of debt or equity securities, that the Group incurs in connection with a business combination are expensed as incurred. The revised standard does not have an impact on these consolidated financial statements as there were no business combinations accounted by the Group. The change in accounting policy has been applied prospectively and has had no impact on earnings per share. (ii) Accounting for acquisitions of non-controlling interests Under the new accounting policy, acquisitions of non-controlling interests are accounted for as transactions with owners in their capacity as owners and therefore no goodwill is recognised as a result of such transactions. The adjustments to non-controlling interests are based on a proportionate amount of the carrying value of net assets of the subsidiary. The change in accounting policy has been applied prospectively and has had no impact on earnings per share. (iii) Accounting for long term leases of land As per the amendment of IAS 17 Leases, which is applicable from 1 January, a land lease with a lease term of several decades or longer may be classified as a finance lease, even if at the end of the lease term title will not pass to the lessee, because in such arrangements substantially all risks and rewards are transferred to the lessee and the present value of the residual value of the leased asset is considered negligible. The amendment also clarifies that the lessee in leases of this type will typically be in a position economically similar to that of the buyer. The Group has assessed its port concession agreements based on the above amendment and concluded that none of its concession agreements result in a position which is economically similar to that of the buyer. Accordingly the amendment has had no impact on the Group s financial position. 3 Significant accounting policies The accounting policies set out below have been applied consistently in the period presented in these consolidated financial statements and have been applied consistently by the Group entities. (a) Basis of consolidation (i) Business combinations Except for transactions involving entities under common control, where the provisions of IFRS 3 Business Combinations are not applicable, business combinations are accounted for using the acquisition method. This involves recognising identifiable assets (including previously unrecognised port concession rights) and liabilities (including contingent liabilities and excluding future restructuring) of the acquired business at fair value. All acquisition-related costs are expensed. (ii) Subsidiaries Subsidiaries are entities controlled by the Group. Control exists when the Group has the power to govern the financial and operating policies of an entity so as to obtain benefits from its activities. In assessing control, potential voting rights that are presently exercisable are taken into account. The financial statements of subsidiaries are included in the consolidated financial statements from the date that control commences until the date that control ceases. The accounting policies of subsidiaries have been changed where necessary to align them with the policies adopted by the Group. Losses applicable to the non-controlling interests in a subsidiary are allocated to the non-controlling interests even if doing so causes the non controlling interests to have a deficit balance. (iii) De-recognition of subsidiaries Gains or losses arising from de-recognition of subsidiaries are measured as the difference between the net disposal proceeds and the carrying amount of the subsidiary and are recognised in the consolidated income statement when the subsidiary is derecognised. (iv) Accounting for acquisitions of non-controlling interests Acquisitions of non-controlling interests are accounted for as transactions with owners in their capacity as owners and therefore no goodwill is recognised as a result of such transactions. The adjustments to non-controlling interests are based on a proportionate amount of the carrying value of net assets of the subsidiary. (v) Special purpose entities The Group has established DP World Sukuk Limited (a limited liability company incorporated in the Cayman Islands) as a special purpose entity ( SPE ) for the issue of Sukuk Certificates. These certificates are listed on NASDAQ Dubai. The Group does not have any direct or indirect shareholdings in this entity. An SPE is consolidated based on an evaluation of the substance of its relationship with the Group and based on the SPE s risks and rewards; the Group concludes that it controls the SPE. The SPE controlled by the Group was established under terms that impose strict limitations on the decision-making powers of the SPE s management and that result in the Group receiving the majority of the benefits related to the SPE s operations and net assets, being exposed to risks incident to the SPE s activities, and retaining the majority of the residual or ownership risks related to the SPE or its assets. (vi) Investments in associates and joint ventures (equity-accounted investees) Associates are those entities in which the Group has significant influence, but not control, over the financial and operating policies. Joint ventures are those entities over whose activities the Group has joint control, established by contractual agreement and requiring unanimous consent for strategic financial and operating decisions. 40
43 Business Review corporate governance FINANCIAL STATEMENTS Investment in associates and joint ventures are accounted for using the equity method (equity-accounted investees) and are initially recorded at cost. The Group s investment includes goodwill identified on acquisition, net of any accumulated impairment losses. The consolidated financial statements include the Group s share of the income and expenses of equity-accounted investees, after adjustments to align the accounting policies with those of the Group, from the date that significant influence or joint control commences until the date that significant influence or joint control ceases. When the Group s share of losses exceeds its interest in an equity-accounted investee, the carrying amount of that interest (including any long-term investments) is reduced to nil and the recognition of further losses is discontinued except to the extent that the Group has an obligation or has made payments on behalf of the investee. The transactions between the Group and associates and joint ventures are made at normal market prices. (vii) Loss of control On the loss of control, the Group de-recognises the assets and liabilities of the subsidiary, any non-controlling interests and the other components of equity related to the subsidiary. Any surplus or deficit arising on the loss of control is recognised in the consolidated income statement. If the Group retains any interest in the previous subsidiary, then such interest is re-measured at fair value at the date that control is lost. Subsequently, it is accounted for as an equity-accounted investee or as an available-for-sale financial asset depending on the level of influence retained. (viii) Transactions eliminated on consolidation Intra-group balances and transactions, and any unrealised income and expenses arising from intra-group transactions, are eliminated in preparing the consolidated financial statements. Unrealised gains arising from the transactions with equity-accounted investees are eliminated against the investment to the extent of the Group s interest in the investee. Unrealised losses are eliminated in the same way as unrealised gains, but only to the extent that there is no evidence of impairment. (b) Foreign currency (i) Foreign currency transactions These consolidated financial statements are presented in USD, which is the Group s presentation currency. Transactions in foreign currencies are translated to the respective functional currencies of the Group entities at exchange rates at the date of the transactions. Monetary assets and liabilities denominated in foreign currencies at the reporting date are retranslated to the functional currency at the exchange rate at that date. Non-monetary assets and liabilities denominated in foreign currencies that are measured at fair value are retranslated to the functional currency at the exchange rate at the date that the fair value was determined. Non-monetary items in a foreign currency that are measured at historical cost are translated to the functional currency using the exchange rate at the date of transaction. Foreign currency differences arising on retranslation of monetary items are recognised in the consolidated income statement, except for differences arising on the retranslation of available-for-sale equity instruments, of a financial liability designated as a hedge of the net investment in a foreign operation, or qualifying cash flow hedges, which are recognised directly in other comprehensive income (refer to Note 3b (iii)). (ii) Foreign operations The assets and liabilities of foreign operations, including goodwill and fair value adjustments arising on acquisition, are translated to USD at exchange rates at the reporting date. The income and expenses of foreign operations are translated to USD at rates approximating to the foreign exchange rates ruling at the date of the transactions. Foreign exchange differences arising on translation are recognised in other comprehensive income and presented in the translation reserve in equity. When a foreign operation is disposed such that control, significant influence or joint control is lost, the cumulative amount in the translation reserve related to that foreign operation is reclassified to consolidated income statement as part of the gain or loss on disposal. When the Group disposes of only part of its interest in a subsidiary that includes a foreign operation while retaining control, the relevant proportion of the cumulative amount is reattributed to non controlling interests. When the Group disposes of only part of its investment in an associate or joint venture that includes a foreign operation while retaining significant influence or joint control, the relevant proportion of the cumulative amount is reclassified to the consolidated income statement. Foreign exchange gains and losses arising from a monetary item receivable from or payable to a foreign operation, the settlement of which is neither planned nor likely in the foreseeable future, are considered to form part of a net investment in a foreign operation and are recognised in other comprehensive income, and presented in the translation reserve in equity. (iii) Hedge of net investment in foreign operation Foreign currency differences arising on the retranslation of a financial liability designated as a hedge of a net investment in foreign operation are recognised in other comprehensive income, to the extent that the hedge is effective. To the extent that the hedge is ineffective, such differences are recognised in the consolidated statement of comprehensive income. When the hedged part of a net investment is disposed off, the associated cumulative amount in other comprehensive income is transferred to the consolidated income statement on disposal. (c) Financial instruments (i) Non-derivative financial assets Initial recognition and measurement: The Group classifies non-derivative financial assets into the following categories: financial assets at fair value through profit or loss, held to maturity financial assets, loans and receivables and available-for-sale financial assets. The Group determines the classification of its financial assets at initial recognition. 41
44 Notes to consolidated financial statements continued (forming part of the financial statements) 3 Significant accounting policies continued (c) Financial instruments continued All non-derivative financial assets are recognised initially at fair value, plus, for instruments not at fair value through profit or loss, any directly attributable transaction costs. The Group initially recognises loans and receivables and deposits on the date that they are originated. All other financial assets (including assets designated at fair value through profit or loss) are recognised initially on the trade date, which is the date that the Group becomes a party to the contractual provisions of the instrument. The Group s non-derivative financial assets comprise investments in an unquoted infrastructure fund, debt securities, bank balances and cash, trade and other receivables, due from related parties and cash and cash equivalents. Subsequent measurement: The subsequent measurement of non derivative financial assets depends on their classification as follows: Financial assets at fair value through profit or loss A financial asset is classified at fair value through profit or loss if it is classified as held for trading or is designated as such upon initial recognition. Financial assets are designated at fair value through profit or loss if the Group manages such investments and makes purchase and sale decisions based on their fair value in accordance with the Group s documented risk management or investment strategy. Attributable transaction costs are recognised in the consolidated income statement as incurred. Financial assets at fair value through profit or loss are measured at fair value, and changes therein are recognised in consolidated income statement. Held to maturity financial assets If the Group has a positive intent and ability to hold debt securities to maturity, then these are classified as held-to-maturity. Subsequent to initial recognition held-to-maturity financial assets are measured at amortised cost using the effective interest method, less any impairment losses. Amortised cost is calculated by taking into account any discount or premium on acquisition and fees or costs that are an integral part of the effective interest rate. The effective interest rate amortisation is included in finance cost in the consolidated income statement. Gains and losses are also recognised in the consolidated income statement when these financial assets are derecognised. Loans and receivables Loans and receivables are financial assets with fixed or determinable payments that are not quoted in an active market. Subsequent to initial recognition, loans and receivables are measured at amortised cost using the effective interest rate method, less any impairment losses. Loans and receivables comprise bank balances and cash, due from related parties and trade and other receivables. Bank balances and cash Bank balances and cash in the statement of financial position comprise cash in hand, bank balances and short-term deposits under lien with an original maturity of three months or less. For the purpose of consolidated statement of cash flows, cash and cash equivalents consist of bank balances and cash as defined above and cash classified as held for sale, net of bank overdrafts. Bank overdrafts forms an integral part of the Group s cash management and is included as a component of cash and cash equivalents for the purpose of the consolidated statement of cash flows. Available-for-sale investments Available-for-sale financial assets comprise equity securities. Available-for-sale financial assets are non-derivative financial assets that are designated as available-for-sale or are not classified in any of the above categories of financial assets. Subsequent to initial recognition these are measured at fair value and changes therein are recognised in other comprehensive income and presented in the other reserves in equity. When an investment is de-recognised, the gain or loss accumulated in equity is reclassified to the consolidated income statement. De-recognition of non derivative financial assets The Group de-recognises a financial asset when the contractual rights to the cash flows from the asset expire, or it transfers the rights to receive the contractual cash flows on the financial asset in a transaction in which substantially all the risks and rewards of ownership of the financial asset are transferred. Any interest in transferred financial assets that is created or retained by the Group is recognised as a separate asset or liability. (ii) Non-derivative financial liabilities Initial recognition and measurement: The Group classifies non-derivative financial liabilities into the following categories: financial liabilities at fair value through profit or loss and other financial liabilities. Other financial liabilities comprise loans and borrowings, bank overdrafts, due to related parties and trade and other payables. The Group determines the classification of its financial liabilities at initial recognition. All non-derivative financial liabilities are recognised initially at fair value and in the case of other financial liabilities, plus, directly attributable transaction costs. 42 The Group initially recognises debt securities issued and subordinated liabilities on the date they originate. All other financial liabilities (including liabilities designated at fair value through profit or loss) are recognised initially on the trade date, which is the date that the Group becomes a party to the contractual provisions of the instrument.
45 Business Review corporate governance FINANCIAL STATEMENTS Subsequent measurement: The subsequent measurement of non derivative financial liabilities depends on their classification as follows: Financial liabilities at fair value through profit or loss A financial liability is classified at fair value through profit or loss if it is classified as held for trading or is designated as such upon initial recognition. Financial liabilities are classified as held for trading if they are acquired for the purpose of selling in the near term. This category includes derivative financial instruments entered into by the Group that are not designated as hedging instruments in hedge relationships as defined by IAS 39. Financial liabilities at fair value through profit or loss are measured at fair value, and changes therein are recognised in the consolidated income statement. Other financial liabilities Subsequent to initial recognition, these financial liabilities are measured at amortised cost using effective interest rate method. Amortised cost is calculated by taking into account any discount or premium on acquisition and fees or costs that are an integral part of the effective interest rate. The effective interest rate amortisation is included in finance costs in the consolidated income statement. Fees paid on the establishment of loan facilities are recognised as transaction costs to the extent there is evidence that it is probable that some or all of the facility will be drawn down, the fee is capitalised as a prepayment for liquidity services and amortised over the period of the facility to which it relates. De-recognition of non derivative financial liabilities The Group de-recognise a financial liability when its contractual obligations are discharged or cancelled or expired. (iii) Derivative financial instruments The Group holds derivative financial instruments to hedge its foreign currency and interest rate risk exposures. On initial designation of the derivatives as the hedging instrument, the Group formally documents the relationship between the hedging instrument and hedged item, including the risk management objective and strategy in undertaking the hedge transaction and hedged risk together with the methods that will be used to assess the effectiveness of the hedging relationship. The Group makes an assessment, both at the inception of the hedge relationship as well as on an ongoing basis, of whether the hedging instruments are expected to be highly effective in offsetting the changes in the fair value or cash flows of the respective hedged items attributable to the hedged risk and whether the actual results of each hedge are within the acceptable range. Derivatives are recognised initially at fair value and attributable transaction costs are recognised in the consolidated income statement when incurred. Derivatives are carried as financial assets when the fair value is positive and as financial liabilities when the fair value is negative. Derivative instruments that are not designated as hedging instruments in hedge relationships as defined by IAS 39 are classified as financial liabilities or assets at fair value through profit or loss. Subsequent to initial recognition, derivatives are measured at fair value, and changes therein are accounted for as described below: Cash flow hedges When a derivative is designated as the hedging instrument in a hedge of the variability in cash flows attributable to a particular risk associated with a recognised asset or liability or a highly probable forecast transaction that could affect the consolidated income statement, then such hedges are classified as cash flow hedges. Changes in the fair value of the derivative hedging instrument designated as a cash flow hedge are recognised directly in the other comprehensive income to the extent that the hedge is effective and presented in the hedging reserve in the equity. When the hedged item is a non-financial asset, the amount recognised in other comprehensive income is transferred to the carrying amount of the asset when it is recognised. In other cases, the amount recognised in other comprehensive income is transferred to consolidated income statement in the same period that the hedged item affects the consolidated income statement. Any ineffective portion of changes in the fair value of the derivative is recognised immediately in the consolidated income statement. If the hedging instrument no longer meets the criteria for hedge accounting, expires or is sold, terminated or exercised, or the designation is revoked, then hedge accounting is discontinued prospectively. The cumulative gain or loss previously recognised in other comprehensive income remains there until the forecast transaction occurs. (iv) Offsetting of financial instruments Financial assets and financial liabilities are offset and the net amount presented in the statement of financial position when, and only when, the Group has a legal right to offset the amounts and intends either to set off on a net basis, or to realise the assets and settle the liability simultaneously. (d) Property, plant and equipment (i) Recognition and measurement Items of property, plant and equipment are measured at cost less accumulated depreciation and impairment losses (refer to accounting policy on impairment). 43
46 Notes to consolidated financial statements continued (forming part of the financial statements) 3 Significant accounting policies continued (d) Property, plant and equipment continued Cost includes expenditures that are directly attributable to the acquisition of the asset. The cost of a self-constructed asset includes the cost of materials and direct labour, any other costs directly attributable to bringing the asset to a working condition for its intended use, and the cost of dismantling and removing the items and restoring the site on which they are located. Borrowing costs that are directly attributable to acquisition, construction or production of a qualifying asset are included in the cost of that asset. Purchased software that is integral to the functionality of the related equipment is capitalized as part of that equipment. When parts of an item of property, plant and equipment have different useful lives, they are depreciated as separate items (major components) of property, plant and equipment. Gains and losses on disposal of an item of property, plant and equipment are determined by comparing the proceeds from disposal with the carrying amount of property, plant and equipment and recognised within other income in the consolidated income statement. Capital work-in-progress Capital work-in-progress is measured at cost less impairment losses and not depreciated until such time the assets are ready for intended use and transferred to the respective category under property, plant and equipment. Dredging Dredging expenditure is categorised into capital dredging and major maintenance dredging. Capital dredging is expenditure which includes creation of a new harbour, deepening or extension of the channel berths or waterways in order to allow access to larger ships which will result in future economic benefits for the Group. This expenditure is capitalised and amortised over the expected period of the relevant concession agreement. The expenditure is also capitalised under port concession rights due to application of IFRIC 12 Service Concession Arrangements. Major maintenance dredging is expenditure incurred to restore the channel to its previous condition and depth. On an average, the Group incurs such expenditure every 10 years. At the completion of maintenance dredging, the channel has an average service potential of 10 years. Any unamortised expense is written-off on commencing of any new dredging activities. Maintenance dredging is regarded as a separate component of the asset and is capitalised and amortised evenly over 10 years. (ii) Subsequent costs The cost of replacing part of an item of property, plant and equipment is recognised in the carrying amount of the item if it is probable that the future economic benefits embodied within the part will flow to the Group and its cost can be measured reliably. The carrying amounts of the replaced parts are derecognised. The costs of the day-to-day servicing of property, plant and equipment are recognised in the consolidated income statement as incurred. (iii) Depreciation Depreciation is recognised in the consolidated income statement on a straight-line basis over the estimated useful lives of each part of an item of property, plant and equipment is based on cost less residual value. Dredging costs are depreciated on a straight line basis based on the lives of various components of dredging. Leased assets are depreciated over the shorter of the lease term and their useful lives unless it is reasonably certain that the Group will obtain ownership by the end of the lease term. No depreciation is provided on freehold land. The estimated useful lives of assets are as follows: Useful life Assets (years) Buildings 5 50 Plant and equipment 3 25 Ships Dredging Depreciation methods, useful lives and residual values are reviewed at each reporting date and adjusted prospectively, if required. (e) Goodwill Goodwill arises on the acquisition of subsidiaries, associates and joint ventures. Goodwill represents the excess of the cost of the acquisition over the Group s interest in the net fair value of the identifiable assets, liabilities and contingent liabilities of the acquiree. When the excess is negative (negative goodwill), it is recognised immediately in the consolidated income statement. Subsequent measurement Goodwill is measured at cost less accumulated impairment losses (refer to accounting policy on impairment). 44 In respect of equity-accounted investees, the carrying amount of goodwill is included in the carrying amount of the investment, and is not tested for impairment separately.
47 Business Review corporate governance FINANCIAL STATEMENTS (f) Port concession rights The Group considers port concession rights as intangible assets. Substantially all of the Group s terminal operations are conducted pursuant to long-term operating concessions or leases entered into with the owner of a relevant port for terms generally between 25 and 50 years. The Group commonly starts negotiations regarding renewal of concession agreements with approximately 5-10 years remaining on the term and often obtains renewals or extensions on the concession agreements in advance of their expiration in return for a commitment to make certain capital expenditures in respect of the subject terminal. In addition, such negotiations may result in the re-basing of rental charges to reflect prevailing market rates. However, based on the Group s experience, incumbent operators are typically granted renewal often because it can be costly for a port owner to switch operators, both administratively and due to interruptions to port operations and reduced productivity associated with such transactions. Port concession rights comprises of: (i) Port concession rights arising on business combinations The cost of port concession rights acquired in a business combination is the fair value as at the date of acquisition. Other port concession rights acquired separately are measured on initial recognition at cost. Following initial recognition, port concession rights are carried at cost less accumulated amortisation and any accumulated impairment losses. Internally generated port concession rights, excluding capitalised development costs, are recognised in the consolidated income statement as incurred. The useful lives of port concession rights are assessed to be either finite or indefinite. Port concession rights with finite lives are amortised on a straight line basis over the useful economic life and assessed for impairment whenever there is an indication that the port concession rights may be impaired. Port concession rights with indefinite lives are not amortised and are tested for impairment at least on an annual basis. The amortisation period and amortisation method for port concession rights with a finite useful life is reviewed at least at each financial year end. Changes in the expected useful life or the expected pattern of consumption of future economic benefits embodied in the assets are accounted for by changing the amortisation period or method, as appropriate, and treated as changes in accounting estimates. The amortisation expense on port concession rights with finite useful lives is recognised in the consolidated income statement on a straight line basis in the expense category consistent with the function of port concession rights. (ii) Port concession rights arising from Service Concession Arrangements (IFRIC 12) The Group recognises port concession rights arising from a service concession arrangement, in which the public sector (the grantor) controls or regulates the services provided and the prices charged, and also controls any significant residual interest in the infrastructure such as property, plant and equipment, if the infrastructure is existing infrastructure of the grantor or the infrastructure is constructed or purchased by the Group as part of the service concession arrangement. Port concession rights with indefinite useful lives are tested for impairment annually either individually or at the cash-generating unit level. Such port concession rights are not amortised. The useful life of port concession rights with an indefinite life is reviewed annually to determine whether the indefinite life assessment continues to be supportable. If not, the change in the useful life assessment from indefinite to finite is made on a prospective basis. Gains or losses arising from de-recognition of a port concession rights are measured as the difference between the net disposal proceeds and the carrying amount of the asset and are recognised in the consolidated income statement when the asset is derecognised. The estimated useful lives for port concession rights range within a period of 5 78 years (including the concession rights relating to associates and joint ventures). Port concession rights also include certain property, plant and equipment which are reclassified as intangible assets in accordance with IFRIC 12 Service Concession Arrangements. These assets are amortised based on the lower of their useful lives or concession period. (g) Inventories Inventories mainly consist of spare parts and consumables. Inventories are measured at the lower of cost and net realisable value. The cost of inventories is based on weighted average method and includes expenditure incurred in acquiring inventories and bringing them to their existing location and condition. Net realisable value is the estimated selling price in the ordinary course of business, less the estimated costs of completion and selling expenses. (h) Leases (i) Group as a lessee Leases in which a significant portion of the risks and rewards of ownership are retained by the lessor are classified as operating leases. Payments made under operating leases are recognised in the consolidated income statement on a straight-line basis over the term of the lease. Lease incentives received are recognised as an integral part of the total lease expense, over the term of the lease. The Group leases certain property, plant and equipment. Leases of property, plant and equipment where the Group has substantially all the risks and rewards of ownership are classified as finance lease. Minimum lease payments made under finance leases are apportioned between the finance expense and the reduction of the outstanding liability. The finance expense is allocated to each period during the lease term so as to produce a constant periodic rate of interest on the remaining balance of the liability. 45
48 Notes to consolidated financial statements continued (forming part of the financial statements) 3 Significant accounting policies continued (h) Leases continued Contingent payments are accounted for by revising the minimum lease payments over the remaining term of the lease when the lease adjustment is confirmed. (ii) Group as a lessor Leases where the Group retains substantially all the risks and benefits of ownership of the asset are classified as operating leases. Initial direct costs incurred in negotiating an operating lease are added to the carrying amount of the leased asset and recognised over the lease term on the same basis as rental income. Contingent rents are recognised as income in the period in which they are earned. (iii) Leasing and sub-leasing transactions A series of leasing and sub-leasing transactions between the Group and third parties, which are closely interrelated, negotiated as a single transaction, and which take place concurrently or in a continuous sequence are considered linked and accounted for as one transaction when the overall economic effect cannot be understood without reference to the series of transactions as a whole. These leasing and sub-leasing transactions are designed to achieve certain benefits for the third parties in overseas locations in return for a cash benefit to the Group. Such cash benefit is accounted in the consolidated income statement based on its economic substance. Under these leasing and sub-leasing transactions, current and non-current liabilities have been decreased by the loan receivable and the placement of deposits. Those liabilities, receivables and deposits (and income and charges arising therefrom) are netted off in the consolidated financial statements, in order to reflect the overall commercial effect of the arrangement. (iv) Leases of land in concession arrangements A land lease with a lease term of several decades or longer may be classified as a finance lease, even if at the end of the lease term title will not pass to the lessee, because in such arrangements substantially all risks and rewards are transferred to the lessee and the present value of the residual value of the leased asset is considered negligible. The lessee in leases of this type will typically be in a position economically similar to that of the buyer. (i) Impairment (i) Financial assets (a) Loans and receivables and held to maturity investments The Group considers evidence of impairment for loans and receivables and held to maturity investment securities at both a specific asset level and collective level. All individually significant receivables and held to maturity investment securities are assessed for specific impairment. An impairment loss in respect of a financial asset measured at amortised cost is calculated as the difference between its carrying amount and the present value of the estimated future cash flows discounted at the original effective interest rate. Impairment losses are recognised in consolidated income statement and reflected in an allowance account against loans and receivables or held to maturity investments. When a subsequent event causes the amount of impairment loss to decrease, the decrease in impairment loss is reversed through the consolidated income statement. (b) Available-for-sale financial assets For available-for-sale financial investments, the Group assesses at each reporting date whether there is objective evidence that an investment or a group of investments is impaired. A significant or prolonged decline in fair value of an equity investment is considered as an objective evidence of impairment. The Group considers that generally a decline of 20% will be considered as significant and a decline of over 9 months will be generally considered as prolonged. Impairment losses on available-for-sale financial assets are recognised by reclassifying the losses accumulated in the other reserve in equity to the consolidated income statement. The cumulative loss that is reclassified from equity to the consolidated income statement is the difference between the acquisition cost, net of any principal repayment and amortisation, and the current fair value, less any impairment loss recognised previously in the consolidated income statement. Any subsequent recovery in the fair value of an impaired available for sale equity security is recognised in other comprehensive income. (ii) Non-financial assets The carrying amounts of the Group s non-financial assets, other than inventories and deferred tax assets are reviewed for impairment whenever there is an indication of impairment. If any such indication exists then the asset s recoverable amount is estimated. The recoverable amount of an asset or cash-generating unit is the greater of its value in use and its fair value less costs to sell. In assessing value in use, the estimated future cash flows are discounted to their present value using a pre-tax discount rate that reflects current market assessments of the time value of money and the risks specific to the asset or cash generating unit. A cash-generating unit is the smallest identifiable asset group that generates cash flows that largely are independent from other assets and groups. An impairment loss is recognised if the carrying amount of an asset or its cash-generating unit exceeds its estimated recoverable amount. Impairment losses are recognised in the consolidated income statement. Impairment losses recognised in respect of cash generating units are allocated first to reduce the carrying amount of any goodwill allocated to the units and then to reduce the carrying amount of the other assets in the unit (group of units) on a pro rata basis. 46 For goodwill and port concession rights that have indefinite lives or that are not yet available for use, recoverable amount is estimated annually and when circumstances indicate that carrying value may be impaired. Goodwill acquired in business combination is allocated to groups of cash generating unit that are expected to benefit from the synergies of the combination. An impairment loss in respect of goodwill is not reversed.
49 Business Review corporate governance FINANCIAL STATEMENTS In respect of other assets, impairment losses recognised in prior periods are assessed at each reporting date for any indications that the loss has decreased or no longer exists. An impairment loss is reversed if there has been a change in the estimates used to determine the recoverable amount. An impairment loss is reversed only to the extent that the asset s carrying amount does not exceed the carrying amount, which would have been determined, net of depreciation or amortisation, if no impairment loss had been recognised. (j) Assets held for sale Assets (or disposal groups comprising assets and liabilities) which are expected to be recovered primarily through sale rather than through continuing use are classified as held for sale. Immediately before classification as held for sale, the assets (or components of a disposal group) are re-measured in accordance with the Group s accounting policies. Thereafter, generally the assets (or disposal group) are measured at the lower of their carrying amount or fair value less costs to sell. Any impairment loss on a disposal group is first allocated to goodwill, and then to remaining assets and liabilities on a pro rata basis, except that no loss is allocated to inventories, financial assets, deferred tax assets and employee benefit assets which continue to be measured in accordance with the Group s accounting policies. Impairment losses on initial classification as held for sale and subsequent gains or losses on re-measurement are recognised in the consolidated income statement. Gains are not recognised in excess of any cumulative impairment loss. Port concession rights and property, plant and equipment once classified as held for sale or distribution are not amortised or depreciated. In addition, equity accounting of equity-accounted investees ceases once classified as held for sale. (k) Share capital Ordinary shares are classified as equity. Incremental costs directly attributable to the issue of ordinary shares are recognised as a deduction from equity. Any excess payment received over par value is treated as share premium. (l) Employee benefits (i) Employee benefits in UAE The Group provides end of service benefits to its expatriate employees. The entitlement to these benefits is based upon the employees final salary and length of service, subject to the completion of a minimum service period. The expected costs of these benefits are accrued over the period of employment. With respect to its UAE national employees, the Group makes a provision for contributions to be made to the UAE Pensions Authority calculated as a percentage of the employees salaries. The Group s obligations are limited to these contributions, which are expensed when due. (ii) Pension and post-employment benefits outside UAE The Group s net obligation in respect of defined benefit pension plans is calculated separately for each plan by estimating the amount of future benefit that employees have earned in return for their service in the current and prior periods. That benefit is discounted to determine the present value, and the fair value of any plan assets is deducted. The calculation is performed by a qualified actuary using the projected unit credit method. The discount rate is the yield at the reporting date on AA credit rated bonds that have maturity dates approximating to the terms of the Group s obligations. When the benefits of a plan are improved, the portion of the increased benefit relating to past service by employees is recognised as an expense in the consolidated income statement on a straight line basis over the average period until the benefits become vested. To the extent that the benefits vest immediately, the expense is recognised immediately in the consolidated income statement. When the actuarial calculation results in a benefit to the Group, the recognised asset is limited to the total of any unrecognised past service costs and the present value of economic benefits available in the form of any future refunds from the plan or reductions in future contributions to the plan. In order to calculate the present value of economic benefits, consideration is given to any minimum funding requirements that apply to any plan in the Group. An economic benefit is available to the Group if it is realisable during the life of the plan, or on settlement of the plan liabilities. Where the present value of the deficit contributions exceeds the IAS 19 deficit an additional liability is recognised. Actuarial gains and losses that arise in calculating the Group s obligation in respect of a plan are recognised in the period in which they arise directly in other comprehensive income. The cost of providing benefits under the defined benefit plans is determined separately for each plan using the projected unit credit method, which attributes entitlement to benefits to the current period (to determine current service cost) and to the current and prior periods (to determine the present value of defined benefit obligation) and is based on actuarial advice. Contributions, including lump sum payments, in respect of defined contribution pension schemes and multi employer defined benefit schemes where it is not possible to identify the Group s share of the scheme, are charged to the consolidated income statement as they fall due. (iii) Long-term service benefits outside UAE The Group s net obligation in respect of long-term service benefits, other than pension plans, is the amount of future benefit that employees have earned in return for their service in the current and prior periods. The obligation is calculated using the projected unit credit method and is discounted to its present value and the fair value of any related assets is deducted. The discount rate is the yield at the reporting date on AA credit rated bonds that have maturity dates approximating to the terms of the Group s obligations. 47
50 Notes to consolidated financial statements continued (forming part of the financial statements) 3 Significant accounting policies continued (l) Employee benefits continued (iv) Share-based payment transactions The grant date fair value of equity settled share-based payment awards granted to employees is recognised by the Group as an expense with a corresponding increase in equity over the period that the employees become unconditionally entitled to payment, on a straight line basis. (m) Provisions A provision is recognised if, as a result of a past event, the Group has a present legal or constructive obligation that can be estimated reliably, and it is probable that an outflow of economic benefits will be required to settle the obligation. Provisions are determined by discounting the expected future cash flows at a pre-tax rate that reflects current market assessments of the time value of money and the risks specific to the liability. The unwinding of the discount is recognised as a finance cost in the consolidated income statement. 48 Provision for onerous contract is recognised when the expected benefits to be derived by the Group from a contract are lower than the unavoidable cost of meeting its obligations under the contract. The provision is measured at the present value of the lower of the expected cost of terminating the contract and the expected net cost of continuing with the contract. (n) Revenue Revenue is recognised to the extent that it is probable that the economic benefits will flow to the Group and the revenue can be reliably measured, regardless of when the payment is being made. Revenue is measured at the fair value of the consideration received or receivable, taking into account contractually defined terms of payment and excluding taxes or duty. Revenue mainly comprises of containerized stevedoring and other containerized revenue. Non containerized revenue mainly includes logistic and storage services. The following specific recognition criteria must also be met before revenue is recognised: Rendering of services Revenue from the rendering of containerized stevedoring and other containerized services is recognised on the delivery of those services, once the relevant throughput has taken place (completion of the shipping or transport operation). For logistics storage, revenue is recognised over the period during which storage is provided and for its handling and transport operations on completion of service. Service concession arrangements Revenues relating to construction contracts which are entered into with local authorities for the construction of the infrastructure necessary for the provision of services are measured at the fair value of the consideration received or receivable. (o) Finance income and expense Finance income comprises interest income on funds invested and gains on hedging instruments that are recognised in the consolidated income statement. Interest income is recognised as it accrues, using the effective interest method. Finance costs comprises interest expense on borrowings, unwinding of the discount on provisions, impairment losses recognised on financial assets and losses on hedging instruments that are recognised in the consolidated income statement. Finance income and expense also include realised exchange gains and losses. (p) Income tax Income tax expense comprises current and deferred tax. Income tax expense is recognised in the consolidated income statement except to the extent that it relates to a business combination, or items recognised directly in other comprehensive income. Income tax expense also includes any interest, fines and penalties payable to tax authorities. Current tax is the expected tax payable on the taxable income for the year, using tax rates enacted or substantively enacted at the reporting date in the countries where the Group operates and generates taxable income. It also includes any adjustment to tax payable in respect of previous years. Deferred tax is recognised using the liability method, providing for temporary differences between the carrying amounts of assets and liabilities for financial reporting purposes and the amounts used for taxation purposes. Deferred tax is not recognised for: the temporary differences arising on the initial recognition of goodwill and the initial recognition of assets or liabilities in a transaction that is not a business combination and that affects neither accounting nor taxable profit or loss; and the temporary differences relating to investments in subsidiaries and jointly controlled entities to the extent that they probably will not reverse in the foreseeable future. Deferred tax is measured at the tax rates that are expected to be applied to the temporary differences when they reverse, based on the laws that have been enacted or substantively enacted by the reporting date. A deferred tax asset is recognised for unused tax losses, tax credits and deductible temporary differences, to the extent that it is probable that future taxable profits will be available against which they can be utilized. Deferred tax assets are reviewed at each reporting date and are reduced to the extent that it is no longer probable that the related tax benefit will be realized.
51 Business Review corporate governance FINANCIAL STATEMENTS Deferred tax assets and deferred tax liabilities are offset, if there is a legally enforceable right to offset current tax assets against current tax liabilities and the deferred taxes relate to the same taxable entity and the same taxation authority or different taxable entities where there is an intention to settle the balance on a net basis. (q) Discontinued operation A discontinued operation is a component of the Group s business that represents a separate major line of business or geographical area of operations that has been disposed of or is held for sale. Classification as a discontinued operation occurs upon disposal or when the operation meets the criteria to be classified as held for sale, if earlier. When an operation is classified as a discontinued operation, the comparative consolidated income statement and consolidated statement of comprehensive income is restated as if the operation had been discontinued from the start of the comparative period. In the consolidated income statement of the reporting period, and of the comparable period of the previous year, income and expenses from discontinued operations are reported separately from income and expenses from continuing operations, down to the level of profit after taxes, even when the Group retains a non-controlling interest in the subsidiary after the sale. The resulting profit or loss (after taxes) is reported separately in the consolidated income statement and disclosed in the Notes to the consolidated financial statements. (r) Earnings per share The Group presents basic earnings per share ( EPS ) data for its ordinary shares. Basic EPS is calculated by dividing the profit or loss attributable to ordinary shareholders of the Company by the weighted average number of ordinary shares outstanding during the year. Diluted EPS is determined by adjusting the profit or loss attributable to ordinary shareholders and the weighted average number of ordinary shares outstanding, adjusted for own shares held, for the effects of all dilutive potential ordinary shares, which comprise convertible notes and share options granted to employees. (s) Segment reporting An operating segment is a component of the Group that engages in business activities from which it may earn revenue and incur expenses, including revenues and expenses that relate to transactions with any of the Group s other components. All operating segments operating results are reviewed regularly by the Group s Board of Directors to assess performance. Segment results that are reported to the Board of Directors include items directly attributable to a segment as well as those that can be allocated on a reasonable basis. Unallocated items comprise mainly corporate assets (primarily Company s head office), head office expenses and income tax assets and liabilities. Segment capital expenditure is the total cost incurred during the year to acquire property, plant and equipment, and port concession rights other than goodwill. (t) Separately disclosed items The Group presents, as separately disclosed items on the face of the consolidated income statement, those items of income and expense which, because of the nature and expected infrequency of the events giving rise to them, merit separate presentation to allow users to understand better the elements of financial performance in the period, so as to facilitate a comparison with prior periods and a better assessment of trends in financial performance. (u) New standards and interpretation not yet effective A number of new standards, amendments to standards and interpretations are not yet effective for annual periods beginning after 1 January, and have not been applied in preparing these consolidated financial statements. These are: IFRS 9 Financial Instruments ( and ) The standard is effective for annual periods beginning on or after 1 January 2013 and will change the classification and measurement of financial assets. The management anticipates that above standard and interpretation will be adopted by the Group to the extent applicable to them from their effective dates. The extent of the impact on adoption of these standards, amendments and interpretations has not been determined. (v) New standards and interpretations early adopted The Group has opted to early adopt the revised IAS 24 Related Parties (2008) in so far as it pertains to government related entities. The revised standard provides some relief from the disclosure requirements of IAS 24 in relation to government entities. The impact of the early adoption does not impact the current disclosure provided by the entity. 4 Determination of fair values A number of the Group s accounting policies and disclosures require the determination of fair value, for both financial and nonfinancial assets and liabilities. Fair values have been determined for measurement and/or disclosure purposes based on the following methods. When applicable, further information about the assumptions made in determining fair values is disclosed in the Notes specific to that asset or liability. (i) Property, plant and equipment The fair value of property, plant and equipment recognised as a result of a business combination is based on market values. The market value of property is the estimated amount for which a property could be exchanged on the date of valuation between a willing buyer and a willing seller in an arm s length transaction after proper marketing wherein the parties had each acted knowledgeably, prudently and without compulsion. The market value of items of plant, equipment, fixtures and fittings is based on the quoted market prices for similar items. 49
52 Notes to consolidated financial statements continued (forming part of the financial statements) 4 Determination of fair values continued (ii) Port concession rights Port concession rights acquired in a business combination are accounted at their fair values. The fair value is based on the discounted cash flows expected to be derived from the use and eventual sale of the assets. (iii) Investments in debt securities and available-for-sale financial assets The fair values of equity and debt securities are determined by reference to their quoted closing bid price at the reporting date. The fair value of the unquoted infrastructure investment fund classified as available-for-sale is based on the independent valuation of the fund. The fair value of investments in unquoted bonds is determined based on the discounted cash flows at a market related discount rate. The fair value of debt securities held to maturity is determined for disclosure purpose only. (iv) Trade and other receivables/payables The fair value of trade and other receivables and trade and other payables approximates to book value due to the short-term maturity of these instruments. (v) Derivatives The fair value of forward exchange contracts and interest rate swaps is based on the bank quotes at the reporting dates. (vi) Non-derivative financial liabilities Fair value for quoted bonds is based on their clean market price as at the reporting date. Other loans include term loans and finance leases. These are largely at variable interest rates and therefore, the book value normally equates to the fair value. The fair value of bank balances and cash and bank overdrafts approximates to the book value due to the short-term maturity of these instruments. 5 Financial risk management Overview The Group has exposure to the following risks from its use of financial instruments: credit risk liquidity risk market risk This Note presents information about the Group s exposure to each of the above risks, the Group s objectives, policies and processes for measuring and managing risk. Further quantitative disclosures are included throughout these consolidated financial statements. Risk management framework The Board of Directors have overall responsibility for the establishment and oversight of the Group s risk management framework. The Group s risk management policies are established to identify and analyse the risks faced by the Group, to set appropriate risk limits and controls, and to monitor risks and adherence to limits. The Group, through its training and management standards and procedures, aims to develop a disciplined and constructive control environment in which all employees understand their roles and obligations. The Group Audit Committee oversees how management monitors compliance with the Group s risk management policies and procedures and reviews the adequacy of the risk management framework in relation to the risks faced by the Group. The Group Audit Committee is assisted in its oversight role by Internal Audit. Internal Audit undertakes both regular and ad-hoc reviews of risk management controls and procedures, the results of which are reported to the Audit Committee. (a) Credit risk Credit risk is the risk of financial loss to the Group if a customer fails to meet its contractual obligations, and arises principally from the Group s receivables from customers, due from related parties and investment securities. Trade and other receivables The Group trades only with recognised and creditworthy third parties. It is the Group s policy that all customers who wish to trade on credit terms are subject to credit verification procedures and are required to submit financial guarantees based on their creditworthiness. In addition, receivable balances are monitored on an ongoing basis with the result that the Group s exposure to bad debts is not significant. The Group establishes an allowance for impairment that represents its estimate of incurred losses in respect of trade and other receivables. The main components of this allowance are a specific loss component that relates to individually significant exposures, and a collective loss component established for groups of similar assets in respect of losses that have been incurred but not yet identified. The collective loss allowance is determined based on historical data of payment statistics for similar financial assets after taking into account the impact of the current global financial crisis on the Group s major customers. 50 Other financial assets Credit risk arising from other financial assets of the Group comprises cash and cash equivalents and certain derivative instruments.
53 Business Review corporate governance FINANCIAL STATEMENTS The Group s exposure to credit risk arises from default of the counterparty, with a maximum exposure equal to the carrying amount of these instruments. The Group manages its credit risks with regard to bank deposits, throughout the Group, through a number of controls, which include assessing the credit rating of the bank either from public credit ratings, or internal analysis where public data is not available and consideration of the support for financial institutions from their central banks or other regulatory authorities. Financial guarantees The Group s policy is to consider the provision of a financial guarantee to wholly-owned subsidiaries, where there is a commercial rationale to do so. Guarantees may also be provided to associates and joint ventures in very limited circumstances and always only for the Group s share of the obligation. The provision of guarantees always requires the approval of senior management. (b) Liquidity risk Liquidity risk is the risk that the Group will not be able to meet its financial obligations as they fall due. The Group s approach to managing liquidity is to ensure, as far as possible, that it will always have sufficient cash to meet its liabilities when due, under both normal and stressed conditions, without incurring unacceptable losses or risking damage to the Group s reputation. The Group s objective is to maintain a balance between continuity of funding and flexibility through the use of bank facilities and by ensuring adequate internally generated funds. The Group s terms of business require amounts to be paid within 60 days of the date of provision of the service. Trade payables are normally settled within 45 days of the date of purchase. (c) Market risk Market risk is the risk that changes in market prices, such as foreign exchange rates and interest rates will affect the Group s income or the value of its holdings of financial instruments. The objective of market risk management is to manage and control market risk exposures within acceptable parameters, while optimising the return. The Group buys and sells derivatives and also incurs financial liabilities, in order to manage market risks. All such transactions are carried out within the guidelines set by the Board of Directors in the Group Treasury Policy. Generally, the Group seeks to apply hedge accounting in order to manage the volatility in the consolidated income statement. (i) Currency risk The proportion of the Group s net operating assets denominated in foreign currencies (i.e. other than the functional currency of the Company, UAE Dirhams) is approximately 71% (: 86%) with the result that the Group s USD consolidated statement of financial position, and in particular owner s equity, can be affected by currency movements when it is retranslated at each period end rate. The Group partially mitigates the effect of such movements by borrowing in the same currencies as those in which the assets are denominated and using cross currency swaps. The impact of currency movements on operating profit is partially mitigated by interest costs being incurred in foreign currencies. The Group operates in some locations where the local currency is fixed to the Group s reporting currency of USD further reducing the risk of currency movements. Interest on borrowings is denominated in the currency of the borrowings. Generally, borrowings are denominated in currencies that match the cash flows generated by the underlying foreign operations of the Group. This provides an economic hedge without derivatives being entered into and therefore hedge accounting is not applied in these circumstances. A portion of the Group s activities generate part of their revenue and incur some costs outside their main functional currency. Due to the diverse number of locations in which the Group operates there is some natural hedging that occurs within the Group. When it is considered that currency volatility could have a material impact on the results of an operation, hedging using forward foreign currency contracts, is undertaken to reduce the short-term effect of currency movements. When the Group s businesses enter into capital expenditure or lease commitments in currencies other than their main functional currency, these commitments are hedged in most instances using forward contracts and currency swaps in order to fix the cost when converted to the functional currency. The Group classifies its forward exchange contracts hedging forecast transactions as cash flow hedges and states them at fair value. (ii) Interest rate risk The Group s exposure to the risk of changes in market interest rates relates primarily to the Group s long-term debt obligations with a fixed/floating interest rate and bank deposits. The Group issued two fixed rate bonds, a 10 year Sukuk with a profit rate of 6.25% and a 30 year Medium Term Note with a coupon of 6.85% which collectively represents USD 3,250,000 thousand of the Group s year end outstanding debt. Approximately USD 4,172,700 thousand (: USD 4,315,094 thousand) of the Group s interest bearing loans and borrowings comprising US Dollar, Great British Pound, Indian Rupee, and Canadian Dollar borrowings carried interest at floating rates. The Group s policy is to manage its interest cost by entering into interest rate swap agreements, in which the Group agrees to exchange, at specified intervals, the difference between fixed and variable rate interest amounts calculated by reference to an agreed-upon notional principal amount. These swaps are designated to hedge underlying debt obligations. At 31 December, after taking into account the effect of interest rate swaps, approximately 70% (: 70%) of the Group s borrowings are at a fixed rate of interest. 51
54 Notes to consolidated financial statements continued (forming part of the financial statements) 5 Financial risk management continued Capital management The Board s policy is to maintain a strong capital base so as to maintain investor, creditor and market confidence and to sustain future development of the business. The Board of Directors monitors the return on capital, which the Group defines as net operating profit attributable to the equity shareholders divided by total shareholders equity. The primary objective of the Group s capital management is to ensure that it maintains a strong credit rating and healthy capital ratios in order to support its business and maximise shareholder value. The Board seeks to maintain a balance between the higher returns that might be possible with higher levels of borrowings and the advantages and security afforded by a sound capital position. Neither the Company nor any of its subsidiaries are subject to externally imposed capital requirements. 6 Segment information Based on the internal management reports that are reviewed by the Board of Directors based on the location of the Group s assets and liabilities, the Group has identified the following geographic areas as its basis of segmentation. Asia Pacific and Indian subcontinent Australia and Americas Middle East, Europe and Africa Each of these operating segments have an individual appointed as Segment Director responsible for these segments, who in turn reports to the Chief Operating Decision Maker. Information regarding the results of each reportable segment is included below. Performance is measured based on segment profit before income tax, as included in the internal management reports that are reviewed by the Group s Board of Directors. The following table presents certain results, assets and liabilities information regarding the Group s geographical segments as at the reporting date. Asia Pacific and Indian subcontinent Australia and Americas Middle East, Europe and Africa Head office Inter segment Total Revenue from operations 571, , , ,299 1,741,727 1,748,155 3,188,941 2,929,229 Segment results from operations 1 157, , ,154 74, , ,166 (136,449) (144,515) 747, ,305 Finance income 89,395 85,492 89,395 85,492 Finance costs (385,806) (356,728) (385,806) (356,728) Profit/(Loss) for the year 157, , ,154 74, , ,166 (432,860) (415,751) 451, ,069 1 Segment results from operations comprise profit for the year before net finance cost. Net finance cost and tax expense have not been allocated to various geographical locations and are instead reported in head office. Asia Pacific and Indian subcontinent Australia and Americas Middle East, Europe and Africa Head office Inter segment Total Segment assets 5,344,059 5,224,976 3,755,601 3,155,830 8,443,788 8,518,785 9,517,703 9,548,960 (7,701,607) (7,488,015) 19,359,544 18,960,536 Segment liabilities 417, , , ,082 1,302,420 1,064,811 8,388,042 8,592,321 (949,758) (742,544) 9,672,041 9,491,582 Tax liabilities 1 1,191,577 1,431,509 1,191,577 1,431,509 Total liabilities 417, , , ,082 1,302,420 1,064,811 9,579,619 10,023,830 (949,758) (742,544) 10,863,618 10,923,091 Capital expenditure 241, , , , , ,710 3,122 57, , ,493 Acquisition of land 191, ,982 Depreciation 36,465 25,451 77,087 55, , ,672 4,338 3, , ,755 Amortisation/impairment 62,568 51,970 45,311 33,182 55,151 62, , ,462 Share of profit/(loss) of equity-accounted investees before separately disclosed items 95,763 48,393 34,800 23,831 9,640 (917) 140,203 71,307 Tax expense 53,174 55,128 53,174 55,128 1 Tax liabilities have not been allocated to various geographical locations and are reported in head office. 52
55 Business Review corporate governance FINANCIAL STATEMENTS Earnings before interest, tax, depreciation and amortisation ( EBITDA ) Adjusted Asia Pacific and Indian subcontinent Australia and Americas Middle East, Europe and Africa Head office Inter segment Total Revenue before separately disclosed items 460, , , ,299 1,741,727 1,748,155 3,078,076 2,821,017 Profit/(loss) for the year 157, , ,154 74, , ,166 (432,860) (415,751) 451, ,069 Adjusted for separately disclosed items (2,200) (16,074) (16,449) (25,578) 7,874 17,583 (3,628) (1,066) (37,406) Adjusted net profit/(loss) for the year before separately disclosed items 155, , ,705 49, , ,040 (415,277) (419,379) 450, ,663 Finance income (89,395) (72,950) (89,395) (72,950) Finance costs 368, , , ,728 Tax expense 53,174 54,441 53,174 54,441 Depreciation and amortisation 99,033 75, ,698 88, , ,108 4,338 3, , ,560 EBITDA (Adjusted) 254, , , , , ,148 (78,937) (78,158) 1,240,452 1,072,442 7 Revenue from operations Revenue from operations comprise of: Containerized stevedoring revenue 1,606,914 1,425,255 Containerized other revenue 905, ,281 Non-containerized revenue 565, ,481 Service concession revenue 110, ,212 3,188,941 2,929,229 The Group does not have revenue from transactions with any customers exceeding 10 per cent of the Group s revenue. 8 Profit for the year Profit for the year is stated after charging the following costs: Staff costs 674, ,043 Depreciation, amortisation and impairment 462, ,217 Operating lease rentals 296, ,610 53
56 Notes to consolidated financial statements continued (forming part of the financial statements) 9 Finance income and expenses Financial income Interest income 82,405 71,392 Exchange gains 6,590 14,100 Other net financing income in respect of pension plans ,395 85,492 Financial expenses Interest payable (368,547) (353,628) Exchange losses (13,059) Other net financing expense in respect of pension plans (4,200) (3,100) (385,806) (356,728) Net finance costs (296,411) (271,236) 10 Income tax The major components of income tax expense for the year ended 31 December : Current income tax expense Current year 47,125 57,149 Adjustment for prior periods 2,791 28,270 49,916 85,419 Deferred tax expense/credits 3,258 (31,291) 53,174 54,128 Income tax expense from continuing operations 53,174 54,128 Share of income tax of equity-accounted investees 37,111 12,509 Total tax charge 90,285 66,637 Current income tax liabilities 84, ,655 All tax items included within separately disclosed items are detailed in Note 11. The Group is not subject to income tax on its UAE operations. The tax expense relates to the tax payable on the profit earned by the overseas subsidiaries, associates and joint ventures as adjusted in accordance with the taxation laws and regulations of the countries in which they operate. The applicable tax rates in the regions in which the Group operates are set out below: Applicable Geographical segments corporate tax rate Asia Pacific and Indian subcontinent 16.5% to 35.0% Australia and Americas 25.0% to 35.0% Middle East, Europe and Africa 0% to 34.0% 54
57 Business Review corporate governance FINANCIAL STATEMENTS The relationship between the tax expense and the accounting profit can be explained as follows: Net profit before tax 504, ,197 Tax at the Group s domestic tax rate Higher income tax on foreign earnings 96,941 55,438 Permanent differences including non-taxable income and non-deductible expenses 4,929 20,896 Profit not subject to tax (4,975) Tax charge on equity-accounted investees 37,111 12,509 Current year losses not recognised for deferred tax asset 17,700 9,299 Brought forward losses utilised (6,186) (12,496) Deferred tax in respect of fair value adjustments (48,787) (18,718) Others (34,410) 4,173 Tax expense before prior year adjustments 67,298 66,126 Tax under/(over) provided in prior periods: current tax 2,791 28,270 deferred tax 20,196 (27,759) Total tax expense from operations 90,285 66,637 Net profit before tax 504, ,197 Adjustment for profit on sale/termination of business (13,200) (44,276) Adjustment for share of income tax of equity-accounted investees 37,111 12,509 Adjusted profit before tax 528, ,430 Effective tax rate 17.1% 17.0% Unrecognised deferred tax assets Deferred tax is not recognised on trading losses of USD 450,451 thousand (: USD 565,831 thousand) where utilisation is uncertain, either because they have not been agreed with tax authorities, or because the likelihood of future taxable profits is not sufficiently certain, or because of the impact of tax holidays on infrastructure projects. Under current legislation, USD 427,745 thousand (: USD 531,299 thousand) of these trading losses can be carried forward indefinitely. Deferred tax is also not recognised on capital and other losses of USD 451,017 thousand (: USD 490,404 thousand) due to the fact that their utilisation is uncertain. Under current legislation, all of these capital and other losses can be carried forward indefinitely. 55
58 Notes to consolidated financial statements continued (forming part of the financial statements) 10 Income tax continued Movement in temporary differences during the year: 1 January Recognised in consolidated income statement Translation and other movements 31 December Deferred tax liability Depreciation for property, plant and equipment 116,912 18,628 4, ,737 Investment in equity-accounted investees 14,275 3,350 (393) 17,232 Fair value adjustment on acquisitions 777,271 (44,120) (211,979) 521,171 Financial instruments 1, ,219 Others 394,661 2,690 29, ,914 Total 1,304,854 (19,452) (178,129) 1,107,273 Deferred tax assets Depreciation for property, plant and equipment 9,946 (5,281) (68) 4,597 Employees end of service benefits 26, (15,196) 12,190 Deferred financing charges 29,327 (24,228) (3,887) 1,213 Provisions 3,696 (6,957) 6,213 2,952 Tax value of losses carried forward recognised 27,597 8,379 12,084 48,061 Others 6,389 4,475 6,510 17,372 Total 103,439 (22,710) 5,656 86, Separately disclosed items Construction contract revenue relating to service concessions 110, ,212 Construction contract costs relating to service concessions (110,865) (108,212) Impairment, project development and restructuring costs (3,700) (20,755) Other income 8,905 3,000 Share of profit/(loss) of equity-accounted investees 244 (1,970) Profit on sale/termination of business 13,200 44,276 (Loss)/Gain on interest rate swaps and currency options (17,583) 42 Foreign exchange gain 12,500 Deferred tax expense 313 1,066 37,406 Construction contract revenue and costs In the current year, in accordance with IFRIC 12 Service Concession Arrangements, the Group has recorded revenue of USD 110,865 thousand (: USD 108,212 thousand) on construction of a port. The construction revenue represents the fair value of the construction services provided in developing the port. No margin has been recognised, as in management s opinion the fair value of the construction services provided approximates the construction cost. Impairment, project development and restructuring costs includes impairment loss on a property held in the Australia and Americas region (: mainly represents impairment of certain cranes in Middle East, Europe and Africa region and project development and restructuring costs). Other income mainly relates to certain insurance claim settlements of a non-recurring nature in the Australia and Americas region (: mainly included one-off recoveries from a legal claim). Share of profit/(loss) of equity accounted investees mainly relates to profit on sale of an investment by a Joint Venture in Asia Pacific and Indian Subcontintent region which is partially offset by non-recurring income tax expense incurred on transfer of certain assets by another associate in the same region, and operating loss of an associate in the Australia and Americas region (: includes share of loss on sale of certain assets in the Asia Pacific and Indian subcontinent region). 56
59 Business Review corporate governance FINANCIAL STATEMENTS Profit on sale/termination of business mainly includes the profit on sale of investment in an associate in the Australia and Americas region (: mainly includes profit on sale of investments divested in the Australia and Americas region). (Loss)/Gain on interest rate swaps represents USD 6,200 thousand recycling of hedge reserve to consolidated income statement in Middle East, Europe and Africa region and USD 11,383 thousand loss on foreign currency options related to the Australia and Americas region. Foreign exchange gain : Nil (: mainly relates to recycling of foreign exchange from translation reserve to the consolidated income statement as the loan no longer meets the criteria of a net investment hedge in a subsidiary in the Australia and Americas region). Deferred tax expense : Nil (: represents reversal of deferred tax credit on impairment of cranes in the Middle East, Europe and Africa region). 12 Property, plant and equipment Land and buildings Plant and equipment Ships Capital workin-progress Total Cost: As at 1 January 2,677,914 2,680,045 46, ,005 6,031,602 Additions during the year 41,212 83,959 81, , ,108 Transfer to assets held for sale (refer to Note 28(a)) (195,319) (523,841) (31,119) (750,279) Transfers from capital work-in-progress 453, ,320 (684,374) Translation adjustment 25,307 62,309 4,272 (3,081) 88,807 Disposals (1,237) (42,706) (927) (44,870) As at 31 December 3,000,931 2,491, , ,271 6,227,368 Depreciation: As at 1 January 307, ,698 10,709 1,172,402 Charge for the year 98, ,485 9, ,060 Transfer to assets held for sale (refer to Note 28(a)) (53,757) (301,285) (355,042) Translation adjustment 12,922 40,445 1,235 54,602 On disposals (927) (28,017) (927) (29,871) As at 31 December 364, ,326 20,135 1,141,151 Net book value: As at 31 December 2,636,241 1,734, , ,271 5,086,217 In the prior years, the Group had entered into agreements with third parties pursuant to which the Group participated in a series of linked transactions including leasing and sub-leasing of certain cranes of the Group (the Crane French Lease Arrangements ). At 31 December, cranes with aggregate net book value amounting to USD 320,188 thousand (: USD 335,926 thousand) were covered by these Crane French Lease Arrangements. These cranes are accounted for as property, plant and equipment as the Group retains all the risks and rewards incidental to the ownership of the underlying assets. At 31 December, property, plant and equipment with a carrying amount of USD 596,856 thousand (: USD 1,238,888 thousand) are pledged to secure bank loans (refer to Note 25). At 31 December, the net carrying value of the leased plant and equipment and other assets was USD 839,008 thousand (: USD 447,990 thousand). Borrowing costs capitalised to property, plant and equipment amounted to USD 39,781 thousand (: USD 10,191 thousand) with a capitalisation rate in the range of 7% to 8% per annum (: 6.75% to 8% per annum). The net carrying value of property, plant and equipment transferred to assets held for sale comprises USD 392,198 thousand for Australia region (refer to Note 28 (a)) and balance USD 3,039 thousand for other regions (refer to Note 28 (b)). 57
60 Notes to consolidated financial statements continued (forming part of the financial statements) 12 Property, plant and equipment continued Land and buildings Plant and equipment Ships Capital workin-progress Total Cost: As at 1 January 2,034,319 2,188,327 88, ,015 5,199,119 Additions during the year 243,193 48, , ,234 Transfer to assets held for sale (refer to Note 28(b)) (15,973) (15,973) Transfer (to)/from port concession rights (refer to Note 13) (104,765) 112,595 (51,264) (43,434) Transfers from capital work-in-progress 477, ,056 (777,653) Translation adjustment 44, ,260 8,992 35, ,862 Disposals (1,377) (118,224) (51,365) (4,240) (175,206) As at 31 December 2,677,914 2,680,045 46, ,005 6,031,602 Depreciation: As at 1 January 204, ,596 55, ,436 Charge for the year 83, ,043 2, ,755 Transfer from port concession rights 8,770 8,770 Translation adjustment 12,034 73,407 3,538 88,979 On disposals (980) (86,348) (51,210) (138,538) As at 31 December 307, ,698 10,709 1,172,402 Net book value: As at 31 December 2,369,919 1,826,347 35, ,005 4,859, Goodwill and port concession rights Goodwill Port concession rights Total Cost: As at 1 January 2,424,689 4,714,661 7,139,350 Additions 226, ,606 Disposals (2,628) (2,628) Transfer to assets held for sale (refer to Note 28(a)) (846,748) (871,583) (1,718,331) Translation adjustment 92,360 51, ,446 As at 31 December 1,670,301 4,118,142 5,788,443 Amortisation: As at 1 January 540, ,466 Charge for the year 159, ,330 On disposals (2,324) (2,324) Transfer to assets held for sale (refer to Note 28(a)) (190,961) (190,961) Translation adjustment 33,818 33,818 As at 31 December 540, ,329 Net book value: As at 31 December 1,670,301 3,577,813 5,248,114 58
61 Business Review corporate governance FINANCIAL STATEMENTS Port concession rights include concession agreements which are mainly accounted for as business combinations and acquisitions. These concessions were determined to have finite and indefinite useful lives based on the terms of the respective concession agreements and the income approach model was used for the purpose of determining their fair values. Goodwill Port concession rights Total Cost: As at 1 January 2,154,165 4,259,864 6,414,029 Additions 3, , ,771 Disposals (34,777) (188,959) (223,736) Transfer from property, plant and equipment (refer to Note 12) 43,434 43,434 Other capitalisations 122, ,511 Translation adjustment 301, , ,341 As at 31 December 2,424,689 4,714,661 7,139,350 Amortisation: As at 1 January 419, ,337 Charge for the year 147, ,462 On disposals (62,300) (62,300) Transfer to property, plant and equipment (8,770) (8,770) Other capitalisations 4,552 4,552 Translation adjustment 40,185 40,185 As at 31 December 540, ,466 Net book value: As at 31 December 2,424,689 4,174,195 6,598, Impairment testing Goodwill acquired through business combinations and port concession rights with indefinite useful lives have been allocated to various cash-generating units ( CGU ), which are reportable business units, for the purposes of impairment testing. Impairment testing is done at an operating port level that represents individual CGUs. Details of the operating segments are shown below: Cash-generating units aggregated by operating segment Carrying amount of goodwill Carrying amount of port concession rights Discount rates Perpetuity growth rate Asia Pacific and Indian subcontinent 275, , % 15.50% 2.50% 5.00% Australia and Americas 332, , % 14.50% 2.50% Middle East, Europe and Africa 1,061,995 1,207,489 1,004,851 1,043, % 12.50% 2.50% 4.00% Total 1,670,301 2,424,689 1,004,851 1,043,111 The recoverable amount of the CGU has been determined based on their value in use calculated using cash flow projections based on the financial budgets approved by management covering a three year period and a further outlook for five years, which is considered appropriate in view of the outlook for the industry and the long-term nature of the concession agreements held i.e. generally for a period of years. Key assumptions used in value in use calculations The following describes each key assumption on which management has based its cash flow projections to undertake impairment testing of goodwill and port concession rights with indefinite useful lives. 59
62 Notes to consolidated financial statements continued (forming part of the financial statements) 14 Impairment testing continued Budgeted margins The basis used to determine the value assigned to the budgeted margin is the average gross margin achieved in the year immediately before the budgeted year, adjusted for expected efficiency improvements, price fluctuations and manpower costs. Discount rates These represent the cost of capital for the Group adjusted for the respective location risk factors. The Group uses the post-tax Weighted Average Cost of Capital which reflects the country specific risk adjusted discounted rate. Cost inflation The forecast general price index is used to determine the cost inflation during the budget year for the relevant countries where the Group is operating. Perpetuity growth rate In management s view, the perpetuity growth rate is the minimum growth rate expected to be achieved beyond the eight year period. These are based on the overall regional economic growth and Group s internal capacity changes for a given region. The Group also takes into account competition and regional capacity growth to provide a comprehensive growth assumption for the entire portfolio. The values assigned to key assumptions are consistent with the past experience of management. Sensitivity to changes in assumptions The calculation of value in use for the CGU is sensitive to future earnings and therefore a sensitivity analysis was performed. The analysis demonstrated that a 10% decrease in earnings for a future period of three years from the reporting date would not result in any impairment. 15 Investment in equity-accounted investees Summary financial information for equity-accounted investees, not adjusted for the percentage ownership held by the Group: Asia Pacific and Indian Subcontinent Australia and Americas Middle East, Europe and Africa Total Current assets 397, , , , , ,766 1,121,831 1,120,373 Non-current assets 7,381,166 6,905, , ,555 2,877,660 2,996,665 11,092,418 10,714,478 Total assets 7,778,852 7,363,108 1,236,131 1,203,312 3,199,266 3,268,431 12,214,249 11,834,851 Current liabilities 929, , ,751 96, , ,970 1,236, ,619 Non-current liabilities 1,255,237 1,562, , , , ,454 2,432,277 2,853,547 Total liabilities 2,185,067 2,310, , ,947 1,109,069 1,082,424 3,668,638 3,848,166 Revenue 1,036, , , , , ,538 2,167,538 1,827,175 Expenses (823,137) (671,968) (429,811) (473,644) (586,595) (534,868) (1,839,543) (1,680,480) Net profit 213,247 80,895 63,922 62,130 50,826 3, , ,695 The Group s share of profit from equity-accounted investees (before separately disclosed items) 140,203 71,307 The Group s investments in equity-accounted investees as at 31 December 3,474,113 3,453,833 For ownership percentages in equity-accounted investees, refer to Note Other investments Non-current investments Debt securities held to maturity 14,429 14,729 Available-for-sale financial assets 51,439 50,560 65,868 65,289 Debt securities held to maturity carries an effective interest rate of 5.35% per annum (: 5.35% per annum). 60
63 Business Review corporate governance FINANCIAL STATEMENTS Available-for-sale financial assets consist of unquoted investment in an Infrastructure Fund. The movement schedule for these investments is as follows: As at 1 January 50,560 36,815 Return of capital during the year (260) Change in fair value recognised in other comprehensive income 1,139 13,745 As at 31 December 51,439 50, Accounts receivable and prepayments Noncurrent Current Total Trade receivables (net) 1, , ,742 Advances paid to suppliers 13,653 13,653 Other receivables and prepayments 51, , ,794 Fair value of derivative financial instruments ,770 10,970 Employee benefit assets (refer to Note 24) Due from related parties (refer to Note 27) 34,512 97, ,935 88, , ,594 Non-current Current Total Trade receivables (net) 289, ,870 Advances paid to suppliers 14,846 14,846 Other receivables and prepayments 43, , ,386 Fair value of derivative financial instruments ,100 Employee benefit assets (refer to Note 24) 1,300 1,300 Due from related parties (refer to Note 27) 28,844 91, ,223 74, , ,725 The Group s exposure to credit and currency risks related to trade receivables, other receivables and due from related parties are disclosed in Note Bank balances and cash Cash at banks and in hand 443, ,255 Short-term deposits 2,076,074 2,023,460 Deposits under lien 368,351 Bank balances and cash 2,519,616 2,910,066 Bank overdrafts (3,000) (11,500) 2,516,616 2,898,566 Cash classified as held for sale (refer to Note 28(a)) 50,900 Cash and cash equivalents for statement of cash flows 2,567,516 2,898,566 Short-term deposits are made for varying periods of between one day and three months depending on the immediate cash requirements of the Group and earn interest at the respective short-term deposit market rates. Bank overdrafts are repayable on demand. 61
64 Notes to consolidated financial statements continued (forming part of the financial statements) 18 Bank balances and cash continued There are no deposits under lien (: USD 368,351 thousand) as at 31 December. The previous year deposits under lien include deposit of USD 348,669 thousand which was placed to collateralise some of the Group s regional borrowings and a deposit of USD 19,682 thousand in respect of certain loan notes issued to the erstwhile shareholders of Peninsular & Oriental Steam Navigation Company Limited ( P&O ). 19 Share capital The share capital of the Company as at 31 December was as follows: Authorised 25,000,000,000 ordinary shares of USD 0.10 each 2,500,000 2,500,000 Issued and fully paid 16,600,000,000 ordinary shares of USD 0.10 each 1,660,000 1,660, Reserves Share premium Share premium represents surplus received over and above the nominal cost of the shares issued to the shareholders and forms part of the shareholder equity. The reserve is not available for distribution except in circumstances as stipulated by the law. Shareholders reserve Shareholders reserve forms part of the distributable reserves of the Group. Hedging reserve The hedging reserve comprises the effective portion of the cumulative net change in the fair value of the cash flow hedging instruments related to hedge transactions that have not yet occurred. Other reserves The other reserves mainly include statutory reserves of subsidiaries as required by applicable local legislations and share based payment transactions. This reserve also includes the unrealised fair value changes on available-for-sale investments. Actuarial reserve The actuarial reserve comprises the cumulative actuarial losses recognised in other comprehensive income. Translation reserve The translation reserve comprises all foreign currency differences arising from the translation of the financial statements of foreign operations whose functional currencies are different from that of the Group s presentation currency. It also includes foreign exchange translation differences arising from translation of goodwill and purchase price adjustments which are denominated in foreign currencies at the Group level. 21 Dividends Declared and paid during the year: Final dividend for : 0.82 US cents per share (2008: 0.69 US cents per share) 136, ,540 Proposed for approval at the annual general meeting (not recognised as a liability as at 31 December): Final dividend for : 0.86 US cents per share (: 0.82 US cents per share) 142, ,120 62
65 Business Review corporate governance FINANCIAL STATEMENTS 22 Earnings per share Basic earnings per share The calculation of basic earnings per share is based on the profit attributable to ordinary shareholders and the weighted average number of ordinary shares outstanding. Profit attributable to ordinary shareholders 374, ,862 Number of shares Number of shares Number of ordinary shares outstanding as at 31 December 16,600,000,000 16,600,000,000 Basic earnings per share (US cents) USD USD The Company has no significant share options outstanding at the year end and therefore in management s opinion, the basic and diluted earnings per share are not significantly different. 23 Employees end of service benefits Movements in the provision recognised in the consolidated statement of financial position are as follows: As at 1 January 42,948 43,114 Provision made during the year 1 13,793 16,282 Amounts paid during the year (10,753) (16,448) As at 31 December 45,988 42,948 1 The provision for expatriate staff gratuities, included in employees end of service benefits, is calculated in accordance with the regulations of the Jebel Ali Free Zone Authority. This is based on the liability that would arise if employment of all staff were terminated at the reporting date. The UAE government had introduced Federal Labour Law No.7 of 1999 for pension and social security. Under this Law, employers are required to contribute 15% of the contribution calculation salary of those employees who are UAE nationals. These employees are also required to contribute 5% of the contribution calculation salary to the scheme. The Company s contribution is recognised as an expense in the consolidated income statement as incurred. 24 Pension and post-employment benefits Non-UAE region Reconciliation of assets and liabilities recognised in the consolidated statement of financial position Non-current Defined benefit schemes net liabilities 173, ,900 Liabilities from defined contribution schemes 2,400 Liability in respect of long-service leave 500 5,200 Liability for other non-current deferred compensation 2, , ,100 Current Liability for current deferred compensation 14,500 45,400 Net liabilities 188, ,500 63
66 Notes to consolidated financial statements continued (forming part of the financial statements) 24 Pension and post-employment benefits (continued) Net liabilities Reflected in the consolidated statement of financial position as follows: Employee benefits assets (included within non-current receivables (refer to Note 17)) (500) (1,300) Employee benefits liabilities: Non-current 174, ,400 Employee benefits liabilities: Current 14,500 45, , ,500 The defined benefit pension schemes net liabilities of USD 173,900 thousand (: USD 257,900 thousand) is in respect of the total P&O schemes shown below. The USD 5,200 thousand (: USD 6,500 thousand) net liabilities in respect of the P&O s share of associates and joint ventures are included within investments in associates and joint ventures in the consolidated statement of financial position. An expense of USD 37,300 thousand (: 28,700 thousand) has been recognised in the consolidated income statement in respect of employee benefits excluding pensions, USD 27,800 thousand (: USD 23,500 thousand) in general and administration expenses and USD 9,500 thousand (: USD 5,200 thousand) in cost of sales. The current portion of employee benefits liabilities includes a liability of USD 10,100 thousand (: USD 25,200 thousand) in respect of annual leave, USD 1,400 thousand (: USD 11,400 thousand) in respect of long-service leave, and USD 3,000 thousand (: USD 8,800 thousand) in respect of sick leave and other miscellaneous employee benefit items. Pensions P&O participates in a number of pension schemes throughout the world. The principal scheme is located in the UK (the P&O UK Scheme ). The P&O UK Scheme is a funded defined benefit scheme and was closed to routine new members on 1 January The assets of the scheme are managed on behalf of the trustee by independent fund managers. P&O also operates a number of smaller defined benefit and defined contribution schemes. In addition, P&O participates in various industry schemes, the most significant of which is the Merchant Navy Officers Pension Fund (the MNOPF Scheme ). These generally have assets held in separate trustee administered funds. Expenses recognised in the consolidated income statement of : Defined benefit pension schemes P&O UK scheme MNOPF scheme Other schemes Total Group schemes Share of equity accounted investees schemes P&O UK schemes Employer s current service cost 600 5,300 5, ,400 Expected return on scheme assets (101,500) (7,900) (9,000) (118,400) (1,100) (119,500) Interest cost 103,700 8,500 9, ,100 1, ,500 Total 2, , ,000 Total defined benefit expenses 2, ,200 9, ,400 Total defined contribution expense 26,100 4,400 30,500 Total 2, ,200 35,700 5,200 40,900 64
67 Business Review corporate governance FINANCIAL STATEMENTS Expenses recognised in the consolidated income statement of : Defined benefit pension schemes P&O UK scheme MNOPF scheme Other schemes Total Group schemes Share of equityaccounted investees schemes P&O UK schemes Employer s current service cost 300 4,700 5, ,200 Expected return on scheme assets (95,700) (6,900) (8,100) (110,700) (800) (111,500) Interest cost 96,800 8,100 8, , ,700 Total 1,100 1, , ,200 Total defined benefit expenses 1,400 1,200 5,500 8, ,400 Total defined contribution expense 23,200 4,100 27,300 Total 1,400 1,200 5,500 31,300 4,400 35,700 The expenses for defined benefit and defined contribution schemes are recognised in the following line items in the consolidated income statement of : Defined benefit pension schemes P&O UK scheme MNOPF scheme Other schemes Defined contribution pension schemes Total Group schemes Share of equityaccounted investees schemes Total Operating expenses 5,300 23,300 28,600 28,600 General and administration expenses 600 2,800 3,400 3,400 Share of results of equity-accounted investees 5,200 5, ,300 26,100 32,000 5,200 37,200 Financial expenses 2, ,700 3,700 Total 2, ,200 26,100 35,700 5,200 40,900 The expenses for defined benefit and defined contribution schemes are recognised in the following line items in the consolidated income statement of : Defined benefit pension schemes P&O UK scheme MNOPF scheme Other schemes Defined contribution pension schemes Total Group schemes Share of equityaccounted investees schemes Total Operating expenses 3,000 15,400 18,400 18,400 General and administration expenses 300 1,700 7,800 9,800 9,800 Share of results of equity-accounted investees 4,300 4, ,700 23,200 28,200 4,300 32,500 Financial expenses 1,100 1, , ,200 Total 1,400 1,200 5,500 23,200 31,300 4,400 35,700 65
68 Notes to consolidated financial statements continued (forming part of the financial statements) 24 Pension and post-employment benefits continued Total amount of actuarial losses gross of tax recognised in the other comprehensive income. Actuarial (gain)/losses recognised in the year (68,400) 162,200 Movement in minimum funding liability 13,300 (55,100) 162,200 Actuarial valuations and assumptions The latest valuations of the defined benefit schemes have been updated to 31 December by qualified independent actuaries. The principal assumptions are included in the table below. The assumptions used by the actuaries are the best estimates chosen from a range of possible actuarial assumptions, which, due to the timescale covered, may not necessarily be borne out in practice. P&O UK scheme MNOPF scheme Other schemes Share of equityaccounted investees schemes Discount rates 5.40% 5.40% 5.72% 6.00% Discount rates Bulk Annuity Asset 5.35% Expected rates of salary increases 4.60% 4.03% 4.50% Pension increases: deferment 3.00% 2.90% 3.31% 2.10% payment 3.00% 3.40% 3.31% 2.10% Inflation 3.60% 3.60% 3.41% 2.90% Inflation Bulk Annuity Asset 3.55% Expected rate of return on scheme assets 5.94% 6.68% 6.51% 6.30% P&O UK scheme MNOPF scheme Other schemes Share of equityaccounted investees schemes Discount rates 5.60% 5.60% 4.50% 6.20% Discount rates Bulk Annuity Asset 5.60% Expected rates of salary increases 4.70% 5.20% 3.00% 4.10% Pension increases: deferment 3.70% 3.70% payment 3.25% 3.50% 3.20% 2.10% Inflation 3.70% 3.70% 3.30% 2.90% Inflation Bulk Annuity Asset 3.70% Expected rate of return on scheme assets 6.02% 6.53% 6.80% 7.00% 66
69 Business Review corporate governance FINANCIAL STATEMENTS In addition to the assumption for expected rates of salary increases set out in the table above, a further allowance for pay increases of up to 3% per annum is applied to members of the P&O UK Scheme under 50 years of age, the allowance being greater at younger ages. The assumptions for pensioner longevity under both the P&O UK Scheme and the MNOPF Scheme are based on analysis of pensioner death trends under the respective schemes over many years. For the P&O UK Scheme the Light SAPS amounts tables S1PMA_L and S1NFA_L are used with multipliers of 113% and 106% for males and females respectively and adjustment to in line with CMI Medium Cohort projections. In addition an allowance has been made for future longevity improvements from in line with the CMI Core Projection model with a 2% per annum long-term trend. For the MNOPF scheme the Heavy SAPS amounts tables S1NMA_H and S1NFA_H are used for normal members with a multiplier of 80% and adjustment to in line with CMI Medium Cohort projections. In addition an allowance has been made for future longevity improvements from by assuming reductions of 2.5% a year in mortality rates until 2019 and 1.5% a year thereafter for members up to age 85. From age 85, these reductions decrease linearly to 0.5% a year at age 110. For illustration, the life expectancies for the two schemes at age 65 now and in the future are detailed in the table below. Age 65 now Male Female Age 65 in 20 years time Age 65 now Age 65 in 20 years time P&O UK Scheme MNOPF Scheme P&O UK Scheme MNOPF Scheme The expected long-term rates of return for each of the main asset classes are subjective judgements based on market indicators, economic background, historical analysis of returns and industry forecasts. They take into account the schemes strategic asset allocations across the sectors of the main asset classes. P&O UK scheme MNOPF scheme Other schemes Expected long-term rate of return % p.a. Fair value Expected long term rate of return % p.a. Fair value Expected long-term rate of return % p.a. Fair value Group schemes fair value Share of equityaccounted investees schemes Fair value Total fair value Equities , , , ,100 7, ,700 Bonds , , , ,100 10, ,600 Other , , ,700 50,600 1,100 51,700 Value of insured pensioner liability ,196,200 1,196,200 1,196, ,688, , ,100 1,945,000 19,200 1,964,200 Equities , , , ,300 7, ,300 Bonds , , , ,300 9, ,500 Other , , ,300 70,500 1,300 71,800 Value of insured pensioner liability ,352,900 1,352,900 1,352, ,812, , ,900 2,082,000 17,500 2,099,500 67
70 Notes to consolidated financial statements continued (forming part of the financial statements) 24 Pension and post-employment benefits continued Reconciliation of the opening and closing present value defined benefit obligations: P&O UK scheme MNOPF scheme Other schemes Total Group schemes Share of equity accounted investees schemes Total Present value of obligation at 1 January (1,991,800) (163,600) (184,500) (2,339,900) (24,000) (2,363,900) Employer s interest cost (103,700) (8,500) (9,900) (122,100) (1,400) (123,500) Employer s current service cost (600) (5,300) (5,900) (500) (6,400) Contributions by scheme participants (200) (2,200) (2,400) (200) (2,600) Foreign currency exchange 71,700 5,600 3,800 81, ,000 Benefits paid 103,500 8,200 15, ,600 1, ,000 Sale/(purchase) of business Amounts reclassified as defined contribution scheme Amounts recognised in the statement or recognised income and expense Actuarial gain/(loss) loss on obligation 141,500 (16,100) (800) 124,600 (600) 124,000 Transfer to assets/liabilities classified as held for sale 31,400 31,400 31,400 Present value of obligation at 31 December (1,779,600) (174,400) (151,600) (2,105,600) (24,400) (2,130,000) Reconciliation of the opening and closing present value defined benefit obligations: P&O UK scheme MNOPF scheme Other schemes Total Group schemes Share of equity accounted investees schemes Total Present value of obligation at 1 January (1,508,400) (126,000) (142,300) (1,776,700) (14,200) (1,790,900) Employer s interest cost (96,800) (8,100) (8,900) (113,800) (900) (114,700) Employer s current service cost (300) (4,700) (5,000) (200) (5,200) Contributions by scheme participants (200) (2,500) (2,700) (200) (2,900) Foreign currency exchange (168,900) (14,000) (21,200) (204,100) (1,600) (205,700) Benefits paid 109,200 7,200 14, , ,800 Sale/(purchase) of business 6,300 6,300 (3,300) 3,000 Amounts reclassified as defined contribution scheme 2,700 2,700 2,700 Actuarial loss on obligation (326,400) (22,700) (28,500) (377,600) (4,400) (382,000) Present value of obligation at 31 December (1,991,800) (163,600) (184,500) (2,339,900) (24,000) (2,363,900) 68
71 Business Review corporate governance FINANCIAL STATEMENTS Reconciliation of the opening and closing fair value of scheme assets: P&O UK scheme MNOPF scheme Other schemes Total Group schemes Share of equity accounted investees schemes Total Fair value of scheme assets at 1 January 1,812, , ,900 2,082,000 17,500 2,099,500 Expected return on scheme assets 101,500 7,900 9, ,400 1, ,500 Contributions by employer 13,400 6,600 7,000 27, ,900 Contributions by scheme participants 200 2,200 2, ,600 Foreign currency exchange (64,400) (4,300) (2,200) (70,900) 300 (70,600) Benefits paid (103,500) (8,200) (15,900) (127,600) (1,400) (129,000) Actuarial (loss)/gain on assets (70,300) 11,900 2,200 (56,200) 600 (55,600) Transfer to assets/liabilities classified as held for sale (30,100) (30,100) (30,100) Fair value of scheme assets at 31 December 1,688, , ,100 1,945,000 19,200 1,964,200 Defined benefit schemes net liabilities (90,700) (33,400) (36,500) (160,600) (5,200) (165,800) Minimum funding liability (13,300) (13,300) (13,300) Net liability recognised in the statement of financial position at 31 December (90,700) (46,700) (36,500) (173,900) (5,200) (179,100) Actual gain on scheme assets 31,200 19,800 11,200 62,200 1,700 63,900 Where a surplus arises on a scheme in accordance with IAS 19 and IFRIC 14, the surplus is recognised as an asset only if it represents an unconditional economic benefit available to the Group in the future. Any surplus in excess of this benefit is not recognised in the statement of financial position. A minimum funding liability arises where the statutory funding requirements are such that future contributions in respect of past service will result in a future unrecognisable surplus. Reconciliation of the opening and closing fair value of scheme assets: P&O UK scheme MNOPF scheme Other schemes Total Group schemes Share of equity accounted investees schemes Total Fair value of scheme assets at 1 January 1,450, , ,500 1,674,800 12,000 1,686,800 Expected return on scheme assets 95,700 6,900 8, , ,500 Contributions by employer 13,500 4,400 6,700 24, ,500 Contributions by scheme participants 200 2,500 2, ,900 Foreign currency exchange 159,200 11,500 17, ,500 1, ,900 Benefits paid (109,200) (7,200) (14,600) (131,000) (800) (131,800) (Sale)/purchase of business (7,700) (7,700) 2,700 (5,000) Actuarial gain on assets 202,200 5,600 11, , ,700 Fair value of scheme assets at 31 December 1,812, , ,900 2,082,000 17,500 2,099,500 Defined benefit schemes net liabilities (179,800) (36,500) (41,600) (257,900) (6,500) (264,400) Actual gain on scheme assets 297,900 12,500 19, ,100 1, ,200 69
72 Notes to consolidated financial statements continued (forming part of the financial statements) 24 Pension and post-employment benefits continued It is anticipated that the Group will make the following contributions to the pension schemes in 2011: P&O UK scheme MNOPF scheme Other schemes Total Group schemes Share of equity accounted investees schemes Total Pension scheme contributions 14,100 7,000 8,100 29,200 1,000 30,200 Present value of defined benefit obligation 31 December Present value of define benefit obligation (1,779,600) (174,400) (151,600) (2,105,600) (24,400) (2,130,000) Fair value of scheme assets 1,688, , ,100 1,945,000 19,200 1,964,200 Deficit in the scheme (90,700) (33,400) (36,500) (160,600) (5,200) (165,800) Minimum funding obligation (13,300) (13,300) (13,300) Net liability recognised in the statement of financial position (90,700) (46,700) (36,500) (173,900) (5,200) (179,100) Experience gains/(losses) on scheme assets (70,300) 11,900 2,200 (56,200) 600 (55,600) Percentage of scheme assets at year end (%) -4% 8% 2% -3% 3% -3% Experience gains/(losses) on scheme liabilities 101,600 (7,400) 5,200 99,400 (600) 98,800 Percentage of scheme liabilities at year end (%) -6% 4% -3% -5% 2% -5% Gains/(losses) due to change in assumptions 39,900 (8,700) (6,000) 25,200 25,200 Movement in minimum funding liability (13,300) (13,300) (13,300) 31 December Present value of define benefit obligation (1,991,800) (163,600) (184,500) (2,339,900) (24,000) (2,363,900) Fair value of scheme assets 1,812, , ,900 2,082,000 17,500 2,099,500 Surplus or deficit in the scheme (179,800) (36,500) (41,600) (257,900) (6,500) (264,400) Experience gains/(losses) on scheme assets 202,200 5,600 11, , ,700 Percentage of scheme assets at year end (%) 11% 4% 8% 11% 2% 10% Experience gains/(losses) on scheme liabilities Percentage of scheme liabilities at year end (%) 0% 0% 0% 0% 0% 0% Gains/(losses) due to change in assumptions (326,400) (22,700) (28,700) (377,800) (4,400) (382,200) 70
73 Business Review corporate governance FINANCIAL STATEMENTS P&O UK scheme MNOPF scheme Other schemes Total Group schemes Share of equity accounted investees schemes Total 31 December 2008 Present value of define benefit obligation (1,508,400) (126,000) (142,300) (1,776,700) (14,200) (1,790,900) Fair value of scheme assets 1,450, , ,500 1,674,800 12,000 1,686,800 Surplus or deficit in the scheme (58,000) (20,100) (23,800) (101,900) (2,200) (104,100) Experience gains/(losses) on scheme assets (278,500) (33,500) (38,700) (350,700) (3,900) (354,600) Percentage of scheme assets at year end (%) -19% -32% -33% -21% -33% -21% Experience gains/(losses) on scheme liabilities (11,300) (3,300) 2,200 (12,400) (12,400) Percentage of scheme liabilities at year end (%) 1% 3% -2% 1% 0% 1% Gains/(losses) due to change in assumptions 213,300 14,500 28, ,800 4, , December 2007 Present value of define benefit obligation (2,237,900) (181,000) (212,000) (2,630,900) (23,200) (2,654,100) Fair value of scheme assets 2,173, , ,600 2,531,700 19,100 2,550,800 Surplus or deficit in the scheme (64,300) (9,500) (25,400) (99,200) (4,100) (103,300) Experience gains/(losses) on scheme assets (44,400) 29,800 (1,200) (15,800) (500) (16,300) Percentage of scheme assets at year end (%) -2% 17% -1% -1% -3% -1% Experience gains/(losses) on scheme liabilities 2,000 16,000 (200) 17,800 17,800 Percentage of scheme liabilities at year end (%) 0% -9% 0% -1% 0% -1% Gains/(losses) due to change in assumptions (64,200) 10,600 5,600 (48,000) (200) (48,200) P&O UK Scheme Formal actuarial valuations of the P&O UK Scheme are normally carried out triennially by qualified independent actuaries, the latest completed regular valuation report for the scheme being at 31 March 2007, using the projected unit credit method. At this date, the market value of the P&O UK Scheme s assets were USD 2,373,000 thousand and the value of accrued benefits to members allowing for future increases in earnings was USD 2,504,000 thousand giving a deficit of USD 131,000 thousand and a funding ratio of 94.8%. Excluding the deficit reduction payments, the average contribution rate for the P&O UK Scheme was 29.1% for the year to 31 December and 29.1% for the year to 31 December. The principal long-term assumptions in the P&O UK Scheme s 2007 valuation are: Nominal % per annum Price inflation 3.00 Investment return on pre-employment portfolio 5.94 Investment return on post-employment portfolio 5.11 Earnings escalation 4.50 Increase in accrued pensions on excess over Guaranteed Minimum Pensions 2.75 As a result of this valuation P&O committed to regular monthly deficit payments from April 2008 totalling USD 46,300 thousand over the subsequent three years. These monthly payments are supported by bank guarantees. In December 2007, as part of a process developed with P&O to de-risk the pension scheme, the Trustee transferred USD 1,600,000 thousand of P&O UK Scheme assets to Paternoster (UK) Ltd, in exchange for a bulk annuity insurance policy to ensure that the assets (in the Company s statement of financial position and in the Scheme) will always be equal to the current value of the liability of the pensions in payment at 30 June 2007, thus removing the funding risks for these liabilities. 71
74 Notes to consolidated financial statements continued (forming part of the financial statements) 24 Pension and post-employment benefits continued Merchant Navy Officers Pension Fund ( MNOPF ) The MNOPF Scheme is a defined benefit multi-employer scheme in which officers employed by companies within the Group have participated. The scheme is divided into two sections, the Old Section and the New Section, both of which are closed to new members and the latest valuation was carried out at 31 March. The Old Section has been closed to benefit accrual since The scheme s independent actuary advised that at 31 March the market value of the scheme s assets for the Old Section was USD 1,595,000 thousand, representing approximately 89% of the value of the benefits accrued to members. The Trustee has determined that the asset growth of the Fund, in excess of that assumed in calculating the technical provisions, between the formal date of the valuation and 18 November has been sufficient to eliminate the shortfall. Therefore no contributions are required to meet the shortfall. The assets of the Old Section were substantially invested in bonds. As at 31 March, the date of the most recent formal actuarial valuation, the New Section had assets with a market value of USD 2,217,000 thousand, representing approximately 68% of the benefits accrued to members. The valuation assumptions were as follows: Nominal % per annum Investment return on pre-employment portfolio 7.25 Investment return on post-employment portfolio 4.75 Rate of national average earnings increase 4.50 Rate of pension increases (where increases apply) 3.00 At the date of the valuation, approximately 48% of the New Section s assets were invested in pooled investment vehicles, 35% in equities, 9% in bonds and 8% in cash and other assets. Following the valuation the Trustee and Employers have agreed contributions in addition to those arising from the 31 March 2003 and 31 March 2006 valuations will be paid to the Section by participating employers over the period to 30 September These additional payments have a present value of USD 632,000 thousand as at 30 September. The Trustee will decide the payment terms for each participating employer in accordance with the Trustee s Contribution Collection Policy. The Group s share is USD 29,500 thousand. Following a court decision in 2005, the trustee advised P&O that its share of the net deficit of the New Section was 3.355% and issued a schedule of regular deficit payments from P&O companies totalling USD 2,100 thousand per annum commencing on 30 September 2005 and payable annually on 31 March thereafter until 31 March In addition, part of the deficit payments being made by Carnival plc are attributable to P&O under the terms of the demerger agreement relating to the demerger of P&O Princess Cruises in These payments equate to a further 1.096% of the net deficit. The proportion of deficit attributable to P&O changed with effect from 20 February 2007 to 3.963% as not all employers met their deficit payments. The payments to P&O Princess Cruises have also changed and these payments now equate to a further 1.295%. As a result of the 31 March 2006 valuation report for the scheme the trustee issued a further schedule of regular deficit payments from P&O companies totalling USD 2,200 thousand commencing on 30 September 2007 and payable annually on 30 September thereafter until 30 September P&O s share of the net deficit of the New Section at 31 December is estimated at 4.807%. Merchant Navy Ratings Pension Fund ( MNRPF ) The Merchant Navy Ratings Pension Fund (the MNRPF Scheme ) is an industry wide multi-employer defined benefit pension scheme in which sea staff employed by companies within P&O have participated. The scheme has a significant funding deficit and has been closed to further benefit accrual. 72
75 Business Review corporate governance FINANCIAL STATEMENTS As at 31 March 2008, the date of the most recent full triennial actuarial valuation carried out by an independent actuary, the scheme had assets with a market value of USD 1,239,000 thousand, representing 78% of the benefits accrued to members allowing for future increases. Approximately 66% of the scheme s assets were invested in bonds, 23% in equities and 11% in property and cash. The valuation assumptions were as follows: Nominal % per annum Investment return on pre-employment portfolio 6.20 Investment return on post-employment portfolio 5.20 Rate of national average earnings increase 5.20 Rate of pension increases (where increases apply) 3.60 Following the transfer of the Ferries division companies the Group s share of the deficit at 31 December is immaterial and as it has been unable to identify its share of the underlying assets and liabilities of the MNRPF Scheme on a consistent and reasonable basis it therefore accounts for contributions and payments to the MNRPF Scheme under IAS 19 as if it were a defined contribution scheme. Certain Group companies which are no longer current employers in the MNRPF and had settled their statutory debt obligation were not considered to have any legal obligation with respect to the on-going deficit in the fund. This position has, however, been challenged by Stena Line Limited in the High Court. Judgement was handed down in this case on 27 July, with the judgement going against the Group. Leave to appeal was granted, and the appeal is expected to be heard at the end of March Other schemes Other defined benefit schemes include schemes in Australia, Canada, Indonesia, Pakistan, Hong Kong and the Philippines. Other industry schemes are mainly overseas multi-employer schemes, in which the Group is unable to identify its share of the underlying assets and liabilities on a consistent and reasonable basis. The Group is therefore accounting for contributions to these schemes as if they were defined contribution schemes for IAS 19 purposes. The Group operates a defined contribution Mandatory Provident Fund retirement benefits scheme (the MPF Scheme ) in Hong Kong, under the Mandatory Provident Fund Schemes Ordinance, for those employees who are eligible to participate in the MPF Scheme. Contributions are made based on a percentage of the employees relevant income and are charged to the consolidated income statement as they become payable in accordance with the rules of the MPF Scheme. The assets of the MPF Scheme are held separately from those of the Group in an independently administered fund. The Group s employer contributions vest fully with the employees when contributed into the MPF Scheme. The Group also operates a defined contribution retirement benefits scheme (the ORSO Scheme ) in Hong Kong for those employees who are eligible to participate in this scheme. The ORSO Scheme operates in a similar way to the MPF Scheme, except that when an employee leaves the ORSO Scheme, before the employer contributions vest fully, the ongoing employer contributions payable by the Group are reduced by the relevant amount of the forfeited employer contributions. In respect of Australia, a number of DP World s Australian companies participate in the Mercer Superannuation Trust, an Australian multi-employer corporate fund in which DP World Australia operates a sub-fund called DP World Australia Superannuation Plan. The defined benefit section of the sub-fund is closed to new members. At 31 December the sub-fund had a small deficit of USD 1,560 thousand. The Australian group of companies also participate in the superannuation plan associated with the maritime industry called Maritime Super (MS). MS is a multi-employer superannuation fund. Its defined benefit section is closed to new members. As a multi-employer fund there is no reliable basis for allocating benefits, assets and costs between employers and therefore the Group has adopted multi-employer provisions when reporting under IFRS. Those provisions allow the employers to report as if the fund was a defined contribution fund. In any event, as at 31 December the total number of members remaining in the defined benefit section of MS were 199, of which DP World s share was 78. The last actuarial statement dated June 2008 showed the ratio of assets to benefits at 102%. 73
76 Notes to consolidated financial statements continued (forming part of the financial statements) 25 Interest bearing loans and borrowings This Note provides information about the terms of the Group s interest-bearing loans and borrowings, which are measured at amortised cost. Information about the Group s exposure to interest rate, foreign currency and liquidity risk are described in Note 29. Non-current liabilities Secured bank loans 682, ,341 Mortgage debenture stock 2,221 2,303 Unsecured loan stock 5,093 5,280 Unsecured bank loans 3,442,000 3,645,649 Unsecured bond issues 3,233,518 3,231,829 Finance lease liabilities 54,499 53,476 7,420,299 7,474,878 Current liabilities Secured bank loans 76, ,605 Unsecured bank loans 258,420 51,715 Unsecured loans 2,433 2,548 Finance lease liabilities 12,261 9, , ,091 Total 7,769,746 7,957,969 74
77 Business Review corporate governance FINANCIAL STATEMENTS Terms and debt repayment schedule Terms and conditions of outstanding loans were as follows: Currency Notes Nominal interest rate Year of maturity Face value Carrying Amount Secured loans EGP 14% ,684 4,684 EUR Variable ,644 7,644 EUR 7% ,497 16,497 HKD 2.90% ,576 1,576 INR 11.62% ,183 11,183 INR Variable ,762 94,762 PKR Variable ,155 80,155 USD 2.76% 4.75% ,230 36,230 USD Variable , ,135 ZAR Variable ,435 1,435 Unsecured loans CAD Variable , ,374 INR Variable ,886 62,886 INR 7.9% 8.13% ,451 72,451 SAR Variable ,259 27,259 USD 4.14% ,876 32,876 USD (a) Variable ,000,000 2,995,143 USD Variable , ,431 EUR Variable ,433 2,433 Mortgage debenture stock GBP 3.50% undated 2,221 2,221 Unsecured loan stock GBP 7.50% undated 5,093 5,093 Unsecured bond USD 7.88% ,000 7,929 Unsecured sukuk bonds USD (b) * ,500,000 1,487,289 Unsecured MTNs USD (b) 6.85% ,750,000 1,738,300 Finance lease liabilities in various currencies 4.14% 14% ,760 66,760 7,799,085 7,769,746 * The profit rate on this Islamic Bond is 6.25%. (a) The unsecured bank loans include USD 3,000,000 thousand (: USD 3,000,000 thousand) drawn under a USD 3,000,000 thousand revolving credit facility. This is a committed facility with a final maturity on 22 October (b) The Group has a listed conventional bond of USD 1,750,000 thousand Medium Term Note and a Sukuk (Islamic Bond) of USD 1,500,000 thousand listed under DP World Sukuk Limited on NASDAQ Dubai and the London Stock Exchange (LSE). Certain property, plant and equipment are pledged against the facilities obtained from the banks (refer to Note 12). There is no cash under lien as at 31 December (: USD 368,351 thousand) (refer to Note 18). 75
78 Notes to consolidated financial statements continued (forming part of the financial statements) 25 Interest bearing loans and borrowings continued There has been no issuance or repayment of debt securities in the current year (: nil). At 31 December, the undrawn committed borrowing facilities of USD 60,213 thousand (: USD 179,744 thousand) were available to the Group, in respect of which all precedent conditions had been met. Terms and debt repayment schedule Terms and conditions of outstanding loans were as follows: Face value Carrying amount Currency Notes Nominal interest rate Year of maturity Secured loans AUD Variable 103, ,105 EGP 14% ,610 6,610 EUR Variable ,174 19,174 GBP Variable 157, ,136 HKD 2.90% ,951 1,951 INR Variable ,899 6,899 PKR Variable ,616 45,616 USD 1.45% 4.75% ,458 75,458 USD Variable , ,645 ZAR Variable ,352 1,352 Unsecured loans AUD Variable 16,209 16,209 CAD Variable , ,429 INR Variable ,395 97,395 INR 7.30% 14.25% ,165 93,165 SAR Variable ,378 31,378 USD Variable , ,791 USD Variable ,512 29,512 USD (a) Variable ,000,000 2,992,485 EUR Variable 2,548 2,548 Mortgage debenture stock GBP 3.50% undated 2,303 2,303 Unsecured loan stock GBP 7.50% undated 5,280 5,280 Unsecured bond USD 7.88% ,000 7,925 Unsecured sukuk bonds USD (b) * ,500,000 1,485,756 Unsecured MTNs USD (b) 6.85% ,750,000 1,738,148 Finance lease liabilities in various currencies Variable ,699 62,699 7,991,655 7,957,969 * The profit rate on this Islamic Bond is 6.25%. 76
79 Business Review corporate governance FINANCIAL STATEMENTS Finance lease liabilities The Group classifies certain property, plant and equipment as finance leases where it retains all risks and rewards incidental to the ownership. The net carrying values of assets taken under finance leases are disclosed in Note 12. Future minimum lease payments under finance leases together with the present value of the net minimum lease payments are as follows: Future minimum lease payments Interest Present value of minimum lease payments Less than one year 15,391 (2,898) 12,493 Between one and five years 41,009 (10,962) 30,047 More than five years 34,296 (10,076) 24,220 At 31 December 90,696 (23,936) 66,760 Less than one year 14,853 (2,978) 11,875 Between one and five years 47,794 (6,170) 41,624 More than five years 18,900 (9,700) 9,200 At 31 December 81,547 (18,848) 62,699 The finance leases do not contain any escalation clauses and do not provide for contingent rents. 26 Accounts payable and accruals Trade payables Noncurrent Current Total 201, ,546 Other payables and accruals 338, , ,313 Provisions* ,900 44,700 Fair value of derivative financial instruments 26,800 69,579 96,379 Amounts due to related parties (refer to Note 27) 1,600 17,176 18,776 As at 31 December 36, ,562 1,307,714 Noncurrent Current Total Trade payables 160, ,462 Other payables and accruals 319, , ,227 Provisions* 1,600 29,100 30,700 Fair value of derivative financial instruments 22,200 44,800 67,000 Amounts due to related parties (refer to Note 27) 3,683 18,293 21,976 As at 31 December 346, ,602 1,164,365 * During the year an amount of USD 32,000 thousand was provided (: USD 19,600 thousand) and an amount of USD 18,000 thousand was utilised (: USD 30,100 thousand). 27 Related party transactions For the purpose of these consolidated financial statements, parties are considered to be related to the Group if the Group has the ability, directly or indirectly, to control the party or exercise significant influence over it in making financial and operating decisions, or vice versa, or where the Group and the party are subject to common control or significant influence ie part of the same Parent Group. Related parties represent associated companies, shareholders, directors and key management personnel of the Group, the Parent Company, ultimate Parent Company (Dubai World Corporation) and entities jointly controlled or significantly influenced by such parties. Pricing policies and terms of these transactions are approved by the Group s management. The terms and conditions of the related party transaction were made on an arm s length basis. 77
80 Notes to consolidated financial statements continued (forming part of the financial statements) 27 Related party transactions continued The Parent Group operates a Shared Services Unit ( SSU ) which recharges the proportionate costs of services provided to the Group. SSU also processes the payroll for the Group and recharges the respective payroll costs. Transactions with related parties included in the consolidated financial statements are as follows: Expenses charged: Concession fee Shared services Other recharges Ultimate Parent Company Equityaccounted investees Other related parties Total 48,169 48,169 10,055 10,055 13,770 13,770 Revenue earned: Management fee income 13,020 13,020 Ultimate Parent Company Equity accounted investees Other related parties Total Expenses charged: Concession fee 48,169 48,169 Shared services 12,034 12,034 Other recharges 11,807 12,591 24,398 Property acquired 82,785 82,785 Revenue earned: Management fee income 6,024 6,024 Balances with related parties included in the statement of financial position are as follows: Due to related parties Due from related parties Ultimate Parent Company 3,793 2,749 Parent Company 65,750 58,234 Equity-accounted investees 43,400 43,003 1, Other related parties 18,992 18,986 17,176 18, , ,223 18,776 21,976 The balances outstanding at the year-end arise in the normal course of business. For the years ended 31 December and the Group has not recorded any impairment on the amounts owed by related parties. Loan and lease guarantees issued on behalf of associates and joint ventures amount to USD 5,785 thousand (: USD 13,090 thousand). Compensation of key management personnel The remuneration of Directors and other key members of the management during the year were as follows: Short-term benefits and bonuses 6,699 7,648 Post retirement benefits ,211 8,076 78
81 Business Review corporate governance FINANCIAL STATEMENTS 28 Assets and liabilities held for sale Asset held for sale Australia and America region (refer to Note (a)) 2,071,000 Other regions (refer to Note (b)) 13,840 28,400 2,084,840 28,400 Liabilities held for sale Australia and America region (refer to Note (a)) 356,193 (a) On 22 December, the Group and Citi Infrastruture Investors (CII), together with one of CII s major investors announced their intention to form a strategic partnership in relation to the Group s five marine terminals in Australia (refer to Note 34). The major class of assets and liabilities as at 31 December were as follows: Non-current assets Property, plant and equipment (refer to Note 12) 392,198 Port concession rights (refer to Note 13) 680,622 Goodwill (refer to Note 13) 846,748 Investment in equity-accounted investments 1,000 Deferred tax assets 27,400 1,947,968 Current assets Inventories 6,000 Accounts receivable and prepayments (net) (refer to Note 29 (a)) 66,132 Bank balances and cash (refer to Note 18) 50, ,032 Asset classified as held for sale 2,071,000 Non-current liabilities Deferred tax liabilities 213,293 Pension and post-employment benefits 6,900 Interest bearing loans and borrowings 21, ,093 Current liabilities Income tax liabilities 5,800 Pension and post-employment benefits 49,100 Interest bearing loans and borrowings 3,500 Accounts payable and accruals 55, ,100 Liabilities classified as held for sale 356,193 (b) Assets held for sale in other regions includes property, plant and equipment of USD 3,039 thousand (: USD 15,973 thousand), which have been restated at their fair value resulting in an impairment loss of USD 3,700 thousand (also refer to Notes 11 and 12). 79
82 Notes to consolidated financial statements continued (forming part of the financial statements) 29 Financial instruments (a) Credit risk (i) Exposure to credit risk The carrying amount of financial assets represents the maximum credit exposure. The maximum exposure to credit risk at the reporting date was as follows: Carrying amount USD'000 Available-for-sale financial assets 51,439 50,560 Debt securities held to maturity 14,429 14,729 Derivative assets 10,970 1,100 Loans and receivables 607, ,534 Bank balances 2,519,616 2,910,066 3,204,214 3,512,989 The maximum exposure to credit risk for trade receivables (net) at the reporting date by operating region is as follows: Carrying amount USD'000 Asia Pacific and Indian subcontinent 23,927 28,128 Australia and Americas 32,400 73,902 Middle East, Europe and Africa 172, , , ,870 The ageing of trade receivables (net) at the reporting date was: Neither past due nor impaired on the reporting date: 169, ,840 Past due on the reporting date Past due 0-30 days 22,422 89,253 Past due days 12,228 19,828 Past due days 10,767 12,305 Past due > 90 days 14,063 40, , ,870 The Group believes that the unimpaired amounts that are past due by more than 30 days are still collectible, based on historic payment behaviour. Movement in the allowance for impairment in respect of trade receivables during the year was: USD'000 As at 1 January 46,367 59,774 Provision (written back)/recognised during the year (10,470) (13,407) Transfer to assets held for sale (4,068) As at 31 December 31,829 46,367 Based on historic default rates, the Group believes that, apart from above, no impairment allowance is necessary in respect of trade receivables not past due or past due. Trade receivables with the top ten customers represent 38% (: 46%) of the trade receivables. 80
83 Business Review corporate governance FINANCIAL STATEMENTS (b) Liquidity risk The following are the contractual maturities of financial liabilities, including estimated interest payments and excludes the impact of netting agreements. Carrying amount Contractual cash flows Less than 1 year 1 2 years 2 5 years More than 5 years Non derivative financial liabilities Secured bank loans 759,301 (972,914) (143,361) (148,664) (445,498) (235,391) Unsecured bond issues 3,233,518 (7,055,651) (214,255) (214,255) (642,765) (5,984,376) Mortgage debenture stocks 2,221 (4,399) (78) (78) (233) (4,010) Unsecured loan stock 5,093 (15,792) (382) (382) (1,146) (13,882) Finance lease liabilities 66,760 (90,696) (15,391) (14,116) (26,892) (34,297) Unsecured syndicate bank loans 2,995,143 (3,031,681) (28,584) (3,003,097) Unsecured other bank loans 707,710 (789,772) (589,537) (71,038) (76,212) (52,985) Trade and other payables 644,929 (644,929) (521,675) (93,749) (9,380) (20,125) Bank overdraft 3,000 (3,000) (3,000) Financial guarantees 1 (5,785) (5,785) Derivative financial liabilities Interest rate swaps 96,079 (123,125) (47,561) (35,814) (34,847) (4,903) Cross currency swaps 300 (208) (208) Total 8,514,054 (12,737,952) (1,569,817) (3,581,193) (1,236,973) (6,349,969) 1 These are financial guarantees provided to equity-accounted investees (also refer to Note 27). The following table indicates the periods in which the cash flows associated with derivatives that are cash flow hedges are expected to occur. The timing of these cash flows is not materially different from the impact on the consolidated income statement. Carrying amount Expected cash flows Less than 1 year 1 2 years 2 5 years More than 5 years Interest rate swaps Assets Liabilities (96,079) (123,125) (47,561) (35,814) (34,847) (4,903) Forward exchange contracts Assets Cross currency swaps Liabilities (300) (208) (208) Total (96,179) (122,954) (47,551) (35,653) (34,847) (4,903) 81
84 Notes to consolidated financial statements continued (forming part of the financial statements) 29 Financial instruments continued (b) Liquidity risk continued The following are the contractual maturities of financial liabilities, including estimated interest payments and excludes the impact of netting agreements. Carrying amount Contractual cash flows Less than 1 year 1 2 years 2 5 years More than 5 years Non derivative financial liabilities Secured bank loans 955,946 (1,166,241) (477,139) (111,944) (324,414) (252,744) Unsecured bond issues 3,231,829 (7,269,906) (214,255) (214,255) (642,765) (6,198,631) Mortgage debenture stocks 2,303 (4,641) (81) (81) (242) (4,237) Unsecured loan stock 5,280 (16,763) (396) (396) (1,188) (14,783) Finance lease liabilities 62,699 (81,547) (14,853) (11,948) (35,846) (18,900) Unsecured syndicate bank loans 2,992,494 (3,056,965) (27,019) (27,019) (3,002,927) Unsecured other bank loans 707,418 (914,092) (168,591) (505,640) (170,287) (69,574) Trade and other payables 1,066,661 (1,066,661) (743,698) (322,963) Bank overdraft 11,500 (11,500) (11,500) Financial guarantees (13,090) (13,090) Derivative financial liabilities Interest rate swaps 64,185 (83,776) (50,898) (23,261) (7,844) (1,773) Forward exchange contracts Net outflow 2,815 (5,753) (5,753) Total 9,103,130 (13,690,935) (1,727,273) (1,217,507) (4,185,513) (6,560,642) The following table indicates the periods in which the cash flows associated with derivatives that are cash flow hedges are expected to occur. The timing of these cash flows is not materially different from the impact on the consolidated income statement. Carrying amount Expected cash flows Less than 1 year 1 2 years 2 5 years More than 5 years Interest rate swaps Assets Liabilities (64,185) (83,776) (50,898) (23,261) (7,844) (1,773) Forward exchange contracts Net liabilities (2,715) (5,466) (5,466) Cross currency swaps Assets Total (65,900) (87,854) (55,787) (23,081) (7,213) (1,773) 82
85 Business Review corporate governance FINANCIAL STATEMENTS (c) Market risk (i) Currency risk Exposure to currency risk The Group s exposure to foreign currency risk was as follows: USD GBP EUR AUD INR CAD Others Total Cash and cash equivalents 2,216, ,613 48,221 37,596 7,900 17,780 82,417 2,519,616 Trade receivables 108,703 17,436 44,273 6,084 9,185 12,636 30, ,742 Secured bank loans and debenture stock (539,831) (2,222) (24,141) (105,954) (89,374) (761,522) Unsecured bank loans and loan stock (3,345,989) (5,093) (135,196) (194,408) (27,260) (3,707,946) Bank overdraft (1,124) (1,876) (3,000) Trade payables (59,074) (13,557) (45,984) (4,212) (59,605) (1,872) (17,242) (201,546) Net statement of financial position exposures (1,620,102) 106,177 22,369 39,468 (284,794) (165,864) (22,910) (1,925,656) The Group s exposure to foreign currency risk was as follows: USD GBP EUR AUD INR CAD Others Total Cash and cash equivalents 2,372, ,149 60, , ,240 63,123 2,910,066 Trade receivables 118,648 24,743 32,820 59,300 18,789 11,138 24, ,870 Secured bank loans and debenture stock (616,076) (159,437) (19,175) (103,084) (6,899) (53,578) (958,249) Unsecured bank loans and loan stock (3,305,999) (5,280) (2,548) (16,209) (190,745) (184,411) (3,705,192) Bank overdraft (6,468) (3,426) (1,606) (11,500) Trade payables (50,327) (14,048) (39,197) (7,198) (33,489) (3,056) (13,147) (160,462) Net statement of financial position exposures (1,480,986) 82,127 32,444 94,515 (215,702) (167,089) 19,224 (1,635,467) The following significant exchange rates applied during the year: Average rate during Reporting date spot rate GBP EUR AUD INR CAD
86 Notes to consolidated financial statements continued (forming part of the financial statements) 29 Financial instruments continued (c) Market risk continued (ii) Sensitivity analysis A 10 percent strengthening of the USD against the following currencies at 31 December would have increased/(decreased) other comprehensive income and consolidated income statement by the amounts shown below. This analysis assumes that all other variables, in particular interest rates, remain constant. Further, as each entity in the Group determines its own functional currency, the effect of translating financial assets and liabilities of the respective entity would mainly impact other comprehensive income. Other comprehensive income USD'000 Consolidated income statement USD'000 GBP 11,797 8,213 1,664 1,617 EUR 2,485 3,244 1, AUD 4,385 9, INR CAD (31,644) (21,570) 7,869 4,285 (18,429) (16,709) 720 1,203 A 10 percent weakening of the USD against the above currencies at 31 December would have had the equal but opposite effect on the above currencies to the amounts shown above, on the basis that all other variables remain constant. (d) Interest rate risk (i) Profile At the reporting date the interest rate profile of the Group s interest bearing financial instruments was: Carrying amount USD'000 Fixed rate instruments Financial assets 14,429 14,729 Financial liabilities (3,483,089) (3,591,983) Interest rate swaps (1,932,288) (2,016,007) (5,400,948) (5,593,261) Variable rate instruments Financial assets 2,076,074 2,023,460 Financial liabilities (4,289,657) (4,377,486) Interest rate swaps 1,932,288 2,016,007 (281,295) (338,019) (ii) Cash flow sensitivity analysis for variable rate instruments A change of 100 basis points ( bp ) in interest rates at the reporting date would have increased/(decreased) other comprehensive income and consolidated income statement by the amounts shown below. This analysis assumes that all other variables, in particular foreign currency rates, remain constant. 84 Consolidated income statement 100 bp increase 100 bp decrease Other comprehensive income 100 bp increase 100 bp decrease Variable rate instruments (2,813) 2,813 Interest rate swap (2,930) 2,930 (16,393) 16,393 Cash flow sensitivity (net) (5,743) 5,743 (16,393) 16,393 Variable rate instruments (3,380) 3,380 Interest rate swap (2,210) 2,210 (17,950) 17,950 Cash flow sensitivity (net) (5,590) 5,590 (17,950) 17,950
87 Business Review corporate governance FINANCIAL STATEMENTS (e) Fair values Fair values versus carrying amounts The fair values of financial assets and liabilities, together with the carrying amounts shown in the statement of financial position are as follows: Carrying amount Fair value Carrying Amount USD'000 Fair Value USD'000 Assets carried at fair values Available-for-sale financial assets 51,439 51,439 50,560 50,560 Cross currency options 10,770 10,770 Interest rate swaps Forward exchange contracts Cross currency swaps ,409 62,409 51,660 51,660 Assets carried at amortised cost Debt securities held to maturity 14,429 14,266 14,729 14,729 Loans and receivables 607, , , ,534 Cash and cash equivalents 2,519,616 2,519,616 2,910,066 2,910,066 3,141,805 3,141,642 3,461,329 3,461,329 Liabilities carried at fair values Interest rate swaps (96,079) (96,079) (64,185) (64,185) Forward foreign currency contracts (300) (300) (2,815) (2,815) (96,379) (96,379) (67,000) (67,000) Liabilities carried at amortised cost Secured bank loans* (759,301) (759,301) (955,946) (955,946) Mortgage debenture stocks (2,221) (2,141) (2,303) (2,303) Unsecured bond issues (3,233,518) (3,117,997) (3,231,829) (2,629,126) Unsecured loan stock (5,093) (5,093) (5,280) (5,280) Finance lease liabilities (66,760) (66,760) (62,699) (62,699) Unsecured bank and other loans* (3,702,853) (3,702,853) (3,699,912) (3,699,912) Trade and other payables (644,929) (644,929) (1,066,661) (1,066,661) Bank overdraft (3,000) (3,000) (11,500) (11,500) (8,417,675) (8,302,074) (9,036,130) (8,433,427) * A significant portion of these loans carry a variable rate of interest and hence, the fair values reported are same as carrying values. 85
88 Notes to consolidated financial statements continued (forming part of the financial statements) 29 Financial instruments continued (e) Fair values continued Fair value hierarchy The table below analyses financial instruments carried at fair value, by valuation method. The different levels have been defined as follows: Level 1: quoted prices (unadjusted) in active markets for identical assets or liabilities Level 2: inputs other than quoted prices included within Level 1 that are observable for the asset or liability, either directly (i.e. as prices) or indirectly (i.e. derived from prices) Level 3: inputs for the asset or liability that are not based on observable market data (unobservable inputs) Level 1 Level 2 USD'000 Level 3 USD'000 Available-for-sale financial assets 51,439 Derivative financial assets 10,970 62,409 Derivative financial liabilities (96,379) (33,970) Available-for-sale financial assets 50,560 Derivative financial assets 1,100 51,660 Derivative financial liabilities (67,000) (15,340) 30 Operating leases Operating lease commitments Group as a lessee Future minimum rentals payable under non-cancellable operating leases as at 31 December are as follows: Within one year 178, ,835 Between one to five years 1,104, ,194 Between five to ten years 1,354,819 1,408,553 Between ten to twenty years 1,642,390 1,733,066 Between twenty to thirty years 708, ,726 Between thirty to fifty years 1,031,959 1,073,954 Between fifty to seventy years 914, ,508 More than seventy years 1,120,762 1,174,608 8,055,503 8,030,444 The above operating leases (Group as a lessee) mainly consist of terminal operating leases arising out of concession arrangements which are long-term in nature. In addition, there are also leases of plant, equipment and vehicles. In respect of terminal operating leases, contingent rent is payable based on revenues/profits earned in the future period. The majority of leases contain renewable options for additional lease periods at rental rates based on negotiations or prevailing market rate. 86
89 Business Review corporate governance FINANCIAL STATEMENTS Operating lease commitments Group as a lessor Future minimum rentals receivable under non-cancellable operating leases as at 31 December are as follows: Within one year 22,163 22,772 Between one to five years 61,483 56,131 More than five years 38,075 51, , ,778 The above operating leases (Group as a lessor) mainly consist of rental of property, plant and equipment leased out by the Group. The leases contain renewal options for additional lease periods and at rental rates based on negotiations or prevailing market rate. 31 Capital commitments Estimated capital expenditure contracted for as at 31 December 462,425 1,040, Contingencies (a) The Group has contingent liabilities amounting to USD 143,827 thousand (: USD 170,114 thousand) in respect of payment guarantees, USD 114,446 thousand (: USD 76,624 thousand) in respect of performance guarantees and USD 2,266 thousand (: nil) in respect of letters of credit issued by the Group s bankers. The bank guarantees and letters of credit are arising in the ordinary course of business from which it is anticipated that no material liabilities will arise. (b) The Group, through its 100% owned subsidiary Mundra International Container Terminal Private Limited ( MICT ), has developed and is operating the container terminal at the Mundra port in Gujarat. In 2006, MICT received a show cause notice from Gujarat Maritime Board ( GMB ) requiring MICT to demonstrate that the undertaking given by its parent company, P&O Ports (Mundra) Private Limited, with regard to its shareholding in MICT has not been breached in view of P&O Ports being taken over by the Group (DP World). Based on the strong merits of the case and on the advice received from legal counsel, management believes that the above litigation is unsubstantiated, and in management s view, it will have no impact on the Group s ability to continue to operate the port. (c) Chennai Port Trust ( CPT ) has raised a demand for an amount of USD 26,733 thousand (: 19,690 thousand) from Chennai Container Terminal Limited ( CCTL ), a subsidiary of the Group, on the basis that CCTL has failed to fulfil its obligations in respect of non-transhipment containers for a period of four consecutive years from 1 December CCTL has subsequently paid USD 14,282 thousand (: USD 13,780 thousand) under dispute in the year CCTL has commenced legal proceedings at the Chennai High Court against CPT. Based on advice from the legal counsel, management believes that the legal proceedings will have no adverse impact on the Group s financial position; the amount paid is highly likely to be recovered eventually and will not result in termination of the license agreement to operate the port. CPT has raised a demand for an amount of USD 16,841 thousand (: USD 15,950 thousand) from CCTL, towards additional lease charges for the land leased out to CCTL. Legal proceedings have been initiated for this matter and the Group strongly believes that this case will be settled in the Group s favour. 33 Significant group entities The extent of the Group s ownership in its various subsidiaries, associates and joint ventures and their principal activities are as follows: (a) Significant holding companies Ownership Legal name interest Country of incorporation Principal activities DP World FZE 100% United Arab Emirates Management and operation of seaports and airports and leasing of port equipment Thunder FZE 100% United Arab Emirates Holding company Peninsular and Oriental Steam Navigation Company Limited 100% United Kingdom Management and operations of seaports DP World Ports Co-op U.A. 100% Netherlands Holding Company DP World Maritime Cooperative U.A. 100% Netherlands Holding Company DPI Terminals Holdings C.V. 100% Netherlands Holding Company DPI Terminals Asia Holding Limited 100% Netherlands Holding Company DPI Terminals (BVI) Limited 100% Netherlands Holding Company 87
90 Notes to consolidated financial statements continued (forming part of the financial statements) 33 Significant group entities continued (b) Significant subsidiaries Ports Legal name Ownership interest Country of incorporation Principal activities Terminales Rio de la Plata SA 55.62% Argentina Container terminal operations DP World Adelaide Pty Ltd (refer to Note 34) 60% Australia Container terminal operations DP World Australia Ltd (refer to Note 34) 100% Australia Container terminal operations DP World Brisbane Pty Ltd (refer to Note 34) 100% Australia Container terminal operations DP World Sydney Pty Ltd (refer to Note 34) 90.37% Australia Container terminal operations DP World (Fremantle) Ltd (refer to Note 34) 100% Australia Container terminal operations DP World Antwerp N.V. 100% Belgium Container terminal and other operations DP World (Canada) Inc. 100% Canada Container terminals and Stevedoring Egyptian Container Handling Company (ECHCO) S.A.E. 90% Egypt Container terminal operations DP World Germersheim GmbH and Co. KG 100% Germany Container terminal operator and barge management operator CSX World Terminals Hong Kong Limited 66.66% Hong Kong Container terminal operations India Gateway Terminal Private Ltd % India Container terminal operations Mundra International Container Terminal Private Limited 100% India Container terminal operations Nhava Sheva International Container Terminal Private Limited 100% India Container terminal operations Chennai Container Terminal Private Limited 100% India Container terminal operations DP World Middle East Limited 100% Kingdom of Saudi Arabia Container terminal operations DP World Maputo S.A. 60% Mozambique Container terminal operations Qasim International Container Terminal Pakistan Ltd. 75% Pakistan Container terminal operations DP World Callao S.A. 100% Peru Container terminal operations Doraleh Container Terminal SARL 33.33% 1 Republic of Djibouti Container terminal operations Constanta South Container Terminal SRL 75% Romania Container terminal operations DP World Dakar S.A. 90% Senegal Container terminal operations DP World Tarragona S.A. 60% Spain Container terminal operations DP World UAE Region FZE 100% United Arab Emirates Container terminal operations DP World Fujairah FZE 100% United Arab Emirates Container terminal operations Southampton Container Terminals Limited 51% United Kingdom Container terminal operations Saigon Premier Container Terminal 80% Vietnam Container terminal operations 88
91 Business Review corporate governance FINANCIAL STATEMENTS (c) Associates and joint ventures Ports Legal name Ownership interest Country of incorporation Principal activities Djazair Port World Spa 50% Algeria Container terminal operations DP World Djen Djen Spa 50% Algeria Container terminal operations Antwerp Gateway N.V % Belgium Container terminal operations Caucedo Investment Inc. 45% British Virgin Islands Container terminal operations Manutention Generale Mediterranenne S.A. (Marseille) 25.50% France Container terminal operations Manutention Terminal Nord Development S.A. (Le Havre) 50% France Container terminal operations Port Synergy SAS 50% France Container terminal operations Asia Container Terminals Limited 55.16% 2 Hong Kong Container terminal operations Vishaka Container Terminals Private Limited 26% India Container terminal operations PT Terminal Petikemas Surabaya 49% Indonesia Container terminal operations Pusan Newport Co. Ltd % Korea Container terminal operations Qingdao Qianwan Container Terminal Co. Ltd. Tianjin Orient Container Terminal Co Ltd. DP World Yantai Company Limited 29% People s Republic of China 24.50% People s Republic of China 32.50% People s Republic of China Container terminal operations Container terminal operations Container terminal operations Asian Terminals Inc 50.54% 2 Philippines Container terminal operations Vostochny Stevedoring Company 25% Russia Container terminal operations Laem Chabang International Terminal Co. Ltd % Thailand Container terminal operations Tilbury Container Services Ltd. 34% United Kingdom Container terminal operations Dubai & Aden Port Development Company 33.34% Yemen Container terminal operations (d) Other non-port business Legal name Ownership interest Country of incorporation Principal activities P&O Maritime Services Pty Ltd. 100% Australia Maritime services Defence Maritime Services Pty Ltd. 50% Australia Maritime services Empresa Brasileria de Terminais Portuarious S.A % Brazil Container terminal operations ATL Logistics Centre Hong Kong Limited 34% Hong Kong Warehouse owner/operator ATL Logistics Centre Yantian Limited 48.83% Hong Kong Warehousing and logistics Empresa de Dragagem do Porto de Maputo, S.A % Mozambique Dredging services DP World Crane Services (Shanghai) ATL Logistics Centre Yantian (Shenzen) Limited 100% People s Republic of China 48.83% People s Republic of China Technical support, services, consulting with crane manufacturers and leasing of port equipment Warehousing and logistics Port Secure Djibouti 40% Republic of Djibouti Port Security Services Dubai International Djibouti FZE 100% United Arab Emirates Port Management and Operation P&O Maritime FZE 100% United Arab Emirates Management of Marine Assets service and port support operations DP World Cargo Services (Pty) Limited 70% South Africa Cargo Services 89
92 Notes to consolidated financial statements continued (forming part of the financial statements) 33 Significant group entities continued (e) Ports under development Legal name Ownership interest Country of incorporation Principal activities Rotterdam World Gateway B.V. 30% Netherlands Container terminal operations Yarimca Porselen Sanayi Ve Ticaret A.S. 100% Turkey Container terminal operations London Gateway Port Ltd. 100% United Kingdom Container terminal operations 1 Although the Group has only a 33.33% effective ownership interest in Doraleh Container Terminal SARL, this entity is treated as a subsidiary, as the Group is able to govern the financial and operating policies of the company by virtue of an agreement with the other investor. 2 Although the Group has more than 50% effective ownership interest in these entities, they are not treated as subsidiaries, but instead treated as joint ventures. The underlying joint venture agreement with the other shareholders does not provide significant control to the Group. 34 Subsequent event On 22 December, the Group, and Citi Infrastructure Investors (CII), together with one of CII s major investors announced their intention to form a strategic partnership in relation to the Group s five marine terminals in Australia. The Group, which formed a new joint venture company on completion of the transaction in March 2011, monetised 75% of the Group s share, whilst retaining a 25% shareholding. In addition, the Group has a long-term agreement to provide management services to the Australian operation. The total proceeds of the transaction amounts to USD 1,475,000 thousand (Australian Dollar 1,483,000 thousand). The net financial impact would be computed and disclosed in the financial statements for the six months ended 30 June 2011, after taking into account the impact of recycling of foreign currency translation reserve, tax charges and other costs related to the transaction. 90

93 designed by Emperor Design Consultants Ltd, produced by Sterling Financial Print Ltd
Global Ports Connecting Global Markets Presentation of Interim Results 25 August 2011
 Global Ports Connecting Global Markets Presentation of Interim Results 25 August 2011 1 Agenda Overview Mohammed Sharaf, Chief Executive Officer Financial Review Yuvraj Narayan, Chief Financial Officer
DP WORLD ANNOUNCES STRONG FINANCIAL RESULTS
 DP WORLD ANNOUNCES STRONG FINANCIAL RESULTS EPS grows 31 in 2015 driven by EZW acquisition and robust like-for-like growth Dubai, United Arab Emirates, 17 March, 2016. Global trade enabler DP World today
DP WORLD ANNOUNCES STRONG FINANCIAL RESULTS Like-for-like Earnings growth of 15.1% in 2017
 DP WORLD ANNOUNCES STRONG FINANCIAL RESULTS Like-for-like Earnings growth of 15.1 in 2017 Dubai, United Arab Emirates, 15 March 2018. Global trade enabler DP World today announces strong financial results
Interim Results to 30 June 2012
 Interim Results to 30 June 2012 Presentation to Investors and Analysts 29 August 2012 Mohammed Sharaf, Chief Executive Officer Yuvraj Narayan, Chief Financial Officer Agenda Introduction Sultan Ahmed Bin
DP WORLD ANNOUNCES SOLID FINANCIAL RESULTS Like-for-like Earnings grow 15.8% in First Half of 2017
 DP WORLD ANNOUNCES SOLID FINANCIAL RESULTS Like-for-like Earnings grow 15.8% in First Half of Dubai, United Arab Emirates, 24 August,. Global trade enabler DP World today announces solid financial results
DP WORLD ANNOUNCES STRONG FINANCIAL RESULTS Earnings grow 50% in First Half of 2016
 DP WORLD ANNOUNCES STRONG FINANCIAL RESULTS Earnings grow 50% in First Half of Dubai, United Arab Emirates, 18 August,. Global trade enabler DP World today announces strong financial results for the six
DP WORLD ANNOUNCES ROBUST FINANCIAL RESULTS Revenue growth of 14.4% in First Half of 2018
 DP WORLD ANNOUNCES ROBUST FINANCIAL RESULTS Revenue growth of 14.4 in First Half of 2018 Dubai, United Arab Emirates, 16 August 2018. Global trade enabler DP World today announces robust financial results
2018 Interim Results Presentation
 Presentation to Investors and Analysts 16 August 2018 2018 Interim Results Presentation Half Year ending 30 June 2018 Table of Contents Section 1 Introduction Yuvraj Narayan, Group Chief Financial Officer
The Ideal Criteria for Port Selection
 The Ideal Criteria for Port Selection 105th AAPA Annual Convention October 23-26, 2016 New Orleans, LA USA [Caucedo & Posorja Case] Table of Contents 1 Who are we? DP World s Global Portfolio Sections
2017 Interim Results Presentation For the Half Year ended 30 June 2017 Presentation to Investors and Analysts. 24 August 2017
 2017 Interim Results Presentation For the Half Year ended 30 June 2017 Presentation to Investors and Analysts 24 August 2017 2 Table of Contents Section 1 Introduction Yuvraj Narayan, Chief Financial Officer
DP WORLD ANNOUNCES ROBUST FINANCIAL RESULTS Revenue growth of 14.4% in First Half of 2018
 DP WORLD ANNOUNCES ROBUST FINANCIAL RESULTS Revenue growth of 14.4% in First Half of Dubai, United Arab Emirates, 16 August. Global trade enabler DP World today announces robust financial results for the
DP WORLD ANNOUNCES STRONG FINANCIAL RESULTS Like-for-like Earnings growth of 15.1% in 2017
 DP WORLD ANNOUNCES STRONG FINANCIAL RESULTS Like-for-like Earnings growth of 15.1% in 2017 Dubai, United Arab Emirates, 15 March 2018. Global trade enabler DP World today announces strong financial results
Notice of Annual General Meeting
 NOTICE IS HEREBY GIVEN that the Annual General Meeting of DP World Limited (the Company ) will be held at The Wheelhouse, Jebel Ali Port, Dubai, United Arab Emirates on Monday 26 April 2010 at 11.00 am
DP WORLD ANNOUNCES ROBUST FINANCIAL RESULTS Reported revenue growth of 20% in 2018
 DP WORLD ANNOUNCES ROBUST FINANCIAL RESULTS Reported revenue growth of 20% in 2018 Dubai, United Arab Emirates, 14 March 2019. Global trade enabler DP World today announces strong financial results for
DP World Limited Investor Presentation September 2017
 DP World Limited Investor Presentation September 2017 1 Our Journey From Local to Regional to Global Port Operator 1972 1998: Local port operator 1972. Development of Port Rashid (Dubai, UAE). 1979. Opening
DISCLOSEABLE TRANSACTION CONCESSION AGREEMENT IN RELATION TO KHALIFA PORT CONTAINER TERMINAL 2
 Hong Kong Exchanges and Clearing Limited and The Stock Exchange of Hong Kong Limited take no responsibility for the contents of this announcement, make no representation as to its accuracy or completeness
DP World Limited Investor Presentation May 2017
 DP World Limited Investor Presentation May 2017 1 Our Journey From Local to Regional to Global Port Operator 1972 1998: Local port operator 1972. Development of Port Rashid (Dubai, UAE). 1979. Opening
Expo 2020 Dubai and DP World partner to position the UAE at the heart of future global trade
 Press release Expo 2020 Dubai and DP World partner to position the UAE at the heart of future global trade Partnership with global trade enabler DP World to help Expo 2020 promote a future of Mobility,
DP World Limited. Investor Presentation January 2018
 DP World Limited Investor Presentation January 2018 1 Our Journey From Local to Regional to Global Port Operator 1972 1998: Local port operator 1972. Development of Port Rashid (Dubai, UAE). 1979. Opening
DP World Limited. Investor Presentation March 2018
 DP World Limited Investor Presentation March 2018 1 Our Journey From Local to Regional to Global Port Operator 1972 1998: Local port operator 1972. Development of Port Rashid (Dubai, UAE) 1979. Opening
Notes to the consolidated financial statements (forming part of the financial statements)
") Annual Report and Accounts Notes to the consolidated financial statements 1. Corporate information DP World Limited ( the Company ) was incorporated on 9 August 2006 as a Company Limited by Shares with
Annual Report and Accounts Notes to the consolidated financial statements 1. Corporate information DP World Limited ( the Company ) was incorporated on 9 August 2006 as a Company Limited by Shares with
DP World Limited Investor Presentation June 2018
 DP World Limited Investor Presentation June 2018 Our Journey From Local to Regional to Global Port Operator 1972 1998: Local port operator 1972. Development of Port Rashid (Dubai, UAE) 1979. Opening of
DP World Invests Over $1 Billion in Global Trade in 2017 Adding value across the supply chain for customers and partners
 Media Release DP World Invests Over $1 Billion in Global Trade in 2017 Adding value across the supply chain for customers and partners Dubai, United Arab Emirates, 7 January 2018: Growing global trade
HALF-YEARLY FINANCIAL RESULTS 2018 ROBERT WALTERS PLC
 HALF-YEARLY FINANCIAL RESULTS ROBERT WALTERS PLC INTRODUCTION PEOPLE ARE THE MOST IMPORTANT COMPONENTS OF OUR BUSINESS. FROM THE JOB SEEKER, TO THE HIRING MANAGER, TO THOSE WHO BRING THEM TOGETHER. SO
HALF-YEARLY FINANCIAL RESULTS 2017 ROBERT WALTERS PLC
 HALF-YEARLY FINANCIAL RESULTS ROBERT WALTERS PLC SPECIALISTS IN RECRUITMENT Robert Walters is a market-leading specialist professional recruitment group spanning 28 countries. Our specialist solutions
Operations Review. Europe Container Terminals ( ECT ), in the Netherlands, marks its 50 th anniversary. CK Hutchison Holdings Limited
, in the Netherlands, marks its 50 th anniversary. CK Hutchison Holdings Limited") Operations Review Europe Container Terminals ( ECT ), in the Netherlands, marks its 50 th anniversary. 16 CK Hutchison Holdings Limited Ports and Related Services The Bahamas The Netherlands United Kingdom
Operations Review Europe Container Terminals ( ECT ), in the Netherlands, marks its 50 th anniversary. 16 CK Hutchison Holdings Limited Ports and Related Services The Bahamas The Netherlands United Kingdom
ROBERT WALTERS PLC (the Company, or the Group ) Half-yearly financial results for the six months ended 30 June 2018 RECORD PROFITS, DIVIDEND UP 45%
 Half-yearly financial results for the six months ended 30 June 2018 RECORD PROFITS, DIVIDEND UP 45%") 26 July 2018 ROBERT WALTERS PLC (the Company, or the Group ) Half-yearly financial results for the six months ended 30 June 2018 RECORD PROFITS, DIVIDEND UP 45% Robert Walters plc (LSE: RWA), the leading
26 July 2018 ROBERT WALTERS PLC (the Company, or the Group ) Half-yearly financial results for the six months ended 30 June 2018 RECORD PROFITS, DIVIDEND UP 45% Robert Walters plc (LSE: RWA), the leading
Fliway Group Limited Results for announcement to the market NZX Appendix 1. 6 months to 31 December months to 31 December 2015
 Fliway Group Limited Results for announcement to the market NZX Appendix 1 Reporting Period 6 months to 31 December 2016 Previous Reporting Period 6 months to 31 December 2015 Amount (000s) Percentage
NUPLEX INDUSTRIES LIMITED RESULTS PRESENTATION FOR THE YEAR ENDED 30 JUNE 2012 PRESENTATION AGENDA
 NUPLEX INDUSTRIES LIMITED RESULTS PRESENTATION FOR THE YEAR ENDED 30 JUNE 2012 17 AUGUST 2012 Emery Severin, Chief Executive Officer Ian Davis, Chief Financial Officer PRESENTATION AGENDA 1. Group Overview
For personal use only
 GALE PACIFIC LIMITED (ASX:GAP) ASX and Media Release 25 th August 2011 Record NPAT of $7.1 million up 18% on previous year Earnings per share of 2.4 cents Continued strong cash flow generation from operations
2009 Half Year Results. August 25, 2009
 1 2009 Half Year Results August 25, 2009 2 Caution statement This presentation may contain forward looking statements, which are subject to risk and uncertainty. A variety of factors could cause our actual
AUSTAL DELIVERS RECORD REVENUE AND REDUCES NET DEBT BY 50%
 AUSTAL DELIVERS RECORD REVENUE AND REDUCES NET DEBT BY 50% COMPANY ANNOUNCEMENT 27 AUGUST 2014 Summary of results: Revenue of $1,122.9 million (FY2013: $899.5 million), EBIT of $55.6 million (FY2013: $38.1
Notes to Consolidated Financial Statements
 DP World Annual Report and Accounts Overview 67 Notes to Consolidated Financial Statements (forming part of the financial statements) 1 Reporting entity DP World Limited (the Company ) was incorporated
John Menzies plc. Interim Results Presentation 16 August 2016
 Interim Results Presentation 16 August 2016 1 Interim Results - 16 August 2016 Agenda Interim Results Overview Financial Overview Operational Overview Aviation Distribution Summary and Outlook 2 Executive
FINANCIAL HIGHLIGHTS Change %
 Statement of Results for the year ended 31 December 2012 FINANCIAL HIGHLIGHTS Change % Revenue 1 256.1m 251.7m +1.7% EBITDA 2 45.8m 47.3m -3.2% Operating profit 2 (before non-trading items) 26.5m 27.1m
Sir John Rose AGM 2010 Script. SLIDE 1: Delivering today, investing for the future Annual
 1 Sir John Rose AGM 2010 Script SLIDE 1: Delivering today, investing for the future Annual General Meeting 2010 Good morning. It is good to see so many of you here, and to have this opportunity to review
HSBC Holdings plc Interim Results 2012 Presentation to Investors and Analysts
 A Chinese ship in Brazil s largest port, Santos. Photography: Matthew Mawson HSBC Holdings plc Interim Results 2012 Presentation to Investors and Analysts Forward-looking statements This presentation and
UNITED ARAB EMIRATES
 SHIPPING IN THE UNITED ARAB EMIRATES Rania Tadros is the managing partner of Ince & Co s Dubai office. Rania qualified as an English solicitor with Ince & Co in London in 2000 and relocated from London
How Free Trade Zones Can Enhance Trade Development
 Conference on Global Connectivity With The Mediterranean Basin, July 2 nd & 3 rd 2012, Treiste, Italy How Free Trade Zones Can Enhance Trade Development Anand V Sharma Mantrana Maritime Advisory Pvt Ltd,
COSCO Pacific Limited
 Press Release 24th August 2011 Results Highlights COSCO Pacific Limited (Incorporated in Bermuda with Limited Liability) (stock code: 1199) 2011 Interim Results Revenue increased by 25.2% to US$278,667,000
U M M A L QUWAI N FR E E T RA DE ZONE AUT HO RIT Y PO BOX 7072 U M M A L QUWAI N / UAE
 U M M A L QUWAI N FR E E T RA DE ZONE AUT HO RIT Y PO BOX 7072 U M M A L QUWAI N / UAE TEL : +971(0)6 76 472 7 2 FAX: +971(0)6 76 4 9 7 8 2 W WW.UA QF T Z. CO M INFO@UAQF T Z. COM UA Q G OV E RN ME N T
For personal use only
 COMPANY ANNOUNCEMENT 23 FEBRUARY 2016 AUSTAL DELIVERS STRONG CASHFLOW, DOUBLES INTERIM DIVIDEND Summary: Revenue of $747.4 million (FY2015 H1: $680.2 million) EBIT of $29.0 million (FY2015 H1: $45.0 million,
Global Infrastructure Series
 Boston Strategies International, Inc. November 27 Global Infrastructure Series Global Supply Chain Management: Dubai www.bostonstrategies.com b t t t i (1) (781) 25 815 Page 1 This report has been prepared
Santander Trade Barometer. September 2017
 Santander Trade Barometer September 2017 Foreword John Carroll, MD Products & International Business, Santander The diversity, connectivity and innovation which underpins the UK economy has helped it regain
Third Quarter 2017 Results Announcement 31 October 2017
 Third Quarter 2017 Results Announcement 31 October 2017 Applus Services, S.A. ( Applus+ or the Group ), one of the world s leading and most innovative companies in Testing, Inspection and Certification,
COMPANY PROFILE. ACCIONA, sustainable development as a factor for leadership
 COMPANY PROFILE ACCIONA is one of the world's leading companies in terms of sustainability, standing out especially for its drive to develop renewable energies, infrastructures, water and services, placing
For personal use only. Lovisa Holdings Limited 2019 HALF YEAR
 Lovisa Holdings Limited 2019 HALF YEAR SHANE FALLSCHEER CHRIS LAUDER MANAGING DIRECTOR CHIEF FINANCIAL OFFICER Some of the information contained in this presentation contains forward - looking statements
July 26, 2017 LafargeHolcim Ltd 2015
 Second Quarter 2017 Results Beat Hess, Chairman and Interim CEO Roland Köhler, Interim COO and Regional Head of Europe, Australia/NZ & Trading Ron Wirahadiraksa, CFO July 26, 2017 LafargeHolcim Ltd 2015
NOTES TO THE CONSOLIDATED FINANCIAL STATEMENTS
 1. Corporate information DP World PLC ( the Company ) formerly known as DP World Limited, was incorporated on 9 August 2006 as a Company Limited by Shares with the Registrar of Companies of the Dubai International
COMPUTERSHARE LIMITED (ASX:CPU) FINANCIAL RESULTS FOR THE FULL YEAR ENDED 30 JUNE (Comparisons are to the full year ended 30 June 2007)
 FINANCIAL RESULTS FOR THE FULL YEAR ENDED 30 JUNE (Comparisons are to the full year ended 30 June 2007)") COMPUTERSHARE LIMITED (ASX:CPU) FINANCIAL RESULTS FOR THE FULL YEAR ENDED 30 JUNE 2008 (Comparisons are to the full year ended 30 June 2007) 13 August 2008 NOTE: All figures (including comparatives) are
COMPUTERSHARE LIMITED (ASX:CPU) FINANCIAL RESULTS FOR THE FULL YEAR ENDED 30 JUNE 2008 (Comparisons are to the full year ended 30 June 2007) 13 August 2008 NOTE: All figures (including comparatives) are
INTERIM REPORT. FDM Group (Holdings) plc. For the six months ended 30 June Creating and inspiring exciting careers that shape our digital future
 plc. For the six months ended 30 June Creating and inspiring exciting careers that shape our digital future") INTERIM REPORT For the six months ended 30 June 2016 Creating and inspiring exciting careers that shape our digital future Contents 1 About FDM 3 Highlights 6 Interim Management Review 14 Condensed Consolidated
INTERIM REPORT For the six months ended 30 June 2016 Creating and inspiring exciting careers that shape our digital future Contents 1 About FDM 3 Highlights 6 Interim Management Review 14 Condensed Consolidated
HSBC Middle East Securities LLC Financial statements for the year ended 31 December 2011
 Financial statements for the year ended 31 December 2011 Financial statements for the year ended 31 December 2011 Contents Page Directors' report Independent auditors' report Statement of income Statement
For personal use only
 The Manager Company Announcements Office Australian Stock Exchange Exchange Centre 20 Bridge Street SYDNEY NSW 2000 5 May 2016 ELECTRONIC LODGEMENT Dear Sir or Madam, RE: CHAIRMAN AND CEO'S ADDRESS 2016
EDITED TRANSCRIPT. ATCO Ltd. (TSX: ACO.X, ACO.Y) NELTUME PORTS INVESTMENT INVESTOR PRESENTATION EVENT DATE / TIME: SEPTEMBER 12, 2018 / 09:00 AM MDT
 NELTUME PORTS INVESTMENT INVESTOR PRESENTATION EVENT DATE / TIME: SEPTEMBER 12, 2018 / 09:00 AM MDT") EDITED TRANSCRIPT ATCO Ltd. (TSX: ACO.X, ACO.Y) NELTUME PORTS INVESTMENT INVESTOR PRESENTATION EVENT DATE / TIME: SEPTEMBER 12, 2018 / 09:00 AM MDT ATCO Ltd. (ACO.X, ACO.Y) NELTUME PORTS INVESTMENT INVESTOR
EDITED TRANSCRIPT ATCO Ltd. (TSX: ACO.X, ACO.Y) NELTUME PORTS INVESTMENT INVESTOR PRESENTATION EVENT DATE / TIME: SEPTEMBER 12, 2018 / 09:00 AM MDT ATCO Ltd. (ACO.X, ACO.Y) NELTUME PORTS INVESTMENT INVESTOR
2013 Interim Results. 14 August 2013
 2013 Interim Results 14 August 2013 1 This presentation contains statements that are, or may be, forward-looking regarding the group's financial position and results, business strategy, plans and objectives.
COMPUTERSHARE LIMITED (ASX:CPU) FINANCIAL RESULTS FOR THE FULL YEAR ENDED 30 JUNE August 2014
 FINANCIAL RESULTS FOR THE FULL YEAR ENDED 30 JUNE August 2014") COMPUTERSHARE LIMITED (ASX:CPU) FINANCIAL RESULTS FOR THE FULL YEAR ENDED 30 JUNE 2014 13 August 2014 NOTE: All figures (including comparatives) are presented in US Dollars (unless otherwise stated). The
COMPUTERSHARE LIMITED (ASX:CPU) FINANCIAL RESULTS FOR THE FULL YEAR ENDED 30 JUNE 2014 13 August 2014 NOTE: All figures (including comparatives) are presented in US Dollars (unless otherwise stated). The
Pinsent Masons in the UAE
 Pinsent Masons in the UAE Pinsent Masons In the UAE Introduction Our UAE office, based in the heart of Dubai s financial district, combines local knowledge with an international experience to advise clients
Nurturing Trade, Geared for Growth. Nurturing
 Nurturing Trade, Geared for Growth 1 2 DP World, UAE Region His Highness Sheikh Mohammed bin Rashid Al Maktoum His Highness Sheikh Khalifa bin Zayed Al Nahyan His Highness Sheikh Hamdan bin Mohammed Al
Emirates NBD Announces First Quarter 2018 Results
 For immediate release Emirates NBD Announces First Quarter 2018 Results Net profit up 27% y-o-y and 10% q-o-q to AED 2.4 billion Dubai, 18 April 2018 Emirates NBD (DFM: EmiratesNBD), a leading bank in
Savills plc. ( Savills or the Group ) RESULTS FOR THE HALF YEAR ENDED 30 JUNE 2013
 RESULTS FOR THE HALF YEAR ENDED 30 JUNE 2013") 8 August 2013 Savills plc ( Savills or the Group ) RESULTS FOR THE HALF YEAR ENDED 30 JUNE 2013 Savills plc, the international real estate advisor, today announces its unaudited results for the six months
8 August 2013 Savills plc ( Savills or the Group ) RESULTS FOR THE HALF YEAR ENDED 30 JUNE 2013 Savills plc, the international real estate advisor, today announces its unaudited results for the six months
An FSE Listings Inc Article FSE Listings Inc- Frankfurt Stock Exchange Listings
 FSE Listings How To Prepare Yourself For Listing On The Frankfurt Stock Exchange Author: Mark Bragg An FSE Listings Inc Article FSE Listings Inc- Frankfurt Stock Exchange Listings List your firm fast with
The Jebel Ali (JAFZA) Free Zone Company, Dubai General
 Free Zone Company, Dubai General") The Jebel Ali (JAFZA) Free Zone Company, Dubai General Jebel Ali Free Zone (JAFZA) is a 140 km2 free trade zone that offers office units, warehouses and land sites for lease. As one of the largest and
The Jebel Ali (JAFZA) Free Zone Company, Dubai General Jebel Ali Free Zone (JAFZA) is a 140 km2 free trade zone that offers office units, warehouses and land sites for lease. As one of the largest and
G4S plc 2018 Full Year Results
 12 March 2019 G4S plc 2018 Full Year Results G4S Chief Executive Officer Ashley Almanza commented: Our Secure Solutions business delivered underlying revenue growth of 3% and profit margins rose from 6.2%
INTERIM REPORT FOR THE SIX MONTHS ENDED 30 JUNE FDM Group (Holdings) plc
 plc") INTERIM REPORT FOR THE SIX MONTHS ENDED 30 JUNE Highlights Financial 30 June 30 June % change Revenue 117.1m 86.5m +35.4% Mountie revenue 100.8m 76.7m +31.4% Adjusted operating profit 1 22.4m 16.6m +34.9%
INTERIM REPORT FOR THE SIX MONTHS ENDED 30 JUNE Highlights Financial 30 June 30 June % change Revenue 117.1m 86.5m +35.4% Mountie revenue 100.8m 76.7m +31.4% Adjusted operating profit 1 22.4m 16.6m +34.9%
CMA CGM TO ACQUIRE NOL, REINFORCING ITS POSITION IN GLOBAL SHIPPING
 NOT FOR RELEASE, PUBLICATION OR DISTRIBUTION IN WHOLE OR IN PART IN, INTO OR FROM ANY JURISDICTION WHERE TO DO SO WOULD CONSTITUTE A VIOLATION OF THE RELEVANT LAWS OR REGULATIONS OF THAT JURISDICTION.
GRAFTON GROUP PLC INTERIM RESULTS FOR THE SIX MONTHS ENDED 30 JUNE Pretax profits up 32 per cent to 41.7m ( 31.6m)
") GRAFTON GROUP PLC INTERIM RESULTS FOR THE SIX MONTHS ENDED 30 JUNE 2003 Pretax profits up 32 per cent to 41.7m ( 31.6m) Adjusted EPS increased 25 per cent to 19.63c (15.68c) Operating profit before goodwill
GRAFTON GROUP PLC INTERIM RESULTS FOR THE SIX MONTHS ENDED 30 JUNE 2003 Pretax profits up 32 per cent to 41.7m ( 31.6m) Adjusted EPS increased 25 per cent to 19.63c (15.68c) Operating profit before goodwill
Standard Chartered first half profit up 9% to US$3.95bn
 Standard Chartered first half profit up 9% to US$3.95bn Strong momentum combined with diversity of performance provides real resilience Highlights: Group income climbs 9%, with growth across our markets.
IMCD reports 25% EBITA growth in 2018
 Press release IMCD reports 25% EBITA growth in 2018 Rotterdam, The Netherlands (1 March 2019) - IMCD N.V. ( IMCD or Company ), a leading distributor of speciality chemicals and food ingredients, today
HAMBURGER HAFEN UND LOGISTIK AG COMMERZBANK SECTOR CONFERENCE
 HAMBURGER HAFEN UND LOGISTIK AG COMMERZBANK SECTOR CONFERENCE Frankfurt am Main, 1 September 2011 Hamburger Hafen und Logistik AG DISCLAIMER The facts and information contained herein are as up to date
4 Operating and financial review
 4 Operating and financial review OVERVIEW Express transports goods and documents around the world with a focus on time-certain and/or day-certain delivery. Goods and documents have different weights, shapes
THE DUBAI INTERNATIONAL FINANCIAL CENTRE (DIFC) A COMPLETE GUIDE TO WEALTH STRUCTURING OPTIONS
 A COMPLETE GUIDE TO WEALTH STRUCTURING OPTIONS") THE DUBAI INTERNATIONAL FINANCIAL CENTRE (DIFC) A COMPLETE GUIDE TO WEALTH STRUCTURING OPTIONS Executive Summary The Dubai International Financial Centre (DIFC) has successfully positioned itself as a
THE DUBAI INTERNATIONAL FINANCIAL CENTRE (DIFC) A COMPLETE GUIDE TO WEALTH STRUCTURING OPTIONS Executive Summary The Dubai International Financial Centre (DIFC) has successfully positioned itself as a
Qube delivers revenue and earnings growth while completing strategic acquisitions for the future
 23 August 2017 ASX Announcement Qube delivers revenue and earnings growth while completing strategic acquisitions for the future Both operating divisions up and Moorebank on track with Target Australia
NOTICE OF ANNUAL GENERAL MEETING
 NOTICE OF ANNUAL GENERAL MEETING NOTICE IS HEREBY GIVEN that the Annual General Meeting ( AGM ) of DP World PLC (the Company ) will be held both online and in person at The Wheelhouse, Jebel Ali Port,
HEALTHPERM RESOURCING LTD. (FORMERLY YUJIN INTERNATIONAL LTD.) (the "Company") Interim Results for the six months ended 30 June 2016
 (the Company) Interim Results for the six months ended 30 June 2016") Thursday 29 September, 2016 HEALTHPERM RESOURCING LTD. (FORMERLY YUJIN INTERNATIONAL LTD.) (the "Company") Interim Results for the six months ended 30 June 2016 Chairman's Statement I am pleased to present
Thursday 29 September, 2016 HEALTHPERM RESOURCING LTD. (FORMERLY YUJIN INTERNATIONAL LTD.) (the "Company") Interim Results for the six months ended 30 June 2016 Chairman's Statement I am pleased to present
34.6M NEW ZEALAND S 2012 INTERIM REPORT
 2032 UNDERLYING HALF YEAR PROFIT UP 13.4% 39.2 MILLION FOR 6 MONTHS ENDED DEC FOR 6 MONTHS ENDED DEC 34.6M NEW ZEALAND S INTERIM REPORT INTERIM REPORT SIX MONTHS ENDED 31 DECEMBER : port OF TAURANGA LIMITED
IndigoVision Group plc ( IndigoVision or The Group ) Interim Results for the six months ending 30 June 2017
 Interim Results for the six months ending 30 June 2017") IndigoVision Group plc ( IndigoVision or The Group ) Interim Results for the six months ending 30 June 2017 Financial Highlights Revenue $20.4m (: $21.8m), with increased volumes Gross margin 51.1% (:
IndigoVision Group plc ( IndigoVision or The Group ) Interim Results for the six months ending 30 June 2017 Financial Highlights Revenue $20.4m (: $21.8m), with increased volumes Gross margin 51.1% (:
(i) No information is required to be disclosed in respect of Listing Rules (1), (3), (4), (5), (6), (7), (8), (9), (10), (11) and (14).
 No information is required to be disclosed in respect of Listing Rules (1), (3), (4), (5), (6), (7), (8), (9), (10), (11) and (14).") Directors Report The Directors submit their report and the audited Consolidated Financial Statements for the year ended 31 December 2016. Principal Activity, Results for the Year and Review of Business
Directors Report The Directors submit their report and the audited Consolidated Financial Statements for the year ended 31 December 2016. Principal Activity, Results for the Year and Review of Business
Emirates Integrated Telecommunications Company PJSC and its subsidiaries
 Emirates Integrated Telecommunications Company PJSC and its subsidiaries Condensed interim consolidated financial statements for the nine-month period ended 2015 Emirates Integrated Telecommunications
IndigoVision Group plc ( IndigoVision, the Company or the Group ) Interim Results for six months ending 30 June 2018
 Interim Results for six months ending 30 June 2018") 20 September 2018 IndigoVision Group plc ( IndigoVision, the Company or the Group ) Interim Results for six months ending 30 June 2018 Financial Highlights Revenue increased by 9.5% to $22.2m (2017: $20.3m
20 September 2018 IndigoVision Group plc ( IndigoVision, the Company or the Group ) Interim Results for six months ending 30 June 2018 Financial Highlights Revenue increased by 9.5% to $22.2m (2017: $20.3m
P.J.S.C ANNUAL REPORT
 P.J.S.C ANNUAL REPORT BRANCHES SHARJAH P.O. Box 881, Sharjah Tel : (971-6) 56 84 111 Fax : (971-6) 56 84 965 JEBEL ALI P.O. Box 16823, Jebel Ali, Dubai Tel : (971-4) 88 16 445 Fax : (971-4) 88 16 845 AL
Marine. Global Programmes. cunninghamlindsey.com. A Cunningham Lindsey service
 Marine Global Programmes A Cunningham Lindsey service Marine global presence Marine Global Programmes Cunningham Lindsey approach Managing your needs With 160 marine surveyors and claims managers in 36
COMPUTERSHARE LIMITED (ASX:CPU) FINANCIAL RESULTS FOR THE HALF YEAR ENDED 31 DECEMBER February 2015
 FINANCIAL RESULTS FOR THE HALF YEAR ENDED 31 DECEMBER February 2015") COMPUTERSHARE LIMITED (ASX:CPU) FINANCIAL RESULTS FOR THE HALF YEAR ENDED 31 DECEMBER 2014 11 February 2015 NOTE: All figures (including comparatives) are presented in US Dollars unless otherwise stated.
COMPUTERSHARE LIMITED (ASX:CPU) FINANCIAL RESULTS FOR THE HALF YEAR ENDED 31 DECEMBER 2014 11 February 2015 NOTE: All figures (including comparatives) are presented in US Dollars unless otherwise stated.
Majid Al Futtaim Holding LLC Consolidated Financial Statements For the year ended 31 December 2014
 Consolidated Financial Statements For the year ended 31 December 2014 Table of Content Page No Directors' report 1-2 Independent auditors' report 3-4 Consolidated statement of financial position 5 Consolidated
at the center of your administration
 at the center of your administration About IGC Who We Are Inter Global Consulting was founded with the aim of providing transparent and earnest services for setting up and managing businesses in the United
FY FEBRUARY 2015 ANALYST PRESENTATION
 FY 27 FEBRUARY 2015 ANALYST PRESENTATION Results Forward-looking Statements This presentation contains forward-looking statements, based on currently available plans and forecasts. By their nature, forward-looking
AEGIS GROUP PLC 2008 ANNUAL RESULTS. 19 March 2009
 AEGIS GROUP PLC 2008 ANNUAL RESULTS 19 March 2009 AGENDA OVERVIEW OF RESULTS John Napier FINANCIAL REVIEW Alicja Lesniak OUTLOOK John Napier Q&A Aegis Group plc Page 2 OVERVIEW OF RESULTS John Napier,
HALF YEAR RESULTS Robert Walters plc 26 July 2018
 HALF YEAR RESULTS Robert Walters plc 26 July 2018 # AUSTRALIA BELGIUM BRAZIL CANADA CHINA FRANCE GERMANY HONG KONG INDIA INDONESIA IRELAND JAPAN LUXEMBOURG MALAYSIA NETHERLANDS NEW ZEALAND PHILIPPINES
AGGREKO plc INTERIM RESULTS FOR THE SIX MONTHS TO 30 JUNE 2004
 AGGREKO plc Thursday 16 September INTERIM RESULTS FOR THE SIX MONTHS TO 30 JUNE 2004 Aggreko plc, the world leader in the supply of temporary power, temperature control and oil-free compressed air services,
A focus on innovation
 Introduction Bibby Line Group started out as a family-run shipping business. It was founded in 1807 and since that time the company has grown to become a global business. It has also diversified into new
Emirates Telecommunications Corporation Etisalat FY 13 Earnings Release
 Emirates Telecommunications Corporation Etisalat FY 13 Earnings Release Abu Dhabi, March 4 th 2014: Etisalat announced today its consolidated financial statements for the twelve months ending 31 st December
Dubai Electricity and Water Authority. Consolidated financial statements For the year ended 31 December 2016
 Consolidated financial statements For the year ended 31 December 2016 Consolidated financial statements For the year ended 31 December 2016 Pages Independent auditor s report 1-4 Consolidated balance sheet
Retail Banking and Wealth Management Investor Update
 March 2014 Retail Banking and Wealth Management Investor Update John Flint Chief Executive, RBWM Forward-looking statements This presentation and subsequent discussion may contain certain forward-looking
The Deloitte Talent in Insurance Survey 2015 UAE in Focus
 The Deloitte Talent in Insurance Survey 2015 UAE in Focus Survey findings Figure 1. Popularity of insurance as a career choice among business students, EMEA, 2015 Poland 2.98% Switzerland 2.93% Finland
NOTICE OF ANNUAL GENERAL MEETING
 NOTICE OF ANNUAL GENERAL MEETING NOTICE IS HEREBY GIVEN that the Annual General Meeting ( AGM ) of DP World Limited (the Company ) will be held both online and in person at The Wheelhouse, Jebel Ali Port,
John Menzies plc. Interim Results Presentation 14 August 2018
 John Menzies plc Interim Results Presentation 14 August 2018 Results Overview Highlights Underlying operating profit at 33.9m, up 18% at constant currency Profit progression John Menzies plc H1 underlying
Financial Results Full year ended 30 June August 2018
 Yesterday Today Tomorrow Financial Results Full year ended 30 June 2018 24 August 2018 Disclaimer The material contained in this document is a presentation of information about the Group s activities current
INTERIM MANAGEMENT STATEMENT QUARTER ENDED 31 MARCH 2012
 INTERIM MANAGEMENT STATEMENT QUARTER ENDED 31 MARCH 2012 12 April 2012 Financial summary Growth in net fees for the quarter ended 31 March 2012 (Q3) (versus the same period last year) Actual Growth LFL*
Samsonite International S.A. Announces 2013 Final Results Net sales top a record US$2 billion for the first time
 (Incorporated in Luxembourg with limited liability) (Stock code: 1910) Samsonite International S.A. Announces 2013 Final Results Net sales top a record US$2 billion for the first time Highlights Samsonite
FEATURED. Edition 60. RISK MANAGEMENT Fail to prepare, prepare to fail
 FEATURED - Terminal tugs - GREENCRANES - Simulation in VTS training - Port Community Systems www.porttechnology.org Edition 60 SUSTAINABLE SHIPPING LNG fuelling debate TRENDS IN THE BULK SUPPLY CHAIN A
MACQUARIE BANK ANNOUNCES A 13% INCREASE IN REPORTED EARNINGS AND A 34% INCREASE IN ORDINARY DIVIDENDS FOR THE 2006 FULL YEAR
 Macquarie Bank Limited ABN 46 008 583 542 No.1 Martin Place Telephone (61 2) 8232 3333 Money Market 8232 3600 Facsimile 8232 4227 Sydney NSW 2000 Facsimile (61 2) 8232 7780 Foreign Exchange 8232 3666 Facsimile