Annual Report DECEMBER we build value. SALINI IMPREGILO S.p.A. salini-impregilo.com
|
|
|
- Francine Miles
- 6 years ago
- Views:
Transcription

1 Cover_Relazione 2016_ING.qxp_Layout 1 21/04/17 19:01 Pagina 1 we build value Annual Report 2016 Annual Report SALINI IMPREGILO S.p.A. salini-impregilo.com 31 DECEMBER 2016
2 Table of contents CEO s letter to the shareholders 2 Company officers 8 Global presence and Group mission 10 Key events of the year 12 Directors report - Part I 18 Financial highlights 20 Performance 24 Directors report - Part II 44 Performance by geographical segment 48 Risk management system 68 Main risk factors and uncertainties 74 Sustainability business model 104 Human resources and organisation 108 Events after the reporting period 124 Outlook 126 Report on corporate governance and the ownership structure 128 Alternative performance indicators 130 Other information 132 Proposal to the shareholders of Salini Impregilo S.p.A. 134 Consolidated financial statements as at and for the year ended 31 December Notes to the consolidated financial statements 146 Statement of financial position 184 Income statement 263 Consolidated financial statements of Salini Impregilo Group - Intragroup transactions 278 Consolidated financial statements of Salini Impregilo Group - Equity investments 298 Consolidated financial statements of Salini Impregilo Group - Scope of Consolidation 308 Statement on the consolidated financial statements 330 Separate financial statements of Salini Impregilo S.p.A. as at and for the year ended 31 December Notes to the separate financial statements 342 Statement of financial position 364 Income statement 412 Proposal to the shareholders of Salini Impregilo S.p.A. 428 Separate financial statements of Salini Impregilo - Intragroup transactions 430 Separate financial statements of Salini Impregilo - Equity investments 454 Statement on the separate financial statements 470 Reports 472

3

4 CEO s letter to the shareholders

5 CEO s letter to the shareholders Dear shareholders, 2016 has been a great year for our Group: for the third year running, our results have met and in some cases exceeded the very ambitious targets we had set ourselves. Over the last three years, we have seen organic growth and profitability above the sector average. Our ability to select those projects with the best profit/risk ratio is one of the key factors underpinning our business plan presented in London in May Our acquisition of Lane Construction in the US, which took place towards the end of 2015/start of 2016, was a key contributor to our progress and will allow us to capitalise on opportunities in the US market as a local operator. We have continued our ongoing transformation from a privately-owned construction company to a global multinational, leader in the large infrastructures sector. Three years ago, we defined our vision: to become a pure player in the infrastructure sector, a market leader for large complex works and the most geographically diversified group in the world. The market has increasingly acknowledged our progress with the Group ranked number one in the water purification sector for the fourth year running (ENR no.1 ranking) and in the US roads sector with Lane (ENR no. 1 ranking) has been a very difficult year in economic and geopolitical terms. The global growth rate was around 2.3% while that of the advanced economies was 1.6%. The emerging countries development continued to be held back by the widespread political instability. Against this backdrop, the construction market is increasingly seen as an economic driver and investments in infrastructure viewed as a boost to economic recovery. Many countries are moving in this direction, first and foremost, the US, whose new administration has announced a USD1 trillion investment plan. The Group s flexible business model has allowed it to grow and avail of the best market opportunities. Our aim is to build up our presence in strongly growing areas like the US and Australia, while we have maintained our stronghold in the Arab 4 Annual Report as at 31 December 2016
6 CEO s letter to the shareholders countries and confirmed our footprint in those areas where we have traditionally had a base, such as the more stable African countries. We will also continue to focus on those projects that span the global mega trends characterising our sector: renewable energy, megacities, sustainable mobility, strengthening our position in these areas, especially the construction of metros and railways as well as wastewater treatment projects has been one of the most important years in the Group s history in terms of the delivery of completed projects and acquisition of new ones: we delivered and opened the new Panama Canal, perhaps one of the most complicated infrastructures ever built and which will generate total income of USD5 billion for Panama when it is fully operational. In December, we delivered the GIBE III dam in Ethiopia, which is currently the highest RCC dam in the world. This project worth an approximate 1.5 billion has confirmed the Group s global leadership in the water management sector. Another project we are very proud of is the Stavros Niarchos Foundation s Cultural Centre in Athens, a 600 million project designed by Renzo Piano. It obtained the Platinum certification from the LEED (Leadership in Energy and Environmental Design) Programme, acknowledging its compliance with strict environmental sustainability criteria which, together with its architectural complexity, make it unique. We also commenced work on a very strategic mobility project in Europe during the year: the Brenner tunnel, which will become one of the core transport corridors of the trans-european transport network (TEN-T) and the longest underground railway line in the world. The Group acquired many new projects in The main ones include the Rogun hydroelectric project in Tajikistan worth 1.8 billion and involving construction of the tallest dam in the world; the Koysha dam in Ethiopia worth 2.5 billion, the Perth metro in Australia for 790 million and the construction of a residential urban area in Kuwait city, as part of the larger South Al Mutlaa Housing project for 467 million. Lane was awarded several projects in the US, including the Purple Line Transit System in Maryland (Lane s share exceeds 600 million) and the Interstate 70 in Pennsylvania. At the start of 2017, it also acquired additional projects, such as extension of the 395 Express Lanes in Virginia and the important expansion of the Al Maktoum Airport in the United Arab Emirates (once completed, it is expected to become the largest airport in the world in terms of its size and passenger capacity by 2050). 5 Annual Report as at 31 December 2016
7 CEO s letter to the shareholders The Lane acquisition has been a key lever to allow the Group s growth in the US, which is its most strategic market according to the next three-year business plan. The results have already been very satisfactory with Lane increasing its order backlog to 2.5 billion in Merging Salini Impregilo s and Lane s skills will enable them to exploit the best opportunities on the US market, partly thanks to a marketing campaign for Lane s strategic repositioning to cover not only the roads and highways sector but also the dams, metro and railway sectors. The Group s ability to win and deliver projects and its sound financial management can be seen in its results for the year. Revenue exceeded the target 6.1 billion to come in at 6,124.5 million. EBITDA jumped 9.5% on 2015 to million. New orders of 7.3 billion show the Group s ability to reach and exceed its goals, confirmed by the extraordinary order backlog of 36.9 billion, of which 29.4 billion relates to construction contracts. Strengthening Salini Impregilo s brand at international level helps consolidate its market leadership. For this reason, it has decided to bolster its reputation by rolling out a marketing campaign on its business culture. The first important step of this campaign was launched in late 2016 with a conference, Presente e futuro delle infrastructure nel mondo. At the end of September, Salini Impregilo kickstarted its plan to celebrate the Group s 110 years, involving institutions, investors, opinion leaders and the media and its employees. The event launched the Beyond - Delivering the Future for the past 110 years exhibition held at the Triennale di Milan, which was the first time ever that large engineering works were presented as works of art. The success of these initiatives encouraged the Group to develop a programme for 2017 to launch Lane s new presence in the US. Events and concerts will be held in Milan, Washington and New York in 2017 to celebrate the 150th anniversary of Arturo Toscanini s birth, which will draw parallels between Toscanini s brilliance with that of the Group. The Group intends to grow in a sustainable manner, which includes its local communities. The Group contributes to local development by setting up schools, providing training, employment and work opportunities for our subcontractors and we also assist our customers to meet the Sustainable Development Goals set by the United Nations. This growth and transformation process is backed up by the consolidation of internal processes and structures that involve the risk management, quality, health and 6 Annual Report as at 31 December 2016
8 CEO s letter to the shareholders safety and compliance units. During 2016, we introduced 24 new procedures and related processes, assisted by regular internal communication, to promote the change management process and involve people in the new processes. Our steady growth over the last few years is a result of our people s contribution, the key strategic asset that sets the Group apart in the services and projects we offer our customers. During 2016, we honed the development paths for employees and started a knowledge-sharing project at group level. Our employee retention plans are flanked by projects to attract the best talent on the market, with special projects such as the International Construction Management masters course at the Milan Polytechnic University and employer branding events in some of the main technical universities around the world. We can affirm that the Group is well placed to take on future challenges. Pietro Salini 7 Annual Report as at 31 December 2016

9 Company officers
10 Company officers Board of directors (i) Chairperson Chief executive officer Directors Executive committee (ii) Chairperson Risk and control committee Chairperson Remuneration and appointment committee Chairperson Related party transactions committee Chairperson Board of statutory auditors (iii) Chairperson Standing statutory auditors Substitute statutory auditors Alberto Giovannini Pietro Salini Marco Bolgiani Marina Brogi Giuseppina Capaldo Mario Giuseppe Cattaneo Roberto Cera Nicola Greco Pietro Guindani Geert Linnebank Giacomo Marazzi Franco Passacantando Laudomia Pucci Alessandro Salini Grazia Volo Pietro Salini Alberto Giovannini Nicola Greco Giacomo Marazzi Mario Giuseppe Cattaneo Marco Bolgiani Giuseppina Capaldo Pietro Guindani Franco Passacantando Marina Brogi Nicola Greco Geert Linnebank Laudomia Pucci Marco Bolgiani Marina Brogi Giuseppina Capaldo Geert Linnebank Alessandro Trotter Teresa Cristiana Naddeo Gabriele Villa Roberta Battistin Marco Tabellini Independent auditors (iv) KPMG S.p.A. (i) Appointed by the shareholders on 30 April 2015; in office until approval of the financial statements as at and for the year ending 31 December (ii) Revoked from office on 15 September (iii) Appointed by the shareholders on 30 April 2014; in office until approval of the financial statements as at and for the year ended 31 December (iv) Engaged by the shareholders on 30 April 2015; term of engagement from 2015 to Annual Report as at 31 December 2016

11 Global presence and Group mission
12 Global presence and Group mission Mission Global presence Salini Impregilo is an industrial Group specializing in the construction of major, complex infrastructure projects throughout the world. Inspired by the principles of sustainable development, the Group uses technological and organisational innovation combined with its extraordinary human and professional resources, to develop construction solutions capable of enhancing the resources of communities and contributing to the economic and social improvement of nations. Salini Impregilo Group has reinforced its international presence over the years thanks to the construction of projects that have become symbols of progress for entire countries. It has completed 1,017 projects in Europe, 412 in Africa, 222 in North America, 213 in South America, 54 in the Middle East and 66 in Asia and Oceania for a total of approximately 2,000 works which have improved the lives of millions of people. Dams and hydroelectric power plans, motorways, roads and bridges, railways and metros, airports, canals, civil and industrial engineering: Salini Impregilo currently operates in 50 countries, has 35 thousand employees from 100 different countries, having a turnover of more than 6 billion and is the global leader in the water segment. Lane s acquisition represents another step in Salini Impregilo s expansion into the US infrastructure market and will bring significant growth opportunities, while increasing the diversification of the portfolio and improving the balance of its exposure between developed and developing markets. Our worldwide presence can be viewed on our website: 11 Annual Report as at 31 December 2016

13 Key events of the year
14 Key events of the year January 2016 Lane Industries Incorporated On 4 January 2016, the acquisition of 100% of Lane Industries Incorporated ( Lane ) was finalised. The consideration is roughly USD455 million. Salini Impregilo financed the acquisition with a bridge financing of 400 million, to be repaid in May 2017, obtained from a syndicate of five leading international banks. It subsequently repaid the financing through a new bond issue redeemable in Lane is one of the major highway contractors and is the top private asphalt producer in the United States. It is a family-owned business with more than 100 years of experience specialised in civil construction and in the transportation infrastructure sector with projects in more than 20 states in the US and roughly 5,000 employees. The company has three divisions: asphalt production, road projects and other infrastructure projects, in both domestic and international markets. Thanks to its strong track record, technical experience and the strategic location of its materials plants, Lane is participating in some of the largest and most complex projects in the US, such as the construction of the I-4 Ultimate highway in Florida, an approximate USD2.3 billion contract, in which it has a 30% stake. Lane s acquisition represents another step in Salini Impregilo s expansion into the US infrastructure market and will bring significant growth opportunities, increasing the diversification of the portfolio and improving the balance of its exposure between developed and developing markets. March 2016 Purple Line transit system in Maryland (USA) worth USD2 billion Purple Line Transit Partners, which includes Lane Construction, was selected as the best bidder for the design and construction of the Purple Line transit system worth USD2 billion. The contract includes the construction of 21 stations along a 16-mile alignment through Montgomery and Prince George s counties in Maryland. The joint venture, in which Lane has a 30% share (for approximately USD600 million), includes Fluor Enterprises Inc. and Traylor Bros Inc. The slated completion date is for April 2016 Sale of Todini Costruzioni Generali S.p.A. On 4 April 2016, the parent sold its investment in Todini Costruzioni Generali to Prime System Kz Ltd. for roughly 51 million (see the subsequent section on the Initial considerations on the comparability of data for more information). 13 Annual Report as at 31 December 2016
15 Key events of the year Perth rail contract worth AUD1.2 billion On 28 April 2016, Salini Impregilo signed a 10-year contract worth approximately 790 million (AUD1.2 billion) to design, construct and maintain an underground passenger rail line, which will connect the Forrestfield airport with central Perth (Australia). Salini Impregilo and NRW Pty Ltd, the two partners, signed the contract with the Government of Western Australia (WA). The rail network s total length will be 8.5 km, 8.0 km of which will be underground. Salini Impregilo and its partner will build the three stations, twin tunnels for virtually the entire length of the line, car parks and service structures for the buses. The joint venture, in which Salini Impregilo is the lead contractor with an 80% stake, will complete the works in May business plan On 20 May 2016, the parent s board of directors approved the new business plan for the period from 2016 to Its aim is to consolidate Salini Impregilo s leadership position in the complex large-scale infrastructures sector, confirming its top ranking place in the water cycle segment and continuing to develop its exceptional track record in the transport segment, specifically as regards metros, railways and roads. The plan focuses on cash generation. The prospected growth is supported by an order backlog that will provide roughly 70% of total revenue and 80% of the gross operating profit (Ebitda) in the next four years. These forecasts are based on the medium to long-term macroeconomic situations in the various geographical areas in which the Group is present and the expected development of the infrastructure sector, estimated to show an average growth rate of above 3%, to be worth roughly USD8,000 billion. The book to bill ratio is forecast to be in the range of 1.1 or higher. The new contracts will mostly be carried out in developed areas with better risk profiles and returns. Profitability will continue its excellent trend seen in the last two years, despite the rise in the costs necessary to benefit from the opportunities in the infrastructure market and the Group s commitment to strengthen Lane s organisational structure. The new business plan s success hinges on the Group maintaining a sound financial position and improving the debt/ebitda ratio, expected to be around 2/2.5x in Cash generation (cash flows before dividends) will be fundamental. Moreover, the Group s acquisition of Lane at the start of 2016 provides it with a new base for development in more stable areas, which will assist growth in less risky markets. Koysha dam 2.5 billion contract (Ethiopia) On 24 May 2016, Salini Impregilo won a new contract worth approximately 2.5 billion to build the Koysha dam awarded by Ethiopian Electric Power (EEP). This 14 Annual Report as at 31 December 2016
16 Key events of the year includes a hydroelectric plant with installed capacity of 2,200 MW and construction of a dam with a reservoir capacity of 6,000 cubic metres and annual energy generation of 6,460 Gwh. This important new project, to be performed entirely by Salini Impregilo, together with GIBE III and GERD (the Grand Renaissance Dam) on the Blue Nile, will enable Ethiopia to become Africa s leader in terms of energy production. June 2016 USD955 million contract in Kuwait On 17 June 2016, Kuwait s Public Authority for Housing Welfare assigned the contract for the construction of primary urbanisation works to build a new residential area in a 12 thousand hectares site located 40 km northwest of Kuwait City as part of the South Al Mutlaa Housing Project. The project, which is worth approximately 890 million, will be carried out by a consortium led by Salini Impregilo with a 55% stake and includes, inter alia, the construction of 150 km of roads and related structures and numerous other works. The Kuwaiti parliament has approved a development plan which includes investments totalling more than USD100 billion in infrastructure projects in the country, including the construction of thousands of homes-case, metro and railway networks and new refineries and industrial facilities. Placement of new five-year bond issue On 24 June 2016, Salini Impregilo communicated its intention to issue bonds with a total nominal amount of approximately 428 million and a fixed rate coupon of 3.75% to institutional investors. It placed the bonds on the Irish Stock Exchange in Dublin on 24 June Some of the bonds (nominal amount of roughly 128 million) were assigned to the holders of the 400,000, % notes due 1 August 2018 that adhered to the parent s exchange offer. The related exchange ratio for the existing bonds was %. After this exchange, the outstanding amount of the 400,000, % notes due 1 August 2018 was approximately 283 million. The parent used the proceeds from the newly issued bonds ( 300 million), to be redeemed on 24 June 2021 and not exchanged, to repay the bridge financing taken out to acquire Lane. On 11 July 2016, the parent successfully completed the placement of additional bonds with a total nominal amount of 171,736,000 reserved to institutional investors. The new bonds form part of a single series with the previous bonds of 428,264,000 issued on 24 June 2016 with a redemption date of 24 June 2021 for a total of 600 million. The new bonds are quoted on the Irish Stock Exchange in Dublin for settlement on 20 July Annual Report as at 31 December 2016
17 Key events of the year These transactions have extended the Group s average debt repayment dates and increased the component of fixed rate debt. Salini Impregilo delivers the new Panama Canal The contract is one of the largest and most important civil engineering projects ever to take place. It involved the construction of two new series of locks, one on the Atlantic side and the other on the Pacific side, which will allow an increase in commercial traffic through the Canal and better meet developments in the sea freight market with ships nearly three times bigger and with more tonnage than the ships that can currently use the existing locks (the Post Panamax ships). During the first half of 2016, all the civil and electromechanical works were finalised. On 31 May, the project was functionally completed, as confirmed by the customer, and the new Canal was officially opened on 26 June. The project carried out by the joint venture which includes Salini Impregilo hinged on unique technical and design solutions, such as, for example, a complex system of locks with sluice gates that allow the ships to rise 27 metres above sea level to enter Gatún Lake, one of the largest artificial lakes in the world. After crossing the lake, the set of locks on the other side of the Canal brings the ships back down to sea level so that they can exit the Canal. July 2016 Framework agreement worth USD3.9 billion in Tajikistan On 1 July 2016, Salini Impregilo signed a framework agreement with the Tajikistani government worth approximately USD3.9 billion to build a hydroelectric power plant. The Group, with a 100% share, has also been assigned the first lot of roughly USD1.9 billion to build a 335 metre-high rockfill dam with a clay core, the tallest in the world, on the Vakhsh River in Pamir, one of Central Asia s main mountain ranges. The agreement between Salini Impregilo and OJSC Rogun Hydropower Project (the state-run company that is coordinating the project) covers the exploitation of Pamir s huge hydroelectric potential and includes four lots. The three remaining lots will be assigned to the Group. Once completed, the plant will have six turbines of 600 MW each with a total installed capacity of 3,600 MW (the equivalent of three nuclear power plants). 16 Annual Report as at 31 December 2016
18 Key events of the year December 2016 Ethiopia inaugurates Gibe III dam Ethiopia has inaugurated Gibe III, the biggest hydroelectric dam in the country with an installed capacity of 1,870 MW and the tallest of its kind in the world. Built by Salini Impregilo, it will almost double the eastern African country s electricity production as it strives to modernise its economy and become a regional energy hub. The contract was worth approximately 1.6 billion and created roughly 20,000 jobs. 17 Annual Report as at 31 December 2016
19

20 Directors report Part I

21 Financial highlights
22 Directors report - Part I The acquisition of 100% of Lane was finalised on 4 January The IFRS provide that a subsidiary shall be consolidated starting from the date when control is acquired. The consolidated financial statements at 31 December 2016 present the statement of financial position figures at 31 December 2015 and the income statement figures for the year then ended for comparative purposes that do not include Lane Group. It follows that the data for 2016 are not very comparable. In order to make these data more comparable with 2015, this section sets out Salini Impregilo Group s key figures using the same consolidation scope. The Group monitors the key figures solely for management purposes adjusting Lane Group s IFRS figures to present the results of the non-subsidiary joint ventures consolidated on a proportionate basis. These management accounts results show the progress made on the contracts managed directly by Lane or through its noncontrolling investments in the joint ventures. The subsequent section on Initial considerations on the comparability of data - Lane Industries Incorporated provides more information on the following reconciliation of the adjusted key figures. The Alternative performance indicators paragraph gives a definition of the financial statements indicators used to present the Group s highlights. REVENUE 6, ,051.5 GROSS OPERATING PROFIT (EbITDA) OPERATING PROFIT (EbIT) PROFIT FROM CONTINUING OPERATION NET FINANCIAL INDEbTEDNESS (370.3) (350.8) (in millions of Euros) 21 Annual Report as at 31 December 2016
23 Directors report - Part I Consolidated income statement (in millions of Euros) Adjusted Adjusted Revenue 6, ,051.5 Gross operating profit (EBITDA) EbITDA % 9.2% 8.5% Operating profit (EBIT) R.o.S. 4.9% 4.6% Net financing costs (86.5) (103.7) Net gains (losses) on equity investments (15.3) 0.3 Profit before tax (EBT) Income tax expense (78.0) (93.6) Profit from continuing operations Loss from discontinued operations (20.7) (12.5) Non-controlling interests (39.6) (28.1) Profit for the year attributable to the owners of the parent Net financial indebtedness 31 December December 2015 (in millions of Euros) Adjusted Non-current financial assets Current financial assets Cash and cash equivalents 1, ,458.6 Total cash and cash equivalents and other financial assets 1, ,838.6 bank and other loans and borrowings (866.4) (1,134.6) bonds (868.1) (396.2) Finance lease liabilities (119.7) (79.8) Total non-current indebtedness (1,854.2) (1,610.6) Current portion of bank loans and borrowings and current account facilities (398.6) (541.1) Current portion of bonds (18.9) (10.2) Current portion of finance lease liabilities (55.3) (49.6) Total current indebtedness (472.8) (601.9) Derivative assets Derivative liabilities (7.2) (14.8) Net financial position with unconsolidated SPEs (5.3) 17.5 Total other financial assets (liabilities) (12.4) 2.7 Net financial indebtedness - continuing operations (350.8) (370.3) Net financial position (indebtedness) - discontinued operations - (18.9) Net financial indebtedness including discontinued operations (350.8) (389.2) 22 Annual Report as at 31 December 2016
24 Directors report - Part I Adjusted revenue for the year is 6,124.5 million compared to same-consolidation scope revenue of 6,051.5 million for It includes revenue of the unconsolidated joint ventures of Lane of million and million, respectively. The main factors driving the increase in the caption are some large contracts such as the Riyadh Metro Line 3 in Saudi Arabia, the GERD and Koysha dams in Ethiopia, the Red Line North Underground in Qatar, the Copenhagen Metro and Lane s ongoing projects. The adjusted gross operating profit amounts to million, up 9.5% on 2015 while the adjusted operating profit of million shows an improvement of about 6.6%. The adjusted gross operating profit is equal to 9.2% of revenue and the adjusted R.o.S. is 4.9%. Net financing costs approximate 86.5 million compared to million for The item comprises financial income of 44.5 million, net exchange rate gains of 15.4 million and financial expense of million. The profit before tax amounts to million, an improvement on the 2015 balance of million. The tax rate is roughly 39% compared to 53%. The loss from discontinued operations is 20.7 million and mainly refers to the realisation of net exchange rate losses accumulated in the translation reserve of 13.9 million after the sale of Todini Costruzioni Generali in April Non-controlling interests amount to 39.6 million and principally comprise 11 million for Lane s projects, 10 million for the Al Bayt Stadium and the Red Line North Underground in Qatar, 9 million for Line 3 of the Riyadh Metro in Saudi Arabia and 10 million for other projects. Net financial indebtedness from continuing operations amounts to million, which is an improvement on the same-consolidation scope balance of million at 31 December The 19.5 million improvement in this item is mainly due to: greater cash and cash equivalents of 150 million; higher gross indebtedness of million; a decrease in total other financial assets (liabilities) of 15.1 million, principally due to the Group s net amounts due to and from consortia and consortium companies. At 31 December 2015, the Group s net financial indebtedness from discontinued operations amounted to 18.9 million compared to a nil balance at the reporting date. 23 Annual Report as at 31 December 2016
25 Performance
26 Directors report - Part I The Initial considerations on the comparability of data section provides the Group s main figures for the year presented using the same consolidation scope to render them comparable with the prior year figures. Specifically, the management account figures include the results of the non-subsidiary joint ventures which are consolidated using the proportionate method ( work under management ). Analysis of Salini Impregilo Group s and parent s financial position and results of operations for the year This section presents the Group s and parent s reclassified income statements and statements of financial position and a breakdown of their financial position at 31 December It also provides an overview of the main changes in the Group s financial position and results of operations compared to the previous year. As shown later, the figures for 2016 are not fully comparable with those of 2015 due to the acquisition of Lane on 4 January Unless indicated otherwise, figures are provided in millions of Euros and those shown in brackets relate to the previous year. The Alternative performance indicators paragraph in the Other information section gives a definition of the financial statements indicators used to present the Group s and parent s financial position and results of operations for the year. Initial considerations on the comparability of data Lane Industries Incorporated As described in the section on the key events of the year, the acquisition of 100% of Lane was finalised on 4 January IFRS 10 Consolidated financial statements provides that a subsidiary shall be consolidated starting from the date when control is acquired. Therefore, the consolidated financial statements at 31 December 2016 present the statement of financial position figures at 31 December 2015 and the income statement figures for the year then ended for comparative purposes that do not include Lane Group. It follows that the data for 2016 are not fully comparable with those of the previous year. In order to make these data more comparable with 2015, this section sets out Salin Impregilo Group s key figures using the same consolidation scope. 25 Annual Report as at 31 December 2016
27 Directors report - Part I Comparison of the 2016 and 2015 data using the same consolidation scope The combined data at 31 December 2015 have been obtained by combining the Group s key figures, restated compared to that shown in the 2015 Annual Report to consider the new IFRS 5 scope, with the key figures of Lane Group, which are its consolidated figures at 31 December 2015 prepared in accordance with the IFRS. The net financial indebtedness at 31 December 2015 was obtained by combining the IFRS statement of financial position figures at that date with the IFRS figures of Lane Group. It also includes the debt incurred to acquire the US company. The following tables compare the Group s key figures at 31 December 2016 with the combined figures at 31 December 2015, as described above. Table A - Income statement Salini Impregilo Salini Impregilo Group Variation Group combined 2016 with Lane Group ( 000) 2015 Revenue 5,883,809 5,854,319 29,490 Gross operating profit (EbITDA) 536, ,293 49,041 EBITDA % 9.1% 8.3% Operating profit (EbIT) 275, ,743 18,770 R.o.S. % 4.7% 4.4% Profit before non-controlling interests 99,515 71,783 27, Annual Report as at 31 December 2016
28 Directors report - Part I Net financial indebtedness Salini Impregilo Salini Impregilo Group Lane Acquisition 31 December Group unaudited pro forma 4 January Published 31 December 2016 consolidated financial statements at 31 ( 000) December 2015 Non-current financial assets 62,458 67,832-67,832 Current financial assets 323, , ,104 Cash and cash equivalents 1,602,721 1,458,649 47,874 1,410,775 Total cash and cash equivalents and other financial assets 1,988,572 1,838,585 47,874 1,790,711 bank and other loans and borrowings (866,361) (1,134,637) (389,083) (745,554) bonds (868,115) (396,211) - (396,211) Finance lease liabilities (119,742) (79,789) - (79,789) Total non-current indebtedness (1,854,218) (1,610,637) (389,083) (1,221,554) Current portion of bank loans and borrowings and current account facilities (398,589) (541,096) (2,294) (538,802) Current portion of bonds (18,931) (10,203) - (10,203) Current portion of finance lease liabilities (55,281) (49,617) - (49,617) Total current indebtedness (472,801) (600,916) (2,294) (598,622) Derivative assets Derivative liabilities (7,180) (14,798) - (14,798) Net financial position with unconsolidated SPEs (5,345) 17,512-17,512 Total other financial assets (liabilities) (12,369) 2,714-2,714 Net financial indebtedness - continuing operations (350,816) (370,254) (343,503) (26,751) Net financial position (indebtedness) - discontinued operations - (18,939) - (18,939) Net financial indebtedness including discontinued operations (350,816) (389,193) (343,503) (45,690) Management accounts presentation of the figures for 2016 and 2015 ( Work Under Management ) The Group monitors the key figures of Lane Group for management purposes adjusting the IFRS figures prepared for consolidation purposes to present the results of the joint ventures not controlled by Lane which are consolidated on a proportionate basis. These figures show the progress made on contracts managed directly by Lane or through its non-controlling investments in joint ventures. 27 Annual Report as at 31 December 2016
29 Directors report - Part I Table B shows the effects of this presentation on the consolidated financial statements at 31 December 2016 compared with the combined figures of Salini Impregilo Group and Lane Group at 31 December 2015: Table B 2016 Work Under Management 2015 Work Under Management Salini Impregilo Joint ventures Total Salini Impregilo Joint ventures Total Variation Group not controlled including Group not controlled including WUM by Lane WUM combined with by Lane WUM ( 000) Lane Revenue 5,883, ,721 6,124,530 5,854, ,149 6,051,468 73,063 Gross operating profit (EBITDA) 536,334 24, , ,293 24, ,880 48,826 EBITDA % 9.1% 10.1% 9.2% 8.3% 12.5% 8.5% Operating profit (EBIT) 275,513 24, , ,743 24, ,330 18,555 R.o.S. % 4.7% 10.1% 4.9% 4.4% 12.5% 4.6% Net financing costs (86,506) - (86,506) (103,741) - (103,741) 17,235 Net gains (losses) on equity investments 9,122 (24,372) (15,250) 24,923 (24,587) 336 (15,586) Profit before tax (EbT) 198, , , ,925 20,204 Income tax expense (77,952) - (77,952) (93,647) - (93,647) 15,695 Profit from continuing operations 120, ,177 84,277-84,277 35,900 Loss from discontinued operations (20,662) - (20,662) (12,493) - (12,493) (8,169) Non-controlling interests (39,594) - (39,594) (28,135) - (28,135) (11,459) Profit for the year attributable to the owners of the parent 59,921-59,921 43,648-43,648 16,273 Sale of Todini Costruzioni Generali The parent completed the sale of Todini Costruzioni Generali to Prime System Kz Ltd., set up and organised under Kazakstani law, for about 51 million on 4 April The effects of the sale are presented in the 2015 income statement, except for those related to the reclassification of the translation reserve to profit or loss, recognised in 2016 ( 13.2 million). In March 2016, before the sale, Todini Costruzioni Generali s assets not sold to third parties were transferred to a newco HCE Costruzioni S.p.A. ( HCE ), which was subsequently sold to Salini Impregilo S.p.A. Therefore, at the transaction date, Todini Costruzioni Generali solely consisted of the assets and liabilities of the foreign business unit, i.e., the projects and branches operating in Georgia, Azerbaijan, Belarus and Kazakhstan, including the carrying amount of the investments in the subsidiaries carrying out the relevant projects, JV Todini Takenaka and Todini Central Asia, as well as some operating assets either owned directly by the Group or leased. 28 Annual Report as at 31 December 2016
30 Directors report - Part I The assets transferred to HCE included those belonging to Business unit A - Contracts in Italy, which include the Metrocampania (Naples Alifana and Secondigliano) contracts, the Valico crossing and Naples Sarno River contracts and the plant and machinery at the Lungavilla depot. The activities that Todini Costruzioni Generali transferred to HCE (Business A) were classified as assets held for sale in the consolidated financial statements at 31 December 2015 based on the expressions of interest received at that date. Given the status of the negotiations, the HCE assets have been classified under continuing operations in the 2016 consolidated financial statements. Therefore, it was necessary to restate the comparative figures for 2015 to be consistent with this approach used in 2016 pursuant to IFRS 5. The effects of the restatement of the income statement are shown in the following table: Variation ( 000) Restated Published Total revenue 4,770,295 4,738,876 31,419 Operating expenses ( ) (4,287,651) (4,252,366) (35,285) Gross operating profit (EBITDA) 482, ,510 (3,866) EBITDA % 10.1% 10.3% Amortisation and depreciation (215,058) (213,854) (1,204) Operating profit (EBIT) 267, ,656 (5,070) Return on Sales 5.6% 5.8% Net financing costs (90,424) (89,611) (813) Net gains on equity investments Net financing costs and net gains on equity investments (90,088) (89,275) (813) Profit before tax (EBT) 177, ,381 (5,883) Income tax expense (84,577) (84,577) 0 Profit from continuing operations 92,921 98,804 (5,883) Loss from discontinued operations (10,690) (16,573) 5,883 Profit before non-controlling interests 82,231 82,231 0 Non-controlling interests (21,639) (21,639) 0 Profit for the year attributable to the owners of the parent 60,592 60,592 0 ( ) They include provisions and impairment losses. 29 Annual Report as at 31 December 2016
31 Directors report - Part I Group performance Table 1 - Reclassified consolidated income statement Note (*) Variation ( 000) ( ) Revenue 5,760,358 4,624,066 1,136,292 Other income 123, ,229 (22,778) Total revenue 34 5,883,809 4,770,295 1,113,514 Operating expenses ( ) 35 (5,347,475) (4,287,650) (1,059,825) Gross operating profit (EBITDA) 536, ,645 53,689 EbITDA % 9.1% 10.1% Amortisation and depreciation 35 (260,821) (215,058) (45,763) Operating profit (EBIT) 275, ,587 7,926 Return on Sales % 4.7% 5.6% Financing income (costs) and gains (losses) on equity investments Net financing costs 36 (86,506) (90,424) 3,918 Net gains on equity investments 37 9, ,787 Net financing costs and net gains on equity investments (77,384) (90,089) 12,705 Profit before tax (EBT) 198, ,498 20,631 Income tax expense 38 (77,952) (84,577) 6,625 Profit from continuing operations 120,177 92,921 27,256 Loss from discontinued operations 20 (20,662) (10,690) (9,972) Profit before non-controlling interests 99,515 82,231 17,284 Non-controlling interests (39,594) (21,639) (17,955) Profit for the year attributable to the owners of the parent 59,921 60,592 (671) (*) The note numbers refer to the notes to the consolidated financial statements where the items are analysed in detail. ( ) They include provisions and impairment losses of 16,503 thousand in ( ) The income statement for 2015 was restated to comply with IFRS 5. The figures in this column do not include Lane acquired on 4 January Revenue Total revenue for the year is 5,883.8 million ( 4,770.3 million), including 5,344.2 million earned abroad ( 4,028.0 million), of which 1,305.5 million by Lane, and million in Italy. The 23.3% increase on 2015 is mainly due to the inclusion of Lane in the consolidation scope. Other income mostly refers to contract work in progress and specifically industrial activities and related works not directly related to contracts with clients. 30 Annual Report as at 31 December 2016
32 Directors report - Part I Operating profit (Ebit) The gross operating profit (Ebitda) and the operating profit (Ebit) for the year amount to million and million, respectively, with a gross operating profit margin of 9.1% (10.1%) and a R.o.S. of 4.7% (5.6%). The reduction in the two margins is mainly due to the consolidation of Lane Group. The central units costs and other general expenses for the year come to approximately million ( million). The operating profit generated by the foreign operations amounts to million, including 14.1 million by Lane, while the Italian operations, gross of the corporate costs, made an operating loss of 2 million. Financing income (costs) and gains (losses) on equity investments The Group recorded net financing costs of 86.5 million (net costs of 90.4 million) while net gains on equity investments amount to 9.1 million (net gains of 0.3 million). Net financing costs include financial income of 44.5 million and financial expense of million. The 28.3 million increase in the item is mainly due to the Group s larger gross financial indebtedness as a result of its acquisition of Lane. Moreover, its results are affected by financial expense of 25.4 million ( 12.1 million) arising from the application of the amortised cost method during the year, including 9.5 million for the financial debt restructuring that took place during the year. Net exchange rate gains amount to 15.5 million (net losses of 16.7 million). Income tax expense Loss from discontinued operations The income tax expense for the year is 78.0 million ( 84.6 million) calculated using the effective rate of 39.3% (47.6%). The reduction in the tax rate is due to, inter alia, the profit trend of the Group s contracts. The loss from discontinued operations amounts to 20.7 million ( 10.7 million) and mainly comprises: the realisation of exchange rate losses of 13.9 million accumulated in the translation reserve related to the foreign operations of Todini Costruzioni Generali sold on 4 April 2016; the cost of 6.6 million for Impregilo International Infrastructures NV s tax assessment concerning transactions, the results of which had been included in the loss from discontinued operations. 31 Annual Report as at 31 December 2016
33 Directors report - Part I Non-controlling interests Non-controlling interests amount to 39.6 million ( 21.6 million), mainly related to the subsidiaries working on the contracts for the Al Bayt Stadium and the Red Line North Underground in Qatar ( 10 million), some entities following the acquisition of Lane ( 11 million) and other entities in Saudi Arabia engaged in the construction of the Riyadh Metro Line 3 (roughly 9 million). The Group s financial position Table 2 - Reclassified consolidated statement of financial position Note (*) 31 December December 2015 Variation ( 000) ( ) Non-current assets ,173, , ,830 Goodwill 9 175, ,188 Net non-current assets held for sale 20 6,032 41,594 (35,562) Provisions for risks 27 (105,765) (106,361) 596 Post-employment benefits and employee benefits 26 (91,930) (25,412) (66,518) Net tax assets , ,066 (17,724) - Inventories , ,073 2,506 - Contract work in progress 14 2,367,263 1,775, ,472 - Progress payments and advances on contract work in progress 28 (2,455,632) (1,862,759) (592,873) - Loans and receivables (**) 15 2,357,251 1,543, ,079 - Liabilities (**) 29 (2,337,406) (1,630,437) (706,969) - Other current assets , ,642 72,628 - Other current liabilities 31 (356,315) (334,198) (22,117) Working capital 437, , ,726 Net invested capital 1,712,147 1,243, ,536 Equity attributable to the owners of the parent 1,205,005 1,116,000 89,005 Non-controlling interests 156, ,860 55,466 Equity 21 1,361,331 1,216, ,471 Net financial indebtedness 350,816 26, ,065 Total financial resources 1,712,147 1,243, ,536 (*) The note numbers refer to the notes to the consolidated financial statements where the items are analysed in detail. (**) These items show loans and receivables of 2.0 million and liabilities of 7.3 million (loans and receivables of 17.5 million) classified in net financial indebtedness and related to the Group s net amounts due from/to consortia and/or consortium companies (SPEs) operating under a cost recharging system and not included in the consolidation scope. The balance reflects the Group s share of cash and cash equivalents or debt of the SPEs. ( ) The figures in this column do not include Lane acquired on 4 January Annual Report as at 31 December 2016
34 Directors report - Part I Net invested capital This item increased by million on the previous year end to 1,712.1 million at 31 December 2016 principally as a result of Lane s consolidation, which led to an increase of million. The main changes are due to the factors listed below. Non-current assets Non-current assets increased by million. They may be analysed as follows: ( 000) 31 December December 2015 Variation Property, plant and equipment 803, , ,674 Intangible assets 168, ,821 (25,058) Equity investments 201, ,254 70,214 Total non-current assets 1,173, , ,830 Property, plant and equipment increased by million, mostly as a result of: the change in the consolidation scope of million due to the acquisition of Lane; investments of million, principally for the high speed/capacity Milan - Genoa railway section in Italy and the Ruta del Sol contract in Colombia, the projects in Ethiopia, Lane Group s contracts and the Riyadh Metro Line 3 in Saudi Arabia abroad; depreciation of the year of million; disposals of 63.2 million. Intangible assets show a net decrease of 25.1 million, mainly due to amortisation of 34 million, partly offset by the change in the consolidation scope following the acquisition of Lane. The 70.2 million increase in equity investments is mostly due to the following factors: acquisitions of interests in joint ventures through Lane s inclusion in the consolidation scope ( 37.6 million); the increase in the Group s interest in Grupo Unidos Por el Canal as a result of the capital injections ( 44.7 million). 33 Annual Report as at 31 December 2016
35 Directors report - Part I Goodwill This item refers to the acquisition of Lane Group ( 148 million) and assets from Asphalt Roads and Materials Company Inc. ( 27.2 million). The Group calculated these balances after completion of the purchase price allocation procedure as required by (revised) IFRS 3. Net non-current assets held for sale Net non-current assets held for sale amount to 6 million and mainly include the net assets of the USW Campania projects of 5.7 million, unchanged from 31 December At 31 December 2015, the item also included Todini Costruzioni Generali s net assets of 35.9 million (sold in the second quarter of 2016). Provisions for risks These provisions of million are substantially unchanged from the previous year end. Employees leaving entitlement and employee benefits This item s variation is mostly due to the consolidation of Lane Group. Net tax assets The following table analyses the item: ( 000) 31 December December 2015 Variation Deferred tax assets 121,925 64,064 57,861 Deferred tax liabilities (108,493) (55,857) (52,636) Net deferred tax assets 13,432 8,207 5,225 Current tax assets 135, ,577 21,410 Current tax liabilities (109,991) (68,273) (41,718) Net current tax assets 25,996 46,304 (20,308) Other current tax assets 146, ,652 3,851 Other current tax liabilities (67,589) (61,097) (6,492) Net other current tax assets 78,914 81,555 (2,641) Net tax assets 118, ,066 (17,724) The reduction in this item is due to the Group s taxable profit for the year, also considering the changes attributable to the foreign operations and the change in the consolidation scope. 34 Annual Report as at 31 December 2016
36 Directors report - Part I Working capital Working capital increased by million from million at 31 December 2015 to million at the reporting date. The main changes in the individual items making up net working capital are summarised below: inventories increased by 2.5 million to million due to the consolidation of Lane, partly offset by the consumption of materials for the Group s main contracts; the rise in contract work in progress of 2,367.3 million ( 1,775.8 million) is due to Italian contracts ( million) and foreign contracts ( 1,915.1 million, including million for the Venezuelan railway projects. The increase of million in this item reflects the production progress calculated using the most recent estimates of the ongoing projects profitability and is due to: - the rise in contract work in progress abroad of million, mostly related to the contracts in Denmark ( million), Qatar ( million) and Australia ( 91 million). The variation also includes 41.4 million for Lane following its inclusion in the consolidation scope; - the 52.6 million increase in contract work in Italy, mainly due to work on the high speed/capacity Milan - Genoa railway section; progress payments and advances on contract work in progress include both advances and negative work in progress (i.e., progress billings in excess of the cumulative value of the works built) and amount to 2,455.6 million, up million on 31 December This increase is mainly the result of: - the million increase in advances, mainly due to the amounts received for the contracts in Denmark ( 163 million) and Tajikistan ( 92.5 million), partly offset by the variation in the balance for contracts in Saudi Arabia ( 136 million); - the million increase in negative work in progress, due to the Koysha contract in Ethiopia ( million), consolidation of Lane s contracts ( million) and the Australian contracts ( 52.3 million); current loans and receivables, which increased by million. The item includes amounts of 2,203.6 million with third parties ( 1,381.6 million) and of million with unconsolidated group companies and other related parties ( million). The receivables from Venezuelan clients for railway contracts amount to million, mostly denominated in hard currency (Euros and US dollars). 35 Annual Report as at 31 December 2016
37 Directors report - Part I The increase is mainly a result of: - higher amounts from third parties of million, including million for Lane and million for the increase in receivables from the branch s clients in Ethiopia; - a reduction of 9.5 million in receivables from unconsolidated group companies and other related parties, following collections from non-consolidated Italian consortia; current liabilities, which increased by million and include liabilities with third parties of 2,233.6 million ( 1,501.7 million) and unconsolidated group companies and other related parties of million ( million). The increase in the item is mainly due to: - higher liabilities with third parties of million, including million for Lane, million for the Ethiopian contracts and other increases related to production progress on recently commenced contracts in the Middle East and Asia (specifically, the Al Bayt Stadium in Qatar, the Riyadh Metro in Saudi Arabia and the Rogun Hydropower Project in Tajikistan); - the 24.9 million decrease in liabilities with unconsolidated group companies and other related parties, including the variation in the balances with Pedelombarda S.c.p.A. following completion of the works; other assets increased by 72.6 million, mainly due to the consolidation of Lane. Net financial indebtedness At 31 December 2016, the Group has net financial indebtedness from continuing operations of million (indebtedness of 26.8 million), while its indebtedness from discontinued operations is nil (indebtedness of 18.9 million) following the new IFRS 5 scope. The increase in the Group s net financial indebtedness is mainly a combination of: the financing taken out to acquire Lane, which entailed an outlay of 429 million, and to acquire some assets of the US company Asphalt Roads and Material Company Inc. for 33.9 million; cash inflows generated in Gross indebtedness increased by million from 31 December 2015 to 2,332.4 million at the reporting date. The debt/equity ratio (based on the net financial indebtedness from continuing operations) is 0.26 at group level at the reporting date. 36 Annual Report as at 31 December 2016
38 Directors report - Part I Salini Impregilo has given guarantees of million in favour of unconsolidated group companies securing bank loans. The Group s net financial indebtedness at 31 December 2016 is summarised in the following table. Table 3 - Net financial indebtedness of Salini Impregilo Group Note (*) 31 December December 2015 Variation ( 000) ( ) Non-current financial assets 11 62,458 67,832 (5,374) Current financial assets , ,104 11,289 Cash and cash equivalents 19 1,602,721 1,410, ,946 Total cash and cash equivalents and other financial assets 1,988,572 1,790, ,861 bank and other loans and borrowings 22 (866,361) (745,554) (120,807) bonds 23 (868,115) (396,211) (471,904) Finance lease liabilities 24 (119,742) (79,789) (39,953) Total non-current indebtedness (1,854,218) (1,221,554) (632,664) Current portion of bank loans and borrowings and current account facilities 22 (398,589) (538,802) 140,213 Current portion of bonds 23 (18,931) (10,203) (8,728) Current portion of finance lease liabilities 24 (55,281) (49,617) (5,664) Total current indebtedness (472,801) (598,622) 125,821 Derivative assets Derivative liabilities 25 (7,180) (14,798) 7,618 Net financial position with unconsolidated SPEs (**) (5,345) 17,512 (22,857) Total other financial assets (liabilities) (12,369) 2,714 (15,083) Net financial indebtedness - continuing operations (350,816) (26,751) (324,065) Net financial position (indebtedness) - discontinued operations - (18,939) 18,939 Net financial indebtedness including discontinued operations (350,816) (45,690) (305,126) (*) The note numbers refer to the notes to the consolidated financial statements where the items are analysed in detail. (**) This item shows the Group s net amounts due from/to unconsolidated consortia and/or consortium companies operating under a cost recharging system and not included in the consolidation scope. The balance reflects the Group s share of cash and cash equivalents or debt of the SPEs. The balances are shown under trade receivables and payables in the consolidated financial statements. ( ) The figures in this column do not include Lane acquired on 4 January Annual Report as at 31 December 2016
39 Directors report - Part I Performance of the parent Salini Impregilo S.p.A. Table 4 - Reclassified income statement Note (*) Variation ( 000) ( ) Revenue 2,974,148 2,913,417 60,731 Other income 102, ,772 (11,260) Total revenue 29 3,076,660 3,027,189 49,471 Operating expenses 30 (2,706,960) (2,708,431) 1,471 Gross operating profit (EBITDA) 369, ,758 50,942 EbITDA % (**) 12.0% 10.5% Amortisation and depreciation 30 (124,851) (112,154) (12,697) Operating profit (EBIT) 244, ,604 38,245 Return on Sales (**) 8.0% 6.8% Financing income (costs) and gains (losses) on equity investments Net financing costs 31 (60,820) (53,633) (7,187) Net losses on equity investments 32 (56,103) (114,938) 58,835 Net financing costs and net losses on equity investments (116,923) (168,571) 51,648 Profit before tax (EBT) 127,926 38,033 89,893 Income tax expense 33 (63,323) (2,302) (61,021) Profit for the year 64,603 35,731 28,872 (*) The note numbers refer to the notes to the separate financial statements where the items are analysed in detail. (**) The Other information section gives a definition of these indicators. Revenue Total revenue for the year is 3,076.7 million ( 3,027.2 million), including million ( million) earned in Italy and 2,688.9 million ( 2,529.9 million) abroad. Other income mainly refers to assistance and coordination services provided by the parent to its investees for a fee. Operating profit (Ebit) The operating profit for the year amounts to million ( million) with a R.o.S. of 8.0% of total revenue (6.8%). The 2016 operating profit was affected by the corporate structure s costs of million ( million). 38 Annual Report as at 31 December 2016
40 Directors report - Part I Financing income (costs) and gains (losses) on equity investments The parent recorded net financing costs of 60.8 million (net costs of 53.6 million) while net losses on equity investments amounted to 56.1 million (net losses of million). As already disclosed in the section on the Group, the parent s net financial position was affected by the rise in gross financial indebtedness incurred to acquire Lane. Net exchange rate gains amount to 15.3 million (net gains of 16.1 million). Net losses on equity investments of 56.1 million (net losses of million) are principally the result of the impairment losses recognised on the investments in Grupo Unidos Por el Canal ( 25.6 million) and HCE Costruzioni ( 28.5 million). In 2015, the losses reflected the impairment loss of 96.4 million on the investment in Todini Costruzioni Generali recognised after the sales agreement (described earlier) was signed. Financial position of the parent Salini Impregilo S.p.A. Table 5 - Reclassified statement of financial position ( 000) Note (*) 31 December December 2015 Variation Non-current assets ,432,783 1,086, ,162 Provisions for risks 22 (72,076) (29,884) (42,192) Post-employment benefits and employee benefits 21 (12,802) (12,090) (712) Net tax assets ,909 60,499 48,410 - Inventories 9 180, ,256 (17,446) - Contract work in progress 10 1,010, ,856 71,336 - Progress payments and advances on contract work in progress 23 (1,246,547) (1,003,418) (243,129) - Loans and receivables (**) 11 1,712,786 1,027, ,384 - Liabilities (**) 24 (1,408,433) (899,898) (508,535) - Other current assets , ,530 50,063 - Other current liabilities 26 (132,067) (118,168) (13,899) Working capital 382, ,560 23,774 Net invested capital 1,839,148 1,463, ,442 Equity 16 1,007, ,362 70,066 Net financial indebtedness 831, , ,376 Total financial resources 1,839,148 1,463, ,442 (*) The note numbers refer to the notes to the separate financial statements where the items are analysed in detail. (**) These items show loans and receivables of 2.0 million and liabilities of 7.3 million (loans and receivables of 17.5 million) classified in net financial indebtedness and related to the parent s net amounts due from/to consortia and/or consortium companies (SPEs) not controlled by any one entity and operating under a cost recharging system. The balance reflects the parent s share of cash and cash equivalents of the SPEs. 39 Annual Report as at 31 December 2016
41 Directors report - Part I Net invested capital This item increased by million on the previous year end. The main changes are due to the factors listed below. Non-current assets Non-current assets increased by million. They may be analysed as follows: ( 000) 31 December December 2015 Variation Property, plant and equipment 223, ,955 (65,561) Intangible assets 79, ,065 (38,521) Equity investments 1,129, , ,246 Total non-current assets 1,432,783 1,086, ,164 Property, plant and equipment decreased by approximately 65.6 million, mainly due to depreciation ( million), investments ( 69.5 million) and disposals ( 29.9 million). Intangible assets mostly comprise the cost incurred to acquire contracts and decreased by 38.5 million, mostly as a result of amortisation ( 23 million) and the sale of 14% of Civil Works to a group company ( 16.3 million). Equity investments increased by million following the acquisition of Lane. Post-employment benefits and employee benefits This item of 12.8 million is substantially unchanged from the previous year end. 40 Annual Report as at 31 December 2016
42 Directors report - Part I Net tax assets At 31 December 2016, net tax assets amount to million ( 60.5 million) and may be analysed as follows: ( 000) 31 December December 2015 Variation Deferred tax assets 38,892 35,760 3,132 Deferred tax liabilities (24,152) (34,570) 10,418 Net deferred tax assets 14,740 1,190 13,550 Current tax assets 107,788 83,056 24,732 Current tax liabilities (72,172) (47,775) (24,397) Net current tax assets 35,616 35, Other current tax assets 73,949 54,810 19,139 Other current tax liabilities (15,396) (30,782) 15,386 Net other current tax assets 58,553 24,028 34,525 Net tax assets 108,909 60,499 48,410 Working capital Net financial indebtedness Working capital increased by 23.8 million to million at the reporting date. The main changes in the individual items arose as a result of developments in the parent s operations and production on projects in Italy and abroad during the year. At 31 December 2016, the parent has net financial indebtedness of million compared to million at the end of the previous year. The following table shows the parent s net financial indebtedness at 31 December 2016 and changes therein: 41 Annual Report as at 31 December 2016
43 Directors report - Part I Table 6 - Net financial indebtedness of Salini Impregilo S.p.A. ( 000) Note (*) 31 December December 2015 Variation Non-current financial assets 7 19,800 17,630 2,170 Current financial assets , , ,234 Cash and cash equivalents , ,933 88,619 Total cash and cash equivalents and other financial assets 1,503,933 1,264, ,023 bank and other loans and borrowings 17 (756,981) (675,989) (80,992) bonds 18 (868,115) (396,211) (471,904) Finance lease liabilities 19 (47,237) (67,002) 19,765 Total non-current indebtedness (1,672,333) (1,139,202) (533,131) Current portion of bank loans and borrowings and current account facilities 17 (605,879) (606,595) 716 Current portion of bonds 18 (18,931) (10,203) (8,728) Current portion of finance lease liabilities 19 (30,414) (42,081) 11,667 Total current indebtedness (655,224) (658,879) 3,655 Derivative liabilities 20 (2,751) (10,685) 7,934 Net financial position with unconsolidated SPEs (**) (5,345) 17,512 (22,857) Total other financial assets (liabilities) (8,096) 6,827 (14,923) Net financial indebtedness including discontinued operations (831,720) (526,344) (305,376) (*) The note numbers refer to the notes to the separate financial statements where the items are analysed in detail. (**) These items show the parent s net amounts due from/to consortia and/or consortium companies not controlled by any one entity and operating under a cost recharging system. The balance reflects the parent s share of cash and cash equivalents or debt of the SPEs. The loans and receivables and liabilities making up this balance are presented under trade receivables and trade payables, respectively, in the separate financial statements. 42 Annual Report as at 31 December 2016
44

45

46 Directors report Part II
 December 2016 of total Italy 12,934.7 35.0% Africa 7,047.5 19.1% Americas 6,679.3 18.1% Asia 6,057.0 16.4% Europe 3,359.7 9.1% Oceania 832.1 2.3% Total 36,910.3 100.")
47 Directors report - Part II Order backlog The order backlog for the construction and concession segments is as follows at the reporting date: Area/country Residual backlog at 31 Percentage (Share in millions of Euros) December 2016 of total Italy 12, % Africa 7, % Americas 6, % Asia 6, % Europe 3, % Oceania % Total 36, % 46 Annual Report as at 31 December 2016

48 Directors report - Part II The following chart provides a breakdown of the order backlog by area/country: Breakdown of the order backlog EU 9.1% Oceania 2.3% Asia 16.4% Italy 35% Americas 18.1% Africa 19.1% 47 Annual Report as at 31 December 2016

49 Performance by geographical segment
50 Directors report - Part II Italy The Group operates in the construction and concessions sectors in Italy. Macroeconomic scenario 2016 was characterised by global instability and uncertainty. The key underlying factors were i) Brexit, ii) the constitutional referendum in Italy and subsequent change of its executive branch, iii) concerns about the European banking system s health, iv) the Chinese economy s slowdown, v) consistently lower inflation levels in the advanced economies and vi) limits to the central banks room for manoeuvre. This situation was also affected by the numerous geopolitical risk factors in the Middle East and the uncertainty about the outcome of the important elections in the US and Western Europe. According to the most recent data published by ISTAT (the Italian national institute for statistics) in March 2017, Italian GDP should have grown by 0.9% in 2016, showing an improvement on the 0.8% growth rate of 2015, thus confirming the steady, ongoing progress of the last few years. The budget deficit is expected to decrease by 0.2% on 2015 while the 2017 budget includes a number of incentives to boost innovation and investment as well as a reduction in the corporate income tax rate from 27.5% to 24%. The reduction in rates to historical lows has led to a large decrease in interest expense, generating significant fiscal space. The effective interest rate on public debt of around 3% and the cut in interest payments of approximately 20% should allow the government to recommence public investments. Greater public spending would speed up growth and push down debt levels. However, any delay in the introduction of the ambitious public investment programme will slow down recovery. Construction The order backlog for the Italian construction segment is as follows: Project Residual order backlog Percentage (Share in millions of Euros) at 31 December 2016 of total High speed/capacity 5, % Other projects 3, % Total 8, % 49 Annual Report as at 31 December 2016
51 Directors report - Part II The following chart provides a breakdown of the order backlog by type of business: Breakdown of the Italian construction Other 34.8% Hight Capacity/ Hight Speed 65.2% Project Residual order backlog Percentage (Share in millions of Euros) at 31 December 2016 of completion COCIV LOT 1-6 3, % IRICAV 2 2, % OTHER 4.5 High speed/capacity 5,652.8 broni-mortara 981,5 0,0% Metro b % Milan Metro Line % Jonica state highway % Other Other work in Italy 3,019.2 Total 8,672.0 High-speed/capacity Milan-Genoa Railway Project The project for the construction of this railway line was assigned to COCIV Consortium as general contractor by RFI S.p.A. (Rete Ferroviaria Italia, formerly TAV S.p.A. - as Ferrovie dello Stato s operator) with the agreement of 16 March The project s pre-contractual stage was complicated and difficult, with developments from 1992 to 2011 on various fronts. On 11 November 2011, a rider to the agreement was signed for the assignment to the consortium of the design and construction of the Giovi third railway crossing of the high speed/capacity Milan - Genoa railway line. Salini Impregilo is the consortium leader with a percentage of 68.25%. 50 Annual Report as at 31 December 2016
52 Directors report - Part II The works began on 2 April 2012 and the contract is worth approximately 4,400 million. It is split into six non-functional construction lots for a total of roughly 120 months including the pre-operating/inspection phase. During the first half of the year, RFI commenced the third construction lot 21 months behind schedule, increasing the total value of the works and activities financed and under construction to 1,634 million, 537 million higher than the active lots (1 and 2). In addition, the Interministerial Committee for Economic Planning (CIPE) approved financing of the fourth construction lot with resolution no. 42/16 of 10 August 2016, sending the documentation to the Court of Auditors for its examination. Communication of the effectiveness of the fourth lot is scheduled for 17 March This fourth construction lot will increase the amount of financed works by 1,125 million to 2,759 million. On 26 October, the Rome and Genoa Public Prosecutors issued orders which, inter alia, involved certain parties related to the consortium. More information is available in the Main risk factors and uncertainties section. High-speed/capacity Verona-Padua Railway Project The IRICAV DUE consortium is RFI s general contractor for the design and construction of the high speed/capacity Verona-Padua section as per the agreement of 15 October Its role was confirmed by the arbitration award of May 2012, which has become definitive. Salini Impregilo s current involvement in the consortium is 34.09%. During the first half of this year and together with its partner Astaldi, Salini Impregilo communicated their interest in acquiring the stakes of Ansaldo STS of 8.12% and 8.93%, respectively. Should this acquisition go ahead (RFI s approval is conditional upon Ansaldo STA continuing to hold a nominal stake of 0.001%), Salini Impregilo s share of the consortium fund would increase to %. In 2015, the consortium provided the customer with the definitive project drawings for the Verona-Vicenza sub-section with the bid. It also delivered the definitive project, inclusive of the related bid, for the first functional lot, the Verona-Vicenza junction. On 23 March 2016, the Services Conference took place in the presence of the Directorate General for Railway Transport and Railway Infrastructure of the Ministry of Infrastructure and Transport (MIT), attended by the bodies involved in the project. Once it has obtained the environmental compatibility opinions and the opinion of the Superior Council of Public Works, the MIT will send the design for the first functional lot to CIPE for its definitive approval, which is expected for early In the meantime, negotiations with RFI to check the fairness of the consideration are underway. 51 Annual Report as at 31 December 2016
53 Directors report - Part II At present, it can be assumed that the rider for the first functional lot will be signed with RFI during the first six months of 2017, allowing commencement of the works in the second half of the year. The contract is worth an estimated 5 billion, including roughly 2 billion for the first functional lot, the Verona-Vicenza junction. Concessions The Group s portfolio of concession activities in Italy mainly consists of investments in the operators still involved in developing projects and constructing the related infrastructure. These concessions principally relate to the transport sector (motorways, metros and car parks). The following tables show the key figures of the Italian concessions at the reporting date, broken down by business segment: MOTORWAYS Country Operator % of Total Stage Start date End date investment km Italy SabroM-broni Mortara not yet active Italy (Ancona) Dorico-Porto Ancona bypass not yet active METROS Country Operator % of Total Stage Start date End date investment km Italy (Milan) Milan Metro Line not yet active CAR PARKS Country Operator % of Total Stage Start date End date investment km Italy (Terni) Corso del Popolo S.p.A not yet active OTHER Country Operator % of Total Stage Start date End date investment km Italy (Terni) Piscine dello Stadio S.r.l active Annual Report as at 31 December 2016
54 Directors report - Part II Lane operating segment The Group is active in the US through the subsidiary Lane Industries Incorporated. Macroeconomic scenario Salini Impregilo has strengthened its share of the US market considerably with its acquisition of Lane, the top highway contractor. In fact, the US is now the Group s key market, accounting for roughly one quarter of its revenue, after this acquisition. The US economy is expected to maintain the growth rates achieved in previous years in 2017 and to gain impetus in 2018, mainly thanks to the infrastructure programme and tax incentives promised by the Trump administration. The growth prospects for the US infrastructure market are very promising for the next few years, boosted by approval of the Fast Act (Fixing America s Surface Transportation Act) in December Experts believe that reconstruction of the country s infrastructure cannot be put off much longer. Large investments to modernise the current infrastructure and launch new projects have been referred to by President Trump, who has announced an ambitious investment programme to build roads, bridges, tunnels, airports, ports and railways of approximately USD1 trillion over ten years. The American Society of Civil Engineering has estimated infrastructure investment requirements for the US to be USD3.6 trillion by This market s potential development is an excellent opportunity to be grasped by the Group through its local subsidiary, Lane. The IMF has confirmed the US economy s favourable trend: 2018 GDP growth has been revised upwards in the most recent estimates of January 2017 to 2.5%, an improvement of 0.4% on the October 2016 forecasts. The following table shows the amounts involved in the main contracts in portfolio: Project Residual order backlog Percentage of (Share in millions of Euros) at 31 December 2016 completion Purple Line % I-4 Ultimate % Gerald Desmond bridge (Healy Project) % Dugway Storage Tunnel Cleveland (Healy Project) % Other 1,345.2 Total 2, Annual Report as at 31 December 2016
55 Directors report - Part II Lane - Purple Line - Maryland Purple Line Transit Partners, which includes Lane Construction, was selected as the best bidder for the design and construction of the Purple Line transit system worth USD2 billion in March The project includes the construction of 21 stations along a 16-mile alignment, mainly between New Carrollton and Bethesda, north of Washington DC. Lane Construction is involved in the construction work (but not the concession) with a 30% share. Lane - I-4 Ultimate - Orlando - Florida In September 2014, the I-4 Mobility Partners joint venture entered into a concession agreement with the Florida Department of Transportation (FDOT) to design, build, finance and operate the USD2.3 billion I-4 Ultimate project. Lane s share of the joint venture is 30%. The project includes the reconstruction of 21 miles of I-4 from west of Kirkman Road in Orange Country to east of SR 434 in Seminole County, including the addition of four lanes. Healy Project - Gerald Desmond Bridge - Long Beach - California The contract, awarded in 2012, consists of the construction of a cable-stayed bridge with the main span of 300 metres and two 150 m-high towers in the harbour of the city of Long Beach (CA). It is worth around USD790 million, of which 30% for the Group. Healy Project - Dugway Storage Tunnel - Cleveland - Ohio This USD153 million contract awarded in November 2014 involves the construction of a 4.5 km-long and 8 m-wide tunnel and six shafts. The Group s share is 100%. In addition, the Group won a number of contracts during the year, including the South Carolina Port Access Road as a joint venture with Flour Enterprises Inc, worth approximately USD220 million. Outlook for 2017 The acquisition of Lane represents another step by Salini Impregilo to expand in the US infrastructure market. The US construction sector has become a core market for the Group, contributing around 25% to its total revenue. With Lane, Salini Impregilo can compete and participate in a much larger pool of projects, especially in the highway, rail, environment and mobility sectors, including underground works using mechanised excavation machines. This is reflected in the order backlog worth 2.5 billion at year end and the new orders won in the first two months of 2017 for 54 Annual Report as at 31 December 2016
56 Directors report - Part II 850 million. Lane recently won a new design-build contract worth USD336 million to extend the 395 Express Lanes in Virginia. The project consists of an eight-mile extension of the 95 Express Lanes from Edsall Road in Fairfax County to Eads Street in Arlington County. The work will extend the 95 Express Lanes to the Washington, D.C., line and is expected to reduce congestion significantly along the I-395 corridor. Management accounts presentation of the figures for 2016 and 2015 ( Work Under Management ) For management purposes, the Group monitors the main figures of Lane Group, adjusting the IFRS balances, prepared for consolidation purposes, to consider the results of the joint ventures not controlled by Lane, which are consolidated using the proportionate method. These management account results (works under management) show the progress made on the contracts managed directly by Lane or through its non-controlling investments in the joint ventures. The following table shows the key figures for 2016 compared to the previous year: * Lane Joint ventures Total Lane Industries Joint ventures Total Industries not controlled WUM Group not controlled WUM ( 000) Group by Lane (unaudited) by Lane Revenue 1,303, ,721 1,544,199 1,270, ,149 1,467,801 Gross operating profit (EbITDA) 48,311 24,372 72,683 43,004 24,587 67,591 Operating profit (EbIT) 14,110 24,372 38,482 12,837 24,587 37,424 Profit from continuing operations 30,346-30,346 11,755-11,755 Profit for the year attributable to the owners of the parent 19,542-19,542 3,455-3,455 * The figures for 2015 for Lane are the consolidated figures prepared under IFRS. Abroad The Group is active in the construction and concessions sectors abroad. Macroeconomic scenario The global economy s recovery continued in 2016 albeit at a slower and weaker pace than expected. According to the latest IMF estimates, global growth is expected to be 3.1% for 2016, substantially in line with 2015, to rise to 3.4% and 3.6% in 2017 and 2018, respectively. These forecasts show slower growth for the advanced economies as a result of the Brexit vote. 55 Annual Report as at 31 December 2016
57 Directors report - Part II The economic growth rate of the main advanced economies was steady at 1.6% for 2016, down 0.5% on the previous year. The outlook is more positive, with growth expected to increase to above 2% in On the other hand, the emerging markets and developing countries are more dynamic with global growth prospects beyond 2017 for a gradual increase to 3.8% by the end of Despite this still quite volatile economic scenario, the general climate has benefited from positive factors, such as more stable oil prices, lower interest rates and higher raw materials prices. The developing countries will continue to be the main driver of global growth, although their growth pattern will be intermittent and slower than of the last 20 years. Construction The order backlog for the foreign construction segment is as follows: Area Residual order backlog Percentage (Share in millions of Euros) at 31 December 2016 of completion Africa 7, % Asia (excluding Lane) 5, % Americas (excluding Lane) 3, % Europe (excluding Italy) 1, % Oceania % Total 18, % The following chart provides a breakdown of the order backlog by area: Breakdown of the foreign construction order Oceania 4.6% EU (excluding Italy) 8.0% Americas (excluding Lane) 16.6% Africa 38.6% Asia (excluding Lane) 32.2% 56 Annual Report as at 31 December 2016
58 Directors report - Part II Australia Market The construction sector is a driving force of the Australian industry and contributes roughly 8% to the country s GDP. The Australian Bureau of Statistics estimates that the population will double by 2075 from the current 23 million residents to 46 million. As the demographic growth rate is one of the factors that positively affects development of the civil engineering and large-scale works sector, the individual state governments and the federal government have confirmed they will support the vigorous development of infrastructure with the dual aim of bolstering the economy, through a public spending plan to reply to the negative performance of the mining industry, and to adequately respond to the existing demand for more infrastructure. The Group has been active in Australia since 2013 and currently operates through Salini Impregilo Australia Branch, the wholly-owned Salini Australia Pty Ltd, Impregilo Salini Joint Venture and Salini Impregilo - NRW Joint Venture. In December 2013, Transport for New South Wales awarded Impregilo-Salini Joint Venture the contract, worth approximately AUD624 million at year end, for the Sydney Metro Northwest Project - Design and Construction of Surface and Viaduct Civil Works. The project is the first stage of the Sydney Metro Project, the largest public transport infrastructure project in Australia, which consists of the construction of the new metro line to serve north-east Sydney. Project Residual order backlog Percentage (Share in millions of Euros) at 31 December 2016 of completion Forrestfield Airport Link % NW Rail Link Project % Total Forrestfield Airport Link On 28 April 2016, the joint venture of Salini Impregilo (80%) and NRW Pty Ltd (20%) was awarded the contract to design, construct and maintain the Forrestfield Airport Link by the Public Transport Authority of Western Australia. The project includes construction of a new metro line to connect Forrestfield, and hence the airport, to the existing Perth network through an 8 km underground line. As well as the design and construction of the three new metro stations, the contract also includes 10 years of maintenance of the infrastructure. It is worth approximately AUD1.2 billion. 57 Annual Report as at 31 December 2016
59 Directors report - Part II Outlook for 2017 In November 2016, the Salini Impregilo - Fluor - Lane joint venture presented a bid for the design and construction of the Western Distributor Project worth around 3.6 billion (AUD5.5 billion) in Melbourne. This is one of the most ambitious road infrastructure works for the Victorian government and its objective is to reduce traffic congestion on the existing bridge (West Gate Bridge) and commuting times. It will also create 5,600 new jobs. The works are to be completed by On 11 August 2016, the Moving Melbourne Together consortium, which includes Salini Impregilo, CBP and Ghella, was short-listed for the Melbourne Metro contract. The Public Private Partnership (PPP) project worth AUD6 billion will be the largest ever in the state of Victoria and will create 4,700 jobs. The contract will include roughly 9 km of tunnels and five metro stations. The formal proposals will be presented at the start of 2017 while the tunnelling work will commence in The Group deems that the Australian market is fundamental for its growth, as shown by the above developments. Tajikistan Market This country s economy grew at a rate of 7.5% between 2011 and 2013 and the expected growth rate for 2017 is 4%. During the same period, the poverty and unemployment rates have improved. The project assigned to the Group is of fundamental importance to boost economic growth over the next few years with the delivery of electrical energy generated by the Rogun hydroelectric power plant. The following table shows the amounts involved in the contract at the reporting date: Project Residual order backlog Percentage (Share in millions of Euros) at 31 December 2016 of completion Rogun Hydropower Project 1, % Total 1,713.3 Rogun Hydropower Project On 1 July 2016, Salini Impregilo signed a framework agreement with the Tagikistani government worth approximately USD3.9 billion to build a hydroelectric power plant. The Group, with a 100% share, has also been assigned the first lot of roughly USD1.9 billion to build a 335 metre-high rockfill dam with a clay core, the tallest in the world, on the Vakhsh River in Pamir, one of Central Asia s main mountain ranges. The contract term is 11 years (plus two years warranty). The contract for Lot 2 will be executed by the Group s local branch. 58 Annual Report as at 31 December 2016
60 Directors report - Part II The power plant will have total installed capacity of 3,600 MW generated by six turbines of 600 MW each. Outlook for 2017 While it is still in an initial phase, the river deviation phase was completed in Completion of the project will take place in another three lots, included in the framework agreement signed with the customer. Saudi Arabia Market The Saudi market is stagnant due to the falling oil prices and the country s expected deficit. The local currency s depreciation against the US dollar planned at the start of 2016 no longer seems feasible. The following table shows the amounts involved in the main contracts in place at the reporting date: Project Residual order backlog Percentage (Share in millions of Euros) at 31 December 2016 of completion Riyadh Metro Line 3 1, % Other 78.9 Total 1,816.0 Riyadh Metro Line 3 On 29 July 2013, Salini Impregilo, as leader of an international consortium, won a portion of the maxi contract awarded by ArRiyadh Development Authority to design and construct the new Riyadh metro line (41.2 km), the longest line of the challenging project for the metro system of Saudi Arabia s capital. The lot assigned to ArRiyadh New Mobility Consortium is an important part of the larger construction contract for Riyadh s new metro system, worth approximately USD23.5 billion. The value of the works to be carried out by the consortium, i.e., the design and construction of the entire Line 3, is roughly USD6.0 billion, including approximately USD4.9 billion for the civil works, of which Salini Impregilo will carry out 66%. It sold 14% of its share to Salini Saudi Arabia Company L.t.d. (51% owned by Salini Impregilo) in Annual Report as at 31 December 2016
61 Directors report - Part II Outlook for 2017 The Group will continue to pursue any new business opportunities that arise in 2017 in this country. Qatar Market Given current oil prices, the country has held back development of new infrastructure projects and has only continued high priority projects (such as the Doha metro line) for the 2022 FIFA World Cup. The following table shows the amounts involved in the main contracts in place at the reporting date: Project Residual order backlog Percentage (Share in millions of Euros) at 31 December 2016 of completion Al bayt Stadium % Red Line North % Other Total 1,323.5 Al Bayt Stadium In July 2015, the Group was awarded the contract to build the Al Bayt stadium in Al Khor, roughly 50 km north of the capital Doha. The Group s share of the contract, which entails the design and construction of one of the sports complexes where the 2022 FIFA World Cup matches will take place, is worth approximately 770 million. The contract was awarded by the Aspire Zone Foundation, which is responsible for the development of Qatar s sports infrastructure. The stadium will be able to accommodate 70,000 spectators with an area of 200 thousand square metres. The profit is an example of an eco-sustainable work, thanks to modern construction techniques and the use of environmentally friendly and low energy impact state-ofthe-art materials. The Group s share of the contract is 40%. Red Line North Underground, Doha In 2013, Impregilo, as leader of a joint venture with a 41.25% share, won the tender called by Qatar Railways Company (Qrail) for the design and construction of the Red Line North Underground in Doha. The project, along with three other metro lines, is part of a programme promoted by Qatar to build a new infrastructure mobility system included in the National Development Plan for 2030 ( Qatar National Vision 2030 ), which provides for significant investments to ensure sustainable economic growth over time. The contract s value has decreased from the previous QAR8 billion (roughly 2 billion) to the current QAR5.6 billion (approximately 1.4 billion), due to the partial use of the contractually-provided for provisional sum. 60 Annual Report as at 31 December 2016
62 Directors report - Part II Outlook for 2017 The Group will continue to pursue any new business opportunities in arise in 2017 in this country. Ethiopia Market Ethiopia is the fastest growing economy in Africa in the last five years. Its development plans for the next few years include the installation of 17,000 MW power capacity and the GERD and Koysha projects. The latter was won in The following table shows the amounts involved in the main contracts in place at the reporting date: Project Residual order backlog Percentage (Share in millions of Euros) at 31 December 2016 of completion Koysha 2, % Gerd 1, % Gibe III % Total 3,641.8 Koysha Hydroelectric Project This project is on the Omo River, about 370 km south-west of the capital Addis Abeba. It was commissioned by Ethiopian Electric Power (EEP) and includes the construction of a dam with a 6,000 million cubic metre capacity reservoir, annual energy generation of 6,460 Gwh and total installed capacity of 2,200 MW. The project also includes the access roads, a new bridge over the river and a 400 KW transmission line from Koysha to Gibe III. The contract is worth approximately 2.5 billion and the Group s share is 100%. This important new project, together with GIBE III and GERD (the Grand Renaissance Dam) on the Blue Nile, will enable Ethiopia to become Africa s leader in terms of energy production. GERD The GERD project, located approximately 500 km north-west of the capital Addis Abeba, consists of the construction of a hydroelectric plant, Grand Ethiopian Renaissance Dam (GERD), and the largest dam in the African continent (1,800 metres long, 170 metres high). The project also includes the construction of two power stations on the banks of the Blue Nile, equipped with 16 turbines with installed capacity of 375 MW each. The contract is worth approximately 3.7 billion and the Group s share is 100%. Outlook for 2017 The Group will continue to pursue new business opportunities in 2017 in line with the country s continued growth. 61 Annual Report as at 31 December 2016
63 Directors report - Part II Peru Market The country is engaged in strengthening its democratic institutions to encourage private initiative in the economy. To this end, the current government has communicated its intention to stimulate investment in large infrastructural works to modernise Peru. In 2017, the government plans to call tenders for the Lima L3 Metro worth approximately 5,802 million as well as another two projects of a smaller amount for the ring road around Lima and the Longitudinal de la Sierra road. The following table shows the amounts involved in the main contracts in place at the reporting date: Project Residual order backlog Percentage (Share in millions of Euros) at 31 December 2016 of completion Lima Metro % Total Lima M2 - Peru On 28 March 2014, the consortium comprising Salini Impregilo Group and other international groups won the contract for the construction and operation of the extension to Lima s metro network under concession from P - Agencia de Promociòn de la Inversiòn Privada. The project includes the construction of the works and operation of the infrastructure over the 35-year concession. The Group s share of the construction work is 25.5% of the civil works. The five-year project includes the development of a 35 km-long underground line and 35 stations. The contract, updated by variations, is worth approximately USD3,042 million (original amount of USD3,004 million plus addenda of USD38 million). Outlook for 2017 The Group will continue to pursue any new business opportunities that arise in 2017 in this country. Denmark Market Denmark is experiencing a phase of moderate growth. The country s infrastructure development plan entails public and private investment. The Group operates through its subsidiary Copenhagen Metro Team I/S, a company incorporated under Danish law and involved in the construction of Copenhagen Cityringen, one of the world s most modern transport infrastructures. 62 Annual Report as at 31 December 2016
64 Directors report - Part II The following table shows the amounts involved in the contract in place at the reporting date: Project Residual order backlog Percentage (Share in millions of Euros) at 31 December 2016 of completion Cityringen % Total Copenhagen Cityringen The project consists of the design and construction of the new metro line in the centre of Copenhagen, which entails two tunnels of 16 km each, 17 stations and five monitoring shafts. The contract is worth approximately 2,147 million, including riders and price reviews. During the period, work went ahead according to schedule with continuation of the electromechanical works and architectural finishings. The Group s share of the project is 99.9%. During 2016 and 2015, the Group incurred costs for activities not originally provided for in the contract (more information is available in the section on the Main risk factors and uncertainties ). Outlook for 2017 The Group is involved in a major tender in the transport sector. It is currently finalising its bid for the southbound extension of the Copenhagen metro line. Poland Market Poland is a dynamic, fast-growing country with its GDP showing strong growth in recent years (+3.1% in 2016 and +3.0% in 2015). This market is very attractive to foreign companies given the large EU funding it receives, the low salaries, highly professional workforce and modest tax regime. Accordingly, Poland is one of the countries with the best development potential in the medium term. The following table shows the amounts involved in the contracts in place at the reporting date: Project Residual order backlog Percentage (Share in millions of Euros) at 31 December 2016 of completion A1F Tuszyn-Pyrzowice % Expressway S7 Krakow-Rabka Zdroj % Expressway S7 Checiny % Expressway S3 Nowa Sol % Expressway S8 Marki - Radzymin Lot % Total Annual Report as at 31 December 2016
65 Directors report - Part II A1 Motorway On 22 July 2015, the Group was awarded a contract worth approximately 130 million for the design and construction of a 20 km section of the A1 Motorway south of Warsaw near Katowice. The works are financed with EU and Polish state funds and have a term of 33 months. The Group s share is 100%. Expressway S7 - South of Krakow On 20 January 2016, the Group won a 114 million contract, signed on 31 March 2016, to build a section of Expressway S7 south of Krakow near the border with Slovakia. The project, which is EU and Polish state funded, will take 22 months. The Group s share is 100%. Outlook for 2017 Work on the main motorway projects underway continued in Production is slated to pick up speed in 2017 as the road projects have a term of between two and three years and the contracts have now reached their peak production time. The Group s outlook for this country is tied to its participation in 23 pre-qualification rounds for tenders worth approximately 3 billion for road works. At present, Salini Impregilo has qualified for 14 out of the 23 projects and has been invited to present bids for nine road tenders. It is also evaluating whether to participate in railway and hydraulic tenders in order to diversify its business, which is currently focused solely in the fast-growing road infrastructural sector. Other countries Argentina Riachuelo - Buenos Aires The project has significant environmental and social value as it will clean up the Riachuelo River basin. The initiative is the first part of a larger programme, financed by the World Bank, for sustainable development of the Matanza- Riachuelo catchment basin, aimed at the environmental restoration of the Riachuelo River and the areas it passes through, considered to be among the most polluted in the region. Following an addendum signed in the second half of 2016, the contract is now worth 414 million (Salini Impregilo s share is 75%) and the project was 21.4% complete at 31 December Argentina is expected to record growth at around 3% with inflation under 20% (currently around 40%) in The government has announced a big public works investment plan (17.7% of GDP). Given these premises, the Group has decided to set up a branch office in Buenos Aires to evaluate the many bids presented for calls to tender announced in late 2016 and to be continued in Slovakia D1 Motorway - Lietavská Lúčka - Višňové - Dubná Skala Section The D1 Motorway - Lietavská Lúčka Višňové Dubná Skala section project consists of the construction of roughly 13.4 km of the motorway, which includes a 64 Annual Report as at 31 December 2016
66 Directors report - Part II 7.5 km twin-tube tunnel, an intersection, a car park, nine bridges, a maintenance centre and sundry related works. The EU-funded contract is worth approximately 307 million (Salini Impregilo s share is 100%). According to European Union forecasts (Directorate-General for Economic and Financial Affairs), this country s GDP growth should continue in 2017 and The growth rate was above 3% in In addition, investments in the automotive sector and greater public spending (including for large-scale infrastructure projects) should boost the outlook for solid growth in 2017 and The Group will continue to pursue new business opportunities in 2017 in line with the country s continued growth. Concessions The Group s portfolio of foreign concessions comprises both investments in the operators, which are fully operational and, hence, provide services for a fee or at rates applied to the infrastructure s users, and operators that are still developing and constructing the related infrastructure and will only provide the related service in future years. The current concessions are held in Latin America (Argentina, Colombia and Peru), the UK and Turkey. They refer to the transport sector (motorways, metro systems and car parks), hospitals, renewable energy and water treatment sectors. The two Argentine operators are currently in liquidation and their contracts have been terminated. The following tables show the main figures of the foreign concessions at the reporting date, broken down by business segment: 65 Annual Report as at 31 December 2016
67 Directors report - Part II MOTORWAYS Country Operator % of Total Stage Start End date investment km date Argentina Iglys S.A holding Argentina Autopistas Del Sol active Argentina Puentes del Litoral S.A ,6 in liquidation 1998 Argentina Mercovia S.A active Colombia Yuma Concessionaria S.A.(Ruta del Sol) active METROS Country Operator % of Total Stage Start End date investment km date Peru Metro de Lima Linea 2 S.A not yet active ENERGY FROM RENEWABLE SOURCES Country Operator % of Installed Stage Start End date investment voltage date Argentina Yacylec S.A T line active Argentina Enecor S.A T line active INTEGRATED WATER CYCLE Country Operator % of Pop. Stage Start End date served date Argentina Aguas del G. buenos Aires S.A k in liquidation 2000 Peru Consorcio Agua Azul S.A k active HOSPITALS Country Operator % of No. of Stage Start End date investment beds date Gb Impregilo Wolverhampton Ltd k medical active visits Gb Ochre Solutions Ltd-Ospedale di Oxford active Gb Impregilo New Cross Ltd holding Turkey Gaziantep Hospital not yet active CAR PARKS Country Operator % of No. of Stage Start End date investment parks date Gb Impregilo Parking Glasgow Ltd active Annual Report as at 31 December 2016
68 Directors report - Part II Order backlog The order backlog shows the amount of the long-term construction contracts awarded to the Group, net of revenue recognised at the reporting date. The Group records the current and outstanding contract outcome in its order backlog. Projects are included when the Group receives official notification that it has been awarded the project by the customer, which may take place before the definitive binding signing of the related contract. The Group includes projects in its order backlog when it deems that the contract counterparties will comply with their obligations. Moreover, its contracts usually provide for the activation of specific procedures (usually arbitrations) to be followed in the case of either party s contractual default. The order backlog includes the amount of the projects, including when they are suspended or deferred, pursuant to the contractual conditions, even if their resumption date is unknown. The value of the order backlog decreases: when a contract is cancelled or decreased as agreed with the customer; in line with the recognition of contract revenue in profit or loss. The Group updates the order backlog to reflect amendments to contracts and agreements signed with clients. In the case of contracts that do not have a fixed consideration, the related order backlog reflects any contractual variations agreed with the customer or when the customer requests an extension of the execution times or amendments to the project that had not been provided for in the contract, as long as these variations are agreed with the customer and the related revenue is reasonably certain. The measurement method used for the order backlog is not a measurement parameter provided for by the IFRS and is not calculated using financial information prepared in accordance with such standards. Therefore, the calculation method used by the Group may differ from that used by other sector operators. Accordingly, it cannot be considered as an alternative indicator to the revenue calculated under the IFRS or other IFRS measurements. Moreover, although the Group s accounting systems update the related data on a consolidated basis once a month, the order backlog does not necessarily reflect the Group s future results, as the order backlog data may be subject to significant variations. 67 Annual Report as at 31 December 2016

69 Risk management system
70 Directors report - Part II The context in which the Group currently operates, characterised by rapid macroeconomic changes, financial markets instability and progressive developments of legal and regulatory compliance regulations, requires clear strategies and effective management processes aimed at preserving and maximising value. To strengthen the internal controls and risk management system, the Group has a risk management framework, which it keeps up-to-date, extended to all group operating companies to identify, assess, manage and monitor risks in accordance with industry best practices. Development, implementation and circulation of the risk management framework is designed to assist senior management with strategic and commercial planning and operations through the comprehensive, in-depth analysis of relevant factors for the business and the local contexts in which the Group operates, facilitating the identification and monitoring of related risks. During 2016, activities focused on the development and introduction of tools to efficiently manage some material risks, such as country risk and counterparty risk, by concentrating on the clients, partners and sub-contractors. The Group also concurrently developed a method to chart and periodically monitor its risk exposure and ensure its risk profile s consistency with the defined strategic objectives (through risk planning and assessment). These instruments employed in the Group s core processes assist management to direct its activities through tailored analyses and by questioning its decisions to strengthen informed decision-making. Thanks to its activities and development of the existing framework, the department was able to define the Group s current risk profile and identify management strategies to deal with the more material risks, which can be developed and introduced through specific measures. Business risks External risks that may compromise the Group s achievement of its objectives, i.e., all events whose occurrence is not influenced by corporate decisions. This category includes all risks arising from a country s macroeconomic and socio-political dynamics, sector trends and competitive scenario, as well as from industry specific technological innovation and regulatory developments. Because of the nature of such risks, the Group must rely on its forecasting and managing abilities. Specifically, Salini Impregilo integrated risk vision in its strategic and business planning processes through the definition of commercial and risk guidelines and the development of a process for the prioritisation and selection of initiatives to be pursued, also and most of all based on the assessment of relevant risks linked to the country and/or sector in which operations are planned, rather than to the counterparty. Risk control is also 69 Annual Report as at 31 December 2016
71 Directors report - Part II ensured by monitoring the progress of strategic objectives also in terms of composition and diversification of the portfolio and its development over time in terms of risk profile. Strategic risks These risks arise from strategic, business and organisational risks that may adversely impact the Group s performance and ultimately result in the nonachievement of strategic objectives. They include risks resulting from the choice of business or organisational models through which the Group intends to operate, those arising from M&A transactions, or the ineffective management of the order portfolio or the relationships with key counterparties (clients, partners, suppliers, sub-contractors, etc.). Salini Impregilo considers risk as a key element for the preliminary assessment of decisions and strategic choices, so much so that it has envisaged integrating the strategy definition and development process with that for the identification, measurement and management of risks. The choices pertaining to the adoption of a business or organisational model, the assessment about the opportunity of proceeding with an extraordinary transaction or establishing a partnership are subject to preliminary analysis and evaluation of the related risks and opportunities, with the concurrent identification of risk management methods and strategies to be promptly activated should such risks arise. Financial risks All risks linked to the availability of group resources, depending on the management of receivables and cash and cash equivalents and/or the volatility of market variables such as interest and exchange rates. Specifically, liquidity management has the objective of ensuring the financial autonomy of contracts in progress, taking into account the structure of consortia and special purpose entities, which can tie the availability of financial resources to the execution of the relevant projects. Moreover, liquidity management takes into account restrictions to currency transfers imposed by the legislation of some countries. Salini Impregilo also considers specific risk areas such as the counterparty s credit rating and raw materials price volatility, equipping itself with effective financial planning tools. Legal and compliance risk This risk class includes risks for the management of legal issues and/or risks related to compliance with laws and regulations (e.g. taxation, local legislation, etc.) required in order to operate in the sector and/or specific countries. Salini 70 Annual Report as at 31 December 2016
72 Directors report - Part II Impregilo deems that monitoring contractual issues linked to contract management and, particularly, the relationship with relevant counterparties, is fundamental. This also includes any internal and external fraud risks, and, more generally, the compliance with procedures and policies established by the Group to govern its operations. With respect to the aforementioned factors, Salini Impregilo implements a regulatory risk monitoring and management policy in order to minimise the impact of such risk, through a multi-level control system that entails collaborative and ongoing liaison with relevant counterparties and business units affected by regulatory developments and the comprehensive assessment of any potential impacts. Operational risks These are risks that could jeopardize value creation and are due to an inefficient and/or ineffective management of the Group s core business, particularly those linked to bid management and actual execution of contracts. The various risk areas that fall into this class include bid design and planning, effective supply chain, logistics and inventory management, as well as those linked to the management of IT systems, personnel and planning and reporting. These risks arise during the performance of contracts, should Group policies and procedures not be adequate for the management of risk factors linked to the level of complexity of the project or unforeseeable events. To this end, the Group intends to monitor such risks starting at the bidding stage of each contract with a risk/benefit analysis of the project in the event of its award and its impact on the portfolio structure, both in terms of risk concentration and overall risk profile. At this time, Salini Impregilo, as part of a wider process, prepares a pre-bid risk assessment aimed at identifying potential risks and impacts linked to the project, as well as the necessary mitigation and/or contingency measures to counter them. The risk surveillance activity is then performed again at tender stage and monitored and updated during contract execution in order to promptly detect the risk exposure development and promptly implement adequate remediation measures. *** As part of the aforementioned framework for the identification and classification of risks applicable to Group operations, Salini Impregilo has adopted a crossfunctional approach for the analysis of risk dimensions that are considered more relevant due to the specific features of its business. These dimensions include various risk areas identified and belonging to different risk classes. Country risk The Group pursues its objectives by operating almost everywhere in the world, 71 Annual Report as at 31 December 2016
73 Directors report - Part II leveraging business opportunities in different countries and hence exposing itself to the risks resulting from the characteristics and conditions dictated by them, such as the political, economic and social scenario, local regulations, taxation and operational complexity and, last but not least, safety conditions. Being aware of and constantly monitoring country risk through specific indicators enables the Group first and foremost to define informed commercial strategies, as well as to gain an optimal understanding of the operating scenario and, therefore, adopt precautions and/or implement actions aimed at removing barriers and mitigate potential threats. Counterparty risk The counterparty dimension identifies potential criticalities linked to relationships with the Group s clients, shareholders, subcontractors and suppliers, so as to create a comprehensive overview of the features of the partners with which Salini Impregilo may start or continue to collaborate. For each of the above counterparty types, risk factors linked to financial and operational reliability apply to a different extent, as does the potential strategic role of a partnership for a specific business initiative, as well as all aspects linked to legal and other compliance that safeguard the lawfulness of the relationship. The Group performs a counterparty analysis for each new analysis, involving all the competent departments and the Group Risk Officer, allowing a more precise identification of the critical issues that could arise during the contract s operational stages and more accurate planning of the possible mitigation actions. Contract risk The contract dimension is key for an effective analysis of all risks linked to the Group s core business, since it is considered to define tools capable of identifying and monitoring so-called contract risks starting from the bidding stage in a risk prevention perspective, as part of an in-depth analysis of the risks and opportunities linked to the pursuit of a specific activity. Another fundamental aspect is the ongoing tracking of risks once they have been consciously taken on by management, managing the resulting risk exposure in a proactive, dynamic way, as well as its ongoing development over time. *** The analysis of key risk dimensions and the relevant risk areas has the aim of providing management with a two-sided overview: a detailed one (i.e. at individual country, counterparty, contract level) and a portfolio one (for assessment of the overall exposure to such dimension), in order to assess the Group s risk profile as well as its compliance with the exposure limits imposed by its risk management capacity. Moreover, the portfolio overview enables the performance of systematic assessments about the potential development of the 72 Annual Report as at 31 December 2016
74 Directors report - Part II risk profile upon occurrence of certain events and/or specific choices that may result in any changes to it, through the use of dedicated risk management tools. The risk management framework, as outlined above and subject to further and future developments, has been designed to support decision-making and operational processes at every stage of the management of projects, in order to reduce the possibility that certain events may compromise the Group s normal business operations or its strategic objectives: to this end, it is integrated in strategic and business planning processes, which, therefore, cannot be separated from the Group s risk profile, as well as from its choices in terms of risk appetite. 73 Annual Report as at 31 December 2016

75 Main risk factors and uncertainties
76 Directors report - Part II Main risk factors and uncertainties Litigation In addition to the areas outlined in the Business risk management section above, the following specific situations linked to major outstanding claims and country risk exposure at 31 December 2016, characterised by risk and/or uncertainty profiles, should be added to the universe of risk events that may potentially impact on operations. USW Campania projects The Group became involved in the urban solid waste disposal projects in the Province of Naples and other provinces in Campania at the end of the 1990 s through its subsidiaries Fibe and Fibe Campania (the companies ). The main phases of the USW Campania projects were as follows: (i) the Contractual phase which started in the period with the signing by the two SPEs Fibe and Fibe Campania of the service contracts for the disposal of urban solid waste in the provinces of Campania and ended on 15 December 2005 with the ope legis termination of these contracts pursuant to Decree law no. 245/2005 (converted into Law no. 21 of 27 January 2006); (ii) the Transitional phase which started upon conclusion of the Contractual phase and lasted until the enactment of Decree law no. 90 of 23 May 2008 and Decree law no. 107 of 17 June 2008, both converted into Law no. 123 of July 14, The latter measure officially marked, among other things, the Group s exit from the waste disposal business, by transferring title to the RDF and storage facilities to the provincial administrations; (iii) the Current phase launched at the end of the Transition phase, which is still underway. The major issues that have characterised the Group s activities in service contracts since , which have been discussed in detail and reviewed in all of the reports published by the Group starting from that time, have evolved and became more complex over the years, giving rise to a large range of disputes, some of which are major and in part still ongoing. Even given the positive developments, the general situation in terms of pending disputes is still very complex. A brief overview is provided below, especially in relation to existing risk positions. Since Fibe Campania S.p.A. was merged into Fibe S.p.A. in 2009, unless otherwise stated, reference is made exclusively to Fibe S.p.A. in the rest of this section, even with regard to positions and events that affected the merged company. Administrative litigation Recovery of the amounts owed to Fibe by local administrations for waste disposal fees up to the contracts termination date The special commissioner tasked by the Regional Administrative Court to collect 75 Annual Report as at 31 December 2016
77 Directors report - Part II receivables of former operators of the waste disposal service performed until 15 December 2005 submitted their report in November 2014, in which they stated that, despite an outstanding amount payable to FIBE as a fee for its service rendered until 15 December 2005, the administration had already collected directly 46,363,800, without forwarding it to FIBE, and that total outstanding receivables totalled 74,317,550. The administration, apart from raising some objections, which were rejected by the Regional Administrative Court and related to calculation criteria and the offsetting of receivables (which, incidentally, were the subject of other rulings), lodged a motion, requesting that the appeal should be rejected on the grounds of expiry of the regulation - starting from 31 December allowing performance of the activities that should have been carried out by the special commissioner. On 13 February 2015, the Regional Administrative Court and, subsequently, on 1 September 2015, the Council of State, rejected the appeal confirming that the administration and, on its behalf, the commissioner appointed to replace it were still responsible for collecting receivables due to Fibe. Following the resignation of the special commissioner and the subsequent appointment of the General Commander of the Italian Financial Police by the Regional Administrative Court as their replacement and as a result of the anticipated incompatibility raised by the latter, on 13 July 2015, the Regional Administrative Court appointed the Ministry of Economy and Finance s (MEF) Chief of Staff, who, on 10 September 2015, appointed a manager of the aforementioned MEF as attorney. With notice of 16 November 2015, the new commissioner asked the Regional Administrative Court whether the duties assigned entailed, apart from collection, also the payment to Fibe of the amounts already collected by the administration. The Regional Administrative Court held in its ruling no. 7323/2016 that the commissioner s activities would satisfy Fibe s requests only after their work was completed and, hence, excluding the possibility that amounts collected from the administration could be paid to it. FIBE has challenged this ruling with the Council of State. Request that Fibe take back ownership of certain areas and storage sites by the parties appointed by the government commissioner to handle technical and operating activities Starting in 2008, Fibe had to deal with a number of repeated events where the parties appointed by the government commissioner to handle technical and operating activities demanded that Fibe take back ownership of certain areas and storage sites already handed over to the appointed parties in August 2008, since they were deemed not to be suitable for the management of the service. The Lazio Regional Administrative Court and the Council of State, following appeal of the relevant provisions by Fibe, confirmed the suitability of the aforementioned sites for the integrated waste cycle. The civil proceedings before the Naples Court initiated by S.A.P.NA. S.p.A., a local company set up by the Naples provincial authorities, are part of this situation. S.A.P.NA. S.p.A. challenged its takeover of title to certain temporary and definitive areas and 76 Annual Report as at 31 December 2016
78 Directors report - Part II storage sites in roughly 40 proceedings. It also requested to be indemnified and held harmless by Fibe S.p.A. and/or the government commissioner from the operating costs incurred in the meantime and yet to be incurred, including possible site reclamation. Following the rulings of the Ordinary Court of Naples, which found that jurisdiction rested with the Administrative Court, the majority of the aforementioned dispute was resumed by S.A.P. NA. S.p.A. before the Campania Regional Administrative Court. With the rulings filed for the first appeals discussed, the Campania Regional Administrative Court fully rejected all claims brought by S.A.P. NA. S.p.A.. In addition, S.A.P. NA filed notices of discontinuance for lack of interest and, hence, the related appeals were precluded from prosecution. Administrative procedures for the recording and recognition of the costs for activities carried out and the work ordered by the Administration during the transitional management period As early as 2009, Fibe filed a complaint with the Lazio Regional Administrative Court about the administrative procedures for the recording and recognition of the costs incurred by the former service contractors for activities carried out pursuant to law and the work ordered by the administration and performed by the companies during the transitional management period. As part of the aforementioned ruling, the Regional Administrative Court appointed an inspector who, on 31 March 2014, submitted a final report that compared the amounts stated by FIBE in its appeal and the supporting documentation, finding the figures to be substantially consistent. Allowing the inspection request submitted by Fibe, the Regional Administrative Court ordered an extension to the inspection performed, asking for the identification of the existence and extent of the amounts requested and documented by the applicants upon reporting, whose investigation was omitted or not fulfilled by the administration. To this end, it set 26 May 2017 as the deadline for filing the report and 6 December 2017 as the date of the hearing for the oral discussions. Delivery of waste to the Acerra waste-to-energy plant With their appeal notified on 18 May 2009 (RG no. 4189/09), the companies challenged the Prime Minister s Order no. 3748/09 before the Lazio Regional Administrative Court whereby it illegally stated that only waste produced and stored after the date of termination of the service contracts with the companies (15 December 2005) was to be transferred to the Acerra waste-to-energy plant. The appeal was ruled to be inadmissible due to lack of interest as the regulations in the challenged Prime Minister s Order did not have a detrimental effect on Fibe. Payment of the RDF plants With ruling no of 5 May 2011, the Lazio Regional Administrative Court upheld Fibe s appeal and ordered the administration to pay the undepreciated costs at the termination date for the RDF plants to Fibe, for a total amount of Annual Report as at 31 December 2016
79 Directors report - Part II million, plus legal and default interest from 15 December 2005 until settlement. Following the enforcement order filed by Fibe and opposed by the Office of the Prime Minister, Fibe obtained the allocation of 241 million as a final payment for the receivables for principal and legal interest and suspended the enforcement procedure for the further amount of default interest claimed. Both parties initiated proceedings about the merits of the case. Following the adjournment of proceedings with the order of 17 July 2015, the dispute was discussed during the hearing of 21 October The judge rejected the request for default interest submitted by Fibe in the ruling of 12 February 2016, which Fibe challenged. The related hearing for clarification of the conclusions was set for 8 February Again with respect to the costs not depreciated at 15 December 2005 for the Campania RDF plants, legal actions were taken to obtain reimbursement of the VAT paid on the principal amount collected of 205 million ordered to be paid by the judge. On 30 December 2016, Fibe signed an agreement which provided that the VAT would be paid against waiver of the interest and dismissal of the proceedings. The VAT was collected on 16 February Environmental disputes The civil litigation During the various stages of the USW Campania projects, the Group had to deal with a large number of administrative measures regarding reclamation and the implementation of safety measures at some of the landfills, storage areas and RDF plants. The unsuccessfully resolved proceedings are on hold pending the merit hearings. For the proceedings regarding the characterisation and emergency safety measures at the Pontericcio site, the RDF plant in Giugliano and the temporary storage area at Cava Giuliani, the Lazio Regional Administrative Court rejected the appeals filed by Fibe with ruling no of An appeal against this ruling, based also on contamination found at a site different to those subject of the proceedings, was filed with the Council of State. It denied Fibe s precautionary motion to stay the enforcement of the decision. A date for the merits hearing has not been set yet. With respect to the Cava Giuliani landfill, the Lazio Regional Administrative Court, with ruling no. 5831/2012, found that it lacked jurisdiction in favour of the Superior Court of Public Waters, before which the appeal was summed up. Meanwhile, Fibe is continuing with the characterisation operations for the above sites, but this does not constitute any admission of liability whatsoever. In May 2005, the government commissioner filed a motion requesting compensation from Fibe, Fibe Campania and Fisia Italimpianti for alleged damage of about 43 million. During the hearing, the commissioner increased its claims to over 700 million, further to the additional claim for damage to its reputation, calculated to be 1 billion. The companies appeared before the court and, in addition to disputing the claims made by the government commissioner, filed a counterclaim requesting compensation for damage and sundry expenses for over 650 million, plus a further claim for reputation damage quantified at 1.5 billion. In the same proceeding, the banks that issued Fibe and Fibe Campania s performance bonds 78 Annual Report as at 31 December 2016
80 Directors report - Part II to the government commissioner also requested the commissioner s claim be dismissed and, in any case, to be held harmless by Salini Impregilo (at the time, Impregilo), which appeared before the court and disputed the bank s requests. The public prosecutor appealed against the ruling of 11 April 2011, which found that jurisdiction rested with the administrative court and not with the ordinary court. On 1 August 2012, the Ministry of Justice and the Cassa delle Ammende summarised the ruling for enforcement of the sureties for 13 million before the Milan Court. These sureties had been given by major banks to guarantee execution of the measures imposed by the Naples public prosecutor as part of the seizure of the RDF plants. With decision no. 6907/14, the Milan Court denied the requests made by Cassa Ammende and by the Ministry of Justice against the banks, UniCredit and ABC International Bank PLC, accordingly declaring the claims for recourse filed by the banks against Impregilo and Fibe and the latter against the Office of the Prime Minister absorbed. The Ministry of Justice and the Cassa Ammende appealed against this decision before the Milan Appeal Court and the related proceedings were postponed to 13 December 2016 for clarification of the conclusions when the judgement was adjourned for further consideration. On 30 November 2015, the Office of the Prime Minister received a new claim form served by both Fibe and other group companies involved in various ways in the activities performed in Campania for the waste disposal service, containing claims for the damage suffered as a result of termination of the agreements in The total amount claimed is 2,429 million. Considering that some requests are already included in other proceedings, the net amount is 2,258 million. The Office of the Prime Minister filed a counterclaim for 845 million for reasons already included in other proceedings. The court appointed an expert for an appraisal. Finally, the public administration has recently commenced proceedings challenging Fibe s operations with respect to the complex situation of receivables and payables arising from the contractual phase. Although these are separate from the other proceedings described above, they refer to the same claims filed by Fibe in the administrative courts that the special commissioner is still working on. Accordingly and comforted by the advice of the legal advisors which support it in this complicated situation, the Group believes that Fibe s fully compliant conduct during the contractual period can reasonably be confirmed and that the risk of a negative outcome of these proceedings is a mere possibility. Specifically, the Group s legal advisors believes that the public administration s claims can reasonably be countered considering the counterclaims and, 79 Annual Report as at 31 December 2016
81 Directors report - Part II moreover, the admissibility in these proceedings of a court-ordered offsetting process. Lastly, pending proceedings include a lawsuit in opposition to a payment order obtained by FS Logistica (formerly Ecolog) against the Office of the Prime Minister for the payment of consideration owed for assignments it received from 2001 to 2008 by the then government commissioner for shipment of waste outside Italy. The claim made through a summary procedure was brought against the Office of the Prime Minister, which, in turn, summoned Fibe as a guarantee, that, in turn, filed a counterclaim for the payment of the greater expenses incurred during the concession. The judge allowed a court-ordered technical expert s report only with regard to the claims of FS Logistica from the Office of the Prime Minister and covered by the order, adjourning the hearing to 31 March The parties then filed a settlement agreement and requested an extension to complete the procedure. The hearing has been deferred to acknowledge the settlement agreement and define the relationship between FS Logistica and the Office of the Prime Minister, while actions to hear the claims of FIBE and the Office of the Prime Minister will be continued. Tax litigation Fibe s dispute about the local property tax (ICI) on the Acerra waste-to-energy plant is worthy of note. In January 2013, the subsidiary received tax assessment notices from the Acerra municipality with respect to the waste-to-energy plant, requesting payment of local property tax and relevant penalties for approximately 14.3 million for the years The amount requested by the Municipality and challenged by Fibe was confirmed as far as its applicability but reduced in terms of its amount and penalties by the Naples Regional Tax Commission. Although it believes that it will be able to reverse the ruling through an appeal to the Supreme Court, in 2015, the subsidiary - comforted by its legal advisors - set aside a provision for an amount equal to just the tax plus any accrued interest as a precautionary measure. Criminal litigation In September 2006, the public prosecutor at the Naples Court served Impregilo S.p.A. (now Salini Impregilo), Impregilo International Infrastructures N.V., Fibe S.p.A., Fibe Campania S.p.A., Fisia Italimpiant S.p.A. (now Fisia Ambiente S.p.A.) and Gestione Napoli S.p.A. in liquidation with a Notice of the conclusion of the preliminary investigations about the administrative liability of companies related to the alleged administrative crime pursuant to article 24 of Legislative decree no. 231/2001, as part of criminal proceedings against some former directors and employees of the above-mentioned companies, who were being investigated for the crimes covered by article 640.1/2.1, of the Criminal Code in connection with the contracts for management of the urban solid waste disposal cycle in Campania. Following the preliminary hearing of 29 February 2008, the Preliminary Investigations Judge at the Naples Court allowed the motions for indictment 80 Annual Report as at 31 December 2016
82 Directors report - Part II presented by the public prosecutor, rejecting all the civil parties claims against the companies finding them to be unacceptable. As part of these proceedings, in its ruling of 26 June 2007, the Preliminary Investigations Judge ordered the precautionary seizure of the profit from the alleged crime, estimated to approximate 750 million. The precautionary proceedings continued for nearly five years and finally ended in May 2012, without any action taken against the Group. On 4 November 2013, the Naples Court handed down a decision finding all defendants not guilty on all charges. In March 2014, the public prosecutor of Naples challenged the decision and the next hearing will take place on 17 May *** In 2008, as part of a new investigation into waste disposal in the Campania region carried out after the ope legis termination of the contracts (on 15 December 2005), the Preliminary Investigations Judge, upon a request by the public prosecutor, issued personal preventive seizure measures against some managers and employees of Fibe, Fibe Campania and Fisia Ambiente and managers of the commissioner s office. As part of this investigation, which in the record is described both as a continuation of an earlier investigation and as separate proceedings based on new charges, the former service providers and Fisia Ambiente are again charged with the administrative liability attributable to companies pursuant to Legislative decree no. 231/01. In the hearing of 21 March 2013, the Preliminary Hearing Judge ordered that all the defendants and legal entities involved pursuant to Legislative decree no. 231/2001 be committed for trial for all charges, transferring the proceedings to the Rome Court as a result of an acting judge being listed by the Naples public prosecutor as being under investigation. At the hearing of 1 April 2014, the Rome Court acquired the ruling delivered by the Fifth Criminal Chamber of the Naples Court in the aforementioned parent proceedings (RGNR 15940/03). On 16 June 2016, the Court accepted the public prosecutor s request and found all the individuals involved in the proceedings not guilty. The hearing will continue for the companies involved pursuant to Legislative decree no. 231/2001. During the hearing of 29 November 2016, witnesses were heard and the calendar scheduled for the subsequent hearings to take place in early On 23 December 2011, as the party involved pursuant to Legislative decree no. 231/01, Fibe was notified of the completion of the preliminary investigations related to another investigation by the Naples public prosecutor. The allegation relates to the charging of article 24 of Legislative decree no. 231/01 relating to the committing of the crime covered and punished by article 81 and articles 110 and 640.I/II of the Criminal Code committed jointly and with the prior agreement of the defendants (individuals) and other parties to be identified with respect to 81 Annual Report as at 31 December 2016
83 Directors report - Part II management of the urban waste water purification service using purification systems. Fibe is accused as it has allegedly presented documents reporting among the other items related to the elimination of USW the cost of transferring leachate, while not mentioning why the leachate had been transferred to plants that did not have the necessary legal authorisation, technical qualifications and residual purification capacity. The public prosecutor filed a motion requesting that the Preliminary Investigations Judge of the Naples Court hear the case filed and the latter, upholding the objection presented by the defence of the public bodies, ruled that it lacked jurisdiction and ordered that the record of the proceedings be forwarded to the Rome public prosecutor. On 13 April 2015, the Rome public prosecutor requested the closure of proceedings for all defendants (both individuals and companies) and all claims. On 17 January 2017, the Preliminary Investigations Judge ordered the closure for all the individuals while the claims about the administrative offences allegedly committed by the companies were transferred to the public prosecutor so that they can send them to the general attorney for filing. As it relates to events challenged in the period after the contracts were terminated, when the companies activities were not solely specifically covered by Law no. 21/2006 but also carried out on behalf of the commissioner, the group companies involved are fully convinced that they acted in accordance with the law. The directors considerations about the USW Campania projects at 31 December 2016 The general situation of the Salini Impregilo Group with respect to the USW Campania projects at 31 December 2016 still continues to be extremely complex and uncertain (as can be seen from the complexity of the above information). The decisions of the administrative courts regarding the claims made for the costs of the RDF plants that had not been depreciated when the service contracts were terminated (15 December 2005) and the decisions recently handed down for proceedings initiated by S.A.P. NA. S.p.A., as discussed earlier in this report, are positive and extremely important factors because they support the Group s arguments regarding the correctness of its conduct and the resulting assessments made to date. Taking also into account the rulings handed down by the administrative judges regarding the aforementioned environmental issues (which are still pending with regard to merit) and for which the directors, with the support of the legal advisors assisting Fibe in the various disputes, deem the risk of an unfavourable outcome to be in the realm of mere possibility, at this time, an 82 Annual Report as at 31 December 2016
84 Directors report - Part II accurate timeframe for the end of the various pending proceedings cannot be reasonably determined. Given the complexity and range of the different disputes disclosed in the previous sections, the Group cannot exclude that events may arise in the future that cannot currently be foreseen which might require changes to these assessments. Panama Canal extension project With regard to this project, certain critical issues arose during the first stage of full-scale production which, due to their specific characteristics and the materiality of the work to which they relate, made it necessary to significantly negatively revise the estimates on which the early phases of the project had been based. The most critical issues related, inter alia, to the geological characteristics of the excavation areas, specifically with respect to the raw materials required to produce concrete and the processing of such raw materials during normal production activities. Additional problems arose due to the adoption by the customer of operational and management procedures substantially different from those contractually agreed, specifically with regard to the processes for the approval of technical and design solutions suggested by the contractor. These facts, which were the subject of specific disclosures in previous reports published by the Group, continued in 2013 and Faced with the customer s persistent unwillingness to reasonably implement appropriate, contractually provided for measures to manage such disputes, the contractor - and thus the original contractor partners - was forced to acknowledge the resulting impossibility to continue the construction activities needed to complete the project at its full and exclusive risk by undertaking the relevant full financial burden without any guarantee of the commencement of objective negotiations with the counterparty. In this context, at the end of 2013, formal notice was sent to the customer to inform it of the intention to immediately suspend work if the customer refused once again to address this dispute in accordance with a contractual approach based on good faith and the willingness of all parties to reach a reasonable agreement. Negotiations between the parties, supported by the respective consultants and legal/contract experts, were carried out through February 2014 and, on 13 March 2014, an agreement was signed. The essential elements of the agreement provided that the contractor would resume works and functionally complete them by 31 December 2015, while the customer and contracting companies agreed to provide financial support for the works to be finished up to a maximum of about USD1.4 billion. The customer met its obligation by granting a moratorium on the refunding of already disbursed contractual advances totalling about USD800 million and disbursing additional advances amounting to USD100 million. The group of contractor companies met their obligation by directly disbursing USD100 million and additional financial resources, through the conversion into cash of existing contractual guarantees totalling USD400 million. The reimbursement of the amounts granted to finance the work to be performed was postponed, so as to make it compatible with the expected outcome of the 83 Annual Report as at 31 December 2016
85 Directors report - Part II arbitration proceedings, already commenced to establish the responsibilities of the parties for the extra costs already incurred and to be incurred due to the aforementioned situation. At the end of 2014, the DAB (Dispute Adjudication Board), established by the parties pursuant to the contract, granted GUPC an extension of time of 176 days and an amount of USD244 million for the extra costs, as per the claims presented as Referral 11, of which USD233 million was paid in early 2015 and a further USD10 million in the last quarter of that year. In December 2015 and January 2016, the DAB accepted the claims made by GUPC on three separate occasions (Referrals 13B, 13C and 13D) of USD6.2 million, USD24.7 million and USD11.2 million. In addition, on 20 June 2016, the DAB approved another USD2.7 million with the decision about the claim presented as Referral 14D. On 20 July 2016, the DAB issued two decisions in GUPC s favour: (i) that related to Referral 14B for the Testing and Laboratory Services subcontract in which it agreed with the contractor and awarded the GUPC another USD6.4 million; (ii) that referred to Referral 14C Dewatering of Excavations, where it found the GUPC s claim to be grounded and that it had the right to receive USD0.2 million. The DAB rejected the GUPC s claim about the unforeseen faults and fissures in its decision of 26 July 2016 about Referral 13A by majority vote. This claim was based on similar assumptions to those of Referral 11 and the DAB s decision (passed by majority vote) is thus contradictory to that announced for Referral 11, as shown also by the dissenting opinion of one of its three members. The GUPC expressed its dissatisfaction with this decision and will present its claim shortly for arbitration. Finally, with respect to Referral 14A about the physical and geological conditions of the area around the sides of the reservoir and some storage areas, the DAB s decision of 26 January 2017 (passed by majority vote) (i) rejected most of the claim made by the GUPC based on similar assumptions to those of Referrals 11 and 13A and (ii) found that GUPC was entitled to a fee of roughly USD4 million compared to the requested amount of USD114 million. One of the DAB members presented a dissenting opinion and the GUPC intends to file its dissatisfaction shortly and commence the related arbitration proceedings. There are also a number of separate arbitration hearings ongoing before the International Chamber of Commerce between GUPC (with its European partners Sacyr, Salini Impregilo and Jan De Nul) and the Panama Canal Authority. The first relates to the Cofferdam dispute and is at an advanced stage: the merit hearings will be held in Miami in July 2016 to be followed by the concluding briefs and the award. The second hearing covers DAB s decisions about the claims about the inadequate quality of the basalt compared to the quality guaranteed by ACP and the lengthy delays caused by ACP to approve the design formula for the concrete mix. This proceeding is still at an initial stage. 84 Annual Report as at 31 December 2016
86 Directors report - Part II The third hearing relates to the extra costs incurred by the GUPC due to certain unjustified conditions imposed by ACP for the design of the lock gates and other claims about labour costs. The fourth hearing involves sundry claims mentioned in the completion certification. Both of these hearings, commenced on 8 December 2016, are still at an initial stage (only the original process has been filed). The arbitration tribunals have not yet been constituted and no information is available at present about the hearing dates. There is also a dispute about the contractual advances due to ACP for which a fifth arbitration hearing has just commenced. Already in previous years, the Group applied a valuation approach to the project on the basis of which significant losses to complete the contract were recognised, offset in part by the corresponding recognition of the additional consideration claimed from the customer and determined based on the expectation that recognition of such consideration could be deemed to be reasonably certain based on the opinions expressed by its legal counsel and in light of the damages awarded by the DAB. In 2016, the estimate for the additional costs to complete the project was updated, as well as the additional consideration claimed from the customer (again with the support of the company s technical and legal experts). The Group cannot exclude that currently unforeseeable events may arise in the future which could require changes to the assessments made to date. The work to extend the Panama Canal has been substantially completed to the customer s satisfaction and ACP has issued the Taking Over Certificate. The Canal was re-opened on 26 June Copenaghen Cityringen As a result of significant critical issues about this project, the Group has had to revise the cost estimates for the early stages of this project, leading to a large increase. They mainly related to the construction of the concrete works. Following negotiations with the customer and assisted by their consultants and technical/legal advisors, the parties signed an interim agreement on 30 December 2016, paving the way towards finalisation of the claim settlement agreement and enabling the Group to collect 145 million on the same date. It also provided that the contractually-agreed arbitration procedure will take place to settle some contractual items and end the dispute. The Group has recognised all the significant costs to complete the contract, partly offset by the additional consideration claimed from the customer, to be decided upon by the arbitration tribunal, calculated on the basis that the Group is reasonably certain its claims will be upheld, based on the opinions of its technical and legal advisors. 85 Annual Report as at 31 December 2016
87 Directors report - Part II However, it cannot exclude that events may take place in the future that cannot currently be foreseen and that could make it necessary to change its valuations. CAVTOMI Consortium (Turin-Milan high speed/capacity line) With respect to the contract for the Turin-Milan high speed/capacity railway line - Novara - Milan sub-section, the general contractor Fiat (now FCA N.V.) is required to follow the registered claims of the general contractor CAVTOMI Consortium (the consortium ), in which Salini Impregilo has a share of 74.69%, against the customer Rete Ferroviaria Italiana ( RFI ). The consortium carried out all design and execution activities for the project. Accordingly, on 18 April 2008, Fiat initiated contractual arbitration proceedings against RFI for the award, in particular, of damages suffered for delays in the works ascribable to the customer, non-achievement of early completion bonus also due to the customer and higher consideration. On 9 July 2013, the arbitration tribunal handed down an award in favour of Fiat, ordering RFI to pay approximately 187 million (of which about 185 million pertaining to the consortium). RFI appealed against the award before the Rome Appeal Court on 30 September 2013 and in October 2013 paid the amount due to Fiat, which, in turn, forwarded the relevant share to the consortium in December The ruling of 23 September 2015 of the Rome Appeal Court cancelled a large part of the aforementioned arbitration award. FCA appealed to the Supreme Court and issued a claims form for the revision of the Appeal Court s ruling. Since the Appeal Court s ruling is enforceable and following the notification by RFI to FCA of writ of enforcement of approximately 175 million, FCA and RFI reached an agreement whereby FCA provided RFI with the following guarantees in order to prevent execution of the aforementioned ruling, without prejudice to the parties substantive rights, which are subject to final judgement: (i) payment of an amount of approximately 66 million, and (ii) issue to RFI of a bank security of 100 million ( 75 million for Salini Impregilo). The legal advisors representing FCA in this dispute deem that the appeal of the Appeal Court s ruling has good and substantial chances of success; therefore, the consortium is confident that its arguments will be accepted at the end of the dispute and that it will recover the amounts recognised as loans and receivables at the reporting date. The Group cannot exclude that currently unforeseeable events may arise in the future which could require changes to the assessments made to date. COCIV With the claim form notified to the COCIV Consortium on 18 September 2014, the 86 Annual Report as at 31 December 2016
88 Directors report - Part II customer RFI S.p.A. challenged the validity of the inter partes arbitration award of June 2013 and also requested the return of about 108 million (approximately 74 million for Salini Impregilo) collected by COCIV as a result of the award. The COCIV Consortium appeared in court and the case was adjourned to 17 March 2017 for clarification of the conclusions. The consortium, represented by its legal advisors, is confident that the arbitration award will be confirmed by the ruling. The Group cannot exclude that currently unforeseeable events may arise in the future which could require changes to the assessments made to date. *** On 26 October 2016, some managers and employees of COCIV were arrested as were other persons (including the chairman of Reggio Calabria - Scilla S.C.p.A., who promptly resigned). The above two legal entities were informed that the Genoa and Rome public prosecutors are investigating alleged obstruction of public tender procedures, corruption and, in some cases, criminal organisation. Specifically, the proceeding before the Genoa Court (involving COCIV managers and employees) covers alleged obstruction of public tender procedures for supplies or works on individual lots (for which the public prosecutor also intends to investigate the parent s CEO) as well as two cases of corruption. The proceeding before the Rome Court relates to the alleged active corruption of works management in order to encourage the works manager (also under investigation) to perform acts contrary to their official duties. As a precautionary measure and to demonstrate its non-involvement in the crime, a clean break with the past and full collaboration with the authorities, COCIV has implemented the following measures and actions: replacement of the individuals involved in the proceedings and withdrawal of their proxies; dismissal or suspension of these employees; ban on their access to work premises or corporate or any document archives; lapse of all the contracts that showed their reprehensible conduct as per the remand orders; cancellation of ongoing tenders and an awarded tenders to call them again after a clear-cut break with the past; termination of the contract with the works management service provider and temporary appointment, with the consent of RFI S.p.A., of two experts to 87 Annual Report as at 31 December 2016
89 Directors report - Part II perform this service, while communicating its willingness to transfer this duty (currently carried out by the consortium as per the contract) to the customer, as per its request; on 19 January 2017, appointment by RFI S.p.A., upon COCIV's request, of a person identified by it to participate in the tender boards for the work that COCIV should assign under EU procedures. On 11 January 2017, as part of the proceedings commenced on 16 November 2016, ANAC sent the Genoa Prefecture a proposal for adoption of the extraordinary measures pursuant to article 32 of Law decree no. 91/14 against COCIV. On 3 March 2017, the Rome Prefecture issued its decree of the same date appointing a commissioner for the extraordinary and temporary administrative procedure of COCIV in accordance with article 32.1.b) of Law decree no. 90 of 24 June 2014, converted with amendments by Law no. 114 of 14 August 2014 for a six-month period, which may be extended. On 31 January 2017, the Rome public prosecutor notified the completion of the preliminary investigations of the individuals involved in the alleged crimes of criminal organisation, as well as COCIV and Reggio Calabria - Scilla S.C.p.A. for the administrative offence as per articles 5 and 25 of Legislative decree no. 231/01. The consortium deems that the crimes allegedly committed by its personnel (should they be found guilty by the court) were to its detriment and were essentially committed in their own interests (and, hence, not in the consortium's interest) by fraudulently circumventing the rules in place to control its activities. Moreover, these alleged offences would not have required RFI S.p.A. to pay a larger or undue amount or create economic benefits for the consortium but rather would have required it to pay higher costs. The consortium's new structure (senior management and operating personnel) is committed to ensuring that the works can continue while concurrently dealing with the social and employment issues arising from the discontinuity measures that the consortium has had to put in place vis-à-vis the third party companies involved in the legal proceedings. The consortium has carefully checked the quality of the materials works previously carried out although this is not an issue raised by the public prosecutors. Its results are wholly in line with the findings of the expert appointed by the Genoa court which both found the full compliance of the materials used by the consortium with the quality levels specified in the contracts and relevant legislation. The directors carefully examined the above facts and circumstances to correctly present them in this Annual Report based on the available information. They deem that the consortium has acted correctly and the net assets (mainly consisting of loans and receivables and contract work in progress recognised at 31 December 2016) are fully recoverable. At present, the Group does not have information that would allow it to assess 88 Annual Report as at 31 December 2016
90 Directors report - Part II whether any potential developments could require modifications to the assessments made to date or the probability or scope of such developments. Strait of Messina bridge - Eurolink In March 2006, as lead contractor of the joint venture created for this project (interest of 45%) (subsequently merged into the SPE Eurolink S.C.p.A.), Impregilo S.p.A. (now Salini Impregilo S.p.A.) signed a contract with Stretto di Messina S.p.A. for its engagement as general contractor for the final and executive designs and construction of the Messina Strait Bridge and related roadway and railway connectors. A bank syndicate also signed the financial documentation required in the General Specifications after the joint venture won the tender, for the concession of credit lines of 250 million earmarked for this project. The customer was also given performance bonds of 239 million, as provided for in the contract. Reduction of the credit line to 20 million was approved in Stretto di Messina S.p.A. and the general contractor Eurolink S.C.p.A. signed a rider in September 2009 which covered, inter alia, suspension of the project works carried out since the contract was signed and until that date. As provided for by the rider, the final designs were delivered to the customer and its board of directors approved them on 29 July Decree law no. 187 was issued on 2 November 2012 providing for Urgent measures for the renegotiation of the contracts with Stretto di Messina S.p.A. (the customer) and for local public transport. Following enactment of this decree and given the potential implications for its position as general contractor, Eurolink, led by Salini Impregilo, notified the customer of its intention to withdraw from the contract under the contractual terms, also to protect the positions of all the Italian and foreign co-venturers. However, given the immense interest in constructing the works, the general contractor also communicated its willingness to review its position should the customer demonstrate its real intention to carry out the project. To date, the ongoing negotiations have not been successful despite the efforts made. Eurolink has commenced various legal proceedings in Italy and the EU, arguing that the provisions of the above decree are contrary to the Constitution and EU laws and that they damage Eurolink s legally acquired rights under the contract. It has also requested that Stretto di Messina be ordered to pay the amounts requested by the general contractor due to the termination of the contract for reasons not attributable to it. With regard to the actions filed at EU level, in November 2013, the European Commission communicated its decision not to follow up the proceedings, as no treaties were violated, and confirmed this on 7 January 2014, with a communication dismissing the case. As regards the civil action in Italy, Salini Impregilo and all the members of Eurolink have jointly and severally asked that Stretto di Messina be ordered to pay the amounts claimed, for various reasons, due to the termination of the contract for reasons not attributable to them. After completion of the investigation phase, the Judge referred the case to the Third Civil Chamber of the Rome Court for the first 89 Annual Report as at 31 December 2016
91 Directors report - Part II level ruling. In the meantime, before the investigation phase had been completed, Stretto di Messina brought an action before the Supreme Court under article 41 of the Italian Code of Civil Procedure for a prior ruling on the question of jurisdiction of the Rome Civil Court s lack of jurisdiction. Considering the complex nature of the various legal proceedings and although the legal advisors assisting Salini Impregilo and the general contractor are reasonably confident about the outcome of the proceedings and the recoverability of the remaining assets (mainly contract work in progress) recognised for this contract, it cannot be excluded that events not currently foreseeable may arise in the future which would require the current assessments to be revised. Romania - Orastie-Sibiu highway Salini Impregilo has been operating in Romania since July 2011 following the start of the works for the Orastie-Sibiu highway section contract (Lot 3). In July 2013, it was awarded a second tender for the development of Lot 2 of another highway section between the cities of Lugoj and Deva. The two contracts are part of a wider road project called Pan-European Corridor IV, which cuts through Romania from Nãdlac (on the border with Hungary) via Pitesti and reaches Costanza, on the Black Sea. Both contracts were entered into with the Romanian National Road & Highways Company (CNADNR) and 85% financed with EU structural funds and 15% by the Romanian government. The Orastie-Sibiu contract provided for the construction of 22.1 km of two-lane highway (plus the relevant emergency lanes). In September 2015, Salini Impregilo presented an application for arbitration to the customer for claims about the extension of the original contractual delivery times and payment of an additional consideration due to unforeseeable events and the customer s negligent conduct. On 13 January 2016, with works completion at 99.9%, following a number of disputes between the parties, the customer terminated the contract and enforced the contractual guarantees of approximately 13 million, motivating such unilateral decision as being due to the alleged non-resolution of non-compliances notified by works management. The aforementioned contract termination, which the parent deemed fully unfounded, was formally contested as a result. The dispute between the parties is currently being heard by the International Court of Arbitration at the International Chamber of Commerce. The directors (also based on the advice of their legal and technical experts), believe that the parent s operations were correct and that the amounts recognised as contract work in progress and loans and receivables at 31 December 2016, inclusive of requests for additional consideration also part of the claim, can be collected. Considering the uncertainties linked to the dispute stage, the Group cannot 90 Annual Report as at 31 December 2016
92 Directors report - Part II exclude that currently unforeseeable events may arise in the future which could require changes to the assessments made to date. Rome Metro As part of the contract for the design and construction of the works for the B1 line of the Rome Metro, Salini Impregilo commenced three proceedings in its name and as lead contractor of the joint venture against Roma Metropolitane S.r.l. and Roma Capitale requesting they be ordered to pay the disputed claims recorded during works execution, for which a technical appraisal by a courtappointed expert was provided. The Rome Court s ruling of 22 August 2016 settled the first level proceedings involving the claims made for the Bologna Conca d Oro section and partly accepted the joint venture s requests, ordering Roma Metropolitane S.r.l. to pay 10,607,683.91, plus VAT and related costs. The joint venture commenced the necessary actions to collect the receivable based on this temporary enforceable ruling. It also presented an appeal for the award of a greater amount. The second proceeding relates to the first set of claims for the Conca d Oro Jonio section and is currently at the decisional phase. The third proceeding refers to the second and last set of claims for the Conca d Oro Jonio section and was commenced in September The Directors (also supported by their legal and technical experts) deem that the amounts recognised in contract work in progress at 31 December 2016, inclusive of the additional consideration claimed from the customer and calculated based on the expectation that recognition of such consideration could be deemed to be reasonably certain also on the basis of the aforementioned expert opinions, are collectible. Considering the uncertainties linked to the dispute stage, the Group cannot exclude that currently unforeseeable events may arise in the future which could require changes to the assessments made to date. A1 Milan-Naples motorway, work to upgrade the Apennine Mountains section between Sasso Marconi and Barberino di Mugello, La Quercia-Aglio segment The works were substantially finished and the segment was opened to traffic in December In June 2011, the Florence public prosecutor, at the end of an investigation launched in 2005, charged some employees/senior managers of Todini Costruzioni Generali S.p.A. with environmental crimes allegedly related to the construction of the new route across the Apennines. 91 Annual Report as at 31 December 2016
93 Directors report - Part II On 5 November 2012, the Preliminary Hearing Judge ruled for all the accused parties that the statute of limitations had run out on the alleged crimes regarding water control and effluent management and committed for trial the abovementioned defendants for the alleged crimes concerning the management of excavated soil and rocks and environmental damage. In the hearing of 26 March 2013, before the Florence Court, the Ministry of the Environment joined the proceeding seeking damages from the parties liable under civil law, that is, Todini Costruzioni Generali, Autostrade per l Italia S.p.A., and the other contractors involved (in addition to said defendants) by claiming damages for equivalent assets of not less than 810 million or such amount as the Court considers just and appropriate. In support of its claim, the Ministry of the Environment filed a report by the I.S.P.R.A. (an institute established within the Ministry), which was struck from the record of the proceedings at a hearing on 9 December 2013, as the judge ruled that the introduction of this document could not be allowed because it had not been developed in the presence of both parties and lacked the name of the party who wrote it. Since the civil plaintiff failed to produce documents or consultants, at this point, the damage claim is not supported by any evidence as to its amount. The investigation phase began in January 2014 and is still ongoing. At the hearing of 9 May 2016, HCE Costruzioni S.p.A. appeared in court as the transferee of Todini Costruzioni Generali S.p.A. s Italia business unit, which includes the contested contract and related proceedings. The Group denies having any responsibility for the disputed issues, emphasising that its conduct was completely lawful and that the charges levied against it are groundless. It also objects to the outrageous amount of the damage claim filed by the Ministry of the Environment, which, in addition to being presented without first requesting the adoption of any environmental remediation measures that might have been necessary, does not appear to be compliant with Italian law and European Directive no. 2004/35/EC. In this respect, the European Commission activated an infringement procedure against Italy in 2007 (no. 2007/4679), confirmed on 27 January 2012 with a complementary reasoned opinion, which recently resulted in the adoption, with Law no. 97 of 6 August 2013, of amendments to the Single Environmental Code enacted with Legislative decree no. 152 of 3 April 2006, which include the elimination from the text of article 311 of the above-mentioned Legislative decree no. 152/2006 of the reference to the damage claim for equivalent assets, due to the fact that compensation for environmental damages can firstly be achieved with specific remediation measures. Comforted by the opinion of its legal advisors, the Group believes that the above-mentioned damage claim is groundless and, consequently, that the risk of the claim being granted is remote. Consequently, management did not 92 Annual Report as at 31 December 2016
94 Directors report - Part II find it necessary to recognise a provision in the consolidated financial statements. Considering the uncertainties linked to the dispute stage, the Group cannot exclude that currently unforeseeable events may arise in the future which could require changes to the assessments made to date. Sesto San Giovanni building The parent became involved in a dispute with the lessor of its previously leased registered office in 2009 following the relocation of its registered office from Sesto San Giovanni (Milan) to its current premises in Milan. The dispute was settled with the arbitration award of December 2012 which accepted the claim made by the lessor and ordered the parent to pay the outstanding lease payments for the remaining term of the lease which expired in July The parent promptly challenged the award with the relevant Milan Appeal Court which has yet to hand down its ruling. Moreover, the parent had already provided for the outcome of the arbitration in its 2012 financial statements pending the terms for challenging it. While awaiting the Appeal Court ruling, the parent has been obliged to pay the amount awarded to the lessor, although it reserves the right to recover it. Pursuant to the contract signed with Immobiliare Lombarda S.p.A., which is the original lessor of the current registered office, Salini Impregilo has the right to be held harmless from claims made by its previous lessor that exceed 8 million. It exercised this right by requesting a court order, which was issued by the Milan Court and challenged by Immobiliare Lombarda. While awaiting the merit ruling, the counterparty paid the full amount of the claim, as the court refused to stay the enforcement of the payment order. Ente Acque Umbre Toscane (Imprepar) The Group was informed that part of the sill above the surface discharge of the Montedoglio dam in the Arezzo province had been damaged on 29 December The Irrigation Body, Ente irriguo Umbro-Toscano (now Ente Acque Umbre Toscane) notified Imprepar in January 2011 that investigations and checks are being carried out to ascertain the reasons and responsibilities for the damage. As the transferee of the sundry activities business unit, which includes the Montedoglio dam contract, Imprepar informed the body that the activities related to the damaged works were carried out by another company in 1979 and 1980, from which Impregilo (then COGEFAR) only took over the contract in The works had been tested and inspected with positive results. Imprepar specifically explained its non-liability for any damage caused by the event in its communication to Ente Acque Umbre Toscane and does not believe that there are reasons to modify its related assessments, supported by the opinion of its legal advisors. During 2012, the managers of Ente Acque Umbre Toscane and the works manager signed a service order requesting the contractor to immediately prepare 93 Annual Report as at 31 December 2016
95 Directors report - Part II executive designs and commence the related works at its own expense and under its own responsibility. Imprepar challenged these acts in full even though the amounts involved are not deemed significant. As part of a prior technical assessment resulting from a third-party complaint claiming damages of a minor amount (around 80,000), the judge ordered a technical appraisal by a court-appointed expert to determine the causes of the dam s subsidence. The court-ordered technical expert s report filed in June 2015 ascribes the cause of subsidence to various concurrent factors with different negligence percentages, and, specifically: design deficiencies 20%, execution deficiencies 60%, control deficiencies 20%. Imprepar challenged this report. Imprepar, with the aid of its legal advisors, is defending the correctness of its conduct in all the competent forums. C.A.V.E.T. Consortium - Florence Court With regard to the criminal proceedings commenced against the C.A.V.E.T. Consortium and certain individuals, including some former managers of the consortium, the appellate proceedings ended with a decision handed down on 27 June 2011, which reversed in full the lower court s decision, thus reversing the convictions handed down by the lower court and finding both the consortium and the indicted individuals not guilty of any of the charges. The public prosecutor of the Florence Court appealed this decision before the Supreme Court, which, on 18 March 2013, set aside in part the decision of the Florence Appeal Court ordering that the case be returned to such Appeal Court. The reinstated proceedings before the Court got underway on 30 January 2014 and, on 21 March 2014, the Appeal Court handed down a decision by which it rejected most of the charges levied by the public prosecutor, but upheld them in some important cases. The decision of the Florence Appeal Court was appealed by all defendants and by C.A.V.E.T, in its capacity as a party liable under civil law, and the relevant appeals were filed before the Supreme Court in September On 21 April 2016, the Fourth Criminal Chamber of the Supreme Court handed down its ruling cancelling without remand the 21 March 2014 ruling of the Florence Appeal Court for all the criminal charges and most of the civil charges. It provided that only certain of the civil charges are to be heard by the competent civil law judge in an appeals hearing. The Ministry of the Environment has summarised the proceedings before the Florence Appeal Court, requesting that the existence of the environmental damage be recognised and that CAVET and some of the individuals already indicted in the criminal proceedings be ordered to adopt the remediation measures that have not yet been identified. Judicial investigations - Milan Court (proceedings commenced at the Monza Court) Following the proceedings initiated by the public prosecutor before the Monza 94 Annual Report as at 31 December 2016
96 Directors report - Part II Court, in which the chairman of the board of directors and the chief executive officer of Impregilo in office at the time of the events in question are being investigated, Impregilo S.p.A. was the target of a preliminary investigation. The alleged charge against Impregilo is to have prepared and implemented an organisational model unsuitable to prevent the crimes allegedly attributed to the directors involved in the investigation, from which the company is alleged to have benefited. After structured and complex procedural phases, described in previous reports, to which we refer, on 21 March 2012, the Milan Appeal Court (as part of the appeal proceedings initiated by the public prosecutor against the lower court s decision that had found Impregilo not guilty of the charge of violating Legislative decree no. 231/01) rejected the public prosecutor s arguments and fully confirmed the aforementioned decision, which had found, inter alia, that the organisational model adopted by the company was adequate. The public prosecutor appealed this decision before the Supreme Court, which on 18 December 2013, handed down decision no. 4677/14 cancelling the Milan Appeal Court s decision, returning the proceedings to a different section of the same Court for a new merit review. The ruling was summarised before the Milan Appeal Court, which, in the hearing of 19 November 2014, acquitted the company and confirmed the rest of the acquittal of the Preliminary Investigations Judge of the Milan Court of 17 November *** For completeness purposes, information about disputes settled during the year and presented in prior year reports is set out below. Santiago Metro - Chile The project for the construction of two sections of line 6 of the Santiago Metro was won in 2013 by Salini Impregilo Group, through its subsidiary Empresa Constructora Metro 6 Limitada and is worth CLF3.3 million (Unidad de Fomento - equivalent to 122 million). A series of events interfered with the work, such as unexpected geological conditions that were very different from those reported by the customer, project engineering changes, archaeological finds and the customer s prohibition to working at night despite the fact that it would not exceed the maximum permitted noise levels. These factors led to delays that were partially recognised by the works management, but never formalised by the customer. The customer, at its own initiative and on the basis of a schedule different from that agreed, started imposing fines in November These fines were all challenged. In addition to the above, relations with the customer were characterised by complex situations, resulting in five requests to extend the delivery date of the work and, in 2014, to the revision of its scope. 95 Annual Report as at 31 December 2016
97 Directors report - Part II With respect to this situation, Empresa Constructora Metro 6 Limitada, submitted various claims to the customer in July 2014, and requested an Extension of Time, asking that they be assessed by the relevant contractuallyprovided for body. In August 2014, the customer rejected the requests and submitted Salini Impregilo s claim directly for arbitration before the Santiago Chamber of Commerce, failing to respect the contractual agreements requiring prior consultation between the parties for the selection of the single arbitrator. The first hearing was scheduled for 25 September 2014, but the customer asked it be postponed to 6 October In the meantime, on 3 October 2014, the customer informed Empresa Constructora Metro 6 Limitada of the early termination of the contract based on grounds that have been challenged in full and are currently the subject of the aforementioned arbitration. The customer has the contractual right to terminate the contract with Empresa Constructora Metro 6 Limitada at any time, regardless of any breaches denied by it. On the same date, the customer presented a request to the Chilean banks for the enforcement of the contract sureties (local contract guarantees secured by European banks) for a total of CLF912,174 (the equivalent of 29.9 million). These amounts also include the full enforcement of the guarantee for advance payment, even though CLF156,323 (the equivalent of 5.1 million) had already been repaid to the customer through the monthly certifications (a criminal report was filed in Chile). The subsidiary responded to the customer s initiatives by requesting that the surety enforcement order be suspended and that the operational and contractual conditions be reinstated to those existing on 2 October The arbitrator did not find grounds for an urgent order to suspend enforcement of the sureties and reserved final judgement, prolonging the suspension of the works. Therefore, the amounts corresponding to the guarantees referred to above have been paid. Following negotiations with the customer to settle the dispute, an out-of-court agreement was signed on 7 September 2016 providing for: a) publication in three Chilean newspapers of a joint statement; b) deliver of the works performance certification and the works final acceptance report; c) payments: Payment by the customer to Salini Impregilo S.p.A.: 96 Annual Report as at 31 December 2016
98 Directors report - Part II - return of the amounts for the guarantees enforced by the customer (CLF912,173,685, equal to approximately 29.9 million); Payment by the customer to Empresa Constructora Metro Limitada: - for the certified works related to August and September 2014, site cleanup, extraordinary works - CLF461, (equal to approximately 16 million); - return of the contractual withholdings - CLF63, (equal to approximately 2.2 million); - return of the contractual fines applied during the contract term - CLF108,218 (equal to approximately 3.8 million); Payment by Empresa Constructora Metro 6 Limidata to the customer: - return of the unamortised advance of CLF323, (equal to approximately 11.4 million). The transaction generated a loss of approximately 19 million recognised in profit or loss in Naples - construction of a railway section for an urban railway system, Piscinola-Secondigliano segment Construction of the civil engineering structures for the Piscinola-Secondigliano railway section, part of a project to modernise and upgrade the Naples - Alifana railway, was suspended in the second half of 2011 due to the failure of the customer Metrocampania Nordest S.r.l. (now Ente Autonomo Volturno) to pay the consideration owed for the work. As a result, the only activities carried out concerned ensuring the safety of the construction sites. While aware of the strategic significance of the project for the purpose of completing the Naples railway loop, the customer was unable to honour its commitments due to the financial difficulties underlying the budget of the Campania region, which, ultimately, created a shortage of financial resources for its subsidiary Metrocampania Nordest S.r.l., making disbursement of the consideration owed extremely difficult. In light of this situation, the Ministry of Infrastructures and Transportation, in accordance with the provisions of Decree law no. 83 of 22 June 2012 (converted into Law no. 134 of 7 August 2012), appointed a special commissioner tasked with determining the amounts of the payables and receivables of the companies that operate the regional railway services, with the aim of developing a plan to cover the ascertained deficit. At this point, the appointed commissioner has completed their task regarding the 97 Annual Report as at 31 December 2016
99 Directors report - Part II investigative and planning phase and are now expected to announce their subsequent decisions. Considering that, in order to allow the commissioner to carry out their activities, the above-mentioned Decree law specified that no payment enforcement actions may be activated or pursued against the companies owned by the regional administration that operate railway transportation services for 12 months from the effective date of the above-mentioned Decree law no. 83 (a deadline that has been extended several times and recently confirmed until 31 December 2016 by article 41.5 of Decree law no. 133/2014), Todini Costruzioni Generali S.p.A., subsequently replaced by HCE Costruzioni S.p.A., has nevertheless taken all actions that it deemed necessary to obtain satisfaction of its rights, while maintaining a non-confrontational relationship with its customer, which still considers completion of the railway segment in question a priority for the effective operation of the metro railway loop. Todini Costruzioni Generali S.p.A. transferred all the receivables arising from the unpaid invoices issued to Ente Autonomo to Salini Impregilo S.p.A. with its document of 30 June 2014 notified to the customer. During 2014, and before formalisation of the transfer deed, the customer paid approximately 8.5 million to Todini Costruzioni Generali S.p.A. Negotiations have been commenced with the customer, which has also requested the dispute concerning implementation of the lot adjacent to the Naples-Alifana railway (Secondigliano-Di Vittorio), contracted to a joint venture of which HCE Costruzioni S.p.A. is the lead contractor, be included in the settlement. In relation to the Secondigliano - Di Vittorio section (whose works were never started), the joint venture commenced legal proceedings to have the contract declared terminated, claiming compensation for all damages. The negotiations commenced to settle the Secondigliano Di Vittorio section dispute led to the signing of an acknowledgment and settlement agreement on 20 February 2017, which provides for: payment of 18,093, as the accrued unpaid consideration and to settle the claims recorded in the accounting register, which Ente Autonomo Volturno will pay in two instalments in March and June 2017; a return to work after payment of the first instalment and commencement of the remaining works starting from December 2017; completion of the works by March The negotiations to settle the dispute related to the Secondigliano Di Vittorio section are still pending. 98 Annual Report as at 31 December 2016
100 Directors report - Part II Country risk Libya Salini Impregilo S.p.A. operates in Libya through a permanent establishment and a subsidiary, Impregilo Lidco Libya General Contracting Company (Impregilo Lidco), which has been active in Libya since 2009 and is 60% owned by Salini Impregilo with the other 40% held by a local partner. The directors do not deem that significant risks exist with respect to the permanent establishment s contracts as work thereon has not started, except for the Koufra airport project. Moreover, the Group s exposure is not material. The Group is also involved in the Libyan Coastal Highway project which leads to the Egyptian border for the stretch through Cyrenaica, which had not yet been started at the reporting date. Impregilo Lidco won important contracts for the construction of: infrastructural works in Tripoli and Misuratah; university campuses in Misuratah, Tarhunah and Zliten; a new Conference Hall in Tripoli. Despite the dramatic political events in Libya from February 2011, Salini Impregilo has always acted in accordance with the contractual terms. This political upheaval has not yet subsided, impeding the subsidiary from developing its business. At present, Salini Impregilo does not expect activities to be resumed in the near future as there are also serious security problems. The subsidiary Impregilo Lidco continues to be present in Libya and to maintain contacts with its clients, complying promptly with legal and corporate requirements. It informed its clients immediately of the activation of the force majeure clause (provided for contractually) given the situation in Libya, but the projects covered by the contracts should continue to be a priority for the country. The clients have acknowledged the contractual rights and the validity of the claims presented for the costs, losses and damages incurred as a result of the abovementioned unrest. Once the local situation has normalised and the country s institutions are working again, these claims will be discussed with the clients. The impairment losses on net assets and costs incurred starting from the 2012 financial statements until the reporting date are fully included in contract work in progress. The subsidiary has presented claims to the clients for these amounts, which it deems are fully recoverable as they are due to force majeure. In addition, the investments made to date are covered by the contractual advances received from the clients. 99 Annual Report as at 31 December 2016
101 Directors report - Part II The subsidiary s legal advisors agree with this approach as can be seen in their reports. No significant risks are deemed to exist for the recovery of the net assets attributable to the subsidiary, thanks in part to actions and claims filed against the clients. This country s situation continues to be complex and highly critical, which does not allow the Group to make reliable forecasts about whether operations can be resumed in the short term. Salini Impregilo will continue to guarantee the subsidiary s business continuity. However, it cannot be excluded that events which cannot currently be foreseen may take place after the date of preparation of this report that require changes to the assessments made to date. Venezuela Salini Impregilo Group has been active in Venezuela through its permanent organisation, which directly or in association with international partners, carries out railway and hydroelectric projects with a solid base constructed in the country over more than 30 years. In recent years, relationships with clients, which are all government agencies, have been characterised by delays in payments. This issue became more acute in 2015 due to the rapid fall in oil prices, which is Venezuela s main source of hard currency, and social tensions that have intensified as a result of the lack of basic foodstuffs and medicines. With respect to the railway works and especially the P. Cabello - La Encrucijada project, the last significant considerations in hard currency collected were in January No large collections in either the local or foreign currency took place in In the second week of December 2016, the customer issued a debt certification showing its liabilities with the railway consortia (including Caracas-Cua), confirming its interest in continuing the works. This certification is extremely important given that the works scheduled for 2017 have been halted and the country s uncertain state of affairs. In addition, the customer recently approved the contractual extensions requested for both the Puerto Cabello and the two Guarico (San Juan de los Morros and Chaguaramas) projects, confirming the extension of the contractual deadlines. Work on the Puerto Cabello project continued slowly during the year, given the collection difficulties and the country s continuously deteriorating situation. The two Guarico projects have officially been suspended on a temporary basis. Moreover, since the election of the new government, relations between the executive and the legislative branches have been very difficult such that the judicial system froze all legislative activities during the year through the Supreme Court. This situation makes it difficult to foresee what may happen. 100 Annual Report as at 31 December 2016
102 Directors report - Part II With respect to the hydroelectric works executed through the OIV Tocuma consortium, the customer requested that they be rescheduled. This proposal was agreed at the end of 2015 by the customer that, also in light of legitimate requests for payment of the certified debt and the definition of the future financial resources needed to ensure normal performing of the remaining work, recommenced making payments in favour of the consortium and signed a new addendum to the contract under which the work to be completed and related outlays have been rescheduled. In October 2015, the dam s reservoir was filled to the planned level in line with schedules. Despite the commitments taken on by the parties with the aforementioned addendum, works slowed down starting from the start of 2016 as a result of delays in the latest payments (about USD80 million and VEF1.2 billion scheduled for the last quarter of 2015) and non-compliance by the customer with the agreements. At present and as agreed with the customer, the works for the next year will be rescheduled so as to allow turbines 1 and 2 to be operational by the end of This will be covered by a new contractual addendum. In addition to that set out above, Venezuela s central bank abolished the official exchange rate and the SIMADI on 10 March 2016 and introduced two new rates: DIPRO (fixed), only to be used for imports of basic necessities (i.e., medicines, food, etc.); DICOM (floating), applicable to all other commercial transactions. This rate has depreciated by more than 300% since its introduction. There has been a concurrent explosion in inflation with forecasts hovering around an annual 700%, leading to a drop in consumption and a large loss in purchasing power. The continued social-economic-political uncertainty and oil price levels are having a dramatic influence on the country s entire production system. The projects that are being developed by Salini Impregilo Group are priority infrastructures of the utmost importance, both in economic-industrial and social terms. Accordingly, and based on the constant and careful monitoring of the country s situation, carried out together with the Group s partners and through discussions with clients and local government authorities to monitor and protect the Group s positions, the assumptions about the recoverability of the Group s net assets (mainly receivables from clients and contract work in progress) can be confirmed. However, in view of the delicate and complex uncertain situation that has developed at political level, the possibility that events not foreseeable at the reporting date may arise in the future that may require changes to the assessments made to date cannot be excluded. 101 Annual Report as at 31 December 2016
103 Directors report - Part II Nigeria The economic crisis caused by the drop in oil prices, the country s main revenue contributor, prevents Nigeria from investing in infrastructure. The measures introduced by the government are not designed to continue the projects underway, which were put on hold during the year throughout the country. Nigeria s production sectors, including construction, are stagnant. The unemployment rate continues to rise, as do the widespread discontent and crime. The local currency prices of imported goods have increased significantly due to the central bank s official depreciation of the Naira in July 2016 with the resulting Naira/Euro exchange rate moving from about 220 to about 320. The federal government expects improvement in 2017 although this will be dependent on oil prices of USD42.50/barrel and a production rate of 2.2 Mbpd, foreign funding and improved tax recovery. As it cannot directly control these factors, the announced improvement cannot be said to be very reliable compared to the situation seen in 2016, which led to the standstill of all the Group s contracts for the entire year. In view of the present critical political and economic situation, it cannot be excluded that events not foreseeable at the date of this report may arise in the future requiring changes to the assessments made to date about the recoverability of the outstanding net assets. Turkey Despite internal political tension and the serious public order situations in certain areas which culminated with the coup d état foiled in July 2016, Turkey showed its considerable ability to deal with the critical external and internal issues during the year. Moreover, with its letter dated 15 March 2016, the customer Statkraft communicated the termination of the contract for alleged non-compliance of the contractor (Salini Impregilo - Salini Insaat - NTF joint venture). In the joint venture s opinion, comforted by its legal advisors, this termination of the contract is a unilateral decision by Statkraft to withdraw from the contract as a result of the serious public order situation that had emerged in the location where the works are being carried out, for reasons not attributable to the contractor. The joint venture, therefore, opposed the clients decision and initiated the contractual procedure for dispute resolution. At the end of May 2016, the site personnel had all been transferred. Negotiations with the customer are in place to settle the dispute. Specifically, the customer requested the bank guarantees of approximately 34 million given on the joint venture s behalf be enforced. The Milan Court ordered the enforcement be blocked with its ruling of 13 June 2016 and set the date of 14 July 2016 for the related hearing. Subsequently, the measure was confirmed with the order of 23 July 2016, whereby the Judge recognised the contractor s fumus boni iuris, holding that both enforcement of the guarantees and termination of the contract are not due to the joint venture s default but to the customer s unilateral decision, due to the very serious public order issues at the work site. 102 Annual Report as at 31 December 2016
104 Directors report - Part II It cannot be excluded that events not currently foreseeable may take place after the date of this report which would make it necessary to modify the assessments made to date about the recoverability of the outstanding net assets. With respect to the other contract, Gaziantep, also located in a critical area, the province and city of Gaziantep, which is an important busy industrial hub, are protected by a large Turkish security force assisted by NATO. There is a heightened risk of possible isolated terrorist actions, especially against government sites. Ukraine This country s political and economic situation is still extremely difficult. The continued instability has led to a serious economic recession and steady worsening in Ukraine s public finances. Given the location of the Group s construction site for the Capital Repair M03 Kiyv- Kharkiv-Dovzhanskiy contract near Poltava, which is far away from the areas most affected by the ongoing armed conflict in the south east, the safety of contract activities has not been significantly affected. The Group is not exposed to currency depreciation risk since the contractual amounts are expressed in Euros and US dollars. The burden of the conflict and the economic slowdown have negatively impacted the country s public debt. The unstable institutional and governmental situation affected the customer s organisation (the Ukraine State Agency of Automobile Roads - Ukravtodor), which has recently seen the introduction of new senior managers, during the year. This made it more difficult for the Group to deal with the customer. In addition, the parent s sale of Todini Costruzioni Generali (which had been awarded both contracts in this country) made intensive communication with the customer necessary to clarify the Group s position and guarantee continuity in the Capital Repair M03 Kiyv-Kharkiv-Dovzhanskiy project. Moreover, Ukravtodor has not accepted the company s position and communicated its intention to terminate the contract in August The Group has clearly defended its position following the contractually-specified procedure. In December 2016, the dispute arbitration board, appointed to rule on the termination, confirmed its illegality. The Group is currently assessing the contract s future and it cannot currently exclude any situation a priori, given that the customer has appealed to the International Court of Arbitration. The Group s position in Ukraine continues to be very unclear given the country s economic, political and social situation and the dispute about the Capital Repair M03 Kiyv-Kharkiv-Dovzhanskiy project. In view of the present critical situation, it cannot be excluded that events not foreseeable at the date of this report may arise in the future requiring changes to the assessments made to date about the recoverability of the outstanding net assets. 103 Annual Report as at 31 December 2016

105 Sustainability business model
106 Directors report - Part II Empowered by 110 years of experience in the construction sector, the Group has developed a strong business model that combines the creation of value for its shareholders, investors and clients with the generation of social and environmental value in the areas where it works. Its approach is to create shared values that fully integrate sustainability values and strategies with its business strategy. The Group is committed to pursuing the following priorities: ensuring high performance standards to investors, clients, employees and partners, as well as the local communities and the areas where it works; supporting social and economic growth in the areas in which it operates, through job creation, professional training, engagement of local suppliers and support to local communities; and ensuring transparency towards all stakeholders to create a climate of mutual trust, correctness and transparency. The Group s sustainability model also supports the wider management of operational, financial and reputational risks, as well as creating new opportunities and competitive advantages in a market that increasingly focuses on these aspects. Salini Impregilo has formalised its commitment in a coordinated set of policies, procedures and organisational structures aligned with major international benchmark structures, underpinned by its sustainability policy, defining ten principles that enshrine the Group s ten commitments to its stakeholders. Moreover, Salini Impregilo is a member of the United Nations Global Compact, a global sustainable development initiative through which the Group undertakes to align its strategies and operations to ten universal principles concerning human rights, work, the environment and the fight against corruption. The Group s adoption of an integrated quality, health and safety and environmental management system, as well as the organisational model pursuant to Legislative decree no. 231/2001 and the anti-corruption model ensures that it is equipped with adequate controls in accordance with the aforementioned principles. Since 2014, the Group has voluntarily joined the Carbon Disclosure Project (CDP), the global platform supported by over 800 institutional investors that allows users to measure, compare and share information about the environmental performance (climate change) of over 2,000 companies all over the world. In 2016, Salini Impregilo was included in the CDP s Climate A List of the 193 most virtuous companies in the world in terms of their commitment to sustainability, including eight Italian companies. Its inclusion in the list was accompanied by 105 Annual Report as at 31 December 2016
107 Directors report - Part II an award from CDP and Borsa Italiana as part of the CDP Climate Leadership Awards 2016, as recognition of Salini Impregilo s strategies and actions to reduce greenhouse gas emissions and to combat climate change. At domestic level, Salini Impregilo is a founding member of the Global Compact Network Italy Foundation and collaborates with other member organisations and companies to develop specific projects and initiatives aimed at promoting the priorities set by the Global Compact. In addition to adopting the aforementioned policies and management systems, Salini Impregilo implements additional sustainability programmes based on the specific features of each project. These include eco-design and eco-construction systems adopted by the Stavros Niarchos Cultural Centre project in Athens, Greece, which achieved the LEED Platinum certification and was awarded the prestigious 2016 Global Best Project Award by ENR (Engineering New Records), by the Red Line North project in Doha, Qatar, which adopted the GSAS system to improve the sustainability performance of public works, and by the Metro Northwest project in Sydney, Australia, which was awarded the Leading Infrastructure Sustainability Design rating by ISCA (Infrastructure Sustainability Council of Australia) for the development of sustainability best practices in its design. The commitment to sustainability, the initiatives implemented and the results achieved in this area are accounted for on an annual basis in the Group s Sustainability Report, available on the website. Salini Impregilo was one of the first European construction companies to prepare an Environmental Report on a voluntary basis, starting from In the first years of its publication, this report came to be an important reference for the entire sector, since up until then few companies had dealt with the relationship between the environment and the execution of large infrastructural projects in a systematic way. The Group subsequently extended its reporting activities to other areas, such as the health and safety of workers, the quality of structures erected, personnel policies and interaction with local communities. The 2016 Sustainability Report, to which reference is made for more in-depth information, has been prepared in accordance with the guidelines of the Global Reporting Initiative (GRI-G4), the most advanced sustainability reporting standard currently available. The document complies with GRI s comprehensive option, which guarantees maximum disclosure about the Group s significant impacts and is independently certified by Deloitte & Touche. 106 Annual Report as at 31 December 2016
108

109 Human resources and organisation
110 Directors report - Part II At 31 December 2016, the group s workforce was as follows: Total workforce by category 31 December December 2015 Managers White collars 7,270 6,646 blue collars 26,808 23,665 Total 34,440 30,598 Organisation The Group strengthened its corporate organisational structures during the year by introducing risk management and security units, the creation of a corporate social responsibility unit and by focusing on innovation through the set up of an engineering, development and concessions department to translate the Group s strategic vision into fact. The quality, environment, health and safety unit, which used to report to the chief executive officer, was transferred to the group HR and organisation department to generate synergies between the two functions and simultaneously ensure greater focus on implementing systems and providing specialist assistance with contracts by the quality, environment, health and safety unit. The internal audit department was enlarged to include the compliance unit, which used to report to the chief executive officer, for the greater integration of the various controls and to strengthen the internal controls and optimise the governance model. The strengthening of the corporate structures was assisted by the hiring of new employees on the market, not all of whom had construction sector backgrounds, to integrate the Group s current skill set and facilitate the ongoing transformation. Introduction of new units and the concurrent overhaul of some existing organisational structures were accompanied by another modification of the Group s procedural system to revise and optimise the related model and incorporate the new positions and responsibilities into the system as well as allowing it to keep pace with the new business requirements. The Group also developed its reference procedures for the management of quality, environment, health and safety related issues and designed more operational administrative and accounting procedures. The Group translated the main procedures into English to facilitate their circulation and implementation by all group entities, thus ensuring harmonised processes, standards and policies. It also provided video tutorials for some of them to allow the rapid and immediate understanding of the key processes, presenting the roles, responsibilities and main steps in a simple and straight-forward manner. 109 Annual Report as at 31 December 2016
111 Directors report - Part II During the second half of the year, the Group rolled out important projects to assist the digitalisation of processes. They included introduction of an application to assist recruiting and development of a system to manage business trips, which will be in use at the start of Training Learning Academy This academy continued to operate and provided leadership, knowledge sharing and technical-operating courses during the year. The management training course, Da Giocatore a Coach (From player to coach), involving 120 international managers, was of great importance providing training on the management and assessment of colleagues both through classroom and webinar sessions. This course is part of the management performance programme and promotes a common approach to developing professional growth. The Train the Trainer course was attended by various staff levels (managers and professionals) and is designed to build up the skills of internal trainers and mentors and their ability to share their key knowledge of the Group s business. The participants, who are internal members, were all involved as lecturers in the International Construction Management masters course for new graduates at the Milan Polytechnical University. Technical courses included the programme about the new Italian public sector contracts code involving more than 100 managers and professional staff in the second half of the year. E-learning The Group launched the new, innovative e-learning platform, the Salini Impregilo E-learning Academy, during the second half of the year. This will become the Group s main international training hub, providing employees with the possibility to access courses they are interested in for self-improvement purposes, regardless of their location. The new on-line training programme has different courses, including a section for newly hired employees (orientation programme) who can use innovative methods such as video tutorials and training pills, to obtain a clear and immediate understanding of the Group s main procedures. Attraction and development of talent The Employer Branding plan and recruiting and university career counselling activities The employer branding and talent attraction plan in the most important Italian and international universities was continued during the year. The Group successfully organised and carried out 21 different projects involving university students and the business world, designed to select talented graduates, provide professional 110 Annual Report as at 31 December 2016
112 Directors report - Part II counselling and tutoring about construction sector career opportunities. They are organised through strategic agreements with the major Italian and international universities and by leveraging engagement initiatives such as career days, recruiting days, themed workshops in university facilities, presentations and visits to construction sites as well as communications via digital and social media, university websites and the main on-line job boards, which facilitate direct, ongoing dialogue with potential candidates. Thanks to these activities, promoted by the HR and communication units, the Group obtained two important accolades as part of the OTAC (On Line Talent Communication) survey carried by the Swedish research company, Potential Park. Salini Impregilo is included in the 2016 classification as one of the top Italian companies in the Social Media and Mobile Talent Interaction categories, ranking 20th and 25th respectively. Master in International Construction Management The parent successfully continued its work with Milan Polytechnic, a leading university partner, on dedicated training and internship activities for young talented graduates with level I and level II master degrees in International Construction Management. The Master course, for the first time held entirely in English, is attended by 15 Italian (67%) and international (33%) new graduates with degrees in civil engineering, construction systems and building architecture, providing unique theoretical and practical training. The course has two sections: the first of which includes classroom lessons, workshops, project works and site visits, with more than 300 hours of lessons provided by Salini Impregilo professionals. The second section consists of on-the-job training where the students perform internships under the guidance of company tutors after which they are required to write their master theses. The young engineers are thus given a view of the Group s business and on-hands experience of what it means to participate in the construction of large works, developing innovative construction solutions and acquiring the necessary technical skills thanks to the guidance provided by the best sector experts. In December 2016, the tender for the new masters programme was launched. This programme will be carried out between 2017 and 2018 to ensure continuity of the investment in professional training about the construction sector to assist young talented graduates. Salini Impregilo Best New Entry amongst Best Employers of Choice 2016 In 2016, Salini Impregilo entered the Top 20 of the Best Employer of Choice list (the list of the most desirable employers in Italy for new graduates that 111 Annual Report as at 31 December 2016
113 Directors report - Part II Cesop Communication has compiled since 2002) and won the Best New Entry 2016 award, with an overall ranking of 11 and as the only construction sector company. It improved its ranking during the year climbing seven positions in the 2017 classification, confirming its position as one of the most desirable employers in Italy for university graduates, placing fourth in the global ranking and second as the preferred workplace of technical-scientific graduates. Remuneration policies and Performance management Performance Management Programme The objectives for the 2016 performance management programme were defined during the year for a small group of the Group s key employees. The assessment stage will take place in the first quarter of Short-term incentive plan for key management personnel Like in previous years, the Group continued its short-term incentive plan for key management personnel in As set out in the 2016 remuneration report, the plan provides for a bonus if annual objectives set at group, business unit and individual level are met. Labour relations Office integration project As part of the integration process of the Milan and Rome offices, and with the aim of pursuing process and corporate procedure efficiency objectives, cost optimisation for the Group as a whole and a suitable, targeted remix of the professional profiles, available internally, the parent continued to implement the decisions agreed with the trade unions and company union representatives to achieve corporate objectives and entailing some of the accompanying measures for the aforementioned company activities. Accordingly, on 27 October 2016, the parent, the trade unions and the company union representatives signed the agreement for the positive conclusion of the collective redundancy procedure commenced with the letter of 18 October 2016 involving 30 employees at the Rome and Milan offices. On 19 December 2016, the parent signed another agreement with the Rome and Milan company union representatives to extend (for 2016 and 2017) the option for employees who meet the legal requirements for retirement or will do so before 30 June 2017 to sign individual agreements for the termination of their employment relationship against payment of a termination benefit. CO.GE.MA. S.p.A. On 19 December 2016, CO.GE.MA. S.p.A. signed an agreement with the Rome trade unions and company union representatives allowing the company to dismiss employees up until 31 October 2017 for objective just cause, which will not be 112 Annual Report as at 31 December 2016
114 Directors report - Part II opposed by the employees who will receive a termination benefit and a settlement, thus settling any issues between them and the company. Sale of a business unit by Todini Costruzioni Generali S.p.A. to HCE Construction S.p.A. The consultation procedure pursuant to article 47 of Law no. 428/190 as subsequently amended and integrated ended on 3 February It had been started with the letter of 27 January 2016 informing the trade unions of Todini Costruzioni Generali S.p.A. s intention to sell a business unit to its subsidiary HCE Costruzioni S.p.A. Isarco S.c.a.r.l. Isarco S.c.a.r.l. and the trade unions signed a memorandum of understanding on 16 November This covered, inter alia, an extensive and structured system of trade union relations to be considered for the construction of the Brenner base tunnel - Isarco River Underpass Section lot and better financial conditions compared to the national and provincial labour agreements for Isarco s employees and/or consultants. Quality, safety and the environment Salini Impregilo s quality, safety and environmental management system is increasingly integrated within the Group and is applied to all its contracts. It complies with the UNI EN ISO 9001 (quality), UNI EN ISO (environment) and BS OHSAS (health and safety) regulations, as the quality management system was certified in 1997, the safety management system in 2003 and the environmental management system in The independent body, SGS Italia S.p.A., is scheduled to audit the Group in December 2016/January 2017 to allow it to maintain its ISO 9001, ISO and OHSAS certifications. The Group plays an important social and economical role in the markets in which it operates, contributing to local economic development with investments in health, safety and the environment, as well as supporting local communities. It has adopted a quality, safety and environmental management system as a guarantee to all stakeholders (shareholders, employees, clients, suppliers, local communities, public adminstrations, etc.) to deliver increasingly efficient and effective performances. Adoption of the QSE management system has assisted the Group to meet the objectives set out in the QSE policy, specifically: maintaining the quality of products and services, through respect for the environment and the health and safety of workers in all workplaces and labour sectors. This commitment also extends to third party companies and subcontractors; 113 Annual Report as at 31 December 2016
115 Directors report - Part II the availability of resources (human, technological and financial) necessary for the development and implementation of the quality, health and safety and environmental management system; the performance of work based on the latest construction technologies available in the industry and the fundamental concept of building to best industry standards, the use of processes, technologies and materials that allow the rational and sustainable use of natural resources (e.g., water, energy and raw materials); the involvement and active participation of all staff working for the Group or on its behalf, through information, education and training, for proper circulation and understanding of the principles expressed on the issues of quality management, environmental respect and protection, the health and safety of workers, with the commitment to continual improvement; compliance with the applicable legal provisions and any other regulations which might be adopted, with the application of more stringent standards whenever possible; ongoing dialogue with clients and their representatives throughout the technical and administrative process of delivering services and the performance of works, the involvement of Interested Parties in the analysis of the Group s environmental performance through the opening of communication channels to discuss sustainable development, the promotion of all initiatives with employees, clients, suppliers and Interested Parties designed to achieve the highest levels of health and safety protection; the identification and assessment of risks to the health and safety of workers caused by their activities; the identification and assessment of the environmental aspects of the Group s activities and the identification of those aspects that have or could have a significant impact on the environment; effective waste management through the re-use of products and materials where possible, and the use of products with low environmental impact; the identification of all technical and organisational measures useful to eliminate the possibility of pollution, through the careful analysis of the risk of spillage or uncontrolled release into soil/water/air; the prevention of occupational illnesses and the elimination or reduction of accidents in the workplace for employees, service providers and subcontractors, based on the principle that all accidents are preventable. One of the most significant developments introduced with the issue of new standards of the ISO 9001 and ISO (2015 version) was the so-called risk- 114 Annual Report as at 31 December 2016
116 Directors report - Part II based approach for management systems. The project to align the QSE systems is scheduled for completion in 2017 (alignment with the new standards must be completed by September 2018). For the correct application of the QSE management system, the Group appointed a management representative who, assisted by the quality, environment and safety unit, is responsible for: updating personnel and the entire organisation about management s commitments taken on with the Quality, Environment and Safety Policy, also by using portal; scheduling regular internal audits to check the organisation s working; proposing possible changes to the policies aimed at improving the Group s performance to senior management. During the year, the QHSE unit carried out a number of audits in line with its annual plan to check the effective application of the QSE system in contracts. The audits mainly covered fully operational contracts and less so those in a start-up phase (where, nevertheless, the unit carried out checks taking part in the deployment programme) or those nearing completion. The unit performed 10 audits of various contracts. Support to branch offices was provided through medium to long-term missions (aimed at achieving specific objectives), both based on the QHSE unit s plans and direct requests from the branches. Environmental protection Protecting the environment has always been a priority for the Group, formalised since among the first companies in Europe - in a specific Environmental Policy, which received ISO certification in Since then, the Group has implemented an environmental management system in all its operating companies to ensure that the environmental impacts of their work are adequately identified and mitigated, in response to legislative requirements, contractual requirements and the expectations of the communities affected by our projects. Specifically, this system complies with Salini Impregilo s policy to protect the environment, not only for the purposes of sustainable development and success in global markets, but also for: its strategic priority; ongoing improvement in performance and conduct; additional information and training for employees; 115 Annual Report as at 31 December 2016
117 Directors report - Part II the assessment and prior limitation of the effects of its operations on the environment; research and development, to identify increasingly sustainable techniques; dialogue with employees and local communities, to jointly resolve any contingent environmental issues; commitment to involving clients, suppliers and subcontractors in a more correct and evolved environmental management of their products and services. The environmental management system allows Salini Impregilo to continue its current policy aimed at: ongoing improvement of environmental performances; utilisation of an internal organisation to circulate and promote the system s guidelines and instructions with all group companies and in building sites, ensuring their correct application; developing the capacity to identify and monitor key environmental aspects of its core business, including by setting up special data bases; the faster use of the results of technological research, encouraging adoption of increasingly efficient solutions to recycle materials, contain the movement and consumption of raw materials and energy, protect water resources and reduce waste and the clean-up of sites after work. Large civil engineering projects have, by their very nature, very strong effects on the anthropic and environmental contexts in which they are built, modifying them to make them accessible (as is the case of transport infrastructures), to increase their economic potential (as in the case of dams for irrigation or energy) or to improve public utility services (as in the case of hydraulic engineering works). Salini Impregilo Group is committed to providing the highest level of environmental protection in all stages of its construction works: from design to the construction phase, until clearing of the work sites and environmental restoration. Adopting the most advanced tools available, the Group evaluates all potential impacts arising from its activities, in order to eliminate or minimise them. During project implementation, the Group adopts specific environmental management plans to monitor the potential effect of all works on the environment. The environmental management system s procedures are applied to all contracts and are constantly assessed and monitored, also through direct audits performed by the parent s QSE unit. When a new contract is started and based on the work to be carried out, the Group identifies significant environmental aspects, i.e., those aspects that could 116 Annual Report as at 31 December 2016
118 Directors report - Part II significantly impact the environment. Their identification and subsequent assessment take place using specific procedures designed by Salini Impregilo s QSE unit, applicable to all contracts. The significance of environmental impacts is assessed using a methodology prepared considering criteria which are given different weights, depending on their importance. These criteria are: the existence of specific regulatory requirements; the probability that the event will occur; the seriousness for the environment; how long the impact will last; how difficult it will be to restore the original situation; the effects on the Group s reputation. Once the significant environmental impacts have been identified, the contract s main effects on the different environmental components are analysed: atmosphere; natural resources and energy consumption; surface and underground watercourses; soil and subsoil; waste generation; noise and vibrations; biodiversity, which differ depending on the type of work carried out (underground tunnels and works, bridges and viaducts, railway and road works and dams). Following the significance analysis, an environmental protection plan is prepared for each contract, describing the management and monitoring activities (environmental control plans) for all the environmental components involved. Atmosphere During construction of infrastructure, the most significant direct effects on the atmosphere are related to dust dispersion and gas and particulate emissions. This 117 Annual Report as at 31 December 2016
119 Directors report - Part II is due to the nature of the key processes: excavation, earthwork, movement of heavy vehicles on dirt tracks, crushing plants and the demolition of existing structures and buildings. In addition, the engines of building site equipment and self-generating power plants release atmospheric emissions. The Group adopts different methods to limit the creation and dispersion of dust: it regularly dampens access dirt tracks to building sites, vehicles are required to maintain a low speed. Industrial sites and quarries are equipped with tire washing systems to prevent trucks from spreading dirt on paved roads, which would cause dust dispersion. Low-impact methods are used to reduce emissions of combustion gases and particulates: performing regular maintenance, periodically upgrading plant, machinery and vehicles with more efficient and environmentally friendly models. However, the main opportunities for reducing emissions derive from the connection of the Group s plant and installations to local power networks, reducing, where possible, the use of diesel generators. For this reason, Salini Impregilo carefully assesses the possibility and means of connecting its sites to existing electricity networks. Natural resources, energy and greenhouse gas emissions Construction of motorways, bridges, dams and railway lines requires the use of large quantities of concrete, water, iron and backfill: all raw materials which are mostly not renewable. Salini Impregilo is committed to ensuring the most efficient use of these resources and the use of alternative materials, when possible, without affecting the quality, security and functioning of the finished product. In order to improve its environmental performance, Salini Impregilo has fine-tuned systems to recycle and reduce consumption: when possible, it recycles debris as part of the same contract or uses systems that allow the reuse of water for other specific activities, such as, for example, washing vehicles or dust suppression. Energy consumption, both in the form of fossil fuels and electric energy, has a strong impact during construction of infrastructure. Reduction of energy consumption allows a decrease in greenhouse gas emissions and mitigation of the effects of climate change. Salini Impregilo uses state-of-the-art power rationalisation systems by deploying highly efficient vehicles and equipment, connecting its building site plants to electricity networks rather than diesel generators, carrying out regular maintenance programmes for its vehicles, using energy recovery systems and informing its employees about the importance of energy saving. The Group also contributes proactively to the fight against climate change with its projects. It builds hydroelectric power plants that generate renewable energy, metro 118 Annual Report as at 31 December 2016
120 Directors report - Part II lines that reduce the use of private vehicles encouraging more sustainable mobility and many green building projects. Information about the Group s greenhouse gas emissions is provided below. Direct emissions (Scope 1) and indirect emissions (Scope 2 and 3) of greenhouse gases Unit * Direct emissions (Scope 1) tco2e 526, ,974 Indirect emissions (Scope 2) tco2e 34,509 40,858 Other indirect emissions (Scope 3) tco2e 129, ,347 Total tco2e 690, ,179 Intensity of greenhouse gas emissions tco2e/ m * The figures include Lane Industries (acquired on 4 January 2016). Water environment The effects of construction of a large-scale work on surface or underground watercourses are never insignificant. The impact varies depending on the type of work. Construction of a bridge or a dam inevitably leads to interference of watercourses. In these cases, Salini Impregilo implements procedures to limit any impacts on water quality as much as possible. Tunnel boring also unavoidably leads to interference of underground watercourses. This is normal in all tunnel work but may become a critical issue if there are large waterbeds. Salini Impregilo adopts the necessary techniques to prevent any type of contamination. To prevent contamination, wastewater is properly channelled and collected in leakproof sedimentation tanks and treatment plants, where sediment and oily residues are removed. Prior to their release into the environment, the Group closely monitors the quantity and quality of its water discharges, to ensure compliance with local laws. The water from underground excavations is also collected and treated in treatment plants constructed at the entrance to the excavation windows, in order to eliminate any trace of pollutants or suspended matter before the water is returned to the environment. Soil and subsoil Large-scale works and infrastructure always affect the soil: use of the surfaces, sealing, excavations and backfills, contamination risks. 119 Annual Report as at 31 December 2016
121 Directors report - Part II Earthwork and excavations are one of the most obvious and typical aspects during construction: construction of embankments, cuttings or certain types of dams require the movement of large earth quantities. Large volumes of soil have to be moved to the work front or removed. When the earth does not come from excavations at the building site, the effect on the environment of using earth from quarries or other natural environments has to be considered. The primary and most visible environmental impact in the case of underground works is the large quantity of material created by the tunnel boring activities and the related traffic due to transport of the muck to the lowest impact sites near the works. The excavated earth and rock are classified and stored on the sites for possible reuse within them, where possible and in compliance with the regulations, or sold to third parties to be re-used externally. Waste Waste generated during construction of large-scale infrastructure and engineering works can be grouped into two separate categories: urban or similar waste and special waste. Urban or similar waste is generated by logistics sites where all the support activities for the industrial production are carried out such as offices, accommodation for non-resident workers, canteens and recreational facilities for workers. Salini Impregilo avails of the services of local authorised companies for the collection, recycling and disposal of this type of waste. Special waste is generated by the actual industrial activities. It includes concrete residue and iron scraps, which are usually recycled. On industrial sites, waste materials are collected and sorted, and stored in specific enclosed areas, from which they are then taken to be reused or to be sold to third parties authorised to carry out disposal and treatment of waste. Other types of waste generated in large quantities are packaging (plastic and wood) and sludge from the water purification systems, which are transferred to specific authorised third party systems. Hazardous waste is a marginal part of the waste generated in a large-scale infrastructure contract. Normally it involves paint, additives and solvents, used oil and oil filters from vehicle maintenance, batteries, rechargeable batteries and, in some cases, earth, mud and other materials containing hazardous substances. Salini Impregilo transfers its hazardous waste to authorised third parties. In all cases, Salini Impregilo operates in compliance with the current legislation and with maximum care, using qualified suppliers if necessary. 120 Annual Report as at 31 December 2016
122 Directors report - Part II Noise and vibrations The aspects relating to noise and vibration have a double significance for the Group: internally, in terms of the health of workers, and externally, in terms of impacts on the environment and local communities. Within its management system, there are specific procedures to evaluate and monitor these aspects, adopting the most appropriate measures to ensure protection of the health and safety of workers (use of personal protection equipment, soundproofing, etc.) and of the surrounding environment. With regard to the effects on the environment surrounding the sites, the areas most subject to noise interference are protected by noise barriers, which can be artificial dunes made of backfill material or support structures and absorption panels made of various materials. The noise barriers could also be one or more rows of trees or shrubs which both absorb the noise and reduce the visual impact. Vibration is also a feature of work on civil engineering sites. The effects of pressure waves that propagate in the soil can cause damage to buildings or other structures located in the vicinity of the works. During the works, periodic monitoring of both noise and vibration is carried out. Biodiversity The performance of infrastructure projects requires the implementation of special protection measures when the sites are adjacent to or within sites of special natural interest, so that construction activities interfere as little as possible with the fauna and flora present. In these situations, the Group commits to preserving and protecting the biological diversity of the areas surrounding its operating sites. Employee health and safety Employee health and safety is one of Salini Impregilo s core values. The Group carries out many different types of work at its sites involving different risks for the employees involved. Salini Impregilo, therefore, is strongly committed to providing its employees with ongoing training about their duties, also making them aware of the risks they may face. Salini Impregilo has put in place and puts in place all the human and technical resources necessary to meet the objectives set in its QSE policy and in accordance with BS OHSAS Thanks to its adoption of a BS OHSAS certified occupational health and safety management system, Salini Impregilo has achieved important milestones, such as: development of a safety culture; reduction of work-related accidents; prevention of occupational illnesses; decrease in administrative and criminal sanctions. 121 Annual Report as at 31 December 2016
123 Directors report - Part II Moreover, integration of the occupational health and safety management system with the other rules for quality (ISO 9001) and the environment (ISO 14001) has meant that Salini Impregilo can continue its main goal of construction with quality, respectful of the environment and its employees health and safety. Salini Impregilo complies with prevailing regulations in each country in which it operates and guarantees high standards of health and safety in the workplace. All internal departments are required to contribute to ensuring the correct implementation of the management system, pursuant to the relevant regulations and the organisational, management and control model as per Legislative decree no. 231/2001. Operational control of the management system is implemented through specific procedures, which require that, at each group office and site, safety risks and emergencies are properly identified and managed, preventive and protective measures are defined and responsible corporate functions are identified. The basic documentation required to operate the system is as follows: Risk assessment documents (RAD); Operational safety plans (OSP); Emergency and evacuation plans; Fire prevention and control plans; First aid plans. To ensure the consistency, uniformity and rigor of the documentation prepared by the individual sites, the Group has established guidelines and principles to be adopted in the preparation of the OSP, which must take into account the characteristics of the work, the specific processes, particular performance risks, the contractual specifications and local regulations. The head office s quality, environment and safety unit carries out periodic audits on specific safety procedures used at group sites and evaluates the application of corporate rules concerning health and safety in the workplace. The main health and safety products undertaken during the year included: agreement and development of a corporate Leadership for Health and Safety project to create a new, shared corporate health and safety culture, fostering awareness by the leadership, harmonising the standards in the different countries in which the Group operates and increasing awareness about the issue. Two pilot projects have been launched at CMT Copenhagen and NWRL Sydney; participation in the World Health and Safety Day promoted by the International Labour Organisation (ILO) on 28 April 2016; the Group entered its 20 major 122 Annual Report as at 31 December 2016
124 Directors report - Part II contracts in the world and more than 400 managers attended the HS meeting while over 2,600 workers participated in building site events (link WSG - World Safe Day). Safety numbers With respect to accident figures, it should be noted that the data analysed also refers to the consolidated entity Salini Impregilo for the period prior to the date of the merger (1 January 2014). The table summarises data and key indicators for the past four years in a single table, considering both employee and subcontractor data. Indicator/Year 2013* 2014* ** Total Man Hours worked 114,774, ,218, ,745, ,041,526 LTI (Lost Time Injuries) > 3 days lost Number of Lost Workdays > 3 days 16,096 10,371 12,923 13,974 IR - Total Workforce Injury Rate (ILO) = ((LTI>3 days)/hours Worked) X 200, LDR - Total Workforce Lost Day Rate (ILO) = (LWD >3 days/hours Worked) X 200, Note: * Comparative data (for 2013 and 2014) were restated, compared to those published in the 2014 Annual Report to align them with those published in the 2014 Sustainability Report with respect to the scope and calculation method. ** The data do not include those related to the projects of Todini Costruzioni Generali, which is no longer part of the Group. The analysis of the figures shows a rise in the Severity Rate, whereas the LTRIF frequency index continues to decrease. 123 Annual Report as at 31 December 2016

125 Events after the reporting period
126 Directors report - Part II This section sets out the main events that have taken place since the reporting date and not commented on earlier in this report. Contract worth USD336 million awarded in virginia (USA) Lane has won new orders for 850 million in the first two months of Specifically, on 1 March 2017, it was awarded a new design-build contract worth 336 million to extend the 395 Express Lanes in Virginia, USA, where Lane has already performed other works. Preliminary work will start in March million contract awarded for the first lot of the high speed/capacity Naples-Bari railway section On 2 March 2017, the Salini Impregilo-Astaldi joint venture was awarded the contract worth 397 million to design and build the Naples-Cancello segment of the high speed/capacity Naples-Bari section. The works will be performed by Salini Impregilo (lead contractor, 60% share) and Astaldi (40%). The contract signing will take place once the necessary checks required by the tender procedure to ensure that the two joint venturers meet the relevant participation requirements have been completed. The contract was commissioned by ITALFERR S.p.A. and is to be completed by It covers the first segment of the Naples-Bari section and is a fundamental part of the overall restructuring of the entire railway line. COCIv On 6 March 2017, the Rome prefecture ordered the extraordinary administration of this consortium pursuant to article 32.1.b of Law decree no. 90 of 24 June 2014, converted with amendments by Law no. 114 of 11 August It appointed an extraordinary commissioner for a six-month period which may be extended. 125 Annual Report as at 31 December 2016

127 Outlook
128 Directors report - Part II 2016 saw consolidation of the ongoing growth trend even though the Group's markets were affected by numerous macroeconomic and political uncertainties, as described in earlier in this Report. The Group has an excellent order backlog for 2017 in both quantitative and qualitative terms, which will strengthen its leadership position in the large complicated infrastructure sector, confirm its number one position in the water treatment segment and its exceptional track record in the transport sector, especially in the metro, railway and road segments. The acquisition of Lane at the start of 2016 has strengthened the Group s business model, increased its portfolio diversification and improved its exposure between the advanced and developing countries. This acquisition will provide the Group with considerable opportunities for growth. 127 Annual Report as at 31 December 2016

129 Report on corporate governance and the ownership structure
130 Directors report - Part II The corporate governance model adopted by Salini Impregilo complies with the principles enshrined in the Corporate Governance Code for Listed Companies approved by the corporate governance committee and promoted by Borsa Italiana S.p.A., ABI, Ania, Assogestioni, Assonime and Confindustria. More information about the corporate governance system pursuant to article 123- bis of the Consolidated Finance Act (Legislative decree no. 58 of 24 February 1998, as subsequently amended) is available in the Report on corporate governance and the ownership structure, published on the parent s website in the governance section ( 129 Annual Report as at 31 December 2016

131 Alternative performance indicators
132 Directors report - Part II As required by Consob communication no of 28 July 2006, details of the performance indicators used in this Report and in the Group s institutional communications are given below. Financial ratios: Performance indicators Debt/equity ratio: this ratio shows net financial position (shown with a minus sign when negative, i.e., net financial indebtedness) as the numerator and equity as the denominator. The items making up the financial position are presented in a specific table in the notes to the consolidated financial statements. The equity items are those included in the relevant section of the statement of financial position. For consolidation purposes, equity used for this ratio also includes that attributable to non-controlling interests. 1. Gross operating profit (EBITDA): this ratio shows the sum of the following items included in the income statement: a. Total revenue b. Total costs, less amortisation and depreciation This can also be shown as the ratio of gross operating profit to total revenue. 2. Operating profit (EBIT): the operating profit given in the income statement, being the sum of total revenue and total costs. 3. Return on sales o R.o.S.: given as a percentage, shows the ratio of operating profit (as calculated above) to total revenue. Adjusted income statement and net financial indebtedness The Group monitors the key figures of Lane Group for management purposes adjusting the IFRS figures prepared for consolidation purposes to present the results of the joint ventures not controlled by Lane which are consolidated on a proportionate basis. These figures ( work under management ) show the status of contracts managed directly by Lane or through non-controlling investments in joint ventures. With respect to the acquisition of Lane Industries Incorporated, the adjusted comparative figures for 2015 have been prepared using the same consolidation scope, combining Salini Impregilo Group s key figures, restated compared to those shown in the 2015 Annual Report to consider the new IFRS 5 scope, with the key figures of Lane Group, which are its consolidated figures at 31 December 2015 prepared in accordance with IFRS. The net financial indebtedness at 31 December 2015 was calculated by summing the IFRS figures of the Group for 2015 with the IFRS accounting figures of Lane Group and the debt incurred to acquire the US company. 131 Annual Report as at 31 December 2016

133 Other information
134 Directors report - Part II Compliance with the conditions of article 36 of the Stock Exchange Regulation Salini Impregilo confirms that it complies with the conditions of article 36 of Consob regulation no ( Regulation on markets ), based on the procedures adopted before article 36 was effective and the availability of the related information. Research and development Pursuant to article 2428 of the Italian Civil Code, we note that the Group did not undertake any research and development activities during the year. Repurchase of treasury shares The repurchase programme approved by the parent s shareholders in their ordinary meeting of 19 September 2014 started on 6 October At the reporting date, the parent had repurchased 3,104,377 treasury shares for 7,676, Related parties Reference should be made to Note 39 to the consolidated financial statements and to Note 34 to the separate financial statements at 31 December 2016 for a description of related party transactions. 133 Annual Report as at 31 December 2016

135 Proposal to the shareholders of Salini Impregilo S.p.A.
136 Proposal to the shareholders Dear shareholders, The Separate financial statements of Salini Impregilo S.p.A. at 31 December 2016, prepared for your approval, show a profit for the year of 64,603,085.24, which we propose be allocated as follows: 3,230,154.26, equal to 5% of the profit for the year, to the legal reserve; 25,920, gross as a dividend to the holders of ordinary shares, gross of the legal withholdings for each existing share having dividend rights and, therefore, excluding the 3,104,377 own shares held by the parent, equal to per share; 420, gross as a dividend to the holders of savings shares, gross of the legal withholdings, equal to 0.26 per share, as per article 33.b) of the by-laws; 35,032, to be carried forward. In view of the calendar approved by Borsa Italiana S.p.A., we propose that the aforementioned dividends be distributed on 24 May 2017, with an ex-dividend date of 22 May 2017 (record date of 23 May 2017). On behalf of the board of directors Chairman Alberto Giovannini (Signed on the original) 135 Annual Report as at 31 December 2016
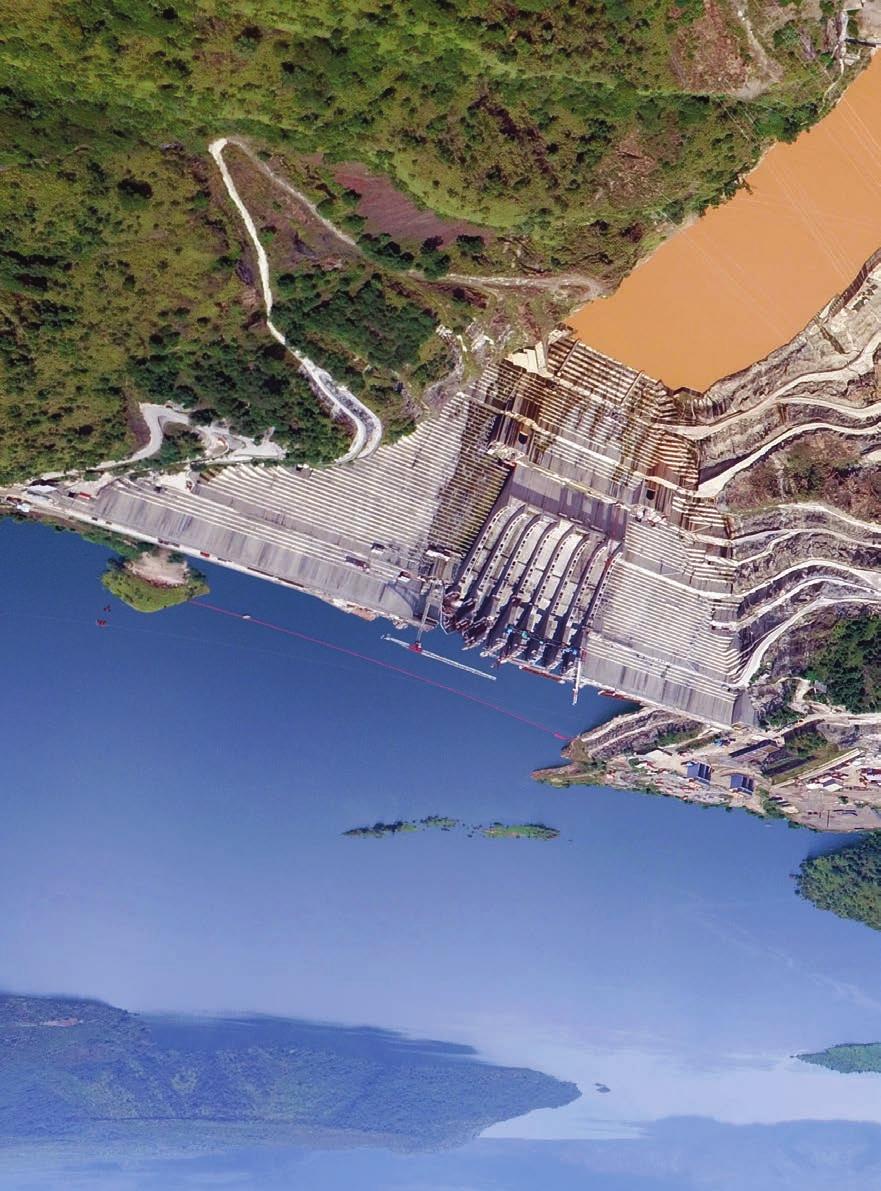
137

138 Consolidated financial statements as at and for the year ended 31 December 2016
139 Consolidated financial statements as at and for the year ended 31 December 2016 Consolidated financial statements Statement of financial position ASSETS Note 31 December 2016 of which: 31 December 2015 of which: ( 000) related parties related parties Non-current assets Property, plant and equipment 7 803, ,365 Intangible assets 8 168, ,821 Goodwill 9 175,188 - Equity investments , ,254 Derivatives and non-current financial assets 11 62,614 19,005 67,832 19,986 Deferred tax assets ,925 64,064 Total non-current assets 1,532,997 1,051,336 Current assets Inventories , ,073 Contract work in progress 14 2,367,263 1,775,791 Trade receivables 15 2,359, ,629 1,560, ,586 Derivatives and other current financial assets , , , ,463 Current tax assets , ,577 Other current tax assets , ,652 Other current assets ,271 35, ,642 33,882 Cash and cash equivalents 19 1,602,721 1,410,775 Total current assets 7,796,990 6,103,298 Non-current assets held for sale and discontinued operations 20 6, ,606 Total assets 9,336,019 7,302, Annual Report as at 31 December 2016
140 Consolidated financial statements as at and for the year ended 31 December 2016 EQUITY AND LIABILITIES Note 31 December 2016 of which: 31 December 2015 of which: ( 000) related parties related parties Equity Share capital 544, ,740 Share premium reserve 120, ,798 Other reserves 96,052 90,163 Other comprehensive income (expense) 47,088 (24,552) Retained earnings 336, ,259 Profit for the year 59,921 60,592 Equity attributable to the owners of the parent 1,205,005 1,116,000 Non-controlling interests 156, ,860 Total equity 21 1,361,331 1,216,860 Non-current liabilities bank and other loans and borrowings , ,554 bonds , ,211 Finance lease liabilities ,742 79,789 Non-current derivatives 25 4,429 4,113 Post-employment benefits and employee benefits 26 91,930 25,412 Deferred tax liabilities ,493 55,857 Provisions for risks , ,361 Total non-current liabilities 2,164,836 1,413,297 Current liabilities Current portion of bank loans and borrowings and current account facilities ,589 13, ,802 9,825 Current portion of bonds 23 18,931 10,203 Current portion of finance lease liabilities 24 55,281 49,617 Derivatives and other current financial liabilities 25 2,751 10,685 Progress payments and advances on contract work in progress 28 2,455,632 1,862,759 Trade payables 29 2,344, ,162 1,630, ,757 Current tax liabilities ,991 68,273 Other current tax liabilities 30 67,589 61,097 Other current liabilities ,315 13, ,198 13,061 Total current liabilities 5,809,852 4,566,071 Liabilities directly associated with non-current assets held for sale and discontinued operations ,012 Total equity and liabilities 9,336,019 7,302, Annual Report as at 31 December 2016
141 Consolidated financial statements as at and for the year ended 31 December 2016 Income statement Note 2016 of which: 2015 (*) of which: ( 000) related parties related parties Revenue Revenue 34 5,760, ,096 4,624, ,912 Other income ,451 12, ,229 21,991 Total revenue 5,883,809 4,770,295 Costs Purchases 35.1 (1,161,046) (116) (815,101) Subcontracts 35.2 (1,505,428) (1,249,957) (811) Services 35.3 (1,555,996) (220,024) (1,498,977) (477,721) Personnel expenses 35.4 (886,237) (538,764) Other operating expenses 35.5 (222,265) (744) (162,067) (19) Amortisation, depreciation, provisions and impairment losses 35.6 (277,324) (433) (237,842) (2,214) Total costs (5,608,296) (4,502,708) Operating profit (EBIT) 275, ,587 Financing income (costs) and gains (losses) on equity investments Financial income ,499 9,625 34,587 8,729 Financial expense 36.2 (146,542) (361) (108,336) (189) Net exchange rate gains (losses) ,537 (16,675) Net financing costs (86,506) (90,424) Net gains on equity investments 37 9, Net financing costs and net gains on equity investments (77,384) (90,089) Profit before tax (EBT) 198, ,498 Income tax expense 38 (77,952) (84,577) Profit from continuing operations 120,177 92,921 Loss from discontinued operations 20 (20,662) (10,690) Profit for the year 99,515 82,231 Profit for the year attributable to: Owners of the parent 59,921 60,592 Non-controlling interests 39,594 21,639 (*) The 2015 income statement was restated to comply with IFRS 5 given the new disposal scope of Todini Costruzioni Generali Group. 140 Annual Report as at 31 December 2016
142 Consolidated financial statements as at and for the year ended 31 December 2016 Statement of comprehensive income ( 000) Note (*) Profit for the year (a) 99,515 82,231 Items that may be subsequently reclassified to profit or loss, net of the tax effect: Exchange rate gains (losses) on the translation of foreign companies financial statements 21 61,742 (28,339) Net gains (losses) on cash flow hedges, net of the tax effect 21 7,581 (9,830) Other comprehensive income (expense) related to equity-accounted investees 21 1,483 (15) Items that may not be subsequently reclassified to profit or loss, net of the tax effect: Net actuarial gains on defined benefit plans 21 4, Other comprehensive income (expense) (b) 75,170 (38,010) Comprehensive income (a) + (b) 174,685 44,221 Comprehensive income attributable to: Owners of the parent 131,261 23,925 Non-controlling interests 43,124 20,296 Earnings per share From continuing and discontinued operations 40 basic Diluted From continuing operations 40 basic Diluted (*) The 2015 statement of comprehensive income was restated to comply with IFRS 5 given the new disposal scope of Todini Costruzioni Generali Group. 141 Annual Report as at 31 December 2016
143 Consolidated financial statements as at and for the year ended 31 December 2016 Statement of cash flows ( 000) Note (*) Cash and cash equivalents 19 1,410,774 1,030,925 Current account facilities 22 (115,615) (27,711) Total opening cash and cash equivalents 1,295,159 1,003,214 Operating activities Profit from continuing operations 120,177 92,920 Amortisation of intangible assets 35 34,009 24,563 Depreciation of property, plant and equipment , ,495 Net impairment losses and provisions 35 16,503 22,784 Accrual for post-employment benefits and employee benefits 26 13,878 15,486 Net gains (losses) on the sale of assets 1,877 (1,192) Deferred taxes 38 (5,761) 33,436 Share of loss of equity-accounted investees 37 (5,104) (412) Income taxes 38 83,713 51,141 Net interest paid during the year 88,279 78,153 Other non-monetary items 15,478 14,081 Cash flows generated by operations 589, ,454 Increase in inventories and contract work in progress ( ) (407,531) Decrease (increase) in trade receivables 15 (633,010) 213,505 (Decrease) increase in progress payments and advances on contract work in progress ,312 (94,658) Increase in trade payables , ,668 Decrease (increase) in other assets/liabilities (49,241) 205,779 Total changes in working capital (105,269) 77,763 Increase in other items not included in working capital (56,277) (90,358) Interest expense paid (76,140) (64,699) Income taxes paid (64,742) (24,925) Cash flows generated by operating activities 287, ,235 Investing activities Net investments in intangible assets 8 (2,422) (62,815) Investments in property, plant and equipment 7 (257,632) (215,386) Proceeds from the sale or reimbursement value of property, plant and equipment 61,287 38,598 Investments in non-current financial assets and capital transactions 10 (51,159) (37,412) Dividends and capital repayments from equity-accounted investees 10 27, Proceeds from the sale or reimbursement value of non-current financial assets 4,399 (704) Acquisitions and/or disposals of subsidiaries or business units, net of cash and cash equivalents (**) (376,420) 146,701 Cash flows used in investing activities (594,677) (130,039) 142 Annual Report as at 31 December 2016
144 Consolidated financial statements as at and for the year ended 31 December 2016 ( 000) Note (*) Financing activities Dividends distributed 21 (43,655) (22,921) Capital injection by non-controlling investors in subsidiaries (73) 11,295 Increase in bank and other loans 22 3,094,337 1,537,498 Decrease in bank and other loans 22 (2,547,252) (1,229,818) Change in other financial assets/liabilities 27,191 (352,983) Cash flows generated by (used in) financing activities 530,548 (56,879) Net cash flow from discontinued operations 19 (1,180) 3,429 Net exchange rate gains on cash and cash equivalents 34,140 50,370 Increase in cash and cash equivalents Cash and cash equivalents 19 1,602,721 1,410,775 Current account facilities 22 (51,297) (115,615) Total closing cash and cash equivalents 1,551,424 1,295,160 (*) The 2015 statement of cash flows was restated to comply with IFRS 5 given the new disposal scope of Todini Costruzioni Generali Group. (**) The 2015 balance has been reclassified to Investing activities for ease of comparison. 143 Annual Report as at 31 December 2016
145 Consolidated financial statements as at and for the year ended 31 December 2016 Statement of changes in equity ( 000) Share capital Share premium reserve Legal reserve Share capital increase related Extraordinary and other reserves Other reserves Reserve for treasury shares LTI reserve As at 1 January , , ,000 (3,970) 136 (7,677) - Allocation of profit and reserves , Dividend distribution Change in consolidation scope Stock options Capital Increase Other changes and reclassifications Dividend distribution to non-controlling interests Profit for the year Other comprehensive expense Comprehensive income December , , ,535 (3,970) 136 (7,677) 139 As at 1 January , , ,535 (3,970) 136 (7,677) 139 Allocation of profit and reserves , Dividend distribution Change in consolidation scope Stock options ,103 Capital Increase Other changes and reclassifications Dividend distribution to non-controlling interests Profit for the year Other comprehensive expense Comprehensive income December , , ,321 (3,970) 136 (7,677) 4, Annual Report as at 31 December 2016
146 Consolidated financial statements as at and for the year ended 31 December 2016 Other comprehensive income (expense) Total other reserves Hedging reserve Actuarial reserve Total other comprehens ive income Retained earnings Profit for the year Equity attributable to the owners of the parent Translation reserve Noncontrolling interests Total 88,489 15,575 1,987 (5,447) 12, ,988 93,773 1,109,903 76,513 1,186,416 1, ,238 (93,773) (19,983) - (19,983) - (19,983) ,668-2,668 (4,306) (1,638) ,295 11, (652) - (652) - (652) (2,938) (2,938) ,592 60,592 21,639 82,231 - (26,769) (10,072) 174 (36,667) - - (36,667) (1,343) (38,010) - (26,769) (10,072) 174 (36,667) - 60,592 23,925 20,296 44,221 90,163 (11,194) (8,085) (5,273) (24,552) 324,259 60,592 1,116, ,860 1,216,860 90,163 (11,194) (8,085) (5,273) (24,552) 324,259 60,592 1,116, ,860 1,216,860 1, ,806 (60,592) (19,983) - (19,983) - (19,983) (26,676) - (26,676) 35,562 8,886 4, ,103-4, (73) (73) (23,672) (23,672) ,921 59,921 39,594 99,515-59,723 7,553 4,364 71, ,640 3,530 75,170-59,723 7,553 4,364 71,640-59, ,561 43, ,685 96,052 48,529 (532) (909) 47, ,406 59,921 1,205, ,326 1,361, Annual Report as at 31 December 2016
147 Consolidated financial statements as at and for the year ended 31 December 2016 Notes to the consolidated financial statements 1. Basis of preparation Salini Impregilo S.p.A. (the parent or Salini Impregilo ) has its registered office in Italy. These consolidated financial statements at 31 December 2016 include the financial statements of the parent and its subsidiaries (the Group ). The Group, created by the merger of the Salini and Impregilo Groups, is a global player in the large-scale infrastructure sector. Salini Impregilo Group has prepared its consolidated financial statements at 31 December 2016 on a going concern basis. As required by Regulation 1606/2002 issued by the European Parliament and Council, implemented in Italy by Legislative decree no. 38/2005, these consolidated financial statements have been prepared in accordance with the International Financial Reporting Standards (IFRS) issued by the International Accounting Standards Board (IASB) and endorsed by the European Union. The format and content of these consolidated financial statements comply with the disclosure requirements of article 154-ter of the Consolidated Finance Act. The accounting policies adopted to draw up these consolidated financial statements at 31 December 2016 are consistent with those used to prepare the 2015 annual consolidated financial statements, to which reference should be made except for the changes summarised in Note 2. Translation of the assets and liabilities in foreign currency related to Venezuela At the end of the first half of 2014, the Group had to update the estimates for its industrial operations in Venezuela. In line with that already dislosed in previous reports, made available to the public as required by the current legal provisions, the deterioration of the country s economic conditions, seen since early 2014 were such that it became necessary to review the time and financial parameters according to which the Group s net assets can be realised in this area. Moreover, in light of the current general framework of the local currency/financial market situation, stemming from the conditions of the abovementioned local economic system, and consistently with the changes to the currency regulations of the country during 2014, the Group considered it reasonable, inter alia, to adopt, with effect from 30 June 2014, a new reference exchange rate for the translation of both the present values of working capital denominated in the Venezuelan currency and the prospective assets/liabilities over the entire estimated life of the railway contract work in progress. Since then, the Venezuelan monetary authorities have amended the local currency conversion systems on several occasions up until the most recent change approved on 10 March 2016, introducing two new exchange rates: DIPRO (fixed), only to be used for imports of basic necessities (i.e., medicines, food, etc.); 146 Annual Report as at 31 December 2016
148 Consolidated financial statements as at and for the year ended 31 December 2016 DICOM (floating), to be applied to all commercial transactions. Given the nature of its business, the Group has decided that the DICOM is the exchange rate to be used to translate Bolivar balances as it best represents the rate at which future cash flows, expressed in the local currency, may be settled assuming that they are still valid at the measurement date, also considering the possibility to access the local currency market and the Group s need to obtain a currency other than its functional currency. As a result of adoption of the DICOM rate in 2016, the Group recorded a decrease of approximately 1.8 million in the carrying amount of its net assets in local currency. The reduction in its net assets in local currency recognised in previous years amounted to 59 million. 2. Changes in standards The following standards, amendments and interpretations have been applied since 1 January 2016: amendments to IFRS 10 - Consolidated financial statements, IFRS 12 - Disclosure of interests in other entities and IAS 28 - Investments in associates and joint ventures about applying the consolidation exemption; amendment to IFRS 11 - Joint arrangements for the accounting of acquisitions of interests in joint operations; amendment to IAS 1 - Presentation of financial statements for the disclosure initiative; amendments to IAS 16 - Property, plant and equipment and IAS 38 - Intangible assets clarifying acceptable methods of depreciation and amortisation; amendments to IAS 16 - Property, plant and equipment and IAS 41 - Agriculture about bearer plants; amendment to IAS 19 - Employee benefits about employee contributions to defined benefit plans; amendments as part of the annual improvements to IFRS cycles and Adoption of the above amendments did not significantly affect the Group s consolidated financial statements. 147 Annual Report as at 31 December 2016
149 Consolidated financial statements as at and for the year ended 31 December 2016 This section lists the standards, amendments and interpretations published by the IFRS and endorsed by the European Union but which will become applicable after 31 December 2016: Standard, amendment or interpretation Status IFRS 15 -Revenue from contracts with clients, Endorsed in September 2016 and applicable issued in May 2014, including the deferral of to annual periods beginning on or after standard s effective date, issued in September January 2018 IFRS 9 - Financial instruments, issued in July 2014 Endorsed in November 2016 and applicable to annual periods beginning on or after 1 January 2018 The Group has not adopted the above standards in advance. The standards, amendments and interpretations published by the IASB and the International Financial Reporting Standards Interpretations Committee (IFRS- IC) but not yet endorsed by the competent EU bodies at the reporting date are set out below: Standard, amendment or interpretation Status IFRS 14 - Regulatory deferral accounts issued The European Commission has decided not to commence in January 2014 the endorsement process of the draft standard until the final document has been issued IFRS 16 - Leases issued in January 2016 Endorsement expected by the end of 2017 Amendments to IAS 12 - Recognition of deferred tax Endorsement expected during the first half of 2017 assets for unrealised losses issued in January 2016 Amendments to IAS 7 - Disclosure initiative Endorsement expected by the first half of 2017 issued in January 2016 Clarifications to IFRS 15: Revenue from Endorsement expected by the first quarter of 2017 contracts with clients issued in April 2016 Amendments to IFRS 2 - Classification and measurement Endorsement expected by the third quarter of 2017 of share-based payment transactions, issued in June 2016 Amendments to IFRS 4: Applying IFRS 9 Financial instruments Endorsement expected by the third quarter of 2017 with IFRS 4 Insurance contracts, issued in September 2016 Annual Improvements to IFRS Standards Endorsement expected by the third quarter of 2017 Cycle, issued in December 2016 IFRIC 22 - Foreign currency transactions Endorsement expected by the third quarter of 2017 and advance consideration, issued in December 2016 Amendments to IAS 40: Transfers of investment Endorsement expected by the third quarter of 2017 property issued in December 2016 Adoption of the above standards will not significantly affect the Group s consolidated financial statements, except for IFRS 9, IFRS 15 and IFRS 16, for which brief information is provided below. The parent has started the process to implement these standards, defining the organisational methods and timing therefor. 148 Annual Report as at 31 December 2016
150 Consolidated financial statements as at and for the year ended 31 December 2016 During the year, the parent held training courses about IFRS 15 and IFRS 16 in particular for managers of various internal departments (procurement, IT, planning and controls, tax and accounting) who are involved in implementing the new standards. The Group is currently assessing the effects of adopting these new standards on its consolidated financial statements. Moreover, the new standards will significantly change the disclosures provided in the notes. IFRS 9 - Financial instruments The IASB published the final version of IFRS 9 - Financial instruments in July The standard is applicable to annual reporting periods beginning on or after 1 January Early adoption is allowed. IFRS 9 introduces new rules for the classification and measurement of financial instruments, especially financial assets, based on the business model under which they are held and their cash flow characteristics. The standard classifies financial assets into three main categories: amortised cost, fair value through other comprehensive income and fair value through profit or loss. The categories envisaged by IAS 39, i.e., held-to-maturity, loans and receivables and available-for-sale have been eliminated. The standard introduces the measurement of impairment losses using the expected credit loss model rather than the incurred loss model provided for under IAS 39. The new model entails a significant degree of judgement about the impact of changes in economic factors on the expected credit losses, which are weighted by probability. IFRS 9 also introduces a new hedge accounting model aligned to the entity s risk management policies. The exemption from application of the fair value measurement to unlisted equity investments has been eliminated. The standard also requires new and more detailed disclosures about hedge accounting, credit risk and expected credit losses. The standard is applicable to annual reporting periods beginning on or after 1 January 2018 and shall be applied retrospectively, with the possibility to use some simplifications. IFRS 15 - Revenue from contracts with clients The IASB issued the new standard in May 2014 to unify in one standard the rules for revenue recognition previously included in several standards and interpretations (including IAS 18 - Revenue, IAS 11 - Contract work in progress and IFRIC 13 - Customer loyalty programmes). 149 Annual Report as at 31 December 2016
151 Consolidated financial statements as at and for the year ended 31 December 2016 IFRS 15 provides that revenue is to be recognised using a five-step model as set out below: 1. identify the contract with a customer 2. identify the performance obligations (distinct elements that are part of a single contract but are separated for accounting purposes) in the contract 3. determine the transaction price 4. allocate the transaction price to the performance obligations in the contract 5. recognise revenue when (or as) the entity satisfies a performance obligation. IFRS 15 also covers contractual costs, contract modifications and financial statements disclosures. IFRS 15 is applicable to the annual periods beginning on or after 1 January Early adoption is allowed. The original version of the standard was approved in September 2016 while some amendments published in the same year should be endorsed by the EU in IFRS 16 - Leases The IASB issued this standard in January It introduces a single method to account for leases in the financial statements of the lessee, eliminating the distinction between operating and finance leases, so that the lessee recognises an asset for the right to use an underlying asset and a lease liability. The standard includes exemptions when the lease term is 12 months or less or the underlying asset has a low value. IFRS 16 replaces the current standards on leases, including IAS 17 - Leases, IFRIC 4 - Determining whether an arrangement contains a lease, SIC 15 - Operating leases - Incentives and SIC 27 - Evaluating the substance of transactions in the legal form of a lease. IFRS 16 is applicable to the annual periods beginning on or after 1 January Early application is permitted if IFRS 15 has also been applied. Endorsement by the EU is expected in Non-current assets held for sale and discontinued operations USW Campania Based on information that came to light in previous years and like in previous financial statements, the Group decided that the conditions for application of IFRS 5 - Non-current assets held for sale and discontinued operations continued to exist. Therefore, it has recognised the USW Campania project net assets and operations separately in the statement of financial position and income statement. 150 Annual Report as at 31 December 2016
152 Consolidated financial statements as at and for the year ended 31 December 2016 Due to reasons outside the Group s control, the period for completion of the sale has extended beyond the year allowed by IFRS 5. Despite this, the Group s commitment to finalising the sale as described in the Annual Report remains unchanged. Therefore, the directors have not deemed it necessary to change the accounting treatment of the assets in question as provided for in IFRS 5.9. Reference should be made to the section on the Main risk factors and uncertainties in the Directors report for more information. Todini Group The parent completed the sale of Todini Costruzioni Generali to Prime System Kz Ltd., set up and organised under Kazakstani law, for about 51 million on 4 April In March 2016, before the sale, Todini Costruzioni Generali s assets not sold to third parties were transferred to a newco HCE Costruzioni S.p.A. ( HCE ), which was subsequently sold to Salini Impregilo. Therefore, at the transaction date, Todini Costruzioni Generali solely consisted of the assets and liabilities of the foreign business unit, i.e., the projects and branches operating in Georgia, Azerbaijan, Belarus and Kazakhstan, including the carrying amount of the investments in the subsidiaries carrying out the relevant projects, JV Todini Takenaka and Todini Central Asia, as well as some operating assets either owned directly by the Group or leased. The assets transferred to HCE included those belonging to Business unit A - Contracts in Italy, which include the Metrocampania (Naples Alifana and Secondigliano) contracts, the Valico crossing and Naples Sarno River contracts and the plant and machinery at the Lungavilla depot. The activities that Todini Costruzioni Generali transferred to HCE (Business A) were classified as assets held for sale in the consolidated financial statements at 31 December 2015 based on the expressions of interest received at that date. Given the status of the negotiations, the HCE assets have been classified under continuing operations in the 2016 consolidated financial statements. Therefore, it was necessary to restate the comparative figures for 2015 to be consistent with this approach used in 2016 pursuant to IFRS 5. Impregilo International Infrastructures NV At the reporting date, the Group has accrued 6.6 million for this subsidiary s tax disputes related to operations classified as discontinued in previous years. 151 Annual Report as at 31 December 2016
153 Consolidated financial statements as at and for the year ended 31 December Basis of presentation The Group s consolidated financial statements include the financial statements of the parent, Salini Impregilo, and the Italian and foreign operating companies controlled directly or indirectly by Salini Impregilo. The financial statements at 31 December 2016 approved by the internal bodies of the consolidated companies, where applicable, have been used for consolidation purposes. The financial statements are prepared by adopting the parent s accounting policies. Where necessary, consolidation adjustments are made to make the items affected by different accounting policies consistent. A list of the companies and other Salini Impregilo Group entities included in the consolidation scope is set out in the annexes with the schedules showing changes therein during the year. Consolidated financial statements The Group opted to present its consolidated financial statements at 31 December 2016 in line with previous years as follows: Current and non-current assets and current and non-current liabilities are presented separately in the statement of financial position. Current assets and liabilities are those expected to be realised, sold, used or settled in the Group s normal operating cycle, which usually exceeds 12 months. Noncurrent assets and liabilities include non-current assets, deferred tax assets, employee benefits, deferred tax liabilities and other balances expected to be realised, sold, used or settled after the Group s normal operating cycle, i.e., more than twelve months after the reporting date. The income statement gives a classification of costs by nature and shows the profit or loss before Financing income (costs) and gains (losses) on equity investments and income taxes. The profit or loss from continuing operations, the profit or loss from discontinued operations and the profit or loss attributable to non-controlling interests and that attributable to the owners of the parent are also presented. The statement of comprehensive income shows all non-owner changes in equity. The statement of cash flows presents the cash flows from operating, investing and financing activities separately. The indirect method is used. 152 Annual Report as at 31 December 2016
154 Consolidated financial statements as at and for the year ended 31 December 2016 Basis of consolidation The consolidated financial statements have been prepared by consolidating the financial statements at 31 December 2016 of Salini Impregilo, the parent, and the Italian and foreign companies which the parent directly or indirectly controls. Control exists when the Group has the power to govern, directly or indirectly, the financial and operating policies of an entity so as to obtain benefits from its activities. Generally speaking, control is presumed to exist when the Group holds more than half of the voting rights either directly or indirectly. Entities or companies over which Salini Impregilo has joint control, by virtue of an investment therein or specific contractual arrangements, are consolidated as follows pursuant to IFRS 11: on a line-by-line basis according to the investment percentage, if they are joint operations; at equity, if they are joint ventures. Investments in associates are measured using the equity method. The financial statements used for consolidation are modified (made consistent) and reclassified to comply with the Group s accounting policies in line with the currently applicable IFRS. The financial statements used are expressed in the functional currency, being the local currency or another currency in which most of the economic transactions and assets and liabilities are denominated. Financial statements expressed in currencies other than the Euro are translated into Euros by applying the closing rates to the statement of financial position items and the average annual rates to the income statement items, as these approximate the spot rates. Differences arising from the translation of the opening equity using the closing rates and from the translation of assets and liabilities at the spot rate and the income statement items at the average annual rate are taken to the translation reserve. 153 Annual Report as at 31 December 2016
155 Consolidated financial statements as at and for the year ended 31 December 2016 The exchange rates used to translate the foreign currency financial statements into Euros are as follows: Currency Closing rate average Closing rate average December 2016 rate December 2015 rate ZAR South Africa Rand BRL Brazilian Real COP Colombian Peso 3, , , , PEN Nuevo Sol AED United Arab Emirates Dirham ARS Argentine Peso AUD Australian Dollar BGN Bulgarian New Lev DZD Algerian Dinar INR Indian Rupee LYD Libyan Dinar MYR Malaysian Ringgit NGN Nigerian Naira PES Chilean Peso PLN Polish Zloty RUB Russian Ruble SAR Saudi Riyal SGD Singapore Dollar TRY Turkish Lira (new) USD US Dollar NAM Namibian Dollar CHF Swiss Franc GBP British Pound DOP Dominican Peso PKR Pakistani Rupee QAR Qatari Riyal DICOM Venezuela Reference should be made to the information provided earlier about the use of the DICOM (formerly the SIMADI) as the exchange rate for the Venezuelan currency. When an investment in a consolidated entity is sold, the accumulated gain or loss recognised in equity is released to profit or loss. 154 Annual Report as at 31 December 2016
156 Consolidated financial statements as at and for the year ended 31 December 2016 The consolidation criteria used to prepare these consolidated financial statements may be summarised as follows: Subsidiaries are consolidated on a line-by-line basis, whereby: - assets and liabilities, costs and revenue shown in the subsidiaries financial statements are fully recognised, regardless of the size of the investment therein; - the carrying amount of the investment is eliminated against the Group s share of its equity; - the main transactions between consolidated entities, including dividends distributed among group companies, are eliminated; - non-controlling interests are shown separately under equity and their share of the profit or loss for the year is similarly shown separately in the income statement. Investments in associates and joint ventures are measured using the equity method whereby the carrying amount of the investment is adjusted to consider: - the parent s share of the profits or losses of the investee realised after the acquisition date; - modifications arising from changes in equity of the investee that are not taken to profit or loss as per the relevant IFRS; - dividends distributed by the investees; - any greater value paid at acquisition (measured using the same criteria set out in the section on Business combinations ) and managed pursuant to the relevant standard; - the share of the profit or loss deriving from application of the equity method, which is taken to profit or loss; - standardisation to comply with the group accounting policies, where necessary. Interests in joint ventures that qualify as joint operations are recognised by the investor to the extent of its share of the rights and obligations held. Dividends, reversals of impairment losses and impairment losses on investments in consolidated companies, gains and losses on the intragroup exchange of investments in consolidated entities are eliminated. 155 Annual Report as at 31 December 2016
157 Consolidated financial statements as at and for the year ended 31 December 2016 Gains and losses arising from transactions between consolidated companies, which are not realised directly or indirectly through transactions with third parties, are eliminated. Unrealised intragroup losses are recognised when the transaction shows an impairment of the transferred asset. Business combinations Business combinations are recognised using the acquisition method set out in IFRS 3 (revised in 2008). Accordingly, the consideration for a business combination is measured at fair value, being the sum of the fair value of the assets acquired and liabilities assumed or incurred by the Group at the acquisition date and the equity instruments issued in exchange for control of the acquired entity. Transaction costs are recognised in profit or loss when incurred. The contingent consideration, included as part of the transfer price, is measured at acquisition-date fair value. Any subsequent changes in fair value are recognised in profit or loss. The identifiable assets acquired and the liabilities assumed are recognised at their acquisition-date fair value. Goodwill is measured as the difference between the aggregate of the consideration transferred, the amount of any non-controlling interests (NCI) and the acquisition-date fair value of the acquirer s previously-held equity interest in the acquiree and the net fair value of the acquisition-date amounts of the identifiable assets acquired and the liabilities assumed. If the difference is negative, the resulting gain is recognised as a bargain purchase in profit or loss. NCI can be measured at fair value or at its proportionate share of the fair value of the net assets of the acquiree at the acquisition date. The measurement method is decided on a transaction by transaction basis. Business combination achieved in stages (step acquisition) In the case of step acquisitions, the Group s existing investment in the acquiree is measured at fair value on the date that control is obtained. Any resulting adjustments to previously recognised assets and liabilities are recognised in profit or loss. Therefore, the previously held investment is treated as if it had been sold and reacquired on the date that control is obtained. Transactions involving NCI Changes to the investment percentage of a subsidiary that does not entail loss of control are treated as equity transactions. Therefore, any differences between the acquisition price and the related share of equity in subsequent acquisitions of investments in entities already controlled by the Group are 156 Annual Report as at 31 December 2016
158 Consolidated financial statements as at and for the year ended 31 December 2016 recognised directly in equity. With respect to partial disposals of an investment in a subsidiary while control is retained, any gain or loss is recognised in equity. Basis of preparation The accounting policies adopted to draw up the Group s consolidated financial statements at 31 December 2016 comply with the IFRS and are consistent with those used to prepare the 2015 consolidated financial statements, except for the standards enacted after 1 January 2016 summarised in the section on the Changes in standards. Accounting policies Property, plant and equipment Salini Impregilo Group has opted to recognise property, plant and equipment at purchase or production cost net of accumulated depreciation and any impairment losses. Depreciation is calculated on a straight-line basis using rates determined based on the assets residual possible use. The annual rates are as follows: Category Depreciation rate Land 0% Buildings 3% Plant and machinery from 10% to 20% Industrial and commercial equipment from 25% to 40% Other assets from 12% to 25% Land and buildings, plant and machinery with a carrying amount to be recovered mainly through their sale (rather than the asset s continuing use) are measured at the lower of their carrying amount and fair value less costs to sell. Assets held for sale shall be available for immediate sale and their sale shall be highly probable (i.e., the related commitments already exist). Their price shall be reasonable compared to their fair value. Assets acquired as a result of business combinations are recognised at fair value at the acquisition date and remeasured within a year. Such amount reflects their purchase cost. After their initial recognition, they are measured at cost, depreciated over their estimated useful lives and shown net of any impairment losses. When an asset consists of different significant components with different useful lives, the significant components are recognised and subsequently measured separately. 157 Annual Report as at 31 December 2016
159 Consolidated financial statements as at and for the year ended 31 December 2016 The carrying amount of property, plant and equipment is tested for impairment whenever events or changes in circumstances take place indicating that the carrying amount may not be recovered. Reference should be made to the section on Impairment of non-financial assets for details on impairment testing. Borrowing costs directly related to the acquisition or construction of an asset are capitalised as part of the cost of the asset, to the extent of its recoverable amount. As established by IAS 23 - Borrowing costs, the Group has applied this method to all qualifying assets. Borrowing costs are capitalised when the costs of the acquisition of the asset and borrowing costs are incurred, and the activities necessary to bring the asset to a condition for its use have been started. The costs provided for but not yet paid related to qualifying assets are excluded from the amount to be capitalised. Capitalisation of borrowing costs is suspended during extended periods in which active development is interrupted. Moreover, capitalisation of borrowing costs ceases when substantially all the activities necessary to prepare the qualifying asset for its intended use or sale are complete. Subsequent expenditure is only capitalised if it increases the future economic benefits of the related asset. All other expenditure is expensed when incurred. Ordinary maintenance costs are fully expensed when incurred. Costs that increase the carrying amount of assets are allocated thereto and depreciated over their residual economic lives. Dismantlement and restoration costs of assets used for contract work in progress are added to the cost of the related asset and depreciated in line with the depreciation pattern of the asset to which they refer when they are foreseeable and objectively determinable. Leasehold improvements are classified in the different items of property, plant and equipment on the basis of their nature. They are depreciated over the shorter of the estimated useful life of the relevant asset and the residual term of the lease. Leased property, plant and equipment Assets held under finance leases whereby all the risks and rewards of ownership are substantially transferred to the Group are recognised as group assets and classified as property, plant and equipment. The related liability to the lessor is shown under financial liabilities. 158 Annual Report as at 31 December 2016
160 Consolidated financial statements as at and for the year ended 31 December 2016 The lease payment is split into the interest expense, taken to the income statement, and the principal repayment, offset against the financial liability. The carrying amount of the leased asset is determined considering its fair value or, if lower, the present value of the minimum future lease payments. The depreciation method and subsequent measurement are consistent with those applied to non-leased assets. Leases where the lessor retains all the risks and rewards of ownership are treated as operating leases. The initial negotiation costs incurred for this type of lease increase the value of the related lease and are recognised over the lease term in order to match the revenue generated by the leased asset. Operating lease payments are recognised as an expense in the income statement on a straight-line basis over the lease term. Rights to infrastructure under concession These rights are covered by IFRIC 12 - Service concession arrangements, issued by the International Financial Reporting Interpretations Committee (IFRIC), which regulates the recognition and measurement of concession arrangements between public sector entities and private sector operators. It was endorsed by the European Commission with EC regulation 254/2009 dated 25 March 2009 and its application is mandatory for financial statements drawn up under IFRS beginning from the year after which it was endorsed. Therefore, the Group has applied IFRIC 12 since The criteria adopted by the Group to apply the interpretation to its concessions are set out below. Scope and measurement Scope: IFRIC 12 is applicable to service concession arrangements when the grantor is a public body and the operator is a private entity, when the following conditions are met: a) the grantor controls or regulates what services the operator must provide with the infrastructure, to whom it must provide them, and at what price; and b) the grantor controls through ownership, beneficial entitlement or otherwise - any significant residual interest in the infrastructure at the end of the term of the arrangement. Measurement of the revenue arising from the concession arrangement: the operator acts as the service provider (construction and management of the work) and recognises the revenue for the construction and upgrade services in accordance with IAS 11 - Construction contracts and the revenue from management of the infrastructure in line with IAS 18 - Revenue. 159 Annual Report as at 31 December 2016
161 Consolidated financial statements as at and for the year ended 31 December 2016 The grantor pays the operator a consideration for the construction/upgrade services, to be recognised at fair value, which may consist of rights to: (a) a financial asset (financial asset model); (b) an intangible asset (intangible asset model); (c) both ( mixed model). The first model is applicable when the operator has an unconditional contractual right to receive a specified or determinable amount of cash. The second is applicable when the operator acquires the right to charge for use of a public sector asset that it constructs or upgrades. The amounts are contingent on the extent to which the public uses the service (demand risk). Finally, the third model is applicable when both of the above situations are present. In this case, the intangible asset is determined as the difference between the fair value of the investment made and the present value of the financial asset obtained by discounting the cash flows from the minimum specified amount. The Group s concession arrangements (via the operators consolidated on a line-by-line or proportionate basis) fall under the intangible asset model except for two immaterial concessions held by the subsidiaries of HCE Costruzioni Generali S.p.A., wholly owned by the parent, which fall under the mixed model. The financial asset model is applicable to certain equity-accounted associates. Recognition of the intangible asset: the intangible asset is recognised during construction of the infrastructure. The main identified cases are as follows: a. Arrangements that cover the construction of a new infrastructure: the operator recognises the intangible asset in line with the stage of completion of the construction project. During construction, the operator recognises revenue and costs in line with IAS 11 - Construction contracts. b. Arrangements that cover management of an existing infrastructure and its extension or upgrading against which the operator acquires specific additional financial benefits: the operator recognises an increase in the intangible asset as the construction services are provided for these construction and/or upgrade services to be recognised under IAS 11 - Construction contracts. c. Arrangements that cover management of an existing infrastructure and specific obligations to extend or upgrade it against which the operator does not acquire additional specific financial benefits: at initial recognition, the operator recognises a liability equal to the present value of the forecast outlay for the construction services to be provided in the future with, as a balancing 160 Annual Report as at 31 December 2016
162 Consolidated financial statements as at and for the year ended 31 December 2016 item, an additional component of the intangible asset for the contract consideration, which begins to be amortised. Contractual obligations for the infrastructure s efficiency levels: given that the operator does not meet the requirements for recognition of the infrastructure as Property, plant and equipment, the accounting treatment differs depending on the nature of the work carried out and can be spit into two categories: (i) work related to normal maintenance of the infrastructure; (ii) replacement and scheduled maintenance at a future date. The first category relates to normal ordinary maintenance of the infrastructure, the cost of which is recognised in profit or loss when incurred, also under IFRIC 12. Given that the interpretation does not provide for the recognition of the physical asset but of a right, the second category is recognised in line with IAS 37 - Provisions, contingent liabilities and contingent assets, which requires: (i) recognition of an accrual to a provision in profit or loss; and (ii) recognition of a provision for charges in the statement of financial position. Amortisation of the intangible asset: amortisation of the intangible asset recognised for the rights acquired under the concession arrangement is calculated in line with paragraph 97 of IAS 38 - Intangible assets: The amortisation method used shall reflect the pattern in which the asset s future economic benefits are expected to be consumed by the entity. If that pattern cannot be determined reliably, the straight-line method shall be used. Goodwill and intangible assets with indefinite lives Goodwill and other intangible assets with indefinite lives are recognised at cost net of impairment losses. Goodwill acquired as part of a business combination is measured as the difference between the aggregate of the acquisition-date fair value of the consideration considered, the amount of any NCI and the acquisition-date fair value of the acquirer s previously-held equity interest in the acquiree, and the net of the acquisition-date amounts of the identifiable assets acquired and the liabilities assumed. Goodwill deriving from acquisitions is not amortised. It is tested annually for impairment or whenever conditions arise that presume impairment as per IAS 36 - Impairment of assets. For impairment testing purposes, goodwill acquired as part of a business combination is allocated at the acquisition date to each of the cash-generating units (or groups of cash-generating units - CGU) that will benefit from the acquisition. The carrying amount of goodwill is monitored at cash-generating unit level for internal management purposes. 161 Annual Report as at 31 December 2016
163 Consolidated financial statements as at and for the year ended 31 December 2016 Impairment is determined by defining the recoverable amount of the cashgenerating unit (or group of units) to which the goodwill is allocated. When the recoverable amount of the CGU (or group of CGUs) is lower than the carrying amount, an impairment loss is recognised. When goodwill is allocated to a CGU (or group of CGUs), the asset of which has been partly disposed of, the goodwill allocated to the disposed of asset is considered to determine any gain or loss deriving from the transaction. In this case, the transferred goodwill is measured using the amounts related to the disposed of asset compared to the asset still held by the unit. Other intangible assets Other intangible assets acquired or generated internally are recognised under assets in accordance with IAS 38 - Intangible assets when it is probable that the use of the asset will generate future economic benefits and the cost of the asset can be measured reliably. Those assets with finite useful lives are measured at acquisition or development cost and amortised on a straight-line basis over their estimated useful lives. Recoverability of their carrying amount is checked by using the criteria set out in the section on Impairment of non-financial assets. The excess of the purchase cost compared to the Group s share of the net fair value of the business units acquired in the past is classified as other intangible assets and mainly refers to acquisition costs of the business units purchased. The related amortisation is calculated in line with the stage of completion and duration of the work. Other non-current assets (recognised in Other assets) Other non-current assets mainly consist of loans and receivables and claims related to completed or nearly completed contracts and companies in liquidation when their liquidation plan provides for the realisation of the assets after twelve months from the reporting date. These assets are measured at their estimated realisable value, by recognising allowances to adjust their carrying amount accordingly. Claims are only recognised for the amounts matured and that part which is held to be reasonably recoverable. The estimated realisable value is discounted if the time value of money is material depending on when settlement is expected to take place. Impairment of non-financial assets If there is any indication that an intangible asset or an item of property, plant and equipment is impaired, the recoverable amount of the asset is estimated to determine the amount of the impairment loss. Goodwill is tested at least annually for impairment. The recoverable amount of an asset is the higher of its fair value less costs to sell and its value in use. 162 Annual Report as at 31 December 2016
164 Consolidated financial statements as at and for the year ended 31 December 2016 If a binding sales agreement does not exist, fair value is estimated using the observable prices of an active market, recent transactions or the best information available to reflect the amount the entity could obtain by disposing of the asset. Value in use is determined by discounting the estimated future cash flows expected to arise from the continuing use of an asset, net of taxes, and, if reasonably determinable, from its disposal at the end of its useful life. Discounting is applied by using a post-tax discount rate which reflects the current market assessments of the time value of money and the risks specific to the asset. The assessment is made for individual assets or the smallest identifiable group of assets that generates cash inflows that are largely independent of the cash inflows from other assets or groups of assets from its continuing use (cashgenerating unit). An impairment loss is recognised when the recoverable amount is lower than the carrying amount. If the reasons for the impairment loss are no longer valid, the impairment loss (except in the case of goodwill) is reversed and the adjustment is taken to profit or loss as a reversal of impairment losses. A reversal of impairment losses is recognised to the extent of the lower of the recoverable amount and original carrying amount less depreciation/amortisation that would have been recognised had the impairment loss not been recognised. Inventories of goods Inventories of goods are measured at the lower of average purchase cost and net realisable value. Cost includes the directly related costs and estimated realisable value is determined using the replacement cost of the asset or similar assets. Any write-downs are eliminated in subsequent years when the reasons therefor are no longer valid. Contract work in progress and revenue from construction contracts Contract work in progress consists of work performed net of progress billings issued to clients. When final payment of the consideration is made, the related progress billings and advances are recognised under Operating revenue in the income statement, with the related variation in inventories. The provision for contractual risks directly offsets inventories and is set up to cover possible charges and losses on contracts performed either directly by the company or as part of a joint venture. Contract work in progress is measured considering the consideration agreed with the customer and the stage of completion of the work. Revenue related to contract work in progress is recognised using the stage of completion method. 163 Annual Report as at 31 December 2016
165 Consolidated financial statements as at and for the year ended 31 December 2016 The stage of completion is determined using the cost to cost method whereby the percentage of completion (the ratio between costs incurred and total estimated costs) is applied to the total estimated revenue. Given the technical complexity, size and length of time involved in completing contracts, the additional considerations are measured before an agreement is reached with the customer. Claims for additional considerations are considered when measuring contract work in progress if they have been substantially approved by the customer, or, if not yet approved by the customer, are supported by appraisals made by third party consultants and/or documentation prepared by contractual bodies (arbitration tribunals, dispute review boards, dispute adjudication boards, etc.). In the case of events that take place after the reporting date but before the consolidated financial statements are approved, which provide additional information about expected profits or losses on the contract, this additional information is considered when determining the contractual revenue or costs to be incurred to complete the contract and for the recognition of any profits or losses. When total contract costs exceed total contract revenue, the loss to complete the contract is recognised as an expense immediately. The contract costs, included in the cost to cost calculation, may be classified as: pre-operating costs, which include costs incurred during the start-up stage of the contract, before construction starts, such as the costs of design and specific studies carried out for the contract; organisation and production startup costs and building site start-up costs. These pre-operating costs are included in the stage of completion calculation and in the cost to cost calculation once they have been incurred. During the initial stage of the contract, they are included in the carrying amount of contract work in progress, if recoverable, without recognising any contract output when the contract profit or loss cannot be reliably estimated; contract operating costs, which include those directly attributable to the contract (e.g., materials, subcontracting, labour, amortisation and depreciation, compulsory purchases, any directly attributable borrowing costs, etc.). They are recognised on an accruals basis and included in the calculation of the stage of completion; post-operating costs, which include site dismantlement costs generally incurred after the contract has been closed to remove the installations (or entire sites) and to return the machinery or plant to the Group s premises or transfer them to another site. This category also includes losses on abandoned materials and the cost of transporting unused materials. They are included in the contract estimate and, therefore, if incurred during the 164 Annual Report as at 31 December 2016
166 Consolidated financial statements as at and for the year ended 31 December 2016 contract term, they are comprised in the calculation of the progress billings. Therefore, no specific accruals are made to the income statement; costs for services to be rendered after completion of the contract, which mainly relate to services rendered after the contract has been completed. They may include assistance and supervision provided in the early stages of use of the plant or scheduled maintenance. If the contract does not include specific additional considerations for these services and the contract may be closed for accounting purposes (contracts are usually closed once work is completed and the customer has accepted the end result), the costs to be incurred to render these services when the contract is closed in the accounting records should be estimated and provided for in the specific items. These costs are included in the calculation to determine the contract revenue. Real estate projects Closing inventories of real estate projects are those real estate areas developed with a view to selling them. They are measured at the lower of cost and estimated realisable value. Costs incurred consist of the consideration paid for purchasing the areas and related charges, construction costs and borrowing costs related to the project up to and not exceeding its completion. Financial assets and liabilities Measurement and presentation of financial instruments are covered by IAS 39 and IAS 32, respectively. The Group introduced the disclosure required by IFRS 7 in The financial instruments used by the Group are classified as follows: financial assets or financial liabilities at fair value through profit or loss, loans and receivables, held-to-maturity investments and available-for-sale financial assets. Financial assets or financial liabilities at fair value through profit or loss This category includes derivatives that do not meet hedge accounting requirements. Fair value gains or losses on derivatives in this category are recognised as Financing income (costs) in profit or loss when they arise. Loans and receivables Loans and receivables are non-derivative financial assets with fixed or determinable payments that are not quoted on an active market. They are measured at amortised cost, as detailed further on, and any gains or losses arising therefrom are recognised as Financing income (costs) in profit or loss. 165 Annual Report as at 31 December 2016
167 Consolidated financial statements as at and for the year ended 31 December 2016 This category includes the following items: Trade receivables and payables and other assets and liabilities Trade receivables and other assets are recognised at amortised cost, net of impairment losses determined on the basis of their estimated recoverable amount calculated by analysing each position and the total non-collection risk. If the collection date is postponed and exceeds normal collection times for the sector, these receivables are discounted. All factored receivables that do not meet the requirements for derecognition under IAS 39 continue to be recognised in the Group s consolidated financial statements even when they have been legally transferred. They are thus included as assets and a financial liability of the same amount is recognised. Trade payables and other liabilities are recognised at amortised cost, allocating interest to the income statement based on the effective interest rate, being the rate that exactly discounts estimated future cash payments through to the carrying amount of the related asset. Cash and cash equivalents Cash and cash equivalents comprise cash on hand, demand deposits and other short-term, highly liquid investments with a term of less than three months. This item is shown in the statement of cash flows net of bank borrowings at the reporting date. Loans and borrowings and bonds Loans and borrowings and bonds are initially recognised at cost, being the fair value of the consideration received less transaction costs. After initial recognition, loans are measured at amortised cost, whereby repayments are determined using the effective interest method with a rate which matches, at initial recognition, the expected cash flows with the initial carrying amount. Loan transaction costs are classified under liabilities decreasing the loan; amortised cost is calculated considering these costs and any discounts or premiums expected at settlement. The effects arising from the recognition at amortised cost are taken to Financing income (costs). Held-to-maturity investments Held-to-maturity investments are non-derivative financial assets with fixed or determinable payments and fixed maturity that the Group has the positive intention and ability to hold to maturity. They are recognised at amortised cost and interest accrued thereon is taken to profit or loss under Financial income using the effective interest method. 166 Annual Report as at 31 December 2016
168 Consolidated financial statements as at and for the year ended 31 December 2016 Available-for-sale financial assets Available-for-sale financial assets are non-derivative financial instruments that are not classified in the other categories. They include the following items: Equity investments Investments in entities other than subsidiaries, associates, joint operations and joint ventures (reference for which should be made to the section on Consolidation scope ) are classified as Equity investments at the time of their acquisition and are included in the available-for-sale financial assets category required by IAS 39. Since they mainly relate to consortia and consortium companies of which the Group holds less than 20%, in accordance with IAS 39, such investments are stated as non-current assets measured at cost, adjusted for impairment, since their fair value cannot be determined. Investments in listed companies belonging to this category are measured at fair value and the related fair value gains or losses are recognised in equity. Material or prolonged decreases in their fair value that are evidence of impairment are, therefore, transferred from equity to profit or loss and offset against the relevant reserve. Dividend income from such financial instruments is recognised in profit or loss under financial income when the group companies holding the investments are given the right to such dividend. Fair value of financial instruments The fair value of financial instruments has been estimated as follows: The fair value of financial instruments traded on an active market is based on the market price at the reporting date. This method has been applied especially to listed financial instruments classified as Available-for-sale financial assets and financial instruments classified as Held-to-maturity investments. The fair value of the derivatives classified as Hedging derivatives and Financial assets and financial liabilities at fair value through profit or loss is measured using the Discounted Cash Flow Model. With respect to interest rate swaps, future cash flows are estimated using the implicit forward rate of the market Euro curve at 31 December 2016 and 2015, while the forward exchange rate market prices at the relevant reporting date are used for currency forward transactions. The fair value of loans and receivables is determined, for disclosure purposes in the notes, on the basis of the present value of their future cash flows discounted at a rate equal to the current interest rates applicable in 167 Annual Report as at 31 December 2016
169 Consolidated financial statements as at and for the year ended 31 December 2016 the relevant markets and the average spread agreed by the Group. The fair value measurement of loans takes account of the Group s credit risk and uses the rate curves in the different currencies with reference to the reporting date. Derecognition of financial assets and liabilities (a) Financial assets. A financial asset (or, where applicable, part of a financial asset or parts of a group of similar financial assets) is derecognised when: (i) the contractual rights to the cash flows from the financial asset expire; (ii) the Group retains the contractual rights to receive the cash flows of the financial asset, but assumes a contractual obligation to pay the cash flows to one or more recipients in full and immediately; (iii) the Group transfers the contractual rights to receive the cash flows of the asset and has transferred substantially all the risks and rewards of ownership of the financial asset and the related control. When the Group has transferred the contractual rights to receive the cash flows of the financial asset and has neither transferred nor retained substantially all the risks and rewards or has retained control, it continues to recognise the asset to the extent of its continuing involvement in the asset. Continuing involvement that takes the form of guaranteeing the transferred asset is measured at the lower of the initial carrying amount of the asset and the maximum amount of the consideration that the Group could be required to pay. (b) Financial liabilities Financial liabilities are derecognised when the underlying obligation is extinguished, cancelled or settled. When an existing financial liability is exchanged with another by the same lender at substantially different terms, or the terms of an existing liability are substantially modified, this exchange or modification is treated as an extinguishment of the original financial liability and the recognition of a new financial liability. The difference between the carrying amounts is recognised in profit or loss. Impairment of financial assets If there is any indication that a financial asset is impaired, the recoverable amount of the asset is estimated to determine the amount of the impairment loss. 168 Annual Report as at 31 December 2016
170 Consolidated financial statements as at and for the year ended 31 December 2016 Derivatives and hedging transactions Salini Impregilo Group has derivatives recognised at fair value when the related agreement is signed and for subsequent fair value changes. The treatment of the related fair value gains or losses changes depending on whether the conditions for hedge accounting are met, as described below. Salini Impregilo Group has derivatives to hedge currency and financial risks. At the inception of the transaction, it documents the hedging relationship, its risk management and strategy objectives in entering into the transaction, the hedging instrument and hedged item or transaction and the nature of the hedged risk. Moreover, at the inception of the transaction and thereafter on an ongoing basis, the Group documents whether or not the hedge meets the effectiveness requirements to offset its exposure to changes in the fair value of the hedged item or cash flows attributable to the hedged risk. Based on the above-mentioned documentation, derivatives used for specific hedging purposes are classified and recognised as follows: (a) Fair value hedge - If a derivative is designated as a hedge of exposure to changes in the fair value of an asset or liability due to a specific risk that may affect profit or loss, the gain or loss deriving from the subsequent measurement of the fair value of the hedging instrument is recognised in profit or loss. The gain or loss on the hedged item, related to the hedged risk, changes the carrying amount of this item and is recognised in profit or loss. (b) Cash flow hedge - If a derivative is designated as a hedge of exposure to changes in cash flows of an asset or liability or a highly probable transaction that could affect profit or loss, the effective part of the gains or losses on the financial instrument is recognised in equity. The cumulative gain or loss is reclassified from equity to profit or loss in the same period in which the hedged transaction is recognised. The gain or loss related to a hedge or part of a hedge which has become ineffective is taken to profit or loss immediately. If a hedging instrument or a hedging relationship is closed, but the hedged transaction has not yet taken place, the cumulative gains and losses, recognised in equity up to then, are reclassified to profit or loss when the transaction takes place. If it is unlikely the hedged transaction will take place, the unrealised gains and losses recognised in equity are immediately reclassified to profit or loss. Hedging purposes are assessed in strategic terms. When they do not meet the requirements of IAS 39 for hedge accounting, the derivatives are classified as Financial assets or financial liabilities at fair value through profit or loss. 169 Annual Report as at 31 December 2016
171 Consolidated financial statements as at and for the year ended 31 December 2016 Employee benefits Defined benefit plans and defined contribution plans The Group has pension plans for its employees that are classified either as defined benefit plans or defined contribution plans depending on their characteristics. Defined benefit plans include the benefits the employees will receive when they retire and which are usually dependent on one or more factors such as age, years of service and remuneration. The Group recognises a liability for these defined benefits equal to the present value of its obligation at year end, including any adjustments for unrecognised costs related to past service less the fair value of the plan assets. The Group calculates its liability once a year using the projected unit credit method. Present value is calculated by discounting the future outlays using the interest rate applied to high quality corporate bonds with a currency and term consistent with the currency and estimated term of the post-employment benefit obligations. Actuarial gains and losses on defined benefit plans arising from changes in the underlying assumptions or in the plan conditions are recognised in other comprehensive income in the period in which they arise. Past service cost is expensed immediately. The Group pays benefits to public and private pension funds on an mandatory, contractual or voluntary basis for the defined contribution plans. The contributions are recognised as personnel expense. The Group contributes to multi-employer pension plans via its US subsidiaries. These plans pool the assets contributed by the various entities to provide benefits to the employees of more than one entity determining the contribution and benefit levels without regard to the identity of the entity that employs the employees concerned. The Group recognises these plans as defined contribution plans. Short-term and long-term benefits Short-term employee benefits, that is, payable within twelve months of the end of the year in which the employees rendered the service, are recognised as a cost and as a liability for the undiscounted amount of benefits expected to be paid in exchange for that service. Long-term benefits, such as remuneration to be paid after twelve months of the end of the year in which the employees rendered the service, are recognised as liabilities for an amount equal to the present value of the benefits at the reporting date. Post-employment benefits Post-employment benefits are recognised at the present value of the Group s liability determined in line with ruling legislation and national and in-house labour agreements. The valuation, based on demographic, financial and turnover assumptions, is carried out by independent actuaries. The gains and 170 Annual Report as at 31 December 2016
172 Consolidated financial statements as at and for the year ended 31 December 2016 losses resulting from the actuarial calculation are recognised in profit or loss if related to service costs and interest expense or in comprehensive income if relating to assets and liabilities. The 2007 Finance Act and related implementing decrees introduced significant changes to legislation governing Italian post-employment benefits, effective as from 1 January These include the option given to employees, to be exercised before 30 June 2007, of where to allocate their future benefits. Specifically, employees can opt to allocate them to selected pension funds or maintain them with the company, in which case, the latter shall pay the contributions to the treasury fund of INPS (the Italian social security institution). Following these changes, the Italian post-employment benefits accruing after the date of the employees decision and, in any case, after 30 June 2007, are considered part of a defined contribution plan and treated like all other social security contributions. Share-based payments The Group has adhered to the guidelines of IFRS 2 - Share-based payments. Share-based payments are measured at fair value of the option at the grant date. This amount is recognised in the income statement on a straight-line basis over the vesting period. This treatment is based on an assessment of the stock options that will effectively vest in favour of the qualifying employees. Fair value is determined using the share price at the grant date. Income taxes Current taxes are provided for using the enacted tax rates and laws ruling in Italy and other countries in which the Group operates, based on the best estimate of the taxable profit for the year. Group companies net tax assets and liabilities when this is legally allowed. Beginning from 1 January 2004, the parent, Salini Impregilo, and 16 of its Italian subsidiaries have joined the national tax consolidation system pursuant to article 117 and subsequent articles of Presidential decree no. 917/86, which is regulated by the specific consolidation mechanisms. Deferred tax assets and liabilities are calculated on the basis of the temporary differences between the tax base of an asset or liability and its carrying amount. Deferred tax assets are recognised when the Group holds their recovery to be probable. The carrying amount of deferred tax assets is reviewed at each reporting date and, to the extent necessary, is decreased when it is no longer probable that sufficient taxable profits will be available in the future to use all or part of the 171 Annual Report as at 31 December 2016
173 Consolidated financial statements as at and for the year ended 31 December 2016 related benefit. Deferred tax assets and liabilities are measured at the tax rates that are expected to apply in the year when the asset is realised or the liability is settled, based on tax rates that have been enacted or substantially enacted at the reporting date. Deferred tax assets and liabilities are classified as non-current assets and liabilities, respectively, and are netted at company level if related to taxes that may be offset. If the balance is positive, it is recognised as Deferred tax assets, if not, as Deferred tax liabilities. Taxes that could arise from the transfer of undistributed profits by subsidiaries are only calculated when the subsidiary has the positive intention to transfer such profits. In the case of transactions recognised directly in equity, the related deferred tax asset or liability also affects equity. Provisions for risks and charges In accordance with IAS 37, the Group makes accruals to provisions for risks and charges when the following conditions exist: the Group or a group company has a present obligation (legal or constructive) at the reporting date as a result of a past event where an outflow of resources embodying economic benefits will be required to settle the obligation; it is probable that the obligation (through an outflow of resources) will have to be settled; a reliable estimate can be made of the amount of the obligation. When the time value is material and the obligation payment dates can be estimated reliably, the amount recognised as the provision equals the pre-tax future cash flows (i.e., forecast outflows) discounted at a rate that reflects the present market value and risks specific to the liability. The increase in the provision due to discounting is recognised as a financial expense. When the expected cash flows are included in an estimate range with the same probability of occurrence, the median value is discounted to measure the liability. Provision for restructuring costs is recognised when the parent or relevant group company has approved a detailed formal plan that has been implemented and communicated to the third parties involved. Translation criteria for foreign currency items and translation of financial statements of consolidated companies or companies measured using the equity method expressed in currencies other than the Euro The translation criteria for foreign currency items adopted by the Group are as follows: foreign currency monetary assets and liabilities are translated at the closing spot rate with any exchange rate gains or losses taken to the income statement; 172 Annual Report as at 31 December 2016
174 Consolidated financial statements as at and for the year ended 31 December 2016 non-monetary assets are recognised at historical cost denominated in the foreign currency and translated using the historical exchange rate; revenue and costs related to foreign currency transactions are recognised in profit or loss at the exchange rate ruling on the date of the transaction; any material effects deriving from changes in exchange rates after the reporting date are disclosed in the notes. With respect to the translation of financial statements of consolidated companies or companies measured using the equity method and expressed in currencies other than the presentation currency (functional currency), reference should be made to the section on the Basis of consolidation. The Group has applied IAS 29 - Financial reporting in hyperinflationary economies for its subsidiaries and associates that prepare their financial statements in a functional currency of a hyperinflationary economy. This standard requires that the financial statements of an entity, whose functional currency is that of a hyperinflationary economy, be translated at the closing spot rate. The statement of financial position items not yet translated into Euros at the reporting date are redetermined using a general price index. All the income statement items are translated into Euros at the exchange rate ruling on the date the revenue and costs were initially recognised. Non-current assets held for sale and discontinued operations Non-current assets (and disposal groups) are classified as held for sale if their carrying amount will be recovered through a sale transaction rather than through continuing use. Assets held for sale are recognised as such when the following events take place: signing of a binding sales agreement; approval and communication of a formal sales plan by directors. In order to be correctly measured, the assets shall be: available for immediate sale in their present condition; subject only to terms that are usual and customary for sales of such assets; and the sale must be highly probable and expected to take place within twelve months. Non-current assets (and disposal groups) classified as held for sale are measured at the lower of their previous carrying amount and fair value less costs 173 Annual Report as at 31 December 2016
175 Consolidated financial statements as at and for the year ended 31 December 2016 to sell. A discontinued operation is a component of an entity that either has been disposed of or classified as held for sale and that meets any of the following criteria: i) it represents a separate major line of business or geographical area of operations; ii) it is part of a single coordinated plan to dispose of a separate major line of business or geographical area of operations; or iii) it is a subsidiary acquired exclusively with a plan to resell. The profit or loss from discontinued operations is disclosed separately in the income statement. As required by paragraph 34 of IFRS 5 - Non-current assets held for sale and discontinued operations, the corresponding prior year figures are reclassified accordingly. Revenue recognition Operating and other revenue Revenue is measured to the extent it is probable that the economic benefits will flow to the Group and the related amount can be determined reliably. Revenue from the sale of goods is recognised when the Group has shipped the goods and has transferred all the material risks and rewards of ownership to the buyer. Revenue from construction contracts is recognised as provided for in the related Standard, described below. When the outcome of a construction contract can be estimated reliably, contract revenue is recognised by reference to the stage of completion of the contract activity at the reporting date based on the ratio of the costs incurred up to the reporting date to the total estimated contract costs, unless this is held to not represent the stage of completion of the contract. Changes in the contract and price revisions are recognised to the extent that they are reasonably certain.revenue is recognised only to the extent of contract costs incurred that it is probable will be recovered. Contract costs are recognised as an expense in the year in which they are incurred. Interest income Interest income is recognised on an accruals basis, considering the principal and applicable effective interest rate, i.e., the rate that discounts the estimated future inflows over the expected life of the financial asset to return it to its carrying amount. Dividends Dividends are recognised when the investors right to receive payment arises in line with local ruling legislation. Earnings per share Basic earnings per share are calculated as the ratio of the profit or loss for the year attributable to the holders of the ordinary shares of the parent to the weighted number of ordinary shares outstanding during the year. Diluted earnings per share are calculated considering the potential diluting effect of 174 Annual Report as at 31 December 2016
176 Consolidated financial statements as at and for the year ended 31 December 2016 exercise of their rights by the holders of rights that potentially have a diluting effect on shares when calculating the number of outstanding shares. Operating segments The operating segments comply with the reporting system provided to group management which is in charge of allocating the resources and assessing the results obtained by the segments. The Group s management and organisational structure presents the segments according to a geographic breakdown in macro-areas, on the basis of the three segments (Italian, foreign and Lane Group). The intrasegment transfer prices related to the exchange of goods and services are agreed at normal market conditions. Significant accounting estimates Preparation of financial statements and the related notes in accordance with the IFRS requires management to make judgements and estimates that affect the carrying amount of assets and liabilities and financial statements disclosures. The estimates are used to: recognise goodwill (see section 5 Business combinations ); determine amortisation and depreciation (see the Property, plant and machinery, Leased property, plant and equipment, Rights to infrastructure under concession and Other intangible assets paragraphs of the Accounting policies section); recognise impairment losses (see the Impairment of non-financial assets paragraph of the Accounting policies section); recognise employee benefits (see the Employee benefits paragraph of the Accounting policies section); recognise taxes (see the Income taxes paragraph of the Accounting policies section); recognise provisions for risks and charges (see the Provisions for risks and charges paragraph of the Accounting policies section); determine contract revenue, including claims for additional consideration, total contract costs and the related stage of completion (see the Contract work in progress and revenue from construction contracts paragraph of the Accounting policies section). A significant part of the Group s activities is typically performed on the basis of contracts which provide that a specific consideration is agreed when the contract is awarded. This implies that the profits on these contracts may undergo change compared to the original estimates depending on the recoverability of greater expenses and/or costs the Group may incur during performance of such contracts. 175 Annual Report as at 31 December 2016
177 Consolidated financial statements as at and for the year ended 31 December 2016 The actual results may differ from those estimated due to uncertainties underlying the assumptions and the conditions on which the estimates are based. Fundamental assumptions about the future and other reasons for uncertainty when making the estimates at the reporting date that may lead to material adjustments to the carrying amount of the assets and liabilities are described in the specific section of the Directors report which gives an analysis of the risk areas of each segment. 5. Business combinations Acquisition of Lane Industries Incorporated On 4 January 2016, the parent finalised the acquisition of 100% of Lane Industries Incorporated ( Lane Group ). Lane Group is one of the major highway contractors and is the top private asphalt producer in the United States. It is a family-owned business with more than 100 years of experience specialised in civil construction and in the transportation infrastructure sector. The company has three divisions: asphalt production, road projects and other infrastructure projects in both domestic and international markets. Lane s acquisition represents another step in Salini Impregilo s expansion into the US infrastructure market and will bring significant growth opportunities, increasing the diversification of the portfolio and improving the balance of its exposure between developed and developing markets. Lane Industries has been included in the consolidation scope since 4 January 2016 and its contribution is presented in the Group s consolidated financial statements. The agreed consideration was USD455 million, which generated provisional goodwill of USD238 million (which the Group recognised in its condensed interim consolidated financial statements as at and for the six months ended 30 June 2016 for 229 million). The following table summarises the provisional carrying amount of goodwill recognised at the acquisition date: (thousand) USD EURO Acquisition price Debt repayment (107.0) (98.3) Deferred compensation repayment (7.8) (7.1) Liabilities assumed (114.8) (105.4) Equity (121.3) (111.4) Equity attributable to non-controlling interests Impairment losses on capitalised borrowing costs Equity - Lane Industries (102.8) (94.4) Provisional goodwill Annual Report as at 31 December 2016
178 Consolidated financial statements as at and for the year ended 31 December 2016 The Group determined the fair value of the main assets as part of the PPA procedure as follows: Land: market method (guideline transactions); Buildings: cost method (replacement cost); Plant and machinery: market method (guideline transactions); Quarries: income method (with-or-without); Order backlog: income method (with-or-without); Workforce not separable from goodwill: cost method (replacement cost). The Group recognised the acquisition costs in the following items: Services: they include the consultancy fees paid for the Lane acquisition; Financial expense: they include the cost of the loan recognised in profit or loss using the amortised cost method starting from the loan agreement date. No contingent liabilities were recognised during the PPA procedure. Salini Impregilo availed of the option allowed by (revised) IFRS 3 to provisionally allocate the acquisition cost to the fair value of the assets acquired, the liabilities assumed and contingent liabilities. During 2016, the Group finalised the purchase price allocation procedure and reflected its effects retrospectively starting from the acquisition date as per (revised) IFRS 3. The following table summarises Salini Impregilo s share of the assets and liabilities of Lane Group at the acquisition date and their fair value determined before such date for the PPA procedure: 177 Annual Report as at 31 December 2016
179 Consolidated financial statements as at and for the year ended 31 December 2016 ( 000) Carrying amount Fair value Non-current assets 162, ,569 of which: - Property, plant and equipment 115, ,355 - Intangible assets 5,094 8,089 - Goodwill - 144,065 - Equity investments 42,060 42,060 Inventories 22,147 22,147 Trade receivables 176, ,078 Cash and cash equivalents 87,898 87,898 Contract work in progress 22,615 13,863 Other current assets 24,811 61,981 Total assets 495, ,535 Post-employment benefits and employee benefits 83, ,418 Deferred tax liabilities - 15,386 Non-current bank loans and borrowings 95, Other non-current liabilities 6,363 6,363 Trade payables 106, ,013 Other current liabilities 14,908 14,908 Current bank loans and borrowings 2,294 2,294 Progress payments and advances on contract work in progress 76,327 80,560 Total liabilities 384, ,273 Net assets acquired 111, ,263 Less non-controlling interests (13,489) (13,489) Net assets acquired (net of non-controlling interests) 97, ,774 The cash used for the acquisition, net of cash acquired, is set out below: ( 000) Cash and cash equivalents 87,898 Non-current assets 419,569 Other current assets 274,068 Non-current liabilities (135,497) Current liabilities (203,775) Total net assets acquired 442,263 Less non-controlling interests (13,489) Total net assets acquired attributable to the owners of the parent 428,774 Less cash acquired (87,898) Cash and cash equivalents net of cash acquired and used for the acquisition 340,876 Lane has been included in the consolidation scope since 4 January 2016 and its contribution is presented in the Group s consolidated financial Statements. 178 Annual Report as at 31 December 2016
180 Consolidated financial statements as at and for the year ended 31 December 2016 Acquisition of assets of Asphalt Roads and Materials Company Inc. (Virginia Beach) On 21 March 2016, Lane signed an agreement for the acquisition of some assets of Asphalt Roads and Materials Company Inc, active in road construction and asphalt production in Virginia Beach (Virginia). These assets include machinery, equipment, buildings, land, inventories, rights and commitments to complete existing contracts. The acquisition was closed on 4 April 2016 for USD39 million. The assets carrying amount was USD4.8 million. The following table shows the assets acquired by Lane at the transaction date and their fair value, calculated definitively after the PPA procedure. The Euro/US dollar exchange rate used on 4 April 2016 was ( 000) Carrying amount Fair value Non-current assets 4,107 33,901 of which: - Intangible assets/goodwill 25,167 Current assets 176 Other current assets Net assets acquired 4,282 34,279 The following table shows the cash and cash equivalents used to acquire the assets: ( 000) Carrying amount Fair value Inventories 202 Contract work in progress 176 Property, plant and equipment 8,734 Goodwill 25,167 Cash and cash equivalents used in the acquisition 34,279 Other business combinations The 12-month period allowed by the (revised) IFRS 3 to define the PPA procedure expired during the first half of 2016 for the acquisitions of Co.Ge.Fin S.r.l., acquired from the related party Todini Finanziaria, and Seli Tunneling Denmark ApS, acquired from third parties (described in the 2015 Annual Report). Completion of the above procedure did not identify fair values different to those calculated provisionally and published in the 2015 Annual Report. Other changes in the consolidation scope In addition to completion of the sale of Todini Costruzioni Generali S.p.A. and acquisition of Lane Group, the other changes in the consolidation scope that took place in the year are described below: 179 Annual Report as at 31 December 2016
181 Consolidated financial statements as at and for the year ended 31 December 2016 (i) Acquisition of Salini Saudi Arabia Co. Ltd On 23 April 2016, the Group finalised its acquisition of 51% of Salini Saudi Arabia Co. Ltd for SAR421,066 (equivalent to 99,687 using the transaction date exchange rate) from the related party Salini Costruttori S.p.A. and Compagna Gestione Macchinari - CO.GE.MA S.p.A.. The acquiree coordinates the Group s activities in Saudi Arabia. The acquisition has not significantly affected the Group s consolidated financial statements. (ii) Acquisition of 30% of Consorcio OHL In May 2016, the Group finalised its acquisition of 30% of this Colombian consortium from third parties, obtaining full control thereover. The consortium is engaged in the El Quimbo project. (iii) Sale of 25% of the Riachuelo contract (Argentina) On 3 February 2016, the Group completed its sale of 25% of Salini Impregilo S.p.A. - S.A. Healy Company Jose J Chediack S.A. UTE, a SPE set up to construct an underwater effluent diffuser in Buenos Aires, Argentina. Accordingly, it had a 75% interest in this SPE at year end. Pursuant to IFRS 10, the effects of this sale have been recognised directly in equity. (iv) Transfer of 14% of the joint operation CWG to Salini Saudi Arabia As per the previously-signed agreements with the Saudi partner, Salini Impregilo transferred 14% of Civil Work Group JV to its subsidiary Salini Saudi Arabia Ltd. Co. (SSA) on 30 November As a result, it now holds 52% of the joint operation. Pursuant to IFRs 10, the effects of the transfer were recognised directly in equity. 6. Segment reporting Impregilo Group s combination with Salini Group has meant, inter alia, both the concentration of the Group s industrial operations in its core business of the construction of complex large-scale infrastructure and the gradual disposal of assets no longer deemed strategic, as well as a comprehensive review of the Group s organisation and business management processes. As a result, segment reporting is presented according to macro geographical regions, based on the management review approach adopted by senior management, for the three geographical segments: Italy, Abroad and LANE Group (following acquisition of the US Group on 4 January 2016). Costs relating to activities carried out by the parent, called Corporate costs, are attributed to the Italy segment and relate to: planning and management of human and financial resources; 180 Annual Report as at 31 December 2016
182 Consolidated financial statements as at and for the year ended 31 December 2016 coordination and assistance with administrative, tax, legal/corporate and institutional communications requirements to group companies. These costs amounted to million for 2016 compared to million for the previous year. Management measures the segments results by considering their operating profit. The geographical segments are measured based on net invested capital. Disclosures on the Group s performance by business segment are set out in the Directors report. The consolidated financial statements figures are summarised below by geographical segment. Italy (*) Abroad LANE Total ( 000) Group Group Revenue 455,685 4,007,094 1,297,579 5,760,358 Other income 83,894 33,624 5, ,451 Total revenue 539,579 4,040,718 1,303,512 5,883,809 Costs Production costs (385,963) (2,939,307) (897,200) (4,222,470) Personnel expenses (187,148) (352,469) (346,621) (886,237) Other operating expenses (61,995) (150,545) (9,724) (222,264) Provisions and impairment losses (7,869) (7,010) (1,623) (16,503) Total costs (642,975) (3,449,331) (1,255,167) (5,347,475) Gross operating profit (loss) (EBITDA) (103,396) 591,387 48, ,334 EBITDA % -19.2% 14.6% 3.7% 9.1% Amortisation and depreciation (57,021) (169,599) (34,201) (260,821) Operating profit (loss) (EBIT) (160,418) 421,788 14, ,513 Return on Sales 4.7% Financing income (costs) and gains (losses on equity investments (77,384) Profit before tax (EBT) 198,130 Income tax expense (77,952) Profit from continuing operations 120,178 Loss from discontinued operations (20,662) Profit for the year 99,515 (*) The operating profit includes the costs of the central units and other general costs of million. 181 Annual Report as at 31 December 2016
183 Consolidated financial statements as at and for the year ended 31 December 2016 The figures in the above table for Lane Group are its IFRS-compliant figures and they do not include the non-controlling investments in joint ventures included in the Work Under Management figures as presented in the Directors report. The Group monitors the key figures of Lane Group for management account purposes adjusting the IFRS figures prepared for consolidation purposes to present the results of the non-subsidiary joint ventures consolidated on a proportionate basis. These figures show the status of contracts managed directly by Lane or through non-controlling investments in joint ventures. Reference should be made to the section on Initial considerations on the comparability of data of the Directors report for more information). Income statement by geographical segment ( ) ( 000) Italy (*) Abroad Total Revenue 667,449 3,956,617 4,624,066 Other income 74,827 71, ,229 Total revenue 742,276 4,028,019 4,770,295 Costs Production costs (563,385) (3,000,651) (3,564,036) Personnel expenses (165,333) (373,431) (538,764) Other operating expenses (73,619) (88,448) (162,067) Provisions and impairment losses (31,020) 8,237 (22,783) Total costs (833,357) (3,454,293) (4,287,650) Gross operating profit (loss) (EBITDA) (91,081) 573, ,645 EBITDA % -12.3% 14.2% 10.1% Amortisation and depreciation (40,654) (174,405) (215,059) Operating profit (loss) (EBIT) (131,735) 399, ,586 Return on Sales 5.6% Financing income (costs) and gains (losses) on equity investments (90,089) Profit (loss) before tax (EBT) 177,497 Income tax expense (84,576) Profit (loss) from continuing operations 92,921 Loss from discontinued operations (10,690) Profit for the year 82,231 ( ) The 2015 income statement was restated to comply with IFRS 5 given the new disposal scope of Todini Costruzioni Generali, The figures in this column do not include Lane acquired on 4 January 2016, (*) The operating profit includes the costs of the central units and other general costs of 143,3, 182 Annual Report as at 31 December 2016
184 Consolidated financial statements as at and for the year ended 31 December 2016 Statement of financial position as at 31 December 2016 by geographical segment Italy Abroad LANE Total ( 000) Group Non-current assets 431, , ,619 1,348,457 Assets held for sale, net 6, ,032 Provisions for risks (83,663) (16,297) (5,805) (105,765) Post-employment benefits and employee benefits (14,444) (12,762) (64,724) (91,930) Net tax assets (liabilities) 219,177 (73,073) (27,762) 118,342 Working capital 190, ,351 45, ,012 Net invested capital 749, , ,089 1,712,148 Equity 1,361,330 Net financial position 350,818 Total financial resources 1,712,148 Statement of financial position as at 31 December 2015 by geographical segment ( 000) Italy Abroad Total Non-current assets 253, , ,440 Assets (liabilities) held for sale, net 62,169 (20,575) 41,594 Provisions for risks (97,091) (9,270) (106,361) Post-employment benefits and employee benefits (14,195) (11,217) (25,412) Net tax assets 83,561 52, ,066 Working capital 355,518 (77,234) 278,284 Net invested capital 643, ,599 1,243,611 Equity 1,216,860 Net financial position 26,751 Total financial resources 1,243, Annual Report as at 31 December 2016
185 Consolidated financial statements as at and for the year ended 31 December 2016 Statement of financial position 7. Property, plant and equipment Property, plant and equipment amount to million, up from the 31 December 2015 figure by million. Their historical cost and carrying amount are given in the following table: 31 December December 2015 Cost Acc. Carrying Cost Acc. Carrying ( 000) depreciation amount depreciation amount Land 60,107-60,107 5,354-5,354 Buildings 145,914 (62,920) 82, ,726 (74,056) 78,670 Plant and machinery 1,287,576 (733,247) 554,329 1,084,534 (634,156) 450,378 Industrial and commercial equipment 114,007 (98,026) 15, ,781 (93,979) 18,802 Other assets 103,439 (47,918) 55,521 57,771 (44,812) 12,959 Assets under const. and payments on account 34,106-34,106 28,202-28,202 Total 1,745,149 (942,111) 803,039 1,441,368 (847,003) 594,365 Changes during the year are summarised below: 31 December Increases Deprec. (Imp. Reclass. Disposals Exchange Change in 31 December 2015 losses)/re rate gains consolidation 2016 versals (losses) and scope ( 000) of losses other changes Land 5, (793) 1,408 53,763 60,107 Buildings 78,670 21,518 (20,581) - (22,173) (3,970) 1,199 28,330 82,994 Plant and machinery 450, ,763 (188,974) - 25,199 (54,805) 2, , ,329 Industrial and commercial equipment 18,802 9,832 (11,429) (1,146) (82) (248) 15,981 Other assets 12,959 3,941 (5,828) (546) 1,190 43,614 55,521 Assets under const. and payments on account 28,202 11, (3,469) (1,903) 249 (176) 34,106 Total 594, ,633 (226,813) - - (63,163) 6, , ,039 Prior year changes are summarised below: 31 December Increases Deprec. (Imp, Reclass. Disposals Exchange Change in 31 December 2014 losses)/re rate gains consolidation 2015 versals (losses) and scope ( 000) of losses other changes Land 2,014 3, ,354 Buildings 68,034 25,692 (18,497) - 2,926 (4,399) 4, ,670 Plant and machinery 430, ,048 (152,220) (416) 7,201 (29,721) (2,757) 31, ,378 Industrial and commercial equipment 25,813 14,721 (14,231) - (6,508) (809) (184) - 18,802 Other assets 13,229 4,444 (4,342) (1) (331) (535) ,959 Assets under const. and payments on account 28,261 1, (419) (1,942) ,202 Total 567, ,386 (189,290) (417) 2,869 (37,406) 1,969 33, , Annual Report as at 31 December 2016
186 Consolidated financial statements as at and for the year ended 31 December 2016 The most significant changes include: increases of million, mainly related to investments for foreign contracts including the Ethiopian branch ( 20 million, principally relating to the Gibe IV project), the Riyadh Metro Line 3 (Saudi Arabia) ( 10.5 million), the Lima Metro 2 ( 9.5 million), Consorzio Collegamenti Integrati Veloci (CO.C.I.V.) ( 90.1 million) and the Ruta del Sol project ( 51.2 million); depreciation for the year of million; disposals of 63.2 million, principally related to plant and machinery. These disposals mostly refer to contracts nearing completion and the Line North Underground (Qatar) ( 15.9 million); the change in the consolidation scope, mostly referring to the acquisitions of Lane ( million) and assets from Asphalt Roads and Materials Company ( 8.7 million). These amounts have been calculated using the PPA procedure described in Note 5; the closing balance at 31 December 2016 includes leased assets of 203 million recognised under Buildings ( 0.2 million), Plant and machinery ( million), Industrial and commercial equipment ( 1.2 million) and Other assets ( 0.1 million). 8. Intangible assets Intangible assets amount to million, down from the 31 December 2015 figure by 25.1 million. Their historical cost and carrying amount are given in the following table: 31 December December 2015 Cost Acc. Carrying Cost Acc. Carrying ( 000) amortisation amount amortisation amount Rights to infrastructure under concession 72,718 (9,469) 63,249 73,984 (9,098) 64,886 Contract acquisition costs 200,154 (97,511) 102, ,923 (66,209) 127,714 Other 8,526 (5,655) 2,871 3,331 (2,110) 1,221 Total 281,398 (112,635) 168, ,238 (77,417) 193,821 The rights to infrastructure under concession of 63.2 million decreased compared to the previous year-end balance. Changes of the year are detailed in the following table: 31 December 2015 Increases Amortisation Exchange Change in 31 December 2016 rate losses consolidation ( 000) scope SA.BRO.M. 43, ,229 Parking Glasgow 19,452 - (962) (1,276) - 17,214 Mercovia 1, (382) (298) - 1,806 Total 64,886 1,281 (1,344) (1,574) - 63, Annual Report as at 31 December 2016
187 Consolidated financial statements as at and for the year ended 31 December 2016 The increase in this item for SA.BRO.M. mainly comprises design costs, including the borrowing costs capitalised in accordance with IAS 23, which the Group expects to recover based on the outcome of the contract. The item is not amortised as the concession is currently inoperative. No indications of impairment were identified during the year and, therefore, the Group did not perform the impairment test. For comparative purposes, prior year changes are as follows: 31 December 2014 Increases Amortisation Exchange Change in 31 December 2015 rate losses consolidation ( 000) scope SA.BRO.M. 42, ,491 Parking Glasgow 19,913 (1,016) ,452 Mercovia 2, (477) (660) 1,943 Totale diritti su infrastrutture in concessione 65,380 1,104 (1,493) (105) - 64,886 Contract acquisition costs amount to million and are analysed in the following table: 31 December 2015 Increases Amortisation Exchange Change in 31 December 2016 rate gains consolidation ( 000) scope Cociv (Milan-Genoa railway section) 44,366 - (3,791) ,575 Riyadh Metro - Saudi Arabia 56,551 - (17,719) ,832 Iricav Due (Verona-Padua railway section) 12, ,510 Thessalonica Metro - Greece 1,130 - (501) Yarull - Dom. Republic 3,037 - (32) - - 3,005 Vegas Tunnel - USA (307) Gerald Desmond Bridge - USA 5,264 - (1,715) - - 3,549 Stavros Niarchos - Greece (710) Seli Tunnelling Denmark A.p.S. 3,839 - (2,756) - - 1,083 Lane - - (3,590) 19 6,031 2,460 Total 127,714 - (31,121) 19 6, ,643 Contract acquisition costs include considerations paid to purchase stakes in projects/contracts representing intangible assets with a finite useful life, which are amortised in line with the stage of completion of the related contracts. The change in the consolidation scope refers to the acquisition of Lane. The Group calculated this amount using the PPA procedure described in Note Annual Report as at 31 December 2016
188 Consolidated financial statements as at and for the year ended 31 December 2016 With respect to the Verona - Padua section, amortisation of the acquisition cost will commence when work starts. Prior year changes are as follows: 31 December 2014 Increases Amortisation Disposals Change in 31 December 2015 consolidation ( 000) scope Cociv (Milan-Genoa railway section) 48,623 - (4,257) ,366 Riyadh Metro - Saudi Arabia 25,394 38,748 (7,591) ,551 Iricav Due (Verona-Padua railway section) - 12, ,510 Thessalonica Metro - Greece 1,202 - (72) - - 1,130 Yarull - Dom. Republic 3,083 - (46) - - 3,037 Vegas Tunnel - USA 4,687 - (4,380) Gerald Desmond Bridge - USA 7,235 - (1,971) - - 5,264 Stavros Niarchos - Greece 3,108 - (2,398) Seli Tunnelling Denmark A.p.S. - - (1,968) - 5,807 3,839 Total 93,332 51,258 (22,683) - 5, ,714 There are no indicators of impairment for the contracts to which the acquisition costs refer. Other intangible assets amount to 2.9 million, up 1.6 million from the 31 December 2015 figure. Their historical cost and carrying amount are given in the following table: 31 December December 2015 Cost Acc. Carrying Cost Acc. Carrying ( 000) amortisation amount amortisation amount Industrial patents 74 (60) (908) 13 Concessions 64 (64) - 64 (62) 2 Software 7,292 (4,699) 2,593 1,447 (487) 960 Other 1,095 (831) (653) 246 Total 8,525 (5,654) 2,871 3,331 (2,110) 1,221 Changes during the year are set out below: 31 December Increases Amortisation Other Disposals Exchange Change in 31 December 2015 changes rate gains consolidation 2016 ( 000) (losses) scope Industrial patents (20) Concessions (18) 16 - Software (1,333) - - (3) 2,040 2,593 Other (174) - - (17) Total 1,221 1,141 (1,545) - - (4) 2,058 2, Annual Report as at 31 December 2016
189 Consolidated financial statements as at and for the year ended 31 December 2016 The change in the consolidation scope refers to the acquisition of Lane on 4 January Reference should be made to Note 5 - Business combinations for more information on the acquisition. Prior year changes are as follows: 31 December Increases Amortisation Reclassifications Disposals Exchange Change in 31 December 2014 rate gains consolidation 2015 ( 000) (losses) scope Industrial patents 42 - (29) Concessions 4 - (2) Software (271) (61) - (37) Other (85) Total 1, (387) (61) - (37) - 1, Goodwill Goodwill of million at the reporting date solely relates to the acquisition of Lane Group finalised during the Its recognition is detailed in Note 5 - Business combinations. Changes during the year are set out below: 31 December January April 2016 Exchange 31 December 2016 acquisition of Lane acquisition of rate gains ( 000) Virginia Beach Lane Group - 144,065-3, ,018 Asphalt Roads and Materials Co. assets ,167 2,003 27,170 Total - 144,065 20,468 5, ,188 The recoverability of the carrying amounts was checked by comparing Lane Group s net invested capital, which is a separate CGU, with the related recoverable amounts, which are the estimated future cash flows arising from the assets continuing use discounted to their net present value ( value in use ). The main assumptions adopted to calculate value in use are as follows: long-term growth rate of zero on a prudent basis; post-tax discount rate: 7.5%. The Group has adopted the discount rate calculated based on the market cost of money and the asset sector s specific risk (Weighted Avarage Cost of Capital, WACC). Specifically, the Group considered the return rate on long-term government bonds and the average capital structure of a basket of comparable companies. 188 Annual Report as at 31 December 2016
190 Consolidated financial statements as at and for the year ended 31 December 2016 The CGU s recoverable amount has been calculated using the cash flow projections set out in the three-year plan prepared and approved by management. The terminal value is based on a sustainable profit assumption, from which stable long-term operating cash flows have been estimated, on a going concern basis. The Group tested goodwill for impairment at the reporting date, which showed that the CGU s recoverable amount exceeds its carrying amount (net invested capital) by 50%. Moreover, given the materiality of the above difference, a possible reasonable change in the assumptions described above adopted in the calculation of the recoverable amount (a 0.5% increase or decrease in the growth rate and in the discount rate, respectively), would not lead to a significantly different outcome. 10. Equity investments Equity investments increased by 70.2 million to million. ( 000) 31 December December 2015 Variation Investments in subsidiaries (77) Investments in equity-accounted investees 183, ,990 68,519 Other investments 17,912 16,140 1,772 Total 201, ,254 70,214 The main changes that led to differences in the carrying amounts of the equity investments are summarised below: ( 000) 31 December December 2015 Change in consolidation method 42,087 (9,095) Capital transactions 51,159 36,739 Acquisitions, capital injections and disinvestments (4,855) 673 Share of profit of equity-accounted investees 5, Dividends from equity-accounted investees (26,855) (925) Other changes including change in the translation reserve 3,133 (641) Total 70,214 26,832 The change in consolidation method refers to the new consolidation scope with the inclusion of the Lane Group joint ventures measured using the equity method. 189 Annual Report as at 31 December 2016
191 Consolidated financial statements as at and for the year ended 31 December 2016 Capital transactions mainly refer to the subscription of shares of the company that will develop the concession project for the Milan Metro 4 for 3.5 million, the recapitalisation of the SPE Grupo Unido por el Canal (Panama) for 44.7 million and the subscription of additional shares of Gaziantep (Turkey) for 1.9 million. The Group s share of profit of equity-accounted investees totals 5.5 million, considering also the figures shown in Note 27, detailing the changes in the provision for risks on equity investments. The effect on profit or loss is analysed in Note 37. The carrying amount of the investment in Ochre Solutions Holdings Ltd was tested for impairment using the English operator s business plan. Its cash flows were discounted using a rate of 5.3% (2015: 5.7%) to calculate the investment s recoverable amount. The Group also performed sensitivity analyses considering the potential effect of a change in the reference parameters. The resulting recoverable amount was higher than the investment s carrying amount and, therefore, it was not necessary to recognise an impairment loss. The Group performed a similar test for Consorcio Agua Azul S.A. based on the Peruvian operator s business plan. Its cash flows were discounted using a rate of 8.4% (2015: 8.8%). The Group also performed sensitivity analyses considering the potential effect of a change in the reference parameters. The resulting recoverable amount was higher than the investment s carrying amount, showing that it was not impaired. Investments in equity-accounted investees and other equity investments Investments in equity-accounted investees and other equity investments increased by 70.3 million to million: ( 000) 31 December December 2015 Variation Investments in associates 112, ,847 8,170 Investments in jointly controlled entities 86,643 22,831 63,812 Investments in other companies 2,761 4,452 (1,691) Total 201, ,130 70,291 The increase is principally due to the Lane Group joint ventures included this year. 190 Annual Report as at 31 December 2016
192 Consolidated financial statements as at and for the year ended 31 December 2016 Investments in associates, jointly controlled entities and other companies with a negative carrying amount, provided for in the provision for risks on equity investments (see Note 27), increased to 2.5 million by 0.3 million compared to 31 December ( 000) 31 December December 2015 Variation Investments in associates (1,744) (1,691) (53) Investments in jointly controlled entities (415) 0 (415) Investments in other companies (367) (499) 132 Total (2,526) (2,190) (336) The amount recognised in profit or loss is as follows: ( 000) Variation Investments in associates Investments in jointly controlled entities 5,964 (103) 6,067 Investments in other companies (1,201) 343 (1,544) Total 5, ,947 The classification of Salini Impregilo Group companies in line with the IFRS referred to earlier was based on the following guidelines: (i) Paragraphs 5 and 6 of IFRS 10 were adhered to for assessing the existence of control. Group entities were only classified as subsidiaries when the Group has substantial rights over the investee s relevant activities, in exchange for the Group s exposure to variable returns from its involvement with the investee and the Group can use its power over the investee to affect the amount of the variable returns. These requirements are met when the Group holds sufficient voting rights to obtain the majority required in decisions for the governance bodies of the group entities in question. (ii) Reference was made to paragraphs 4 and 5 of IFRS 11 to assess the existence of joint control. Joint control exists if the majorities required for decision-taking by the governance bodies of the group entities in question require the unanimous vote or qualified majorities that can only be reached with the consent of a specific group of investors. (iii) With reference to the type of joint arrangements, in view of the fact that all joint arrangements in which the Group participates are structured through separate vehicles, reference was made to paragraph B15 of IFRS 11, analysing in particular the legal form of the separate vehicle and the terms 191 Annual Report as at 31 December 2016
193 Consolidated financial statements as at and for the year ended 31 December 2016 of the contractual agreement. With reference to the situation at 31 December 2016 and 2015, only those entities not incorporated into legal entities and structured as separate vehicles that guarantee transparency of the rights and obligations of the parties are classified as joint operations. Salini Impregilo Group s activities involve its participation in numerous SPEs that, especially in Italy, use the consortium structure, which works using a cost recharging system. Under IFRS 10 and IFRS 11, these entities have been classified as subsidiaries, associates and joint ventures, according to the guidelines set out above. Although the investments in the consortium entities classified as associates and joint ventures are measured using the equity method, their revenue is nonetheless presented in the consolidated financial statements, as the parent recognises the contract work in progress while the costs incurred by the entities are recharged to the parent and shown in a single cost item under Services. Therefore, since the significant effects concerning consortium entities are already shown in the consolidated financial statements, they are not detailed in the following section. Financial highlights of the significant associates The group associates at 31 December 2016 that management considers significant for the Group are presented below. Their share capital consists solely of ordinary shares, which the Group holds directly. These companies primarily conduct their business in the country of their incorporation or registration. Head office Registered Investment % Nature of the Measurement office (if different relationship method to the head office) Consorcio Agua Azul S.A. Peru n/a 25.5% (1) Equity Metro de Lima 2 S.A. Peru n/a 18.25% (2) Equity Yuma Concessionaria S.A. Colombia n/a 48.33% (3) Equity The activities of the above companies are key to the Group s activities. A description of the nature of Salini Impregilo Group s relationship with the above companies is provided below: (1) The company is held by the sub holding company Impregilo International Infrastructures N.V. and has a concession contract expiring in 2027 for the integrated water cycle in Lima, Peru. The governance system requires majority resolutions and Salini Impregilo s investment percentage means it can be classified as an associate. Information about the concession s term is provided in the paragraph on Concessions of the Abroad section of the Directors report. 192 Annual Report as at 31 December 2016
194 Consolidated financial statements as at and for the year ended 31 December 2016 (2) The company is held directly by the parent and has a concession contract for the Metro de Lima 2 project (Peru) for the concession, construction and operation of the infrastructure during the 35-year concession expiring in The paragraph on Concessions of the Abroad section of the Directors report provides a description of this concession. The governance system requires majority resolutions and Salini Impregilo s investment percentage means it can be classified as an associate. (3) The company is held directly by Salini Impregilo S.p.A. and has a concession contract for the third motorway lot of the Ruta del Sol project in Colombia. The contract expires in The section on Concessions in the Directors report provides a description of this concession. The governance system requires majority resolutions and Salini Impregilo s investment percentage means it can be classified as an associate. Information about the concession s term is provided in the paragraph on Concessions of the Abroad section of the Directors report. The financial information relating to individually significant associates accounted for using the equity method is shown below. In addition, the financial information of the associates is reconciled with the carrying amount of the related investments. The information shown reflects the carrying amounts in the associates financial statements, adjusted to comply with group accounting policies. 193 Annual Report as at 31 December 2016
195 Consolidated financial statements as at and for the year ended 31 December 2016 Agua Azul (Peru) 31/12/ /12/2015 Variation ( 000) Non-current assets Property, plant and equipment and intangible assets 21,365 22,107 (742) Other non-current assets - 2,900 (2,900) Total non-current assets 21,365 25,007 (3,642) Current assets Cash and cash equivalents and other financial assets 2,746 3,583 (837) Other current assets 4,313 1,286 3,027 Total current assets 7,059 4,869 2,190 Total assets 28,424 29,876 (1,452) Equity 27,021 27,473 (452) Non-current liabilities Non-current financial liabilities Other non-current liabilities Total non-current liabilities Current liabilities Current financial liabilities 248 (248) Other current liabilities 1,392 2,155 (763) Total current liabilities 1,392 2,403 (1,011) Total liabilities 28,424 29,876 (1,452) Agua Azul (Peru) 31/12/ /12/2015 ( 000 Group share) Opening equity 7,005 6,779 Comprehensive income attributable to the owners of the parent 1, Dividends distributed (1,470) (766) Capital increases and other variations - - Closing equity 6,891 7,005 Carrying amount 6,891 7,005 Agua Azul (Peru) Variation ( 000) Revenue 12,488 12,591 (103) Costs (6,435) (6,449) 14 Operating profit 6,053 6,142 (89) Net financing income (costs) (112) 45 (157) Profit before tax 5,941 6,187 (246) Income tax expense (1,811) (1,895) 84 Profit from continuing operations 4,130 4,292 (162) Other comprehensive income (expense) 1,184 (399) 1,583 Profit for the year 5,314 3,893 1, Annual Report as at 31 December 2016
196 Consolidated financial statements as at and for the year ended 31 December 2016 Yuma (Colombia) 31/12/ /12/2015 Variation ( 000) Non-current assets Property, plant and equipment and intangible assets 184, ,017 43,742 Other non-current assets Total non-current assets 185, ,017 44,618 Current assets Cash and cash equivalents and other financial assets 8,167 2,179 5,988 Other current assets 58,398 61,142 (2,744) Total current assets 66,565 63,321 3,244 Total assets 252, ,338 47,862 Equity 27,568 23,286 4,282 Non-current liabilities Non-current financial liabilities 37,517 38,897 (1,380) Other non-current liabilities 31, ,619 Total non-current liabilities 68,938 39,699 29,239 Current liabilities Current financial liabilities 141, ,208 11,771 Other current liabilities 13,715 11,145 2,570 Total current liabilities 155, ,353 14,341 Total liabilities 252, ,338 47,862 Yuma (Colombia) 31/12/ /12/2015 ( 000 Group share) Opening equity 11,253 8,868 Comprehensive income attributable to the owners of the parent 2, Dividends distributed - - Other comprehensive income - 2,302 Closing equity 13,324 11,253 Carrying amount 13,324 11,253 Yuma (Colombia) Variation ( 000) Revenue 77,138 86,714 (9,576) Costs (80,234) (87,199) 6,965 Gross operating loss (3,096) (485) (2,611) Net financing income 3,497 7,953 (4,456) Profit before tax 401 7,468 (7,067) Income tax income/expense 1,643 (2,764) 4,407 Profit from continuing operations 2,044 4,704 (2,660) Other comprehensive income (expense) 2,239 (4,533) 6,772 Profit for the year 4, , Annual Report as at 31 December 2016
197 Consolidated financial statements as at and for the year ended 31 December 2016 Metro de Lima 2 S.A. (Peru) 31/12/ /12/2015 Variation ( 000) Non-current assets Property, plant and equipment and intangible assets ,136 (38,845) Total non-current assets ,136 (38,845) Current assets Cash and cash equivalents and other financial assets 80,304 59,433 20,871 Other current assets 198, ,144 98,843 Total current assets 279, , ,714 Total assets 279, ,713 80,869 Equity 126, ,064 8,406 Non-current liabilities Other non-current liabilities 3,023 77,877 (74,854) Total non-current liabilities 3,023 77,877 (74,854) Current liabilities Other current liabilities 150,089 2, ,317 Total current liabilities 150,089 2, ,317 Total liabilities 279, ,713 80,869 Metro de Lima 2 S.A. (Peru) 31/12/ /12/2015 ( 000 Group share) Opening equity 21,547 8,567 Comprehensive income attributable to the owners of the parent 1,534 3,065 Capital increases and other variations - 9,915 Closing equity 23,081 21,547 Carrying amount 23,081 21,547 Metro de Lima 2 S.A. (Peru) Variation ( 000) Revenue 349, , ,746 Costs (344,596) (174,363) (170,233) Operating profit 4,852 7,339 (2,487) Net financing income 1, ,531 Profit before tax 6,591 7,547 (956) Income tax expense (2,277) - (2,277) Profit from continuing operations 4,314 7,547 (3,233) Other comprehensive income 4,091 9,248 (5,157) Profit for the year 8,405 16,795 (8,390) 196 Annual Report as at 31 December 2016
198 Consolidated financial statements as at and for the year ended 31 December 2016 Significant restrictions At the date of preparation of this Report, there were no restrictions on the associates ability to transfer dividends, repay loans or make advances to the parent. Contingent liabilities At the date of preparation of this Report, there were no contingent liabilities related to the Group s investments in associates. Any related risk areas are described in the paragraph on Concessions of the Abroad section of the Directors report. Interests in joint ventures The most significant joint ventures are listed below: Head office Registered office Investment % Nature of the Measurement (if different relationship method to the head office) Grupo Unidos Por El Canal S.A. Panama n/a 48% (1) Equity AGL JV United States n/a 20% (2) Equity Gemma Lane Liberty Partners United States n/a 10% (2) Equity Gemma Lane Patriot Partners United States n/a 10% (2) Equity Purple Line Transit Constructors LLC United States n/a 30% (2) Equity Skanska Granite Lane United States n/a 30% (2) Equity I4 Leasing LLC United States n/a 30% (2) Equity (1) The company is held directly by Salini Impregilo S.p.A. and is engaged in building the new system of locks on the Panama Canal. Reference should be made to the Main risk factors and uncertainties section of the Directors report on for further information. The governance system requires qualified majority resolutions passed with the favourable vote of two members, including Salini Impregilo. (2) The joint ventures are held by the newly-acquired sub-holding company Lane and are active in the construction segment. Reference should be made to the Directors report for additional information. Financial highlights of the joint ventures The financial information related to the joint ventures measured using the equity method is set out below with a reconciliation of such information with the carrying amount of the Group s interest in the joint venture as per the shareholder agreements. The information shown reflects the carrying amounts in the joint venture s financial statements, adjusted to comply with group accounting policies. 197 Annual Report as at 31 December 2016
199 Consolidated financial statements as at and for the year ended 31 December 2016 Gemma Lane Liberty Partners 31/12/ /12/2015 Variation ( 000) Non-current assets Current assets Cash and cash equivalents and other financial assets 4,189 n.a. n.a. Other current assets 61 n.a. n.a. Total current assets 4, Total assets 4, Equity 1, Non-current liabilities Current liabilities Other current liabilities 2,968 n.a. n.a. Total current liabilities 2, Total liabilities 4, Gemma Lane Liberty Partners 31/12/ /12/2015 ( 000 Group share) Opening equity 1,831 - Comprehensive income attributable to the owners of the parent 2,103 n.a. Dividends distributed (3,614) n.a. Closing equity Carrying amount Gemma Lane Liberty Partners Variation ( 000) Revenue 31,669 n.a. n.a. Costs (23,203) n.a. n.a. Operating profit 8, Profit before tax 8, Profit from continuing operations 8, Profit for the year 8, Other comprehensive expense (52) n.a. n.a. Profit for the year 8, Annual Report as at 31 December 2016
200 Consolidated financial statements as at and for the year ended 31 December 2016 Gemma Lane Patriot Partners 31/12/ /12/2015 Variation ( 000) Non-current assets Current assets Cash and cash equivalents and other financial assets 7,642 n.a. n.a. Other current assets - n.a. n.a. Total current assets 7, Total assets 7, Equity 1, Non-current liabilities Current liabilities Other current liabilities 5,787 n.a. n.a. Total current liabilities 5, Total liabilities 7, Gemma Lane Patriot Partners 31/12/ /12/2015 ( 000 Group share) Opening equity Net expense for the year 5,204 n.a. Dividends distributed (4,969) n.a. Closing equity Carrying amount Gemma Lane Patriot Partners Variation ( 000) Revenue 72,173 n.a. n.a. Costs (51,434) n.a. n.a. Operating profit 20, Profit before tax 20, Profit from continuing operations 20, Profit for the year 20, Other comprehensive income 74 n.a. n.a. Profit for the year 20, Annual Report as at 31 December 2016
201 Consolidated financial statements as at and for the year ended 31 December 2016 Purple Line Tr. Constr. (Lane) 31/12/ /12/2015 Variation ( 000) Non-current assets Property, plant and equipment and intangible assets - n.a. n.a. Total non-current assets Current assets Cash and cash equivalents and other financial assets 53,510 n.a. n.a. Other current assets 9,067 n.a. n.a. Total current assets 62, Total assets 62, Equity 16, Non-current liabilities Non-current financial liabilities 289 n.a. n.a. Total non-current liabilities Current liabilities Other current liabilities 45,888 n.a. n.a. Total current liabilities 45, Total liabilities 62, Purple Line Tr. Constr. (Lane) 31/12/ /12/2015 ( 000 Group share) Opening equity - - Comprehensive income attributable to the owners of the parent 4,920 n.a. Dividends distributed - n.a. Closing equity 4,920 - Carrying amount 4,920 - Purple Line Tr. Constr. (Lane) Variation ( 000) Revenue 146,196 n.a. n.a. Costs (130,573) n.a. n.a. Operating profit 15, Net financing costs (4) n.a. n.a. Profit before tax 15, Profit from continuing operations 15, Profit for the year 15, Other comprehensive income 782 n.a. n.a. Profit for the year 16, Annual Report as at 31 December 2016
202 Consolidated financial statements as at and for the year ended 31 December 2016 Skanska Granite Lane 31/12/ /12/2015 Variation ( 000) Non-current assets Property, plant and equipment and intangible assets 51 n.a. n.a. Total non-current assets Current assets Cash and cash equivalents and other financial assets 138,987 n.a. n.a. Other current assets 74,321 n.a. n.a. Total current assets 213, Total assets 213, Equity 24, Non-current liabilities Non-current financial liabilities - n.a. n.a. Total non-current liabilities Current liabilities Other current liabilities 189,338 n.a. n.a. Total current liabilities 189, Total liabilities 213, Skanska Granite Lane 31/12/ /12/2015 ( 000 Group share) Opening equity 2,811 - Comprehensive income attributable to the owners of the parent 9,816 n.a. Dividends distributed (5,421) n.a. Closing equity 7,206 - Carrying amount 7,206 - Skanska Granite Lane Variation ( 000) Revenue 336,274 n.a. n.a. Costs (305,727) n.a. n.a. Operating profit 30, Net financing income 1,173 n.a. n.a. Profit before tax 31, Profit from continuing operations 31, Profit for the year 31, Other comprehensive income 1,001 n.a. n.a. Profit for the year 32, Annual Report as at 31 December 2016
203 Consolidated financial statements as at and for the year ended 31 December 2016 I4 Leasing (Lane) 31/12/ /12/2015 Variation ( 000) Non-current assets Property, plant and equipment and intangible assets 50,155 n.a. n.a. Total non-current assets 50, Current assets Cash and cash equivalents and other financial assets 12,972 n.a. n.a. Other current assets 1,362 n.a. n.a. Total current assets 14, Total assets 64, Equity 62, Non-current liabilities Current liabilities Current financial liabilities - n.a. n.a. Other current liabilities 1,679 n.a. n.a. Total current liabilities 1, Total liabilities 64, I4 Leasing (Lane) 31/12/ /12/2015 ( 000 Group share) Opening equity 17,969 - Comprehensive income attributable to the owners of the parent 873 n.a. Dividends distributed - n.a. Capital increases and other variations - n.a. Closing equity 18,842 - Carrying amount 18,842 - I4 Leasing (Lane) Variation ( 000) Revenue 6,810 n.a. n.a. Costs (6,028) n.a. n.a. Operating profit Net financing income 59 n.a. n.a. Profit before tax Profit from continuing operations 841 n.a. n.a. Other comprehensive income 2,071 n.a. n.a. Profit for the year 2, Annual Report as at 31 December 2016
204 Consolidated financial statements as at and for the year ended 31 December 2016 AGL Constructors JV (Lane) 31/12/ /12/2015 Variation ( 000) Non-current assets Property, plant and equipment and intangible assets 26,238 n.a. n.a. Total non-current assets 26, Current assets Cash and cash equivalents and other financial assets 23,950 n.a. n.a. Other current assets 50,136 n.a. n.a. Total current assets 74, Total assets 100, Equity 26, Non-current liabilities Current liabilities Current financial liabilities 76 n.a. n.a. Other current liabilities 73,774 n.a. n.a. Total current liabilities 73, Total liabilities 100, AGL Constructors JV (Lane) 31/12/ /12/2015 ( 000 Group share) Opening equity 7,012 - Comprehensive income attributable to the owners of the parent (19) n.a. Dividends distributed (1,807) n.a. Capital increases and other variations 110 n.a. Closing equity 5,296 - Carrying amount 5,296 - AGL Constructors JV (Lane) Variation ( 000) Revenue 286,238 n.a. n.a. Costs (285,811) n.a. n.a. Operating profit Net financing income (525) n.a. n.a. Profit before tax (98) - - Profit from continuing operations (98) n.a. n.a. Other comprehensive income - n.a. n.a. Profit for the year (98) Annual Report as at 31 December 2016
205 Consolidated financial statements as at and for the year ended 31 December 2016 Gupc (Panama) 31/12/ /12/2015 Variation ( 000) Non-current assets Property, plant and equipment and intangible assets 48,301 80,079 (31,778) Total non-current assets 48,301 80,079 (31,778) Current assets Cash and cash equivalents and other financial assets 14,428 30,296 (15,868) Other current assets 1,420,801 1,357,931 62,870 Total current assets 1,435,229 1,388,227 47,002 Total assets 1,483,530 1,468,306 15,224 Deficit (559,114) (492,519) (66,595) Non-current liabilities Other non-current liabilities 421 1,141 (720) Total non-current liabilities 421 1,141 (720) Current liabilities Current financial liabilities 508, ,832 35,409 Other current liabilities 1,533,982 1,486,852 47,130 Total current liabilities 2,042,223 1,959,684 82,539 Total liabilities 1,483,530 1,468,306 15,224 Gupc (Panama) 31/12/ /12/2015 ( 000 Group share) Opening deficit (189,127) (169,499) Comprehensive expense attributable to the owners of the parent (25,573) (19,657) Capital increases and other variations - 29 Closing deficit (214,700) (189,127) Loan asset 263, ,928 Carrying amount 49,021 22,801 Gupc (Panama) Variation ( 000) Revenue 305, ,265 (607,885) Costs (329,809) (895,765) 565,956 Operating profit (loss) (24,429) 17,500 (41,929) Net financing costs (23,490) (17,727) (5,763) Loss before tax (47,919) (227) (47,692) Income tax expense (104) (116) 12 Loss from continuing operations (48,023) (343) (47,680) Other comprehensive expense (18,572) (50,847) 32,275 Loss for the year (66,595) (51,190) (15,405) 204 Annual Report as at 31 December 2016
206 Consolidated financial statements as at and for the year ended 31 December 2016 The carrying amount of this investment is the balance of the parent s receivable due from the joint venture and the provisions for risks on equity investments set up to reflect the assessment of the losses to complete the contract. Contingent liabilities At the date of preparation of this Report, there were no significant contingent liabilities related to the Group s interests in joint ventures. Any related risk areas are described in the paragraph on Concessions of the Abroad section of the Directors report and, with respect to GUPC, the paragraph on the Main risk factors and uncertainties. Risks associated with the Group s investments in associates and joint ventures Commitments The Group has the following commitments vis-à-vis its associates and joint ventures: ( 000) 31 December December 2015 Variation Commitments 1,727,707 1,156, ,966 The increase is mainly due to guarantees issued on behalf of the nonconsolidated joint ventures of Lane Group ( million), net of the decrease in the guarantees issued on behalf of Pedelombarda S.c.p.A. ( 41.1 million), partially offset by the increase in the guarantees issued on behalf of Iricav 2 Consorzio, which is constructing the high speed/capacity Verona - Padua railway section. Joint operations The Group is involved in the following main joint operations: CMC - Mavundla - Impregilo (South Africa), Civil Work Group (Saudi Arabia), Arge Tulfes Pfons (Austria) and South Al Mutlaa (Kuwait). Salini Impregilo S.p.A. has a direct 39.2% interest in CMC - Mavundla - Impregilo, which is engaged in works for the hydroelectric plant in Ingula. The Civil Work Group, which is engaged in the civil works for the Riyadh metro, is directly owned by the parent (52%) and indirectly through Salini Saudi Arabia (for a total of 66%), in which the group has a 51% interest. The Arge Tulfes Pfons is 49% held directly by Salini Impregilo S.p.A. and is engaged in the construction of the last section of the Brenner-Innsbruck tunnel. The South Al Mutlaa was incorporated during the year and is directly held by Salini Impregilo S.p.A. (55%). It will construct primary urbanisation works to build a new residential area in a 12 thousand hectares site located 40 km northwest of Kuwait City as part of the South Al Mutlaa Housing Project. 205 Annual Report as at 31 December 2016
207 Consolidated financial statements as at and for the year ended 31 December 2016 The above operations are governed by joint control arrangements as resolutions of the governing bodies require a unanimous vote. They are structured as separate vehicles, guaranteeing transparency of their rights and obligations with respect to Salini Impregilo S.p.A Derivatives and non-current financial assets Non-current financial assets of 62.6 million are analysed in the following table: ( 000) 31 December December 2015 Variation Other financial assets 17,877 19,638 (1,761) Loans and receivables - unconsolidated group companies and other related parties 19,005 19,986 (981) Loans and receivables - third parties 25,576 28,208 (2,632) Derivatives Total 62,614 67,832 (5,218) The other financial assets include unlisted guaranteed-return securities which mature after one year. They amount to 18.0 million at year end (31 December 2015: 19.6 million) and mainly comprise units in the fund financing Yuma. Loans and receivables - unconsolidated group companies and other related parties of 19.0 million (31 December 2015, 20 million) mainly relate to loans granted to the UK associates Ochre Holding ( 11.3 million) and Impregilo Wolverhampton ( 0.7 milioni) and the Swiss associates CSC ( 3.8 million) and CEDIV ( 3.2 million), owned by Salini Costruttori S.p.A. Loans and receivables - third parties of 25.6 million decreased by 2.6 million on 31 December 2015 and mainly include: 21.5 million related to the concessions of the indirect subsidiaries Corso del Popolo S.p.A. and Piscine dello Stadio S.r.l.; 3.7 million due from Prime System as a result of the sale of Todini during the year. The decrease in loans and receivables - third parties is mainly due to the reclassification of amounts due before 31 December 2017 from Caminos de Las Sierras and the Cordoba provincial authorities and the recognition of the amount due from Prime System, as mentioned above. Derivatives show the reporting-date fair value of the interest rate hedges. 206 Annual Report as at 31 December 2016
208 Consolidated financial statements as at and for the year ended 31 December 2016 They are broken down below: ( 000) 31 December 2016 Interest rate swaps - Cash flow hedges 156 Total 156 Interest rate hedging derivatives with positive fair value and fair value gains or losses recognised in the hedging reserve Company Agreement date Expiry date Currency Notional amoun Fair value ( ) Lane 10/07/ /08/2021 USD 40,000, ,931 Totale 155, Deferred tax assets and liabilities Deferred tax assets and liabilities amount to million and million at 31 December 2016, respectively, as shown in the following table: ( 000) 31 December December 2015 Variation Deferred tax assets 121,925 64,064 57,861 Deferred tax liabilities (108,493) (55,857) (52,636) Changes in deferred tax assets and liabilities are set out below: 31 December IncreasesDecreases Exchange Change in Change in Re- Other 31 December 2015 rate gains consolidation tax rate classifications changes 2016 ( 000) (losses) scope Deferred tax assets 227,841 28,808 (20,092) (374) 33, , ,430 Offsetting (163,778) (5,727) (169,505) Net deferred tax assets 64,063 28,808 (20,092) (374) 33, , ,925 Deferred tax liabilities (219,635) (17,745) 14,791 5,169 (35,409) - - (25,169) (277,998) Offsetting 163, , ,505 Net deferred tax liabilities (55,857) (17,745) 14,791 5,169 (35,409) - - (19,442) (108,493) Deferred tax assets and liabilities are classified as non-current assets and liabilities, respectively, and are netted at company level when this is allowed. 207 Annual Report as at 31 December 2016
209 Consolidated financial statements as at and for the year ended 31 December 2016 Changes in 2015 were as follows: 31 December IncreasesDecreases Exchange Change in Change in Re- Other 31 December 2014 rate gains consolidation tax rate classifications changes 2015 ( 000) (losses) scope Deferred tax assets 215, ,184 (82,483) (202) (6,943) (5,856) 2,266 (43,250) 227,843 Offsetting (76,725) ,648 - (621) (88,702) (163,779) Net deferred tax assets 138, ,805 (82,483) (202) (5,295) (5,856) 1,645 (131,952) 64,064 Deferred tax liabilities (157,160) (149,722) 52, (8,251) 2,330 (1,655) 41,832 (219,636) Offsetting 76, (1,648) , ,779 Net deferred tax liabilities (80,435) (149,722) 52, (9,899) 2,330 (1,655) 130,534 (55,857) 13. Inventories Inventories total million at the reporting date, as shown in the following table: 31 December December 2015 Gross Allowance Carrying Gross Allowance Carrying Variation ( 000) amount amount amount amount Real estate projects 22,059 (8,597) 13,462 22,085 (8,597) 13,488 (26) Finished products and goods 3,475-3,475 3,448 3, Raw materials, consumables and supplies 256,225 (2,583) 253, ,666 (1,529) 251,137 2,505 Total 281,759 (11,180) 270, ,199 (10,126) 268,073 2,506 Real estate projects Real estate projects amount to 13.5 million, substantially unchanged from the previous year end. They mainly relate to the real estate project of 11.6 million (net of the related allowance of 7.8 million) for the construction of a trade point in Lombardy for which a dispute is pending about the zoning provisions of the area on which the property stands. Based also on its legal advisors opinion, the Group deems that the carrying amount can be recovered through the real estate project or, alternatively, through recognition of the damage incurred due to non-authorisation of the zoning of the area by the competent authorities. Finished products and goods and Raw materials, consumables and supplies The carrying amount of these items totals 3.5 million and million, respectively, and mainly relates to materials and goods to be used for foreign contracts, including those in Ethiopia ( million), those of Lane Industries Incorporated ( 23.5 million), those in Venezuela ( 17.6 million), Colombia ( 9.9 million) and Nigeria ( 7.6 million). 208 Annual Report as at 31 December 2016
210 Consolidated financial statements as at and for the year ended 31 December 2016 The carrying amount of raw materials, consumables and supplies is net of an allowance of 2.6 million, analysed below: 31 December Write-downs Utilisations Reversals Other Exchange 31 December ( 000) 2015 changes rate losses 2016 Allowance - raw materials (1,529) (432) 1, (2,957) (25) (2,583) Total (1,529) (432) 1, (2,957) (25) (2,583) Changes in the prior year are shown in the next table: 31 December Write-downs Utilisations Reversals Other Exchange 31 December ( 000) 2014 changes rate losses 2015 Allowance - raw materials (1,553) (814) (1,529) Total (1,553) (814) (1,529) 14. Contract work in progress Contract work in progress totals 2,367.3 million at the reporting date, up million on the previous year-end figure. The increase includes ongoing production calculated using the most recent estimates of the current contracts profitability. The following table shows contract work in progress calculated using the stage of completion method, net of losses realised or estimated at the reporting date and progress billings: ( 000) 31 December December 2015 Variation Contract work in progress 34,079,424 27,960,191 6,119,233 Progress payments and advances received (on approved work) (31,712,161) (26,184,400) (5,527,761) Total 2,367,263 1,775, ,472 The most significant work in progress relates to railway work in Venezuela ( million), the hydroelectric plants in Ethiopia ( million), the high speed/capacity railway work in Italy ( million), the hydroelectric, road and civil building works in Nigeria ( 64.5 million), the Copenhagen Cityringen Metro in Denmark ( million), the Doha Metro and the Al Bayt Stadium in Al Khor, Qatar ( million), the design and construction of motorways in Romania ( million), the construction of the new metro line as part of the Sydney Metro Northwest Project in Australia ( million) and work in progress in Libya ( million). With respect to the works in Libya, the subsidiary Lidco collected contractual advances in previous years amounting to million at the reporting date, recognised as Advances for contract work in progress under liabilities in the statement of financial position. 209 Annual Report as at 31 December 2016
211 Consolidated financial statements as at and for the year ended 31 December 2016 The item shows an increase over 31 December 2015 mainly due to continuation of production on the contracts in Denmark ( million, due to the Copenhagen Cityringen Metro contract), Qatar ( million, mainly referred to construction of the Al Bayt Stadium in Al Khor and the Red Line North Underground), Tajikistan ( 30.1 million, relating to the construction of an hydroelectric plant), Australia ( 91.0 million, to build the Sydney Metro Northwest Project - Design and Construction of Surface and Viaduct Civil Works) and the US ( 41.5 million, mainly as a result of the work carried out by Lane). The section on the Main risk factors and uncertainties in the Directors report provides information on pending disputes and assets exposed to country risk. The section on the Performance by geographical segment in the Directors report provides more details about the contracts and the progress made on the main contracts. A breakdown of contract work in progress by geographical segment is as follows: ( 000) 31 December December 2015 Variation Italy 453, ,625 53,904 EU (excluding Italy) 462, , ,795 Non-EU 124, ,464 17,956 Asia 75,017 16,310 58,707 Middle East 284, , ,571 Africa 458, ,857 (88,526) North America 30, ,799 Latin America 373, ,251 45,214 Oceania 105,354 14,302 91,052 Total 2,367,263 1,775, , Trade receivables At 31 December 2016, trade receivables amount to 2,359.3 million, a net increase of million compared to 31 December The item includes receivables of million from unconsolidated group companies and other related parties. It is analysed in the following table: ( 000) 31 December December 2015 Variation Third parties 2,203,645 1,380, ,547 Unconsolidated group companies and other related parties 155, ,585 (24,957) Total 2,359,273 1,560, , Annual Report as at 31 December 2016
212 Consolidated financial statements as at and for the year ended 31 December 2016 Trade receivables - third parties may be broken down as follows: ( 000) 31 December December 2015 Variation Trade receivables 2,316,580 1,479, ,839 Allowance for impairment (112,935) (99,643) (13,292) Total 2,203,645 1,380, ,547 The balance relates to amounts due from clients for invoices issued and for work performed and approved by clients but still to be invoiced. The net increase is mainly due to a result of the change in the consolidation scope following Lane s acquisition on 4 January 2016 ( million) and the rise in the Ethiopian branch s trade receivables ( million). The Ethiopian branch recorded a related increase in trade payables for works performed ( million). Settlement of the trade receivables and trade payables takes place concurrently on the basis of the agreements between the parties. The item also includes million due to Fibe by the Campania municipalities for its management services provided under contract until 15 December 2005 and the subsequent transition period (reference should be made to the Main risk factors and uncertainties section in the Directors report for more information about this complicated situation and the directors related assessments. Retentions amount to 126 million at the reporting date compared to 87.3 million at 31 December The allowance for impairment increased by 13.3 million to million at the reporting date and includes impairment losses on trade receivables of 58.1 million (mostly for the Venezuelan branch, the Sierra Leone branch and the head office) and on default interest of 54.8 million (mainly related to Fibe). Impairment losses recognised during the year totalled 20.3 million and are mainly attributable to the Venezuelan branch for delays in payments by clients, described in the paragraph on Venezuela in the section on the Main risk factors and uncertainties in the Directors report. 211 Annual Report as at 31 December 2016
213 Consolidated financial statements as at and for the year ended 31 December 2016 Changes in the allowance are shown in the next table: 31 December Impairment Utilisations Reversals Change in Other Exchange 31 December 2015 losses consolidation changes rate gains 2016 ( 000) scope Trade receivables 43,817 20,375 (1,272) (7,671) 2,677 (73) ,130 Default interest 55, (1,073) ,806 Total 99,643 20,375 (1,272) (8,744) 2,677 (59) ,936 Changes in the previous year are as follows: 31 December Impairment Utilisations Reversals Change in Other Exchange 31 December 2015 losses consolidation changes rate gains 2016 ( 000) scope Trade receivables 41,098 5,269 (6,722) (950) - 2,999 2,123 43,817 Default interest 59, (3,079) - - (1,014) 35 55,826 Total 100,896 5,355 (9,801) (950) - 1,985 2,158 99,643 Trade receivables from unconsolidated group companies and other related parties decreased by 25 million to million at 31 December The item mainly comprises trade receivables from unconsolidated SPEs for work carried out by them under contracts with Italian and foreign public administrations. The balance includes 2 million equal to the Group s share of the SPEs cash and cash equivalents. It is shown in the item Net financial position with unconsolidated SPEs in the schedule of the Group s net financial indebtedness. The decrease is principally attributable to the reduction in the receivable due from the consortium company Metro Blu s.c.r.l. which is involved in constructing Line 4 of the Milan Metro. 16. Derivatives and other current financial assets At 31 December 2016, this item of million (31 December 2015, million) includes the following: ( 000) 31 December December 2015 Variation Government bonds and insurance shares 6,846 2,815 4,031 Loans and receivables - third parties 138, ,693 (26,538) Loans and receivables - unconsolidated group companies and related parties 178, ,596 33,796 Total 323, ,104 11, Annual Report as at 31 December 2016
214 Consolidated financial statements as at and for the year ended 31 December 2016 The government bonds and insurance shares amount to 6.8 million compared to 2.8 million at 31 December The item includes unlisted guaranteed-return securities with maturities of less than one year. The increase in the year is principally due to the investment in securities by the Argentine subsidiary Impregilo Healy Ute, which was awarded the Riachuelo contract in Argentina. Loans and receivables - third parties mainly consist of: 67.9 million due from the CAV.TO.MI Consortium related to the amounts paid as a result of the Appeal Court ruling of 23 September The Group deems this receivable to be recoverable, also based on its legal advisors opinion and the ongoing negotiations with the counterparty. The section on the Main risk factors and uncertainties in the Directors report provides more information; 16.1 million, which is the current portion of the amount due from Prime System Kz Ltd for the sale of Todini Costruzioni Generali S.p.A.; 13.5 million due from the Romanian Ministry for Infrastructure and Transportation related to the surety enforced during the year as a result of the disputes with the customer about the Orastie-Sibiu motorway contract. The Group is confident that it will recover this amount, based also on the opinion of its legal advisors assisting it with the disputes. The section on the Main risks and uncertainties in the Directors report provides more information; 9.6 million, relating to the subsidiary Impregilo International Infrastructures N.V., which is the current portion of the amount due for the sale of the investment in the Argentine operator Caminos de Las Sierras to the Cordoba provincial authorities (Argentina) in This amount bears interest at 9.50% and is comprised as follows: - the amount due from Caminos de Las Sierras, related to the loan granted by Impregilo International Infrastructures to the Argentine operator in the past, which was restructured as part of the sales agreements. The outstanding balance due within one year at the reporting date is 7.8 million; - the amount due from the Cordoba provincial authorities, which also refers to the sale of the investment in Caminos de Las Sierras and amounts to 1.8 million due within one year. To date, these amounts have been currently regularly collected in accordance with the related contractual terms. 213 Annual Report as at 31 December 2016
215 Consolidated financial statements as at and for the year ended 31 December 2016 During the second half of 2016, the Group collected 29.9 million and 18.4 million, which were outstanding at 31 December 2015 due to the surety enforced in 2014 for the delay in the Metro 6 (Chile) works and for the sale of TEEM S.p.A., respectively. Loans and receivables with unconsolidated group companies and other related companies mainly consist of: million due from Consorzio OIV Tocoma, the SPE in charge of a hydroelectric project in Venezuela; 14.4 million due from the owners of Salerno Reggio Calabria S.c.p.A and Cociv Consortium; 6.0 million due from Salini Costruttori S.p.A., principally relating to its participation in the VAT consolidation scheme. At 31 December 2015, this item amounted to 14.5 million; 4.3 million due from the SPE Linea M4 S.p.A. for the loan granted to it in January 2016; this SPE was set up to design, build, maintain and operate the M4 line of the Milan metro under concession from the Milan municipality and to provide the related public service. 17. Current tax assets Current tax assets amount to million as follows: and other current tax assets ( 000) 31 December December 2015 Variation Direct taxes 53,118 56,387 (3,269) IRAP Foreign direct taxes 81,912 57,327 24,585 Total 135, ,577 21,410 The 31 December 2016 balance mainly consists of: direct tax assets for excess taxes paid in previous years, which the Group has correctly claimed for reimbursement and which bear interest; foreign direct tax assets for excess taxes paid abroad by the foreign group companies which will be recovered as per the relevant legislation. 214 Annual Report as at 31 December 2016
216 Consolidated financial statements as at and for the year ended 31 December 2016 Other current tax assets increased by 3.9 million to million at the reporting date as follows: ( 000) 31 December December 2015 Variation VAT 129, ,035 22,555 Other indirect taxes 16,913 35,617 (18,704) Total 146, ,652 3,851 VAT assets include 93.7 million due from the Italian taxation authorities and 35.9 million from foreign taxation authorities. 18. Other current assets Other current assets of million show an increase of 72.6 million on the previous year end and may be analysed as follows: ( 000) 31 December December 2015 Variation Other 275, ,636 57,541 Advances to suppliers 197, ,268 18,146 Other - unconsolidated group companies and other related parties 35,623 33,882 1,741 Prepayments and accrued income 83,057 87,856 (4,799) Total 591, ,642 72,629 Other increased by 57.5 million, mainly due to the different consolidation scope following acquisition of Lane and the larger amounts due from the Group s partners. Specifically, they include: 71.4 million (substantially unchanged from 31 December 2015) due from the public bodies involved in managing the waste emergency in Campania to Fibe. The section on the USW Campania projects and related assessments in the section of the Directors report on the Main risk factors and uncertainties provides more information about these projects; 37.2 million due from the Argentine Republic as compensation for damage following the favourable award issued on 21 June 2011 and confirmed by the Buenos Aires Arbitration Tribunal on 24 January This award settled the proceedings commenced by the shareholders of the investee Aguas del Buenos Aires S.A. in liquidation (operator) against the Argentine Republic; 215 Annual Report as at 31 December 2016
217 Consolidated financial statements as at and for the year ended 31 December million due from some of the Group s partners of joint ventures around the world, mainly for the works for the housing project in South Al Mutlaa (Kuwait) and hydroelectric works in South Africa; 22.1 million related to Lane mainly for insurance policies taken out for key management personnel and a new project being developed in Qatar. Advances to suppliers increased by 18.1 million over 31 December 2015, due to the advances made for the Tajikistani contract for the construction of a new hydroelectric power plant and the Australian contract for the construction of a railway line in Perth. They were partially offset by the use of advances made in previous years for the metro lines in Copenhagen, Denmark and Doha, Qatar, as well as for road works in Colombia. Other - unconsolidated group companies and other related parties increased by 1.7 million to 35.6 million, as a result of a reduction in the amount due from OIV Tocoma Consortium, offset by an increase in the amount due from the Argentine investee engaged in the construction of two prisons in the Buenos Aires area. Prepayments and accrued income of 83.1 million show a decrease of 4.8 million on 31 December The item mainly consists of insurance premiums, commissions on sureties and other contract costs which will be recognised in profit or loss in future periods based on the stage of completion of the related contracts. The decrease, shown in the following table, is mainly due to the Riyadh Metro Line 3 contract in Saudia Arabia, partly offset by the increase generated by the Australian works on the railway line and Lane s new contracts in America. This item is summarised in the following table: ( 000) 31 December December 2015 Variation Accrued income: - Other Total accrued income Prepayments: - Insurance 43,912 41,024 2,888 - Sureties 5,722 6,180 (458) - Other contract costs 33,014 40,351 (7,337) Total prepayments 82,648 87,555 (4,907) Total 83,057 87,856 (4,799) 216 Annual Report as at 31 December 2016
218 Consolidated financial statements as at and for the year ended 31 December Cash and cash equivalents At 31 December 2016, cash and cash equivalents amount to 1,602.7 million, up by million, as shown below: ( 000) 31 December December 2015 Variation Cash and cash equivalents 1,602,721 1,410, ,946 A breakdown by geographical segment is as follows: ( 000) 31 December December 2015 Variation Italy 259, ,922 5,351 EU (excluding Italy) 101, ,975 (37,110) Non-EU 15,569 26,715 (11,146) Asia 42,281 33,388 8,893 Middle East 790, ,495 18,505 Africa 116,037 65,808 50,229 North America 160,487 45, ,443 Latin America 71,209 47,051 24,158 Oceania 46,000 28,377 17,623 Total 1,602,721 1,410, ,946 The balance includes bank account credit balances at the end of the current year and the amounts of cash, cheques and valuables at the registered offices, work sites and foreign subsidiaries. Liquidity management is designed to ensure the financial independence of ongoing contracts, considering the structure of the consortia and SPEs, which may limit the availability of financial resources to achievement of the related projects. Liquidity management also considers the existence of constraints to the transfer of currency imposed by certain countries. The statement of cash flows shows the reason for the increase in the item and changes in current account facilities (Note 22). Imprepar s deposits include 5.5 million collected by it on behalf of third parties. Parking Glasgow s cash and cash equivalents are tied to specific claims for 0.5 million. At the reporting date, the cash and cash equivalents attributable to non-controlling interests of the consolidated SPEs amount to million and mainly refer to the Red Line North Underground and the Al Bayt Stadium in Al Khor, Qatar. 217 Annual Report as at 31 December 2016
219 Consolidated financial statements as at and for the year ended 31 December Non-current assets (liabilities) held for sale and discontinued operations and profit from discontinued operations Non-current assets held for sale are shown in the following table with the associated liabilities: ( 000) 31 December December 2015 Variation Non-current assets held for sale 6, ,606 (141,574) Liabilities directly associated with non-current assets held for sale - (106,012) 106,012 Total 6,032 41,594 (35,562) The 35.6 million reduction in this caption is due to the sale of Todini Costruzioni Generali to Prime System Kz Ltd on 4 April A breakdown of this item is as follows: 31 December 2016 Business Business USW Total unit B unit A Campania ( 000) Todini HCE (*) Non-current assets 348-5,683 6,032 Non-current assets held for sale 348-5,683 6, December 2015 Business Business USW Total unit B unit A Campania ( 000) Todini HCE (*) Non-current assets 31, ,683 37,974 Current assets 80,330 29, ,632 Non-current assets held for sale 112,076 29,847 5, ,606 Non-current liabilities (30,485) - - (30,485) Current liabilities (45,679) (29,849) - (75,528) Liabilities directly associated with non-current assets held for sale (76,164) (29,849) - (106,013) Total 35,912 (2) 5,683 41,593 - including net financial indebtedness (7,274) (11,665) - (18,939) (*) Assets belonging to the Todini Costruzioni Generali business unit identified as Business unit A - Italian operating contracts. These assets were contributed by Todini Costruzioni Generali to HCE Costruzioni S.p.A. in the first quarter of 2016, HCE was subsequently sold to Salini Impregilo S.p.A. 218 Annual Report as at 31 December 2016
220 Consolidated financial statements as at and for the year ended 31 December 2016 The loss from discontinued operations in 2016 and 2015 is analysed in the following tables: 2016 Business unit B I INT IN. USW Total ( 000) Todini Campania Revenue Operating revenue 17, ,359 Other revenue 1, ,522 Total 18, ,881 Costs Costi per servizi - - (1,072) (1,072) Other operating expenses (701) - - (701) Personnel expense (17,321) - - (17,321) Total costs (18,022) - (1,072) (19,094) Operating profit (loss) (1,072) (213) Financing income (costs) and gains (losses) on equity investments Financial income Financial expense (14,890) - - (14,890) Net financing costs (13,896) - - (13,896) Net financing costs and net gains (losses) on equity investments (13,896) - - (13,896) Loss before tax (13,037) - (1,072) (14,109) Income tax expense - (6,555) - (6,555) Loss from discontinued operations (13,037) (6,555) (1,072) (20,664) 2015 Business unit B USW Total ( 000) Todini Campania Revenue Operating revenue 179, ,328 Other revenue 13,363-13,363 Total 192, ,692 Costs Raw materials and consumables (46,536) - (46,536) Subcontracts (75,946) - (75,946) Services (24,396) (542) (24,938) Personnel expense (2,328) - (2,328) Other operating expenses (16,926) - (16,926) Amortisation, depreciation, provisions and impairment losses (31,931) (4,505) (36,436) Total costs (198,063) (5,047) (203,110) Operating loss (5,371) (5,047) (10,418) Financing income (costs) and gains (losses) on equity investments Financial income Financial expense (22) - (22) Net exchange rate gains 2,870-2,870 Net financing income 2,876-2,876 Net gains on equity investments 1-1 Net financing income and net gains on equity investments 2,877-2,877 Loss before tax (2,494) (5,047) (7,541) Income tax expense (3,149) - (3,149) Loss from discontinued operations (5,643) (5,047) (10,690) 219 Annual Report as at 31 December 2016
221 Consolidated financial statements as at and for the year ended 31 December Equity Equity increased to 1,361.3 million at 31 December 2016 from 1,216.9 million at the end of 2015 as follows: ( 000) 31 December December 2015 Variation Equity attributable to the owners of the parent Share capital 544, ,740 - Share premium reserve 120, , Legal reserve 103, ,535 1,786 - Reserve for share capital increase related charges (3,970) (3,970) - - Reserve for treasury shares (7,677) (7,677) - - LTI reserve 4, ,102 - Extraordinary and other reserves Total other reserves 96,051 90,163 5,888 Other comprehensive income (expense) - Translation reserve 48,529 (11,194) 59,723 - Hedging reserve (533) (8,085) 7,552 - Actuarial reserve (909) (5,273) 4,364 Total other comprehensive income (expense) 47,087 (24,552) 71,639 Retained earnings 336, ,259 12,147 Profit for the year 59,921 60,592 (671) Equity attributable to the owners of the parent 1,205,003 1,116,000 89,003 Share capital and reserves attributable to non-controlling interests 116,733 79,221 37,512 Profit for the year attributable to non-controlling interests 39,593 21,639 17,954 Share capital and reserves attributable to non-controlling interests 156, ,860 55,466 Total equity 1,361,329 1,216, ,469 Changes of the year in the different equity items are summarised in the relevant schedule of the consolidated financial statements. Specifically, in their meeting held on 28 April 2016, the parent s shareholders resolved to allocate the profit for 2015 as follows: 1,786,530.08, equal to 5% of the profit for the year, to the legal reserve; 19,562, as a dividend to the holders of ordinary shares, equal to 0.04 per share; 420, as a dividend to the holders of savings shares, equal to 0.26 per share; 13,961, to retained earnings. 220 Annual Report as at 31 December 2016
222 Consolidated financial statements as at and for the year ended 31 December 2016 At 31 December 2016, the parent s fully paid-up share capital amounts to 544,740,000. It comprises 493,798,182 shares, including 492,172,691 ordinary shares and 1,615,491 savings shares, all without a nominal amount. Savings shares issued pursuant to the law do not carry voting rights, have preference dividend and capital repayment rights and can be bearer shares, subject to the provisions of article of the Italian Civil Code. Upon the shareholder s requests and at their own expense, they can be converted into registered shares and vice versa. Savings shares held by directors, statutory auditors and CEOs are registered. Except when the parent s by-laws or relevant legislation provide for otherwise, savings shares give the holders the same rights as those of ordinary shares. Holders of savings shares do not have the right to attend the parent s shareholders meetings or to request that they are called. The special savings shareholders meeting is regulated by law. When reserves are distributed, the savings shares have the same rights as ordinary shares. Upon dissolution of the parent, savings shares bear preference rights to capital repayment, up to 5.2 per share. When shares are grouped or split (as well as when capital transactions are carried out and as necessary in order to protect the savings shareholders rights in the case the shares have nominal value), the above fixed amount shall be adjusted accordingly. Profit for the year as per the financial statements is allocated as follows: a) 5% to the legal reserve, up to the legally-required amount; b) to savings shares, to the extent of 5% of 5.2 per share (i.e., 0.26 per share). If a dividend lower than 5% of 5.2 per share (i.e., 0.26 per share) is paid one year, the difference is taken as an increase in the preferred dividend of the following two years; c) the residual amount, to all shareholders in such a way as to allocate to savings shares a total dividend which is 2% of 5.2 per share (i.e., per share) greater than that distributed to ordinary shares, except when the shareholders decide to allocate an amount to the extraordinary reserves or for other uses. The reserve for treasury shares is unchanged from 31 December The Group launched the repurchase programme on 6 October 2014 and has bought back 3,104,377 shares for 7,676, Annual Report as at 31 December 2016
223 Consolidated financial statements as at and for the year ended 31 December 2016 The LTI (long term incentive plan) reserve shows the fair value of 4.2 million of this plan rolled out in The section on the accounting policies describes how the reserve is treated. The following table provides a breakdown of the reserve: (Euro) No, of shares Amount Start date End date Average price Fair value Chief executive officer 569,573 2,198, /12/ /4/ , Key management personnel 983,286 3,803, /12/ /4/ ,658, Other managers 958,732 3,708, /12/ /4/ ,617, Total 2,511,591 9,710, ,241, The main variation in other comprehensive income items relates to the effect of fluctuations in exchange rates as shown below: ( 000) Opening balance (11,194) 15,575 Reclassification to profit or loss 13,171 - Equity-accounted investees 1, Increase (decrease) 45,041 (26,997) Total changes 59,723 (26,769) Closing balance 48,529 (11,194) The effect of changes in the hedging reserve due to fair value gains (losses) on financial instruments is detailed below: ( 000) Opening balance (8,085) 1,987 Reclassification of fair value gains/losses on settled transactions to profit or loss Net fair value losses (3,490) (10,113) Change in consolidation scope Net exchange rate losses and other changes 9,920 (299) Net losses for equity-accounted investees (28) (243) Total changes 7,552 (10,072) Closing balance (533) (8,085) The actuarial reserve underwent the following changes: ( 000) Opening balance (5,273) (5,447) Reclassifications Net actuarial gains (losses) recognised in OCI 4,364 (570) Closing balance (909) (5,273) 222 Annual Report as at 31 December 2016
224 Consolidated financial statements as at and for the year ended 31 December 2016 Retained earnings This item may be analysed as follows: ( 000) Opening balance 324, ,988 Allocation of profit 58,806 92,237 Dividend distribution (19,983) (19,983) Reclassifications - (651) Change in consolidation scope (26,676) 2,668 Closing balance 336, ,259 Share capital and reserves attributable to non-controlling interests Share capital and reserves attributable to non-controlling interests are as follows: ( 000) Opening balance 100,860 76,513 Capital increase (decrease) (73) 11,295 Profit attributable to non-controlling interests 39,594 21,639 Dividend distribution to non-controlling interests (23,672) (2,938) Change in consolidation scope 35,562 (4,306) Other changes Comprehensive expense 3,531 (1,343) Closing balance 156, ,860 At the reporting date, the Group s significant not wholly owned subsidiaries are: ( m) Head office Business % of ordinary shares held directly by the parent % of ordinary shares held by the Group % of ordinary shares held by noncontrolling investors % of preference shares held by the Group Noncontrolling interests Salerno-Reggio Calabria S.c.p.A. Italy Construction 51% 51% 49% 0% 24.5 Reggio Calabria - Scilla S.c.p.A. Italy Construction 51% 51% 49% 0% 17.1 Società Autostrada Broni - Mortara S.p.A. (SA.BRO.M) Italy Concessions 60% 60% 40% 0% 10.9 Impregilo-SK E&C-Galfar al Misnad JV Qatar Construction 41.25% 41.25% 58.75% 0% 19.4 Lane Industries Incorporated (*) USA Construction 100% 100% n.a. 0% 14.7 Salini Saudi Arabia Saudi Arabia Construction 51% 51% 49% 0% 30.4 Other 39.3 Total non-controlling interests (*) Lane Group has interests in joint operations, mainly Lane-Ds-Ns Consortium ( 4.2 million), Lane Corman ( 3.3 million), Lane Abrams ( 3.8 million) and Lane-National Contracting Jv (Sharjah) ( 2.1 million). 223 Annual Report as at 31 December 2016
225 Consolidated financial statements as at and for the year ended 31 December 2016 A complete list of not wholly-owned subsidiaries is given in the Consolidation scope table at the end of these notes. Summary of financial information of subsidiaries with significant non-controlling interests Access to the assets of Italian law consortia and consortium companies and foreign SPES and the possibility of using them to settle the Group s liabilities is generally subject to approval by qualified majorities of the members, in order to protect the operating requirements of their contracts. The following table summarises the financial information of each company in which the Group has an investment that has significant non-controlling interests: Salerno-Reggio Calabria S.c.p.A. 31 December December 2015 Variation ( 000) Statement of financial position Assets Non-current assets (113) Current assets 247, ,753 (30,569) Total assets 247, ,932 (30,682) Equity and liabilities Equity 50,000 50,000 - Non-current liabilities (3) Current liabilities 197, ,912 (30,679) Total equity and liabilities 247, ,932 (30,682) Income statement Variation Revenue 18,567 38,070 (19,503) Profit before tax (329) Income taxes (130) (391) 261 Profitfor the year - 67 (67) Comprehensive income - 68 (68) Comprehensive income attributable to non-controlling interests - 33 (33) Statement of cash flows 2016 Net cash flows used in operating activities (12,479) Net cash flows used in financing activities (1,940) Net increase in cash and cash equivalents and current account overdrafts (14,419) Opening cash and cash equivalents and current account overdrafts 25,040 Closing cash and cash equivalents and current account overdrafts 10, Annual Report as at 31 December 2016
226 Consolidated financial statements as at and for the year ended 31 December 2016 Reggio Calabria - Scilla S.c.p.A. 31 December December 2015 Variation ( 000) Statement of financial position Assets Non-current assets (410) Current assets 123, ,760 (6,964) Total assets 123, ,259 (7,374) Equity and liabilities Equity 35,000 35,000 - Non-current liabilities (75) Current liabilities 88,587 95,885 (7,298) Total equity and liabilities 123, ,259 (7,373) Income statement Variation Revenue 14,963 34,940 (19,977) Profit before tax Income taxes (371) (262) (109) Profit for the year Comprehensive income Comprehensive income attributable to non-controlling interests Statement of cash flows 2016 Net cash flows used in operating activities (19,093) Net cash flows used in investing activities (251) Net cash flows used in financing activities 8,065 Net increase in cash and cash equivalents and current account overdrafts (11,279) Opening cash and cash equivalents and current account overdrafts 16,732 Closing cash and cash equivalents and current account overdrafts 5,453 Società Autostrada Broni - Mortara S.p.A. 31 December December 2015 Variation ( 000) Statement of financial position Assets Non-current assets 44,229 43, Current assets 2,127 5,044 (2,917) Total assets 46,356 48,535 (2,179) Equity and liabilities Equity 27,099 27,128 (29) Non-current liabilities 19,257 21,407 (2,150) Total equity and liabilities 46,356 48,535 (2,179) Income statement Variation Revenue Profit before tax (55) (393) 338 Income taxes (101) Profit for the year (30) (267) 237 Comprehensive income (30) (267) 237 Comprehensive income attributable to non-controlling interests (12) (107) 95 Statement of cash flows 2016 Net cash flows used in operating activities (651) Net cash flows used in financing activities (2,107) Net increase in cash and cash equivalents and current account overdrafts (2,758) Opening cash and cash equivalents and current account overdrafts 3,552 Closing cash and cash equivalents and current account overdrafts Annual Report as at 31 December 2016
227 Consolidated financial statements as at and for the year ended 31 December 2016 Salini-Kolin-GCF joint venture (Turkey) 31 December December 2015 Variation ( 000) Statement of financial position Assets Non-current assets (39) Current assets 13,826 45,902 (32,076) Total assets 13,908 46,023 (32,115) Equity and liabilities Equity 4 19,202 (19,198) Non-current liabilities - 3,038 (3,038) Current liabilities 13,904 23,783 (9,879) Total equity and liabilities 13,908 46,023 (32,115) Income statement Variation Revenue 3,145 13,925 (10,780) Profit before tax (567) 7,438 (8,005) Income taxes 3,038-3,038 Profitfor the year 2,471 7,438 (4,967) Other comprehensive income Comprehensive income 2,861 7,541 (4,680) Comprehensive income attributable to non-controlling interests 1,774 4,675 (2,901) Dividends paid to non-controlling interests 13,676-13,676 Statement of cash flows 2016 Net cash flows used in operating activities 5,772 Net cash flows used in investing activities (3) Net cash flows used in financing activities (19,979) Net increase in cash and cash equivalents and current account overdrafts (14,210) Opening cash and cash equivalents and current account overdrafts 15,573 Closing cash and cash equivalents and current account overdrafts 1, Annual Report as at 31 December 2016
228 Consolidated financial statements as at and for the year ended 31 December 2016 Impregilo-SK E&C-Galfar al Misnad J.V. (Qatar) 31 December December 2015 Variazione ( 000) Statement of financial position Assets Non-current assets 41,872 74,993 (33,121) Current assets 294, , ,263 Total assets 336, ,638 90,142 Equity and liabilities Equity 33,060 24,632 8,428 Non-current liabilities 2,276-2,276 Current liabilities 301, ,006 79,437 Total equity and liabilities 336, ,638 90,141 Income statement Variation Revenue 427, ,719 87,708 Profit before tax 7,257 13,852 (6,595) Profitfor the year 7,257 13,852 (6,595) Other comprehensive income 1, Comprehensive income 8,429 14,717 (6,288) Comprehensive income attributable to non-controlling interests 4,952 8,646 (3,694) Statement of cash flows 2016 Net cash flows used in operating activities 6,313 Net cash flows generated by investing activities 8,213 Net cash flows used in financing activities 42,204 Net increase in cash and cash equivalents and current account overdrafts 56,730 Opening cash and cash equivalents and current account overdrafts 94,219 Closing cash and cash equivalents and current account overdrafts 150, Annual Report as at 31 December 2016
229 Consolidated financial statements as at and for the year ended 31 December 2016 Salini Saudi Arabia Ltd Co 31 December December 2015 Variation ( 000) Statement of financial position Assets Non-current assets 6,234-6,234 Current assets 167, ,316 Total assets 173, ,550 Equity and liabilities Equity 46,129-46,129 Non-current liabilities Current liabilities 127, ,389 Total equity and liabilities 173, ,550 Income statement Variation Revenue 30,056-30,056 Profit before tax 8,284-8,284 Income taxes (1,086) - (1,086) Profit for the year 7,198-7,198 Other comprehensive income Comprehensive income 7,779-7,779 Comprehensive income attributable to non-controlling interests 3,812-3,812 Statement of cash flows 2016 Net cash flows generated by operating activities 37,726 Net cash flows used in investing activities (2,844) Net cash flows generated by financing activities 84,252 Net increase in cash and cash equivalents and current account overdrafts 119,134 Closing cash and cash equivalents and current account overdrafts 119,134 Reconciliation between equity and profit of Salini Impregilo S.p.A. with consolidated equity and consolidated profit The following table shows the reconciliation of equity and profit of the parent with ( 000) Equity Profit for the year Equity and profit for the year of Salini Impregilo S.p.A. 1,007,428 64,603 Elimination of consolidated investments (1,053,278) 34,127 Elimination of the provision for risks on equity investments 57,660 83,233 Equity and profit or loss of consolidated companies 1,132,712 (68,796) Other consolidation entries Elimination of dividends of consolidated entities - (44,082) Other consolidation entries Gains (losses) on intragroup sales (4,229) 2,256 Purchase Price Allocation 20,600 (185) Unrealised net exchange rate gains (losses) 500 (8,255) Tax effects 19,865 (3,589) Elimination of national tax consolidation system effects 23, Equity and profit for the year attributable to the owners of the parent 1,205,004 59,923 Equity and profit for the year attributable to non-controlling interests 156,325 39,592 Consolidated equity and profit for the year 1,361,329 99, Annual Report as at 31 December 2016
230 Consolidated financial statements as at and for the year ended 31 December Bank and other loans, current portion of bank loans and current account facilities Bank and other loans and borrowings decreased by 19.4 million over 31 December 2015 to 1,265.0 million at year end, as summarised below: ( 000) 31 December December 2015 Variation Non-current portion - Bank and other loans and borrowings 866, , ,807 Current portion - Current account facilities and other loans 398, ,802 (140,213) Total 1,264,950 1,284,356 (19,406) The Group s financial indebtedness is broken down by loan type in the following table: 31 December December 2015 ( 000) Non-current Current Total Non-current Current Total Bank corporate loans 753,740 45, , , , ,061 Bank constructions loans 82,056 88, ,942 38,954 76, ,474 Bank concession financing 22,253 19,337 41,590 24,776 21,301 46,077 Financing and loans of companies in liquidation 2,136-2,136 2,136-2,136 Other financing 5,827 11,937 17,764 7,782 53,036 60,818 Total bank and other loans and borrowings 866, ,191 1,031, , ,590 1,094,566 Current account facilities - 51,297 51, , ,615 Factoring liabilities , , ,763 59,707 Loans and borrowings - unconsolidated group companies - 58,894 58,894 3,634 10,834 14,468 Total 866, ,589 1,264, , ,802 1,284,356 Bank corporate loans Bank corporate loans amount to million at the reporting date (31 December 2015: million) and refer to the parent. They have been granted by major banks and have repayment plans which provide for payment of the last instalments in The interest rates have floating spreads depending on the loan term and conditions. The decision to apply the Euribor (1, 2, 3 or 6 months) has been contractually provided for to the benefit of Salini Impregilo. 229 Annual Report as at 31 December 2016
231 Consolidated financial statements as at and for the year ended 31 December 2016 The main conditions of the bank corporate loans in place at 31 December 2016 are as follows: Company Interest Expiry date Note rate Bank syndicate - Refinancing Facility A Salini Impregilo Euribor 2019 (1) Bank syndicate - Refinancing Facility B Salini Impregilo Euribor 2020 (1) Banca Popolare dell Emilia Romagna Salini Impregilo Euribor 2019 Monte dei Paschi di Siena Salini Impregilo Fixed 2019 (1) Banca Popolare di Bergamo Salini Impregilo Fixed 2019 Banca Popolare di Milano Salini Impregilo Euribor 2021 (1) Banca IMI ( 102 million) Salini Impregilo Euribor 2021 (1) Banca IMI ( 150 million) Salini Impregilo Euribor 2020 (1) Banca del Mezzogiorno Salini Impregilo Euribor 2017 (1) The loans are backed by covenants that establish the requirement for the borrower to maintain certain financial and equity ratios, which at the date of this Annual Report are fully respected. During the year, the Group negotiated loans with Banca IMI ( million and million), Monte dei Paschi di Siena ( 70.0 million), Banca Popolare di Milano ( 50 million) and Banca Popolare di Bergamo ( 40.0 million). The Banca IMI loan of million agreed in January 2016 was taken out to acquire Lane Group and the Group repaid it in full after the bond issue described in Note 23. The non-current portion of the above loans will be repaid at their contractual maturity, based on the following time bands: Company Country Total non- Due after 13 Due after 25 Due after current portion months but months but 60 months ( 000) within 24 months within 60 months Banca IMI Refinancing (Facility B) Salini Impregilo Italy 162, ,640 - Banca IMI ( 150 million) Salini Impregilo Italy 148, ,468 - Banca IMI Refinancing (Facility A) Salini Impregilo Italy 126, ,440 2,772 - Banca IMI ( 102 million) Salini Impregilo Italy 91,630 20,420 71,210 - Monte dei Paschi di Siena Salini Impregilo Italy 119, ,543 - Banca Poplare di Milano Salini Impregilo Italy 40,344 9,754 30,590 - Banca Popolare di Bergamo Salini Impregilo Italy 39,904-39,904 - BPER Salini Impregilo Italy 25,000 12,500 12,500 - Total 753, , ,626 - The fair value of the bank corporate loans, measured as set out in the Accounting policies section, is million. 230 Annual Report as at 31 December 2016
232 Consolidated financial statements as at and for the year ended 31 December 2016 Bank construction loans Construction loans of million at 31 December 2016 mainly relate to the contracts in Colombia ( 34.3 million), North America ( 53.4 million), the Metro B1 contract ( 19.9 million) and the contracts in Nigeria ( 5.9 million). The rise is mostly due to the increase recorded for Lane s contracts ( 53.4 million) and those in Colombia ( 47.6 million) and the decrease on the subsidiary HCE s projects ( 10.9 million), the projects in the United Arab Emirates ( 10.3 million) and Morocco ( 5.9 million). The conditions of the main construction loans in place at year end may be summarised as follows: Company Country Interest Expiry rate date Banco de Bogotà Consorzio OHL Colombia DTF 2017 Banco Stato del Ticino CSC Switzerland Fixed 2017 UniCredit Lane Industries USA Prime 2021 Doha Bank S.A. Lane Industries Qatar Fixed 2017 Skye Bank Salini Nigeria Nigeria Fixed 2017 Banco de Bogotà Ariguani Colombia IBR 2017 Banca del Mezzogiorno Metro B1 Italy Euribor 2019 The interest rates shown in the table have floating spreads depending on the term and conditions of the loans. The non-current portion of the above construction loans will be repaid at its contractual maturity, based on the following time bands: Company Country Total non- Due after 13 Due after 25 Due after current portion months but months but 60 months ( 000) within 24 months within 60 months Various banks Lane Industries 33,906 10,189 23,717 - Various banks Ancipa Italy 20,505 20, Banca del Mezzogiorno Metro B1 Italy 19,895 19, Various banks Pietrarossa Italy 6,506 6, Various banks Diga di Ancipa Italy 1,232 1, Various banks Venezuelan branch Venezuela Total 82,056 58,339 23,717 - The fair value of the construction loans, measured as set out in the Accounting policies section, is million. 231 Annual Report as at 31 December 2016
233 Consolidated financial statements as at and for the year ended 31 December 2016 Bank concession financing At 31 December 2016, bank concession financing amounts to million and refers to the Piscine dello Stadio, Corso del Popolo and Parking Glasgow concessions and the Broni-Mortara (SA.BRO.M.) motorway concession. 31 December December 2015 Company Currency Country Total Current Non- Total Current Non- ( 000) loans current loans current UniCredit S.A.BRO.M Euro Italy 18,152 18,152 20,160 20,160 - Royal Bank Impregilo of Scotland Parking Glasgow Sterling UK 8, ,137 10, ,916 Monte dei Paschi Corso del Popolo Euro Italy 8, ,808 8, ,337 di Siena S.p.A. Credito Sportivo Piscine dello Euro Italy 6, ,308 6, ,523 Stadio S.r.l. Total 41,590 19,337 22,253 46,076 21,301 24,776 The outstanding financing from Royal Bank of Scotland is included in the construction loans category and is secured by the revenue flows arising from the activities carried out under the related concessions. An interest rate hedge has been agreed for this financing (see Note 25). The financing agreement includes a number of covenants, all of which the operator had complied with at the reporting date. The main conditions of the bank concession financing in place at 31 December 2016 are as follows: Company Country Interest Expiry rate date Royal Bank of Scotland Impregilo Parking Glasgow GB Libor 2029 Monte dei Paschi di Siena Corso del Popolo S.p.A. Italy Euribor 2028 Credito Sportivo Piscine dello Stadio Italy IRS 2035 UniCredit SA.BRO.M. Italy Euribor 2017 The interest rates shown in the table have floating spreads depending on the term and conditions of the financing. 232 Annual Report as at 31 December 2016
234 Consolidated financial statements as at and for the year ended 31 December 2016 The non-current portion of the above bank concession financing will be repaid at their contractual maturity, based on the following time bands: Company Country Total non- Due after 13 Due after 25 Due after current portion months but months but 60 months ( 000) within 24 months within 60 months Royal Bank of Scotland Impregilo Parking Glasgow UK 8, ,381 6,337 Monte dei Paschi di Siena Corso del Popolo S.p.A. Italy 7, ,563 5,676 Credito Sportivo Piscine dello Stadio S.r.l. Italy 6, ,043 5,036 Total 22,253 1,217 3,987 17,049 The fair value of the concession financing, measured as set out in the Accounting policies section, is 41.2 million. Financing and loans of companies in liquidation This item of 2.1 million is substantially unchanged from 31 December The related repayment plans are linked to the liquidation procedures of the companies to which the financing and loans refer. Other financing This item may be analysed as follows: 31 December December 2015 Company Country Total Current Non- Total Current Nonother current other current ( 000) financing financing Cat Finance Salini Impregilo Italy 6,977 4,096 2,882 11,996 5,057 6,938 Various HCE Italy 3, , Various Lane Industries USA 2,585 2, Various Salini Impregilo Italy 1,677 1, Various Ariguani Colombia Various ANM Riyadh Bunte Salini Impregilo Italy Various Imprepar Italy Various Pietrarossa Italy Various Lec Consortium Libya Cat Finance Co.Ge.Ma. Italy Various Inc Algerie Algeria Various Salini Impregilo - Argentine branch Argentina Nesma Riyad Salini Impregilo Italy ,076 25,076 - Bethar Al Amal Salini Impregilo Italy ,303 15,303 - Sace Salini Namibia Namibia ,112 4,112 - AFCO Salini Impregilo - Healy Parsons Cleveland Various Nepalese branch Nepal Total 17,766 11,937 5,829 60,818 53,036 7, Annual Report as at 31 December 2016
235 Consolidated financial statements as at and for the year ended 31 December 2016 The conditions of the main existing financing may be summarised as follows: Company Country Interest Expiry rate date CAT Finance Salini Impregilo Italy Fixed rate 2019 CAT Finance Co.Ge.Ma. Italy Fixed rate 2019 The interest rates shown in the table have floating spreads depending on the term and conditions of the financing. The non-current portion of the above other financing will be repaid at its contractual maturity, based on the following time bands: Company Country Total non- Due after 13 Due after 25 Due after current portion months but months but 60 months ( 000) within 24 months within 60 months Cat Finance Salini Impregilo Italy 2,882 1,577 1,304 Cat Finance Todini Italy 2, ,809 Various banks Pietrarossa Italy Various banks Lane Industries USA Total 5,829 2,715 3,113 - The fair value of the other financing, measured as set out in the Accounting policies section, is 17.9 million. Current account facilities Current account facilities decreased by 64.3 million to 51.3 million at the reporting date. The decrease mainly refers to the smaller bank overdrafts of the parent ( 37.7 million), the subsidiaries Salini Nigeria ( 9.8 million), HCE ( 9.1 million), Corso del Popolo S.p.A. ( 4.5 million) and Piscine dello Stadio S.c.a.r.l. ( 1.9 million). Factoring liabilities ( 000) 31 December December 2015 Variation Salini Impregilo S.p.A. (SACE Factoring S.p.A.) 53,794 43,776 10,018 Impregilo-SK E&C-Galfar al Misnad JV (SACE Factoring S.p.A.) 42,205-42,205 Salini Namibia PTY (SACE Factoring S.p.A.) 14,893-14,893 Ethiopian Branch (Factorit) 9,957 14,553 (4,596) Salini Impregilo S.p.A. (UniCredit Pro-soluto) 2,176-2,176 Venezuelan Branch (various) (595) Sierra Leone Branch (Factorit) (273) CMT (SACE Factoring S.p.A.) JV Mukorsi (Factorit) 8-8 Total 123,557 59,706 63, Annual Report as at 31 December 2016
236 Consolidated financial statements as at and for the year ended 31 December 2016 Factoring liabilities related to the factoring of receivables and increased by 63.8 million, mainly due to the factoring of receivables by the subsidiary Impregilo-SK E&C-Galfar al Misnad J.V. during the second half of the year ( 42.2 million) and the increase in the parent s liabilities to SACE Factoring S.p.A. ( 10.0 million). Net financial indebtedness of Salini Impregilo Group ( 000) Note (*) 31 December December 2015 ( ) Variation Non-current financial assets 11 62,458 67,832 (5,374) Current financial assets , ,104 11,289 Cash and cash equivalents 19 1,602,721 1,410, ,946 Total cash and cash equivalents and other financial assets 1,988,572 1,790, ,861 Bank and other loans and borrowings 22 (866,361) (745,554) (120,807) Bonds 23 (868,115) (396,211) (471,904) Finance lease liabilities 24 (119,742) (79,789) (39,953) Total non-current indebtedness (1,854,218) (1,221,554) (632,664) Current portion of bank loans and borrowings and current account facilities 22 (398,589) (538,802) 140,213 Current portion of bonds 23 (18,931) (10,203) (8,728) Current portion of finance lease liabilities 24 (55,281) (49,617) (5,664) Total current indebtedness (472,801) (598,622) 125,821 Derivative assets Derivative liabilities 25 (7,180) (14,798) 7,618 Net financial position (indebtedness) with unconsolidated SPEs (**) (5,345) 17,512 (22,857) Total other financial assets (liabilities) (12,369) 2,714 (15,083) Net financial indebtedness - continuing operations (350,816) (26,751) (324,065) Net financial position (indebtedness) - discontinued operations - (18,939) 18,939 Net financial indebtedness including discontinued operations (350,816) (45,690) (305,126) (*) The note numbers refer to the notes to the consolidated financial statements where the items are analysed in detail. (**) This item shows the Group s net amounts due from/to unconsolidated consortia and/or consortium companies operating under a cost recharging system. The balance reflects the Group s share of cash and cash equivalents or debt of the SPEs. The balances are shown under trade receivables and payables in the consolidated financial statements. ( ) The figures in this column do not include Lane acquired on 4 January At 31 December 2016, the Group has net financial indebtedness from continuing operations of million (indebtedness of 26.8 million), while its indebtedness from discontinued operations is nil (indebtedness of 18.9 million) following the new IFRS 5 scope. The increase in the Group s net financial indebtedness is mainly a result of the financing taken out to acquire Lane, which entailed an outlay of 429 million, and to acquire some assets of the US company Asphalt Roads and Material Company Inc. for 33.9 million; partly offset by cash inflows generated in Annual Report as at 31 December 2016
237 Consolidated financial statements as at and for the year ended 31 December 2016 Gross indebtedness increased by million from 31 December 2015 to 2,332.4 million at the reporting date. The debt/equity ratio (based on the net financial indebtedness from continuing operations) is 0.26 at group level at the reporting date. 23. Bonds The outstanding bonds at 31 December 2016 relate to the parent, Salini Impregilo ( million). They are analysed in the following table: ( 000) 31 December December 2015 Variation Non-current portion 868, , ,904 Current portion 18,931 10,204 8,727 Total 887, , ,631 A breakdown of this item is set out in the following table: 31 December December 2015 ( 000) Expiry date Nominal amount Non-current portion (net of related charges) Current portion (accrued interest) Nominal amount Non-current portion (net of related charges) Current portion (accrued interest) 400,000, % 1 August , ,385 7, , ,211 10, ,000, % 24 June , ,730 11, Total 883, ,115 18, , ,211 10,203 On 23 July 2013, Salini S.p.A. (now part of Salini Impregilo S.p.A.) issued senior unsecured bonds for a nominal amount of 400 million to be redeemed on 1 August 2018, intended for international institutional investors. The bonds, which have a minimum denomination of 100,000 and an annual gross coupon of 6.125%, were placed with primary international institutional investors at a price of The issue is secured by covenants that establish the requirement for the borrower to maintain certain financial and equity ratios which, at the date of this Annual Report, are fully respected. On 24 June 2016, the parent announced the placement of bonds with a nominal amount of million reserved for institutional investors. They have a fixed rate coupon of 3.75%. The bonds are listed on the Irish Stock Exchange in Dublin with a redemption date of 24 June Part of the bonds, with a nominal amount of Annual Report as at 31 December 2016
238 Consolidated financial statements as at and for the year ended 31 December 2016 million, was assigned to the holders of the senior unsecured bonds that adhered to the parent s offer. The exchange rate applied to the existing bonds was %. After the exchange, the outstanding senior unsecured bonds amounted to 283 million. The parent used the proceeds of 300 million from the new issue, not used for the bond exchange, to repay part of the bridge financing taken out to acquire Lane and commented on in Note 22. The Group assessed the continuity of the previous bonds (exchanged) with the bonds placed on 24 June On 11 July 2016, the parent placed more bonds with institutional investors for a total nominal amount of roughly 172 million. The new bonds are part of a single series with the previous 428 million issued on 24 June 2015 and redeemable on 24 June 2021, bringing the total bond issue to 600 million. The transaction has strengthened the Group s debt profile, extended its average debt repayment dates by more than one year and increased its fixed rate debt component. The bonds issued in 2016 are backed by covenants that require the parent to maintain certain financial and equity ratios, which at the date of this report are fully respected. The fair value of the bonds at the reporting date, measured as set out in the Accounting policies section, is million. 24. Finance lease liabilities Finance lease liabilities may be broken down as follows at 31 December 2016: ( 000) 31 December December 2015 Variation Non-current portion 119,742 79,789 39,953 Current portion 55,281 49,617 5,664 This item includes the principal of future lease payments at the reporting date for the purchase of plant, machinery and equipment with an average life of between 3 to 8 years. At 31 December 2016, the effective average rate ranged between 2% to 5% for the Italian companies. Liabilities for these leases are guaranteed to the lessor via rights to the leased assets. 237 Annual Report as at 31 December 2016
239 Consolidated financial statements as at and for the year ended 31 December 2016 The present value of the minimum future lease payments is 175 million (31 December 2015: million) as follows: ( 000) 31 December December 2015 Minimum lease payments: Due within one year 62,110 43,553 Due between one and five years 122,863 92,134 Due after five years 3,607 4,780 Total 188, ,467 Future interest expense (13,557) (11,060) Net present value 175, ,407 The net present value is as follows: Due within one year 55,281 49,617 Due between one and five years 116,348 75,418 Due after five years 3,394 4,372 Total 175, ,407 The Group's future commitments for non-cancellable operating leases are as follows: Estimated commitments for future non-cancellable lease payments ( m) - December 2016 Within one year Between one and five years Due after five years Total The above figures do not reflect the impact that adoption of IFRS 16 from 1 January 2019 could have. 25. Derivatives and other current financial liabilities These items show the reporting-date fair value of the currency and interest rate hedges. They may be broken down as follows: ( 000) 31 December December 2015 Non-current Current Total Annual Report as at 31 December 2016
240 Consolidated financial statements as at and for the year ended 31 December 2016 The following table analyses the item: ( 000) 31 December December 2015 Interest rate swaps - Cash flow hedge 7,096 14,798 Currency swaps - FVTPL 84 - Total derivatives presented in net financial indebtedness 7,180 14,798 The following tables set out the characteristics of the derivative liabilities existing at 31 December 2016, showing the company owning the contract and the related fair value at the reporting date: Interest rate swap - Cash flow hedge: Fair value passivi Company Agreement date Expiry date Currency Notional amount Fair value ( ) Impregilo Parking Glasgow 09/27/ /06/2029 GBP 7,456,299 (2,880,562) Impregilo Parking Glasgow 06/01/ /06/2029 GBP 810,726 (1,548,629) Salini Impregilo 11/24/ /02/2017 EUR 75,000,000 (1,333,906) Salini Impregilo 11/24/ /02/2017 EUR 75,000,000 (1,333,906) Total (7,097,003) This category includes derivatives that have been entered into to hedge the Group against interest rate risks and that meet IFRS hedge accounting requirements. To check compliance with these requirements, the effectiveness of the hedges has been verified and confirmed and, therefore, their fair value changes have been recognised in the hedging reserve (see Note 21). Forward currency purchases and sales - FVTPL Company Agreement date Expiry date Currency Notional amount Fair value ( ) Salini Impregilo S.p.A. (Tajikistan) 11/23/ /01/2017 EUR 20,000, ,102 Salini Impregilo S.p.A. (Tajikistan) 11/24/ /01/2017 EUR 13,000,000 22,231 Salini Impregilo S.p.A. (Saudi Arabia) 12/16/ /01/2017 EUR 16,000,000 (107,329) Salini Impregilo S.p.A. (Saudi Arabia) 12/19/ /01/2017 EUR 12,000,000 (160,574) Total (83,570) This category includes derivatives that have been entered into to hedge the Group against currency risks but that do not meet hedge accounting requirements. 239 Annual Report as at 31 December 2016
241 Consolidated financial statements as at and for the year ended 31 December Post-employment benefits and employee benefits At 31 December 2016, the Group s liability due to its employees determined using the criteria set out in IAS 19 is 91.9 million. At 31 December 2016 and 2015, the liability for post-employment benefits is the outstanding amount at the reform effective date, net of benefits paid up to the reporting dates. The liability is considered part of a defined benefit plan under IAS 19 and has, therefore, been subjected to actuarial valuation. The valuation, performed with the assistance of an independent expert, was based on the following rates: turnover rate: 7.25%; discount rate: 0.45%; advance payment rate: 3%; inflation rate: 1.5%. The Group has used the Iboxx AA Corporate index for the Eurozone, which has an average financial duration in line with the fund being valued, to calculate the discount rate. The balance mainly consists of the liability for Lane Group s defined benefit plan for its full-time employees. This liability is calculated on the basis of the employees years of service and remuneration and is subjected to an actuarial valuation. Lane Group also provides healthcare cover to retired employees, hired before 31 December 1992 with at least 20 years of service. The item also includes the Italian post-employment benefits (TFR) related to Salini Impregilo and its Italian subsidiaries. The liability is the outstanding amount at the reform effective date, net of benefits paid up to the reporting dates. The liability is considered part of a defined benefit plan under IAS 19 and has, therefore, been subjected to actuarial valuation. The valuation was performed with the assistance of an independent expert. (in millions of Euros) Changes in the item are as follows: 31 December 2015 Accruals Payments Net actuarial losses Change in consolidation scope and other changes Contributions paid to INPS treasury and other funds 31 December 2016 Post-employment benefits and employee benefits 25,412 13,813 (30,663) (4,364) 90,945 (3,212) 91,931 (in millions of Euros) 31 December 2014 Accruals Payments Net actuarial losses Change in consolidation scope and other changes Contributions paid to INPS treasury and other funds 31 December 2015 Post-employment benefits and employee benefits 23,320 15,443 (11,892) (5,536) 570 3,507 25, Annual Report as at 31 December 2016
242 Consolidated financial statements as at and for the year ended 31 December 2016 Net actuarial losses include the actuarial gains and losses recognised in the actuarial reserve as per the revised IAS 19 while Change in consolidation scope and other changes include the effects of the acquisition of Lane Industries on 4 January 2016 as well as exchange rate gains and losses. A 0.25% increase or decrease in the discount rate applied to the calculation of the liability at the reporting date would have had a positive or negative effect of 0.1 million or 0.2 million, respectively. Lane Construction Corporation Defined Benefit Pension Plan Through its US subsidiary Lane Industries Inc., the Group contributes to a pension plan that qualifies as a defined benefit plan, The Lane Construction Corporation Defined Benefit Pension Plan, which pays benefits to employees or former employees who met the related vesting conditions when they retire. The subsidiary also pays benefits to a supplementary pension plan for some senior executives. In addition, it provides employees who have reached retirement age with healthcare benefits. These employees were hired before 31 December 1992 and reached retirement age after at least 20 years service and are also beneficiaries of The Lane Construction Corporation Defined Benefit Pension Plan. A reconciliation between the opening balance (at the subsidiary's acquisition date) and the closing balance of the Group's liability for employee benefits and the plan assets is as follows ( '000): ( '000) Liability for Plan Variation employee assets benefits 4 January ,149 (131,549) 68,601 Contribution cost 4,601-4,601 Interest 8,757 (6,356) 2,401 Gains on the change in the expected return on the plan assets - (3,987) (3,987) Net losses on changes in the financial assumptions 6,223-6,223 Net gains on changes in the demographic assumptions (5,148) - (5,148) Net gains from experience (2,689) - (2,689) Employer contributions (1,264) (7,589) (8,853) Payments (4,901) 5, Healthcare services provided Exchange rate differences December ,374 (144,056) 62, Annual Report as at 31 December 2016
243 Consolidated financial statements as at and for the year ended 31 December 2016 The following tables show the assumptions used to calculate the liability for employee benefits: Pension benefits Other benefits ( 000) Discount rate 4.49% 4.69% 4.02% 4.47% Expected rate of return on plan assets 7.25% 7.25% n.a. n.a. Salary increase rate 3.50% 3.50% n.a. n.a. The long-term expected rate of return on plan assets is calculated based on the investments' performance and the plan asset mix over the period the assets are expected to increase in value before final payment. Assumptions about the rise in healthcare service costs are set out below: Annual growth rate 7.00% 7.20% Ultimate trend rate 4.50% 4.50% Year in which the ultimate trend rate is expected to be reached The next table shows how the liability for employee benefits would change if the main assumptions changed: ( 000) Variation Increase Decrease Discount rate 1.00% (27,562) 34,827 Salary increase rate 1% per age bracket 9,969 (8,863) The following table presents the plan asset categories as a percentage of total invested assets: ( 000) 31 December 2016 % 04 January 2016 % Common/collective trusts 143, % 130, % Interest-bearing deposits % % Other % Total 144, % 131, % The plan assets are selected to ensure a combination of returns and growth opportunity using a prudent investment strategy. Investments usually include 35% in fixed income funds, 45% in equity investments (large and small caps) and 20% in international companies. The subsidiary's management regularly revises its objectives and strategies. 242 Annual Report as at 31 December 2016
244 Consolidated financial statements as at and for the year ended 31 December 2016 A breakdown of the plan assets' fair value by asset category is as follows: Listed prices Other observable Other non- 31 December 2016 significant observable inputs significant inputs ( '000) Level 1 Level 2 Level 3 Total Common/collective trusts 143, ,188 Interest-bearing deposits Total 144, ,056 Listed prices Other observable Other non- 4 January 2016 significant observable inputs significant inputs ( '000) Level 1 Level 2 Level 3 Total Common/collective trusts 130, ,746 Interest-bearing deposits Other Total 131, ,549 The following table shows the estimated undiscounted future payments for employee benefits: ( '000) Periods Pension benefits Other benefits ,493 1, ,704 1, ,238 1, ,729 1, ,154 1, ,645 5,609 Lane pays benefits to multi-employer pension plans, as provided for by national labour agreements for its employees represented by trade unions. The risks of participating in these plans, which involve more than one employer, vary depending on the plan and are borne by each employer as follows: the assets contributed by an employer to a multi-employer pension plan may be used to provide benefits to the employees of the other employers involved in the plan; if an employer stops contributing to a multi-employer pension plan, its unmet obligations are covered by the other employers participating in the plan; 243 Annual Report as at 31 December 2016
245 Consolidated financial statements as at and for the year ended 31 December 2016 if an employer decides to withdraw from a multi-employer pension plan, it may be required to pay the plan an amount calculated considering its possible undercapitalisation at the withdrawal date. Zone Status (Pension Protection Act) 1 Contributions ( '000) Plan end date; Presence of "MFA" 2 Pension plan Number IUOE Local 4 Pension Fund ; 001 Green Green /31/2017; No IUOE Local 98 Benefits Funds ; 001 Green Green /31/2020; No Operating Engineers Constr. Ind. and Misc. Pension Fund ; 001 Green Green 749 1,095 12/31/2019; No Massachusetts Laborers Pension Fund ; 001 Green Green /31/2017; No New England Teamsters Fund ; 001 Red Red /30/2018; No Western Penn Laborers District Council Fund ; 001 Red Red 1,310 1,401 12/31/2019; No Notes to the above table: 1 The "zone status" is based on information received from the plan. Plans in the "red zone" are less than 65% funded, plans in the "orange zone" are between 65% and 80% funded, plans in the "green zone" are more than 80% funded. 2 "MFA" stands for minimum funding arrangement. 27. Provision for risks These provisions amount to million at the reporting date, as follows: ( 000) 31 December December 2015 Variation Provisions for risks on equity investments 2,526 2, Other provisions 103, ,171 (932) Total 105, ,361 (596) The provision for risks on equity investments relates to expected impairment losses on the carrying amount of the Group s investments in associates for the part that exceeds their carrying amounts. 244 Annual Report as at 31 December 2016
246 Consolidated financial statements as at and for the year ended 31 December 2016 Changes in this provision are detailed below: ( 000) 31 December 2016 Change in consolidation method Acquisitions/disinvestments (456) Share of profit of equity-accounted investees 441 Dividends from equity-accounted investees 415 Other changes including change in the translation reserve (64) Total 336 Other provisions comprise: ( 000) 31 December December 2015 Variation USW Campania projects 32,760 32,760 - Provisions set up by Imprepar and its subsidiaries 36,327 36,452 (125) Ongoing litigation 1,556 9,877 (8,321) Building segment litigation Tax and social security litigation 2,240 3,304 (1,064) Other 29,561 20,983 8,578 Total 103, ,171 (932) The provision for the USW Campania projects mainly consists of the estimated potential costs for the environmental clean-up. The section on the Main risk factors and uncertainties in the Directors report includes a description of the litigation and risks related to the USW Campania projects. The provisions set up by Imprepar and its subsidiaries include accruals made for probable future charges related to the closing of contracts and potential developments in ongoing litigation. The provision for ongoing litigation refers to disputes involving Salini Impregilo and certain of its subsidiaries. Other mainly comprises amounts accrued starting from 2015 for certain foreign contracts completed in previous years for which disputes are ongoing with the clients. Relationships with these clients are difficult and, therefore, the Group is unable to estimate exactly when the related receivables will be collected. 245 Annual Report as at 31 December 2016
247 Consolidated financial statements as at and for the year ended 31 December 2016 Changes in the item in the year are summarised below: 31 December Accruals Utilisations Reclassifications Exchange rate Discountin 31 December 2015 gains (losses) and other 2016 ( 000) changes Total 104,171 11,046 (15,952) , ,239 Changes during 2015 are shown in the following table: ( 000) 31 December Accruals Utilisations Reclassifications Exchange rate Discountin 31 December 2014 gains (losses) and other 2015 changes Total 90,833 21,646 (12,809) 4,672 (244) ,171 Changes of the year comprise: accruals of 11 million, mainly related to the parent s head office for labour disputes ( 2.3 million), the subsidiary Imprepar ( 2.4 million), HCE Group for future costs to dismantle work sites ( 3.7 million) and Lane Group ( 1.3 million); utilisations per 15.9 million, related to the subsidiaries Imprepar, Metro 6 and Consorcio Acueducto Oriental due to the occurrence of the events for which the provision had been set up; changes in the consolidation scope of 3.3 million, mainly due to the acquisition of Lane Industries Incorporated on 4 January Reference should be made to the section on the Main risk factors and uncertainties of the Directors report for more information on litigation. 28. Progress payments and advances on contract work in progress This item, included in Current liabilities, amounts to 2,455.6 million, up million on the figure at 31 December It comprises: ( 000) 31 December December 2015 Variation Contract work in progress (5,384,910) (4,099,585) (1,285,325) Progress payments and advances received (on approved work) 5,976,936 4,211,995 1,764,941 Negative work in progress 592, , ,616 Contractual advances 1,863,606 1,750, ,257 Total 2,455,632 1,862, , Annual Report as at 31 December 2016
248 Consolidated financial statements as at and for the year ended 31 December 2016 Work in progress recognised under liabilities (negative WIP) of million is the negative net balance, for each contract, of work performed to date and progress billings and advances. The following table shows the contribution by geographical segment of negative WIP and contractual advances: ( 000) 31 December December 2015 Variation Italy 147, ,438 33,086 EU (excluding Italy) 341, , ,713 Non-EU 67,384 45,032 22,352 Asia 92,478 23,768 68,710 Middle East 523, ,830 (82,154) Africa 965, , ,275 North America 105,667 17,870 87,797 Latin America 129, ,630 8,331 Oceania 82,314 2,551 79,763 Total 2,455,632 1,862, ,873 The contracts that contributed the most to the negative WIP were those in the US ( million), Ethiopia for the Koysha dam ( million), Austria ( 18.9 million), Denmark ( 14.3 million), Peru ( 33.4 million) and Australia ( 52.3 million). The most significant contractual advances, which total 1,863.6 million, relate to the following contracts: the Koysha dam ( 85.2 million), Gibe III ( 50.0 million) and the Grand Ethiopian Renaissance Dam Project (Gerd) in Ethiopia ( million), the Copenhagen Cityringer Metro in Denmark ( million), contracts in Libya ( million), the Riyadh Metro Line 3 in Saudi Arabia ( million), projects in Nigeria ( 97.7 million), construction of the Ruta del Sol motorway in Colombia ( 52.4 million), design and construction of the Red Line North in Doha ( 33.5 million), construction of the Al Bayt Stadium in Al Khor City in Qatar ( 68.1 million) and the hydroelectric project in Tajikstan ( 92.5 million). The Directors report provides more information about the performance of these contracts and their progress. The section on the Main risk factors and uncertainties in the Directors report provides information on pending disputes and assets exposed to country risk. 247 Annual Report as at 31 December 2016
249 Consolidated financial statements as at and for the year ended 31 December Trade payables Trade payables amount to 2,344.8 million at the reporting date, an increase of million on 31 December They are made up as follows: ( 000) 31 December December 2015 Variation Third parties 2,233,611 1,501, ,931 Unconsolidated group companies and other related parties 111, ,757 (17,595) Total 2,344,773 1,630, ,336 The net increase in trade payables is mainly due to: a million increase related to the acquisition of Lane Group; an increase of million related to the Ethiopian branch (see Note 15 about the related rise in trade receivables); the other increases are due to progress on the recently started-up contracts in the Middle East and Asia (specifically, the Al Bayt Stadium in Qatar, the Riyadh Metro in Saudi Arabia and the Rogun Hydropower Project in Tajikistan). Trade payables to unconsolidated group companies and other related parties decreased by 17.5 million to million at the reporting date. The item mostly consists of payables from unconsolidated SPEs accrued on work performed by these entities for contracts with Italian and foreign public administrations. The reduction is principally attributable to the decrease in the payable from the consortium companies Pedelombarda S.c.p.a. and La Quado following completion of the works. The balance includes 7.4 million equal to the Group s share of the SPEs cash and cash equivalents. It is shown in the item Net financial position with unconsolidated SPEs in the schedule of the Group s net financial indebtedness. 248 Annual Report as at 31 December 2016
250 Consolidated financial statements as at and for the year ended 31 December Current tax liabilities and other current tax liabilities Current tax liabilities amount to million as follows: ( 000) 31 December December 2015 Variation IRES 7,838 9,835 (1,997) IRAP 2, ,431 Foreign taxes 100,035 57,751 42,284 Total 109,991 68,273 41,718 Foreign taxes include 9.9 million related to a tax dispute involving Impregilo International Infrastructures N.V. (see Note 32 for more information). Other current tax liabilities of 67.6 million increased by 6.5 million over 31 December They may be analysed as follows: ( 000) 31 December December 2015 Variation Withholdings VAT 48,062 39,311 8,751 Other indirect taxes 18,884 21,502 (2,618) Total 67,589 61,097 6, Annual Report as at 31 December 2016
251 Consolidated financial statements as at and for the year ended 31 December Other current liabilities Other current liabilities of million (31 December 2015: million) comprise: ( 000) 31 December December 2015 Variation Social security institutions 23,271 16,233 7,038 Employees 82,206 52,225 29,981 Compensation and compulsory purchases 5,739 7,331 (1,592) State bodies 115, ,588 - Guarantee deposits Other 93, ,163 (14,200) Unconsolidated group companies and other related parties 13,747 13, Accrued expenses and deferred income 21,584 21, Total 356, ,198 22,117 Employees relate to accrued unpaid remuneration. The large increase in this item during the year, like for Social security institutions, is mainly due to the inclusion of Lane in the consolidation scope. Compensation and compulsory purchases relate to the high speed/capacity railway contracts; the decrease of 1.6 million principally refers to the Milan - Genoa section. State bodies ( million) entirely relate to the transactions with the commissioner, the provincial authorities and municipalities of Campania in connection with the USW Campania projects. Reference should be made to the Main risk factors and uncertainties section in the Directors report for more information about the complicated situation surrounding the USW Campania projects. Other of 94.0 million (31 December 2015: million) decreased by roughly 14.2 million. Such reduction is mainly attributable to the decrease in the liabilities for the motorway project in Slovakia ( 3.6 million) and the Red Line project in Doha, Qatar ( 6.2 million), as well as the decrease in liabilities for contracts completed or nearing completion, such as the El Quimbo hydroelectric project in Colombia ( 5.4 million). Unconsolidated group companies and other related parties of 13.7 million increased by 0.7 million on 31 December Annual Report as at 31 December 2016
252 Consolidated financial statements as at and for the year ended 31 December 2016 Accrued expenses and deferred income of 21.6 million include the ten-year post-contract guarantee of 4.1 million and are in line with the previous year end as follows: ( 000) 31 December December 2015 Variation Accrued expenses: - Commissions on sureties 4,267 3, Other 11,138 12,485 (1,347) Total accrued expenses 15,405 16,079 (674) Deferred income: - Provision of services 6,179 5, Total deferred income 6,179 5, Total 21,584 21, Guarantees, commitments, risks and contingent liabilities Guarantees and commitments The key guarantees given by the Group are set out below: contractual sureties: these total 12,490.8 million (including 4,519.2 million issued directly by Lane Group) and are given to clients as performance bonds, to guarantee advances, withholdings and involvement in tenders for all ongoing contracts. In turn, the group companies has guarantees given by its subcontractors; sureties for credit of million; sureties granted for export credit of million; other guarantees of 1,372.0 million consisting of guarantees related to customs and tax obligations ( 58.4 million) and for other commitments (such as environmental clean-ups and export credit) ( 1,313.5 million); lien on the shares of the SPE M4 ( 1.9 million). Litigation and contingent liabilities The Group is involved in civil and administrative proceedings that are not expected to have a significant negative effect on its consolidated financial statements, based on the information currently available and the existing provisions for risks. The section on the Main risk factors and uncertainties in the Directors report provides information about the main disputes. 251 Annual Report as at 31 December 2016
253 Consolidated financial statements as at and for the year ended 31 December 2016 Tax disputes Salini Impregilo S.p.A. With respect to the principal dispute with the tax authorities: as described in detail in previous reports, the dispute about the assessment notice challenging the tax treatment of impairment losses and losses on the sale of assets recognised by the parent in 2003 is currently before the Supreme Court, following the tax authorities appeal. The main issue about the sale by Impregilo S.p.A. of its investment in the Chilean operator Costanera Norte SA to Impregilo International Infrastructures NV was cancelled by the Milan Regional Tax Commission on 11 September 2009 (higher assessed tax base of 70 million); the parent s appeal about reimbursement of tax assets with a nominal amount of 12.3 million acquired from third parties as part of previous non-recurring transactions is still pending before the Supreme Court; a dispute about the technique used to realign the carrying amount of equity investments as per article 128 of Presidential decree no. 917/86 (greater assessed tax base of 4.2 million) is still pending before the first level court; with respect to another dispute again related to 2005 and the costs of a joint venture set up in Venezuela for which the greater assessed tax base is 6.6 million, the Regional Tax Commission filed its ruling entirely in the parent s favour on 19 May 2015; the tax authorities appealed to the Supreme Court on 28 December 2015 challenging the procedure while stating that the findings do not relate to the appeal. The parent has filed its defence brief; the parent was notified of: (i) a payment order from the tax authorities for Icelandic taxes of 4.6 million, which was cancelled after the the first and second level sentences in favour of the parent; and (ii) a payment bill for the same taxes which the parent appealed. It won again both at first and second level. On 18 January 2016, the tax authorities presented their appeal to the Supreme Court and the parent filed its defence brief; on 29 December 2016, the parent received two assessment notices for IRES and IRAP purposes covering 2011 and alleging unpaid IRES taxes of 21.2 million and IRAP taxes of 2.9 million. Both these notices were based on a preliminary assessment report issued by the tax police and notified to the parent on 27 September They refer to: (i) for a minimum part, the alleged applicability of the transfer price regulations to sureties given free of charge on behalf of foreign subsidiaries, for which the tax police asserted that the normal commission income would have been 700 thousand; (ii) the non-deductibility of costs of 36.4 million incurred to purchase goods and services to perform works for the Abu Dhabi and 252 Annual Report as at 31 December 2016
254 Consolidated financial statements as at and for the year ended 31 December 2016 Panama contracts, both of which countries have a preferential tax regime, due to the alleged insufficient evidence that the suppliers carried out commercial activities in those countries and that the related purchases were in Salini Impregilo s effective interest. To date, the parent is negotiating a settlement of the assessments and the terms for their appeal are still open. With respect to the above pending disputes, after consulting its legal advisors, the parent believes that it has acted correctly and deems that the risk of an adverse ruling is not probable. Finally, the Milan unit of the tax police is currently performing a tax audit of the IRES, IRAP and VAT paid in Icelandic branch With respect to the completed contract for the construction of a hydroelectric plant in Karanjukar (Iceland), a dispute arose with the Icelandic tax authorities in 2004 about the party required to act as the withholding agent for the remuneration of foreign temporary workers at the building site. Salini Impregilo was firstly wrongly held responsible for the payment of the withholdings on this remuneration, which it therefore paid. Following the definitive ruling of the first level court, the parent s claims were fully satisfied. Nevertheless, the local authorities subsequently commenced a new proceeding for exactly the same issue. The Supreme Court rejected the parent s claims in its ruling handed down in February 2010, which is blatantly contrary to the previous ruling issued in 2007 on the same matter by the same judiciary authority. The parent had expected to be refunded the unduly paid withholdings of 6.9 million (at the original exchange rate). After the last ruling, the parent took legal action at international level (appeal presented to the EFTA Surveillance Authority on 22 June 2010) and, as far as possible, again at local level as it deems that the last ruling issued by the Icelandic Supreme Court is unlawful both in respect of local legislative and international agreements regulating trade relations between the EFTA countries and international conventions which do not allow application of discriminatory treatments to foreign parties (individuals and companies) working in other EFTA countries. On 8 February 2012, the EFTA Surveillance Authority sent the Icelandic government a communication notifying the infraction of the free exchange of services and requested the government to provide its observations about this. In April 2013, the EFTA Surveillance Authority issued its documented opinion finding the Icelandic legislation to be inconsistent with the regulations covering trade relations between the member countries with respect to the regulations for the above dispute. It asked that Iceland take steps to comply with these regulations. Accordingly, the parent requested the case be re-examined locally and has engaged a leading legal firm to assess whether to take additional action at international level.. Based on the above, Salini Impregilo does not believe objective reasons currently exist to change the valuations made about this dispute. 253 Annual Report as at 31 December 2016
255 Consolidated financial statements as at and for the year ended 31 December 2016 Imprepar The Milan Regional Tax Commission filed a ruling on the IRES assessment notices for 2006/2007/2008 received by the subsidiary Imprepar at the end of March 2015 cancelling all the main findings notified by the tax authorities on the assessment notices for 2006 and 2007 for 12 million. In November 2015, the tax authorities appealed against the Milan Regional Tax Commission before the Supreme Court and the company filed its defence brief in December. After consulting its legal advisors, the subsidiary did not set up a provision for this tax dispute as it deems that the risk of an adverse ruling is not probable. Fibe As disclosed in previous reports, FIBE has a pending dispute about the local property tax (ICI) on the Acerra waste-to-energy plant. In January 2013, the subsidiary received tax assessment notices from the Acerra municipality with respect to the waste-to-energy plant, which requested payment of local property tax and relevant penalties for approximately 14.3 million for the years The amount requested by the Municipality and challenged by FIBE was confirmed as far as its applicability but reduced in terms of its amount and penalties by Naples Regional Tax Committee, so that the original payment orders issued were cancelled. Although it believes that it will be able to reverse the ruling through an appeal to the Supreme Court, in 2015, the subsidiary - comforted by its legal advisors - set aside a provision for an amount equal to just the tax plus any accrued interest as a precautionary measure. Impregilo International Infrastuctures NV As described in detail in previous reports, the Milan unit of the tax police has completed a tax audit of this subsidiary, based in, and active in the Netherlands since Its preliminary assessment report, notified to the subsidiary on 12 May 2016, found that it is an Italian resident for tax purposes. Based on the information available to it taken from the above preliminary assessment report, the subsidiary s reasonings and recent legislation, the tax authorities have assessed a different legal standing for the subsidiary compared to that set out in the preliminary assessment report by the tax police. The tax authorities have revised the latter s statements and found that the company is not guilty of tax inversion. The authorities notified the Dutch subsidiary of assessment notices which state that the subsidiary worked in Italy through a dependent agent permanent establishment and concurrently decreased the reassessed taxes significantly. Although the subsidiary does not agree with the tax authorities findings, it has 254 Annual Report as at 31 December 2016
256 Consolidated financial statements as at and for the year ended 31 December 2016 deemed it appropriate to settle the issue in order to benefit from the lower fines and avoid a long and exhausting dispute. As disclosed in notes 3 and 38, the subsidiary set up a provision for this dispute, including 6,555 thousand for operations now classified as discontinued and 3,359 thousand for current income taxes. 33. Financial instruments and risk management Classes of financial instruments The Group s financial instruments are broken down by class in the following table, which also shows their fair value: Financial assets ( 000) 31 December 2016 Note Loans and receivables Financial assets at fair value through profit or loss Hedging derivatives Held-tomaturity investments Availablefor-sale financial assets Derivatives and non-current financial assets 11 44, ,876 62,614 62,614 Trade receivables 15 2,359, ,359,273 2,359,273 Other current financial assets ,547-6, , ,393 Cash and cash equivalents 19 1,602, ,602,721 1,602,721 Total 4,323, ,722 4,348,001 4,348,001 Total Fair value Financial liabilities ( 000) 31 December 2016 Note Other liabilities at amortised cos Financial liabilities at fair value through profit or loss Hedging derivatives Bank and other loans and borrowings 22 1,264, ,264,950 1,287,209 Bonds , , ,314 Finance lease liabilities , , ,023 Derivatives and other current financial libalities ,096 7,180 7,180 Trade payables 29 2,344, ,344,773 2,344,773 Total 4,671, ,096 4,678,972 4,761,499 Total Fair value 255 Annual Report as at 31 December 2016
257 Consolidated financial statements as at and for the year ended 31 December 2016 Financial assets Note Loans and Financial Hedging Held-tomaturity Total Fair value ( 000) receivables assets at fair derivatives value through investments profit or loss 31 December 2015 Derivatives and non-current financial assets 11 48,195 19,637 67,832 67,832 Trade receivables 15 1,560,684-1,560,684 1,560,684 Other current financial assets ,289 2, , ,104 Cash and cash equivalents 19 1,410,775-1,410,775 1,410,775 Total 3,328,943 22,452 3,351,395 3,351,395 Availablefor-sale financial assets The note column gives the section in which the relevant item is described. Financial liabilities Note Other liabilities at Financial Hedging Fair value ( 000) amortised cos liabilities at fair derivatives value through profit or loss 31 December 2015 Bank and other loans and borrowings 22 1,284,356-1,284,356 1,297,891 Bonds , , ,160 Finance lease liabilities , , ,400 Derivatives and other current financial liabilities 25-14,798 14,798 14,798 Trade payables 29 1,630,437-1,630,437 1,630,437 Total 3,450,613 14,798 3,465,411 3,628,686 Total Reference should be made to the section on the accounting policies for information on the fair value measurement of these items. Specifically, the fair value of the items is based on the present value of estimated future cash flows. Risk management The Group is exposed to financial risks which encompass all the risks related to capital availability, affected by credit and liquidity management and/or the volatility of market factors such as interest and exchange rates. Market risk Market risk is the risk that the fair value or future cash flows of a financial instrument will fluctuate because of changes in market prices. Market risk comprises currency risk and interest rate risk. 256 Annual Report as at 31 December 2016
258 Consolidated financial statements as at and for the year ended 31 December 2016 Currency risk The Group s international presence entails its exposure to the risk of fluctuations in exchange rates of the Euro and the currencies of the various countries in which it operates. Currency risk at 31 December 2016 mainly related to the following currencies: US dollar (United States) DICOM (Venezuela) Dirham (United Arab Emirates) Riyal (Qatar) Tenge (Kazakhstan) Birr (Ethiopia) Somoni (Tajikistan) The Group s currency risk management strategy is essentially based on the following policies: agreement of contractual considerations for works and projects in countries with weak currencies using a primarily multi-currency format, in which only a portion of the consideration is expressed in local currency; use of portions of the contractual considerations in local currency mainly to cover project expenses to be incurred in that currency; analysis of exposure in US dollars on a cumulative and prospective basis with consistent deadlines and setting up forward transactions in the same currency to hedge the Group s net exposure at those deadlines. Adoption of the above-mentioned policies has contained the Group s exposure to currency risk with respect to the US dollar, the DICOM, the Dirham, the Riyal, the Teng, the Birr and the Somoni. Had the Euro appreciated or depreciated by 5% against the US dollar at year end, the profit before tax for the year would have been respectively greater or lower by 21.3 million, assuming that all other variables remained constant, mainly due to exchange rate losses (gains) arising from the adjustment of net liabilities in US dollars. A similar change at the end of the previous year would have led to a 12.3 million decrease (increase in the case of depreciation) in the profit before tax for the year. 257 Annual Report as at 31 December 2016
259 Consolidated financial statements as at and for the year ended 31 December 2016 Had the Euro appreciated or depreciated by 15% against the Venezuelan DICOM at year end, the profit before tax for the year would have been respectively greater or lower by 0.1 million, assuming that all other variables remained constant, mainly due to exchange rate losses (gains) arising from the adjustment of net liabilities in the Venezuelan DICOM. A similar change at the end of the previous year would have led to a 0.6 million decrease (increase in the case of depreciation) in the profit before tax for the year. Had the Euro appreciated or depreciated by 5% against the UAE Dirham at year end, the profit before tax for the year would have been respectively lower or greater by 0.1 million, assuming that all other variables remained constant, mainly due to exchange rate losses (gains) arising from the adjustment of net assets in the UAE Dirham. A similar change at the end of the previous year would have led to a 0.1 million decrease (increase in the case of depreciation) in the profit before tax for the year. Had the Euro appreciated or depreciated by 5% against the Qatari riyal at year end, the profit before tax for the year would have been respectively lower or greater by 1.0 million, assuming that all other variables remained constant, mainly due to exchange rate losses (gains) arising from the adjustment of net assets in the Qatari currency. A similar change at the end of the previous year would have led to a 1.5 million decrease (increase in the case of depreciation) in the profit before tax for the year. Had the Euro appreciated or depreciated by 5% against the Kazakhstani tenge at year end, the profit before tax for the year assuming that all other variables remained constant, would not have been significantly affected by exchange rate losses (gains) arising from the adjustment of net liabilities in the Kazakhstani tenge. A similar change at the end of the previous year would have led to a 0.3 million decrease (increase in the case of depreciation) in the profit before tax for the year. Had the Euro appreciated or depreciated by 5% against the Ethiopian Birr at year end, the profit before tax for the year would have been respectively lower or greater by 6.5 million, mainly due to exchange rate losses (gains) arising from the adjustment of net assets in the Ethiopian currency. A similar change at the end of the previous year would have led to a 0.9 million decrease (increase in the case of depreciation) in the profit before tax for the year. Had the Euro appreciated or depreciated by 5% against the Tajikistani Somoni at year end, the profit before tax for the year would have been respectively lower or greater by 1.2 million, assuming that all other variables remained constant, mainly due to exchange rate losses (gains) arising from the adjustment of net assets in the Tajikistani currency. At 31 December 2015, the Group did not have any balances in this currency. 258 Annual Report as at 31 December 2016
260 Consolidated financial statements as at and for the year ended 31 December 2016 Interest rate risk Salini Impregilo group has adopted a combined strategy of streamlining group operations by disposing of non-strategic assets, containing debt and hedging interest rate risks on a portion of the non-current structured loans through interest rate swaps (IRSs). The financial risks arising from market interest rate fluctuations to which the Group is potentially exposed and which are monitored by the relevant company personnel relate to non-current floating rate loans. Such risk is mitigated by interest accrued on short-term investments of liquidity available at the Italian-based consortia and consortium companies and foreign subsidiaries, which are used to support the Group s operations. The Group revised its debt structure in 2016, increasing its fixed rate exposure. Had interest rates increased or decreased by an average 75 basis points in 2016, the profit before tax for the year would have been respectively lower or greater by a maximum of 8.0 million ( 12.3 million for 2015), assuming that all other variables remained constant and without considering cash and cash equivalents. The sensitivity test on the interest rate derivative of Impregilo Parking Glasgow was only performed on cash flows settled during the year; fair value was not analysed as the derivative qualifies for hedge accounting and the effects of a change in interest rates would only impact equity. Credit risk Credit risk is that deriving from the Group s exposure to potential losses arising from the clients (which are mostly governments or state bodies) non-compliance with their obligations. Management of this risk is complex, starting as early as the assessment of offers, through a careful analysis of the characteristics of the countries in which the Group s activities should be carried out and the clients, which are usually state or similar bodies, requesting an offer. Therefore, this risk can be essentially assimilated to the country risk. An analysis of this risk based on the age of the outstanding amounts is not very meaningful, since the receivables should be assessed together with the related working capital items, especially those reflecting the net exposure to clients (positive and negative work in progress, advances and payments on account) in relation to contract work in progress as a whole. 259 Annual Report as at 31 December 2016
261 Consolidated financial statements as at and for the year ended 31 December 2016 A breakdown of working capital by geographical segment is set out below: ( 000) 31 December December 2015 Italy 190,899 1,219,967 Other EU countries 299,340 (87,457) Other non-eu countries (38,612) 8,219 America (Lane and other group contracts) 574,307 (170,822) Asia/Middle East (490,965) (590,470) Africa (25,685) 152,934 Australia (72,274) (55,486) Eliminations - (198,602) Total 437, ,283 The reconciliation of the reclassified statement of financial position details the items included in working capital. The Group s exposure to clients, broken down by contract location, is analysed below: ( 000) Loans and Positive Negative WIP Total Allowances receivables WIP and advances 31 December 2016 Italy 595, ,529 (147,524) 901,081 80,639 Other EU countries 66, ,173 (341,552) 187, Other non-eu countries 60, ,420 (67,384) 117,643 - America 488, ,877 (235,628) 656,882 22,600 Asia/Middle East 197, ,579 (616,154) (58,661) 1,760 Africa 943, ,331 (965,076) 436,999 8,379 Australia 6, ,354 (82,314) 29,382 - Total 2,359,273 2,367,263 (2,455,632) 2,270, , December 2015 Italy 740, ,625 (114,438) 1,026,005 78,686 Other EU countries 45, ,378 (195,839) 96, Other non-eu countries 89, ,464 (45,032) 150,495 - America 321, ,864 (139,499) 510,661 8,462 Asia/Middle East 81, ,301 (629,598) (416,230) 1,939 Africa 276, ,857 (735,801) 87,905 10,185 Australia 6,334 14,302 (2,551) 18,085 - Total 1,560,684 1,775,791 (1,862,758) 1,473, , Annual Report as at 31 December 2016
262 Consolidated financial statements as at and for the year ended 31 December 2016 The section on the Main risk factors and uncertainties of the Directors report provides information about country risk for Libya, Venezuela, Nigeria, Ukraine and Turkey. Liquidity risk Liquidity risk derives from the risk that the financial resources necessary to meet obligations may not be available to the Group at the agreed terms and deadlines. The Group s strategy aims at ensuring that each ongoing contract is financially independent, considering the structure of the consortia and SPEs, which may limit the availability of financial resources to achievement of the related projects. Liquidity management also considers the existence of constraints to the transfer of currency imposed by certain countries. This strategy is strictly monitored centrally. A breakdown of financial liabilities by composition and due date (based on undiscounted future cash flows) is set out below: ( 000) 31 December 31 December 31 December After Total Current account facilities 51, ,297 Bonds 39, , ,562-1,030,258 Bank loans and borrowings 534, , ,890 49,157 1,410,967 Finance lease liabilities 62,111 70,742 52,121 3, ,580 Interest rate derivatives 2, ,429 7,097 Gross financial liabilities 690, ,835 1,402,573 57,192 2,688,199 Trade payables 2,344, ,344,773 Total 3,035, ,835 1,402,573 57,192 5,032,972 The prior year end figures are given below for comparative purposes: ( 000) 31 December 31 December 31 December After Total Current account facilities 115, ,615 Bonds 24,567 24, , ,283 Bank loans and borrowings 532, , , ,402 1,229,487 Finance lease liabilities 49,617 28,505 46,911 4, ,405 Interest rate derivatives 10, ,113 14,798 Gross financial liabilities 733, , , ,887 1,950,588 Trade payables 1,630, ,630,437 Total 2,363, , , ,887 3,581, Annual Report as at 31 December 2016
263 Consolidated financial statements as at and for the year ended 31 December 2016 Future interest has been estimated based on the market interest rates at the date of preparation of these consolidated financial statements, summarised in the notes. Liquidity risk management is mainly based on containing debt and maintaining a balanced financial position. This strategy is pursued by each of the Group s operating companies. Loans and borrowings and trade payables (net of advances) falling due before 31 March 2017 are compared with the cash and cash equivalents that can be used to meet such obligations in the table below: Total financial Cash and cash Difference commitments equivalents due before ( 000) 31 March 2017 Salini Impregilo (head office and branches) 158, , ,408 Subsidiaries 106, , ,300 SPEs 110, , ,481 Joint operations 14, , ,549 Total 390,473 1,595,211 1,204,738 Fair value measurement hierarchy IFRS 7 requires that the fair value of financial instruments recognised in the statement of financial position be classified using a fair value hierarchy that reflects the significance of the inputs used to determine fair value. There are three different levels: Level 1 - Fair values measured using quoted prices in active markets; Level 2 - Fair values measured using valuation techniques for which inputs significant to the fair value measurement are based on observable market data; Level 3 - Fair values measured using valuation techniques for which inputs significant to the fair value measurement are based on unobservable market data. Financial instruments recognised by the Group at fair value are classified at the following levels: ( 000) Note Level 1 Level 2 Level 3 Derivative assets Derivative liabilities 25 - (7,180) - Total - (7,024) - There were no movements from Level 1 to Level 2 during the year or vice versa. 262 Annual Report as at 31 December 2016
264 Consolidated financial statements as at and for the year ended 31 December 2016 Income statement 34. Revenue Revenue for 2016 amounts to 5,883.8 million, up 23% on the previous year: ( 000) Variation Revenue 5,760,358 4,624,066 1,136,292 Other income 123, ,229 (22,778) Total revenue 5,883,809 4,770,295 1,113,514 The 1,113.5 million increase in revenue is mainly due to the business volumes of the subsidiary Lane, acquired by the parent in January 2016, as well as other smaller variations due to continuation of work on several large foreign contracts and the closure of completed contracts. A breakdown of revenue is given in the following table: ( 000) Variation Works invoiced to clients 5,404,920 4,368,128 1,036,792 Services 226, ,462 (9,576) Sales 128,553 19, ,077 Total 5,760,358 4,624,066 1,136,292 Services include revenue of million for costs recharged to third party partners of fully consolidated consortia and consortia companies. A breakdown of other income is given in the following table: ( 000) Variation Rent and leases 2,387 1, Staff services (123) Recharged costs 68,855 55,538 13,317 Insurance compensation 659 2,130 (1,471) Gains on the disposal of non-current assets 7,582 13,933 (6,351) Prior year income 28,862 24,930 3,932 Other 15,105 48,157 (33,052) Total 123, ,229 (22,778) 263 Annual Report as at 31 December 2016
265 Consolidated financial statements as at and for the year ended 31 December Costs Costs for the year amount to 5,608.3 million compared to 4,502.7 million for They account for 95.3% of revenue. The item may be broken down as follows: ( 000) Variation Purchases 1,161, , ,945 Subcontracts 1,505,428 1,249, ,471 Services 1,555,996 1,498,977 57,019 Personnel expenses 886, , ,473 Other operating expenses 222, ,067 60,197 Amortisation, depreciation, provisions and impairment losses 277, ,842 39,482 Total 5,608,295 4,502,708 1,105,587 The increase is mainly due to Lane Group s inclusion in the consolidation scope. The variation in the individual items compared to 2015 is also due to the different cost structures that vary from contract to contract and may, in some cases, entail changes in the industrial operating model from one year to another. Moreover, as these are large-scale infrastructural works that take several years to complete, resort to normal production factors depends on the stage of completion of each contract in any given year. These changes may generate significant variations in the percentage of the related cost categories depending on the contract and the year, while not affecting the total percentage of operating costs of total revenue Purchases The cost of raw materials and consumables incurred in 2016 increased by million to 1,161.0 million compared to the previous year: ( 000) Variation Purchases of raw materials and consumables 1,120, , ,376 Change in raw materials and consumables 40,856 3,286 37,570 Total 1,161, , ,946 The rise in the cost of raw materials and consumables is in line with the increase in revenue thanks to the acquisition of Lane Group and the fact that some large foreign projects (especially in Qatar and Australia) and Italian projects (continuation of the high speed/capacity Milan-Genoa section) are fully operational. 264 Annual Report as at 31 December 2016
266 Consolidated financial statements as at and for the year ended 31 December Subcontracts Costs of subcontracts increased to 1,505.4 million, up million on 2015 as shown in the following table: ( 000) Variation Subcontracts 1,505,428 1,249, ,471 Total 1,505,428 1,249, ,471 The million increase is due to Lane Group s acquisition and the increase for the IS JV s Australian contracts ( 17.3 million) partly offset by the reduction in the subcontract costs of the Colombian contract of Constructora Ariguani (the San Roque Ye de Cienaga and Valledupar motorways), the Cityringen project of CMT I/S in Denmark and the Italian Salerno Reggio Calabria contract (nearing completion) Services This item increased to 1,556.0 million, up 57.0 million on the previous year, as shown in the following table: ( 000) Variation Consultancy and technical services 599, , ,899 Fees to directors, statutory auditors and independent auditors 13,321 12, Employee travel costs 5,332 2,780 2,552 Maintenance and testing 32,717 18,538 14,179 Transport and customs 121, ,798 (15,705) Insurance 54,946 61,426 (6,480) Recharging of costs by consortia 206, ,451 (256,509) Rent and leases 233, ,891 68,020 Charge backs Other 287, , ,107 Total 1,555,997 1,498,976 57,021 Other increased by million over the previous year and includes the cost of temporary workers on CMT IS Danish contract (Cityringen project) of approximately million compared to 69.0 million for 2015, while the remainder mostly relates to utilities, seconded personnel, security and board costs. Consultancy and technical services increased by million and mainly consist of the design and construction costs incurred by the SPEs and legal and administrative consultancy fees. 265 Annual Report as at 31 December 2016
267 Consolidated financial statements as at and for the year ended 31 December 2016 A breakdown of this item is as follows: ( 000) Variation Design and engineering services 399, ,168 15,892 Legal, administrative and other services 79,014 68,487 10,527 Testing 1,368 1,493 (125) Construction 120,197 38,592 81,605 Total 599, , ,899 The increase in this item is mainly due to the rise in costs for Construction related to the Riyadh Metro Line 3 contract Personnel expenses Personnel expenses for the year amount to million, up by million on The item is made up as follows: ( 000) Variation Wages and salaries 671, , ,496 Social security and pension contributions 147,536 75,207 72,329 Post-employment benefits and employee benefits 13,878 15,486 (1,608) Other 53,551 49,295 4,256 Total 886, , ,473 The increase is mostly a result of the acquisition of Lane Group and its roughly 5,000 employees. Other mainly relates to termination benefits and reimbursements of travel expenses Other operating expenses Other operating expenses amount to million, up 60.2 million on This item is made up as follows: ( 000) Variation Other operating costs 117,520 81,753 35,767 Commissions on sureties 44,896 47,901 (3,005) Bank charges 15,456 5,272 10,184 Losses on the disposal of property, plant and equipment 9,459 12,741 (3,282) Other non-recurring costs Other prior year expense 34,923 14,400 20,523 Other operating expenses 222, ,068 60, Annual Report as at 31 December 2016
268 Consolidated financial statements as at and for the year ended 31 December 2016 This item s increase is due to the rise in the parent s other operating costs due to the arbitration award with Pizzarotti S.p.A. and assessed fines (Arabian Bemco Contracting and Co.), other charges (settlement due to the waiver of a claim by Co.Ge. Fin S.r.l.) and higher bank charges, also incurred by the parent. The balance includes higher customs duties on the new Koysha contract in Ethiopia. Prior year expense includes the out-of-court settlement between the customer and Empresa Constructora Metro 6 Ltda in Chile (see the paragraph in the section on the Main risk factors and uncertainties in the directors report) Amortisation, depreciation, provisions and impairment losses This item of million shows an increase of 39.5 million on the balance for the previous year. It may be analysed as follows: ( 000) Variation Impairment losses 14,623 10,592 4,031 Provisions 1,879 12,192 (10,313) Total provisions and impairment losses, net of the release of provisions 16,502 22,784 (6,282) Amortisation of intangible assets 1, ,158 Depreciation of property, plant and equipment 226, ,495 36,317 Amortisation of rights to infrastructure under concession 1,344 1,493 (149) Amortisation of contract acquisition costs 31,121 22,683 8,438 Total amortisation and depreciation 260, ,058 45,764 Total 277, ,842 39,482 Provisions and impairment losses decreased by 6.3 million in Specifically, impairment losses of 14.6 million mainly related to the receivables for late payments from Venezuelan clients, described in the paragraph on Venezuela in the section on the Main risk factors and uncertainties of the Directors report. The provisions of 1.9 million include accruals to the provision for risks, mainly for the parent for the potential costs of disputes in Argentina ( 2.3 million), the Kazakistani branch for disputes with the local customer (approximately 1.1 million) and H.C.E. Costruzioni Group for the completion of works in Ukraine ( 2.7 million), offset by the release of accruals made in previous years for projects performed in Chile ( 3.6 million) and the Dominican Republic ( 1.1 million). Amortisation and depreciation of million shows an increase of 45.8 million due to the change in the consolidation scope, following Lane s acquisition, and greater amortisation and depreciation expense for the Riyadh Metro Line 3 project. 267 Annual Report as at 31 December 2016
269 Consolidated financial statements as at and for the year ended 31 December Net financing costs Net financing costs amount to 86.5 million compared to 90.4 million for the previous year. The item may be broken down as follows: ( 000) Variation Financial income 44,499 34,587 9,912 Financial expense (146,542) (108,336) (38,206) Net exchange rate gains (losses) 15,537 (16,675) 32,212 Net financing costs (86,506) (90,424) 3, Financial income Financial income totalled 44.5 million (2015: 34.6 million) and is made up as follows: ( 000) Variation Interest income on loans and receivables 2,106 2,373 (267) Gains on securities 10, ,314 Interest and other income from unconsolidated group companies and other related parties 9,645 8, Interest and other financial income 22,433 23,484 (1,051) - Interest income on correspondence accounts - 6 (6) - Interest on financing (407) - Bank interest 6,203 4,590 1,613 - Default interest 5,959 9,624 (3,665) - Financial discounts and allowances Other 9,526 8,156 1,370 Total 44,499 34,587 9,912 The 9.9 million increase is due to the recognition of the gain on the sale of foreign currency securities on the US market offset the reduction in default interest due from clients during the year. Other financial income increased by 1.4 million to 9.5 million and comprises interest income on the life insurance policy for Lane s employees ( 2.2 million), reversal of the Salini-Impregilo PPA ( 1.6 million) and interest income on loans and receivables of the Argentine operator Caminos de las Sierras ( 1.4 million). 268 Annual Report as at 31 December 2016
270 Consolidated financial statements as at and for the year ended 31 December Financial expense Financial expense totalled million ( million) and is made up as follows: ( 000) Variation Intragroup interest and other expense (517) (200) (317) Interest and other financial expense (146,025) (108,136) (37,889) - Bank interest (74,711) (53,330) (21,381) - Interest on bonds (35,863) (29,400) (6,463) - Interest on tax liabilities (1,589) (1,392) (197) - Default interest (722) (61) (661) - Discounting (2,822) (245) (2,577) - Bank fees (4,830) (3,426) (1,404) - Charges on sureties (1,884) (1,311) (573) - Other loans and borrowings (2,836) (3,218) Factoring and leases (6,116) (7,546) 1,430 - Other (14,652) (8,207) (6,445) Total (146,542) (108,336) (38,206) Financial expense increased by 38.2 million, mainly due to the rise of 28.6 million in bank interest expense and interest on bonds, as a result of the Group s higher debt following the acquisition of Lane. Discounting mostly relates to the actuarial valuation of Lane Group s employees pension plan. Interest expense on other loans and borrowings principally refers to the financial liabilities for the factoring of tax and trade receivables related to the high speed/capacity Milan - Genoa railway section contract. Other includes the loss of 3.8 million on the securities of the Colombian company Yuma Concessionaria S.A. In addition: bank interest of 74.7 million includes the effect of the amortised cost method of 21.7 million, including 13.9 million, which did not entail cash outlays during the year 2016 as it had already been in paid in previous years, and 7.8 million which was paid partly in 2015 and partly in the first half of 2016, but was fully recognised in profit or loss in 2016, in connection with the loan taken out to acquire Lane Group; interest on bonds of 35.9 million includes the effect of the amortised cost method for 3.7 million. 269 Annual Report as at 31 December 2016
271 Consolidated financial statements as at and for the year ended 31 December Net exchange rate gains (losses) The net exchange rate gains amount to 15.5 million (2015: net losses of 16.7 million). ( 000) Variation Net realised exchange rate gains (losses) 2,940 (75,607) 78,547 Net unrealised exchange rate gains 10,622 60,341 (49,719) Net currency hedging gains (losses) 1,975 (1,409) 3,384 Total 15,537 (16,675) 32,212 The 32.2 million improvement in this item is due to the Euro s appreciation against some foreign currencies, especially the Namibian dollar, the Ethopian Birr and the Sierra Leone currency, as well as the positive exchange rate trends for the activities carried out in Ukraine and Tunisia by HCE Group. In order to translate its net financial assets in the Venezuelan currency (Bolivar Fuerte, VEF), the Group adopted the official DICOM exchange rate in 2016, compared to the SIMADI rate, which it started to use in Net gains on equity investments Net gains on investments came to 9.1 million compared to 0.3 million for the previous year. The item may be broken down as follows: ( 000) Variation Share of profit (loss) of investees 5,409 (142) 5,551 Dividends (197) Loss on the disposal of equity investments (365) - (365) Other income 3, ,797 Total 9, ,786 The share of profit of investees is 5.4 million, an increase on 2015 mainly due to the change in the consolidation scope following the acquisition of the US group Lane, which balanced the loss recognised by the investee Grupo Unidos por el Canal. 270 Annual Report as at 31 December 2016
272 Consolidated financial statements as at and for the year ended 31 December 2016 The following table provides a breakdown of this item: ( 000) Variation Share of profit (loss) of investees Yuma Concessionaria 988 3,870 (2,882) Agua Azul 1,053 1,094 (41) Impregilo Arabia (620) (3,209) 2,589 Gupc (18,440) (103) (18,337) Ochre Holding Solution (711) (1,768) 1,057 Wolverhampton (175) (80) (95) Gaziantep Hastane Saglik (247) (496) 249 Interstate Healy JV (33) (120) 87 Irina S.r.l. in liquidation (12) (437) 425 Metro de Lima Linea 2 S.A ,377 (590) Yacilec (241) (153) (88) Edilfi scrl in liquidation Edilizia sociale Montenero scrl Rimini Fiera S.p.A. (1,421) - (1,421) Other (354) (117) (237) Sub-total (18,996) (142) (18,854) Subsidiaries del Lane Group: Agl Constructor JV (19) - (19) Flatiron Lane JV 1-1 Gemma Lane Liberty 2,116-2,116 Gemma Lane Patriot 5,185-5,185 Fluor Lane 95 2,194-2,194 Purple Line 4,685-4,685 Skanca Granite Lane JV 9,516-9,516 SGL Leasing Fluor Lane South Caroline Total Lane Group joint ventures 24,405-24,405 Total 5,409 (142) 5, Annual Report as at 31 December 2016
273 Consolidated financial statements as at and for the year ended 31 December Income tax expense The Group s income tax expense for the year is 78.0 million as follows: ( 000) Variation Current taxes (income taxes) 66,510 36,976 29,534 Net deferred tax (income) expense (5,761) 33,436 (39,197) Prior year taxes 10,905 9,531 1,374 Total 71,654 79,943 (8,289) IRAP 6,298 4,634 1,664 Total 77,952 84,577 (6,625) An analysis and reconciliation of the theoretical income tax rate, calculated under Italian tax legislation, and the effective tax rate are set out below: INCOME TAX EXPENSE euro million % Profit before tax Theoretical tax expense % Effect of permanent differences (1.0) (0.5%) Net effect of foreign taxes % Prior year and other taxes % Total % The effective tax expense is affected by the following in particular: permanent differences; the assets for taxes paid abroad by the consolidated companies branches, recognised to the extent the Group believes the conditions exist for their recovery in Italy in 2016 or subsequent years, the taxes paid by the subsidiaries operating abroad, calculated using the related tax rates. An analysis and reconciliation of the theoretical IRAP tax rate and the effective tax rate are set out below: Operating profit Personnel expenses Revenue 1,161.7 IRAP euro million % Theoretical tax expense % Tax effect of foreign companies production (22.6) (1.9%) Tax effect of foreign production (14.4) (1.2%) Tax effect of permanent differences (2.0) (0.2%) Total % 272 Annual Report as at 31 December 2016
274 Consolidated financial statements as at and for the year ended 31 December 2016 The net deferred tax expense contributes to the consolidated profit for 5.8 million as shown below: ( 000) Deferred tax expense for the year 17,745 Utilisation of deferred tax liabilities recognised in previous years (14,791) Deferred tax income for the year (28,808) Utilisation of deferred tax assets recognised in previous years 20,093 Total (5,761) 39. Related party transactions Transactions with related parties, as defined by IAS 24, were of an ordinary nature and were carried out with the following counterparties in 2016: directors, statutory auditors and key management personnel, solely related to the contracts regulating their positions within the Group; associates and joint arrangements; these transactions mainly relate to: - commercial assistance with purchases and procurement of services necessary to carry out work on contracts, contracting and subcontracting; - services (technical, organisational, legal and administrative), carried out at centralised level; - financial transactions, namely loans and joint current accounts as part of cash pooling transactions and guarantees given on behalf of group companies. Transactions are carried out with associates in the interests of Salini Impregilo, aimed at building on existing synergies in the Group in terms of production and sales integration, efficient use of existing skills, streamlining of centralised structures and financial resources. These transactions are regulated by specific contracts and are carried out on an arm s length basis; 273 Annual Report as at 31 December 2016
275 Consolidated financial statements as at and for the year ended 31 December 2016 other related parties: the main transactions with other related parties, identified pursuant to IAS 24, including companies managed and coordinated by Salini Costruttori S.p.A., are summarised below: Related party ( 000) Loans and receivables Financial assets Other assets Trade payables Financial liabilities Total revenue Total costs Financing income (costs) C.Tiburtino Casada S.r.l CEDIV S.p.A. 1,722 3, Corso del Popolo Immobiliare S.r.l 3,120 Dirlan G.A.B.I.RE S.r.l. 1,155 18, Galla Placida Imm. Agricola San Vittorino Infernetto 13 7 Iniziative Immobiliari Italiane S.p.A ,008 (3) Madonna dei Monti S.r.l Nores 30 7 Plus Salini Costruttori S.p.A ,069 11,956 8, (83) Salini Simonpietro & C Todini Finanziaria 1,480 Zeis Total 8,140 29,232 11, , , Most of the Group s production is carried out through SPEs, set up with other partners that have participated with Salini Impregilo in tenders. The SPEs carry out the related contracts on behalf of its partners. The other transactions refer to costs for design and similar activities, incurred when presenting bids and for recently started contracts. They are also governed by specific agreements and carried out on an arm s length basis and, where applicable, in line with the contract terms. Their effects on the statement of financial position and income statement are shown together with the related contract, when appropriate. In December 2016, the parent SAPA granted Salini Costruttori S.p.A. shares free of charge, which may be converted into Salini Impregilo shares, to Salini Impregilo employees. 274 Annual Report as at 31 December 2016
276 Consolidated financial statements as at and for the year ended 31 December 2016 Transactions with Directors, Statutory Auditors and Key management personnel are show below: Fees and Total Fees and Total ( 000) remuneration remuneration Directors and statutory auditors 6,311 6,311 10,781 10,781 Key management personnel 5,402 5,402 5,114 5,114 Total 11,713 11,713 15,895 15,895 The next table shows the impact of transactions with unconsolidated group companies on the statement of financial position and the income statement (including as a percentage), while their effect on cash flows is shown in the statement of cash flows, when material: 31 December 2016 ( 000) Non-current loans and receivables (1) Current loans and receivables (2) Current Revenue Costs liabilities (3) Financial income Financial expense Total - group companies 19, , , , ,317 9, Total financial statements item 1,532,997 7,796,990 5,809,852 5,883,809 5,608,295 44, ,542 % of financial statements item 1.2% 4.7% 2.4% 3.8% 3.9% 21.6% 0.2% 31 December 2015 ( 000) Non-current loans and receivables (1) Current loans and receivables (2) Current Revenue Costs liabilities (3) Financial income Financial expense Total - group companies 19, , , , ,983 8, Total financial statements item 1,051,336 6,103,298 4,566,071 4,770,295 4,502,708 34, ,336 % of financial statements item 1.9% 6.2% 3.3% 10.5% 10.7% 25.2% 0.2% (1) The percentage of non-current loans and receivables is calculated considering total non-current assets. (2) The percentage of current loans and receivables is calculated considering total current assets. (3) The percentage of current liabilities is calculated considering total current liabilities. 40. Earnings per share Earnings per share are disclosed at the foot of the statement of comprehensive income. Basic earnings per share are calculated by dividing the profit (loss) for the year attributable to the owners of the parent by the weighted average of the shares outstanding during the year. Diluted earnings per share are calculated considering the weighted average of the outstanding shares adjusted by assuming the conversion of all the shares with potentially diluting effects. The following table summarises the calculation. Following the merger resolution of 12 September 2013, 44,974,754 new ordinary Salini Impregilo S.p.A. shares were issued to Salini Costruttori S.p.A. to service the merger. 275 Annual Report as at 31 December 2016
277 Consolidated financial statements as at and for the year ended 31 December 2016 On 20 June 2014, the board of directors approved a capital increase with the related issue of 44,740,000 new shares. This took place on 25 June 2014 and the parent s share capital comprises 492,172,691 ordinary shares and 1,615,491 savings shares. In October 2014, the parent repurchased 3,104,377 own shares. No shares have been subsequently issued or repurchased. ( 000) Profit from continuing operations 120,176 92,920 Non-controlling interests (39,592) (21,638) Profit earmarked for holders of savings shares Profit from continuing operations attributable to the owners of the parent 80,584 71,282 Profit from continuing and discontinued operations 99,514 82,231 Non-controlling interests (39,592) (21,638) Profit earmarked for holders of savings shares Profit from continuing and discontinued operations attributable to the owners of the parent 60,510 61,181 Average outstanding ordinary shares 489, ,069 Average outstanding savings shares 1,615 1,615 Average number of shares 490, ,684 Dilutive effect 2,511 - Average number of diluted shares 493, ,684 Basic earnings per share (from continuing operations) Basic earnings per share (from continuing and discontinued operations) Diluted earnings per share (from continuing operations) Diluted earnings per share (from continuing and discontinued operations) Events after the reporting date Contract worth USD336 million awarded in Virginia (USA) Lane has won new orders for 850 million in the first two months of Specifically, on 1 March 2017, it was awarded a new design-build contract worth 336 million to extend the 395 Express Lanes in Virginia, USA, where Lane has already performed other works. Preliminary work will start in March million contract awarded for the first lot of the high speed/capacity Naples-Bari railway section On 2 March 2017, the Salini Impregilo-Astaldi joint venture was awarded the contract worth 397 million to design and build the Naples-Cancello segment of the high speed/capacity Naples-Bari section. 276 Annual Report as at 31 December 2016
278 Consolidated financial statements as at and for the year ended 31 December 2016 The works will be performed by Salini Impregilo (lead contractor, 60% share) and Astaldi (40%). The contract signing will take place once the necessary checks required by the tender procedure to ensure that the two joint venturers meet the relevant participation requirements have been completed. The contract was commissioned by ITALFERR S.p.A. and is to be completed by It covers the first segment of the Naples-Bari section and is a fundamental part of the overall restructuring of the entire railway line. CoCiv On 6 March 2017, the Rome prefecture ordered the extraordinary administration of this consortium pursuant to article 32.1.b of Law decree no. 90 of 24 June 2014, converted with amendments by Law no. 114 of 11 August It appointed an extraordinary commissioner for a six-month period which may be extended. 42. Significant non-recurring events and transactions Apart from the acquisition of Lane and completion of the sale of Todini Costruzioni, as described earlier, the Group s financial position, performance and cash flows were not affected by significant non-recurring events and transactions, as defined by Consob communication no. DEM/ Balances or transactions arising from atypical and/or unusual transactions During the year, Salini Impregilo Group did not carry out any atypical and/or unusual transactions, as defined in the above Consob communication no. DEM/ On behalf of the board of directors Chairman (Signed on the original) 1 Significant non-recurring events and transactions are those that do not frequently occur in the normal course of business. 2 Atypical and/or unusual transactions are those that, due to their significance and relevance, the counterparty, the object of the transaction, exchange pricing and timing, may cast doubts as to the accuracy and completeness of disclosures, conflicts of interest, protection of the company s assets and non-controlling interests. 277 Annual Report as at 31 December 2016

279

280 Consolidated financial statements of Salini Impregilo Group Intragroup transactions
281 Intragroup transactions Assets and liabilities at 31 December 2016 Trade receivables Non-current financial assets Current financial assets Other current assets Total assets Aegek - Impregilo - Alstom J.V Agua AZ 29, ,529 Agua BA 56, ,867 Alburni S.c.a.r.l. in liquidation ANBAFER S.c.r.l. 28, ,444 Arge Haupttunnel Eyholz 5,164, ,164,389 Arge Sisto N8 3,386, ,386,223 Aurelia 98 S.c.r.l BA.TA. 91 S.c.r.l Barnard ,056,453 2,056,453 Cagliari 89 S.c.r.l. 2,072, ,072,698 Carvalho Pinto CE.S.I.F. S.c.p.a Churchill Consortium 1, ,413 Churchill Hospital J.V. 2, ,803 CMC Consorzio Monte Ceneri lotto 851 1,046, ,046,614 Con.Sal. S.c.n.c. in liquidation Cons Pizzarotti Todini.Keff-Eddir 3,703, , ,368,230 Cons. A.F.T. in liquidation 740, ,579 Cons. Astaldi Federici Todini Kramis 3,730,804 2,959, ,690,054 Consorcio Cigla-Sade 162,227-1,530,340-1,692,567 Consorcio Contuy Medio 4, , ,417 Consorcio Federici/Impresit/Ice Cochabamba 100, ,000 Consorcio Grupo Contuy-Proyectos y Ob. De F Consorcio OIV-TOCOMA 398, ,990, ,389,405 Consorcio Serra do Mar Consorcio V.S.T. Tocoma - - 1,880-1,880 Consorcio VIT Tocoma - - 3,432,718-3,432,718 Consorio.Kallidromo 591,713 86, ,073 Consorzio 201 Quintai 1,307, ,307,194 Consorzio 202 Quintai 609, ,159 Consorzio Biaschina 42, ,578 Consorzio Casertano Consorzio CEMS 26, ,205 Consorzio Coltun JV 930, ,500 Consorzio Consavia S.c.n.c. 3, ,674 Consorzio Costral in liquidation 88, ,057 Consorzio Costruttori TEEM Annual Report as at 31 December 2016
282 Intragroup transactions Trade payables Current portion of bank loans and current account facilities Other current liabilities Total liabilities Net balance (746) 13, ,234 16,295 32, ,363 24, ,338 1,676, ,676,134 3,488,255 53, ,187 3,333,036 16, ,121 (16,121) 1, ,363 (1,363) ,056,453 1,894,720-5,165 1,899, , ,757 7,757 (7,757) 23, ,482 (23,482) , , ,716 (386,913) 593, , , , ,277 (109,277) 10,791, ,791,938 (6,423,708) 529, , ,176 1,403, ,403,804 5,286,250 1,121, ,121, , , , ,786 (786) - 173, ,648 (173,648) - - 1,219,874 1,219, ,169, , ,069 (400,069) , ,432,718-38,232-38, , , , , , , , , ,674 81,894-14,000 95,894 (7,837) Annual Report as at 31 December 2016
283 Intragroup transactions Assets and liabilities at 31 December 2016 Trade receivables Non-current financial assets Current financial assets Other current assets Total assets Consorzio CPR 3 7, ,602 Consorzio CPR Consorzio CRS9 180, ,641 Consorzio del Sinni 76, ,976 Consorzio EPC 854, ,330-1,196,333 Consorzio Felce BP 350, ,521 Consorzio Ferrofir 111, ,038 Consorzio Galliera Roveredo 1,263, ,263,519 Consorzio Imprese Lavori FF.SS. di Saline - FEIC 5, ,055 Consorzio infrastruttura area metropolitana Consorzio Iniziative Ferroviarie - INFER 3, ,044 Consorzio Iricav Due 3,456, ,456,762 Consorzio MM4 431, ,965 Consorzio MPC 116, ,201 Consorzio NOG.MA Consorzio Pedelombarda 2 477, ,369 Consorzio Piottino 101, ,786 Consorzio Portale Vezia 664, ,240 Consorzio Probin 1,680, ,680,664 Consorzio San Cristoforo Consorzio Sarda Costruzioni Generali 7, ,549 Consorzio Sardo d Imprese Consorzio SI.VI.CI.CA. 351, ,340 Consorzio SIVICICA 3 68, ,044 Consorzio Sivicica 4 109, ,488 Consorzio Stazione Mendrisio 41, ,621 Consorzio TAT-Tunnel Alp Transit Ticino 312, , ,674 1,447,823 Consorzio TRA.DE.CI.V. 115, ,977 Consorzio Tre Esse Consorzio Trevi - S.G.F. INC per Napoli 391, ,351 Consorzio Umbria Sanità in liquidation 14, ,807 Consorzio Venezia Nuova Consorzio VIT Caroni Tocoma Depurazione Palermo S.c.r.l E.R. Impregilo/Dumez y Asociados para Yaciretê 14,468,364-7,403,847-21,872,211 Enecor 3, , ,622 Eurolink S.c.p.a. 10,418, ,418,747 Executive J.V. Impregilo S.p.A. Terna S.A ,311-8, Annual Report as at 31 December 2016
284 Intragroup transactions Trade payables Current portion of bank loans and current account facilities Other current liabilities Total liabilities Net balance 24, ,620 (17,018) 201, ,397 (201,397) , , , , , , , , , ,753 (89,715) ,263, ,055 15, ,976 (15,976) ,044 17,469, ,469,111 (14,012,349) 872, ,041 (440,076) 19, ,923 96,278 57, ,428 (57,428) 270, , ,873 48, ,959 52,827 69, , , ,680,664 35, ,859 (35,859) 42, ,524 (34,975) 14, ,501 (14,501) 1, , , , , , ,135,559 1,135, ,264 69, ,689 46, , ,554 (162,554) 29, , , ,807 6, ,964 (6,964) - 1,359,475-1,359,475 (1,359,475) - - 3,615 3,615 (3,615) 50,900-10,435,991 10,486,891 11,385, ,622 16,481, ,481,754 (6,063,007) , Annual Report as at 31 December 2016
285 Intragroup transactions Assets and liabilities at 31 December 2016 Trade receivables Non-current financial assets Current financial assets Other current assets Total assets FE.LO.VI. S.c.n.c. 158, ,683 Felce lotto , ,696 G.T.B. S.c.r.l. 309, ,117 Galileo S.c.a.r.l. 147, ,141 Gaziantep Hastanesi Isletme Ve Bakim Hizmetleri - - 2,279-2,279 Generalny Wykonawca Salini Polska Group. d entreprises Salini Strabag (Guinea) , ,953 Grupo Empresas Italianas - GEI , ,297 GUPC 38,436, ,436,778 IGL Arabia 436, ,220 Imprese Riunite Genova Irg S.c.r.l. 69, ,401 Imprese Riunite Genova Seconda S.c.r.l. 128, ,442 Irina S.r.l. in liquidation 62, ,400 Isarco S.c.r.l. 3,383, ,383,780 Joint Venture Aktor Ate - Impregilo S.p.A. 12, ,063 Joint Venture Aktor S.A. - Impregilo S.p.A Joint Venture Impregilo S.p.A. - Empedos S.A. - Ak 1,498,407-2,108, ,323 4,096,291 Joint Venture Salini-Acciona (Etiopia) 87, ,152 KAYI - Salini - Samsung - JV 831, ,325-1,042,820 La Quado S.c.a.r.l. 50, , ,684 Lambro Scrl 173, ,617 Line 3 Metro Stations 82, , ,794 M.N. 6 S.c.r.l. 455, ,204 Marmore Commessa ,872 14,872 Maver in liquidation 4, ,316 METRO BLU 10,688, ,688,241 Metrogenova S.c.r.l. 33, ,098 Metropolitana di Napoli S.p.A. 189, ,622 Nobiallo in liquidation Ochre Holding - 11,313, ,313,740 Ochre Solutions Ltd 237, ,276 Olbia 90 S.c.r.l. 117, ,471 Pantano S.C.R.L Passante di Mestre S.c.p.A. 568, ,457 Passante Dorico S.p.A. 191,325-36, ,968 Pedelombarda S.c.p.a. 1,578, ,578,267 Pedemontana Veneta S.p.A. 75, , ,568 Puentes 10,298, ,298, Annual Report as at 31 December 2016
286 Intragroup transactions Trade payables Current portion of bank loans and current account facilities Other current liabilities Total liabilities Net balance , ,696 95, , , , ,050 29, , , ,297 1,214, ,214,819 37,221, , ,142 (466,922) 314, ,336 (244,935) ,442-4,161-4,161 58,239 3,274, ,274, , , ,096, , ,042, ,684 6, , , , , , , ,833 (396,629) , ,316 13,741, ,741,200 (3,052,959) 39, ,814 (6,716) 69, , , ,313, ,276 86, ,106 31,365 1, ,001 (1,001) 65, , , , , , , , ,298, Annual Report as at 31 December 2016
287 Intragroup transactions Assets and liabilities at 31 December 2016 Trade receivables Non-current financial assets Current financial assets Other current assets Total assets RCCF Nodo di Torino S.c.p.a. 104,458-39, ,910 Riviera S.c.r.l. 307, ,605 Rupe di Orvieto S.c.a.r.l. in liquidation 49, ,551 S. Anna Palermo S.c.r.l S.I.MA. GEST 3 S.c.r.l S.Ruffillo S.c.a.r.l San Benedetto S.c.r.l San Giorgio Caltagirone S.c.r.l. 130, ,112 Sarmento S.c.r.l. 49, , ,240 Scat 5 S.c.a.r.l. in liquidation 54, ,374 Sclafani S.c.r.l. 393, ,411 Sedi S.c.a.r.l. 61,462 57, ,070 SFI leasing SHIMMICK 136, ,202,232 7,338,824 Sibar Arge 951, ,227-1,286,932 Sirjo S.c.p.A. 1,870, ,870,352 Sistranyac S.A ,043-12,955 Sivicica SO.C.E.T. Societa Costruttori Edili Toscani Società di progetto consortile per azioni M4 455, ,730 Soingit S.c.r.l. 230, ,631 SPV Linea M4 S.p.a. 250,431-4,325,458-4,575,889 Stazione Tribunale Strade e Depuratori Palermo S.c.r.l Techint S.A.C.I.- Hochtief A.G.- Impregilo S.p.A 3,467-10,400 12,496,803 12,510,670 Thessaloniki Metro Thessaloniki Metro CW 2,048, ,979 2,466,505 Todedil S.c.a.r.l Valico S.c.a.r.l. in liquidation 1, ,800 Variante di Valico VE.CO. S.c.r.l Wolverhampton 373, ,546 3,966-1,059,545 Yacilec 11, ,569 Yuma 9,364, ,364,820 Total - group companies 147,488,538 15,763, ,400,838 23,666, ,320, Annual Report as at 31 December 2016
288 Intragroup transactions Trade payables Current portion of bank loans and current account facilities Other current liabilities Total liabilities Net balance , , ,417 (332,812) ,551 79,816 40, ,320 (120,320) 162, ,355 (162,355) 17,783, ,783,747 (17,783,747) 45, ,546 (45,546) , , , ,411 15, , , , ,990 (341,990) 3,741, ,741,871 3,596, ,286,932 11,069, ,069,001 (9,198,649) ,955 31, ,725 (31,725) 106, ,287 (106,287) 59, , ,558 96,222 96, ,151 37, ,575, , ,662 (175,662) 179, ,665 (179,665) ,510, (619) 2,922 2,557,025-2,559,947 (93,442) 10, ,269 (9,862) , , ,527 (138,527) ,059, , ,364, ,858,472 5,644,894 13,746, ,250, ,070, Annual Report as at 31 December 2016
289 Intragroup transactions Assets and liabilities at 31 December 2016 Trade receivables Non-current financial assets Current financial assets Other current assets Total assets C. Tiburtino 26, ,610 Casada S.r.l. 35, ,595 CEDIV SPA 1,722,081 3,241, ,963,081 Corso del Popolo Immobiliare S.r.l. 3,119, ,119,791 Dirlan 102, ,781 G.A.B.I.RE. S.r.l. 1,154,730-18,001,297-19,156,027 Galla Placidia 22, ,876 Imm. Agricola San Vittorino 65, ,031 Infernetto S.r.l. 13, ,455 Iniziative Immobiliari 16, ,693 Madonna dei Monti S.r.l. 3, ,283 Nores 30, ,227 Plus 185, ,502 Salini Costruttori 109,872-7,068,992 11,956,443 19,135,307 SALINI SIMONPIETRO & C. S.A.P.A. 39, ,511 Todini Finanziaria 1,480, ,480,410 Zeis 11, , ,063 Total other related parties 8,140,311 3,241,000 25,991,489 11,956,443 49,329,243 Total 155,628,849 19,004, ,392,327 35,623, ,649, Annual Report as at 31 December 2016
290 Intragroup transactions Trade payables Current portion of bank loans and current account facilities Other current liabilities Total liabilities Net balance , , ,963, ,119, , ,156, , , , , ,754 (240,061) 39, ,440 (36,157) , , ,062,092-8,062,093 11,073, , ,480,410 7, , , ,267 8,062,092-8,365,359 40,963, ,161,739 13,706,986 13,746, ,615, ,033, Annual Report as at 31 December 2016
291 Intragroup transactions Revenue and costs for 2016 Revenue Other revenue and income Purchases Aegek - Impregilo - Alstom J.V. 1, Agua AZ 275,067 9,500 - Agua BA 28, ,070 - ANBAFER S.c.r.l. 7, ANM - 314,335 - Arge Haupttunnel Eyholz 92, Arge Sisto N8 5,353, Autopistas del Sol S.A Autostrada Al Torun - Strykow BARNARD 1,205, Carvalho Pinto 1,504, CE.S.I.F. S.c.p.a CGMR Gestione materiale Roveredo 295, Churchill Consortium 14, Churchill Hospital J.V. 29, CIVIL WORK - 5,898,694 - CMC-MAVUNDLA-IGL JV - 1,159,192 - Consorcio Cigla-Sade 266, Consorcio Contuy Medio 594 1,981 - Consorcio Grupo Contuy-Proyectos y Ob. De F. 43, Consorcio OIV-TOCOMA 444,231 3,800 - Consorcio Serra do Mar Consorcio VIT Tocoma 321, Consortium CSC Zuttion 779, Consorzio 201 Quintai 9,383,604 3,800 - Consorzio 202 Quintai 5,815, Consorzio Biaschina 10, Consorzio CEMS Consorzio Coltun JV 3,739, Consorzio Costral in liquidation 6,400 2,897 - Consorzio Costruttori TEEM Consorzio CPR Consorzio CPR Consorzio EPC 32,581, ,924 - Consorzio Felce BP 14, Consorzio Ferrofir Consorzio Galliera Roveredo 30, Consorzio Iricav Due - 124, Annual Report as at 31 December 2016
292 Intragroup transactions Services Other operating expenses Amortisation, depreciation, provisions and impairment losses Financial income Financial expense 2, , ,791 1, , , ,774, , , ,871, , ,004, , , , ,808-34, ,090, , , , , ,564, ,953, , , ,781, , , , ,292, ,269-12, , ,686, Annual Report as at 31 December 2016
293 Intragroup transactions Revenue and costs for 2016 Revenue Other revenue and income Purchases Consorzio MM4 80, ,990 - Consorzio MPC 1,313, Consorzio NOG.MA Consorzio Pedelombarda 2-3,800 - Consorzio Piottino 682, Consorzio Portale Vezia 2,433, Consorzio Probin 5,570, Consorzio SI.VI.CI.CA Consorzio Sivicica 4 52, Consorzio Stazione Mendrisio 11, Consorzio Umbria Sanità in liquidation Consorzio VIT Caroni Tocoma E.R. Impregilo/Dumez y Asociados para Yaciretê 79, Enecor 10, Eurolink S.c.p.A. 57, ,289 - G.T.B. S.c.r.l. - 9,414 - Galileo S.c.a.r.l. 7,098 2,897 - GHAZI JV - 9,608 - Groupment Todini Hamilà Grupo Empresas Italianas - GEI 278, GUP CANAL 5,591, , ,445 Healy-Parsons - 20,483 - IGL Arabia ,789 - Isarco S.c.r.l. 138, ,839 - Joint Venture Salini-Acciona (Ethiopia) JV Todini - Kutaisi KAYI - Salini - Samsung - JV - 459,969 - La Quado S.c.a.r.l. 40,192 1,315 - Lambro S.c.r.l. - 16,282 - Line 3 Metro Stations Metro Blu 45, ,155 - Metrogenova S.c.r.l. 19, New Cros Ochre Olding Ochre Solutions Ltd 49, Passante di Mestre S.c.p.A. 3,500 11,451 - Passante Dorico S.p.A ,737 - Pedelombarda S.c.p.a. 50, , Annual Report as at 31 December 2016
294 Intragroup transactions Services Other operating expenses Amortisation, depreciation, provisions and impairment losses Financial income Financial expense 992, , , , , ,747, ,759, , , , , ,368, ,395, , , , , , ,299, ,350, , (3,091) , , ,488,908 1, , , ,064, , ,001, Annual Report as at 31 December 2016
295 Intragroup transactions Revenue and costs for 2016 Revenue Other revenue and income Purchases Puentes 19, ,730 - Risalto S.r.l. 4, Riviera S.c.r.l S.Ruffillo S.c.a.r.l Salini Bulgaria AD San Giorgio Caltagirone S.c.r.l. - 2,582 - SARGE TP - 116,900 - Sarmento S.c.r.l Sclafani S.c.r.l. - 2,582 - Sedi S.c.a.r.l SFI leasing 2,238, SGF Ecuador SHIMMICK 45,898, Sibar Arge 3,486, Sirjo S.c.p.A ,703 - Sistranyac S.A. 5, Sivicica 2 47, Soci Terzi Società di progetto consortile per azioni M4 30,000 4,306 - South Al Mutlaa Joint Venture - 885,669 - SPV Linea M4 S.p.A ,863 - Stazione Tribunale Strade e Depuratori Palermo S.c.r.l. 13, TB Metro in liquidation Techint S.A.C.I.- Hochtief A.G.- Impregilo S.p.A 9,066, Thessaloniki Metro CW 66,596, Todedil S.c.a.r.l Wolverhampton 3,092, Yacilec 10, Yuma 336, Total - group companies 209,608,305 12,410, , Annual Report as at 31 December 2016
296 Intragroup transactions Services Other operating expenses Amortisation, depreciation, provisions and impairment losses Financial income Financial expense , , , , , , ,342, , ,330, ,710, ,127, , , ,130-41, , (125,868) , ,438, , , , , ,561, , ,939 9,401, , Annual Report as at 31 December 2016
297 Intragroup transactions Revenue and costs for 2016 Revenue Other revenue and income Purchases C. Tiburtino 17, Casada S.r.l. 16, CEDIV S.p.A. 17, Dirlan 23, G.A.B.I.RE. S.r.l. 19, Galla Placidia 17, Imm. Agricola San Vittorino 16, Infernetto S.r.l. 6, Iniziative Immobiliari Madonna dei Monti S.r.l. 9,816 1,234 - Nores 6, Plus 28, Salini Costruttori 137,923 8,529 - SALINI SIMONPIETRO & C. S.A.P.A. 14, Zeis 155, ,245 - Total other related parties 487, ,252 - Total 210,096,038 12,528, , Annual Report as at 31 December 2016
298 Intragroup transactions Services Other operating expenses Amortisation, depreciation, provisions and impairment losses Financial income Financial expense , , , ,007, , , , , , , ,642 1,610-27,755-1,461,908 3, , , ,023, , ,939 9,625, , Annual Report as at 31 December 2016

299 Relazione 2016_ING_1-145/ / qxp_Layout 1 21/04/17 20:56 Pagina 298

300 Relazione 2016_ING_1-145/ / qxp_Layout 1 21/04/17 20:56 Pagina 299 Consolidated financial statements of Salini Impregilo Group Equity investments
301 Equity investments Salini Impregilo Group - Equity investments with positive carrying amounts at 31 December 2016 Investee Company 31 December 2015 Acquisitions Capital transactions (Disinvestments and liquidations) Share of profit or loss of equityaccounted investees Acqua Campania S.p.A. 9,607 Agl Jv - (19,480) B.O.B.A.C. S.c.a.r.l. 5,100 (5,100) Calpark S.c.p.A. 4,664 CE.S.I.F. S.c.p.a. 63,460 Co.Ge.Fin s.r.l. (atti parasociali) (1) Consorcio Agua Azul S.A. 7,005,601 1,052,888 Consorcio Federici/Impresit/Ice Cochabamba 15,818 Consorzio A.F.T. (in liq.) 15,494 Consorzio Astaldi Federici Todini Kramis (5) Consorzio Casale Nei 775 Consorzio CON.SI 516 (516) Consorzio Consavia S.c.n.c. 1,714 Consorzio Costral 9,526 Consorzio CPR Consorzio CPR 2 37 Consorzio del Sinni 12,395 Consorzio Ferrofir 182,569 Consorzio Ferroviario Milanese 28,276 Consorzio IECAF 129 Consorzio Imprese Lavori FF.SS. di Saline - FEIC 5,165 Consorzio infrastruttura area metropolitana - Metro Cagliari 5,257 (50) Consorzio Iniziative Ferroviarie - INFER 14,461 Consorzio Iricav Due 176,060 Consorzio Libyan Expressway Contractor 5,800 Consorzio MARC - Monitoraggio Ambientale Regione Campania 2,582 Consorzio MITECO 4,416 (4,416) Consorzio MM4 62,100 2,170 Consorzio Nazionale Imballaggi - CO.NA.I. 5 Consorzio NOG.MA 84,000 Consorzio Pedelombarda 2 4,000 Consorzio Pizzarotti Todini Keft-Eddir 50,000 Consorzio Sarda Costruzioni Generali - SACOGEN 2,582 Consorzio Sardo d Imprese 1, Annual Report as at 31 December 2016
302 Equity investments Reversals of imp. losses/imp. Dividends from equityaccounted investees Change in hedging reserve Change in ROC of equityaccounted investees Change in ROC of investee recognised in investor s financial statements Reclassifications Other changes 31 December 2016 (1,806,843) 144,245 (34,619) 7,011,558 5,294,861 9,607-4,664 63,460 (1,470,111) 301,980 6,890,358 (1) 15,818 15,494 (5) 775-1,714 9, , ,569 28, ,165 5,207 14, ,060 5,800 2,582-64, ,000 4,000 50,000 2,582 1, Annual Report as at 31 December 2016
303 Equity investments Investee Company 31 December 2015 Acquisitions Capital transactions (Disinvestments and liquidations) Share of profit or loss of equityaccounted investees Consorzio TRA.DE.CI.V. 12,533 Consorzio Trevi - S.G.F. INC per Napoli 4,500 Consorzio Umbria Sanità 3,202 Consorzio.Kallidromo 1 Depurazione Palermo S.c.r.l. 3,615 Emittenti Titoli S.p.A. 10,832 Empresa Constructora Lo Saldes L..t.d.a. 5,341 (5,341) Eurolink S.c.p.a. 16,875,000 FE.LO.VI. S.c.n.c. 8,392 Flatiron Lane Jv - 1,307 Fluor Lane South Carolina - 473,972 Fluor Lane95 LLC - 2,193,713 Forum S.c. a r.l. 10,329 G.T.B. S.c.r.l. 5 Gaziantep Hastane Saglik 2,669,408 1,883,273 (246,883) Gemma Lane Liberty Partners - 2,116,441 Gemma Lane Patriot Partners - 5,184,780 Golf Pordenone - Grassetto S.p.A. 7,747 Groupment Sci Sonatro 1 Grupo Unidos Por El Canal S.A. 22,800,664 44,661,451 (18,440,798) Healy-Yonkers-Atlas-Gest J.V. 14,800 (14,800) I.S.V.E.U.R.-SPA (1%) 34,086 I_Faber S.p.A. 583,317 I4 Leasing LLC - 252,256 Immobiliare Golf Club Castel D Aviano S.r.l. 62,910 (30,386) Impregilo Arabia Ltd 3,125,070 1,304,550 (619,743) Impregilo Wolverhampton Ltd 3,805,934 (174,933) Inv In Jv- Jordan Bridge - (4,719,310) Irina S.r.l. in liquidation 308,344 Isarco S.c.r.l. 41,000 Istituto per lo Sviluppo Edilizio ed Urbanistico - ISVEUR S.p.A. 22,750 11,336 Istituto Promozionale per l Edilizia S.p.A. - Ispredil S.p.A. 330 Joint Venture Salini-Acciona (Ethiopia) 9,430 La Quado S.c.a.r.l. 3,500 Lambro S.c.r.l. 20 M.N. 6 S.c.r.l. 510 Manifesto S.p.A. 10, Annual Report as at 31 December 2016
304 Equity investments Reversals of imp. losses/imp. Dividends from equityaccounted investees Change in hedging reserve Change in ROC of equityaccounted investees Change in ROC of investee recognised in investor s financial statements Reclassifications Other changes 31 December ,533 4,500 3, ,615 10,832-16,875,000 8,392 1,175 32,773 35,255 23, ,715 (9,490,338) (114,205) 7,420,185 9,355 10,329 5 (270,175) (58) 4,035,565 (3,613,686) (12,999) 1,830, ,472 (4,968,818) 18, , ,714 14,528 14,528 7, ,021,317-34, , ,223 17,969,500 18,842,979 (14,883) 17,641 (14,463) 3,795,414 (85,123) (226,093) 153,745 3,473,530 (74,063) 4,793, ,344 41,000 34, ,430 3, , Annual Report as at 31 December 2016
305 Equity investments Investee Company 31 December 2015 Capital transactions (Disinvestments and liquidations) Share of profit or loss of equityaccounted investees Markland S.r.l. 1,269 Metro de Lima Linea 2 S.A. 21,546, ,363 Metrogenova S.c.r.l. 8,257 Metropolitana di Napoli S.p.A. 313,652 Nomisma S.p.A. 27,015 Ochre Solutions Holdings Ltd 5,330,317 (710,947) Olbia 90 S.c.r.l. 2,531 PANTANO S.C.R.L.(10,5%) 4,338 Parco Scientifico e Tecnologico della Sicilia S.c.p.A. 5,165 Passante di Mestre S.c.p.A. 4,200,000 Passante Dorico S.p.A. 2,820,000 Pedelombarda S.c.p.A. 9,400,000 Pedemontana Veneta S.p.A. 1,280,700 (42,648) Purple Line Transit Constructors LLC - 4,685,408 RCCF Nodo di Torino S.c.p.A. 26,856 Rimini Fiera S.p.A. 3,193,670 (208,940) (1,420,754) Risalto S.r.l. RM 23,337 (23,337) Risalto S.r.l. RM 77,463 (77,463) Riviera S.c.r.l. 6,470 S. Anna Palermo S.c.r.l. 18,592 S.Ruffillo S.c.a.r.l. 21,000 Salini Impregilo - Duha Joint Venture 100 Salini Saudi Arabia Company Ltd 10,727 San Benedetto S.c.r.l. 9,622 Scat 5 S.c.a.r.l. 6,455 Seveso S.c.a.r.l. 400 Sirjo S.c.p.A. 3,000,000 Sistranyac S.A. 149,965 Skanska Granite Lane - 9,516,084 Skiarea Valchiavenna S.p.A. 99,740 (1,370) Società di Progetto Consortile per Azioni M4 104,040 SPV Linea M4 S.p.A. 9,941,200 3,504,800 Stazione Tibunale 8,600 Techint S.A.C.I.- Hochtief A.G.- Impregilo S.p.A.-Iglys S.A. UTE 3,944 Todedil S.c.a.r.l. 8,780 Trasimeno S.c.a.r.l. 3,060 (3,060) Variante di Valico scrl (in liquidation) 26,239 Variante di Valico scrl (in liquidation) 32,828 VE.CO. S.c.r.l. 2,582 Yacylec S.A. 76,062 Yuma Concessionaria S.A. 11,254, , ,254,484-51,158,640 (4,854,713) 5,545, Annual Report as at 31 December 2016
306 Equity investments Reversals of imp. losses/imp. Dividends from equityaccounted investees Change in hedging reserve Change in ROC of equityaccounted investees Change in ROC of investee recognised in investor s financial statements Reclassifications Other changes 31 December , ,692 23,080,689 8, ,652 27, ,271 4,946,641 2,531 4,338 5,165 4,200,000 2,820,000 9,400,000 1,238, ,706 4,920,114 26,856 1,563, ,470 18,592 21, (10,727) - 9,622 6, ,000, ,965 (5,420,529) 300,345 2,810,542 7,206,442 98, ,040 13,446,000 8,600 3,944 8,780-26,239 32,828 2,582 (76,062) - 1,081,992 13,324,305 - (26,855,448) (226,093) 2,176,959 1,292,833 (110,681) 42,086, ,468, Annual Report as at 31 December 2016
307 Equity investments Salini Impregilo Group - Equity investments with negative carrying amounts at 31 December December 2015 Change in consolidation method Acquisitions Capital transactions (Disinvestments and liquidations) Investee Company Cagliari 89 S.c.r.l. (132,850) Con.Sal. S.c.n.c. (12,428) Consorzio Aree Industriali Potentine (666) Consorzio Astaldi Federici Todini Kramis (953,496) Consorzio Edilizia Sociale Industralizzata Lazio - CESIL (116,927) 116,927 Edilfi S.c.a.r.l. in liquidation (236,121) Fluor Lane LLC - Galileo Scrl (4,110) Imprese Riunite Genova Irg S.c.r.l. (13,209) Interstate Healy Equipment J.V. (108,145) Ital.Sa.Gi. Sp.Z.O.O. (Poland) (222,489) 222,489 S. Leonardo S.c.r.l. (1) Saces S.r.l. (116,600) 116,600 San Giorgio Caltagirone S.c.r.l. (87,001) Sclafani S.c.r.l. (135,866) Soingit S.c.r.l. (50,000) Yacilec - Total equity investments with negative carrying amounts (2,189,909) , Annual Report as at 31 December 2016
308 Equity investments Share of profit or loss of equityaccounted investees Other gains (losses) in profit or loss Dividends from equityaccounted investees Change in hedging reserve Change in ROC of equityaccounted investees Change in ROC of investee recognised in investor s financial statements Reclassifications 31 December 2016 (132,850) (49,704) (62,132) (666) (354,504) (1,308,000) - 236,121 - (415,246) (415,246) (4,110) (13,209) (32,529) (5,179) (145,853) - (1) - (87,001) (135,866) (50,000) (240,819) (6,193) 76,062 (170,950) (441,435) - (415,246) - (11,372) - 76,062 (2,525,884) 307 Annual Report as at 31 December 2016
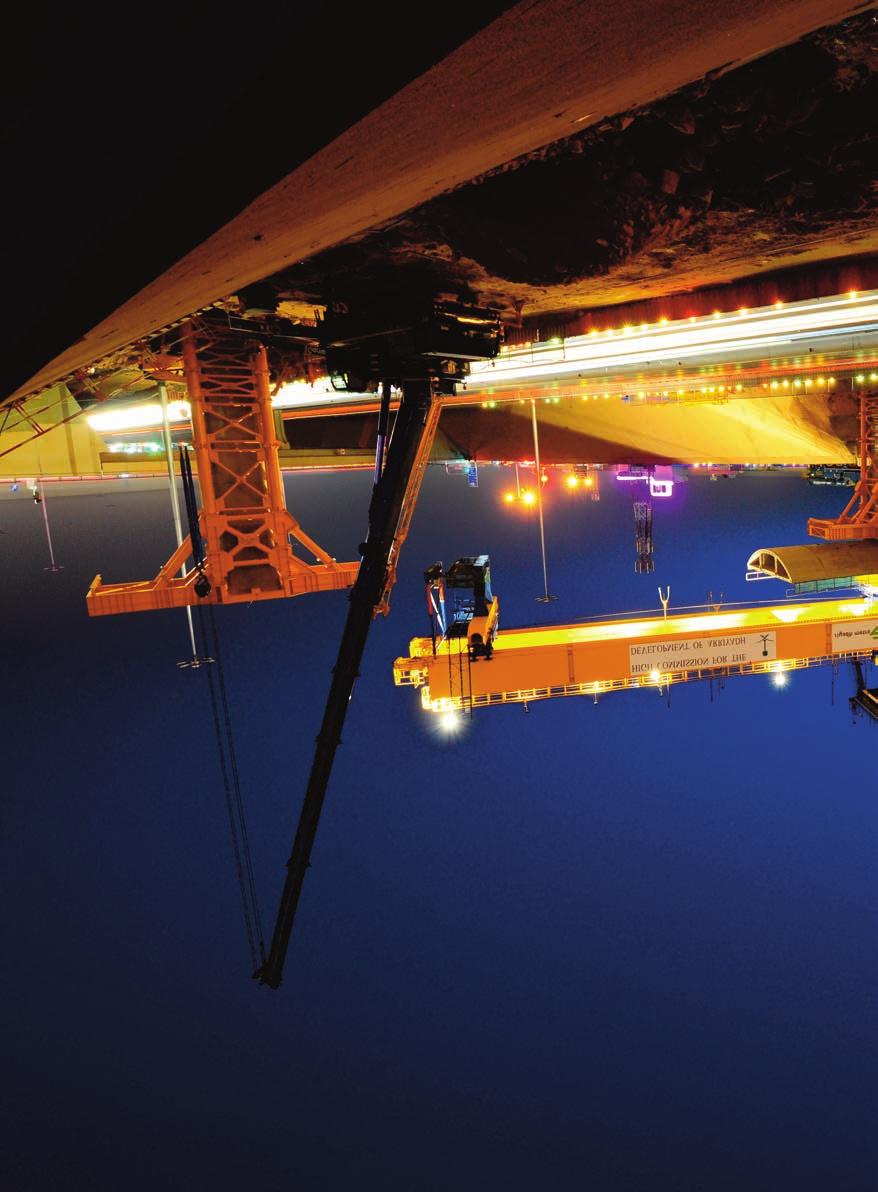
309

310 Consolidated financial statements of Salini Impregilo Group Scope of Consolidation
311 Scope of Consolidation List of companies included in the consolidation scope Name Country Currency Share/quota capital subscribed Salini Impregilo S.p.A. Italy Euro 544,740,000 A1 Motorway Tuszyn-Pyrzowice lot F Joint Venture Poland PLN Alia S.c.r.l. (in liq.) Italy Euro 10,200 Ancipa S.c.r.l. (in liq.) Italy Euro 10,200 Bocoge S.p.A. - Costruzioni Generali Italy Euro 1,702,720 CIS Divisione Prefabbricati Vibrocesa Scac - C.V.S. S.r.l. (in liq.) Italy Euro 10,000 CO. MAR. S.c.r.l. (in liq.) Italy Euro 10,200 Collegamenti Integrati Veloci C.I.V. S.p.A. Italy Euro 6,200 Compagnia Gestione Finanziarie - Co.Ge.Fin S.r.l. Italy Euro 100,000 Compagnia Gestione Macchinari CO.GE.MA. S.p.A. Italy Euro 1,032,000 Congressi 91 S.c.r.l. (in liq.) Italy Euro 25,000 Consorcio Acueducto Oriental Dom. Consorcio Impregilo - OHL Colombia Consorcio Impregilo Yarull Dom. Consorzio Alta Velocità Torino/Milano - C.A.V.TO.MI. Italy Euro 5,000,000 Consorzio C.A.V.E.T. - Consorzio Alta Velocità Emilia/Toscana Italy Euro 5,422,797 Consorzio Caserma Donati (in liq.) Italy Euro 300,000 Consorzio Cociv Italy Euro 516,457 Consorzio FAT Italy Euro 45,900 Consorzio Libyan Expressway Contractor Italy Euro 10,000 Consorzio Scilla (in liq.) Italy Euro 1,000 Consorzio Torre (in liq.) Italy Euro 5,000,000 Consorzio tra le Società Impregilo/Bordin/Coppetti/Icep - CORAV Italy Euro 51,129 Consorzio/Vianini lavori/impresit/dal Canton/Icis/Siderbeton - VIDIS (in liq.) Italy Euro 25,822 Constructora Ariguani SAS Colombia COP 100,000,000 Constructora Mazar Impregilo-Herdoiza Crespo Ecuador Construtora Impregilo y Associados S.A.-CIGLA S.A. Brazil BRL 7,641,014 Copenaghen Metro Team I/S Denmark Corso del Popolo Engineering S.c.r.l. Italy Euro 10,000 Corso del Popolo S.p.A. Italy Euro 1,200,000 Costruzioni Ferroviarie Torinesi Duemila S.c.r.l. (in liq.) Italy Euro 10,328 CSC Impresa Costruzioni S.A. Switzerland CHF 2,000,000 Diga Ancipa S.c.r.l. (in liq.) Italy Euro 10,200 Effepi - Finanza e Progetti S.r.l. (in liq.) Italy Euro 78,000 Empresa Constructora Angostura L.t.d.a. Chile CLP 22,422, Annual Report as at 31 December 2016
312 Scope of Consolidation Investment % % direct % indirect Invest-held by Method 31/12/ line-by-line Salini Polska L.t.d. Liability Co line-by-line 0.01 HCE Costruzioni S.p.A Imprepar S.p.A. line-by-line Imprepar S.p.A. line-by-line Imprepar S.p.A. line-by-line INCAVE S.r.l. line-by-line Imprepar S.p.A. line-by-line line-by-line line-by-line line-by-line Impresa Castelli S.r.l. line-by-line 20 Bocoge S.p.A line-by-line Impregilo Colombia SAS line-by-line line-by-line line-by-line line-by-line line-by-line C.I.V. S.p.A. line-by-line Imprepar S.p.A. line-by-line 1 CO.GE.MA. S.p.A line-by-line line-by-line line-by-line line-by-line Imprepar S.p.A. line-by-line line-by-line line-by-line line-by-line line-by-line HCE Costruzioni S.p.A. line-by-line HCE Costruzioni S.p.A. line-by-line INCAVE S.r.l. line-by-line line-by-line Imprepar S.p.A. line-by-line SGF INC S.p.A. line-by-line line-by-line 311 Annual Report as at 31 December 2016
313 Scope of Consolidation Name Country Currency Share/quota capital subscribed Empresa Constructora Metro 6 L.t.d.a. Chile CLP 25,000,000 Engeco France S.a.r.l. France Euro 15,470 EURL Todini Algerie (in liq.) Algeria DZD 5,000,000 Eurotechno S.r.l. (in liq.) Italy Euro 26,245 FIBE S.p.A. Italy Euro 3,500,000 Fisia - Alkatas Joint Venture Turkey - Fisia Ambiente S.p.A. Italy Euro 3,000,000 Fisia Italimpianti S.p.A. Italy Euro 7,000,000 Galfar - Salini Impregilo - Cimolai JV Qatar - Generalny Wykonawca Salini Polska - Impregilo - Kobylarnia S.A. Poland - Gestione Napoli S.r.l. (in liq.) Italy Euro 10,000 Groupe Mediterraneen di Travaux d Infrastructures (in liq.) Algeria DZD 1,000,000 Groupement Todini - Enaler Autoroute Algeria Algeria DZD 1,000,000 Grupo ICT II SAS Colombia COP 2,942,980,000 HCE Costruzioni S.p.A. Italy Euro 2,186,743 HCE Costruzioni Ukraine LLC Ukraine Euro 10,000 I.L.IM. - Iniziative Lombarde Immobiliari S.r.l. (in liq.) Italy Euro 10,000 IGLYS S.A. Argentina ARS 10,000,000 Impregilo Colombia SAS Colombia COP 6,455,000,000 Impregilo International Infrastructures N.V. Netherllands Euro 50,000,000 Impregilo Lidco Libya Co Libya DL 5,000,000 Impregilo New Cross L.t.d. GB GBP 2 Impregilo Parking Glasgow L.t.d. GB GBP 1,000 Impregilo-SK E&C-Galfar al Misnad JV Qatar - Impregilo-Terna SNFCC JV Greece Euro 100,000 Imprepar-Impregilo Partecipazioni S.p.A. Italy Euro 3,100,000 Impresa Castelli S.r.l. (in liq.) Italy Euro 10,000 Impresit del Pacifico S.A. Peru PEN 35,000 INC - Algerie S.a.r.l. Algeria DZD 301,172,000 INCAVE S.r.l. (in liq.) Italy Euro 90,000 IS Joint Ventures Australia - Joint Venture Impregilo S.p.A. - S.G.F. INC S.p.A. Greece - Lane Abrams Joint Venture USA - Lane Construction Corporation USA USD 991,600 Lane Corman Joint Venture USA - Lane DS - NC Consortium United Arab - Lane Industries Incorporated USA USD 1 Lane Infrastructure Inc. USA USD 10 Lane International B.V. USA USD 18,000 Lane Mideast Contracting LLC United Arab AED 300,000 Lane Mideast Qatar LLC Qatar QAR 5,000,000 Lane National Contracting Joint Venures United Arab Annual Report as at 31 December 2016
314 Scope of Consolidation Investment % % direct % indirect Invest-held by Method 31/12/ Cigla S.A. line-by-line Imprepar S.p.A. line-by-line 0.33 INCAVE S.r.l HCE Costruzioni S.p.A. line-by-line Imprepar S.p.A. line-by-line Impregilo Intern. Infrastruc. N.V. line-by-line Fisia Italimpianti S.p.A. line-by-line line-by-line line-by-line line-by-line Salini Polska Limited Liability Company line-by-line Fisia Ambiente S.p.A. line-by-line HCE Costruzioni S.p.A. line-by-line HCE Costruzioni S.p.A. line-by-line line-by-line line-by-line HCE Costruzioni S.p.A. line-by-line line-by-line Impregilo Intern. Infrastruc. N.V. line-by-line 2 INCAVE S.r.l line-by-line line-by-line line-by-line Impregilo Intern. Infrastruc. N.V. line-by-line Impregilo Intern. Infrastruc. N.V. line-by-line line-by-line line-by-line line-by-line Imprepar S.p.A. line-by-line Imprepar S.p.A. line-by-line SGF INC S.p.A. line-by-line Imprepar S.p.A. line-by-line Salini Australia PTY L.t.d. line-by-line SGF INC S.p.A. line-by-line Lane Construction Corporation line-by-line Lane Industries Incorporated line-by-line Lane Construction Corporation line-by-line Lane Mideast Contracting LLC line-by-line Salini Impregilo - US Holdings Inc. line-by-line Lane Industries Incorporated line-by-line Lane Worldwide Infrastructure Inc. line-by-line Lane International B.V. line-by-line Lane International B.V. line-by-line Lane Mideast Contracting LLC line-by-line 313 Annual Report as at 31 December 2016
315 Scope of Consolidation Name Country Currency Share/quota capital subscribed Lane Solid - Tadmur Joint Venture Qatar Lane Worldwide Infrastructure Inc.. USA USD 10 Lanecon Corporation USA Librino S.c.r.l. (in liq.) Italy Euro 45,900 Melito S.c.r.l. (in liq.) Italy Euro 77,400 Mercovia S.A. Argentina ARS 10,000,000 Metro B S.r.l. Italy Euro 20,000,000 Metro B1 S.c.a.r.l. Italy Euro 100,000 Perugia 219 S.c.r.l. Italy Euro 10,000 PGH L.t.d. Nigeria NGN 52,000,000 Pietrarossa S.c.r.l. (in liq.) Italy Euro 10,200 Piscine dello Stadio S.r.l. Italy Euro 1,100,000 Piscine S.c.r.l. Italy Euro 10,000 Reggio Calabria - Scilla S.c.p.A. Italy Euro 35,000,000 RI.MA.TI. S.c.a.r.l. Italy Euro 100,000 Rivigo JV (Nigeria) L.t.d. Nigeria NGN 100,000,000 S. Leonardo Due S.c.r.l. (in liq.) Italy Euro 40,800 S. Leonardo S.c.r.l. (in liq.) Italy Euro 25,500 S.A. Healy Company USA USD 11,320,863 S.G.F. - I.N.C. S.p.A. Italy Euro 3,859,680 Salerno-Reggio Calabria S.c.p.A. Italy Euro 50,000,000 Salini Impregilo Joint Venture for Mukorsi Zimbabwe Salini Australia PTY L.t.d. Australia AUD 4,350,000 Salini Bulgaria A.D. Bulgaria BGN 50,000 Salini Hydro L.t.d. Ireland Euro 20,000 Salini Impregilo - Duha Joint Venture Slovakia Salini Impregilo - Healy JV (Cleveland) USA Salini Impregilo - NRW Joint Venture Australia Salini Impregilo - Salini Insaat - NTF JV Turkey Salini Impregilo - US Holdings Inc. USA USD 1,000 Salini Impregilo S.p.A. - S.A. Healy Company Jose J Chediack S.A. UTE Argentina ARS 10,000 Salini India Private L.t.d. India INR 93,500,000 Salini Insaat Taahhut Sanayi Ve Ticaret Anonim Sirketi Turkey TRY 50,000 Salini Malaysia SDN BHD Malaysia MYR 1,100,000 Salini Namibia Proprietary L.t.d. Namibia NAD 100 Salini Nigeria L.t.d. Nigeria NGN 10,000,000 Salini Polska - Todini - Salini Impregilo - S7 JV Poland PLN Salini Polska - Todini - Salini Impregilo - Pribex - S3 JV Poland PLN Salini Polska - Todini - Salini Impregilo - Pribex - S8 JV Poland PLN Salini Polska L.t.d. Liability Co Poland PLN 393,000 Salini Saudi Arabia Company L.t.d. Saudi Arabia 314 Annual Report as at 31 December 2016
316 Scope of Consolidation Investment % % direct % indirect Invest-held by Method 31/12/ Lane Mideast Qatar LLC line-by-line Lane Industries Incorporated line-by-line Lane Construction Corporation line-by-line Imprepar S.p.A. line-by-line Imprepar S.p.A. line-by-line Impregilo Intern. Infrastruc. N.V. line-by-line line-by-line line-by-line Imprepar S.p.A. line-by-line line-by-line Imprepar S.p.A. line-by-line HCE Costruzioni S.p.A. line-by-line HCE Costruzioni S.p.A. line-by-line line-by-line line-by-line PGH L.t.d. line-by-line Imprepar S.p.A. line-by-line Imprepar S.p.A. line-by-line Lane Construction Corporation line-by-line line-by-line line-by-line ,1 Imprepar S.p.A. line-by-line line-by-line line-by-line line-by-line line-by-line S.A. Healy Company line-by-line line-by-line Salini Insaat T.S.V.T.A.S. line-by-line line-by-line S.A. Healy Company line-by-line CO.GE.MA. S.p.A. line-by-line line-by-line CO.GE.MA. S.p.A. line-by-line line-by-line CO.GE.MA. S.p.A. line-by-line Salini Polska L.t.d. Liability Co line-by-line 0.01 HCE Costruzioni S.p.A Salini Polska L.t.d. Liability Co line-by-line 0.01 HCE Costruzioni S.p.A Salini Polska L.t.d. Liability Co line-by-line 0.01 HCE Costruzioni S.p.A line-by-line line-by-line 315 Annual Report as at 31 December 2016
317 Scope of Consolidation Name Country Currency Share/quota capital subscribed Salini-Kolin-GCF Joint Venture Turkey Euro 4,000 San Martino Prefabbricati S.p.A. (in liq.) Italy Euro 10,000 Savico S.c.r.l. (in liq.) Italy Euro 10,200 Seli Tunneling Denmark A.p.s. Denmark DKK 130,000 Società Autostrada Broni - Mortara S.p.A. Italy Euro 28,902,600 Società Industriale Prefabbricazione Edilizia del Mediterraneo - S.I.P.E.M. S.p.A. (in liq.) Italy Euro 10,000 Sti Abwicklungs Gmbh Germany Euro 25,000 Suramericana de Obras Publicas C.A.- Suropca C.A. Venezuela VEB 2,874,118,000 Sviluppo Applicazioni Industriali - SAPIN S.r.l. (in liq.) Italy Euro 51,480 TB Metro S.r.l. (in liq.) Italy Euro 100,000 Todini - Hamila Tunisia Todini Akkord Salini Ukraine Trincerone Ferroviario S.c.r.l. (in liq.) Italy Euro 45,900 Vegas Tunnel Constructors USA Vittoria S.c.r.l. (in liq.) Italy Euro 20,400 Western Station J.V, Saudi Arabia Arge Tulfes Pfons Austria Euro 1,000 Arriyad New Mobility Consortium Arabia Civil Works Joint Ventures Arabia CMC - Mavundla - Impregilo JV South Africa Consorcio Contuy Medio Grupo A C.I. S.p.A. Ghella Sogene C.A., Otaola C.A. Venezuela Consorzio Constructor M2 Lima Peru Ghazi-Barotha Contractors JV Switzerland Impregilo-Healy-Parsons JV USA USD Kayi Salini Samsung Joint Venture Turkey Euro Nathpa Jhakri JV India USD 1,000,000 Riyadh Metro Line 3 Saudi Arabia SAD 10,000,000 South Al Mutlaa JV Kuwait Tristar Salini Joint Venture United Arab Aegek-Impregilo-Aslom JV Greece AGL Constructor JV USA Aguas del Gran Buenos Aires S.A. (in liq.) Argentina ARS 45,000,000 Aguas del Oeste S.A. Argentina ARS 170,000 ANBAFER S.c.r.l. (in liq.) Italy Euro 25,500 Arge Haupttunnel Eyholz Switzerland Arge Sisto N8 Switzerland Autopistas del Sol S.A. Argentina ARS 175,396,394 Barnard Impregilo Healy JV USA C.P.R.2 Italy Euro 2,066 C.P.R.3 Italy Euro 2,066 C.U.S. Consorzio Umbria Sanità (in liq.) Italy Euro 10, Annual Report as at 31 December 2016
318 Scope of Consolidation Investment % % direct % indirect Invest-held by Method 31/12/ line-by-line Impresa Castelli S.r.l. line-by-line Imprepar S.p.A. line-by-line 19 Sapin S.r.l Impregilo Intern. Infrastruc. N.V. line-by-line line-by-line line-by-line Impregilo Intern. Infrastruc. N.V. line-by-line CSC S.A. line-by-line Imprepar S.p.A. line-by-line line-by-line HCE Costruzioni S.p.A. line-by-line HCE Costruzioni S.p.A. line-by-line Imprepar S.p.A. line-by-line S.A. Healy Company line-by-line Imprepar S.p.A. line-by-line line-by-line joint oper joint oper Salini Saudi Arabia Company L.t.d. joint oper joint oper joint oper joint oper joint oper S.A. Healy Company joint oper joint oper joint oper joint oper joint oper joint oper equity Lane Construction Corporation equity Impregilo Intern. Infrastruc. N.V. equity 2.36 Iglys. S.A Iglys S.A. equity Imprepar S.p.A. equity CSC S.A. equity CSC S.A. equity Impregilo Intern. Infrastruc. N.V. equity S.A. Healy Company equity Imprepar S.p.A. equity Imprepar S.p.A. equity Imprepar S.p.A. equity 317 Annual Report as at 31 December 2016
319 Scope of Consolidation Name Country Currency Share/quota capital subscribed Cagliari 89 S.c.r.l. (in liq.) Italy Euro 10,200 CE.S.I.F. S.c.p.a. (in liq.) Italy Euro 250,000 CGR Consorzio Galliera Roveredo Switzerland Churchill Construction Consortium GB Churchill Hospital JV GB CMC - Consorzio Monte Ceneri lotto 851 Switzerland Coincar S.A. Argentina ARS 40,465,122 Con. Sal S.c.n.c. (in liq.) Italy Euro 15,494 Consorcio Agua Azul S.A. Peru PEN 69,001,000 Consorcio Carvalho Pinto Brazil Consorcio Cigla-Sade Brazil Consorcio Contuy Medio Venezuela Consorcio Federici/Impresit/Ice Cochabamba Bolivia USD 100,000 Consorcio Grupo Contuy-Proyectos y Obras de Ferrocarriles Venezuela Consorcio Normetro Portugal Consorcio OIV-TOCOMA Venezuela Consorcio Serra do Mar Brazil Consorcio V.I.T. - Tocoma Venezuela Consorcio V.I.T. Caroni - Tocoma Venezuela Consorcio V.S.T. Venezuela Consorcio V.S.T. Tocoma Venezuela Consortium CSC Zuttion Switzerland Consorzio 201 Quintai Switzerland Consorzio 202 Quintai Switzerland Consorzio Astaldi-Federici-Todini (in liq.) Italy Euro 46,000 Consorzio Astaldi-Federici-Todini Kramis Italy Euro 100,000 Consorzio Biaschina Switzerland Consorzio CEMS Switzerland Consorzio CGMR Switzerland Consorzio Coltum Switzerland Consorzio Consavia S.c.n.c. (in liq.) Italy Euro 20,658 Consorzio Costruttori Strade Lazio - COSTRAL (in liq.) Italy Euro 20,000 Consorzio CRS 9 Switzerland Consorzio del Sinni Italy Euro 51,646 Consorzio di Riconversione Industriale Apuano - CO.RI.A. S.c.r.l. Italy Euro 46,481 Consorzio EPC Peru Consorzio Felce BP Switzerland Consorzio Felce lotto 101 Switzerland Consorzio Ferrofir (in liq.) Italy Euro 30,987 Consorzio Ferroviario Milanese Italy Euro 154,937 Consorzio Imprese Lavori FF.SS. di Saline - FEIC Italy Euro 15,494 Consorzio Iniziative Ferroviarie - INFER Italy Euro 41,316 Consorzio Iricav Due Italy Euro 510, Annual Report as at 31 December 2016
320 Scope of Consolidation Investment % % direct % indirect Invest-held by Method 31/12/ Sapin S.r.l. equity equity CSC S.A. equity Impregilo New Cross L.t.d. equity Impregilo New Cross L.t.d. equity CSC S.A. equity Iglys S.A. equity equity Impregilo Intern. Infrastruc. N.V. equity Cigla S.A. equity Cigla S.A. equity equity Imprepar S.p.A. equity equity equity equity Cigla S.A. equity equity equity Suropca C.A. equity equity CSC S.A. equity CSC S.A. equity CSC S.A. equity HCE Costruzioni S.p.A. equity HCE Costruzioni S.p.A. equity CSC S.A. equity CSC S.A. equity CSC S.A. equity CSC S.A. equity Imprepar S.p.A. equity Imprepar S.p.A. equity CSC S.A. equity Imprepar S.p.A. equity Imprepar S.p.A. equity equity CSC S.A. equity CSC S.A. equity Imprepar S.p.A. equity Imprepar S.p.A. equity Imprepar S.p.A. equity Imprepar S.p.A. equity equity 319 Annual Report as at 31 December 2016
321 Scope of Consolidation Consorzio Kallidromo Greece Euro 8,804 Consorzio MARC - Monitoraggio Ambientale Regione Campania (in liq.) Italy Euro 25,822 Consorzio MITECO (in liq.) Italy Euro 10,000 Consorzio MM4 Italy Euro 200,000 Consorzio MPC Switzerland Consorzio NOG.MA (in liq.) Italy Euro 600,000 Consorzio Pedelombarda 2 Italy Euro 10,000 Consorzio Piottino Switzerland Consorzio Pizzarotti Todini-Kef-Eddir. Italy Euro 100,000 Consorzio Portale Vezia (CVP Lotto 854) Consorzio Probin Switzerland Switzerland Consorzio Sarda Costruzioni Generali - SACOGEN Italy Lit 20,000,000 Consorzio Sardo d Imprese (in liq.) Italy Euro 103,291 Consorzio SI.VI.CI.CA. Consorzio SIVICICA 3 Consorzio SIVICICA 4 Consorzio Stazione Mendrisio Consorzio TAT-Tunnel Alp Transit Ticino, Arge Switzerland Switzerland Switzerland Switzerland Switzerland Consorzio Trevi - S.G.F. INC per Napoli Italy Euro 10,000 Constuctora Embalse Casa de Piedra S.A. (in liq.) Argentina ARS 821 Depurazione Palermo S.c.r.l. (in liq.) Italy Euro 10,200 E.R. Impregilo/Dumez y Asociados para Yaciretê - ERIDAY Argentina USD 539,400 EDIL.CRO S.c.r.l. (in liq.) Italy Euro 10,200 Edil.Gi. S.c.r.l. (in liq.) Italy Lit 20,000,000 Enecor S.A. Argentina ARS 8,000,000 Eurolink S.c.p.A. Italy Euro 150,000,000 Executive JV Impregilo S.p.A. Terna S.A. - Alte S.A. (in liq.) FE.LO.VI. S.c.n.c. (in liq.) Italy Euro 25,822 Flatiron-Lane JV Fluor-Lane 95 LLC Fluor-Lane LLC Fluor-Lane South Carolina LLC Forum S.c.r.l. (in liq.) Italy Euro 51,000 Galileo S.c.r.l. (in liq.) Italy Euro 10,000 Gaziantep Hastane Sanglik Hizmetleri Isletme Yatrim Joint Stock Company Turkey TRY 45,000,000 Gaziantep Hastanesi Isletme Ve Bakim Hizmetleri Gemma-Lane Liberty Partners Gemma-Lane Patriot Partners Grupo Empresas Italianas - GEI Venezuela VEB 10,000,000 Grupo Unidos Por El Canal S.A. Panama USD 1,000,000 Healy-Yonkers-Atlas-Gest JV I4 Leasing LLC Country Currency Share/quota capital subscribed Impregilo Arabia L.t.d. Saudi Arabia SAD 40,000,000 Impregilo Wolverhampton L.t.d. GB GBP 1,000 Greece USA USA USA USA Turkey USA USA USA USA 320 Annual Report as at 31 December 2016
322 Scope of Consolidation Investment % % direct % indirect Invest-held by Method 31/12/ HCE Costruzioni S.p.A. equity Effepi S.r.l. equity equity equity CSC S.A. equity equity equity CSC S.A. equity HCE Costruzioni S.p.A. equity CSC S.A. equity CSC S.A. equity Sapin S.r.l. equity Sapin S.r.l.. equity CSC S.A. equity CSC S.A. equity CSC S.A. equity CSC S.A. equity ,5 CSC S.A. equity SGF INC S.p.A. equity Imprepar S.p.A. equity Imprepar S.p.A. equity Iglys S.A. equity Bocoge S.p.A. equity Imprepar S.p.A. equity Impregilo Intern. Infrastruc. N.V. equity equity equity Imprepar S.p.A. equity Lane Construction Corporation equity Lane Construction Corporation equity Lane Construction Corporation equity Lane Construction Corporation equity equity Imprepar S.p.A. equity equity equity Lane Construction Corporation equity Lane Construction Corporation equity equity equity S.A. Healy Company equity Lane Construction Corporation equity equity Impregilo Intern. Infrastruc. N.V. equity 321 Annual Report as at 31 December 2016
323 Scope of Consolidation Name Country Currency Share/quota capital subscribed Imprese Riunite Genova Irg S.c.r.l. (in liq.) Italy Euro 25,500 Imprese Riunite Genova Seconda S.c.r.l. (in liq.) Italy Euro 25,000 Impresit Bakolori Plc Nigeria NGN 100,800,000 Interstate Healy Equipment JV USA IRINA S.r.l. (in liq.) Italy Euro 103,000 Isarco S.c.r.l. Italy Euro 10,000 Isibari S.c.r.l. Italy Euro 15,300 Joint Venture Aegek-Impregilo-Ansaldo-Seli-Ansaldobreda Greece Joint Venture Aktor Ate - Impregilo S.p.A. (Constantinos) Greece Joint Venture Impregilo S.p.A. - Empedos S.A. - Aktor A.T.E. Greece Joint Venture Terna - Impregilo Greece JV Salini - Secol Romania Kallidromo Joint Venture Greece Euro 29,347 La Quado S.c.a.r.l. Italy Euro 10,000 Line 3 Metro Stations Greece Metro Blu S.c.r.l. Italy Euro 10,000 Metro de Lima Linea 2 S.A. Peru PEN 368,808,060 Metrogenova S.c.r.l. Italy Euro 25,500 Ochre Solutions Holdings L.t.d. GB GBP 20,000 Olbia 90 S.c.r.l. (in liq.) Italy Euro 10,200 Pantano S.c.r.l. (in liq.) Italy Euro 40,800 Passante di Mestre S.c.p.A. (in liq.) Italy Euro 10,000,000 Passante Dorico S.p.A. Italy Euro 24,000,000 Pedelombarda S.c.p.A. Italy Euro 80,000,000 Pedemontana Veneta S.p.A. (in liq.) Italy Euro 6,000,000 Puentes del Litoral S.A. (in liq.) Argentina ARS 43,650,000 Purple Line Transit Constructors LLC USA RCCF Nodo di Torino S.c.p.A. (in liq.) Italy Euro 102,000 Risalto S.r.l. (in liq.) Italy Euro 89,000 Riviera S.c.r.l. Italy Euro 50,000 S. Anna Palermo S.c.r.l. (in liq.) Italy Euro 40,800 S. Ruffillo S.c.r.l. Italy Euro 60,000 Salini Acciona Joint Venture Ethiopia Euro 20,000 Salini Strabag Joint Ventures Guinea Euro 10,000 San Benedetto S.c.r.l. (in liq.) Italy Euro 25,823 San Giorgio Caltagirone S.c.r.l. (in liq.) Italy Euro 25,500 SCAT 5 S.c.r.l. (in liq.) Italy Euro 25,500 Sclafani S.c.r.l. (in liq.) Italy Euro 10,400 SEDI S.c.r.l. Italy Euro 10,000 SFI Leasing Company USA Shimmick CO. INC. - FCC CO S.A. - Impregilo S.p.A. -JV USA SI.VI.CI.CA. 2 Switzerland Sibar Arge Switzerland 322 Annual Report as at 31 December 2016
324 Scope of Consolidation Investment % % direct % indirect Invest-held by Method 31/12/ Imprepar S.p.A. equity Imprepar S.p.A. equity equity S.A. Healy Company equity Imprepar S.p.A. equity equity Bocoge S.p.A. equity equity equity equity equity equity HCE Costruzioni S.p.A. equity 2.3 Consorzio Kallidromo equity equity equity equity equity Impregilo Intern. Infrastruc. N.V. equity Sapin S.r.l. equity equity equity equity equity equity Iglys S.A. equity Lane Construction Corporation equity INCAVE S.r.l. equity Imprepar S.p.A. equity equity equity equity equity equity Imprepar S.p.A. equity Imprepar S.p.A. equity Imprepar S.p.A. equity Imprepar S.p.A. equity HCE Costruzioni S.p.A. equity equity equity CSC S.A. equity CSC S.A. equity 323 Annual Report as at 31 December 2016
325 Scope of Consolidation Name Country Currency Share/quota capital subscribed Sirjo S.c.p.A. Italy Euro 30,000,000 Sistranyac S.A. Argentina ARS 3,000,000 Skanska-Granite-Lane JV USA Società di Progetto Consortile per Azioni M4 Italy Euro 360,000 Soingit S.c.r.l. (in liq.) Italy Lit 80,000,000 SPV Linea M4 S.p.A. Italy Euro 26,700,000 Stazione Tribunale S.c.r.l. Italy Euro 20,000 Strade e Depuratori Palermo S.c.r.l. (in liq.) Italy Euro 10,200 Techint S.A.C.I.- Hochtief A.G.- Impregilo S.p.A.-Iglys S.A. UTE Argentina Thessaloniki Metro CW JV Greece TM-Salini Consortium Malaysia Todedil S.c.r.l. (in liq.) Italy Euro 10,200 Trasimeno S.c.r.l. (in liq.) Italy Euro 10,000 Variante di Valico S.c.r.l. (in liq.) Italy Euro 90,000 VE.CO. S.c.r.l. Italy Euro 10,200 Yacylec S.A. Argentina ARS 20,000,000 Yuma Concessionaria S.A. Colombia COP 26,000,100, Annual Report as at 31 December 2016
326 Scope of Consolidation Investment % % direct % indirect Invest-held by Method 31/12/ equity Impregilo Intern. Infrastruc. N.V. equity Lane Construction Corporation equity equity Imprepar S.p.A. equity equity equity Imprepar S.p.A. equity Iglys S.A. equity equity equity Imprepar S.p.A. equity Imprepar S.p.A. equity Imprepar S.p.A. equity equity Impregilo Intern. Infrastruc. N.V. equity Impregilo Intern. Infrastruc. N.V. equity 325 Annual Report as at 31 December 2016
327 Scope of Consolidation Changes in the consolidation scope First year of inclusion Name Country Currency Share/quota capital subscribed Fisia - Alkatas Joint Venture Turkey HCE Costruzioni S.p.A. Italy Euro 2,186,743 Lane Industries Incorporated USA USD 1 Salini Impregilo - NRW Joint Venture Australia Salini Impregilo - US Holdings Inc. USA USD 1,000 Salini Saudi Arabia Company L.t.d. Saudi Arabia Lane Abrams Joint Venture USA Lane Construction Corporation USA USD 991,600 Lane Corman Joint Venture USA Lane DS - NC Consortium United Arab Lane Infrastructure Inc. USA USD 10 Lane International B.V. USA USD 18,000 Lane Mideast Contracting LLC United Arab AED 300,000 Lane Mideast Qatar LLC Qatar QAR 5,000,000 Lane National Contracting Joint Venures United Arab Lane Solid - Tadmur Joint Venture Qatar Lane Worldwide Infrastructure Inc. USA USD 10 HCE Costruzioni Ukraine LLC Ukraine Euro 10,000 South Al Mutlaa JV Kuwait Change in investment percentage Name Country Currency Share/quota capital subscribed Consorcio Impregilo - OHL Colombia Salini Impregilo S.p.A. - S.A. Healy Company Jose J Chediack S.A. UTE Argentina ARS 10,000 Groupe Mediterraneen di Travaux d Infrastructures (in liq.) Algeria DZD 1,000,000 Civil Works Joint Ventures Arabia 326 Annual Report as at 31 December 2016
328 Scope of Consolidation Investment % % direct % indirect Investheld by Method Fisia Italimpianti S.p.A. line-by-line line-by-line Salini Impregilo - US Holdings Inc. line-by-line line-by-line line-by-line line-by-line Lane Construction Corporation line-by-line Lane Industries Incorporated line-by-line Lane Construction Corporation line-by-line Lane Mideast Contracting LLC line-by-line Lane Industries Incorporated line-by-line Lane Worldwide Infrastructure Inc.. line-by-line Lane International B.V. line-by-line Lane International B.V. line-by-line Lane Mideast Contracting LLC line-by-line Lane Mideast Qatar LLC line-by-line Lane Industries Incorporated line-by-line HCE Costruzioni S.p.A. line-by-line Proportionat Investment % % direct % indirect Investheld by Method Impregilo Colombia SAS line-by-line S.A. Healy Company line-by-line HCE Costruzioni S.p.A. line-by-line Salini Saudi Arabia Company L.t.d. joint oper. 327 Annual Report as at 31 December 2016
329 Scope of Consolidation Change in investors Name Country Currency Share/quota capital subscribed S.A. Healy Company USA USD 11,320,863 Salini Impregilo - Healy JV (Cleveland) USA Vegas Tunnel Constructors USA Impregilo-Healy-Parsons JV USA USD Interstate Healy Equipment JV USA Excluded in 2016 Name Country Currency Share/quota capital subscribed CCTE Italy Euro Montenero S.c.r.l. (in liq.) Italy Euro 10,400 Salini Impregilo Bin Omran JV Qatar Salini USA Inc USA USD 20,000 Todini Costruzioni Generali S.p.A. Italy Euro 56,907,000 Todini Central Asia Kazakhstan Todini Takenaka Joint Venture Azerbaijan 328 Annual Report as at 31 December 2016
330 Scope of Consolidation Investment % % direct % indirect Investheld by Method Lane Construction Corporation line-by-line S.A. Healy Company line-by-line S.A. Healy Company line-by-line S.A. Healy Company joint oper S.A. Healy Company equity Investment % % direct % indirect Investheld by Method ILIM S.r.l. line-by-line Imprepar S.p.A. line-by-line line-by-line line-by-line line-by-line HCE Costruzioni S.p.A. line-by-line HCE Costruzioni S.p.A. line-by-line 329 Annual Report as at 31 December 2016

331 Statement on the consolidated financial statements
332 Statement on the consolidated financial statements Statement on the consolidated financial statements pursuant to article 81-ter of Consob regulation no of 14 May 1999 and subsequent amendments and integrations 1 Pietro Salini, as chief executive officer, and Massimo Ferrari, as manager in charge of financial reporting, of Salini Impregilo S.p.A., considering the provisions of article 154-bis.3/4 of Legislative decree no. 58 of 24 February 1998, state: - that the administrative and accounting procedures are adequate given the Group s characteristics; and - that they were actually applied during 2016 to prepare the consolidated financial statements. 2 No significant issues arose. 3 Moreover, they state that: 3.1 The consolidated financial statements: a) have been prepared in accordance with the applicable International Financial Reporting Standards endorsed by the European Union pursuant to EC Regulation 1606/2002 of the European Parliament and Council of 19 July 2002; b) are consistent with the accounting records and entries; c) are suitable to give a true and fair view of the financial position at 31 December 2016 and the results of operations and cash flows for the year then ended of the Issuer and its consolidated companies; 3.2 The Directors report includes a reliable analysis of the financial performance and financial position of the Issuer and the consolidated companies, together with information about the key risks and uncertainties to which they are exposed. Milan, 15 March 2017 Chief Executive Officer Pietro Salini (Signed on the original) Manager in charge of financial reporting Massimo Ferrari (Signed on the original) 331 Annual Report as at 31 December 2016
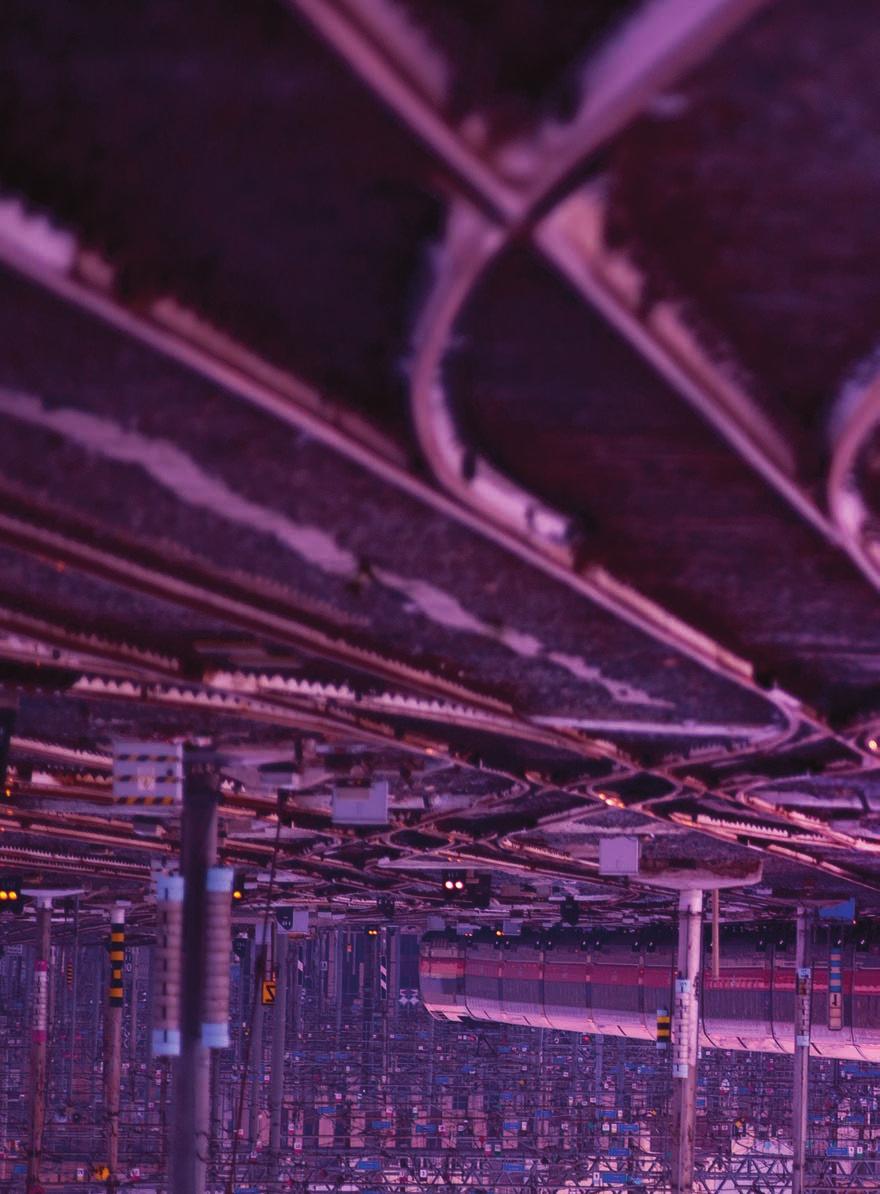
333

334 Separate financial statements of Salini Impregilo S.p.A. as at and for the year ended 31 December 2016
335 Separate financial statements as at and for the year ended 31 December 2016 Statement of financial position ASSETS Note 31 December 2016 of which: 31 December 2015 of which: ( ) related parties related parties Non-current assets Property, plant and equipment 4 223,394, ,955,389 Intangible assets 5 79,544, ,065,769 Equity investments 6 1,129,844, ,599,450 Non-current financial assets 7 19,800,192 17,630,234 Deferred tax assets 8 38,892,158 35,760,220 Total non-current assets 1,491,475,805 1,140,011,062 Current assets Inventories 9 180,810, ,255,365 Contract work in progress 10 1,010,191, ,856,064 Trade receivables 11 1,714,807, ,151,071 1,044,914, ,473,289 Derivatives and other current financial assets ,580, ,029, ,347, ,643,125 Current tax assets ,787,617 83,055,835 Other current tax assets 13 73,948,984 54,809,550 Other current assets ,593,725 67,339, ,530,064 47,028,504 Cash and cash equivalents ,552, ,933,169 Total current assets 4,837,273,365 3,782,701,480 Total assets 6,328,749,170 4,922,712, Annual Report as at 31 December 2016
336 Separate financial statements as at and for the year ended 31 December 2016 EQUITY AND LIABILITIES Note 31 December 2016 of which: 31 December 2015 of which: ( ) related parties related parties Equity Share capital 544,740, ,740,000 Share premium reserve 120,798, ,798,000 Other reserves 242,728, ,838,700 Other comprehensive income (expense) 9,516,709 (11,826,217) Retained earnings 25,042,273 11,080,964 Profit for the year 64,603,085 35,730,602 Total 16 1,007,428, ,362,049 Non-current liabilities Bank and other loans and borrowings ,981, ,988,866 Bonds ,114, ,211,387 Finance lease liabilities 19 47,237,288 67,001,708 Post-employment benefits and employee benefits 21 12,802,047 12,089,646 Deferred tax liabilities 8 24,152,011 34,569,609 Provisions for risks 22 72,076,342 29,884,216 Total non-current liabilities 1,781,363,748 1,215,745,433 Current liabilities Current portion of bank loans and borrowings and current account facilities ,879, ,430, ,594, ,182,337 Current portion of bonds 18 18,931,430 10,202,740 Current portion of finance lease liabilities 19 30,413,597 42,081,174 Derivatives and other current financial liabilities 20 2,751,382 10,685,476 Progress payments and advances on contract work in progress 23 1,246,547,473 1,003,417,880 Trade payables 24 1,415,799, ,243, ,898, ,479,246 Current tax liabilities 25 72,172,437 47,775,377 Other current tax liabilities 25 15,395,714 30,781,650 Other current liabilities ,066,272 29,970, ,167,579 21,975,604 Total current liabilities 3,539,957,332 2,769,605,060 Liabilities directly associated with non-current assets held for sale Total equity and liabilities 6,328,749,170 4,922,712, Annual Report as at 31 December 2016
337 Separate financial statements as at and for the year ended 31 December 2016 Income statement Note 2016 of which: 2015 of which: ( ) related parties related parties Revenue Revenue 29 2,974,147, ,240,061 2,913,416, ,616,410 Other income ,512,076 64,364, ,771,584 70,105,966 Total revenue 3,076,659,886 3,027,188,430 Costs Purchases 30.1 (372,282,479) (667,094) (340,250,868) (212,587) Subcontracts 30.2 (432,876,673) (78,704,926) (491,807,126) (2,087,670) Services 30.3 (1,482,866,987) (496,649,393) (1,497,050,126) (754,402,456) Personnel expenses 30.4 (274,549,359) (2,717,230) (275,492,809) (1,622,377) Other operating expenses 30.5 (129,216,409) (1,031,281) (69,915,862) (40,303) Amortisation, depreciation, provisions and impairment losses 30.6 (140,018,758) (342,682) (146,068,235) (5,970,342) Total costs (2,831,810,665) (2,820,585,026) Operating profit 244,849, ,603,404 Financing income (costs) and gains (losses) on equity investments Financial income ,407,871 17,067,548 29,667,421 19,845,483 Financial expense 31.2 (115,493,629) (5,466,587) (99,392,862) (21,206,101) Net exchange rate gains ,266,154 16,092,163 Net financing costs (60,819,604) (53,633,278) Net losses on equity investments 32 (56,103,446) (114,937,598) Net financing costs and net losses on investments (116,923,050) (168,570,876) Profit before tax 127,926,171 38,032,528 Income tax 33 (63,323,086) (2,301,926) Profit for the year 64,603,085 35,730, Annual Report as at 31 December 2016
338 Separate financial statements as at and for the year ended 31 December 2016 Statement of comprehensive income ( 000) Note Profit for the year (a) 64,603 35,731 - items that may be subsequently reclassified to profit or loss, net of the tax effect: Change in the translation reserve 13,470 (10,937) Net gains (losses) on cash flow hedges, net of the tax effect 16 8,017 (10,667) - items that may not be subsequently reclassified to profit or loss, net of the tax effect: Net actuarial gains (losses) on defined benefit plans 16 (144) 843 Other comprehensive income (expense) (b) 21,344 (20,761) Comprehensive income (a) + (b) 85,947 14, Annual Report as at 31 December 2016
339 Separate financial statements as at and for the year ended 31 December 2016 Statement of cash flows ( 000) Note Cash and cash equivalents , ,867 Current account facilities 17 (38,915) (11,436) Total opening cash and cash equivalents 725, ,431 Operating activities Profit for the year 64,603 35,731 Amortisation of intangible assets 30 23,040 17,473 Depreciation of property, plant and equipment ,811 94,681 Net impairment losses and provisions 30 15,168 33,914 Accrual for post-employment benefits and employee benefits 21 6,405 8,901 Net gains on the sale of assets (5,218) (4,919) Deferred taxes 33 (4,619) 32,593 Impairment losses on equity investments , ,437 Income taxes 33 67,942 (30,291) Net interest paid during the year 72,696 60,001 Other non-monetary items 23,350 6,979 Cash flows generated by operations 466, ,500 Increase in inventories and contract work in progress 9-10 (52,622) (179,190) Increase in trade receivables 11 (706,103) (19,292) Increase in progress payments and on contract work in progress , ,249 Increase in trade payables ,902 42,231 Decrease (increase) in other assets/liabilities (118,532) 116,984 Total changes in working capital (73,204) 160,982 Increase in other items not included in working capital (18,729) (73,840) Interest expense paid (64,557) (44,635) Income taxes (36,013) (17,600) Cash flows generated by operating activities 274, ,407 Investing activities Net investments in intangible assets 5 (771) (51,480) Investments in property, plant and equipment 4 (69,464) (119,646) Proceeds from the sale or reimbursement value of property, plant and equipment 35,109 15,455 Investments in non-current financial assets (528,341) (101,618) Proceeds from the sale or reimbursement value of non-current financial assets 6 50,693 (5,541) Acquisitions and/or disposals of subsidiaries or business units, net of cash and cash equivalents (*) (96,213) (5,511) Cash flows used in investing activities (608,986) (268,341) (*) The 2015 balance has been reclassified to Investing activities for ease of comparison. 338 Annual Report as at 31 December 2016
340 Separate financial statements as at and for the year ended 31 December 2016 ( 000) Note Financing activities Dividend distribution 16 (19,983) (19,982) Increase in bank and other loans 17 2,621,469 1,231,062 Decrease in bank and other loans 17 (2,265,414) (742,633) Change in other financial assets/liabilities 107,732 (231,273) Cash flows generated by financing activities 443, ,174 Net exchange rate gains (losses) on cash and cash equivalents 17,456 (16,653) Increase in cash and cash equivalents 126, ,587 Cash and cash equivalents , ,933 Current account facilities 17 (1,230) (38,915) Total closing cash and cash equivalents 851, , Annual Report as at 31 December 2016
341 Separate financial statements as at and for the year ended 31 December 2016 Statement of changes in equity ( 000) Share capital Share premium reserve Legal reserve Share capital increase related charges Extraordinary and other reserves Other reserves Treasury shares As at 1 January , , ,000 (3,970) 146,813 (7,677) Allocation of profit and reserves , Dividend distribution Stock options Other changes Profit for the year Other comprehensive expense Comprehensive income December , , ,534 (3,970) 146,813 (7,677) As at 1 January , , ,534 (3,970) 146,813 (7,677) Allocation of profit and reserves , Dividend distribution Stock options Profit for the year Other comprehensive income Comprehensive income December , , ,321 (3,970) 146,813 (7,677) 340 Annual Report as at 31 December 2016
342 Separate financial statements as at and for the year ended 31 December 2016 Other comprehensive income LTI reserve Total other reserves Translation reserve Hedging reserve Actuarial reserve Total other comprehens ive income (expense) Retained earnings Profit for the year Equity - 235,166 10,148 (18) (1,196) 8,934 2,656 30, ,987-1, ,158 (30,693) (1) (19,982) - (19,982) (751) - (751) ,731 35, (10,937) (10,667) 843 (20,761) - - (20,761) - - (10,937) (10,667) 843 (20,761) , ,839 (789) (10,685) (353) (11,827) 11,081 35, , ,839 (789) (10,685) (353) (11,827) 11,081 35, ,362-1, ,944 (35,731) (19,983) - (19,983) 4,102 4, , ,603 64, ,470 8,018 (144) 21, , ,470 8,018 (144) 21, ,947 4, ,728 12,681 (2,667) (497) 9,517 25,042 64,603 1,007, Annual Report as at 31 December 2016
343 Separate financial statements as at and for the year ended 31 December 2016 Notes to the separate financial statements 1. Basis of preparation Salini Impregilo S.p.A. (the company ) has prepared its 2016 consolidated financial statements on a going concern basis. As required by Regulation no. 1606/2002 issued by the European Parliament and Council, implemented in Italy by Legislative decree no. 38/2005, these separate financial statements have been prepared in accordance with the International Financial Reporting Standards (IFRS) issued by the International Accounting Standards Board (IASB) and endorsed by the European Union at 31 December They comprise a statement of financial position, an income statement, a statement of comprehensive income, a statement of cash flows, a statement of changes in equity and these notes. The separate financial statements have been prepared using the historical cost principle, except for those items which are recognised at fair value in accordance with IFRS, as described in the section on the Accounting policies. The carrying amounts of assets and liabilities, hedged with transactions which qualify for hedge accounting, are adjusted to reflect changes in fair value related to the hedged risks. The statement of financial position, the income statement and the statement of comprehensive income are presented in Euros, whereas the amounts in the statement of cash flows, the statement of changes in equity and these notes are shown in thousands of Euros, unless stated otherwise. Translation of the assets and liabilities in foreign currency related to venezuela At the end of the first half of 2014, the company had to update the estimates for its industrial operations in Venezuela. In line with the previous reports, made available to the public as required by the current legal provisions, the deterioration of the country s economic conditions, seen since early 2014 were such that it became necessary to review the time and financial parameters according to which the company s net assets can be realised in this area. Moreover, in light of the current general framework of the local currency/financial market situation, stemming from the conditions of the abovementioned local economic system, and consistently with the changes to the currency regulations of the country during 2014, the company considered it reasonable, inter alia, to adopt, with effect from 30 June 2014, a new reference exchange rate for the translation of both the present values of working capital denominated in the Venezuelan currency and the prospective assets/liabilities over the entire estimated life of the railway contract work in progress. Since then, the Venezuelan monetary authorities have amended the local currency conversion systems on several occasions up until the most recent change approved on 10 March 2016, introducing two new exchange rates: DIPRO (fixed), only to be used for imports of basic necessities (i.e., medicines, food, etc.); 342 Annual Report as at 31 December 2016
344 Separate financial statements as at and for the year ended 31 December 2016 DICOM (floating), to be applied to all commercial transactions. Given the nature of its business, the company has decided that the DICOM is the exchange rate to be used to translate Bolivar balances as it best represents the rate at which future cash flows, expressed in the local currency, may be settled assuming that they are still valid at the measurement date, also considering the possibility to access the local currency market and the company s need to obtain a currency other than its functional currency. As a result of adoption of the DICOM rate in 2016, the company recorded a decrease of approximately 1.8 million in the carrying amount of its net assets in local currency. The reduction in its net assets in local currency recognised in previous years amounted to 59 million. 2. Changes in standards The following standards, amendments and interpretations have been applied since 1 January 2016: amendment to IFRS 11 - Joint arrangements for the accounting of acquisitions of interests in joint operations; amendment to IAS 1 - Presentation of financial statements for the disclosure initiative; amendments to IAS 16 - Property, plant and equipment and IAS 38 - Intangible assets clarifying acceptable methods of depreciation and amortisation; amendments to IAS 16 - Property, plant and equipment and IAS 41 - Agriculture about bearer plants; amendment to IAS 19 - Employee benefits about employee contributions to defined benefit plans; amendment to IAS 27 - Separate financial statements for the application of the equity method in separate financial statements; amendments as part of the annual improvements to IFRS cycles and Adoption of the above amendments did not significantly affect the company s separate financial statements. This section lists the standards, amendments and interpretations published by the IFRS and endorsed by the European Union but which will become applicable after 31 December 2016: The company has not adopted the above standards in advance. 343 Annual Report as at 31 December 2016
345 Separate financial statements as at and for the year ended 31 December 2016 Standard, amendment or interpretation IFRS 15 - Revenue from contracts with clients, issued in May 2014, including the change to the standard s application date, issued in September 2015 IFRS 9 - Financial instruments, issued in July 2014 Status Endorsed in September 2016 and applicable to annual periods beginning on or after 1 January 2018 Endorsed in November 2016 and applicable to annual periods beginning on or after 1 January 2018 The standards, amendments and interpretations published by the IASB and the International Financial Reporting Standards Interpretations Committee (IFRS- IC) but not yet endorsed by the competent EU bodies at the reporting date are set out below: Standard, amendment or interpretation IFRS 14 - Regulatory deferral accounts issued in January 2014 Status The European Commission has decided not to commence the endorsement process of the draft standard until the final document has been issued IFRS 16 - Leases issued in January 2016 Endorsement expected by the end of 2017 Amendments to IAS 12 - Recognition of deferred tax assets for unrealised losses issued in January 2016 Endorsement expected by the first half of 2017 Amendments to IAS 7 - Disclosure initiative issued in January 2016 Clarifications to IFRS 15: Revenue from contracts with clients issued in April 2016 Endorsement expected by the first half of 2017 Endorsement expected by the first quarter of 2017 Amendments to IFRS 2 - Classification and measurement of share-based payment transactions, issued in June 2016 Amendments to IFRS 4: Applying IFRS 9 Financial instruments with IFRS 4 Insurance contracts, issued in September 2016 Annual Improvements to IFRS Standards Cycle, issued in December 2016 IFRIC 22 - Foreign currency transactions and advance consideration, issued in December 2016 Amendments to IAS 40: Transfers of investment property issued in December 2016 Endorsement expected by the third quarter of 2017 Endorsement expected by the third quarter of 2017 Endorsement expected by the third quarter of 2017 Endorsement expected by the third quarter of 2017 Endorsement expected by the third quarter of 2017 Adoption of the above standards will not significantly affect the company s separate financial statements, except for IFRS 9, IFRS 15 and IFRS 16, for which brief information is provided below. The company has started the process to implement these standards, defining the organisational methods and timing therefor. During the year, it held training courses about IFRS 15 and IFRS 16 in particular 344 Annual Report as at 31 December 2016
346 Separate financial statements as at and for the year ended 31 December 2016 for managers of various internal departments (procurement, IT, planning and controls, tax and accounting) who are involved in implementing the new standards. The company is currently assessing the effects of adopting these new standards on its financial position and performance. Moreover, the new standards will significantly change the disclosures provided in the notes. ifrs 9 - Financial instruments The IASB published the final version of IFRS 9 - Financial instruments in July The standard is applicable to annual reporting periods beginning on or after 1 January Early adoption is allowed. IFRS 9 introduces new rules for the classification and measurement of financial instruments, especially financial assets, based on the business model under which they are held and their cash flow characteristics. The standard classifies financial assets into three main categories. amortised cost, fair value through other comprehensive income and fair value through profit or loss. The categories envisaged by IAS 39, i.e., held-to-maturity, loans and receivables and available-for-sale have been eliminated. The standard also introduced the measurement of impairment losses using the expected credit loss model rather than the incurred loss model provided for under IAS 39. The new model entails a significant degree of judgement about the impact of changes in economic factors on the expected credit losses, which are weighted by probability. IFRS 9 also introduced a new hedge accounting model aligned to the entity s risk management policies. The exemption from application of the fair value measurement to unlisted equity investments has been eliminated. The standard also requires new and more detailed disclosure about hedging accounting, credit risk and expected credit losses. The standard is applicable to annual reporting periods beginning on or after 1 January 2018 and shall be applied retrospectively, with the possibility to use some simplifications. ifrs 15 - Revenue from contracts with clients The IASB issued the new standard in May 2014 to unify in one standard the rules for revenue recognition previously included in several standards and interpretations (including IAS 18 - Revenue, IAS 11 - Contract work in progress and IFRIC 13 - Customer loyalty programmes). IFRS 15 provides that revenue is to be recognised using a five-step model as set out below: 345 Annual Report as at 31 December 2016
347 Separate financial statements as at and for the year ended 31 December identify the contract with a customer; 2. identify the performance obligations (distinct elements that are part of a single contract but are separated for accounting purposes) in the contract; 3. determine the transaction price; 4. allocate the transaction price to the performance obligations in the contract; 5. recognise revenue when (or as) the entity satisfies a performance obligation. IFRS 15 also covers contractual costs, contract modifications and financial statements disclosures. IFRS 15 is applicable to annual periods beginning on or after 1 January Early adoption is allowed. The original version of the standard was approved in September 2016 while some amendments published in the same year should be endorsed by the EU in ifrs 16 - Leases The IASB issued this standard in January It introduces a single method to account for leases in the financial statements of the lessee, eliminating the distinction between operating and finance leases, so that the lessee recognises an asset for the right to use an underlying asset and a lease liability. The standard includes exemptions when the lease term is 12 months or less or the underlying asset has a low value. IFRS 16 replaces the current standards on leases, including IAS 17 - Leases, IFRIC 4 - Determining whether an arrangement contains a lease, SIC 15 - Operating leases - Incentives and SIC 27 - Evaluating the substance of transactions in the legal form of a lease. IFRS 16 is applicable to annual periods beginning on or after 1 January Early application is permitted if IFRS 15 has also been applied. Endorsement by the EU is expected in Basis of presentation Separate financial statements The company opted to present its separate financial statements at 31 December 2016 as follows: Current and non-current assets and current and non-current liabilities are presented separately in the statement of financial position. Current assets and liabilities are those expected to be realised, sold, used or settled in the company s normal operating cycle, which usually exceeds 12 months. Noncurrent assets and liabilities include non-current assets, deferred tax assets, employee benefits, deferred tax liabilities and other balances expected to be 346 Annual Report as at 31 December 2016
348 Separate financial statements as at and for the year ended 31 December 2016 realised, sold, used or settled after the company s normal operating cycle, i.e., more than twelve months after the reporting date. The income statement gives a classification of costs by nature and shows the profit or loss before Financing income (costs) and gains (losses) on investments and income taxes. The statement of comprehensive income shows all non-owner changes in equity. The cash flow statement presents the cash flows from operating, investing and financing activities separately. The indirect method is used. Accounting policies The accounting policies adopted to draw up the company s separate financial statements at 31 December 2016 comply with the IFRS and are consistent with those used to prepare the 2015 separate financial statements, except for the standards enacted after 1 January 2016, summarised in the section on the Changes in standards. Property, plant and equipment Property, plant and equipment are recognised at purchase or production cost, net of accumulated depreciation and any impairment losses. Depreciation is calculated on a straight-line basis using rates determined based on the assets residual possible use. The annual rates are as follows: Category Depreciation rate Land - Buildings 3% Plant and machinery from 10% to 20% Industrial and commercial equipment from 25% to 40% Other assets from 12% to 25% Land and buildings, plant and machinery with a carrying amount to be recovered mainly through their sale (rather than the asset s continuing use) are measured at the lower of their carrying amount and fair value less costs to sell. Assets held for sale shall be available for immediate sale and their sale shall be highly probable (i.e., the related commitments already exist). Their price shall be reasonable compared to their fair value. The carrying amount of property, plant and equipment is tested for impairment whenever events or changes in circumstances take place indicating that the 347 Annual Report as at 31 December 2016
349 Separate financial statements as at and for the year ended 31 December 2016 carrying amount may not be recovered. Reference should be made to the section on Impairment of non-financial financial assets for details on impairment testing. Borrowing costs directly related to the acquisition or construction of an asset are capitalised as part of the cost of the asset, to the extent of its recoverable amount. As established by IAS 23 - Borrowing costs, the company has applied this method to all qualifying assets. Borrowing costs are capitalised when the costs of the acquisition of the asset and borrowing costs are incurred, and the activities necessary to bring the asset into a condition for its use have been started. The costs provided for but not yet paid related to qualifying assets are excluded from the amount to be capitalised. Capitalisation of borrowing costs is suspended during extended periods in which active development is interrupted. Subsequent expenditure is only capitalised if it increases the future economic benefits of the related asset. All other expenditure is expensed when incurred. Ordinary maintenance costs are fully expensed when incurred. Costs that increase the carrying amount of assets are allocated thereto and depreciated over their residual economic lives. Dismantlement and restoration costs of assets used for contract work in progress are added to the cost of the related asset and depreciated in line with the depreciation pattern of the asset to which they refer when they are foreseeable and objectively determinable. Leasehold improvements are classified in the different items of property, plant and equipment on the basis of their nature. They are depreciated over the shorter of the estimated useful life of the relevant asset and the residual term of the lease. Leased property, plant and equipment Assets held under finance leases whereby all the risks and rewards of ownership are substantially transferred to the company are recognised as company assets and classified as property, plant and equipment. The related liability to the lessor is shown under financial liabilities. The lease payment is split into the interest expense, taken to the income statement, and the principal repayment, offset against the financial liability. The carrying amount of the leased asset is determined considering its fair value or, if lower, the present value of the minimum future lease payments. 348 Annual Report as at 31 December 2016
350 Separate financial statements as at and for the year ended 31 December 2016 The depreciation method and subsequent measurement are consistent with those applied to non-leased assets. Leases where the lessor retains all the risks and rewards of ownership are treated as operating leases. The initial negotiation costs incurred for this type of lease increase the value of the related lease and are recognised over the lease term in order to match the revenue generated by the leased asset. Operating lease payments are recognised as an expense in the income statement on a straight-line basis over the lease term. other intangible assets Other intangible assets acquired or generated internally are recognised under assets in accordance with IAS 38 - Intangible assets when it is probable that the use of the asset will generate future economic benefits and the cost of the asset can be measured reliably. Those assets with finite useful lives are measured at acquisition or development cost and amortised on a straight-line basis over their estimated useful lives. Recoverability of their carrying amount is checked by using the criteria set out in the section on Impairment of nonfinancial assets. The excess of the purchase cost compared to the company s share of the net fair value of the high capacity business units acquired in the past is classified as intangible assets and mainly refers to acquisition costs of the business units purchased. The related amortisation is calculated in line with the stage of completion and duration of the work. Equity investments Investments in subsidiaries and associates and interests in joint ventures are measured at cost and tested regularly for impairment. This test is carried out whenever there is an indication that the investment may be impaired. The method used is described in the section on Impairment of non-financial assets. When an impairment loss is required, this is recognised immediately in profit or loss. When the reasons for a previous impairment loss no longer exist, the carrying amount of the investment is restated to the extent of its original cost. Reversals of impairment losses are recognised in profit or loss. impairment of non-financial assets If there is any indication that an intangible asset or an item of property, plant and equipment is impaired, the recoverable amount of the asset is estimated to determine the amount of the impairment loss. Goodwill and other intangible assets with an indefinite life are tested at least annually for impairment. The recoverable amount of an asset is the higher of its fair value less costs to sell and its value in use. 349 Annual Report as at 31 December 2016
351 Separate financial statements as at and for the year ended 31 December 2016 If a binding sales agreement does not exist, fair value is estimated using the observable prices of an active market, recent transactions or the best information available to reflect the amount the entity could obtain by disposing of the asset. Value in use is determined by discounting the estimated future cash flows expected to arise from the continuing use of an asset, net of taxes, and, if reasonably determinable, from its disposal at the end of its useful life. Discounting is applied by using a post-tax discount rate which reflects the current market assessments of the time value of money and the risks specific to the asset. The assessment is made for individual assets or the smallest identifiable group of assets that generates cash inflows that are largely independent of the cash inflows from other assets or groups of assets from its continuing use (cashgenerating unit). An impairment loss is recognised when the recoverable amount is lower than the carrying amount. If the reasons for the impairment loss are no longer valid, the impairment loss (except in the case of goodwill) is reversed and the adjustment is taken to profit or loss as a reversal of impairment losses. A reversal of impairment losses is recognised to the extent of the lower of the recoverable amount and original carrying amount less depreciation/amortisation that would have been recognised had the impairment loss not been recognised. inventories of goods Inventories of goods are measured at the lower of average purchase cost and net realisable value. Cost includes the directly related costs and estimated realisable value is determined using the replacement cost of the assets or similar assets. Any write-downs are eliminated in subsequent years when the reasons therefor are no longer valid. Contract work in progress and revenue from construction contracts Contract work in progress consists of work performed net of progress billings issued to clients. When final payment of the consideration is made, the related progress billings and advances are recognised under Operating revenue in the income statement, with the related variation in inventories. The provision for contractual risks directly offsets inventories and is set up to cover possible charges and losses on contracts performed either directly by the company or as part of a joint venture. Contract work in progress is measured considering the consideration agreed with the customer and the stage of completion of the work. Revenue related to contract work in progress is recognised using the stage of completion method. 350 Annual Report as at 31 December 2016
352 Separate financial statements as at and for the year ended 31 December 2016 The stage of completion is determined using the cost to cost method whereby the percentage of completion (the ratio between costs incurred and total estimated costs) is applied to the total estimated revenue. Given the technical complexity, size and length of time involved in completing contracts, the additional considerations are measured before an agreement is reached with the customer. Claims for additional considerations are considered when measuring contract work in progress if they have been substantially approved by the customer, or, if not yet approved by the customer, are supported by appraisals made by third party consultants and/or documentation prepared by contractual bodies (arbitration tribunals, Dispute Review Boards, Dispute Adjudication Boards, etc.). In the case of events that take place after the reporting date but before the separate financial statements are approved, which provide additional information about expected profits or losses on the contract, this additional information is considered when determining the contractual revenue or costs to be incurred to complete the contract and for the recognition of any profits or losses. When total contract costs exceed total contract revenue, the loss to complete the contract is recognised as an expense immediately. The contract costs, included in the cost to cost calculation, may be classified as: pre-operating costs, which include costs incurred during the start-up stage of the contract, before construction starts, such as the costs of design and specific studies carried out for the contract; organisation and production startup costs and building site start-up costs. These pre-operating costs are included in the stage of completion calculation and in the cost to cost calculation once they have been incurred. During the initial stage of the contract, they are included in the carrying amount of contract work in progress, if recoverable, without recognising any contract output when the contract profit or loss cannot be reliably estimated; contract operating costs, which include those directly attributable to the contract (e.g., materials, subcontracting, labour, amortisation and depreciation, compulsory purchases, any directly attributable borrowing costs, etc.). They are recognised on an accruals basis and included in the calculation of the stage of completion; post-operating costs, which include site dismantlement costs generally incurred after the contract has been closed to remove the installations (or entire sites) and to return the machinery or plant to the company s premises or transfer them to another site. This category also includes losses on materials no longer usable and the related transport costs. They are included in the contract estimate and, therefore, if incurred during the contract term, they are comprised in the calculation of the progress billings. Therefore, no specific accruals are made to the income statement; 351 Annual Report as at 31 December 2016
353 Separate financial statements as at and for the year ended 31 December 2016 costs for services to be rendered after completion of the contract, which mainly relate to services rendered after the contract has been completed. They may include assistance and supervision provided in the early stages of use of the plant or scheduled maintenance, etc.. If the contract does not include specific additional considerations for these services and the contract may be closed for accounting purposes (contracts are usually closed once work is completed and the customer has accepted the end result), the costs to be incurred to render these services when the contract is closed in the accounting records should be estimated and provided for in the specific items. These costs are included in the calculation to determine the contract revenue. Real estate projects Closing inventories of real estate projects are those real estate areas developed with a view to selling them. They are measured at the lower of cost and estimated realisable value. Costs incurred consist of the consideration paid for purchasing the areas and related charges, construction costs and borrowing costs related to the project up to and not exceeding its completion. Financial assets and liabilities Measurement and presentation of financial instruments are covered by IAS 39 and IAS 32, respectively. The company introduced the disclosure required by IFRS 7 in The financial instruments used by the company are classified as follows: financial assets or financial liabilities at fair value through profit or loss, loans and receivables, held-to-maturity investments and available-for-sale financial assets. Financial assets or financial liabilities at fair value through profit or loss This category includes derivatives that do not meet hedge accounting requirements. Fair value gains or losses on derivatives in this category are recognised as Financing income (costs) in profit or loss when they arise. Loans and receivables Loans and receivables are non-derivative financial assets with fixed or determinable payments that are not quoted on an active market. They are measured at amortised cost, as detailed further on, and any gains or losses arising therefrom are recognised as Financing income (costs) in profit or loss. This category includes the following items: 352 Annual Report as at 31 December 2016
354 Separate financial statements as at and for the year ended 31 December 2016 Trade receivables and payables and other assets and liabilities Trade receivables and other assets are recognised at amortised cost, net of impairment losses determined on the basis of their estimated recoverable amount calculated by analysing each position and the total non-collection risk. If the collection date is postponed and exceeds normal collection times for the sector, these receivables are discounted. All factored receivables that do not meet the requirements for derecognition under IAS 39 continue to be recognised in the company s separate financial statements even when they have been legally transferred. They are thus included as assets and a financial liability of the same amount is recognised. Trade payables and other liabilities are recognised at amortised cost, allocating interest to the income statement based on the effective interest rate, being the rate that exactly discounts estimated future cash payments through to the carrying amount of the related asset. Cash and cash equivalents Cash and cash equivalents comprise cash on hand, demand deposits and other short-term, highly liquid investments with a term of less than three months. This item is shown in the statement of cash flows net of bank borrowings at the reporting date. Loans and borrowings and bonds Loans and borrowings and bonds are initially recognised at cost, being the fair value of the consideration received less transaction costs. After initial recognition, loans are measured at amortised cost, whereby repayments are determined using the effective interest method with a rate which matches, at initial recognition, the expected cash flows with the initial carrying amount. Loan transaction costs are classified under liabilities decreasing the loan; amortised cost is calculated considering these costs and any discounts or premiums expected at settlement. The effects arising from the recognition at amortised cost are taken to Financing income (costs). Held-to-maturity investments Held-to-maturity investments are non-derivative financial assets with fixed or 353 Annual Report as at 31 December 2016
355 Separate financial statements as at and for the year ended 31 December 2016 determinable payments and fixed maturity that the company has the positive intention and ability to hold to maturity. They are recognised at amortised cost and interest accrued thereon is taken to profit or loss under Financial income using the effective interest method. Available-for-sale financial assets Available-for-sale financial assets are non-derivative financial instruments that are not classified in the other categories. They mainly relate to consortia and consortium companies of which the company holds less than 20%. In accordance with IAS 39, such investments are stated as non-current assets measured at cost, adjusted for impairment, since their fair value cannot be determined. Dividend income from such financial instruments is recognised in profit or loss under financial income when the company is given the right to such dividend. Fair value of financial instruments The fair value of financial instruments has been estimated as follows: The fair value of financial instruments traded on an active market is based on the market price at the reporting date. This method has been applied especially to listed financial instruments classified as Available-for-sale financial assets and financial instruments classified as Held-to-maturity investments. The fair value of the derivatives classified as Hedging derivatives and Financial assets and financial liabilities at fair value through profit or loss is measured using the Discounted Cash Flow Model. With respect to interest rate swaps, future cash flows are estimated using the implicit forward rate of the market Euro curve at 31 December 2016 and 2015, while the forward exchange rate market prices at the relevant reporting date are used for currency forward transactions. The fair value of loans and receivables is determined, for disclosure purposes in the notes, on the basis of the present value of their future cash flows discounted at a rate equal to the current interest rates applicable in the relevant markets and the average spread agreed by the company. Derecognition of financial assets and liabilities (a) Financial assets A financial asset (or, where applicable, part of a financial asset or parts of a group of similar financial assets) is derecognised when: I. the contractual rights to the cash flows from the financial asset expire; 354 Annual Report as at 31 December 2016
356 Separate financial statements as at and for the year ended 31 December 2016 II. the company retains the contractual rights to receive the cash flows of the financial asset, but assumes a contractual obligation to pay the cash flows to one or more recipients in full and immediately; III. the company transfers the contractual rights to receive the cash flows of the asset and has transferred substantially all the risks and rewards of ownership of the financial asset and the related control. When the company has transferred the contractual rights to receive the cash flows of the financial asset and has neither transferred nor retained substantially all the risks and rewards or has retained control, it continues to recognise the asset to the extent of its continuing involvement in the asset. Continuing involvement that takes the form of guaranteeing the transferred asset is measured at the lower of the initial carrying amount of the asset and the maximum amount of the consideration that the company could be required to pay. (b) Financial liabilities Financial liabilities are derecognised when the underlying obligation is extinguished, cancelled or settled. When an existing financial liability is exchanged with another by the same lender at substantially different terms, or the terms of an existing liability are substantially modified, this exchange or modification is treated as an extinguishment of the original financial liability and the recognition of a new financial liability. The difference between the carrying amounts is recognised in profit or loss. impairment of financial assets If there is any indication that a financial asset is impaired, the recoverable amount of the asset is estimated to determine the amount of the impairment loss. Derivatives and hedging transactions The company has derivatives recognised at fair value when the related agreement is signed and for subsequent fair value changes. The treatment of the related fair value gains or losses changes depending on whether the conditions for hedge accounting are met, as described below. The company has derivatives to hedge currency and financial risks. At the inception of the transaction, it documents the hedging relationship, its risk management and strategy objectives in entering into the transaction, the hedging instrument and hedged item or transaction and the nature of the hedged risk. Moreover, at the inception of the transaction, and thereafter on an 355 Annual Report as at 31 December 2016
357 Separate financial statements as at and for the year ended 31 December 2016 ongoing basis, the company documents whether or not the hedge meets the effectiveness requirements to offset its exposure to changes in the fair value of the hedged item or cash flows attributable to the hedged risk. Based on the above-mentioned documentation, derivatives used for specific hedging purposes are classified and recognised as follows: (a) Fair value hedge - If a derivative is designated as a hedge of exposure to changes in the fair value of an asset or liability due to a specific risk that may affect profit or loss, the gain or loss deriving from the subsequent measurement of the fair value of the hedging instrument is recognised in profit or loss. The gain or loss on the hedged item, related to the hedged risk, changes the carrying amount of this item and is recognised in profit or loss. (b) Cash flow hedge - If a derivative is designated as a hedge of exposure to changes in cash flows of an asset or liability or a highly probable transaction that could affect profit or loss, the effective part of the gains or losses on the financial instrument is recognised in equity. The cumulative gain or loss is reclassified from equity to profit or loss in the same period in which the hedged transaction is recognised. The gain or loss related to a hedge or part of a hedge which has become ineffective is taken to profit or loss immediately. If a hedging instrument or a hedging relationship is closed, but the hedged transaction has not yet taken place, the cumulative gains and losses, recognised in equity up to then, are reclassified to profit or loss when the transaction takes place. If it is unlikely the hedged transaction will take place, the unrealised gains and losses recognised in equity are immediately reclassified to profit or loss. Hedging purposes are assessed in strategic terms. When they do not meet the requirements of IAS 39 for hedge accounting, the derivatives are classified as Financial assets or financial liabilities at fair value through profit or loss. Employee benefits Post-employment benefits Post-employment benefits are recognised at the present value of the company s liability determined in line with ruling legislation and national and in-house labour agreements. The valuation, based on demographic, financial and turnover assumptions, is carried out by independent actuaries. The gains and losses resulting from the actuarial calculation are recognised in profit or loss if related to service costs and interest expense or in comprehensive income if relating to assets and liabilities. The 2007 Finance Act and related implementing decrees introduced significant changes to legislation governing Italian post-employment benefits, effective as from 1 January These include the option given to employees, to be exercised before 30 June 2007, of where to allocate their future benefits. Specifically, employees can opt to allocate them to selected pension funds or 356 Annual Report as at 31 December 2016
358 Separate financial statements as at and for the year ended 31 December 2016 maintain them with the company, in which case, the latter shall pay the contributions to the treasury fund of INPS (the Italian social security institution). Following these changes, the Italian post-employment benefits accruing after the date of the employees decision and, in any case, after 30 June 2007, are considered part of a defined contribution plan and treated like all other social security contributions. Share-based payments The company has adhered to the guidelines of IFRS 2 - Share-based payments. Share-based payments are measured at fair value of the option at the grant date. This amount is recognised in the income statement on a straight-line basis over the vesting period. This treatment is based on an assessment of the stock options that will effectively vest in favour of the qualifying employees. Fair value is determined using the share price at the grant date. income taxes Current taxes are provided for using the enacted tax rates and laws ruling in Italy and other countries in which the company operates, including through its branches, based on the best estimate of the taxable profit for the year. Beginning from 2004, the company has joined the national tax consolidation system, as the consolidating party, which is regulated by the conditions set out in agreements drawn up by the participating companies. The agreements provide that tax losses transferred by the subsidiaries give rise to a benefit for them to the extent to which they would have been able to offset them even if the national tax consolidation system had not existed. Otherwise, the parent benefits, except for a partial payment to the companies transferring the losses, in proportion to the effective use in the national tax consolidation system. Moreover, the smaller taxes paid by Salini Impregilo as a result of its participation in the national tax consolidation system are prudently provided for when it is probable that a benefit for the used tax losses will be paid in the future to the subsidiaries that transferred them. Deferred tax assets and liabilities are calculated on the basis of the temporary differences between the tax base of an asset or liability and its carrying amount. Deferred tax assets are recognised when the company holds their recovery to be probable. The carrying amount of deferred tax assets is reviewed at each reporting date and, to the extent necessary, is decreased when it is no longer probable that sufficient taxable profits will be available in the future to use all or part of the related benefit. 357 Annual Report as at 31 December 2016
359 Separate financial statements as at and for the year ended 31 December 2016 Deferred tax assets and liabilities are measured at the tax rates that are expected to apply in the year when the asset is realised or the liability is settled, based on tax rates that have been enacted or substantially enacted at the reporting date. Deferred tax assets and liabilities are classified as non-current assets and liabilities, respectively. In the case of transactions recognised directly in equity, the related deferred tax asset or liability also affects equity. Provisions for risks and charges In accordance with IAS 37, the company makes accruals to provisions for risks and charges when the following conditions exist: the company has a present obligation (legal or constructive) at the reporting date as a result of a past event where an outflow of resources embodying economic benefits will be required to settle the obligation; it is probable that the obligation (through an outflow of resources) will have to be settled; a reliable estimate can be made of the amount of the obligation. When the time value is material and the obligation payment dates can be estimated reliably, the amount recognised as the provision equals the pre-tax future cash flows (i.e., forecast outflows) discounted at a rate that reflects the present market value and risks specific to the liability. The increase in the provision due to discounting is recognised as a financial expense. When the expected cash flows are included in an estimate range with the same probability of occurrence, the median value is discounted to measure the liability. Provision for restructuring costs is recognised when the company has approved a detailed formal plan that has been implemented and communicated to the third parties involved. Translation criteria for foreign currency items The translation criteria for foreign currency items adopted by the company are as follows: foreign currency monetary assets and liabilities, excluding property, plant and equipment, intangible assets and equity investments measured at cost, are translated at the closing spot rate with any exchange rate gains or losses taken to the income statement; 358 Annual Report as at 31 December 2016
360 Separate financial statements as at and for the year ended 31 December 2016 property, plant and equipment, intangible assets and equity investments (nonmonetary assets) are recognised at historical cost denominated in the foreign currency and translated using the historical exchange rate; revenue and costs related to foreign currency transactions are recognised in profit or loss at the exchange rate ruling on the date of the transaction; any material effects deriving from changes in exchange rates after the reporting date are disclosed in the notes. The foreign branches functional currency is the Euro, as it is the primary currency they use in their operations. Non-current assets held for sale and discontinued operations Non-current assets (and disposal groups) are classified as held for sale if their carrying amount will be recovered through a sale transaction rather than through continuing use. Assets held for sale are recognised as such when the following events take place: signing of a binding sales agreement; approval and communication of a formal sales plan by directors. In order to be correctly measured, the assets shall be: available for immediate sale in their present condition, subject only to terms that are usual and customary for sales of such assets, and the sale must be highly probable and expected to take place within twelve months. Non-current assets (and disposal groups) classified as held for sale are measured at the lower of their previous carrying amount and fair value less costs to sell. A discontinued operation is a component of an entity that either has been disposed of or classified as held for sale and that meets any of the following criteria: i) it represents a separate major line of business or geographical area of operations; ii) it is part of a single coordinated plan to dispose of a separate major line of business or geographical area of operations; or iii) it is a subsidiary acquired exclusively with a plan to resell. The profit or loss from discontinued operations is disclosed separately in the income statement. As required by paragraph 34 of IFRS 5 - Non-current assets 359 Annual Report as at 31 December 2016
361 Separate financial statements as at and for the year ended 31 December 2016 held for sale and discontinued operations, the corresponding prior year figures are reclassified accordingly. Revenue recognition Revenue is measured to the extent it is probable that the economic benefits will flow to the company and the related amount can be determined reliably. Revenue from the sale of goods is recognised when the company has shipped the goods and has transferred all the material risks and rewards of ownership to the buyer. Revenue from construction contracts is recognised as provided for in the related Standard, described below. When the outcome of a construction contract can be estimated reliably, contract revenue is recognised by reference to the stage of completion of the contract activity at the reporting date based on the ratio of the costs incurred up to the reporting date to the total estimated contract costs, unless this is held to not represent the stage of completion of the contract. Changes in the contract and price revisions are recognised to the extent that they are reasonably certain. Revenue is recognised only to the extent of contract costs incurred that it is probable will be recovered. Contract costs are recognised as an expense in the year in which they are incurred. interest income Interest income is recognised on an accruals basis, considering the principal and applicable effective interest rate, i.e., the rate that discounts the estimated future inflows over the expected life of the financial asset to return it to its carrying amount. Dividends Dividends are recognised when the investors right to receive payment arises in line with local ruling legislation. Significant accounting estimates Preparation of financial statements and the related notes in accordance with the IFRS requires management to make judgements and estimates that affect the carrying amount of assets and liabilities and financial statements disclosures. The estimates are used to: determine amortisation and depreciation (see the Property, plant and machinery, Leased property, plant and equipment, and Other intangible assets paragraphs of the Accounting policies section); 360 Annual Report as at 31 December 2016
362 Separate financial statements as at and for the year ended 31 December 2016 recognise impairment losses (see the Impairment of non-financial assets paragraph of the Accounting policies section); recognise employee benefits (see the Employee benefits paragraph of the Accounting policies section); recognise taxes (see the Income taxes paragraph of the Accounting policies section); recognise provisions for risks and charges (see the Provisions for risks and charges paragraph of the Accounting policies section); determine total contract costs and the related stage of completion (see the Contract work in progress and revenue from construction contracts paragraph of the Accounting policies section). A significant part of the company s activities is typically performed on the basis of contracts which provide that a specific consideration is agreed when the contract is awarded. This implies that the profits on these contracts may undergo change compared to the original estimates depending on the recoverability of greater expenses and/or costs the company may incur during performance of such contracts. The actual results may differ from those estimated due to uncertainties underlying the assumptions and the conditions on which the estimates are based. Fundamental assumptions about the future and other reasons for uncertainty when making the estimates at the reporting date that may lead to material adjustments to the carrying amount of the assets and liabilities are described in the specific section of the Directors report which gives an analysis of the risk areas of each segment. Changes in the scope of the separate financial statements Joint operations The company is involved in the following main joint operations: CMC - Mavundla - Impregilo (South Africa), Civil Work Group (Saudi Arabia), Arge Tulfes Pfons (Austria) and South Al Mutlaa (Kuwait). Salini Impregilo S.p.A. has a 39.2% interest in the first joint operation, which is engaged in works for the hydroelectric plant in Ingula. It has a 52% interest in the second joint operation, which is engaged in the civil works for the Riyadh metro. The third joint operation is 49% held by the company and is engaged in the construction of the last section of the Brenner-Innsbruck tunnel. The fourth was incorporated during the year and is 55% held by Salini Impregilo S.p.A.. It will construct primary urbanisation works to build a new residential area in a 12 thousand hectares site located 40 km northwest of Kuwait City as part of the South Al Mutlaa Housing Project. 361 Annual Report as at 31 December 2016
363 Separate financial statements as at and for the year ended 31 December 2016 The above operations are governed by joint control arrangements as resolutions of the governing bodies require a unanimous vote. They are structured as separate vehicles, guaranteeing transparency of their rights and obligations with respect to Salini Impregilo S.p.A.. As per the previously-signed agreements with the Saudi partner, Salini Impregilo transferred 14% of Civil Work Group to its subsidiary Salini Saudi Arabia Ltd. Co. (SSA) on 30 November 2016 (in which it has a 51% stake). As a result, it now holds 52% of the joint operation instead of the previously-held 66%. 362 Annual Report as at 31 December 2016
364 Separate financial statements as at and for the year ended 31 December income statement by geographical segment ( 000) Italy Abroad Total Revenue 359,576 2,614,572 2,974,148 Other income 28,167 74, ,512 Total revenue 387,743 2,688,917 3,076, income statement by geographical segment ( 000) Italy Abroad Total Revenue 445,524 2,467,893 2,913,417 Other income 51,721 62, ,771 Total revenue 497,245 2,529,943 3,027,188 Statement of financial position as at 31 December 2016 by geographical segment ( 000) Italy Abroad Total Net non-current assets 500, ,780 1,432,783 Provision for risks (65,177) (6,899) (72,076) Post-employment benefits and employee benefits (8,675) (4,127) (12,802) Net tax assets (liabilities) 132,908 (23,999) 108,909 Working capital 119, , ,336 Net invested capital 678,383 1,160,766 1,839,149 Equity 1,007,428 Net financial position 831,721 Total financial resources 1,839,149 Statement of financial position as at 31 December 2015 by geographical segment ( 000) Italy Abroad Total Net non-current assets 845, ,227 1,086,621 Provision for risks (18,267) (11,617) (29,884) Post-employment benefits and employee benefits (9,211) (2,879) (12,090) Net tax assets (liabilities) 88,347 (27,849) 60,498 Working capital 1,010,337 (651,777) 358,560 Net invested capital 1,916,600 (452,895) 1,463,705 Equity 937,362 Net financial position 526,343 Total financial resources 1,463, Annual Report as at 31 December 2016
365 Separate financial statements as at and for the year ended 31 December 2016 Statement of financial position 4. Property, plant and equipment Property, plant and equipment amount to million, down from the 31 December 2015 figure by 65.6 million. Their historical cost and carrying amount are given in the following table: 31 December December 2015 Cost Acc. Carrying Cost Acc. Carrying ( 000) depreciation amount depreciation amount Land Buildings 45,490 (23,975) 21,516 44,987 (21,075) 23,912 Plant and machinery 571,608 (397,141) 174, ,532 (329,904) 241,628 Industrial and commercial equipment 81,228 (76,083) 5,146 80,154 (70,719) 9,435 Other assets 21,186 (14,711) 6,476 20,212 (12,794) 7,418 Assets under const. and payments on account 15,547-15,547 6,318-6,318 Total 735,303 (511,909) 223, ,447 (434,492) 288,955 Changes during the year are summarised below: 31 December Increases Deprec. Imp. Reclass. Disposals Exchange Change in 31 December 2015 losses/ and other rate gains scope 2016 Reversals changes (losses) of imp. ( 000) losses Land (1) Buildings 23,912 1,437 (3,426) - - (134) 72 (345) 21,516 Plant and machinery 241,628 52,990 (89,084) (29,035) 279 (2,521) 174,466 Industrial and commercial equipment 9,435 3,026 (6,843) - 10 (482) (1) - 5,146 Other assets 7,418 1,824 (2,458) - (43) (67) 28 (225) 6,476 Assets under const. and payments on account 6,318 10, (176) (193) 101 (690) 15,547 Total 288,955 69,464 (101,811) - - (29,912) 479 (3,781) 223,394 The most significant changes include: increases of roughly 69.5 million, mainly relating to the Civil Work project in the United Arab Emirates, the Lima Metro 2 project in Chile and, especially, the Koysha project in Ethiopia; depreciation for the year of million, calculated as described in the Accounting policies section; disposals of 29.9 million, mainly referring to sales to third parties and the disposal of assets related to Italian contracts; the negative balance of 3.8 million in the Change in scope column relates to the sale to Salini Saudi Arabia Ltd. of 14% in the joint operation set up for the Riyadh Metro Line 3 contract in Saudi Arabia, as discussed in the Joint operations section of Note Annual Report as at 31 December 2016
366 Separate financial statements as at and for the year ended 31 December 2016 The closing balance at 31 December 2016 includes leased assets of 92.5 million recognised under Plant and machinery ( 91.2 million), Industrial and commercial equipment ( 1.2 million) and Other assets ( 0.1 million). Prior year changes are as follows: 31 December Increases Deprec. Imp. Reclass. Disposals Exchange Change in 31 December 2014 losses/ and other rate gains scope 2015 Reversals changes (losses) of imp. ( 000) losses Land (1) Buildings 20,267 5,150 (3,130) - (407) (80) 1, ,912 Plant and machinery 223,913 93,476 (79,204) (157) 4,962 (3,809) 316 2, ,628 Industrial and commercial equipment 13,933 9,758 (9,891) - (4,455) ,435 Other assets 6,859 2,706 (2,456) (1) (100) (186) ,418 Assets under const. and payments on account 3,588 2, ,318 Total 268, ,098 (94,681) (158) - (3,988) 2,088 3, , Intangible assets Intangible assets amount to 79.5 million, down 38.5 million from the 31 December 2015 figure. The historical cost and carrying amount of the other intangible assets are given in the following table: 31 December December 2015 Cost Acc. Carrying Cost Acc. Carrying ( 000) amortisation amount amortisation amount Software 1,454 (526) (193) 490 Contract acquisition costs 149,261 (70,645) 78, ,657 (57,082) 117,575 Total 150,715 (71,171) 79, ,340 (57,275) 118,065 Changes during the year are set out below: 31 December Increases Amortis. Reclass. Disposals Exchange Other 31 December 2015 rate gains changes 2016 ( 000) (losses) Software (333) Contract acquisition costs 117,575 - (22,706) - (16,253) ,616 Total 118, (23,039) - (16,253) ,544 Changes during the previous year are set out below: 31 December Increases Amortis. Reclass. Disposals. Exchange Other 31 December 2014 rate gains changes 2015 ( 000) (losses) Software (47) - - (1) Contract acquisition costs 83,743 51,258 (17,426) ,575 Total 84,059 51,480 (17,473) - - (1) - 118, Annual Report as at 31 December 2016
367 Separate financial statements as at and for the year ended 31 December 2016 Contract acquisition costs amount to 78.6 million and refer to considerations paid in previous years to purchase the railway high speed/capacity business units and stakes in projects/contracts representing intangible assets with a finite useful life, which are amortised in line with the stage of completion of the related contracts. A breakdown of and changes in this item are as follows: ( 000) 31 December Decreases Amortisation 31 December Cociv (Milan - Genoa railway section) 38,251 - (3,132) 35,119 Riyadh Metro (Saudi Arabia) 56,551 (16,253) (16,493) 23,805 Thessalonica Metro 1,130 - (501) 629 Yarull - Dom. Republic 3,037 - (32) 3,005 Vegas Tunnel - USA (123) - Gerald Desmond Bridge - USA 5,263 - (1,715) 3,548 Stavros Niarchos - Greece (710) - Iricav 2 (Verona - Padua railway section) 12, ,510 Total 117,575 (16,253) (22,706) 78,616 The decrease for the year is due to the sale to the group company Salini Saudi Arabia Ltd. of 14% in the joint operation set up for the Riyadh Metro Line 3 contract in Saudi Arabia, as discussed in the Joint operations section of Note 3. There are no indicators of impairment for the contracts to which the acquisition costs refer. Amortisation of the contract acquisition costs is calculated using the stage of completion method of the contracts based on the cost to cost method and considering the related purchase dates. With respect to the Verona - Padua section, amortisation of the acquisition cost will commence when work starts. Prior year changes are given below for comparative purposes: ( 000) 31 December Increases Amortisation 31 December Cociv (Milan - Genoa railway section) 41,847 - (3,596) 38,251 Riyadh Metro (Saudi Arabia) 25,394 38,748 (7,591) 56,551 Thessalonica Metro 1,202 - (72) 1,130 Yarull - Dom. Republic 3,083 - (46) 3,037 Vegas Tunnel - USA 1,875 - (1,752) 123 Gerald Desmond Bridge - USA 7,234 - (1,971) 5,263 Stavros Niarchos - Greece 3,108 - (2,398) 710 Iricav 2 (Verona - Padua railway section) - 12,510-12,510 Total 83,743 51,258 (17,426) 117, Annual Report as at 31 December 2016
368 Separate financial statements as at and for the year ended 31 December Equity investments Equity investments increased by million to 1,129.8 million. ( 000) 31 December December 2015 Variation Investments in subsidiaries 978, , ,332 Investments in associates 101,458 75,365 26,093 Other investments 50,115 48,294 1,821 Total 1,129, , ,246 Changes during the year are summarised below: ( 000) 31 December December 2015 Capital transactions 84,554 92,601 Acquisitions and capital injections 468,771 9,121 Disinvestments and liquidations (53,102) (441) Impairment losses (35,682) (127,443) Net exchange rate gains 9,095 19,554 Reclassifications (23,390) (16,419) Total 450,246 (23,027) The increase in Capital transactions mainly refers to Salini Saudi Arabia ( 29.9 million), the SPE M4 ( 3.5 million), the Colombian company ICT II ( 9.9 million) and the SPE Grupo Unidos por el Canal (Panama) ( 44.7 million). The latter comprises the payments made during the year, net of the provision for the investment in Grupo Unido por el Canal. Acquisitions and capital injections relate to the capital injection made to Salini Impregilo US Holding ( million) for the acquisition of control over Lane Group. Reference should be made to the Business combinations section of the consolidated financial statements for further details. Disinvestments and liquidations mainly relates to the intragroup sale of the US company Healy SA for 39.9 million, which was sold to Lane Group. Reclassifications principally refer to offsetting of the provision related to certain investees presented under liabilities. Impairment losses mainly relate to the investments in Grupo Unidos Por El Canal S.A. GUPC ( 25.5 million), Grupo ICT II ( 2.2 million) and PGH ( 1.8 million). 367 Annual Report as at 31 December 2016
369 Separate financial statements as at and for the year ended 31 December 2016 The impairment test of the item Equity investments, carried out also to assess the need for any reversals of previously recognised impairment losses, has been performed on an individual basis, considering each investee s specific operating objectives. Based on such approach, the item can be analysed as follows: ( 000) 31 December December 2015 Variation Investments in SPEs 265, ,505 18,861 Other investments 864, , ,385 Total 1,129, , ,246 Special purpose entities (SPEs) are legal entities set up specifically and solely to carry out construction contracts that Salini Impregilo is not expected to carry out directly and in which it has an interest equal to its share of the tender. These entities have a corporate structure compliant with the clients requirements as communicated during the tender procedure and considering the specific legal context of the country in which the contract will be performed. They are classified depending on whether they are: (i) SPEs, the profit or loss of which are allocated to their venturers in line with their interests as provided for by law (i.e., Italian-based consortia and consortium companies which operate on a recharges of costs basis), and (ii) other SPEs for which this allocation is not provided for by law. Due to the periodic allocation of the contract profit or loss to the venturers, the SPEs in item (i) always substantially reach breakeven point. Any losses recorded in the contracts performed by these entities are recognised by the venturers upon allocation of the contract profits and losses. For the SPEs in item (ii), the existence of any losses should be considered in the separate financial statements of Salini Impregilo S.p.A. as their contract profit or loss is included in the consolidated financial statements only. The contracts performed by these SPEs are therefore considered when testing the company s investment for impairment. Specifically, the SPEs financial statements, which include the estimated contract profit or loss and are prepared in accordance with the IFRS as interpreted by the Company s accounting policies, are considered as they show the entity s estimated cash flows. The impairment losses recognised in 2016 in the provision for risks on equity investments adjusted the existing provisions by a modest amount and referred 368 Annual Report as at 31 December 2016
370 Separate financial statements as at and for the year ended 31 December 2016 to the SPEs performing the Grupo Unidos por el Canal contract ( 25.5 million), Metro 6 Ltda (Chile) contract ( 17.6 million) and the works on the Rio Sogamosa hydroelectric plant in Colombia ( 2.2 million). The company completed the sale of Todini Costruzioni Generali to Prime System Kz Ltd., set up and organised under Kazakstani law, for about 51 million on 4 April In March 2016, before the sale, Todini Costruzioni Generali s assets not sold to third parties were transferred to a newco HCE Costruzioni S.p.A. ( HCE ), which was subsequently sold to Salini Impregilo. The assets and liabilities, contributed to HCE, related to the Italian contracts, completed and/or ongoing, the branches in Albania, Argentina, Romania, Tunisia, Algeria, Greece, Dubai, Ukraine and Poland. An independent third party (Ms. Simona Ardiuni) appraised these assets and liabilities at 31 December 2015 and estimated their value to be not less than 2.2 million, using the simple equity method with an income adjustment. An impairment loss of 28.5 million on the investment in the new subsidiary HCE Construction S.p.A. was recognised in It includes the subsidiary s 2016 loss. Fisia Italimpianti recorded a loss for the year of 3.8 million and equity of the same amount, while the investment s carrying amount is 40.2 million. Its order backlog at the reporting date amounted to 84 million. The company tested its investment in Fisia Italimpianti for impairment on the basis of the business plan (the Plan ) approved by the subsidiary s board of directors assisted by independent experts that performed an independent business review. No indicators of impairment were found. Salini Impregilo used the unlevered version of the discounted cash flow method to calculate the investment s value in use. The main valuation parameters used were: Long-term growth rate: 0% (0% in 2015); Discount rate (WACC): 11.5% (10.9% in 2015). The company also performed sensitivity analyses considering the possible effect of changes in the discount rate (+/-0.5%). It did not identify any elements that would have required recognition of an impairment loss. The directors adopted the following assumptions in the business plan, used to extrapolate the expected future cash flows assumed for impairment testing purposes: 369 Annual Report as at 31 December 2016
371 Separate financial statements as at and for the year ended 31 December 2016 assumption about development of demand for projects: the subsidiary s main market is the Middle East, where investments are expected to pick up after the strong contraction seen in recent years. Oil prices drive the local economy and the recent reversal in these prices should facilitate an upturn in business; new technologies: the subsidiary plans to expand its offer to include new types of plant for thermal desalination compared to its traditional products. During the year, Fisia Italimpianti participated in important calls to tender for reverse osomis desalination and water treatment projects, including the tender awarded for the Atakoy water treatment plant in Turkey; assumptions about new projects: in line with Borsa Italiana s guidelines for the listing of construction companies, the revenue expected to be earned over the plan period is calculated considering each commercial project (based on the tender (if called), production capacity or similar plants), weighted by the entity s capacity to win the tender determined on the base of: i) the probability that a tender will be called; ii) the probability that the entity will win the tender based on its skill set; iii) another prudent parameter applied by management especially to the contracts planned for the last years of the plan. It cannot be excluded that events may take place in the future that cannot currently be foreseen and that would require changes to the valuations made. SGF Inc. recorded a loss of 4.9 million for 2016 and a deficit of 0.9 million, while the investment s carrying amount is 13.3 million. Since the company recognised an impairment loss on this subsidiary of 13.3 million, its carrying amount was zeroed. Fibe recorded a substantial break even result for 2016 and equity substantially in line with its carrying amount. Given that the subsidiary is inactive and only manages the outstanding disputes related to the USW Campania projects, its assets and liabilities are the main drivers of the value generation process. Accordingly, its carrying amount is in line with its equity at the reporting date. Salini Impregilo US Holding INC recorded a loss of 6.5 million for 2016 and equity of 442 million, while the investment s carrying amount is million. The investment s recoverable amount has been calculated using the cash flow projections set out in the three-year plan prepared and approved by management. The main valuation parameters used were: long-term growth rate of zero on a prudent basis; post-tax discount rate: 7.5%. 370 Annual Report as at 31 December 2016
372 Separate financial statements as at and for the year ended 31 December 2016 The company has adopted the discount rate calculated based on the market cost of money and the asset sector s specific risk (Weighted Avarage Cost of Capital, WACC). Specifically, the company considered the return rate on longterm government bonds and the average capital structure of a basket of comparable companies. The CGU s recoverable amount has been calculated using the cash flow projections set out in the three-year plan prepared and approved by management. The terminal value is based on a sustainable profit assumption, from which stable long-term operating cash flows have been estimated, on a going concern basis. The company tested goodwill for impairment at the reporting date, which showed that the CGU s recoverable amount exceeds its carrying amount (net invested capital) by 50%. Moreover, given the materiality of the above difference, a possible reasonable change in the assumptions described above adopted in the calculation of the recoverable amount (a 0.5% increase or decrease in the growth rate and in the discount rate, respectively), would not lead to a significantly different outcome. The impairment test showed that there was no need to recognise an impairment loss. Impregilo International Infrastructures NV recorded equity of million at the reporting date, while the investment s carrying amount is 170 million. It did not show any indicators of impairment. As regards the other investments in smaller companies, their carrying amount has been adjusted to Salini Impregilo s share of the investees net assets as recognised in their financial statements at 31 December These impairment losses, totalling 31.7 million, specifically affected Salini Australia PTY ( 12.1 million) and Impregilo Arabia Ltd ( 6.6 million). 7. Non-current financial assets This item may be broken down as follows: ( 000) 31 December December 2015 Variation Other financial assets 15,848 17,412 (1,564) Loans and receivables - third parties 3, ,734 Total 19,800 17,630 2, Annual Report as at 31 December 2016
373 Separate financial statements as at and for the year ended 31 December 2016 The other financial assets decreased by 1.5 million to 15.8 million at the reporting date. They are made up of unlisted guaranteed-return securities which mature after one year. They comprise units in the fund financing Yuma. The decrease is a result of fair value and exchange rate losses. Loans and receivables - third parties increased by 3.7 million from 0.2 million at 31 December 2015, mainly due to the amount due from Prime System KZ Ltd for its purchase of Todini. 8. Deferred tax assets and liabilities Deferred tax assets and liabilities amount to 38.9 million and 24.2 million, respectively. ( 000) 31 December December 2015 Variation Deferred tax assets 38,892 35,760 3,132 Deferred tax liabilities (24,152) (34,570) 10,418 Deferred tax liabilities of 24.2 million include 23.7 million relating to the national tax consolidation scheme. The provision represents the company s potential liability with its subsidiaries that have transferred their losses as part of the IRES national tax consolidation scheme as per article 117 and subsequent articles of the Consolidated Income Tax Act as per the regulations signed when they joined the scheme. 372 Annual Report as at 31 December 2016
374 Separate financial statements as at and for the year ended 31 December 2016 Changes in deferred tax assets and liabilities are set out below: 31 December Increases Decreases Change in Reclassif. Other 31 December ( 000) 2015 tax rate 2016 Deferred tax assets 199,197 25,150 (6,569) - - (9,492) 208,286 Offsetting (163,437) (5,957) (169,394) Net deferred tax assets 35,760 25,150 (6,569) - - (15,449) 38,892 Deferred tax liabilities (excluding those arising from the national tax consolidation scheme) (174,542) (15,599) 1, ,671 (169,833) Offsetting 163, , ,394 Net deferred tax liabilities (11,105) (15,599) 1, ,628 (439) Deferred tax assets and liabilities are classified as non-current assets and liabilities, respectively, and are netted when this is allowed. Changes in 2015 were as follows: 31 December Increases Decreases Change in Reclassif. Other 31 December ( 000) 2014 tax rate 2015 Deferred tax assets 132, ,748 (76,565) (5,856) 2, ,197 Offsetting (75,077) (621) (88,360) (163,437) Net deferred tax assets 57, ,369 (76,565) (5,856) 1,645 (88,360) 35,760 Deferred tax liabilities (75,347) (148,108) 48,237 2,330 (1,654) - (174,542) Offsetting 75, , ,437 Net deferred tax liabilities (270) (148,108) 48,237 2,330 (1,654) 88,360 (11,105) 9. Inventories This item is analysed in the following table: 31 December December 2015 Gross Allowance Carrying Gross Allowance Carrying Variation ( 000) amount amount amount amount Real estate projects 19,334 (7,772) 11,562 19,334 (7,772) 11,562 - Finished products and goods Raw materials, consumables and supplies 170,845 (2,192) 168, ,297 (627) 186,670 (18,017) Total 190,774 (9,964) 180, ,654 (8,399) 198,255 (17,445) 373 Annual Report as at 31 December 2016
375 Separate financial statements as at and for the year ended 31 December 2016 Real estate projects Real estate projects amount to 11.6 million. They relate to the real estate project (net of the related allowance of 7.8 million) for the construction of a trade point in Lombardy for which a dispute is pending about the zoning provisions of the area on which the property stands. Based also on its legal advisors opinion, the company deems that the carrying amount can be recovered through the real estate project or, alternatively, through recognition of the damage incurred due to nonauthorisation of the zoning of the area by the competent authorities. Finished products and goods and Raw materials, consumables and supplies These captions of million (31 December 2015: million) mainly comprise goods to be used at foreign work sites, principally in Ethiopia ( million), Sierra Leone ( 6.8 million), Venezuela ( 17.6 million) and Saudi Arabia ( 7.2 million for the Riyadh Metro Line 3). 10. Contract work in progress Contract work in progress amounts to 1,010.2 million at year end, up on the previous year-end figure of million. The following table shows contract work in progress calculated using the stage of completion method, net of losses realised or estimated at the reporting date and progress billings: ( 000) 31 December December 2015 Variation Contract work in progress 20,751,283 19,507,918 1,243,365 Progress payments and advances received (on approved work) (19,741,092) (18,569,061) (1,172,031) Total 1,010, ,857 71,334 The item shows a total increase of 71.3 million over 31 December This increase mainly refers to continuation of the industrial activities for the contracts in Tajikistan for the construction of a hydroelectric power plant, in Kuwait for urbanisation works, the Venezuelan and Romanian branches and the high speed/capacity contracts in Italy. It is partly offset by the decrease related to works in Ethiopia. 374 Annual Report as at 31 December 2016
376 Separate financial statements as at and for the year ended 31 December 2016 The key contracts making up contract work in progress at year end are summarised below: Contract work in progress 31 December December 2015 Variation ( 000) High speed/capacity 187, ,547 38,372 Arabia Civil Work 21,307 35,289 (13,982) Etiopia Gerd (Mill. Hydro) 4,113 49,481 (45,368) Etiopia Gibe III 111,131 99,619 11,512 Etiopia Koysha - 14,932 (14,932) Kuwait Al Mutlaa 18,941-18,941 Metro B1 Bologna/Conca d Oro and Conca d Oro/Ionio 63,087 61,967 1,120 Messina Bridge 24,506 23, Romania 102,556 75,739 26,817 Highway 36 23,657 23, Salerno - Reggio Calabria Lots ,311 35, South Africa Mavundla - 46,237 (46,237) Tajikistan 30,133-30,133 Venezuela 270, ,285 18,743 Other 117,502 72,511 44,991 Total 1,010, ,857 71,334 The section on the Performance by geographical segment in the Directors report provides more details about the contracts and the progress made on the main contracts. A description of the contracts for which the company has pending disputes and the activities in Libya, Venezuela, Nigeria, Turkey and Ukraine is provided in the section on the Main risk factors and uncertainties in the Directors report. 11. Trade receivables Trade receivables amount to 1,714.8 million (31 December 2015: 1,044.9 million), of which million (31 December 2015: million) from group companies and other related parties. This item may be analysed as follows: ( 000) 31 December December 2015 Variation Third parties 1,001, , ,216 Unconsolidated group companies and other related parties 713, , ,678 Total 1,714,808 1,044, , Annual Report as at 31 December 2016
377 Separate financial statements as at and for the year ended 31 December 2016 Trade receivables - third parties may be broken down as follows: ( 000) 31 December December 2015 Variation Third parties 1,041, , ,496 Allowance for impairment (39,452) (21,172) (18,280) Total 1,001, , ,216 Trade receivables - third parties rose by million to 1,001.7 million, net of the allowance for impairment of 39.5 million. The balance relates to amounts due from clients for invoices issued and for work performed and approved by clients but still to be invoiced. The increase is mainly a result of the rise in the Ethiopian branch s trade receivables ( million). The Ethiopian branch recorded a related increase in trade payables for works performed ( million). Settlement of the trade receivables and trade payables takes place concurrently on the basis of the agreements between the parties. The impairment losses of 18.7 million mostly relate to the receivables for late payments from Venezuelan clients, described in the paragraph on Venezuela in the section on the Main risk factors and uncertainties in the Directors report. Changes in the allowance for impairment are shown in the following table: 31 December Impairment losses Utilisations Other Exchange 31 December ( 000) 2015 Other rate gains 2016 Trade receivables 20,749 18,743 (812) ,976 Default interest Total 21,172 18,743 (812) ,452 Changes in the previous year are as follows: 31 December Impairment Utilisations Reversals Change Other Exchange 31 December ( 000) 2014 losses in scope rate gains 2015 Trade receivables 16,606 4,478 (2,842) ,234 20,749 Default interest Total 16,908 4,564 (2,842) ,269 21,172 Current trade receivables - group companies and other related parties amount to million at the reporting date compared to million at 31 December They mainly refer to commercial transactions. 376 Annual Report as at 31 December 2016
378 Separate financial statements as at and for the year ended 31 December 2016 The following table shows the main group companies to which these receivables refer: ( 000) 31 December December 2015 Variation Salerno-Reggio Calabria 85,933 94,689 (8,756) Cociv 139,650 90,316 49,334 Consorzio Cavtomi 74,197 86,654 (12,457) Grupo Unidos por el Canal 38,404 31,985 6,419 Rc Scilla 31,561 27,523 4,038 Pedelombarda 1,577 21,233 (19,656) Metro Blu 10,376 19,920 (9,544) Salini Namibia 15,514 19,085 (3,571) E.R. Impregilo/Dumez y Asociados para Yaciretê 15,557 14,384 1,173 Eurolink 10,419 10,415 4 Enaler - 7,263 (7,263) Passante di Mestre 568 2,214 (1,646) Fisia Ambiente 1,762 1, Salini Polska L.t.d. 86,547 6,441 80,106 Lane Group 12,009-12,009 Other 189, ,638 12,439 Total 713, , ,678 Other mostly relates to the amounts due from Salini Polska Sp., Salini Nigeria Ltd. and Salini Impregilo Joint Venture for Mukorsi. 12. Derivatives and other current financial assets Other current financial assets amount to million compared to million at 31 December This item is broken down as follows: ( 000) 31 December December 2015 Variation Current loans and receivables - group companies and related parties 595, , ,387 Current loans and receivables - third parties 36,319 45,066 (8,747) Government bonds and insurance shares (406) Total 631, , ,234 Current loans and receivables include loans given to group companies and other related parties and third parties. The balance comprises correspondence current accounts and loans and receivables with group companies and other related parties. A complete list of the transactions is given in the annex Intragroup transactions at the end of these 377 Annual Report as at 31 December 2016
379 Separate financial statements as at and for the year ended 31 December 2016 notes. They are regulated by contracts. The caption includes a loan of 4.9 million given to Salini Costruttori, which decreased by 7.5 million compared to 31 December The caption also includes 36.3 million due from third parties, of which 16.1 million is the current portion of the amounts due from Prime System Kz Ltd for the sale of Todini Costruzioni Generali S.p.A. and 13.5 million is due from the Romanian Ministry of Infrastructure and Transportation related to the surety enforced during the year as a result of the disputes with the customer about the Orastie-Sibiu motorway contract. The company is confident that it will recover this amount, based also on the opinion of its legal advisors assisting it with the disputes. The section on the Main risks and uncertainties in the Directors report provides more information. The captions decreased during the year as the company collected 29.9 million relating to the work performed for the Metro 6 (Chile) works and 18.4 million (including interest) for the sale of TEEM. 13. Current tax Current tax assets amount to million as follows: assets and other current tax assets ( 000) 31 December December 2015 Variation Direct taxes 46,373 44,753 1,620 IRAP 1 23 (22) Foreign direct taxes 61,414 38,280 23,134 Total 107,788 83,056 24,732 Direct taxes show the taxes already claimed for reimbursement. The foreign direct taxes mainly relate to the Milan head office, the Saudi Arabian branch ( 12.0 million) and the US branch ( 4.3 million). The other current tax assets amount to 73.9 million as follows: ( 000) 31 December December 2015 Variation VAT 69,927 39,576 30,351 Other indirect taxes 4,022 15,234 (11,212) Total 73,949 54,810 19, Annual Report as at 31 December 2016
380 Separate financial statements as at and for the year ended 31 December Other current assets Other current assets rose by 50.1 million to million. They are broken down in the following table: ( 000) 31 December December 2015 Variation Other 106,649 57,086 49,563 Advances to suppliers 64,943 52,608 12,335 Other - group companies and other related parties 67,340 47,029 20,311 Prepayments and accrued income 26,662 58,807 (32,145) Total 265, ,530 50,064 Other increased by 49.6 million to million, mainly due to the larger amounts due from some of the company s partners of joint ventures around the world. This item includes: 37.2 million due from the Argentine Republic as compensation for damage following the favourable award issued on 21 June 2011 and confirmed by the Buenos Aires Arbitration Tribunal on 24 January This award settled the proceedings commenced by the shareholders of the investee Aguas del Gran Buenos Aires S.A. in liquidation (operator) against the Argentine Republic; 55.5 million due from some of the company s partners of joint ventures around the world, mainly relating to works for the Ingula hydroelectric plant (South Africa) and for the housing project in South Al Mutlaa (Kuwait). Advances to suppliers increased by 12.3 million over 31 December 2015 to 64.9 million, mainly due to the advances made for the Tajikistani contract for the construction of a new hydroelectric power plant. Other - group companies and other related parties increased by 20.3 million to 67.3 million at the reporting date, mainly as a result of the rise in amounts due from the Argentine entities engaged in the environmental restoration and construction of prisons in the Buenos Aires area. Prepayments and accrued income of 26.7 million show a decrease of 32.1 million on 31 December The decrease is mainly due to the Riyadh Metro Line 3 contract in Saudi Arabia and consultancy costs incurred in 2015 in connection with the acquisition of Lane by the company and recharged to US Holding Inc. during the year. The remainder mainly consists of insurance premiums, commissions on sureties and other contract costs which will be recognised in profit or loss in future periods based on the stage of completion of the related contracts. 379 Annual Report as at 31 December 2016
381 Separate financial statements as at and for the year ended 31 December 2016 They are broken down in the following table: ( 000) 31 December December 2015 Variation Accrued income: - Other Total accrued income Prepayments: - Insurance 9,878 19,921 (10,043) - Sureties 2,136 3,798 (1,662) - Other contract costs 14,629 35,088 (20,459) Total prepayments 26,643 58,807 (32,164) Total 26,662 58,807 (32,145) 15. Cash and cash equivalents At 31 December 2016, cash and cash equivalents amount to million, up by 88.6 million, as shown below: ( 000) 31 December December 2015 Variation Cash and cash equivalents 852, ,933 88,619 The balance includes credit bank account balances at the end of the year and the amounts of cash, cheques and valuables at the registered offices, work sites and foreign subsidiaries. Liquidity management is designed to ensure the financial independence of ongoing contracts, considering the structure of the consortia and SPEs, which may limit the availability of financial resources to achievement of the related projects. Liquidity management also considers the existence of constraints to the transfer of currency imposed by certain countries. The statement of cash flows shows the reason for the increase in the item and changes in current account facilities (Note 17). 380 Annual Report as at 31 December 2016
382 Separate financial statements as at and for the year ended 31 December 2016 A breakdown of this item by geographical segment is as follows: ( 000) 31 December December 2015 Variation Italy 149,167 54,082 95,085 EU (excluding Italy) 36,989 8,570 28,419 Non-EU 398 2,877 (2,479) Asia 28,674 3,172 25,501 Middle East 485, ,854 (121,405) Africa 99,435 45,499 53,936 North America 4,200 9,379 (5,178) South America 37,063 18,236 18,827 Oceania 11,178 15,265 (4,087) Total 852, ,933 88, Equity Equity amounts to 1,007.4 million at 31 December 2016 compared to million at the end of Changes of the year in the different equity items are summarised in the schedule attached to the separate financial statements. ( 000) 31 December December 2015 Variation Share capital 544, ,740 - Share premium reserve 120, , Legal reserve 103, ,534 1,787 - Reserve for treasury shares (7,677) (7,677) - - Reserve for share capital increase related charges (3,970) (3,970) - - LTI reserve 4, ,102 - Extraordinary and other reserves 146, ,813 - Total other reserves 242, ,839 5,889 - Actuarial reserve (497) (353) (144) - Translation reserve 12,681 (789) 13,470 - Hedging reserve (2,667) (10,685) 8,018 Total other comprehensive income (expense) 9,517 (11,827) 21,344 Retained earnings 25,042 11,081 13,961 Profit for the year 64,603 35,731 28,872 Total 1,007, ,362 70, Annual Report as at 31 December 2016
383 Separate financial statements as at and for the year ended 31 December 2016 In their meeting held on 28 April 2016, the company s shareholders resolved to allocate the profit for 2015 as follows: 1,786,530.08, equal to 5% of the profit for the year 2015, to the legal reserve; 19,562, as a dividend to the holders of ordinary shares, equal to 0.04 per share; 420, as a dividend to the holders of savings shares, equal to 0.26 per share; 13,961, to retained earnings. Disclosures about the individual items are set out below. Share capital At 31 December 2016, the company s fully paid-up share capital amounts to 544,740,000. It comprises 493,788,182 shares, including 492,172,691 ordinary shares and 1,615,491 savings shares, all without a nominal amount. Savings shares issued pursuant to the law do not carry voting rights, have preference dividend and capital repayment rights and can be bearer shares, subject to the provisions of article of the Italian Civil Code. Upon the shareholder s requests and at their own expense, they can be converted into registered shares and vice versa. Savings shares held by directors, statutory auditors and CEOs are registered. Except when the company s by-laws or relevant legislation provide for otherwise, savings shares give the holders the same rights as those of ordinary shares. Holders of savings shares do not have the right to attend the company s shareholders meetings or to request that they are called. The special savings shareholders meeting is regulated by law. When reserves are distributed, the savings shares have the same rights as ordinary shares. Upon dissolution of the company, savings shares bear preference rights to capital repayment, up to 5.2 per share. When shares are grouped or split (as well as when capital transactions are carried out and as necessary in order to protect the savings shareholders rights in the case the shares have nominal value), the above fixed amount shall be adjusted accordingly. Profit for the year as per the financial statements is allocated as follows: a) 5% to the legal reserve, up to the legally-required amount; 382 Annual Report as at 31 December 2016
384 Separate financial statements as at and for the year ended 31 December 2016 b) to savings shares, to the extent of 5% of 5.2 per share (i.e., 0.26 per share). If a dividend lower than 5% of 5.2 per share (i.e., 0.26 per share) is paid one year, the difference is taken as an increase in the preferred dividend of the following two years; c) the residual amount, to all shareholders in such a way as to allocate to savings shares a total dividend which is 2% of 5.2 per share (i.e., per share) greater than that distributed to ordinary shares, except when the shareholders decide to allocate an amount to the extraordinary reserves or for other uses. Details on the possible use of equity items and uses in prior years are summarised below: Summary of use use in the previous three years Amount Possible use Available To cover Other ( 000) (A, B, C) portion losses Share capital 544,740 Income-related reserves: Share premium reserve 120,798 A, B 120,798 Other reserves: Legal reserve 103,321 B 103,321 Reserve for treasury shares (7,677) Share capital increase related charges (3,970) Unavailable hedging reserve (2,667) Unavailable actuarial reserve (497) Unavailable LTI reserve 4,241 Translation reserve 12,681 Negative goodwill 146,813 A, B, C 146,813 Total other reserves 252,245 Retained earnings 25,042 A, B, C 25,042 Total 942, ,974 Non-distributable portion 276,191 Residual distributable portion 119,783 A: capital increase B: to cover losses C: dividends The share premium reserve cannot be distributed until the legal reserve reaches 20% of the share capital. 383 Annual Report as at 31 December 2016
385 Separate financial statements as at and for the year ended 31 December 2016 Other reserves This item is broken down as follows: ( 000) 31 December December 2015 Variation Legal reserve 103, ,534 1,787 Negative goodwill 146, ,813 - Reserve for treasury shares (7,677) (7,677) - LTI reserve 4, ,102 Reserve for share capital increase related charges (3,970) (3,970) - Total other reserves 242, ,839 5,889 Legal reserve This reserve underwent the following changes: ( 000) 31 December ,534 Allocation of profit 1, December ,321 Changes during 2015 are shown in the following table: ( 000) 31 December ,000 Allocation of profit 1, December ,534 Reserve for treasury shares The company launched its own treasury repurchase programme on 6 October 2014 and it had bought back 3,104,377 shares for 7,676, at the reporting date, unchanged from 31 December LTI reserve The LTI (long term incentive plan) reserve shows the fair value of 4.2 million of this plan introduced in The section on the accounting policies describes how the reserve is treated. 384 Annual Report as at 31 December 2016
386 Separate financial statements as at and for the year ended 31 December 2016 The following table provides a breakdown of this reserve: (Euro) No. of shares Amount Start date End date Average price Fair value Chief executive officer 569,573 2,198, /12/ /4/ , Key management personnel 983,286 3,803, /12/ /4/ ,658, Other managers 958,732 3,708, /12/ /4/ ,617, Total 2,511,591 9,710, ,241, Other comprehensive income (expense) The main variation in other comprehensive income (expense) items relates to the effect of fluctuations in exchange rates as shown below: ( 000) 31 December 2015 (788) Reclassification to profit or loss 902 Increase 12,567 Total changes 13, December ,681 ( 000) 31 December ,148 Decrease (10,936) Total changes (10,936) 31 December 2015 (788) The actuarial reserve underwent the following changes: ( 000) 31 December 2015 (353) Net actuarial losses recognised in OCI (144) 31 December 2016 (497) Changes during 2015 are shown in the following table: ( 000) 31 December 2014 (1,196) Net actuarial gains recognised in OCI December 2015 (353) 385 Annual Report as at 31 December 2016
387 Separate financial statements as at and for the year ended 31 December 2016 The hedging reserve underwent the following changes: ( 000) 31 December 2015 (10,685) Reclassification of fair value gains/losses on settled transactions to profit or loss 36 Net fair value losses (1,939) Net exchange rate gains and other changes 9, December 2016 (2,667) Changes during 2015 are shown in the following table: ( 000) 31 December 2014 (18) Net fair value losses (10,667) 31 December 2015 (10,685) 17. Bank and other loans, current portion of bank loans and current account facilities Bank and other loans and borrowings and factoring liabilities increased by 80.3 million to 1,362.9 million at the reporting date. ( 000) 31 December December 2015 Variation Bank and other loans and borrowings 756, ,989 80,992 Current account facilities and other loans 605, ,595 (716) Total 1,362,860 1,282,584 80,276 The company s financial indebtedness is broken down by loan type in the following table: 31 December December 2015 ( 000) Non-current Current Total Non-current Current Total Bank corporate loans 753,740 45, , , , ,061 Bank construction loans 11 1,081 1, ,162 16,939 Other financing 2,882 7,108 9,990 6,938 47,172 54,110 Current account facilities - 1,230 1,230-38,915 38,915 Loans and borrowings - group companies - 485, , , ,850 Factoring liabilities for receivables factored with recourse ,087 66, ,763 59,707 Total 756, ,879 1,362, , ,595 1,282, Annual Report as at 31 December 2016
388 Separate financial statements as at and for the year ended 31 December 2016 Bank loans They are broken down in the following table: 31 December December 2015 Company Country Total Current Non-current Total Current Non-current ( 000) loans loans Banca IMI Refinancing (Facility B) Head office Italy 163, , ,645 1, ,988 Banca IMI ( 150 million) Head office Italy 148, , , ,798 Banca IMI Refinancing (Facility A) Head office Italy 126, , ,603 3, ,458 Monte dei Paschi Head office Italy 119, ,542 49, ,708 Banca IMI ( 102 million) Head office Italy 101,921 10,291 91, Banca Popolare di Bergamo Head office Italy 40, ,904 40,001 40,001 - Banca Popolare di Milano Head office Italy 49,873 9,528 40, BPER Head office Italy 38,052 13,052 25,000 70,434 32,934 37,500 Banca del Mezzogiorno Head office Italy 10,576 10,576-20,794 10,250 10,543 Banco do Brasil Head office Italy ,060 46,727 13,333 Credit Agricole Head office Italy ,291 9,291 - Banca Popolare di Lodi Head office Italy ,020 9,020 - Banca Popolare di Bari Head office Italy ,048 15,048 - Banca Popolare del Lazio Head office Italy ,002 14,002 - Revolving Head office Italy ,167 20,167 - Total bank corporate loans 798,771 45, , , , ,328 Various banks Venezuelan branch Venezuela Various banks Romanian branch Romania UNB United Arab Emirates United Arab branch Emirates ,259 10,259 - BMCE Moroccan branch Morocco ,903 5,903 - Total bank construction loans 1,092 1, ,939 16, Annual Report as at 31 December 2016
389 Separate financial statements as at and for the year ended 31 December 2016 The main conditions of the bank loans in place at 31 December 2016 are as follows: Company Interest rate Expiry date Note Bank syndicate - Refinancing Facility A Salini Impregilo Euribor 2019 (1) Bank syndicate - Refinancing Facility B Salini Impregilo Euribor 2020 (1) Banca Popolare dell Emilia Romagna Salini Impregilo Euribor 2019 Monte dei Paschi di Siena Salini Impregilo Fixed 2019 (1) Banca Popolare di Bergamo Salini Impregilo Fixed 2019 Banca Popolare di Milano Salini Impregilo Euribor 2021 (1) Banca IMI ( 102 million) Salini Impregilo Euribor 2021 (1) Banca IMI ( 150 million) Salini Impregilo Euribor 2020 (1) Banca del Mezzogiorno Salini Impregilo Euribor 2017 (1) The loans are backed by covenants that establish the requirement for the borrower to maintain certain financial and equity ratios, which at the date of this Annual Report are fully respected. The interest rates shown in the table have floating spreads depending on the term and conditions of the financing. The decision to apply the Euribor (1, 2, 3 or 6 months) has been contractually provided for to the benefit of Salini Impregilo. The non-current portion of the above loans will be repaid at its contractual maturity, based on the following time bands: Company Country Total non- Due after 13 Due after 25 Due after 60 current portion months but months but months within 24 within 60 ( 000) months months Banca IMI Refinancing (Facility B) Salini Impregilo Italy 162, ,640 - Banca IMI ( 150 million) Salini Impregilo Italy 148, ,468 - Banca IMI Refinancing (Facility A) Salini Impregilo Italy 126, ,440 2,772 - Banca IMI ( 102 million) Salini Impregilo Italy 91,630 20,420 71,210 - Monte dei Paschi di Siena Salini Impregilo Italy 119, ,543 - Banca Poplare di Milano Salini Impregilo Italy 40,344 9,754 30,590 - Banca Popolare di Bergamo Salini Impregilo Italy 39,904-39,904 - BPER Salini Impregilo Italy 25,000 12,500 12,500 - Total bank corporate loans 753, , ,626 - Various banks Venezuelan branch Italy Total bank construction loans The fair value of the bank loans, measured as set out in the Accounting policies section, is million. 388 Annual Report as at 31 December 2016
390 Separate financial statements as at and for the year ended 31 December 2016 Current account facilities Current account facilities decreased by 37.7 million to 1.2 million at the reporting date and mainly refer to the head office. Other financing Other financing at 31 December 2016 totals 9.9 million, 6.9 million of which payable to Caterpillar Financial for the purchase of plant and machinery for the foreign branches. The fair value of this liability, measured as set out in the Accounting policies section, is 10.1 million. Factoring liabilities Factoring liabilities amount to 66.4 million at the reporting date and refer to the factoring of invoices by foreign branches in Ethiopia, Venezuela and Sierra Leone. Net financial indebtedness of Salini Impregilo S.p.A. ( 000) Note (*) 31 December December 2015 Variation Non-current financial assets 7 19,800 17,630 2,170 Current financial assets , , ,234 Cash and cash equivalents , ,933 88,619 Total cash and cash equivalents and other financial assets 1,503,933 1,264, ,023 Bank and other loans and borrowings 17 (756,981) (675,989) (80,992) Bonds 18 (868,115) (396,211) (471,904) Finance lease liabilities 19 (47,237) (67,002) 19,765 Total non-current indebtedness (1,672,333) (1,139,202) (533,131) Current portion of bank loans and borrowings and current account facilities 17 (605,879) (606,595) 716 Current portion of bonds 18 (18,931) (10,203) (8,728) Current portion of finance lease liabilities 19 (30,414) (42,081) 11,667 Total current indebtedness (655,224) (658,879) 3,655 Derivative liabilities 20 (2,751) (10,685) 7,934 Net financial position with unconsolidated SPEs (**) (5,345) 17,512 (22,857) Total other financial assets (liabilities) (8,096) 6,827 (14,923) Net financial indebtedness including discontinued operations (831,720) (526,344) (305,376) (*) The note numbers refer to the notes to the separate financial statements where the items are analysed in detail. (**) These items show the company s net amounts due from/to consortia and/or consortium companies not controlled by any one entity and operating under a cost recharging system. The balance reflects the company s share of cash and cash equivalents or debt of the SPEs. The items making up these balances are presented under trade receivables and trade payables, respectively, in the separate financial statements. At 31 December 2016, the company has net financial indebtedness of million compared to million at the end of the previous year. 389 Annual Report as at 31 December 2016
391 Separate financial statements as at and for the year ended 31 December 2016 The increase is mainly due to the debt taken out to acquire Lane Group, which entailed an outlay of 429 million. 18. Bonds The outstanding bonds at 31 December 2016 amount to million. They are analysed in the following table: ( 000) 31 December December 2015 Variation Non-current portion 868, , ,904 Current portion 18,931 10,203 8,728 Total 887, , ,632 A breakdown of this item is set out in the following table: 31 December December 2015 ( 000) Expiry date Nominal amount Non-current portion (net of related charges) Current portion (accrued interest) Nominal amount Non-current portion (net of related charges) Current portion (accrued interest) ,125% 1 August , ,385 7, , ,211 10, ,75% 24 June , ,730 11, Total 883, ,115 18, , ,211 10,203 On 23 July 2013, Salini S.p.A. (now part of Salini Impregilo S.p.A.) issued senior unsecured bonds for a nominal amount of 400 million to be redeemed on 1 August 2018, intended for international institutional investors. The bonds, which have a minimum denomination of 100,000 and an annual gross coupon of 6.125%, were placed with primary international institutional investors at a price of The issue is secured by covenants that establish the requirement for the borrower to maintain certain financial and equity ratios which, at the date of this Annual Report, are fully respected. On 24 June 2016, the company announced the placement of bonds with a nominal amount of million reserved for institutional investors. They have a fixed rate coupon of 3.75%. The bonds are listed on the Irish Stock Exchange in Dublin with a redemption date of 24 June Part of the bonds, with a nominal amount of million, was assigned to the holders of the senior unsecured bonds that adhered to the company s offer. The exchange ratio applied to the existing bonds was %. After the exchange, the outstanding senior unsecured bonds amounted to 283 million. The Company used the proceeds of 300 million from the new issue, not used for the bond exchange, to repay part of the bridge financing taken out to acquire Lane Group. The company assessed the continuity of the previous bonds (exchanged) with the bonds placed on 24 June On 11 July 2016, it placed more bonds with institutional investors for a total nominal amount of roughly 172 million. The new bonds are part of a single series with the previous 428 million issued on 24 June 2015 and redeemable on 24 June 2021, bringing 390 Annual Report as at 31 December 2016
392 Separate financial statements as at and for the year ended 31 December 2016 the total bond issue to 600 million. The transaction has strengthened the Company s debt profile, extended its average debt repayment dates by more than one year and increased its fixed rate debt component. The bonds issued in 2016 are backed by covenants that require the company to maintain certain financial and equity ratios, which at the date of this Annual Report are fully respected. The fair value of the bonds at the reporting date, measured as set out in the Accounting policies section, is million. 19. Finance lease liabilities Finance lease liabilities may be broken down as follows at 31 December 2016: 31 December 31 December Variation ( 000) Non-current portion 47,237 67,002 (19,765) Current portion 30,414 42,081 (11,667) Total 77, ,083 (31,432) This item includes the principal of minimum lease payments at the reporting date. Liabilities for these leases are guaranteed to the lessor via rights to the leased assets. The present value of the minimum lease payments is 77.7 million (31 December 2015: million) as follows: ( 000) 31 December December 2015 Minimum lease payments: Due within one year 32,324 47,932 Due between one and five years 48,563 68,257 Total 80, ,189 Future interest expense (3,236) (7,106) Net present value 77, ,083 The net present value is as follows: Due within one year 30,414 44,185 Due between one and five years 47,237 64,898 Total 77, , Annual Report as at 31 December 2016
393 Separate financial statements as at and for the year ended 31 December 2016 The company s total minimum lease payments under non-cancellable operating leases are as follows: Estimated total minimum lease payments under non-cancellable leases ( m) - December 2016 Within one year Between one and five years Due after five years Total The above figures do not reflect the impact that adoption of IFRS 16 from 1 January 2019 could have. 20. Derivatives and other current financial liabilities Derivative liabilities amount to 2.8 million and include the reporting-date fair value of the currency and interest rate hedges. They may be broken down as follows: 31 December December 2015 ( 000) Liabilities Liabilities Interest rate swaps - Cash flow hedges 2,667 10,685 Forward currency purchases and sales - FVTPL 84 - Total derivatives presented in net financial indebtedness 2,751 10,685 INTEREST RATE SWAPS - Cash flow hedges Negative fair values Agreement date Expiry date Currency Notional amount Fair Value ( ) Company Salini Impregilo 24/11/ /02/2017 EUR 75,000,000 (1,333,906) Salini Impregilo 24/11/ /02/2017 EUR 75,000,000 (1,333,906) Total (2,667,812) Forward currency purchases and sales - FVTPL Negative fair values Agreement date Expiry date Currency Notional amount Fair Value ( ) Company Salini Impregilo S.p.A. (Tajikistan) 23/11/ /01/2017 EUR 20,000, ,102 Salini Impregilo S.p.A. (Tajikistan) 24/11/ /01/2017 EUR 13,000,000 22,231 Salini Impregilo S.p.A. (Saudi Arabia) 16/12/ /01/2017 EUR 16,000,000 (107,329) Salini Impregilo S.p.A. (Saudi Arabia) 19/12/ /01/2017 EUR 12,000,000 (160,574) Total (83,570) 392 Annual Report as at 31 December 2016
394 Separate financial statements as at and for the year ended 31 December 2016 Interest rate swaps includes derivatives that have been entered into to hedge the company against interest rate risks and that meet IFRS hedge accounting requirements. To check compliance with these requirements, the effectiveness of the hedges have been verified and confirmed and, therefore, their fair value changes have been recognised in the hedging reserve (see Note 16). Foreign currency purchases and sales include derivatives that have been entered into to hedge the company against currency risks but that do not meet hedge accounting requirements for cash flow hedges. 21. Post-employment benefits and employee benefits At 31 December 2016, the company s liability due to all its employees determined using the criteria set out in IAS 19 is 12.8 million. The balance mainly consists of the Italian post-employment benefits (TFR). At 31 December 2016 and 2015, the liability for post-employment benefits is the outstanding amount at the reform effective date, net of benefits paid up to the reporting dates. The liability is considered part of a defined benefit plan under IAS 19 and has, therefore, been subjected to actuarial valuation. The valuation, performed with the assistance of an independent expert, was based on the following rates: turnover rate: 7.25%; discount rate: 0.45%; advance payment rate: 3%; inflation rate: 1.5%. The company has used the Iboxx AA Corporate index for the Eurozone, which has an average financial duration in line with the fund being valued, to calculate the discount rate. Changes in the item are as follows: ( 000) 31 December 2015 Accruals Payments Contributions paid to INPS treasury and other funds Net actuarial Other gains changes and change in consolidation scope 31 December 2016 Post-employment benefits and employee benefits 12,090 6,404 (5,808) (2,972) 144 2,944 12,802 ( 000) 31 December 2014 Accruals Payments Contributions paid to INPS treasury and other funds Net actuarial Other losses changes and change in consolidation scope 31 December 2015 Post-employment benefits and employee benefits 11,322 8,890 (5,835) (5,295) (843) 3,851 12, Annual Report as at 31 December 2016
395 Separate financial statements as at and for the year ended 31 December 2016 The net decrease in post-employment benefits in 2016 is due to both payments made during the year and contributions transferred to the INPS treasury and other funds, as well as the accrual for the year and the actuarial gains and losses recognised in the specific equity reserve, as required by revised IAS 19. Other changes are mainly due to exchange rate differences. An increase or decrease of 0.25% in the discount rate used to calculate the liability at 31 December 2016 would have had a negative or positive effect of 0.1 million. A similar increase or decrease at 31 December 2015 would have had a negative or positive effect of 0.1 million, respectively. 22. Provisions for risks At 31 December 2016, these provisions amount to 72.1 million. Changes of the year are as follows: ( 000) 31 December December 2015 Variation Provision for risks on equity investments 57,863 17,993 39,870 Other provisions 14,213 11,891 2,322 Total 72,076 29,884 42,192 Changes of the year are as follows: 31 December Change in Accruals Utilisations Other 31 December ( 000) 2015 scope changes 2016 Provision for risks on equity investments 17,993-83,223 (19,735) (23,618) 57,863 Other provisions 11,891 (164) 3,485 (1,173) ,213 Total 29,884 (164) 86,708 (20,908) (23,443) 72,076 Prior year changes are given below for comparative purposes: 31 December Change in Accruals Utilisations Other 31 December ( 000) 2014 scope changes 2015 Provision for risks on equity investments 27,359-15,653 - (25,019) 17,993 Other provisions 9,593-2,949 (426) (225) 11,891 Total 36,952-18,602 (426) (25,244) 29, Annual Report as at 31 December 2016
396 Separate financial statements as at and for the year ended 31 December 2016 The main changes in the provision for risks on equity investments are detailed below: 31 December 31 December Variation ( 000) Acquisitions (Disinvestments and liquidations) 2,409 5,792 (3,383) Capital transactions 17, ,358 Impairment losses (83,223) (15,653) (67,570) Reclassifications 23,396 19,037 4,359 Total (39,870) 9,366 (49,236) Specifically and as disclosed in Note 3 (to which reference should be made), the provision for risks on equity investments includes the impairment losses on investments in certain SPEs for the part that exceeds their carrying amounts. Changes are due to: capital transactions of 17.5 million, mainly related to HCE Costruzioni S.p.A. ( 12.5 million), SGF INC ( 2.2 million) and Salini Bulgaria A.D. ( 2.2 million), carried out to cover their losses; impairment losses of 83.2 million, mostly related to Empresa Costructora Metro 6 Ltda ( 17.6 million), HCE Costruzioni S.p.A. ( 28.5 million), SGF INC ( 13.3 million) and Salini Australia Pty Ltd ( 12 million). The 2.3 million increase in other provisions is mostly a result of: (i) accruals of 3.5 million for disputes involving the company related to arbitration hearings about concessions and labour disputes ( 2.3 million) and the Kazakhstan branch for a tax audit ( 1 million); (ii) utilisations/releases of 1.2 million, as the events for which the accruals were made took place; (iii) the change in the scope due to the transfer of the Indian branch during the year. Other provisions include the following: 31 December 31 December Variation ( 000) Ongoing litigation 9,479 9, Building segment litigation Tax and social security litigation 1,500 1,500 - Other 2, ,129 Total 14,213 11,891 2, Annual Report as at 31 December 2016
397 Separate financial statements as at and for the year ended 31 December 2016 The provision for ongoing litigation mainly relates to foreign contracts completed in previous years. The provision for building segment litigation was originally set up by Impregilo Edilizia e Servizi, merged into Salini Impregilo S.p.A. (then Impregilo S.p.A.) in previous years. More information is available in the section on the Main risk factors and uncertainties in the Directors report. 23. Progress payments and advances on contract The item Advances on contract work in progress included in Current liabilities, amounts to 1,246.5 million, up million on the figure at 31 December It comprises: 31 December 31 December Variation ( 000) Contract work in progress (632,314) (1,276,255) 643,941 Progress payments and advances received (on approved work) 1,017,533 1,332,678 (315,145) Negative work in progress 385,219 56, ,796 Contractual advances 861, ,995 (85,666) Total 1,246,548 1,003, ,130 Contract work in progress recognised under liabilities (negative WIP) of million is the negative net balance, for each contract, of work performed to date and progress billings and advances. The main change refers to the Koysha dam in Ethiopia ( million). Contractual advances received include the amounts paid by clients as per the related contract and recovered over the contract term. 396 Annual Report as at 31 December 2016
398 Separate financial statements as at and for the year ended 31 December 2016 The following table shows the contribution by key contract: 31 December December 2015 ( 000) Negative WIP Advances Total Negative WIP Advances Total Variation Saudi Arabia - 265, , , ,505 (207,121) Austria 18,912-18,912 32,190-32,190 (13,278) Ethiopia Gerd (Mill. Hydro) - 181, , , ,951 (103,423) Ethiopia Gibe III - 50,000 50,000-50,674 50,674 (674) Ethiopia Koysha Gibe IV 318,893 85, , ,139 Georgia - 15,979 15,979-14,181 14,181 1,798 Italy Metro Blu ,203-6,203 (6,203) Kuwait El Mutlaa - 49,157 49, ,157 Peru 33,435-33,435 8,398-8,398 25,037 Poland - 11,338 11, ,338 Qatar 1,255-1,255 6,274 1,658 7,932 (6,677) Romania - 11,774 11,774-14,314 14,314 (2,540) South Africa Mavundla 6,771-6,771-32,509 32,509 (25,738) Tajikistan - 92,478 92, ,478 Venezuela 4,194-4, ,382 3, Other 1,759 98, ,204 2,766 72,821 75,587 24,617 Total 385, ,329 1,246,548 56, ,995 1,003, ,130 The item shows a total increase of million over 31 December The most significant contracts contributing to the negative WIP are those for the Koysha dam in Ethiopia, the Lima M2 in Peru and the Brenner twin railway tunnels between Tulfes and Innsbruck in Austria. The most significant contractual advances at the reporting date related to the Koysha dam and the Grand Ethiopian Renaissance Dam (Gerd) in Ethiopia ( 85.2 million and million, respectively), the Riyadh Line 3 in Saudia Arabia ( million) and the Rogun dam in Tajikstan ( 92.5 million). The Directors report provides more information about the performance of these contracts and their progress. 24. Trade payables Trade payables amount to 1,415.8 million (31 December 2015: million) and include payables of million (up million on 31 December 2015) to group companies and other related parties. The increase of million in this caption is analysed in the following table: 31 December 31 December Variation ( 000) Third parties 736, , ,137 Group companies and other related parties 679, , ,765 Total 1,415, , , Annual Report as at 31 December 2016
399 Separate financial statements as at and for the year ended 31 December 2016 The million increase is principally the sum of: an increase of 20.1 million related to the joint operation which is building the Sud Al Mutlaa urban development project (Kuwaiti branch); an increase of 9.2 million for the Lietavska-Lucka project (Slovakian branch); an increase of million, mainly related to the Gibe III and Koysha branches (Ethiopian branch); an increase of 9.9 million for the A1F Tuszyn-pyrozowice, S3 - Nowa Sol, S7 - Checiny and S8 - Marki-Radzymin motorway projects (Polish branch); the other increases are due to progress on the recently started-up contracts in the Middle East and Asia (specifically, the Al Bayt Stadium in Qatar, the Riyadh Metro Line 3 in Saudi Arabia and the Rogun Hydropower Project in Tajikistan). Reference should be made to Note 11 in respect to the rise in trade payables for the projects of the Ethiopian branch. Trade payables to group companies and other related parties increased by million to million. The most significant variations are due to: an increase of 56.2 million in the payable to COCIV due to the step-up in activities during the year; an increase of 27.8 million in the payable to Western Station JV as a result of its inclusion in the Group in 2015; an increase of 87.2 million in the payable to Salini Polska which is now operating at full pace. 25. Current tax liabilities and other current tax liabilities Current tax liabilities amount to 72.2 million as follows: ( 000) 31 December December 2015 Variation IRES (43) IRAP 1,661-1,661 Foreign taxes 70,252 47,473 22,779 Total 72,172 47,775 24, Annual Report as at 31 December 2016
400 Separate financial statements as at and for the year ended 31 December 2016 Other current tax liabilities of 15.4 million decreased by 15.4 million over 31 December They may be analysed as follows: 31 December 31 December Variation ( 000) VAT 2,842 17,901 (15,059) Other indirect taxes 12,554 12,881 (327) Total 15,396 30,782 (15,386) 26. Other current liabilities Other current liabilities of million (31 December 2015: million) increased by 13.9 million. The composition of this item and changes during the year are shown below: 31 December 31 December Variation ( 000) Social security institutions 7,915 8,427 (512) Employees 40,958 34,683 6,275 Other 39,067 32,220 6,847 Group companies and other related parties 29,970 21,976 7,994 Accrued expenses and deferred income 14,156 20,862 (6,706) Total 132, ,168 13,898 These liabilities include: accrued accounts due to social security institutions and personnel, amounting to 7.9 million and 41.0 million, respectively. The increase mainly relates to the new projects in Saudi Arabia and Ethiopia; Other of 39.1 million (31 December 2015: 32.2 million); the 6.9 million increase is mainly due to the rise in the liability with the company s partners of the joint venture set up to build the new urban development in South Mutlaa, Kuwait ( 3.2 million) and the increase in the payables after the two unfavourable arbitration awards about the works in Romania and Saudi Arabia ( 7.8 million) offset by the decrease caused by the settlement of the liabilities following the normal progress of activities by the Slovakian branch ( 3.6 million); liabilities with group companies and related parties of 29.9 million, which increased by 8.0 million, mainly as a result of the rise in the liability to the investee IS Joint venture in Australia, offset by the reduction in liabilities with joint venturers in Greece. 399 Annual Report as at 31 December 2016
401 Separate financial statements as at and for the year ended 31 December 2016 accrued expenses and deferred income of 14.2 million, as follows: 31 December 31 December Variation ( 000) Accrued expenses: - Other 5,879 9,839 (3,960) Total accrued expenses 5,879 9,839 (3,960) Deferred income: - Provision of services 8,277 11,023 (2,746) Total deferred income 8,277 11,023 (2,746) Total 14,156 20,862 (6,706) Accrued expenses and deferred income include the ten-year post-contract guarantee of 4.2 million. They mostly consist of portions of costs not yet paid for contract work in progress. 27. Guarantees, commitments, risks and contingent liabilities Guarantees and commitments The key guarantees given by the company are set out below: Contractual sureties: these total 7,910.8 million and are given to clients as performance bonds, to guarantee advances, withholdings and involvement in tenders for all ongoing contracts. In turn, the company has guarantees given by its subcontractors. Sureties for credit: they amount to 1,045.6 million and relate to subsidiaries ( million), associates ( million) and other group companies ( million). The residual amount of 63.8 million relates to sureties granted on behalf of Salini Impregilo S.p.A. Sureties granted for export credit of million. Other personal guarantees of 51.8 million consisting of guarantees related to customs and tax obligations and other commitments ( 1,295.8 million). Collateral related to a lien on the remaining shares of the SPE M4 ( 1.9 million). Litigation and contingent liabilities The company is involved in civil and administrative proceedings that are not expected to have a significant negative effect on its separate financial statements, based on the information currently available and the existing provisions for risks. The section on the Main risk factors and uncertainties in the Directors report provides information about the main disputes. 400 Annual Report as at 31 December 2016
402 Separate financial statements as at and for the year ended 31 December 2016 Tax disputes With respect to the principal dispute with the tax authorities: as described in detail in previous reports, the dispute about the assessment notice challenging the tax treatment of impairment losses and losses on the sale of assets recognised by the parent in 2003 is currently before the Supreme Court, following the tax authorities appeal. The main issue about the sale by Impregilo S.p.A. of its investment in the Chilean operator Costanera Norte SA to Impregilo International Infrastructures NV was cancelled by the Milan Regional Tax Commission on 11 September 2009 (higher assessed tax base of 70 million); the company s appeal about reimbursement of tax assets with a nominal amount of 12.3 million acquired from third parties as part of previous non-recurring transactions is still pending before the Supreme Court; a dispute about the technique used to realign the carrying amount of equity investments as per article 128 of Presidential decree no. 917/86 (greater assessed tax base of 4.2 million) is still pending before the first level court; with respect to another dispute again related to 2005 and the costs of a joint venture set up in Venezuela for which the greater assessed tax base is 6.6 million, the Regional Tax Commission filed its ruling entirely in the company s favour on 19 May 2015; the tax authorities appealed to the Supreme Court on 28 December 2015 challenging the procedure while stating that the findings do not relate to the appeal. The company has filed its defence brief; the company was notified of: (i) a payment order from the tax authorities for Icelandic taxes of 4.6 million, which was cancelled after the the first and second level sentences in favour of the company; and (ii) a payment bill for the same taxes which the company appealed. It won again both at first and second level. On 18 January 2016, the tax authorities presented their appeal to the Supreme Court and the company filed its defence brief; on 29 December 2016, the company received two assessment notices for IRES and IRAP purposes covering 2011 and alleging unpaid IRES taxes of 21.2 million and IRAP taxes of 2.9 million. Both these notices were based on a preliminary assessment report issued by the tax police and notified to the company on 27 September They refer to: (i) for a minimum part, the alleged applicability of the transfer price regulations to sureties given free of charge on behalf of foreign subsidiaries, for which the tax police asserted that the normal commission income would have been 700 thousand; (ii) the non-deductibility of costs of 36.4 million incurred to purchase goods and services to perform works for the Abu Dhabi and Panama contracts, both of which countries have a preferential tax regime, due to the alleged insufficient evidence that the suppliers carried out commercial activities in those countries and that the related purchases were in Salini Impregilo s effective interest. To date, the company is negotiating a settlement of the assessments and the terms for their appeal are still open. 401 Annual Report as at 31 December 2016
403 Separate financial statements as at and for the year ended 31 December 2016 With respect to the above pending disputes, after consulting its legal advisors, the company believes that it has acted correctly and deems that the risk of an adverse ruling is not probable. Finally, the Milan unit of the tax police is currently performing a tax audit of the IRES, IRAP and VAT paid in Icelandic branch With respect to the completed contract for the construction of a hydroelectric plant in Karanjukar (Iceland), a dispute arose with the Icelandic tax authorities in 2004 about the party required to act as the withholding agent for the remuneration of foreign temporary workers at the building site. Salini Impregilo was firstly wrongly held responsible for the payment of the withholdings on this remuneration, which it therefore paid. Following the definitive ruling of the first level court, the company s claims were fully satisfied. Nevertheless, the local authorities subsequently commenced a new proceeding for exactly the same issue. The Supreme Court rejected the company s claims in its ruling handed down in February 2010, which is blatantly contrary to the previous ruling issued in 2007 on the same matter by the same judiciary authority. The company had expected to be refunded the unduly paid withholdings of 6.9 million (at the original exchange rate). After the last ruling, the company took legal action at international level (appeal presented to the EFTA Surveillance Authority on 22 June 2010) and, as far as possible, again at local level as it deems that the last ruling issued by the Icelandic Supreme Court is unlawful both in respect of local legislative and international agreements regulating trade relations between the EFTA countries and international conventions which do not allow application of discriminatory treatments to foreign parties (individuals and companies) working in other EFTA countries. On 8 February 2012, the EFTA Surveillance Authority sent the Icelandic government a communication notifying the infraction of the free exchange of services and requested the government to provide its observations about this. In April 2013, the EFTA Surveillance Authority issued its documented opinion finding the Icelandic legislation to be inconsistent with the regulations covering trade relations between the member countries with respect to the regulations for the above dispute. It asked that Iceland take steps to comply with these regulations. Accordingly, the company requested the case be reexamined locally and engaged a leading legal firm to assess whether to take additional action at international level. Based on the above, Salini Impregilo does not believe objective reasons currently exist to change the valuations made about this dispute. 402 Annual Report as at 31 December 2016
404 Separate financial statements as at and for the year ended 31 December Financial instruments and risk management Classes of financial instruments The company s financial instruments are broken down by class in the following table, which also shows their fair value: Financial assets ( 000) 31 December 2016 Note Loans and receivables Financial assets at fair value through profit or loss Hedging derivatives Held-tomaturity investments Availablefor-sale financial assets Total Fair Value Non-current financial assets 7 3, ,848 19,800 19,800 Trade receivables 11 1,714, ,714,808 1,714,808 Other current financial assets , , ,581 Cash and cash equivalents , , ,552 Total 3,202, ,080 3,218,741 3,218,741 Financial liabilities ( 000) 31 December 2016 Note Other liabilities at amortised cost Financial liabilities at fair value through profit or loss Hedging derivatives Bank and other loans and borrowings 17 1,362, ,362,860 1,385,411 Bonds , , ,314 Finance lease liabilities 19 77, ,651 77,651 Derivatives 20 2, ,751 2,751 Trade payables 24 1,415, ,415,800 1,415,800 Total 3,746, ,746,108 3,828,927 Totale Fair Value 403 Annual Report as at 31 December 2016
405 Separate financial statements as at and for the year ended 31 December 2016 Financial assets Note Loans and Financial Hedging Held-tomaturity Fair Value ( 000) receivables assets at fair derivatives value investments through profit 31 December 2015 Non-current financial assets or loss ,412 17,630 17,630 Trade receivables 11 1,044, ,044,914 1,044,914 Other current financial assets , , ,347 Cash and cash equivalents , , ,933 Total 2,291, ,050 2,309,824 2,309,824 Availablefor-sale financial assets Total Financial liabilities Note Other liabilities at Financial Hedging Fair Value ( 000) amortised cos liabilities at fair derivatives value through 31 December 2015 Bank and other loans and borrowings 17 1,282,584 profit or loss - - 1,282,584 1,301,018 Bonds , , ,160 Finance lease liabilities , , ,083 Derivatives ,685 10,685 10,685 Trade payables , , ,898 Total 2,697,979-10,685 2,708,664 2,876,844 Total The note column gives the section in which the relevant item is described. Reference should be made to the section on accounting policies for information on the fair value measurement of these items. The fair value of the above items is based on the present value of estimated future cash flows. Risk management Salini Impregilo is exposed to financial risks, including the following: market risk deriving from the company s exposure to interest rate fluctuations and exchange rate fluctuations; credit risk deriving from the company s exposure to potential losses arising from the clients non-compliance with their obligations; liquidity risk deriving from the risk that the financial resources necessary to meet obligations may not be available at the agreed terms and deadlines. 404 Annual Report as at 31 December 2016
406 Separate financial statements as at and for the year ended 31 December 2016 Market risk Market risk is the risk that the fair value or future cash flows of a financial instrument will fluctuate because of changes in market prices. Market risk comprises currency risk and interest rate risk. Currency risk Salini Impregilo s international presence entails its exposure to the risk of fluctuations in exchange rates of the Euro and the currencies of the various countries in which it operates. Currency risk at 31 December 2016 mainly related to the following currencies: US dollar (United States) DICOM (Venezuela) Dirham (United Arab Emirates) Riyal (Qatar) Tenge (Kazakhstan) Naira (Nigeria) Birr (Ethiopia) Somoni (Tajikistan) The company s currency risk management strategy is essentially based on the following policies: agreement of contractual considerations for works and projects in countries with weak currencies using a primarily multi-currency format, in which only a portion of the consideration is expressed in local currency; use of portions of the contractual considerations in local currency mainly to cover project expenses to be incurred in that currency; analysis of exposure in US dollars on a cumulative and prospective basis with consistent deadlines and setting up forward transactions in the same currency to hedge the company s net exposure at those deadlines. Adoption of the above-mentioned policies has contained the company s exposure to currency risk with respect to the US dollar, the DICOM, the Dirham, the Riyal, the Tenge, the Naira, the Birr and the Somoni. 405 Annual Report as at 31 December 2016
407 Separate financial statements as at and for the year ended 31 December 2016 Had the Euro appreciated or depreciated by 5% against the US dollar at year end, the profit before tax for the year would have been respectively lower or greater by 18.0 million, assuming that all other variables remained constant, mainly due to exchange rate gains (losses) arising from the adjustment of net assets in US dollars. A similar change at the end of the previous year would have led to a 12.4 million decrease (increase in the case of depreciation) in the profit before tax for the year, mainly due to the exchange rate gains (losses) arising from the adjustment of net assets in US dollars. Had the Euro appreciated or depreciated by 15% against the Venezuelan DICOM at year end, the profit before tax for the year would have been respectively lower or greater by 0.1 million, assuming that all other variables remained constant, mainly due to exchange rate losses (gains) arising from the adjustment of net assets in the Venezuelan currency. A similar change at the end of the previous year would have led to a 0.6 million decrease (increase in the case of depreciation) in the profit before tax for the year. Had the Euro appreciated or depreciated by 5% against the UAE Dirham at year end, the profit before tax for the year would have been respectively greater or lower by 0.1 million, assuming that all other variables remained constant, mainly due to exchange rate losses (gains) arising from the adjustment of net liabilities in the UAE dirham. A similar change at the end of the previous year would have led to a 0.1 million decrease (increase in the case of depreciation) in the profit before tax for the year. Had the Euro appreciated or depreciated by 5% against the Qatari Riyal at year end, the profit before tax for the year would have been respectively lower or greater by 1.1 million, assuming that all other variables remained constant, mainly due to exchange rate losses (gains) arising from the adjustment of net assets in the Qatari currency. A similar change at the end of the previous year would have led to a 1.5 million decrease (increase in the case of depreciation) in the profit before tax for the year. Had the Euro appreciated or depreciated by 5% against the Kazakhstani Tenge at year end, the profit before tax for the year would have been respectively greater or lower by 0.1 million, assuming that all other variables remained constant, mainly due to exchange rate losses (gains) arising from the adjustment of net liabilities in the Kazakhstani Tenge. A similar change at the end of the previous year would have led to a 0.3 million decrease (increase in the case of depreciation) in the profit before tax for the year. Had the Euro appreciated or depreciated by 5% against the Nigerian Naira at year end, the profit before tax for the year would have been respectively greater or lower 406 Annual Report as at 31 December 2016
408 Separate financial statements as at and for the year ended 31 December 2016 by 0.2 million, assuming that all other variables remained constant, mainly due to exchange rate losses (gains) arising from the adjustment of net assets in the Nigerian currency. A similar change at the end of the previous year would have led to a 0.8 million decrease (increase in the case of depreciation) in the profit before tax for the year. Had the Euro appreciated or depreciated by 5% against the Ethiopian Birr at year end, the profit before tax for the year would have been respectively lower or greater by 6.5 million, assuming that all other variables remained constant, mainly due to exchange rate losses (gains) arising from the adjustment of net assets in the Ethiopian currency. A similar change at the end of the previous year would have led to a 0.9 million decrease (increase in the case of depreciation) in the profit before tax for the year. Had the Euro appreciated or depreciated by 5% against the Tajikistani Somoni at year end, the profit before tax for the year would have been respectively lower or greater by 1.2 million, assuming that all other variables remained constant, mainly due to exchange rate losses (gains) arising from the adjustment of net assets in the Tajikistani currency. At 31 December 2015, the company did not have any balances in this currency. Interest rate risk Salini Impregilo has adopted a combined strategy of streamlining operations by disposing of non-strategic assets, containing debt and hedging interest rate risks on a portion of the non-current structured loans through interest rate swaps (IRSs). The financial risks arising from market interest rate fluctuations to which the company is potentially exposed and which are monitored by the relevant company personnel relate to medium/long-term floating rate loans. Such risk is mitigated by interest accrued on short-term investments of liquidity available at the Italian-based consortia and consortium companies and foreign subsidiaries, which are used to support the company s operations. The company has revised its debt structure significantly, increasing its fixed rate exposure. For this reason, had interest rates increased (or decreased) by 75 basis points at year end, the pre-tax profit for the year would have been respectively lower or greater by 4.8 million ( 9.8 million for 2015), assuming that all other variables remained constant. Credit risk Credit risk is that deriving from the company s exposure to potential losses arising from the clients (which are mostly governments or state bodies) non-compliance with their obligations. Management of this risk is complex, starting as early as the assessment of offers, through a careful analysis of the characteristics of the countries in which the 407 Annual Report as at 31 December 2016
409 Separate financial statements as at and for the year ended 31 December 2016 company s activities should be carried out and the clients, which are usually state or similar bodies, requesting an offer. Therefore, this risk can be essentially assimilated to the country risk. An analysis of this risk based on the age of the outstanding amounts is not very meaningful, since the receivables (mostly due from state bodies) should be assessed together with the related working capital items, especially those reflecting the net exposure to clients (positive and negative work in progress, advances and payments on account) in relation to contract work in progress as a whole. A breakdown of working capital by geographical segment is set out below: ( 000) 31 December December 2015 Italy 119,324 1,010,337 Other EU countries 95,104 (11,490) Other non-eu countries 14,818 (8,926) America 532,337 (150,687) Asia/Middle East (387,889) (385,729) Rest of the world (36,035) 150,957 Australia 44,675 (40,526) Eliminations - (205,376) Total 382, ,560 The reconciliation of the reclassified statement of financial position details the items included in working capital. 408 Annual Report as at 31 December 2016
410 Separate financial statements as at and for the year ended 31 December 2016 Salini Impregilo s exposure to clients, broken down by contract location, is analysed below: ( 000) Trade Positive Negative Total Allowances receivables WIP WIP and advances 31 December 2016 Italy 448, ,143 (108,045) 732,876 - Other EU countries 112, ,301 (23,228) 228,483 - Other non-eu countries 12,156 6,204 (15,979) 2,381 - America 302, ,737 (36,579) 529,944 - Asia/Middle East 82,230 79,612 (409,053) (247,211) - Rest of the world 749, ,195 (653,664) 225,333 - Australia 6, ,646 - Total 1,714,808 1,010,192 (1,246,548) 1,478, December 2015 Italy 550, ,665 (242,041) 632,450 - Other EU countries 27,959 85,145 (28,495) 84,609 - Other non-eu countries 1, ,539 - America 250, ,794 (11,780) 483,052 - Asia/Middle East 75,470 61,544 (309,467) (172,453) - Rest of the world 132, ,708 (379,445) (22,969) - Australia 6,309 - (32,190) (25,881) - Total 1,044, ,856 (1,003,418) 980,347 - The section on the Main risk factors and uncertainties of the Directors report provides information about country risk for Libya, Venezuela, Nigeria, Ukraine and Turkey. Liquidity risk Liquidity risk derives from the risk that the financial resources necessary to meet obligations may not be available to the company at the agreed terms and deadlines. The company s strategy aims at ensuring that each ongoing contract is financially independent. This strategy is strictly monitored centrally. 409 Annual Report as at 31 December 2016
411 Separate financial statements as at and for the year ended 31 December 2016 A breakdown of financial liabilities by composition and due date (based on undiscounted future cash flows) is set out below: ( 000) 31/12/ /12/ /12/2021 After Total Current account facilities 1, ,230 Bonds 39, , ,562-1,030,258 Bank and other loans and borrowings 678, , ,851-1,439,688 Finance lease liabilities 32,324 10,106 38,457-80,877 Interest rate derivatives 2, ,751 Gross financial liabilities 754, ,234 1,349,870-2,554,814 Trade payables 1,415, ,415,800 Total 2,170, ,234 1,349,870-3,970,614 Future interest has been estimated based on the market interest rates at the date of preparation of these separate financial statements, summarised in the notes. The prior year figures are given below for comparative purposes: ( 000) 31/12/ /12/ /12/2019 After Total Current account facilities 38, ,916 Bonds 24,567 24, , ,283 Bank and other loans and borrowings 437, , ,006 90,313 1,062,206 Finance lease liabilities 42,081 18,652 46, ,978 Interest rate derivatives 10, ,685 Gross financial liabilities 553, , ,467 90,313 1,680,068 Trade payables 899, ,898 Total 1,453, , ,467 90,313 2,579,966 Liquidity risk management is mainly based on containing debt and maintaining a balanced financial position. Loans and borrowings (principal) and trade payables (net of advances) falling due before 31 March 2017 are compared with the cash and cash equivalents that can be used to meet such obligations in the table below. ( 000) Total current financial commitments 2,052,093 of which: due before 31 March ,063 Cash and cash equivalents 850,997 Difference 199, Annual Report as at 31 December 2016
412 Separate financial statements as at and for the year ended 31 December 2016 Fair value measurement hierarchy IFRS 7 requires that the fair value of financial instruments recognised in the statement of financial position be classified using a fair value hierarchy that reflects the significance of the inputs used to determine fair value. There are three different levels: Level 1 - Fair values measured using quoted prices in active markets; Level 2 - Fair values measured using valuation techniques for which inputs significant to the fair value measurement are based on observable market data; Level 3 - Fair values measured using valuation techniques for which inputs significant to the fair value measurement are based on unobservable market data. Financial instruments recognised by the company at fair value are classified as follows: ( 000) Nota Level 1 Level 2 Level 3 Derivative liabilities 20 - (2,751) - Total - (2,751) - There were no movements from Level 1 to Level 2 during the year or vice versa. 411 Annual Report as at 31 December 2016
413 Separate financial statements as at and for the year ended 31 December 2016 Income statement 29. Revenue Revenue for 2016 amounts to 3,076.7 million, up 1.6% on the previous year as follows: ( 000) Variation Revenue 2,974,148 2,913,416 60,732 Other income 102, ,772 (11,260) Total 3,076,660 3,027,188 49,472 The rise in revenue is mainly due to several large foreign contracts, including the Red Line North in Qatar and the Riyadh Metro in Saudi Arabia. A breakdown of revenue is as follows: ( 000) Variation Works invoiced to clients 2,864,366 2,803,181 61,185 Services 99,563 98,006 1,557 Sales 10,219 12,229 (2,010) Total 2,974,148 2,913,416 60,732 Works invoiced to clients include contractual revenue deriving from production carried out during the year, measured using the stage of completion method. Services mainly relate to services provided to support group companies. A breakdown of other income is given in the following table: ( 000) Variation Other 13,394 28,501 (15,107) Rent and leases 2,317 2,804 (487) Staff services - 7 (7) Recharged costs 74,925 70,774 4,151 Gains on the disposal of non-current assets and equity investments 5,758 5, Prior year income 6,118 6,683 (565) Total 102, ,772 (11,260) 412 Annual Report as at 31 December 2016
414 Separate financial statements as at and for the year ended 31 December Costs Costs for the year amount to 2,831.8 million compared to 2,820.6 million for They account for 92.0% of total revenue compared to 93.2% in The item may be broken down as follows: ( 000) Variation Purchases 372, ,251 32,031 Subcontracts 432, ,807 (58,930) Services 1,482,867 1,497,050 (14,183) Personnel expenses 274, ,493 (944) Other operating expenses 129,216 69,916 59,300 Amortisation, depreciation, provisions and impairment losses 140, ,068 (6,049) Total 2,831,810 2,820,585 11,225 The increase in the individual items compared to 2015 is mainly due to the different cost structures that vary from contract to contract and may, in some cases, entail changes in the industrial operating model from one year to another. Moreover, as these are large-scale infrastructural works that take several years to complete, resort to normal production factors depends on the stage of completion of each contract in any given year. These changes may generate significant variations in the percentage of the related cost categories depending on the contract and the year, while not affecting the total percentage of operating costs of total revenue Purchases The cost of raw materials and consumables incurred in 2016 increased by 32.0 million to million compared to the previous year: ( 000) Variation Purchases of raw materials and consumables 356, ,964 12,520 Change in raw materials and consumables 15,798 (3,713) 19,511 Total 372, ,251 32,031 The rise in the cost of raw materials and consumables is due to the fact that some foreign projects such as the D1 Motorway Lietavska Lùcka Visnove Dubna Skala in Slovakia and the Riyadh Metro Line 3 are fully operational. 413 Annual Report as at 31 December 2016
415 Separate financial statements as at and for the year ended 31 December Subcontracts Costs of subcontracts decreased to million, down 59.0 million on 2015 as summarised in the following table: ( 000) Variation Subcontracts 432, ,807 (58,930) Total 432, ,807 (58,930) The decrease is due mostly due to some large foreign contracts (mainly in Ethiopia), partly offset by the rise in costs for the Riyadh Metro Line 3 contract in Saudi Arabia Services This item increased to 1,482.9 million, down 14.2 million on the previous year, as shown in the following table: ( 000) Variation Consultancy and technical services 293, ,356 86,055 Fees to directors, statutory auditors and independent auditors 9,504 9,748 (244) Employee travel costs 1,128 1,335 (207) Maintenance 4,754 4, Transport and customs 64,034 82,707 (18,673) Insurance 27,620 36,216 (8,596) Recharging of costs by consortia 944,471 1,039,064 (94,593) Rent and leases 85,706 73,757 11,949 Charge backs Lease payments and expenses Commercial expenses 1-1 Other 51,560 42,140 9,420 Total 1,482,867 1,497,050 (14,183) Recharging of costs by consortia decreased by 94.6 million, mainly due to the variation in costs recharged by consortia and joint ventures. The item includes costs for the contracts of the Qatari branch ( million), the Australian branch ( million) and the Saudi Arabian branch ( 60.4 million). Consultancy and technical services increased by 86.1 million and mainly consist of the design and construction costs incurred by the SPEs and legal and administrative consultancy fees. 414 Annual Report as at 31 December 2016
416 Separate financial statements as at and for the year ended 31 December 2016 A breakdown of this item is as follows: ( 000) Variation Design and engineering services 203, ,376 23,725 Legal, administrative and other services 16,994 18,776 (1,782) Testing Construction 72,936 9,021 63,915 Total 293, ,356 86,055 The increase in this item is mainly due to the rise in costs for Construction related to the Riyadh Metro Line 3 contract. Fees to the independent auditors, KPMG S.p.A., and other companies of its network for 2016 are detailed as follows: ( 000) Services Fees Audit Salini Impregilo S.p.A. 1,325 Audit Subsidiaries 1,836 Total audit 3,161 Attestation Services Salini Impregilo S.p.A. 500 Total attestation Services 500 Other services Salini Impregilo S.p.A. 105 Other services Subsidiaries 118 Total other services 223 Total Salini Impregilo Group 3, Personnel expenses Personnel expenses for the year amount to million, down by 0.9 million on The item is made up as follows: ( 000) Variation Wages and salaries 205, ,835 5,542 Social security and pension contributions 28,722 31,680 (2,958) Post-employment benefits 6,414 8,901 (2,487) Other 34,037 35,077 (1,040) Total 274, ,493 (943) 415 Annual Report as at 31 December 2016
417 Separate financial statements as at and for the year ended 31 December 2016 Other mainly relates to termination benefits and reimbursements of travel expenses. The following table shows the workforce at year end and the related average number: Employers 31 December December average Managers White collars 3,336 2,705 3,021 Blue collars 17,281 13,810 15,546 Total 20,881 16,746 18, Other operating expenses Other operating expenses amount to million, up 59.3 million on 2015 as follows: ( 000) Variation Other 123,454 64,385 59,069 Non-recurring costs 5,762 5, Total 129,216 69,916 59,300 The increase in Other is mainly due to the Ethiopian branch ( 8.4 million) for higher customs duties on the new Koysha contract, CMI (South Africa) ( 15.5 million) and for arbitration awards, fines and other items ( 24.8 million) Amortisation, depreciation, provisions and impairment losses This item of million shows a decrease on the previous year figure of million. It may be analysed as follows: ( 000) Variation Impairment losses 11,683 30,965 (19,282) Provisions 3,485 2, Total provisions and impairment losses 15,168 33,914 (18,746) Amortisation of intangible assets Depreciation of property, plant and equipment 101,811 94,681 7,130 Amortisation of contract acquisition costs 22,706 17,426 5,280 Total amortisation and depreciation 124, ,154 12,697 Total 140, ,068 (6,049) 416 Annual Report as at 31 December 2016
418 Separate financial statements as at and for the year ended 31 December 2016 Provisions and impairment losses decreased by 18.7 million in Specifically, impairment losses of 11.7 million mainly related to the receivables for late payments from Venezuelan clients, described in the paragraph on Venezuela in the section on the Main risk factors and uncertainties of the Directors report. The provision of 3.3 million mainly refers to the disputes in Argentina ( 2.3 million) and the Kazakhstani branch for disputes with the local customer (approximately 1.0 million). Amortisation and depreciation of million includes depreciation of million, up 7.1 million on the previous year, and amortisation of 22.7 million of contract acquisition costs. 31. Net financing costs Net financing costs amount to 60.8 million compared to 53.6 million for the previous year. The item may be broken down as follows: ( 000) Variation Financial income 39,408 29,668 9,740 Financial expense (115,494) (99,393) (16,101) Net exchange rate gains 15,266 16,092 (826) Net financing costs (60,820) (53,633) (7,187) 31.1 Financial income Financial income totalled 39.4 million (2015: 29.7 million) and is made up as follows: ( 000) Variation Interest income on loans and receivables 2,106 2,374 (268) Gains on securities 10,315-10,315 Interest and other income from group companies 17,067 19,845 (2,778) Interest and other financial income 9,920 7,449 2,471 - Interest on financing Bank interest 5,194 3,501 1,693 - Default interest 1,733 2,664 (931) - Financial discounts and allowances Other 2,692 1,244 1,448 Total 39,408 29,668 9, Annual Report as at 31 December 2016
419 Separate financial statements as at and for the year ended 31 December 2016 The increase on the previous year is mainly due to: the increase of 10.3 million in financial income on securities, being the gain on the sale of foreign currency securities on the US market; increase of 1.7 million in bank interest, mainly related to a joint venture active in the Middle East and the South African branch; decrease of 2.8 million in interest from group companies, namely: ( 000) Variation HCE Costruzioni S.p.A. 3,575 6,571 (2,996) Consorzio C.A.V.TO.MI (153) Consorzio C.A.V.E.T Salini Nigeria L.t.d. 1, SGF-INC S.p.A (152) Salini Malaysia 354 1,684 (1,330) Salini Australia (18) SPV Linea M4 S.p.A Metro B (33) Lane companies Gupc 7,299 6, Eriday Co. Ge. Fin. S.r.l ,143 (485) Salini Namibia Other 1,012 1,041 (29) Total 17,067 19,845 (2,778) 418 Annual Report as at 31 December 2016
420 Separate financial statements as at and for the year ended 31 December Financial expense 2016 financial expense increased by 16.1 million to million as follows: ( 000) Variation Intragroup interest and other expense (5,623) (21,247) 15,624 Interest and other financial expense (109,871) (78,146) (31,725) - Interest on bank loans and credit account facilities (53,439) (35,044) (18,395) - Interest on bonds (35,829) (25,965) (9,864) - Interest on tax liabilities (1,540) (1,188) (352) - Default interest (32) - (32) - Discounting (232) (131) (101) - Bank fees (2,936) (2,747) (189) - Other loans and borrowings (83) (1,155) 1,072 - Factoring and leases (3,345) (5,366) 2,021 - Other (12,435) (6,550) (5,885) Total (115,494) (99,393) (16,101) Financial expense increased by 16.1 million, mainly due to the rise of 28.3 million in bank interest expense and interest on bonds, as a result of the company s higher debt following the acquisition of Lane. In addition: bank interest of 53.4 million includes the effect of the amortised cost method of 21.7 million (2015: 10.7 million), including 14.0 million, which did not entail cash outlays during the year as it had already been in paid in previous years, and 7.8 million which was paid partly in 2015 and partly in 2016, but was fully recognised in profit or loss in 2016, in connection with the loan taken out to acquire Lane Group; interest on bonds of 35.8 million includes the effect of the amortised cost method of 3.7 million (2015: 6.9 million), which did not give rise to cash outlays. 419 Annual Report as at 31 December 2016
421 Separate financial statements as at and for the year ended 31 December 2016 Other includes 3.8 million arising from application of the amortised cost method to securities related to the operator in Colombia. Intragroup interest and other expense of 5.6 million on intragroup transactions decreased by 15.6 million and relate to the following companies: ( 000) Variation Fisia Ambiente (165) (5) (160) Salini Malaysia (143) - (143) Impregilo International Infrastructures N.V. (2,746) (18,066) 15,320 Healy S.A. (164) (112) (52) Fisia Italimpianti S.p.A. (241) (3) (238) Mukorsi Dam (753) (150) (603) Copenhagen Metro Team I/S (122) (2,120) 1,998 Salini Namibia Proprietary L.t.d. (604) (494) (110) Other (685) (297) (388) Total (5,623) (21,247) 15, Net exchange rate gains The net exchange rate gains amount to 15.3 million, a slight contraction of 0.8 million on the previous year. They are due to the Euro s appreciation against some currencies, such as, in particular, the US dollar, the Ethiopian Birr and the Sierra Leone currency. The overall decrease of 0.8 million is mainly a result of the Euro s appreciation against the Ethiopian Birr and the negative performance of the Venezuelan currency and the US dollar. In order to translate its net financial assets in the Venezuelan currency (Bolivar Fuerte, VEF), the company adopted the official DICOM exchange rate in the year. ( 000) Variation Realised exchange rate gains (losses) 7,526 (79,059) 86,585 Net unrealised exchange rate gains 8,539 96,546 (88,007) Net currency hedging losses (799) (1,395) 596 Total 15,266 16,092 (826) 420 Annual Report as at 31 December 2016
422 Separate financial statements as at and for the year ended 31 December Net losses on equity investments Net losses on equity investments came to 56.1 million compared to million for the previous year. They are made up as follows: ( 000) Variation Impairment losses/provisions for equity investments (118,909) (143,095) 24,186 - Impairment losses/provisions for equity investments (118,909) (143,095) 24,186 Income from equity investments 62,806 28,157 34,649 - Dividends 58,383 28,152 30,231 - Gain on the disposal of equity investments 4,244-4,244 - Loss on the disposal of equity investments (46) (16) (30) - Other income Total (56,103) (114,938) 58,835 Net losses on equity investments mainly reflect the following effects: the dividend distribution of 58.4 million authorised in 2016 by the subsidiaries Impregilo International Infrastructures NV ( 25 million), Salini Impregilo US Holdings Inc. ( 24.8 million) and Salini Kolin Cgf ( 8.2 million); the fair value and impairment losses of million, mainly related to the subsidiaries HCE Costruzioni S.p.A., Empresa Construtora Metro 6 Ltda, SGF INC S.p.A., Grupo Unidos por el Canal and Salini Australia PTY L.t.d. Note 6 and 22 provides more information about changes in the carrying amounts of the above equity investments. 33. Income tax expense The company s income tax expense for the year is 63.3 million as follows: ( 000) Variation Current taxes (income taxes) 57,948 29,979 27,969 Net deferred tax (income) expense (4,619) 32,593 (37,212) Utilisation of the provision for the national tax consolidation scheme (67) (67,182) 67,115 Prior year taxes 4,438 3, Total 57,700 (1,058) 58,758 IRAP 5,623 3,360 2,263 Total 63,323 2,302 61, Annual Report as at 31 December 2016
423 Separate financial statements as at and for the year ended 31 December 2016 An analysis and reconciliation of the theoretical income tax rate, calculated under Italian tax legislation, and the effective tax rate are set out below: ( Million) Income % tax expense Profit before tax Theoretical tax expense % Effect of permanent differences % Net effect of foreign taxes % Prior year and other taxes % Total % The effective tax expense is affected by the following in particular: permanent differences; the tax asset for taxes paid abroad by the branches recognised to the extent the company believes the conditions exist for its recovery in Italy in 2016 or subsequent years. An analysis and reconciliation of the theoretical IRAP tax rate and the effective tax rate are set out below: ( Million) Irap % Operating profit Personnel expenses Revenue Theoretical tax expense % Tax effect of foreign production (14.4) (2.8%) Tax effect of permanent differences (0.3) (0.1%) Total % The net deferred tax expense contributes positively to the company s profit for 4.6 million, specifically for the following items: ( 000) Deferred tax expense for the year 15,599 Utilisation of deferred tax liabilities recognised in previous years (1,637) Deferred tax income for the year (25,150) Utilisation of deferred tax assets recognised in previous years 6,569 Total (4,619) 422 Annual Report as at 31 December 2016
424 Separate financial statements as at and for the year ended 31 December Related party transactions Transactions with related parties, as defined by IAS 24, were of an ordinary nature. Salini Impregilo S.p.A. has been managed and coordinated by Salini Costruttori S.p.A. since 1 January Related party transactions carried out during the year involved the following counterparties: directors, statutory auditors and key management personnel, solely related to the contracts regulating their positions within the Group; associates; these transactions mainly relate to: - commercial assistance with purchases and procurement of services necessary to carry out work on contracts, contracting and subcontracting; - services (technical, organisational, legal and administrative), carried out at centralised level; - financial transactions, namely loans and joint current accounts as part of cash pooling transactions and guarantees given on behalf of group companies. Transactions are carried out with associates in the interests of Salini Impregilo, aimed at building on existing synergies in the Group in terms of production and sales integration, efficient use of existing skills, streamlining of centralised structures and financial resources. These transactions are regulated by specific contracts and are carried out on an arm s length basis; 423 Annual Report as at 31 December 2016
425 Separate financial statements as at and for the year ended 31 December 2016 other related parties: the main transactions with other related parties, identified pursuant to IAS 24, including companies managed and coordinated by Salini Costruttori S.p.A., are summarised below: ( 000) Related party Loans and Financial Other Trade Financial Total Total Financing receivables assets assets payables liabilities revenue costs income (costs) C.Tiburtino Casada S.r.l CEDIV S.p.A Dirlan G.A.B.I.RE S.r.l Galla Placidia Imm. Agricola San Vittorino Infernetto Iniziative Immobiliari Italiane S.p.A ,008 (3) Madonna dei Monti S.r.l Nores Plus Salini Costruttori S.p.A. 31 4, Salini Simonpietro & C. S.A.P.A Zeis Total 1,323 5, , Most of the Company s production is carried out through SPEs, set up with other partners that have participated with Salini Impregilo in tenders. The SPEs carry out the related contracts on behalf of its partners. The other transactions refer to costs for design and similar activities, incurred when presenting bids and for recently started contracts. They are also governed by specific agreements and carried out on an arm s length basis and, where applicable, in line with the contract terms. Their effects on the statement of financial position and income statement are shown together with the related contract, when appropriate. 424 Annual Report as at 31 December 2016
426 Separate financial statements as at and for the year ended 31 December 2016 Transactions with directors, statutory auditors and key management personnel are shown below: Fees and Total Fees and Total ( 000) remuneration remuneration Directors and statutory auditors 6,311 6,311 10,781 10,781 Key management personnel 5,402 5,402 5,114 5,114 Total 11,713 11,713 15,895 15,895 The company s production is carried out mainly through special purpose entities, which, depending on Salini Impregilo s share in their contracts, qualify as subsidiaries or associates. In many cases, they have corporate structures that directly and continuously allocate the profits and losses on contracts to their investors, including by reallocating costs and fees. They can be considered to be transparent considering the original contractual relationship whereby Salini Impregilo, together with the other investors, depending on the type of organisation selected during the tender stage, is the direct counterparty of the customer and the SPE acts in its own name but on behalf of its investors, including vis-à-vis third party suppliers. Accordingly, transactions between Salini Impregilo and the SPEs, in which it has an investment, are not presented in this section but are summarised with other transactions with subsidiaries and associates in the annex Intragroup transactions - Salini Impregilo S.p.A.. The next table shows the impact of transactions with the above companies on the statement of financial position and the income statement (including as a percentage), while their effect on cash flows is shown in the statement of cash flows, when material: ( 000) Non-current Current Current Revenue Costs Financial Financial 31 December 2016 loans and loans and liabilities (3) income expense receivables (1) receivables (2) Total - group companies 1,375,519 1,150, , ,113 17,068 5,467 Total financial statements item 1,491,476 4,837,273 3,539,957 3,076,660 2,831,811 39, ,494 % of financial statements item 0.00% 28.4% 32.5% 8.9% 20.5% 43.3% 4.7% ( 000) Non-current Current Current Revenue Costs Financial Financial 31 December 2015 loans and loans and liabilities (3) income expense receivables (1) receivables (2) Total - group companies - 1,095, , , ,336 19,845 21,206 Total financial statements item 1,140,011 3,782,702 2,769,605 3,027,189 2,820,585 29,668 99,393 % of financial statements item 0.00% 29.0% 28.1% 16.3% 27.1% 66.9% 21.3% (1) The percentage of non-current loans and receivables is calculated considering total non-current assets. (2) The percentage of current loans and receivables is calculated considering total current assets. (3) The percentage of current liabilities is calculated considering total current liabilities. 425 Annual Report as at 31 December 2016
427 Separate financial statements as at and for the year ended 31 December 2016 Management and coordination In relation to the requirements of article of the Rules of the Markets organised and managed by Borsa Italiana S.p.A., the company states that all requirements listed in article 37.1 of the Consob Regulation on Markets have been met, as regards the quotation of shares of subsidiaries managed and coordinated by other companies. In accordance with article 2497-bis of the Italian Civil Code, the key figures from the financial statements of Salini Costruttori S.p.A. at 31 December 2015, the most recently approved financial statements are presented below. These financial statements have been prepared in accordance with the IFRS highlights ( 000) Income statement Revenue 12,880 Operating profit 8,192 Profit before tax 8,341 Profit for the year 7,965 Statement of financial position Intangible assets - Property, plant and equipment 398 Non-current financial assets 222,626 Total non-current assets 223,024 Current assets 140,170 Prepayments and accrued income 297 Total assets 363,491 Equity 329,169 Provisions for risks and charges 959 Post-employment benefits - Liabilities 33,363 Total liabilities 363,491 Salini Costruttori S.p.A. did not have any employees at 31 December Events after the reporting date 397 million contract awarded for the first lot of the high speed/capacity Naples-Bari railway section On 2 March 2017, the Salini Impregilo-Astaldi joint venture was awarded the contract worth 397 million to design and build the Naples-Cancello segment of the high speed/capacity Naples-Bari section. The works will be performed by Salini Impregilo (lead contractor, 60% share) and Astaldi (40%). The contract signing will take place once the necessary checks required by the tender procedure to ensure that the two joint venturers meet the relevant participation requirements have been completed. 426 Annual Report as at 31 December 2016
428 Separate financial statements as at and for the year ended 31 December 2016 The contract was commissioned by ITALFERR S.p.A. and is to be completed by It covers the first segment of the Naples-Bari section and is a fundamental part of the overall restructuring of the entire railway line. Cociv On 6 March 2017, the Rome prefecture ordered the extraordinary administration of this consortium pursuant to article 32.1.b of Law decree no. 90 of 24 June 2014, converted with amendments by Law no. 114 of 11 August It appointed an extraordinary commissioner for a six-month period which may be extended. 36. Significant non-recurring events and transactions Apart from the acquisition of Lane and completion of the sale of Todini Costruzioni, as described earlier, the company s financial position, performance and cash flows were not affected by significant non-recurring events and transactions in Balances or transactions arising from atypical and/or unusual transactions During the year, Salini Impregilo did not carry out any atypical and/or unusual transactions, as defined in the above Consob communication no. DEM/ Atypical and/or unusual transactions are those that, due to their significance and relevance, the counterparty, the object of the transaction, exchange pricing and timing, may cast doubts as to the accuracy and completeness of disclosures, conflicts of interest, protection of the company s assets and non-controlling interests. 427 Annual Report as at 31 December 2016

429 Proposal to the shareholders of Salini Impregilo S.p.A.
430 Proposal to the shareholders Dear shareholders, The separate financial statements of Salini Impregilo S.p.A. at 31 December 2016, prepared for your approval, show a profit for the year of 64,603,085.24, which we propose be allocated as follows: 3,230,154.26, equal to 5% of the profit for the year, to the legal reserve; 25,920, gross as a dividend to the holders of ordinary shares, gross of the legal withholdings for each existing share having dividend rights and, therefore, excluding the 3,104,377 own shares held by the parent, equal to per share; 420, gross as a dividend to the holders of savings shares, gross of the legal withholdings, equal to 0.26 per share, as per article 33.b) of the by-laws; 35,032, to be carried forward. In view of the calendar approved by Borsa Italiana S.p.A., we propose that the aforementioned dividends be distributed on 24 May 2017, with an ex-dividend date of 22 May 2017 (record date of 23 May 2017). On behalf of the board of directors Chairman Alberto Giovannini (Signed on the original) 429 Annual Report as at 31 December 2016

431

432 Separate financial statements of Salini Impregilo Intragroup transactions
433 Intragroup transactions Assets and liabilities at 31 December 2016 Trade receivables Non-current financial assets Current financial assets Other current assets Total assets A1F Tuszyn-Pyrzowice 6,057, ,057,662 Adiyan Water Treatment Plant 387,150-40, ,364 Aegek - Impregilo - Alstom J.V Agua AZ 29, ,529 Agua BA 21, ,805 Alia 9, , ,720 Ancipa S.c.r.l. 27, ,909 Angostura 29, ,924 Ariguani 3,975, ,307-4,283,641 Aurelia 98 S.c.r.l Autostrada Al Torun - Strykow , ,596 Barnard ,676,973 1,676,973 Bocoge Carvalho Pinto Castelli CAVET 297,449-3,254,177-3,551,626 CAVTOMI 74,196, ,196,635 CE.S.I.F. S.c.p.A CFT , ,128 Cigla , ,146 CIV 68, ,143 CMT IS 4,484, ,484,421 Co.Ge.Fin S.r.l. 75,325-15,371,462-15,446,787 Co.Ge.Ma , ,055 COCIV 139,650,128-9, ,659,161 Con.Sal. S.c.n.c. in liquidation Congr CONS. OHL 3,729, ,729,894 Consorcio Cigla-Sade 162,227-1,530,340-1,692,567 Consorcio Contuy Medio 4, , ,417 Consorcio Grupo Contuy-Proyectos y Ob. De F Consorcio OIV-TOCOMA 398, ,990, ,389,405 Consorcio Serra do Mar Consorcio V.S.T. Tocoma - - 1,880-1,880 Consorcio VIT Tocoma - - 3,432,718-3,432,718 Consorzio 201 Quintai 3, ,800 Consorzio Casertano Annual Report as at 31 December 2016
434 Intragroup transactions Trade payables Bank and other loans Current portion of bank loans and current account facilities Other current liabilities Total liabilities Net balance 7,472,253-13,377,775-20,850,028 (14,792,366) , (746) 13, ,234 16,295 32, ,363 (10,558) , , , ,435 (272,511) 3, ,637 4,280,004 16, ,121 (16,121) , ,676, ,280,694-2,280,694 (2,280,694) ,757 7,757 (7,757) ,617-51,617 (51,617) 641, ,151 2,910,475 14,821,925-8,215,900-23,037,825 51,158,810 23, ,482 (23,482) , , ,328,659-3,328,659 (3,260,516) ,813, ,813,875 (131,329,454) ,446,787 1,295, ,295,364 (924,309) 185,489, ,489,958 (45,830,797) , ,277 (109,277) - - 6,462-6,462 (6,462) 161, ,390 3,568, ,692, , , ,648 (173,648) ,219,874 1,219, ,169, , ,069 (400,069) , ,432, , Annual Report as at 31 December 2016
435 Intragroup transactions Assets and liabilities at 31 December 2016 Trade receivables Non-current financial assets Current financial assets Other current assets Total assets Consorzio Costral in liquidation 82, ,975 Consorzio Costruttori TEEM Consorzio EPC 854, ,330-1,196,333 Consorzio Iricav Due 3,359, ,359,599 Consorzio MM4 431, ,965 Consorzio NOG.MA Consorzio Pedelombarda 2 477, ,369 Consorzio San Cristoforo Consorzio TAT-Tunnel Alp Transit Ticino 44, , ,674 1,179,754 Consorzio TRA.DE.CI.V. 115, ,977 Consorzio VIT Caroni Tocoma Constr. of Inn. Sout. Expre. (ISEX) 62,450-10,941-73,391 Constructora Mazar Impregilo-Herdoiza Crespo , ,284 Corav Corso del Popolo 81, ,050 Corso del Popolo Engineering 694,962-1,029,250-1,724,212 CSC 38, ,800 Dev. Engin. infras. to Idu ind. area and Kar res. dist. Ab ,837-25,352 Diga Ancipa S.c.r.l. 8, ,264 District 1 Development 251,020-6, ,915 Donati 215, ,258 E.R. Impregilo/Dumez y Asociados para Yaciretê 15,557,343-7,403,847-22,961,190 Eurolink S.c.p.A. 10,418, ,418,747 Eurotech ,778-28,778 Executive J.V. Impregilo S.p.A. Terna S.A ,311-8,311 Fibe 1,412,693-14,925,039-16,337,732 Fisia - Alkatas J.V. 7, ,217 Fisia Ambiente S.p.A. 1,779, ,779,389 FISIA Italimpianti S.p.A. 406, ,496 G. W. Trans. to Fed. Cap. Ter. Lot A Dam and Aa. W. 623,568-33, ,188 G.T.B. S.c.r.l. 309, ,117 Galfar Salimp Cimolai JV 4,066, ,822,754 7,889,188 Galileo S.c.a.r.l. 52, ,040 Gaziantep Hastanesi Isletme Ve Bakim Hizmetleri - - 2,279-2,279 Gestione Napoli ,520-17,520 Grecia ,544-81,544 Group. d'entreprises Salini Strabag (Guinea) , ,953 Grupo Empresas Italianas - GEI , , Annual Report as at 31 December 2016
436 Intragroup transactions Trade payables Bank and other loans Current portion of bank loans and current account facilities Other current liabilities Total liabilities Net balance , , , ,481 17,469, ,469,111 (14,109,512) 872, ,041 (440,076) 57, ,428 (57,428) 270, , ,873 35, ,609 (35,609) ,135,559 1,135,559 44,195 69, ,689 46, ,359,475-1,359,475 (1,359,475) , , , ,236 (138,236) , ,724,212 23, ,190 15, , , , ,966-7, ,620 26,638 50, ,476,360 9,527,260 13,433,930 16,476, ,476,682 (6,057,935) , , ,337, ,217 24,016-9,756,403-9,780,419 (8,001,030) 6,661-10,929,302-10,935,963 (10,529,467) 742, ,218 (85,030) 95, , , , ,979 7,768, , , , , , , Annual Report as at 31 December 2016
437 Intragroup transactions Assets and liabilities at 31 December 2016 Trade receivables Non-current financial assets Current financial assets Other current assets Total assets GUPC 38,403, ,403,890 HCE Italia Altre , ,421 HCE Sede 2,766, ,511, ,278,138 Healy 275,492-1,082,432-1,357,924 Impregilo International Infrastructures N.V. 102, ,858 ICT II 3,530, ,530,872 IGL Arabia 436, ,220 IGL Sas 604, ,095 IGL-SK-Galfar 11,652,159-6,450,486 13,637,325 31,739,970 Iglys Imprefeal Impregilo-Healy UTE 384, ,247 12,098,871 12,730,644 Imprepar 59,851-4,817,633-4,877,484 INC Algeria Incave IS JV 5,752,137-57,733,787-63,485,924 Isarco S.c.r.l. 2,171, ,171,794 Joint Venture Aktor Ate - Impregilo S.p.A. 12, ,063 Joint Venture Aktor S.A. - Impregilo S.p.A Joint Venture Impregilo S.p.A. - Empedos S.A. - Ak 1,498,407-2,108,561-3,606,968 Joint Venture Salini-Acciona (Etiopia) 87, ,152 JV Todini - Akkord - Salini 6,859,726-7,656,944-14,516,670 JV_IGL_SGF 1,227,313-8,055,536-9,282,849 KAYI - Salini - Samsung - JV 1,241, ,410-1,556,445 La Quado S.c.a.r.l. 50, , ,684 Lambro S.c.r.l. 173, ,617 Lane Construction Corporation , ,443 Lane Industries Incorporated 938, ,925 Librino 3, ,615 Libyan LEC 944,053-31, ,289 Lidco 491, ,376 Line 3 Metro Stations 82, , ,794 M.N. 6 S.c.r.l. 455, ,204 Metro 6 1,900-33,245,239-33,247,139 Metro B S.r.l Metro B1 6,899,399-3,276,545-10,175,944 Metro Blu 10,375, ,375,856 Metrogenova S.c.r.l. 33, , Annual Report as at 31 December 2016
438 Intragroup transactions Trade payables Bank and other loans Current portion of bank loans and current account facilities Other current liabilities Total liabilities Net balance 584, ,226 37,819, ,168-1, ,253 1,936, ,936, ,341,143 17,498,263-2,049,141-19,547,404 (18,189,480) ,671, ,671,445 (122,568,587) 350, , ,732 2,543, , ,224 (398,004) ,095 1,852, ,852,739 29,887,231 59,520-9,905-69,425 (68,487) , ,683 1,063,284 11,667, , ,296 4,743, , ,577 (122,577) ,157-29,157 (29,146) ,404,626 7,404,626 56,081,298 3,233, ,233,685 (1,061,891) , ,606, , ,516,670 4, ,850,111 1,854,951 7,427, ,556, ,684 6, , ,562 21, , , , , , , , ,235-14,156,423-14,368,658 (13,877,282) , , , , ,833 (396,629) , ,037 33,048, ,878,000 7,878,000 (7,878,000) 35,474, ,474,773 (25,298,829) 11,368, ,368,197 (992,341) 39, ,814 (6,716) 437 Annual Report as at 31 December 2016
439 Intragroup transactions Assets and liabilities at 31 December 2016 Trade receivables Non-current financial assets Current financial assets Other current assets Total assets Metropolitana di Napoli S.p.A. 189, ,622 Millennium Park 421-1,259-1,680 New Cros 23,958-2,306,758-2,330,716 Nigeria Cultural Centre and Mill. Tower 274, , ,647 Pantano S.c.r.l Passante di Mestre S.c.p.A. 568, ,457 Passante Dorico S.p.A. 191,325-36, ,968 Pedelombarda S.c.p.A. 1,577, ,577,268 Pedemontana Veneta S.p.A. 75, , ,568 Perugia ,851-17,066-90,917 PGH L.t.d. 76,422-4,019,172-4,095,594 Pietrarossa S.c.r.l. 8, ,264 Piscine dello Stadio 25, ,119 Piscine dello Stadio S.c.r.l. 18, ,537 Puentes 10,296, ,296,631 RC Scilla 31,560, ,623-32,301,538 Rimati 40, ,494 Riviera S.c.r.l. 307, ,605 Rivigo 153, ,865 S Leonardo Due - - 1,107-1,107 S Martin 8, ,013 S. Anna Palermo S.c.r.l S.I.MA. GEST 3 S.c.r.l S.Ruffillo S.c.a.r.l S3 - Nowa Sol 28,722, ,722,488 S7 - Checiny 32,319, ,319,398 S8 - Marki - Radzymin 18,342, ,342,506 SA_RC 85,932, ,932,616 Sabrom 101, ,543 Salimp Cleveland 499,829-4,288,243-4,788,072 Salini Australia 135,872-3,997,022-4,132,894 Salini Bulgaria 29, ,926 Salini Bulgaria AD , ,664 Salini Impregilo - NRW Joint Venture 869, ,499 Salini Impregilo - Salini Insaat - NTF J.V - Branch 2,992,625-26,554,000-29,546,625 Salini India Private 518, ,117 Salini Ins.Taah.San.Ve Tik. Anonim Sirketi , ,510 Salini Kolin Cgf Joint Venture , , Annual Report as at 31 December 2016
440 Intragroup transactions Trade payables Bank and other loans Current portion of bank loans and current account facilities Other current liabilities Total liabilities Net balance 69, , , ,680 53, ,338 2,277, ,647 1, ,001 (1,001) 65, , , ,968 68, ,114 1,509, , ,917 11, ,917 4,083, , , , ,296,631 52,501, ,501,940 (20,200,402) 246, ,674 (206,180) 640, ,417 (332,812) , , ,013 79,816-40, ,320 (120,320) 162, ,355 (162,355) 17,783, ,783,747 (17,783,747) 28,474, ,474, ,749 36,719, ,719,837 (4,400,439) 22,172,863-7,029,000-29,201,863 (10,859,357) 104,351, ,351,576 (18,418,960) , ,855 (150,312) ,497-70,497 4,717, ,132, , , ,012,466-25,012,466 (24,142,967) ,546, , , , Annual Report as at 31 December 2016
441 Intragroup transactions Assets and liabilities at 31 December 2016 Trade receivables Non-current financial assets Current financial assets Other current assets Total assets Salini Malaysia Head Office 2,110,814-3,548,125-5,658,939 Salini Namibia 15,514,187-17,690,269-33,204,456 Salini Nigeria L.t.d. 11,903,324-38,792,336-50,695,660 Salini Polska Sp. 1,104, ,104,667 Salini Saudi Arabia Company L.t.d. 16,014-1,077,695-1,093,709 Salini-Impregilo US Holdings Inc 8,886, ,886,840 San Giorgio Caltagirone S.c.r.l. 5, ,165 Sapin Sarmento S.c.r.l. 4, , ,820 Scilla Sclafani S.c.r.l. 5, ,164 SFI leasing SGF INC 51,087-8,676,660-8,727,747 SHIMMICK 136, ,202,232 7,338,824 Sipem , ,532 Sirjo S.c.p.A. 1,799, ,799,299 Sistranyac S.A SNFCC 1,146, ,529,905 7,676,672 SO.C.E.T. Società Costruttori Edili Toscani Società di progetto consortile per azioni M4 455, ,730 SPV Linea M4 S.p.A. 250,431-4,325,458-4,575,889 Stazione Tribunale Suleja Minna Dualisation 26,402-12,447-38,849 Suropca Techint S.A.C.I.- Hochtief A.G.- Impregilo S.p.A ,400 9,372,415 9,382,815 Thessaloniki Metro Thessaloniki Metro CW 2,048, ,079 2,466,605 Todini Filiale Dubai 8,540, ,540,415 Todini Filiale Tunisia 32, ,121 Tokwe Mukorsi Dam 67,280, ,280,550 Torre 19, ,860 Trincerone Ferroviario - - 4,255-4,255 Ucraina Kiev-chop 76, ,124 VE.CO. S.c.r.l Vegas 1,408, ,781 1,537,934 Vittoria 3, ,615 Western Station JV 247, ,613 8,727,211 9,190,524 Yarull 4, ,860,159 1,864,550 Yuma 336, ,748 Total group companies 711,827, ,136,390 67,339,231 1,368,303, Annual Report as at 31 December 2016
442 Intragroup transactions Trade payables Bank and other loans Current portion of bank loans and current account facilities Other current liabilities Total liabilities Net balance 498, ,000 5,160, ,204, ,695, ,586-5, , , ,668-26,469,733-27,120,401 (26,026,692) , ,464 8,341, , ,755-8,755 (8,755) ,820 3,706, ,706,028 (3,706,028) , , ,990 (341,990) 239, ,713 8,488,034 3,741, ,741,871 3,596, ,532 11,069, ,069,001 (9,269,702) ,676, , ,287 (106,287) 46, , , ,575, , ,662 (175,662) , , ,849 (834,849) ,382, (619) 2,922-2,557,025-2,559,947 (93,342) ,540, ,121 13,219,201-52,046,455-65,265,656 2,014,894 5,239, ,239,574 (5,219,714) , , , ,527 (138,527) ,537, ,615 54,188, ,188,738 (44,998,214) 10, , ,369 1,635, , ,947, ,430,573 29,970,258 1,150,348, ,955, Annual Report as at 31 December 2016
443 Intragroup transactions Assets and liabilities at 31 December 2016 Trade receivables Non-current financial assets Current financial assets Other current assets Total assets C. Tiburtino 26, ,610 Casada S.r.l. 35, ,595 CEDIV S.p.A. 671, ,516 Dirlan 102, ,781 G.A.B.I.RE. S.r.l. 67, ,448 Galla Placidia 22, ,876 Imm. Agricola San Vittorino 65, ,031 Infernetto S.r.l. 13, ,455 Iniziative Immobiliari 16, ,693 Madonna dei Monti S.r.l. 3, ,283 Nores 30, ,227 Plus 185, ,502 Salini Costruttori 30,690-4,971,474-5,002,164 SALINI SIMONPIETRO & C. S.A.P.A. 39, ,511 Zeis 11, , ,063 Total other related parties 1,323,081-5,892,674-7,215,755 Total 713,151, ,029,064 67,339,231 1,375,519, Annual Report as at 31 December 2016
444 Intragroup transactions Trade payables Bank and other loans Current portion of bank loans and current account facilities Other current liabilities Total liabilities Net balance , , , , , , , , , ,754 (240,061) 39, ,440 (36,157) , , ,002, , , , ,194 6,919, ,243, ,430,573 29,970,258 1,150,644, ,874, Annual Report as at 31 December 2016
445 Intragroup transactions Revenue and costs for 2016 Revenue Other revenue and income Purchases A1F Tuszyn-Pyrzowice - 399,707 - Adiyan Water Treatment Plant Aegek - Impregilo - Alstom J.V. 1, Agua Azul 275,067 9,500 - Agua BA - 330,070 - Alia - 1,808 - Ancipa S.c.r.l. - 14,737 - Angostura 24,118 16,419 - ANM - 314,335 - Ariguani 2,806,204 80,104 - Barnard 675, Bocoge 54,153 2,803 - Carvalho Pinto 793, Castelli CAVET 19, ,648 - CAVTOMI 104,695 89,639 - CE.S.I.F. S.c.p.A CFT Cigla CIV 56,200 11,943 - Civil Work - 5,898,164 - CMC-MAVUNDLA-IGL JV - 1,159,192 - CMT IS 4,352,907 1,540,141 - Co.Ge.Fin S.r.l. 10,887 2,897 - Co.Ge.Ma. 249, ,378 - COCIV 412,041 1,930,269 - COMAR Congr CONS. OHL 1,019,932 42,184 - Consorcio Cigla-Sade Consorcio Contuy Medio 594 1,981 - Consorcio Grupo Contuy-Proyectos y Ob. De F. 43, Consorcio OIV-TOCOMA 444,231 3,800 - Consorcio Serra do Mar Consorcio VIT Tocoma 321, Consorzio 201 Quintai - 3,800 - Consorzio Costral in liquidation 6,400 2,897 - Consorzio Costruttori TEEM Annual Report as at 31 December 2016
446 Intragroup transactions Subcontracts Services Personnel expense Other operating expenses Amortisation, depreciation, provisions and impairment losses Financial income Financial expense - 7,020, , , , , , , , , , , , ,552, , , ,534 50, , ,919 8, ,229-5, , , , , ,570, ,555 25, ,024, , , , ,090, , , , Annual Report as at 31 December 2016
447 Intragroup transactions Revenue and costs for 2016 Revenue Other revenue and income Purchases Consorzio EPC 32,581, ,924 - Consorzio FAT 5,397 2,173 - Consorzio Iricav Due - 123,575 - Consorzio MM4 80, ,990 - Consorzio NOG.MA Consorzio Pedelombarda 2-3,800 - Consorzio VIT Caroni Tocoma Constr. of Inn. Sout. Expre. (ISEX) Corav Corso del Popolo 20,545 2,897 - Corso del Popolo Engineering 13,808 2,897 - CSC - 38,800 - Diga Ancipa S.c.r.l. - 4,132 - District 1 Development Donati E.R. Impregilo/Dumez y Asociados para Yaciretê Eurolink S.c.p.A. 57, ,289 - Eurotech Fibe 74, ,926 - Fisia - Alkatas J.V. - 7,217 - Fisia Ambiente S.p.A. 29,184 2,878 - FISIA Italimpianti S.p.A. 188, ,101 - G. W. Trans. to Fed. Cap. Ter. Lot A Dam and Aa. W. 2,639 7,296 - G.T.B. S.c.r.l. - 9,414 - Galfar Salimp Cimolai JV - 4,750,610 - Galileo S.c.a.r.l. 7,098 2,897 - Ghazi JV - 9,608 - Grupo Empresas Italianas - GEI 278, GUPC 5,560, ,743 80,616 HCE Italia Altre - 106,331 - HCE Sede 3,365, ,656 - Healy 271, , I INT IN - 531,119 - ICT II 806,106 98,076 - IGL Arabia ,789 - IGL Sas 604, IGL-SK-Galfar 4,373,684 13,578,596 - Iglys Annual Report as at 31 December 2016
448 Intragroup transactions Subcontracts Services Personnel expense Other operating expenses Amortisation, depreciation, provisions and impairment losses Financial income Financial expense - 1,292, ,269-12, ,686, , , , ,368, , , , , ,170, , , , , ,798-1, ,377-5, , ,100 18, , ,299, ,331,010 45,137-89,400 12, , ,485,316 1,863,234 1,850-21, , ,746, , , , Annual Report as at 31 December 2016
449 Intragroup transactions Revenue and costs for 2016 Revenue Other revenue and income Purchases Impregilo-Healy UTE 1,695,300 51,200 - Imprepar 196, ,867 - Incave IS JV 698,056 9,209,831 - Isarco S.c.r.l. 93, ,391 - Joint Venture Salini-Acciona (Etiopia) JV Todini - Kutaisi JV Todini - Akkord - Salini KAYI - Salini - Samsung - JV - 686,521 - La Quado S.c.a.r.l. 40,192 1,315 - Lambro S.c.r.l Lane Construction Corporation Lane Industries Incorporated 938, Librino - 1,808 - Libyan LEC 135,200 2,800 - Lidco 648 5,900 - Line 3 Metro Stations Metro 6-5,700 - Metro B1-213,066 - Metro Blu 45, ,637 - Metrogenova S.c.r.l. 19, Metropolitana di Napoli S.p.A Millennium Park - 5,950 - New Cros - 20,758 - Nigeria Cultural Centre and Mill. Tower Passante di Mestre S.c.p.A. 3,500 11,451 - Passante Dorico S.p.A ,737 - Pedelombarda S.c.p.A. 50, ,460 - Perugia 219 7,147 2,897 - PGH L.t.d. - 3,403 - Pietrarossa S.c.r.l. - 4,132 - Piscine dello Stadio 17,692 2,897 - Piscine Dello Stadio S.c.a.r.l. - 21,183 - Piscine dello Stadio S.c.r.l. 12,297 2,897 - Puentes - 172,730 - RC Scilla 28, ,568 - Rimati Risalto S.r.l. 4, Annual Report as at 31 December 2016
450 Intragroup transactions Subcontracts Services Personnel expense Other operating expenses Amortisation, depreciation, provisions and impairment losses Financial income Financial expense , , ,284, , (3,091) , , , , , , , ,804, ,954 35,279-45,272, , , , ,849, , ,067, , Annual Report as at 31 December 2016
451 Intragroup transactions Revenue and costs for 2016 Revenue Other revenue and income Purchases Riviera S.c.r.l Rivigo - 12,469 - S Leonardo Due S Leonar - 5,165 - S.Ruffillo S.c.a.r.l S3 - Nowa Sol - 668,936 - S7 - Checiny - 1,283,115 - S8 - Marki - Radzymin - 555,537 - Sa.Co.Lav. S.c.a r.l. 5, SA_RC 28, ,037 - Sabrom 47,662 42,603 - Salimp Cleveland 481,950 97,461 - Salini Australia - 20,838 - Salini Bulgaria Salini Bulgaria AD Salini Impregilo - NRW Joint Venture - 7,251,688 - Salini Impregilo - Salini Insaat - NTF J.V - Branch - 1,074,636 - Salini Ins.Taah.San.Ve Tik. Anonim Sirketi Salini Kolin Cgf Joint Venture - 252,000 - Salini Malaysia Head Office 1,916, ,874 67,746 Salini Namibia 2,952,685 2,645,069 - Salini Nigeria L.t.d. 4,835,451 57,879 - Salini Polska Sp. 1,109,757 24,970 - Salini Saudi Arabia Company L.t.d ,803 - SAMA S.c.a.r.l. in liquidation 5, San Giorgio Caltagirone S.c.r.l. - 2,582 - SARGE TP - 111,316 - Sarmento S.c.r.l Scilla Sclafani S.c.r.l. - 2,582 - SFI leasing 2,238, SGF INC 267, ,135 - SGF-FL VEN SHIMMICK 45,898, Sirjo S.c.p.A ,703 - SNFCC 1,424,245 41,500 - Società di progetto consortile per azioni M4 30,000 4,306 - South Al Mutlaa Joint Venture - 885, Annual Report as at 31 December 2016
452 Intragroup transactions Subcontracts Services Personnel expense Other operating expenses Amortisation, depreciation, provisions and impairment losses Financial income Financial expense - 143, , , ,900, ,777, ,297, , ,009, , ,762 42, , , , , , , , , , , , , ,383, , , ,449 22, , , , , , ,342, , , ,330, ,127, Annual Report as at 31 December 2016
453 Intragroup transactions Revenue and costs for 2016 Revenue Other revenue and income Purchases SPV Linea M4 SpA ,863 - Stazione Tribunale Suleja Minna Dualisation Suropca TB Metro in liquidation 7,737 2,897 - Techint S.A.C.I.- Hochtief A.G.- Impregilo S.p.A 9,066, Thessaloniki Metro CW 66,596, Tokwe Mukorsi Dam 6,116, , ,619 Torre Trincerone Ferroviario Vegas 1,408, Vittoria - 1,808 - Western Station JV - 1,052,694 - Yarull 184 8,589 - Yuma 336, Total ICP Branch 208,752,328 64,248, ,094 C. Tiburtino 17, Casada S.r.l. 16, CEDIV S.p.A. 17, Dirlan 23, G.A.B.I.RE. S.r.l. 19, Galla Placidia 17, Imm. Agricola San Vittorino 16, Infernetto S.r.l. 6, Iniziative Immobiliari Madonna dei Monti S.r.l. 9,816 1,234 - Nores 6, Plus 28, Salini Costruttori 137,923 8,529 - SALINI SIMONPIETRO & C. S.A.P.A. 14, Zeis 155,264 98,345 - Total other related parties 487, ,352 - Total 209,240,061 64,364, , Annual Report as at 31 December 2016
454 Intragroup transactions Subcontracts Services Personnel expense Other operating expenses Amortisation, depreciation, provisions and impairment losses Financial income Financial expense , , , ,703 25, , ,438, ,386-3, ,179, ,704, ,187,485 2,717,230 1,028, ,682 16,937,355 5,463, , ,007, , , , , , ,642-1,610-27, ,461,908-3, ,193 2,821 78,704, ,649,393 2,717,230 1,031, ,682 17,067,548 5,466, Annual Report as at 31 December 2016
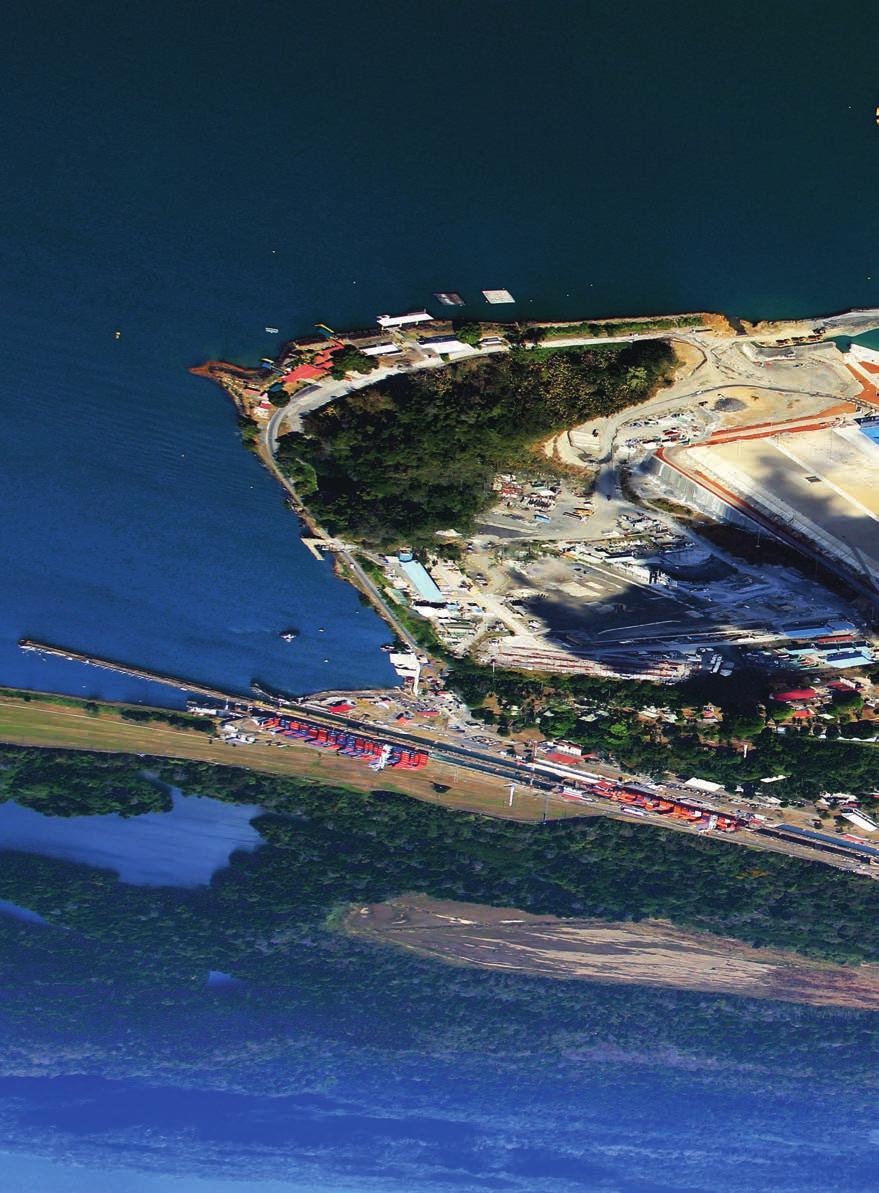
455

456 Separate financial statements of Salini Impregilo Equity investments
457 Equity investments Equity investments at 31 December Salini Impregilo S.p.A. Name Investment % Registered office Amount Salini Impregilo S.p.A. 01/01/2016 ( ) Subsidiaries, associates and jointly controlled entities Agba - Aguas Gran B Aires Sa in liq (Argentina) Milan - Arriyadh New Mobility Consortium (Arabia) Saudi Arabia - Cao - Consorcio Acueducto Oriental (Rep Dominicana) Santo Domingo - Carvalho Pinto Consorzio Brazil - Caserma Donati Consorzio Milan 240,000 Cavet Consorzio Pianoro 4,113,464 CavToMi Consorzio Milan 3,688,621 CCT Consorzio Costruttori TEEM Milan - Cesif S.c.p.A. in liq Cavriago 63,460 Cigla Constructora Sa (Brasile) Sao Paulo 738,778 Civ S.p.A Milan 18,040,477 Civil Works Jv (Arabia) Saudi Arabia - Cociv Consorzio Genoa 330,532 Coincar Sa (Argentina) Argentina - Conai Consorzio Nazionale Imballaggi Milan 5 Consi Consorzio Pordenone 516 Consorzio EPC Italy - Constructora Ariguani Sas (Colombia) Colombia 19,849 Constructora Mazar Consorcio (Ecuador) Ecuador - Contuy Ferrocarriles Consorcio (Venezuela) Venezuela - Contuy Medio Consorcio (Venezuela) Venezuela - Corav Consorzio Milan 51,563 Empresa Constructora Metro 6 L.t.d.a. (Cile) Chile - Eriday Ute (Impregilo - Dumez) (Argentina) Argentina - Eurolink S.c.p.A Rome 16,875,000 Gestione Napoli S.r.l. in liq Genoa - Ghazi Barotha Contractors Jv (Pakistan) Pakistan - Grupo ICT Sas Colombia - GTB S.c.a.r.l Naples 5 Impregilo Civilcad Ingco (Rep Dominicana) Dom. Republic - Impregilo Rizzani de Eccher Jv (Svizzera) Switzerland - Impregilo Yarul Consorcio (Rep Dominicana) Dom. Republic Annual Report as at 31 December 2016
458 Equity investments Increases in the year N Decreases in the year N Amount Salini Impregilo S.p.A. 31/12/2016 ( ) Share of carrying amount Diff. between investment, net of uncalled-up share/quota capital, and equity Date of equity 56,358 O - 56,358 - (56,358) /12/ /12/ , ,600 12,600 31/12/2016 6,941 O (10,374) N 4,110,030 4,110, /12/ ,793 O (11,877) N 3,723,537 3,722,623 (914) 31/12/ ,460 - (63,460) (738,778) C - - (456,610) (456,610) 31/12/2016 (5,100,000) E - 12,940,477 13,157, ,304 31/12/ ,697,226 9,697,226 31/12/ , ,532-31/12/ (5) - (516) I - - (5) ,002 E - 34,851 2,093, ,058, /12/ , ,284 31/12/ ,563 49, (1,983.56) 31/12/ ,745,945 25,745,945 31/12/ ,875,000 16,875,000-31/12/ (10,700) (10,700) 31/12/ ,872,273 1,872,273 31/12/2016 3,216,178 O,C (2,226,238) N 989,940 3,594,009 2,604,069 31/12/ (5) 100 A ,302,112 1,302,112 31/12/ Annual Report as at 31 December 2016
459 Equity investments Equity investments at 31 December Salini Impregilo S.p.A. Name Investment % Registered office Amount Salini Impregilo S.p.A. 01/01/2016 ( ) Subsidiaries, associates and jointly controlled entities Impresit Bakolori Plc (Nigeria) Nigeria - Iricav Due Consorzio Rome 175,566 Isarco S.c.a.r.l Bressanone 41,000 JV Salini - Secol Romania La Quado S.c.a.r.l Milan 3,500 Lambro S.c.a.r.l Milan 20 LEC Libyan Expressway Contractors Consorzio Milan 5,800 Markland S.r.l. in liq Milan 1,269 Metroblu S.c.a.r.l Milan - Metro de Lima Linea 2 Sa (Perù) Peru 18,481,628 Metro Riyadh Line Saudi Arabia - Metrogenova S.c.a.r.l Genoa 8,257 Miteco Consorzio Castelnovo (RE) 4,416 MM4 Consorzio Milan 62,100 MN - Metropolitana di Napoli S.p.A Naples 313,652 MN 6 S.c.a.r.l Naples 510 Nogma Consorzio Venice 84,000 Normetro Ace (Portogallo) Portugal - Normetro Consorcio (Portogallo) Portugal - Passante di Mestre S.c.p.A Venice 4,200,000 Passante Dorico S.p.A Milan 2,820,000 Pedelombarda 2 Consorzio (CP2) Milan 4,000 Pedelombarda S.c.p.A Milan 9,400,000 Pedemontana Veneta S.p.A. in liq Verona 1,280,700 PGH L.t.d. (Nigeria) Nigeria 2,082,611 Puentes del Litoral Sa in concorso prev (Argentina) Argentina - Reggio Calabria Scilla S.c.p.A Rome 17,850,000 Riviera S.c.a.r.l Naples 6,470 S8 Jv (Polonia) Poland - S3 Jv (Polonia) Poland - Sabrom - Soc Autostrada Broni Mortara S.p.A Milan 17,342,000 Salerno Reggio Calabria S.c.p.A Rome 25,500,000 Salini Australia Pty L.t.d. (Australia) Australia 2,820,463 Salini Impregilo Duha Jv (Slovacchia) Slovakia - Salini - Impregilo Joint Venture for Mukorsi Zimbabwe - Salini Insaat Ntf Jv (Turchia) Turkey - Salini Namibia Proprietary L.t.d. (Namibia) Namibia 358 Sant'Anna Palermo S.c.a.r.l. in liq Palermo 18,592 Scilla Consorzio in liq Palmi Annual Report as at 31 December 2016
460 Equity investments Increases in the year N Decreases in the year N Amount Salini Impregilo S.p.A. 31/12/2016 ( ) Share of carrying amount Diff. between investment, net of uncalled-up share/quota capital, and equity Date of equity , , /12/ ,000 41,000-31/12/ ,500 3,500-31/12/ (20) - - 5,800 5,800-31/12/ ,269 - (1,269) ,340 45,340 31/12/ ,481,628 - (18,481,628) ,257 9, /12/ (4,416) I /06/2016 2,170 E - 64,270 64,260 (10) 31/12/ ,652 1,664,660 1,351,008 31/12/ (510) ,000 - (84,000) ,200,000 4,200,000-31/12/ ,820,000 11,255,288 8,435,288 31/12/ ,000 4,000-31/12/ ,400,000 9,400,000-31/12/ (42,648) N 1,238,052 1,279,036 40,984 31/12/ (1,799,883) N 282, ,728-31/12/ ,850,000 17,850,000-31/12/ ,470 - (6,470) ,342,000 16,277,493 (1,064,507) 31/12/ ,500,000 25,500,000-31/12/2015 (2,820,463) C - - 9,249,797 9,249,797 31/12/ ,434,872 4,434,514 31/12/ ,592 - (18,592) /12/ Annual Report as at 31 December 2016
461 Equity investments Equity investments at 31 December Salini Impregilo S.p.A. Name Investment % Registered office Amount Salini Impregilo S.p.A. 01/01/2016 ( ) Subsidiaries, associates and jointly controlled entities Sima Gest 3 S.c.a.r.l. in liq Zola Pedrosa 5 Sipem - Soc Ind Prefabbr Edilizia Medit S.r.l. in liq Assoro - Sirjo S.c.p.A Rome 3,000,000 SP M4 - Soc di Progetto M4 S.c.p.A Milan 104,040 SPV Linea M4 S.p.A Milan 9,941,200 Stazione Tribunale Italy 8,600 Salini Impregilo Bin Omran Jv Qatar - South Al Mutlaa J.V Kuwait TAT - Tunnel Alp Transit Consorzio (Svizzera) Switzerland - TE - Tangenziale Esterna S.p.A. (ex STP) Milan 100 TM Salini Consortium Todini Impregilo Almaty Khorgos Jv (Kazakistan) Kazakhstan - Torre Consorzio Milan 4,730,000 Tradeciv Consorzio Naples 12,533 Transmetro Ace (Portogallo) Portugal - Impregilo Healy Parsons Jv Argentina - Veco S.c.a.r.l Venice 2,582 Yuma Concesionaria Sa (Colombia) Colombia 6,351,551 Western Station J.V, Saudi Arabia Metro B S.r.l Rome 10,504,000 Metro B1 S.c.a.r.l Rome 1,952,940 RI.MA.TI. S.c.a.r.l Rome 699,420 Copenaghen Metro Team I/S Denmark 16,922,452 Salini Insaat Taahhut Sanayi Ve Ticaret Anonim Sirketi Turkey 872,608 Salini Impregilo - Salini Insaat - NTF J.V - Legal Turkey - Salini Impregilo - NRW Joint Venture Australia Salini-Kolin-GCF Joint Venture Turkey - Todini Akkord Salini Ukraine 2,054,820 Forum S.c.r.l. (in liq.) Rome 10,329 Risalto S.r.l. (in liq.) Rome 77,463 Variante di Valico S.c.r.l. (in liq.) Rome 32,828 Compagnia Gestione Finanziarie - Co.Ge.Fin S.r.l Rome 14,850,505 San Ruffillo S.c.a.r.l Rome 21,000 Gaziantep Hastane Sanglik Hizmetleri Isletme Yatrim Joint Stock Company Turkey 3,644,991 Gaziantep Hastanesi Isletme Ve Bakim Hizmetleri Turkey - Salini Acciona Joint Venture Ethiopia 9,430 Salini Strabag Joint Ventures Guinea - Grupo Unidos Por El Canal S.A Panama 22,800,664 I.S.V.E.U.R. S.p.A Rome 34,086 Pantano S.c.r.l Rome 4,338 Equity investments - SPEs 245,312, Annual Report as at 31 December 2016
462 Equity investments Increases in the year N Decreases in the year N Amount Salini Impregilo S.p.A. 31/12/2016 ( ) Share of carrying amount Diff. between investment, net of uncalled-up share/quota capital, and equity Date of equity (5) (398,412) (397,308) 31/12/ ,000,000 3,000,000-31/12/ , ,040-31/12/2015 3,504,800 E - 13,446,000 - (13,446,000) - - 8, (100) ,730,000 4,730,000-31/12/ ,533 - (12,533) ,582 - (2,582) - - 6,351,551 9,814,329 3,462,778 31/12/ (1,334,144) N 9,169,856 1,414,241 (7,755,614) 31/12/ ,952,940 1,952,940-31/12/ , ,418 (2) 31/12/ ,922,452 39,439,056 22,516,604 31/12/2016 (872,608) C , ,578 31/12/ ,485,794 2,485,794 31/12/ ,555 1,555 31/12/ (1,045,204) N 1,009,616 1,009,616-31/12/ ,329 10,329-31/12/2016 2,176 I (79,639) I - 31,394 31,394 29/11/ ,828 52,485 19,657 31/12/ ,850,505 12,990,574 (1,859,931) 31/12/ ,000 21,000-31/12/2013 1,883,273 E - 5,528,264 - (5,528,264) 31/12/2014 7,648 A - 7, ,430 - (9,430) ,764,396 E,Q (25,543,743) N 49,021,317 - (49,021,318) ,086 - (34,086) - - 4,338 4,338-31/12/ ,973,987 (32,098,682) 264,187, ,846,667 (2,333,075) 461 Annual Report as at 31 December 2016
463 Equity investments Equity investments at 31 December Salini Impregilo S.p.A. Name Investment % Registered office Amount Salini Impregilo S.p.A. 01/01/2016 ( ) CSC Impresa Costruzioni Sa (ex Magnenat) (Svizzera) Switzerland 25,727,553 Con. Sal S.c.n.c. (in liq.) Italy Emittenti Titoli S.p.A Milan 10,832 Fibe S.p.A. (impegno ripian 100%) Naples 39,840,780 Fisia Italimpianti S.p.A Genoa 40,219,435 Fisia Ambiente S.p.A. (ex Fisia Italimpianti) Genoa 21,580,565 Golf Pordenone S.r.l Pordenone - Healy Company Sa (Chicago) USA 39,998,486 HCE Costruzioni S.p.A Rome HCE Costruzioni Ukraine LLC Ukraine 583,317 Ilim Iniziative Lombarde Immobiliari S.r.l. in liq Milan 3,834,610 Immobiliare Golf Club Castel d'aviano S.p.A Aviano 62,910 Impregilo Arabia L.t.d Saudi Arabia 6,004,779 Impregilo Colombia Sas Colombia 12,094,597 Impregilo International Infrastructures Nv (Olanda) Netherlands 170,000,000 Impregilo Lidco Co Libya 1,785,000 Imprepar - Impregilo Partecipazioni S.p.A Milan 45,941,191 Rimini Fiera S.p.A Rimini 3,193,670 SGF - INC S.p.A Milan 6,600,000 Skiarea Valchiavenna S.p.A Madesimo 99,740 Suropca - Suramericana de Obras Ca (Venezuela) Venezuela 1,311,051 Compagnia Gestione Macchinari CO.GE.MA. S.p.A Rome 2,059,428 SA.CO.LAV. S.c.r.l. (in liq.) Rome 10,329 SA.MA. S.c.a.r.l. (in liq.) Rome 40,904 TB Metro S.r.l. (in liq.) Rome 35,754 Todini Costruzioni Generali S.p.A Rome 8,907,301 Salini Bulgaria A.D Bulgaria - Salini Impregilo - US Holdings Inc USA - Salini Saudi Arabia Company L.t.d Saudi Arabia - Salini Hydro L.t.d Ireland 302,153 Salini Polska L.t.d. Liability Co Poland 2,239,580 Salini Rus L.t.d. Liability Company Russia - Salini India Private L.t.d India - Salini Malaysia SDN BHD Malaysia 610,468 Salini Nigeria L.t.d Nigeria - Equity investments - Other companies 433,094, Annual Report as at 31 December 2016
464 Equity investments Increases in the year N Decreases in the year N Amount Salini Impregilo S.p.A. 31/12/2016 ( ) Share of carrying amount Diff. between investment, net of uncalled-up share/quota capital, and equity Date of equity ,727,553 30,270,991 4,543,438 31/12/ ,832 - (10,832) ,840,780 39,836,398 (4,382) 31/12/ ,219,435 7,167,592 (33,051,843) 31/12/ ,580,565 31,797,565 10,217,000 31/12/ ,528 C - 14,528 - (39,998,486) G - 55,025,252 55,025,252 31/12/ ,317 1,333, ,790 31/12/2014 1,022,130 G (4,856,740) G - 3,910,889 3,910,889 14/04/2016 (14,528) C (30,386) N 17,995 - (17,995) (2,068,611) E,C - 3,936, ,753 (3,795,414) 31/12/ ,094,597 11,804,945 (289,652) 31/12/ ,000, ,915,000 32,915,000 31/12/ ,785, ,774 (944,226) 31/12/ ,941,191 50,920,505 4,979,314 31/12/ (1,629,693) N 1,563,977 3,221,670 1,657,693 31/12/2013 (6,600,000) C - - 1,756,130 1,756,130 31/12/ (1,370) N 98,370 - (98,370) - (383,742) N 927, ,309-31/12/ (1,541,881) N 517,547 1,299, ,403 31/12/ (10,329) I - 13,263 13,263 25/10/ (40,904) I - 58,836 58,836 25/10/ ,754 (762,117) (797,871) 31/12/ ,202,035 O,H (199,109,336) N,H - 23,667,376 23,667,376 31/12/ ,662,593 A - 468,662,593 30,297,941 A,E,O - 30,297,941 - (289,266) N 12, , ,267 31/12/2015 (2,239,580) C - - (338,775) (338,775) 31/12/ (863,996) (863,996) 31/12/ (487,333) (487,333) 31/12/ ,468 26,166,267 25,555,799 31/12/ ,744,805 24,744,805 31/12/ ,276,507 (247,892,134) 864,478, ,669, ,165, Annual Report as at 31 December 2016
465 Equity investments Equity investments at 31 December Salini Impregilo S.p.A. Name Investment % Registered office Amount Salini Impregilo S.p.A. 01/01/2016 ( ) Subsidiaries, associates and jointly controlled entities Abu Dhabi - Tristar Salini Jv Abu Dhabi - Argent - Eriday Ute (Impregilo - Dumez) Argentina - Argent - Impregilo Healy Ute Argentina 678,530 Argent - Impregilo Iglys Techint Ezeiza Ute (Carceles) Argentina 3,944 Australia - IS Jv Australia - Austria - Arge Tulfes Pfons Austria - Brasile - Serra do Mar Consorcio Brazil - Cile - Empresa Angostura L.t.d.a. (valore carico in Sede) Chile 436,890 Cile - Empresa Constructora Lo Saldes L.t.d.a Chile 5,341 Cile - Empresa Constructora Metro 6 L.t.d.a Chile 17,131 Grecia - Aegek Igl Altom Transport Jv Greece - Grecia - Aktor Impregilo Jv (Agios Constantinos) (Strada) Greece - Grecia - Aktor Impregilo Jv (Metropolitana) Greece - Grecia - Executive Impregilo Terna Iris Jv in liq Greece - Grecia - Igl Sgf Jv (ex Empedos - ex Gnomon Tcgc) (Canale/Tunnel) Greece - Grecia - Igl Terna SNFCC Jv (Centro Niarchos) Greece 51,000 Grecia - Impregilo Empedos Aktor Jv Greece - Grecia - Line 3 Metro Stations Jv Greece - Grecia - Terna Impregilo Jv (Tram) Greece - Grecia - Thessaloniki Metro CW Jv Greece - Grecia - Thessaloniki Metro Jv (Aegek) Greece - India - Nathpa Jhakri Jv India - Perù - Consorcio Constructor M2 Lima Peru - Polonia - Al Motorway Tuszyn Pyrzowice Lot F Jv Poland - Polonia - salini Polska Impregilo Todini S7 jv Poland - Polonia - Generalny Wykonawca Salini Impregilo Kobylarnia Jv Poland - Qatar - Impregilo SK Galfar Jv Qatar - Qatar - Galfar Salini Impregilo Cimolai Qatar - Sudafrica - CMC Mavundla Impregilo Jv South Africa - Usa - Barnard Impregilo Healy Jv USA - Usa - Impregilo Healy Parsons Jv USA - Usa - Salini Impregilo Healy Jv USA - Usa - SFI Leasing Company Jv USA - Usa - Shimmick FCC Impregilo Jv USA - Usa - Vegas Tunnel Constructors Jv USA - Venez - Contuy Medio Grupo A Consorcio Venezuela - Venez - GEI Grupo Empresas Italianas Consorcio Venezuela - Venez - OIV Tocoma Consorcio Venezuela Annual Report as at 31 December 2016
466 Equity investments Increases in the year N Decreases in the year N Amount Salini Impregilo S.p.A. 31/12/2016 ( ) Share of carrying amount Diff. between investment, net of uncalled-up share/quota capital, and equity Date of equity (9,060) I 669, , ,063 13/12/ ,944 0 (3,944) ,404,626 7,404,626 31/12/ , ,292 31/12/ /12/ ,890 - (5,341) I - - (436,890) ,131 (17,131) ,850,111 1,850,111 31/12/ ,000 6,579,866 6,528,866 31/12/ , ,480 31/12/ ,637,281 13,637,281 31/12/ ,153,775 32,153,775 31/12/ ,187,662 1,187,662 30/06/ ,066,180 5,066,180 31/12/ , ,990 31/12/ ,202,232 7,202,232 31/12/ ,021,610 1,021,610 30/06/ ,882 38,882 31/12/ Annual Report as at 31 December 2016
467 Equity investments Equity investments at 31 December Salini Impregilo S.p.A. Name Investment % Registered office Amount Salini Impregilo S.p.A. 01/01/2016 ( ) Venez - VIT Caroni Tocoma Consorcio Venezuela - Venez - VIT Tocoma Consorcio Venezuela - Venez - VST Tocoma Consorcio Venezuela - Investments in branches - SPEs 1,192,837 Total 679,599,450 Summary of variations in equity investments Incorporations and subscriptions Acquisitions and increases in investments Transfer Capital increases Capital injections for capital increases Reimbursement of share/quota capital Intragroup sales Sales to third parties Liquidations Reclassifications due to change in investment % or other changes Reversals of impairment losses to the extent of previously recognised impairment losses Impairment losses Reconstitution of share/quota capital to cover losses Revaluations Exchange rate gains (losses) Cancellations due to mergers Reclassifications of equity investments with a negative carrying amount PPA valuation Total A B C D E F G H I L M N O P Q R S T 466 Annual Report as at 31 December 2016
468 Equity investments Increases in the year N Decreases in the year N Amount Salini Impregilo S.p.A. 31/12/2016 ( ) Share of carrying amount Diff. between investment, net of uncalled-up share/quota capital, and equity Date of equity (14,401) 1,178,436 77,702,521 76,524, ,250,494 (280,005,216) 1,129,844, ,218, ,356, ,771, (23,395,413) ,224, ,022,130 (44,855,227) 190,202,035 (199,109,336) 2,176 (359,145) (35,681,509) 10,328, ,094, ,250,493 (280,005,216) 467 Annual Report as at 31 December 2016
469 Equity investments Equity investments at 31 December Salini Impregilo S.p.A. Name Investment % Registered office Amount Salini Impregilo S.p.A. 01/01/2016 ( ) Subsidiaries, associates and jointly controlled entities, consolidated, with negative carrying amount Cigla Constructora Sa (Brasile) Brazil - Empresa Constructora Metro 6 L.t.d.a. (Cile) Chile (8,135,821) Grupo ICT II Sas (Colombia) Colombia (6,750,822) Grupo Unidos por el Canal (Panama) Panama - HCE Costruzioni S.p.A Rome - Impregilo Arabia L.t.d Saudi Arabia Impregilo Colombia Sas Colombia - PGH L.t.d. (Nigeria) Nigeria - Salini Australia Pty L.t.d Australia - Salini Bulgaria A.D Bulgaria (2,299,595) Salini India Private L.t.d India (451,124) Salini Impregilo Insaat Jv Turkey Salini Insaat Taahut Sanayi Ve Ticaret Turkey Salini - Impregilo Joint Venture for Mukorsi Zimbabwe (120,966) Salini Polska L.t.d. Liability Co Poland SGF - INC S.p.A Milan Sipem Soc Ind Pref Edil Medit S.r.l. in liq Italy Risalto S.r.l. (in liq.) Rome - Variante di Valico S.c.r.l. (in liq.) Rome - Con. Sal S.c.n.c. (in liq.) Rome (12,428) ITALSAGI SPZOO Poland (222,489) Total investments in subsidiaries, associates and jointly controlled entities - consolidated, with negative carrying amount (17,993,244) Summary of variations in equity investments Incorporations and subscriptions A Acquisitions and increases in investments B Transfer C Capital increases D Capital injections for capital increases E Reimbursement of share/quota capital F Intragroup sales G Sales to third parties H Liquidation I Reclassifications due to change in investment % or other changes L Reversals of impairment losses to the extent of previously recognised impairment losses M Impairment losses N Reconstitution of share/quota capital to cover losses O Revaluations P Merger Q Cancellations due to mergers R Reclassifications of equity investments with a negative carrying amount S PPA valuation T Total 468 Annual Report as at 31 December 2016
470 Equity investments Increases in the year N Decreases in the year N Amount Salini Impregilo S.p.A. 31/12/2016 ( ) Share of carrying amount Diff. between investment, net of uncalled-up share/quota capital, and equity share Date of equity 738,778 C (1,195,388) N (456,610) - - Transfer to positive - (17,606,749) N (25,742,570) - 6,750,822 C - - (4,276,294) (4,276,294) 31/12/ ,686,743 A,O (28,500,000) N (13,813,257) 3,373,162 C (3,513,915) N (140,753) Transfer to positive Transfer to positive 2,820,463 C (12,070,260) N (9,249,797) 2,198,215 O (7,103) N (108,484) (2,125,048) (700,241) 31/12/ (18,744) N (469,867) (487,333) (17,467) 31/12/ (2,485,794) N (2,485,794) 1,522,608 O,C (1,717,186) N (194,578) - - (120,966) - - 2,239,580 C (2,578,533) N (338,953) 8,800,000 O,C (13,300,000) N (4,500,000) - (179,604) N (179,604) - C ,485 19,657 31/12/ (49,708) N (62,136) - 222, ,489 I ,130,370 (83,000,494) - (57,863,368) (195,667,360) 1,392, ,186, ,395, , (83,222,983) 17,548, ,130,370 (83,000,494) 469 Annual Report as at 31 December 2016

471 Statement on the separate financial statements
472 Statement on the separate financial statements Statement on the separate financial statements pursuant to article 81-ter of Consob regulation no of 14 May 1999 and subsequent amendments and integrations 1 Pietro Salini, as chief executive officer, and Massimo Ferrari, as manager in charge of financial reporting, of Salini Impregilo S.p.A., considering the provisions of article 154-bis.3/4 of Legislative decree no. 58 of 24 February 1998, state: - that the administrative and accounting procedures are adequate given the company s characteristics; and - that they were actually applied during 2016 to prepare the separate financial statements. 2 No significant issues arose. 3 Moreover, they state that: 3.1 The separate financial statements: a) have been prepared in accordance with the applicable International Financial Reporting Standards endorsed by the European Union pursuant to EC Regulation 1606/2002 of the European Parliament and Council of 19 July 2002; b) are consistent with the accounting records and entries; c) are suitable to give a true and fair view of the financial position and results of operations of the Issuer. 3.2 The Directors report includes a reliable analysis of the financial position and results of operations of the Issuer, together with information about the main risks and uncertainties to which it is exposed. Milan, 15 March 2017 Chief executive officer Pietro Salini (Signed on the original) Manager in charge of financial reporting Massimo Ferrari (Signed on the original) 471 Annual Report as at 31 December 2016

473

474 Reports

475 474 Annual Report as at 31 December 2016 Reports

476 Reports 475 Annual Report as at 31 December 2016
477 476 Annual Report as at 31 December 2016 Reports

478 Reports 477 Annual Report as at 31 December 2016
DIRECTORS REPORT PART I
 DIRECTORS REPORT PART I Directors Report Financial highlights 24 ANNUAL REPORT 2017 The following tables show the Group s adjusted key financial indicators for 2017 compared to the previous year. Adjustments
Interim financial report
 (Translation from the Italian original which remains the definitive version) Interim financial report 30 June 2018 This document is available at: www.salini-impregilo.com Salini Impregilo S.p.A. Company
Interim financial report
 (Translation from the Italian original which remains the definitive version) Interim financial report 30 June 2017 This document is available at: www.salini-impregilo.com Salini Impregilo S.p.A. Company
FY16 Preliminary Financial Results
 we build value FY16 Preliminary Financial Results FY16 Preliminary Financial Results Agenda Business Update Pietro Salini Chief Executive Officer Financial Update Massimo Ferrari General Manager Finance
Annual Report as at 31 December 2013
 Annual Report as at 31 December 2013 Annual Report as at 31 December 2013 Annual Report as at 31 December 2013 Mission The Salini Group is a general contractor specialising in the construction of major,
Half-Year Financial Report
 Half-Year Financial Report as at June 30, 2015 This document is available at: www.salini-impregilo.com Salini Impregilo S.p.A. Salini Impregilo S.p.A., a company subject to management and coordination
Alstom 2016/17 results
 PRESS RELEASE Alstom 2016/17 results 10 billion order intake leading to a record backlog of 34.8 billion 7.3 billion sales up 6% Adjusted EBIT at 421 million up 15% Positive free cash flow at 182 million
2012 Annual Report. 31 December (Translation from the Italian original which remains the definitive version) Impregilo group
 Impregilo group") (Translation from the Italian original which remains the definitive version) Impregilo group 2012 Annual Report 31 December 2012 This document is available at: www.impregilo.it Impregilo S.p.A. Share capital
(Translation from the Italian original which remains the definitive version) Impregilo group 2012 Annual Report 31 December 2012 This document is available at: www.impregilo.it Impregilo S.p.A. Share capital
Interim report on operations
 Interim report on operations September 30, 2015 This document is available at: www.salini-impregilo.com Salini Impregilo S.p.A. Salini Impregilo S.p.A., a company subject to management and coordination
Salini Costruttori S.p.A. SALINI COSTRUTTORI S.P.A.
 SALINI COSTRUTTORI S.P.A. DIRECTORS' REPORT AND FINANCIAL STATEMENTS AS AT 31 DECEMBER 2012 MISSION The Salini Group is a general contractor specialising in the construction of major, complex works throughout
FY 2018 RESULTS ANNOUNCEMENT
 Rome, February 5, 2019 FY 2018 RESULTS ANNOUNCEMENT Strong commercial performance with orders intake at EUR 1,889.1 million (+25.9%), leading to a backlog of EUR 6,883.4 million Revenue at EUR 1,437.1
Excellent results for Alstom in the first half 2018/19
 PRESS RELEASE Excellent results for Alstom in the first half 2018/19 Strong commercial momentum with 7 billion orders, leading to a new record-breaking backlog of 38 billion Outstanding operational performance
2005 First Half Consolidated Results
 2005 First Half Consolidated Results 1 Index 1H 2005 Results Transition to IFRS: main impacts Appendix 2 1H 2005 Main Highlights The following data and all comparisons with previous periods are based on
THE BOARD OF DIRECTORS APPROVES INTERIM CONSOLIDATED REPORT AT 31 MARCH 2016
 London, May 5 th 2016 THE BOARD OF DIRECTORS APPROVES INTERIM CONSOLIDATED REPORT AT 31 MARCH 2016 The main first quarter key performance indicators, as detailed in the table below, are the following:
Ordinary General Shareholders' Meeting of
 Ordinary General Shareholders' Meeting of 8 May 2018 Speech by the CEO Marcelino Fernández Verdes Introduction Fellow shareholders, good morning and many thanks for attending this General Shareholders'
FIERA MILANO: THE BOARD OF DIRECTORS APPROVES THE 2017 RESULTS
 FIERA MILANO: THE BOARD OF DIRECTORS APPROVES THE 2017 RESULTS Strong growth in all financial figures and a return to net profit Revenues of Euro 271.3 million, an increase of 23% compared to the figure
2017 Financial Results
 we build value 15 March 2018 PowerPoint Presentation Guidelines Author Job Title Gabes-Sfax Motorway, Tunisia Agenda 2017 key messages Pietro Salini Chief Executive Officer Financial Update Massimo Ferrari
SALINI S.P.A. IMPREGILO S.P.A.
 INFORMATION MEMORANDUM CONCERNING THE MERGER BY INCORPORATION OF SALINI S.P.A. Registered office at 22 Via della Dataria, Rome Fully paid-in share capital of 62,400,000.00 euros Tax I.D., VAT and Rome
Alstom Q1 2017/18 orders and sales. Order intake of 1.9 billion Sales of 1.9 billion with organic growth at 5% 2020 objectives confirmed
 PRESS RELEASE Alstom Q1 2017/18 orders and sales Order intake of 1.9 billion Sales of 1.9 billion with organic growth at 5% 2020 objectives confirmed 13 July 2017 Over the first quarter 2017/18 (from 1
John Menzies plc. Interim Results Presentation 14 August 2018
 John Menzies plc Interim Results Presentation 14 August 2018 Results Overview Highlights Underlying operating profit at 33.9m, up 18% at constant currency Profit progression John Menzies plc H1 underlying
Arcadis delivers an 11% increase of net income from operations to 137 million in 2015
 PRESS RELEASE Arcadis delivers an 11% increase of net income from operations to 137 million in 2015 ARCADIS NV Gustav Mahlerplein 97-103 P.O. Box 7895 1008 AB Amsterdam The Netherlands Tel +31 20 2011
INTERIM REPORT ON OPERATIONS AT 31 MARCH Astaldi, consolidated net profit up by 14%
 INTERIM REPORT ON OPERATIONS AT 31 MARCH 2010 1 Astaldi, consolidated net profit up by 14% Total revenues up by 6.9% to EUR 460.7 million EBITDA: +10.5% to EUR 51.8 million, with the EBITDA margin up to
Consolidated net revenues from sales totalled Euro million (Euro million as at 30 September 2017)
") PRESS RELEASE PANARIAGROUP Industrie Ceramiche S.p.A.: The Board of Directors approves the Consolidated Financial Report as of 30 th September 2018. The trend in EUR/USD exchange rate, the international
PRESS RELEASE PANARIAGROUP Industrie Ceramiche S.p.A.: The Board of Directors approves the Consolidated Financial Report as of 30 th September 2018. The trend in EUR/USD exchange rate, the international
We create communities. We are Stantec.
 Acquisition of MWH Global March 29, 2016 We create communities. We are Stantec. PROSPECTUS INFORMATION An amended and restated preliminary short form prospectus containing important information relating
Investor Presentation H1 Interim Results. 21 August 2013
 Investor Presentation H1 Interim Results 21 August 2013 Forward-looking statements This presentation contains forward-looking statements, including, but not limited to, the statements and expectations
Consolidated financial results 2014
 PRESS RELEASE Consolidated financial results 2014 The Board of Directors has approved the Consolidated Financial Statement at December 31st, 2014. Consolidated income statement data: o Total revenues of
Condensed Consolidated interim financial statements
 First Quarter Panalpina First Quarter panalpina.com 2 Condensed Consolidated interim financial statements CONTENTS Consolidated Income Statement 3 Consolidated Statement of Comprehensive Income 4 Consolidated
Management report for the first half year
 HALF-YEAR FINANCIAL REPORT AT 30 JUNE 2014 Management report for the first half year 1. Key events in the period 3 1. Faits marquants de la période 3 2. Revenue 5 1. Faits marquants de la période 3 3.
SALINI COSTRUTTORI GROUP
 SALINI COSTRUTTORI GROUP HALF-YEAR FINANCIAL REPORT AS AT 30 JUNE 2013 MISSION The Salini Group is a general contractor specialising in the construction of major, complex works throughout the world. Inspired
CONSOLIDATED AND DRAFT FINANCIAL STATEMENTS 2017 APPROVED, DIVIDEND PROPOSED OF EUR 0.15 PER SHARE, 2018 GUIDANCE APPROVED
 Genoa, March 14 th 2018 CONSOLIDATED AND DRAFT FINANCIAL STATEMENTS 2017 APPROVED, DIVIDEND PROPOSED OF EUR 0.15 PER SHARE, 2018 GUIDANCE APPROVED New orders of EUR 1,500.8 million (+1.7%) Order Backlog
FS ITALIANE E FERROVIE DELLO STATO ITALIANE GROUP 2017 INTERIM REPORT HIGHLIGHTS
 (Translation from the Italian original which remains the definitive version) FS ITALIANE E FERROVIE DELLO STATO ITALIANE GROUP 2017 INTERIM REPORT HIGHLIGHTS CONTENTS FS ITALIANE E FERROVIE DELLO STATO
FAIVELEY TRANSPORT: 25% INCREASE IN NET PROFIT 9.7% SALES GROWTH DURING THE FINANCIAL YEAR ORDER BOOK OF 1,616 MILLION. Press Release 5 June 2013
 Press Release 5 June 2013 FAIVELEY TRANSPORT: 25% INCREASE IN NET PROFIT IN THE 2012/2013 FINANCIAL YEAR Gennevilliers, 5 June 2013 IFRS ( millions) 2011/12 2012/13 % change Sales 900.5 987.7 +9.7% Operating
THE BOARD OF DIRECTORS OF ASTALDI APPROVES A SHARE CAPITAL INCREASE UP TO A MAXIMUM OF EUR 300 MILLION AND CALLS THE SHAREHOLDERS MEETING
 THE BOARD OF DIRECTORS OF ASTALDI APPROVES A SHARE CAPITAL INCREASE UP TO A MAXIMUM OF EUR 300 MILLION AND CALLS THE SHAREHOLDERS MEETING 2018-2022 STRATEGIC PLAN AND CONSOLIDATED RESULTS OF Q1 2018 ALSO
Management s Discussion and Analysis
 (Formerly GLV Inc.) Management s Discussion and Analysis Third quarter of fiscal 2015 Three-month and nine-month periods ended, 2014 Table of Contents 1. PRELIMINARY COMMENTS TO INTERIM MANAGEMENT S DISCUSSION
Roadshow Kepler Cheuvreux. November 7, 2016, London. Driving transformation. Shaping the future.
 Roadshow Kepler Cheuvreux November 7, 2016, London Driving transformation. Shaping the future. Disclaimer Note: This presentation contains statements concerning the future business trend of the Vossloh
For personal use only
 NRW Holdings Limited (ASX: NWH) ABN 95 118 300 217 Interim Financial Report For the Half-Year Ended 31 December 2015 In t er im Fin an cial Rep o r t 1 APPENDIX 4D RESULTS FOR ANNOUNCEMENT TO THE MARKET
FY16 Results Presentation
 Muskrat Falls Hydro Plant, Canada FY16 Results Presentation March 14, 2017 Agenda Warsaw subway Line 2, Poland 2016 Highlights Q4 & FY16 results Appendix 2 Fit for the Future our Strategy Plan Sustainable
Astaldi, the BoD approves the quarterly report at September 30, 2006
 Astaldi, the BoD approves the quarterly report at September 30, 2006 Total revenues of 766.6 million Group net profit for the first nine months of 2006 of 22.6 million Total orders backlog of over 8 billion
ACS gains 233 million euros, 6% more, in the first quarter of 2017
 ACS gains 233 million euros, 6% more, in the first quarter of 2017 Sales increased by 11.2% up to 8,357 million euros Backlog increases by 15.0% up to 68,092 million euros in March 2017 Net debt decreases
Fitter for the Future Strategic Update
 Fitter for the Future Strategic Update 2017-21 Chairman s remarks Global strategic overview Significant market opportunity Basarab Overpass in Bucharest, Romania Naples underground (Toledo Station), Italy
Financial Results CONFERENCE CALL Third Quarter Results. Cesena 14 th November2014. Ended 30 th September 2014
 Financial Results 2014 Third Quarter Results Ended 30 th September 2014 CONFERENCE CALL Cesena 14 th November2014 1. TREVI Group 2. 9M 2014 Financial Results 3. Q&A 4. Appendix Rome (ITALY) Metro Line
Q1 Q Q3 Q EUR million Jan-Mar 2018 Jan-Mar 2017 Change, % EUR million Jan-Dec 2017
 Stockholm, Sweden, 4 May Eltel Group Interim report January March January March Group net sales decreased 10.5% to EUR 266.6 million (297.8), mainly as a result of divestments and on-going discontinuation
ASTM GROUP Investor Presentation 2018
 ASTM GROUP Investor Presentation 2018 2 ASTM GROUP DISCLAIMER This document (the document ) has been prepared by ASTM Group (the Company ) for the sole purpose described herein. Under no condition should
Astaldi in 2010: Net profit of EUR 62.6 million, +12% Revenues of EUR 2 billion, +9.2% Reduction of debt to EUR 384 million, 8.8%
 Astaldi s BoD has approved the consolidated results of Q4 2010 (unaudited) and examined the preliminary consolidated results of 2010 Astaldi in 2010: Net profit of EUR 62.6 million, +12% Revenues of EUR
Autogrill: robust like for like revenue growth of 3.9% in the fist half of 2018
 The Board of Directors approves the consolidated results at 30 June 2018 Autogrill: robust like for like revenue growth of 3.9% in the fist half of 2018 Revenue up 5.2% to 2.1 billion 1 All regions contributing
Grupo Isolux Corsán, S.A. and its subsidiaries. Consolidated financial information for the nine month period ended September 30, 2014 (unaudited)
") Consolidated financial information for the nine month period ended September 30, 2014 (unaudited) CONSOLIDATED INTERIM BALANCE SHEET (unaudited) For the period ended September 30, 2014 (Amounts in thousand
Consolidated financial information for the nine month period ended September 30, 2014 (unaudited) CONSOLIDATED INTERIM BALANCE SHEET (unaudited) For the period ended September 30, 2014 (Amounts in thousand
Interim Report. First Quarter of Fiscal siemens.com. Energy efficiency. Intelligent infrastructure solutions. Next-generation healthcare
 Energy efficiency Next-generation healthcare Industrial productivity Intelligent infrastructure solutions Interim Report First Quarter of Fiscal 2014 siemens.com Key to references REFERENCE WITHIN THE
STRONG FINISH TO 2006 FOR ASSA ABLOY
 14 February 2007 14 February 2007 no:04/07 STRONG FINISH TO 2006 FOR ASSA ABLOY Sales for the fourth quarter increased by 7% to SEK 8,059 M (7,530), with 9% organic growth, 5% acquired growth and -7% exchange-rate
Adjusted revenue up +1.5% to 1,641.4 million. Adjusted organic revenue up +0.4%, with an accelerating Q2 at +1.5%
 H1 2017 Results Adjusted revenue up +1.5% to 1,641.4 million Adjusted organic revenue up +0.4%, with an accelerating Q2 at +1.5% Adjusted operating margin of 255.0 million, down -3.6% Adjusted EBIT, before
OPERATING RESULT HITS RECORD HIGH, NET PROFIT OVER 2.1 BILLION, DIVIDEND RISES 6% TO 0.85 PER SHARE. CONFIRMING GENERALI STRATEGY FULLY ON TRACK
 15/03/2018 PRESS RELEASE GENERALI GROUP CONSOLIDATED RESULTS AT 31 DECEMBER 2017 1 OPERATING RESULT HITS RECORD HIGH, NET PROFIT OVER 2.1 BILLION, DIVIDEND RISES 6% TO 0.85 PER SHARE. CONFIRMING GENERALI
Alstom Presentation. Henri Poupart-Lafarge, Chairman & CEO. JP Morgan Cazenove European Capital Goods CEO Conference, 16 June 2017
 Alstom Presentation Henri Poupart-Lafarge, Chairman & CEO JP Morgan Cazenove European Capital Goods CEO Conference, 16 June 2017 Disclaimer This presentation contains forward-looking statements which are
Salini S.p.A. Group SALINI S.P.A. INTERIM CONSOLIDATED FINANCIAL STATEMENTS AS AT 30 JUNE 2012 (ITA GAAP)
") SALINI S.P.A. INTERIM CONSOLIDATED FINANCIAL STATEMENTS AS AT 30 JUNE 2012 (ITA GAAP) MISSION The Salini Group is a general contractor specialising in the construction of major, complex works throughout
SALINI S.P.A. INTERIM CONSOLIDATED FINANCIAL STATEMENTS AS AT 30 JUNE 2012 (ITA GAAP) MISSION The Salini Group is a general contractor specialising in the construction of major, complex works throughout
REPORT ThIRD QUARTER 2013
 Imagine the result REPORT third QUARTER 2013 2 Introduction Arcadis nv Report third quarter 2013 North America helps drive third quarter organic net revenue growth to 4% Third quarter operating margin
4 Operating and financial review
 4 Operating and financial review OVERVIEW Express transports goods and documents around the world with a focus on time-certain and/or day-certain delivery. Goods and documents have different weights, shapes
ASTALDI: AT 30 JUNE 2011, NET PROFIT +12.4% TO EUR 35 MILLION TOTAL REVENUES +14.3% TO OVER EUR 1.1 BILLION NEW ORDERS OF OVER EUR 1.
 The Board of Directors of Astaldi has approved the 2011 half-yearly results ASTALDI: AT 30 JUNE 2011, NET PROFIT +12.4% TO EUR 35 MILLION TOTAL REVENUES +14.3% TO OVER EUR 1.1 BILLION NEW ORDERS OF OVER
APPROVED THE CONSOLIDATED INTERIM FINANCIAL REPORT AT 30 SEPTEMBER 2018 GUIDANCE FOR THE 15 MONTHS PERIOD (JANUARY 2018 MARCH 2019) APPROVED
 APPROVED") Rome, October 30, 2018 APPROVED THE CONSOLIDATED INTERIM FINANCIAL REPORT AT 30 SEPTEMBER 2018 GUIDANCE FOR THE 15 MONTHS PERIOD (JANUARY 2018 MARCH 2019) APPROVED New orders at EUR 630.3 million (-31.1%)
Rome, October 30, 2018 APPROVED THE CONSOLIDATED INTERIM FINANCIAL REPORT AT 30 SEPTEMBER 2018 GUIDANCE FOR THE 15 MONTHS PERIOD (JANUARY 2018 MARCH 2019) APPROVED New orders at EUR 630.3 million (-31.1%)
Alliance Oil Company Ltd: Interim report for the quarter and six months ended 30 June 2013
 Alliance Oil Company Ltd: Interim report for the quarter and six months Revenue of MUSD 906.6, up 11% from Q2 2012. EBITDA of MUSD 173.1, up 30% from Q2 2012. Profit before tax of MUSD 59.3, up 102% from
Investors Conference HSBC SRI Conference. February 7, 2017, Frankfurt. Driving transformation. Shaping the future.
 Investors Conference HSBC SRI Conference February 7, 2017, Frankfurt Driving transformation. Shaping the future. Disclaimer Note: This presentation contains statements concerning the future business trend
INTERIM FINANCIAL REPORT First quarter 2018 Company announcement no. 690
 INTERIM FINANCIAL REPORT First quarter 2018 Company announcement no. 690 1 May 2018 Selected financial and operating data for the period 1 January 31 March 2018 (DKKm) Q1 2018 Q1 2017 Net revenue 18,380
2018 Orders and FOCF Guidance revised upwards
 Results at 30 June 2018 Leonardo: 1H 2018 Revenues up 4%, before currency impact. 2018 Orders and FOCF Guidance revised upwards. Helicopters successfully achieving the recovery plan. DRS benefitting from
ASSA ABLOY OFF TO AN EXCELLENT START
 25 April 2007 25 April 2007 no:08/07 ASSA ABLOY OFF TO AN EXCELLENT START Sales in the first quarter increased by 8% to SEK 8,227 M (7,653), with 8% organic growth, 6% acquired growth and exchange-rate
Third quarter results. 15 November 2010
 Third quarter results 15 November 2010 1 Period operatives keys Analysis of 3Q10 results Business areas Appendices 2 Period operative keys SyV third quarter results reflect the advancement made in: INTERANTIONAL
Consolidated financial statements 2016
 CONSOLIDATED FINANCIAL STATEMENTS 2016 Consolidated financial statements 2016 CONTENT 04 2016 Key figures 08 Consolidated balance sheet 10 Consolidated income statement 11 Consolidated comprehensive income
RESULTS ENDED 30 SEPTEMBER 2014
 RESULTS ENDED 30 SEPTEMBER 2014 INCREASE IN BACKLOG AND NET INCOME Consolidated key financial and economic data 3Q14 Revenues 274m EBITDA 32m EBIT 17m Net Profit 9m Consolidated key financial and economic
Alstom 2017/18 results
 PRESS RELEASE Alstom 2017/18 results Sales at 8bn with an outstanding growth of 9% (10% organically) Continued profitability improvement with an adjusted EBIT margin reaching 6.5% Positive free cash flow
ASSA ABLOY REPORTS STRONG SALES
 25 April 2006 25 April 2006 no: 8/06 ASSA ABLOY REPORTS STRONG SALES Sales for the first quarter increased organically by 12% to SEK 7,653 M (6,269). The operating margin (EBIT) for the first quarter amounted
PRESS RELEASE PIAGGIO GROUP: 2018 HALF-YEAR FINANCIAL STATEMENTS 1
 PRESS RELEASE PIAGGIO GROUP: 2018 HALF-YEAR FINANCIAL STATEMENTS 1 In the first half of 2018 the Piaggio Group reported an improvement in performance from the year-earlier period, with progress on all
ASSA ABLOY S INCREASED GROWTH DRIVEN BY GLOBAL TECHNOLOGIES
 17 August 2005 No 10/05 ASSA ABLOY S INCREASED GROWTH DRIVEN BY GLOBAL TECHNOLOGIES Sales for the second quarter of 2005 increased organically by 6% to SEK 6,984 M (6,533) Quarterly operating income is
- JCDECAUX SA - COMMENTS ON THE TRANSITION TO IFRS AND FIGURES
 - JCDECAUX SA - COMMENTS ON THE TRANSITION TO IFRS AND FIGURES Pursuant to EC Regulation No. 1606/2002 and in accordance with IFRS 1 First-time Adoption of IFRS, the JCDecaux Group consolidated financial
Leonardo: first half 2017 progress confirms growing orders and profitability
 Results at 30 June 2017 Leonardo: first half 2017 progress confirms growing orders and profitability New Orders at EUR 5.1 billion, higher than 1H2016 net of the EUR 8 billion EFA Kuwait contract booked
idated Ffinancial statements Notes to the consolidated financial statements Financial statements of Swisscom Ltd
 idated Ffinancial statements Consolidated financial statements Notes to the consolidated financial statements Consolidated statement of comprehensive income 94 Consolidated balance sheet 95 Consolidated
GLENALTA AND CFT GROUP ANNOUNCE BUSINESS COMBINATION
 GLENALTA AND CFT GROUP ANNOUNCE BUSINESS COMBINATION CFT GROUP IS ONE OF THE WORLD LEADING OPERATORS IN PLANT CONSTRUCTION AND COMPLETE RANGES FOR THE TRANSFORMATION, PACKAGING AND SELECTION OF FOOD PRODUCTS.
SINGAPORE POST LIMITED AND ITS SUBSIDIARIES (Registration number: M)
") SINGAPORE POST LIMITED AND ITS SUBSIDIARIES (Registration number: 199201623M) SGXNET ANNOUNCEMENT UNAUDITED RESULTS FOR THE FOURTH QUARTER AND FINANCIAL YEAR ENDED 31 MARCH 2015 1 PART I INFORMATION REQUIRED
SINGAPORE POST LIMITED AND ITS SUBSIDIARIES (Registration number: 199201623M) SGXNET ANNOUNCEMENT UNAUDITED RESULTS FOR THE FOURTH QUARTER AND FINANCIAL YEAR ENDED 31 MARCH 2015 1 PART I INFORMATION REQUIRED
P R E S S R E L E A S E
 P R E S S R E L E A S E from ASSA ABLOY AB (publ) 27 April 2005 No. 8/05 STRONG GROWTH IN USA BUT WEAKER IN EUROPE FOR ASSA ABLOY Sales for the first quarter of 2005 increased organically by 2% to SEK
Enel: the Board approves 2006 results
 Enel: the Board approves 2006 results Revenues: 38,513 million euros, (33,787 million euros in 2005, +14.0%). Ebitda: 8,019 million euros, (7,745 million euros in 2005, +3.5%); net of a provision of about
Good performance in a weak market
 1 7 February 2013 No. 2/13 Good performance in a weak market Fourth quarter Sales increased by 4% in the quarter, with 0% organic growth, and totaled SEK 12,239 M (11,744). Good growth in Americas and
P R E S S R E L E A S E
 P R E S S R E L E A S E from ASSA ABLOY AB (publ) 27 April 2004 No. 5/04 ASSA ABLOY Q1: ORGANIC GROWTH AND IMPROVED MARGINS IN ALL DIVISIONS Sales in the first quarter increased organically by 3% to SEK
JANUARY-JUNE 2018 INTERIM REPORT
 JANUARY-JUNE INTERIM REPORT 2 Strong organic growth in. Operating profit for was slightly lower than same period last year. Markets and expectations result confirms that Ramboll s strategic initiatives
Profile of the Group in 2015
 A 0 Profile of the Group in 2015 Obrascón Huarte Lain (OHL) ranks among the leading international concession and construction groups, with more than 100 years of experience and an outstanding presence
Interim report January March 2015
 Interim report January March Gross cash collections SEK 791m Portfolio acquisitions SEK 273m January March (compared with the first quarter ) Gross cash collections increased by 48 per cent to SEK 791m
Alstom s orders and sales for the first nine months of 2018/19
 PRESS RELEASE Alstom s orders and sales for the first nine months of 2018/19 Continuous strong commercial momentum with orders intake of 10.5 billion, leading to a new record-breaking backlog of 40 billion
OAO Scientific Production Corporation Irkut
 Consolidated Financial Statements for the year ended 31 December 2011 Consolidated Financial Statements for the year ended 31 December 2011 Contents Independent Auditors Report 3 Consolidated Income Statement
Interim Report. Second Quarter and First Half of Fiscal siemens.com. Energy efficiency. Intelligent infrastructure solutions
 Energy efficiency Next-generation healthcare Industrial productivity Intelligent infrastructure solutions Interim Report Second Quarter and First Half of Fiscal 2014 siemens.com Key to references REFERENCE
Net profit exceeds 1 bln (+28.4%), best half-year result in 5 years
, best half-year result in 5 years") 01/08/2013 PRESS RELEASE Consolidated results as of 30 June 2013 1 Net profit exceeds 1 bln (+28.4%), best half-year result in 5 years Operating result at 2.4 bln (+5.3%), driven by P&C growth. Solid Life
01/08/2013 PRESS RELEASE Consolidated results as of 30 June 2013 1 Net profit exceeds 1 bln (+28.4%), best half-year result in 5 years Operating result at 2.4 bln (+5.3%), driven by P&C growth. Solid Life
Interim report January June July 2016 FINNLINES Q2
 Interim report January June 2016 28 July 2016 FINNLINES Q2 FINNLINES PLC INTERIM REPORT JANUARY-JUNE 2016 (unaudited) Stock Exchange Release 28 July 2016 at 15:00 JANUARY-JUNE 2016: Result for the reporting
RESULTS ENDED 30 JUNE 2013
 RESULTS ENDED 30 JUNE 2013 STRONG INCREASE IN TOTAL REVENUES AND MARGINS Consolidated key financial and economic data 1H13 Value of Production 678m Revenues 663m EBITDA 76m EBIT 43m Net Financial Position
NEWS RELEASE GTECH ANNOUNCES 2013 FOURTH QUARTER AND FULL YEAR RESULTS
 NEWS RELEASE GTECH ANNOUNCES 2013 FOURTH QUARTER AND FULL YEAR RESULTS Consolidated Financial and Business Highlights New organization in place, significant wins, and strong pipeline; 50 million in expected
INTERIM FINANCIAL STATEMENTS FIRST QUARTER 2014
 INTERIM FINANCIAL STATEMENTS FIRST QUARTER 2014 APPROVED BY THE BOARD OF DIRECTORS ON 14 MAY 2014 INTERIM FINANCIAL STATEMENTS FOR THE FIRST QUARTER 2014 CONTENTS CONTENTS 2 1. HIGHLIGHTS 3 2. INTRODUCTION
FOR IMMEDIATE RELEASE
 Investor Contact Media Contact David Martin Kenneth Julian 717.612.5628 717.730.3683 damartin@harsco.com kjulian@harsco.com FOR IMMEDIATE RELEASE REPORTS SECOND QUARTER 2014 RESULTS Adjusted Operating
QUARTERLY STATEMENT Q3 / 9M 2016 / 17
 QUARTERLY STATEMENT Q3 / 9M 2016 / 17 2 3 Split of METRO GROUP completed 3 About us 3 Acquisition of around 24% of FNAC DARTY S.A. 3 Positive sales and profit performance in Q3 4 Overview 5 INTERIM GROUP
Panariagroup Industrie Ceramiche S.p.A. INTERIM REPORT AT 31 MARCH 2012
 Panariagroup Industrie Ceramiche S.p.A. INTERIM REPORT AT 31 MARCH 2012 Panariagroup Industrie Ceramiche S.p.A. Via Panaria Bassa 22/a 41034 Finale Emilia (Modena) Tax code, VAT 01865640369 www.panariagroup.it
PRESS RELEASE IMMSI GROUP: FIRST NINE MONTHS 2012
 PRESS RELEASE IMMSI GROUP: FIRST NINE MONTHS 2012 Net sales 1,161.1 million ( 1,273.9 mln first nine months 2011) EBITDA 132.1 million ( 160.4 mln first nine months 2011) EBIT 68.8 million ( 90.0 mln first
9M 2013 Results. November 11, 2013
 9M 2013 Results November 11, 2013 1 1 GOALS AND ACHIEVEMENTS FOR 2013 OUR GOALS OUR ACHIEVEMENTS Financial close and start-up of Turkish projects Financial support to domestic projects in order to deliver
ASTALDI: NET PROFIT UP +20.1% AT 32 MILLION EUROS NET INDEBTEDNESS DOWN TO MILLION EUROS
 The Board of Directors has approved the Intermediate Report at 30 September 2008 ASTALDI: NET PROFIT UP +20.1% AT 32 MILLION EUROS NET INDEBTEDNESS DOWN TO 467.7 MILLION EUROS Main consolidated data at
PRESS RELEASE ACOTEL GROUP: Board approves interim report for H1 2014
 PRESS RELEASE ACOTEL GROUP: Board approves interim report for H1 2014 Consolidated revenue 35.2 million ( 51.9 million in H1 2013) Negative EBITDA 3.5 million (negative 3.1 million in H1 2013) Negative
summary interim financial statements
 summary interim financial statements 30 JUNe 2006 contents Management report for the first half of 2006 1 Consolidated IFRS income statement 6 Consolidated IFRS balance sheet 7 Consolidated IFRS cash flow
Full-Year 2016 Results
 7 Full-Year 2016 Results This version published on March 24 th, 2017 solves a printing problem on page 8 of the version dated March 2 nd, 2017 and put online at this date Adjusted revenue up +5.8% to 3,392.8
Banca IFIS: margins and customers up for the 9 months. Rising profitability and strong cash flow generation in the NPL segment
 Q3 Banca IFIS: margins and customers up for the 9 months. Rising profitability and strong cash flow generation in the NPL segment Highlights Results for the first nine months of 2018 1 RECLASSIFIED DATA
BOARD APPROVES HALF YEAR FINANCIAL REPORT FOR 2008
 Press release BOARD APPROVES HALF YEAR FINANCIAL REPORT FOR 2008 The basis of consolidation from the first half of 2008 now includes the Polish Stalexport Autostrady Group and the U. S. company, Electronic
INTERIM REPORT ON OPERATIONS AT MARCH 31, 2008
 1 INTERIM REPORT ON OPERATIONS AT MARCH 31, 2008 CONTENTS Introduction Reclassified consolidated income statement Reclassified consolidated balance sheet and financial position Comments on the Group s