powered b y innovation
|
|
|
- Clementine Little
- 5 years ago
- Views:
Transcription


1 2017 ANNUAL REPORT


2 powered b y innovation
3 Chief Executive Officer and Chairman s Report Independent Auditor s Report Statement of Comprehensive Income Statement of Financial Position Statement of Changes in Equity Statement of Cash Flows Notes to the Financial Statements Shareholder Information Corporate Governance Directory


4 CHIEF EXECUTIVE OFFICER AND CHAIRMAN S REPORT Dear Shareholders, On behalf of the Board of Directors of Future Mobility Solutions Limited (FMS), we are pleased to present its financial results for the year ended 31 March EBITDA of $1.310 million, a 42% improvement on the previous year of $925,000. A 7% increase in gross margin from $5,604,000 to $5,989,000. Total comprehensive income of $649,000, up 18% on the previous year of $551,000. An 81% increase in cash reserves from $1.79 million to $3.23 million as at 31st March FMS has performed strongly over the reporting period as it continues to benefit from the strategy pursued by the board over recent years. Total revenue of $17.7m was achieved on the sale of 86 craft and 4 Sealegs amphibious enablement systems. Of this, OEM sales remain strong, with 23 OEM craft sold during the period, which accounted for 27% of total craft sales, compared to 14 sold, 14% of total craft sales, in the prior year period. Equally, the company s continued efforts to drive cost savings throughout the business has generated significant improvements in the company s margins. This resulted in the year s strong EBITDA improvement, the metric on which management are most closely focused. 7% GROSS MARGIN 42% $ EBITDA 3.2m CASH RESERVES The year also marked a significant acceleration of the group s strategy to become a multi-brand marine and related technology business. This is designed to build on the successful technology the group has already developed and to replicate its success in the global market. At the same time, it is crucial that the business develop a diversified geographic client and production base and positions itself to be competitive in an environment where home content is often crucial to successful orders. With the acquisitions already announced of S.A.S Sillinger, Gemini Marine and Sealegs Europe, FMS believes it is delivering on this strategy. Gemini Marine is a fibreglass RIB manufacturer based in Cape Town, South Africa, operating since Clients include: NSW Water Police, Royal New Zealand Navy, United Nations, Australian Defence Force, Olympic Security, African Union, Australian Federal Police, Australian Special Emergency Services and Singapore Special Forces. S.A.S. Sillinger, based in France and operating for 50 years, S.A.S. Sillinger is one of the most trusted providers of hypalon RIBs to professional and military clients both in France and globally. 2


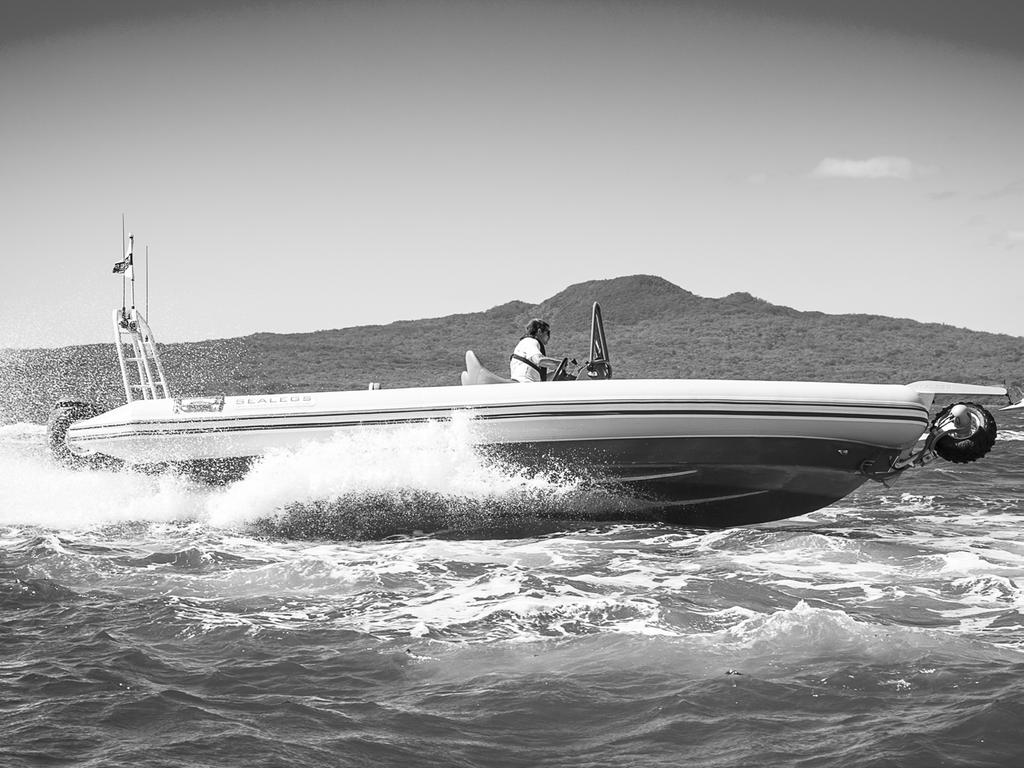
5 The directors also believe these businesses will generate significant opportunities to drive cost efficiencies throughout the FMS group and provide the company with greater operational flexibility in the medium to long term. Looking forward, the board will continue to actively seek acquisition opportunities which enhance and contribute to its strategy and growth. As part of this strategy, the company has previously announced the intention of FMS to obtain a listing on an overseas market. The board believes that FMS is consistently undervalued by the stock market in New Zealand, suffers from thin trading liquidity and is a situation which must be remedied for the long-term benefit of FMS and all its shareholders. As a result of this, in conjunction with its intention to seek an overseas listing for its shares, the company plans to apply to delist from the New Zealand Stock Exchange and to seek approval from shareholders for this in due course. We would like to take this opportunity to acknowledge the employees, customers, shareholders and commercial partners of FMS for their continued support and commitment to the success of the company. Eric Series Chairman Mark Broadley Acting Chief Executive Officer The newly released 7.7m Sport D-Tube Sealegs craft 3
6 4
7 1. Capitalised development costs evaluated the amortisation period applied to the capitalised costs relating to technology developed with consideration given to the lifecycle for other similar technology; and 5
8 2. Revenue recognition, including the timing of revenue recognition 6
9 . 7
10 CONSOLIDATED STATEMENT OF COMPREHENSIVE INCOME For the year ended 31 March 2017 March 2017 March 2016 Note Sales of goods 16,739,451 17,604,567 Rendering of services 967, ,784 Total Revenue 17,706,482 18,564,351 Cost of sales less related depreciation expense * 2 (11,717,726) (12,959,901) Gross profit less related depreciation expense 5,988,756 5,604,450 Other income 26,594 93,005 Administrative expenses * 3,4 (3,205,763) (2,963,579) Distribution expenses (400,043) (367,741) Marketing expenses (654,256) (828,046) Occupancy expenses 3 (204,916) (257,878) Research expenses (71,382) (29,358) Other expenses (169,442) (326,069) Total operating expenses and other income (4,679,209) (1,672,322) Profit before Interest, Taxation, Depreciation, Amortisation and Impairment 1,309, ,784 Depreciation, Amortisation and Impairment 17, 18 (691,182) (429,923) Interest income 5 9,457 12,715 Profit before income tax 627, ,576 Tax expense Profit for the period after income tax attributable to Company shareholders 627, ,576 Movement in foreign currency translation reserve 20,733 43,427 Total comprehensive income for the period 648, ,003 Earnings per share from continuing operations March 17 March 16 Cents Cents Basic earnings / (deficit) per share Diluted earnings / (deficit) per share * The presentation of the Income Statement compared to the 2016 financial statements has been changed to remove depreciation from cost of sales and administration expenses and reclassify this as depreciation, amortisation and impairment expenses. Prior period amounts have been changed to reflect the change in presentation. Refer to Note 2 and Note 3 for more details. 8
11 CONSOLIDATED STATEMENT OF FINANCIAL POSITION As at 31 March 2017 March 2017 March 2016 Note ASSETS Current assets Cash and bank balances 3,236,047 1,787,328 Trade receivables and other receivables ,975 1,320,702 Inventories 14 5,017,685 5,250,427 Prepayments and Other Assets 88, ,403 Deferred tax asset - - Total current assets 9,259,136 8,565,860 Non-current assets Term deposit 75,000 75,000 Property, plant and equipment ,415 1,071,114 Patents and trademarks , ,846 Capitalised development costs 18 1,927,685 2,376,619 Computer software ,127 Total non-current assets 3,047,785 3,680,706 TOTAL ASSETS 12,306,921 12,246,566 LIABILITIES Current liabilities Trade and other payables 11 1,697,865 2,139,154 Warranty provision , ,000 Employee entitlements 300, ,617 Deferred revenue ,196 1,012,714 Total current liabilities 2,908,285 3,876,485 TOTAL LIABILITIES 2,908,285 3,876,485 NET ASSETS 9,398,636 8,370,081 Equity attributable to parent company shareholders Contributed equity 10 56,602,440 56,432,440 Share based payments reserve 210,000 - Accumulated deficit (47,385,244) (48,013,066) Foreign currency translation reserve (28,560) (49,293) TOTAL EQUITY 9,398,636 8,370,081 For and on behalf of the board who authorise the issue of these financial statements on 2 June Christopher Weir Director Mark Broadley Director 9
 (49,293) 8,370,080 Profit / (loss) for the year - - 627,823-627,823 Foreign currency translation reserve recognised in statement of")
12 CONSOLIDATED STATEMENT OF CHANGES IN EQUITY For the year ended 31 March 2017 Contributed Equity Share Based Payment Reserve GROUP - March 2017 Accumulated Deficit Foreign Currency Translation Reserve Note $ Total As at 1 April ,432,440 - (48,013,067) (49,293) 8,370,080 Profit / (loss) for the year , ,823 Foreign currency translation reserve recognised in statement of comprehensive income Total comprehensive income for the period attributable to equity holders of the parent Transactions with owners in their capacity as owners: ,733 20, ,823 20, ,556 Shares issued 9 170, ,000 Share based payment for the year 9-210, ,000 As at 31 March ,602, ,000 (47,385,244) (28,560) 9,398,636 Contributed Equity Share Based Payment Reserve GROUP - March 2016 Accumulated Deficit Foreign Currency Translation Reserve $ Total As at 1 April ,432, ,317 (49,396,960) (92,720) 7,869,077 Profit / (loss) for the year , ,576 Foreign currency translation reserve recognised in statement of comprehensive income Total comprehensive income for the period attributable to equity holders of the parent Transactions with owners in their capacity as owners: ,427 43, ,576 43, ,003 Reclassification of prior year share based payment to liabilities due to modification of incentive plan Reclassification of employee share option reserve to accumulated deficit - (50,000) - - (50,000) - (876,317) 876, As at 31 March ,432,440 - (48,013,067) (49,293) 8,370,080 10
 (17,653,615) Net cash flows from / (used in) operating activities 21 1,507,093 304,791 Cash flows from")
13 CONSOLIDATED STATEMENT OF CASH FLOWS For the year ended 31 March 2017 March 2017 March 2016 Note Cash flows from operating activities Receipts from customers 17,619,891 17,658,516 Government grants - 287,175 Interest received 9,457 12,715 Payments to suppliers and employees (16,122,255) (17,653,615) Net cash flows from / (used in) operating activities 21 1,507, ,791 Cash flows from investing activities Proceeds from sale of fixed assets 21,392 84,778 Purchase of fixed assets (31,592) (98,580) Payments for patents & trademarks (44,880) (19,274) Payments for development costs (16,827) (543,185) Net cash flows from / (used in) investing activities (71,907) (576,262) Cash flows from financing activities Net cash flows from financing activities - - Net increase / (decrease) in cash held 1,435,186 (271,470) Net foreign exchange differences 13,533 (64,239) Add: opening cash bought forward 1,787,328 2,123,037 Cash at end of period 3,236,047 1,787,328 11
14 Notes to and forming part of the co FINANCIAL STATEM 1. Summary of significant accounting policies Reporting Entity Future Mobility Solutions Limited (the Company ) is a company incorporated and domiciled in New Zealand, registered under the Companies Act 1993 and listed on the New Zealand Stock Exchange. The Company is an FMC reporting entity under Part 7 of the Financial Markets Conduct Act Previously known as Sealegs Corporation Limited, the Company changed its name to Future Mobility Solutions Limited on 31 January 2017 as part of its broader strategy to improve shareholder value. The consolidated financial statements of Future Mobility Solutions Limited as at and for the year ended 31 March 2017 comprise the Company and its subsidiaries (together referred to as the ). These financial statements have been approved for issue by the board of directors on 2 June Measurement Base The consolidated financial statements have been prepared on a historical cost basis except where otherwise stated. The information is presented in New Zealand dollars ($), which is the Company s functional currency and rounded to the nearest dollar. Specific Accounting Policies a) Statement of compliance The consolidated financial statements have been prepared in accordance with New Zealand Generally Accepted Accounting Practice ( NZ GAAP ). They comply with New Zealand equivalents to International Financial Reporting Standards ( NZ IFRS ), and other applicable Financial Reporting Standards, as appropriate for profit-oriented entities. The consolidated financial statements comply with International Financial Reporting Standards ( IFRS ). Accounting policies adopted are consistent with those of the previous financial year. b) Basis of consolidation The consolidated financial statements comprise the financial statements of the and its subsidiaries as at 31 March each year. Control is achieved when the is exposed, or has rights, to variable returns from its involvement with the investee and has the ability to affect those returns through its power over the investee. Specifically, the controls an investee if and only if the has: Power over the investee (i.e. existing rights that give it the current ability to direct the relevant activities of the investee) Exposure, or rights, to variable returns from its involvement with the investee, and The ability to use its power over the investee to affect its returns The re-assesses whether or not it controls an investee if facts and circumstances indicate that there are changes to one or more of the three elements of control. Consolidation of a subsidiary begins when the obtains control over the subsidiary and ceases when the loses control of the subsidiary. Assets, liabilities, income and expenses of a subsidiary acquired or disposed of during the year are included in the statement of comprehensive income from the date the gains control until the date the ceases to control the subsidiary. Profit or loss and each component of other comprehensive income (OCI) are attributed to the equity holders of the parent of the and to the non-controlling interests, even if this results in the non-controlling interests having 12
15 nsolidated ENTSFor the year ended 31 March 2017 a deficit balance. When necessary, adjustments are made to the financial statements of subsidiaries to bring their accounting policies into line with the s accounting policies. All intra-group assets and liabilities, equity, income, expenses and cash flows relating to transactions between members of the are eliminated in full on consolidation. c) Intangible assets Intangible assets are initially measured at cost. The cost of an intangible asset is its fair value as at the date of acquisition. Following initial recognition, intangible assets are carried at cost less any accumulated amortisation and any accumulated impairment losses. The useful lives of intangible assets are assessed to be either finite or indefinite. Intangible assets with finite lives are amortised over the useful life and tested for impairment whenever there is an indication that the intangible asset may be impaired (see note (t) for methodology). The amortisation period and the amortisation method for an intangible asset with a finite useful life is reviewed at least at each financial year-end. Changes in the expected useful life or the expected pattern of consumption of future economic benefits embodied in the asset are accounted for prospectively by changing the amortisation period or method, as appropriate, which is a change in accounting estimate. The amortisation expense on intangible assets with finite lives is recognised in profit or loss in the expense category consistent with the function of the intangible asset. Impairment (i) Development costs Development costs are carried at cost less accumulated amortisation and accumulated impairment losses. This intangible asset has been assessed as having a finite life and is amortised using the straight line method over the period of the future expected benefit (not exceeding 10 years) from the related project. Impairment testing is conducted periodically at a review meeting by the board of directors. (ii) Patents and Trademarks Patents and trademarks acquired are carried at cost less accumulated amortisation and impairment losses. Patents and trademarks are amortised using the straight line method over a period not exceeding 10 years. Amortisation rate and method are reviewed annually for appropriateness. Patents and trademarks are impairment tested whenever there is an indication of impairment. (iii) Computer Software Computer Software acquired is carried at cost less accumulated amortisation and impairment losses. Computer software is amortised using the straight line method over the estimated useful life for a period not exceeding 4 years. Amortisation rate and method are reviewed annually for appropriateness. Computer software is impairment tested whenever there is an indication of impairment. The useful economic life of finite intangibles is determined for amortisation as: 1. Development costs 10% - 14% 2. Patents 10% 3. Computer software 30% d) Property, plant and equipment The has the following classes of property, plant and equipment: 1. Computer Equipment 2. Plant and Equipment 3. Furniture and Fittings All items of property, plant and equipment are initially recorded at cost, including costs directly attributable to bringing the asset to its working condition. notes continue over page 13
16 Any expenditure that increases the economic benefits derived from an asset is capitalised. Expenditure on repairs and maintenance that does not increase the economic benefits is expensed in the period it occurs. Subsequent to initial recognition, property, plant and equipment is stated at historic cost less accumulated depreciation and any accumulated impairment losses. When an item of property, plant and equipment is disposed of the difference between net disposal proceeds and the carrying amount is recognised as a gain or loss in profit or loss. Depreciation is provided for on a straight-line basis on all property, plant and equipment items, at depreciation rates calculated to allocate the asset s cost or valuation less estimated residual value, over their estimated useful lives. Major depreciation rates are: 1. Computer Equipment 10% - 30% 2. Plant and Equipment 5% - 40% 3. Furniture and Fittings 6.5% - 30% e) Trade and other receivables Trade receivables, which generally are paid before or on delivery, are recognised initially at fair value and subsequently measured at amortised cost using the effective interest method, less an allowance for impairment. Collectability of trade receivables is reviewed on an on-going basis. Individual debts that management consider to be uncollectible are written off when identified. An impairment provision is recognised when there is objective evidence that the will not be able to collect the receivable. Financial difficulties of the debtor, default payments or debts more than 60 days overdue are considered objective evidence of impairment. The amount of the impairment loss is the difference between the carrying amount of the receivable and the present value of estimated future cash flows, discounted at the original effective interest rate. f) Income tax and other taxes Current tax assets and liabilities for the current and prior periods are measured at the amount expected to be recovered from or paid to the taxation authorities based on the current period s taxable income. The tax rates and tax laws used to compute the amount are those that are enacted or substantively enacted by the balance sheet date. Deferred income tax is provided on all temporary differences at the balance sheet date between the tax bases of assets and liabilities and their carrying amounts for financial reporting purposes. Deferred income tax liabilities are recognised for all taxable temporary differences except: When the deferred income tax liability arises from the initial recognition of goodwill or of an asset or liability in a transaction that is not a business combination and that, at the time of the transaction, affects neither the accounting profit nor taxable profit or loss; or When the taxable temporary difference is associated with investments in subsidiaries and the timing of the reversal of the temporary difference can be controlled and it is probable that the temporary difference will not reverse in the foreseeable future. Deferred income tax assets are recognised for all deductible temporary differences, carry-forward of unused tax credits and unused tax losses, to the extent that it is probable that taxable profit will be available against which the deductible temporary differences and the carry-forward of unused tax credits and unused tax losses can be utilised, except: When the deferred income tax asset relating to the deductible temporary difference arises from the initial recognition of an asset or liability in a transaction that is not a business combination and, at the time of the transaction, affects neither the accounting profit nor taxable profit or loss; or When the deductible temporary difference is associated with investments in subsidiaries, associates or interests in joint ventures, in which case a deferred tax asset is only recognised to the extent that it is probable that the temporary difference will reverse in the foreseeable future and taxable profit will be available against which the temporary difference can be utilised. The carrying amount of deferred income tax assets is reviewed at each balance sheet date and reduced to the extent that it is no longer probable that sufficient taxable profit will be available to allow all or part of the deferred 14
17 income tax asset to be utilised. Unrecognised deferred income tax assets are reassessed at each balance sheet date and are recognised to the extent that it has become probable that future taxable profit will allow the deferred tax asset to be recovered. Deferred income tax assets and liabilities are measured at the tax rates that are expected to apply to the year when the asset is realised or the liability is settled, based on tax rates (and tax laws) that have been enacted or substantively enacted at the balance sheet date. Deferred tax assets and deferred tax liabilities are offset only if a legally enforceable right exists to set off current tax assets against current tax liabilities and the deferred tax assets and liabilities relate to the same taxable entity and the same taxation authority. Revenues, expenses and assets are recognised net of the amount of GST except: When the GST incurred on a purchase of goods and services is not recoverable from the taxation authority, in which case the GST is recognised as part of the cost of acquisition of the asset or as part of the expense item as applicable; and Receivables and payables, which are stated with the amount of GST included. The net amount of GST recoverable from, or payable to, the taxation authority is included as part of receivables or payables in the balance sheet. Cash flows are included in the Cash Flow Statement on a gross basis and the GST component of cash flows arising from investing and financing activities, which is recoverable from, or payable to, the taxation authority is classified as part of operating cash flows. Commitments and contingencies are disclosed net of the amount of GST recoverable from, or payable to, the taxation authority. g) Financial instruments Financial instruments comprise cash and cash equivalents, term deposits, trade and other receivables and trade and other payables. Financial instruments are recognised initially at fair value plus, for instruments not at fair value through profit or loss, any directly attributable transaction costs. A financial instrument is recognised if the becomes a party to the contractual provisions of the instrument. Financial assets are derecognised if the s contractual rights to the cash flows from the financial assets expire or if the transfers the financial asset to another party without retaining control or substantially all risks and rewards of the asset. Financial liabilities are derecognised if the s obligations specified in the contract expire or are discharged or cancelled. Impairment of Financial Assets The Company assesses at each balance date whether there is objective evidence that a financial asset or a group of financial assets is impaired. A financial asset is considered to be impaired if objective evidence indicates that one or more events have had a negative effect on the estimated future cash flows of that asset. Individually significant financial assets are tested for impairment on an individual basis. The remaining financial assets are assessed collectively in groups that share similar characteristics. All impairment losses are recognised in profit or loss. An impairment loss in respect of a financial asset measured at amortised cost is calculated as the difference between its carrying amount, and the present value of the estimated future cash flows discounted at the original effective interest rate. Receivables with a short duration are not discounted. An impairment loss is reversed if the reversal can be related objectively to an event occurring after the impairment loss was recognised. For financial assets measured at amortised cost the reversal is recognised in profit or loss. h) Cash and cash equivalents Cash and cash equivalents in the balance sheet comprise cash at bank and in hand and short term deposits with an original maturity of three months or less that are readily convertible to known amounts of cash and which are subject to an insignificant risk of changes in value. notes continue over page 15
18 For the purpose of the Cash Flow Statement, cash and cash equivalents includes cash on hand, deposits held at call with banks and investments in money market instruments, net of bank overdrafts. i) Employee entitlements (i) Wages, salaries and annual leave Liabilities for wages and salaries, including non-monetary benefits and annual leave expected to be settled within 12 months of the reporting date are recognised in respect of employees services up to the reporting date. They are measured at the amounts expected to be paid when the liabilities are settled. (ii) Share based payment transactions All goods and services received in exchange for the grant of any share-based payment are measured at their fair values. Where employees and directors are rewarded using share-based payments, the fair values are determined by reference to the fair value of the equity instrument granted. The fair value is appraised at the grant date and excludes the impact of non-market vesting conditions. j) Provisions Provisions are recognised when the has a present obligation (legal or constructive) as a result of a past event, it is probable that an outflow of resources embodying economic benefits will be required to settle the obligation and a reliable estimate can be made of the amount of the obligations. Provisions are measured at the present value of management s best estimate of the expenditure required to settle the present obligation at the balance sheet date. When the expects some or all of a provision to be reimbursed the reimbursement is recognised as a separate asset but only when the reimbursement is virtually certain. The expense relating to any provision is presented in the profit and loss net of any reimbursement. k) Inventories Inventories including raw materials, work in progress and finished goods are valued at the lower of cost and net realisable value. Costs incurred in bringing each product to its present location and condition are accounted for as follows: Raw materials purchase cost on a first-in, first-out basis. The cost of purchase comprises the purchase price, import duties and other taxes (other than those subsequently recoverable by the entity from the taxing authorities), transport, handling and other costs directly attributable to the acquisition of raw materials. Volume discounts and rebates are included in determining the cost of purchase. Finished goods and work-in-progress cost of direct materials and labour and a proportion of variable and fixed manufacturing overheads based on normal operating capacity. Costs are assigned on the basis of weighted average costs. Net realisable value is the estimated selling price in the ordinary course of business, less estimated costs of completion and the estimated costs necessary to make the sale. l) Research and development costs Research expenditure is recognised in profit or loss in the period that it is incurred. Development costs are capitalised where future benefits are expected to exceed those costs, otherwise they are recognised in profit or loss in the period that they are incurred. Capitalised development costs are subject to impairment testing. Unamortised costs are reviewed at each balance date to determine the amount (if any) that is no longer recoverable and any amount so identified is written off. An intangible asset arising from development expenditure on an internal project is recognised only when the can demonstrate the technical feasibility of completing the intangible asset so that it will be available for use or sale, its intention to complete and its ability to use or sell the asset, how the asset will generate future economic benefits, the availability of resources to complete the development and the ability to measure reliably the expenditure attributable to the intangible asset during its development. Following the initial recognition of the development expenditure, the cost model is applied requiring the asset to be carried at cost less any accumulated amortisation and accumulated impairment losses. Any expenditure so capitalised is amortised over the period of expected benefit from the related project. 16
19 m) Leases The determination of whether an arrangement is or contains a lease is based on the substance of the arrangement and requires an assessment of whether the fulfilment of the arrangement is dependent on the use of a specific asset or assets and the arrangement conveys a right to use the asset. as a lessee: Finance leases, which transfer to the substantially all the risks and benefits incidental to ownership of the leased item, are capitalised at the inception of the lease at the fair value of the leased asset or, if lower, at the present value of the minimum lease payments. Lease payments are apportioned between the finance charges and reduction of the lease liability so as to achieve a constant rate of interest on the remaining balance of the liability. Finance charges are recognised as an expense in profit or loss. Capitalised leased assets are depreciated over the shorter of the estimated useful life of the asset and the lease term if there is no reasonable certainty that the will obtain ownership by the end of the lease term. Operating lease payments are recognised as an expense in profit or loss on a straight line basis over the lease term. Operating lease incentives are recognised as a liability when received and subsequently reduced by allocating lease payments between rental expense and reduction of the liability. n) Foreign currencies (i) Functional and presentation currency Both the functional and presentation currency of Sealegs Corporation Limited and its New Zealand subsidiary is New Zealand dollars ($). The United States subsidiaries functional currency is United States Dollars which is translated to the presentation currency (see below for consolidated reporting). (ii) Transactions and balances Transactions in foreign currencies are converted at the New Zealand rate of exchange ruling at the date of the transaction. At balance date foreign currency monetary assets and liabilities are translated at the closing rate and exchange variations arising from these translations are recognised in profit or loss. (iii) Translation of Companies functional currency to presentation currency The results of the United States subsidiaries are translated into New Zealand Dollars (presentation currency) at the average monthly exchange rate for each transaction. Assets and liabilities are translated at exchange rates prevailing at reporting date. Exchange variations resulting from the translation are recognised in the foreign currency translation reserve. On consolidation, exchange differences arising from the translation of the net investment in United States subsidiaries are taken to the foreign currency translation reserve. On consolidation, exchange differences arising from monetary items that form part of net investment in the United States subsidiary are recognised initially in foreign currency translation reserve and will be reclassified from equity to profit or loss on disposal of the net investment in that subsidiary. o) Revenue recognition policy Revenue is recognised and measured at the fair value of the consideration received or receivable to the extent it is probable that the economic benefits will flow to the and the revenue can be reliably measured. The following specific recognition criteria must also be met before revenue is recognised: (i) Sale of goods Local sales are generally recorded on the day the boat is picked up by or delivered to the customer at which time all the risks and rewards of ownership pass to the customer. Export sales, unless otherwise specified in the sales contract, are generally recorded on the day the boat is uplifted from Sealegs premises, at which time all the risks and rewards of ownership pass to the customer.. Deposits on orders are held as a current liability on the balance sheet until such time that revenue from the sale is recognised in profit or loss. notes continue over page 17
20 (ii) Government Grants Government grants are recognised when there is reasonable assurance that they will be received and that the will comply with the conditions associated with the grant. Grants that compensate the for expenses incurred are recognised in profit or loss on a systematic basis in the same periods in which the expenses are recognised. Grants that compensate the for the cost of an asset are recognised in profit or loss on a systematic basis over the useful life of the asset. (iii) Service revenue Revenue from the servicing and repair of boats is recorded at the time of completion, which is generally on the day the boat is picked up by or delivered back to the customer. p) Borrowing costs All borrowing costs are recognised as an expense in the period they are incurred, as there are no qualifying assets against which interest needs to be capitalised. q) Trade and other payables Trade and other payables are carried at amortised cost and due to their short term nature they are not discounted. They represent liabilities for goods and services provided to the prior to the end of the financial year that are unpaid and arise when the becomes obliged to make future payments in respect of the purchase of these goods and services. The amounts are unsecured and are usually paid within 30 days of recognition. r) Contributed equity Ordinary shares are classified as equity. Incremental costs directly attributable to the issue of new shares or options are shown in equity as a deduction, net of tax, from the proceeds. s) Earnings per share Basic earnings per share is calculated as net profit attributable to members of the parent, adjusted to exclude any costs of servicing equity (other than dividends), divided by the weighted average number of ordinary shares. The dilutive effect of outstanding options is reflected as additional share dilution in the computation of diluted earnings per share (further details are given in Note 9) t) Impairment of non financial assets Intangible assets that have an indefinite useful life are not subject to amortisation and are tested annually for impairment, or more frequently if events or changes in circumstances indicate that they might be impaired. Other assets are tested for impairment whenever events or changes in circumstances indicate that the carrying amount may not be recoverable. The conducts an annual internal review of asset values, which is used as a source of information to assess for any indicators of impairment. External factors, such as changes in expected future processes, technology and economic conditions, are also monitored to assess for indicators of impairment. If any indication of impairment exists, an estimate of the asset s recoverable amount is calculated. An impairment loss is recognised for the amount by which the asset s carrying amount exceeds its recoverable amount. Recoverable amount is the higher of an asset s fair value less costs to sell and value in use. For the purposes of assessing impairment, assets are grouped at the lowest levels for which there are separately identifiable cash inflows that are largely independent of the cash inflows from other assets or groups of assets (cash-generating units). Non-financial assets, other than goodwill, that suffered an impairment are tested for possible reversal of the impairment whenever events or changes in circumstances indicate that the impairment may have reversed. u) Use of estimates and judgments The preparation of financial statements requires management to make judgements, estimates and assumptions that affect the application of accounting policies and the reporting amounts of assets, liabilities, income and expenses. Actual results may differ from these estimates. Estimates and judgements are continually evaluated and are based on historic experience and other factors including expectations of future events that are believed to be reasonable. Revisions to accounting estimates are recognised 18
 Share-based payment transactions The measures the cost of equity-settled transactions with employees and directors by reference to the fair value of the equity instruments at the date at which")
21 in the period in which the estimate is revised and in any future periods affected. (i) Share-based payment transactions The measures the cost of equity-settled transactions with employees and directors by reference to the fair value of the equity instruments at the date at which they are granted. The fair value is determined by an external valuer using option pricing models or by reference to the quoted price of equity instruments. The accounting estimates and assumptions relating to equity-settled share-based payments would have no significant impact on the carrying amounts of assets and liabilities within the next annual reporting period but may impact expenses and equity. (ii) Capitalised development costs Development costs are only capitalised by the when it can be demonstrated that all the conditions under NZ IAS 38 are satisfied. This includes reliably estimating the amount of time and cost which has been incurred in developing the asset. As part of this process management performs an assessment for each asset to determine both the intention to complete and the ability to use or sell the asset. This assessment includes judgement around the future economic benefits which the will derive from future sales which includes judgment and estimates around both the size of the market opportunity and an assessment of the markets in which the products will likely be sold. Once the asset has been capitalised management need to estimate the period over which costs will be amortised which includes an assessment of the intangible life of the intangible asset along with the number of units that will be sold. (iii) Warranty claims provision In determining the level of provision required for warranty expenses the has made judgements in respect of the expected performance of the product and the costs of fulfilling any warranty claims. Historical experience and current knowledge of the performance of the products has been used in determining this provision. (iv) Going Concern The Company assumption is that the financial statements are prepared on a going concern basis. Further details are given in note 25. (v) Impairment The main estimation used by the is the recoverable amount of the cash generating unit which is used for the purpose of impairment testing of intangible assets. v) Operating segments An operating segment is a component of an entity that engages in business activities from which it may earn revenues and incur expenses (including revenues and expenses relating to transactions with other components of the same entity), whose operating results are regularly reviewed by the entity s chief operating decision maker to make decisions about resources to be allocated to the segment and assess its performance and for which discrete financial information is available. Operating segments have been identified based on the information provided to the chief operating decision makers - being the executive management team. The Company and operating results are reviewed by the executive management team as a single operating unit; manufacturing and selling amphibious marine crafts. The Fleet of Sealegs Amphibious Craft in Malaysia continues to grow in 2017 notes continue over page 19
22 w) New standards and interpretation The following issued Standards, Interpretations and Amendments have not been applied by the : Standard/Interpretation Effective Date Applicable Date NZ IFRS 9 - Financial Instruments 1 January April 2018 NZ IFRS 15 - Revenue Recognition 1 January April 2018 NZ IFRS 16 - Leases 1 January April 2019 NZ IFRS 15 Summary NZ IFRS 15 establishes principles for reporting useful information to users of financial statements about the nature, amount, timing and uncertainty of revenue and cash flows arising from and entity s contracts with customers. NZ IFRS 15 supersedes NZ IAS 18 Revenue. The core principal of NZ IFRS 15 is that an entity recognises revenue to depict the transfer of promised goods or services to customers in an amount that reflects the consideration to which the entity expects to be entitled to in exchange for those goods or services. An entity will recognise revenue in accordance with that core principal by applying the following steps: (a) Identify the contract(s) with the customer; (b) Identify the performance obligations in the contract; (c) Determine the transaction price; (d) Allocate the transaction price to the performance obligations within the contract; (e) Recognise revenue when (or as) the entity satisfies the performance obligation. NZ IFRS 15 Impact on The group has assessed the impact of the changes in NZ IFRS 15 on its accounting policy for the recognition of revenue. Upon adoption NZ IFRS 15 is not expected to have a material impact on revenue recognition. NZ IFRS 16 Summary NZ IFRS 16 sets out the principles for the recognition, measurement, presentation and disclosure of leases. The Standard eliminates the classification of leases as either operating or finance leases. Instead, there is a single lessee model which requires a lessee to recognise on the statement of financial position assets and liabilities for all leases with a term of more than 12 months, unless the underlying asset is of low value. Lessees will be required to recognise a liability to pay rentals with a corresponding asset, and recognise interest expense and depreciation separately. Reassessment of certain key considerations (e.g. lease term, variable rents based on an index or rate, discount rate) by the lessee is required upon certain events. NZ IFRS 16 Impact on The has very few lease commitments however for those it does have will require it to recognise a Right-ofuse Asset and a corresponding Finance Liability in the statement of financial position for those leases. This change will also affect the profile of expenses (interest and depreciation) and the timing of these expenses relative to the lease payments which are currently recognised. If the had applied NZ IFRS 16 in preparing the financial statements the impact on the Statement of Financial Position as at 31 March 2017 would be a reduction in net assets of $18k (Right of Use Asset of $663k and a Finance Liability of $681k). NZ IFRS 9 Summary NZ IFRS 9 introduces new requirements for the classification and measurement of financial assets and liabilities. These requirements improve and simplify the approach for classification and measurement of financial assets compared with the requirements if NZ IAS 39. NZ IFRS 9 Impact on The does not hold financial instruments other than cash and short-term accounts receivable and payable and therefore doesn t expect the accounting change to impact on the. 20
23 2. Cost of sales Note Total cost of sales 11,962,386 13,264,770 less depreciation reclassified to Depreciation, Amortisation and Impairment (244,659) (304,869) Cost of sales less depreciation 11,717,727 12,959, Administrative and occupancy expenses The following items of expenditure are included in administrative and occupancy expenses*: Operating lease expense 145, ,680 Corporate Governance and reporting expenses 754, ,774 Professional fees 318, ,815 Auditor's remuneration to Ernst & Young comprises: Audit of financial statements 67,000 62,000 Tax compliance 8,000 13,750 Tax advisory 10,280 6,242 Total auditors remuneration 85,280 81,992 * Prior period line item presentation has been revised to reflect the revised Income Statement presentation. 4. Personnel expenses Wages and salaries 3,237,520 3,639,531 Defined contribution benefits 76,139 80,978 Share-based payments - - Directors' compensation 6 175, ,416 Total personnel expense 3,488,659 4,252, Finance income Interest income 9,457 12,715 Finance income 9,457 12,715 notes continue over page 21
24 6. Directors' compensation Directors' fees 175, ,957 Total directors' compensation 175, ,957 David McKee Wright was a Director until 31 December 2016 and his remuneration was paid for services as CEO and is included in Note 22. Mark Broadley, through Capital Key Holdings Limited, has been contracted by Future Mobility Solutions Limited to provide certain investment banking and advisory services for the Company beyond those expected to be provided in his capacity as Director (see Note 22). 7. Taxation Profit / (Loss) from continuing operations before income tax 627, ,576 Prima facie income 28% (2016: 28%) 175, ,121 Non-deductible expenses 3,445 - Share based payments 106,400 - Intangible amortisation / impairment 109,747 - Utilisation of tax losses (395,382) (142,121) Income tax expense - - The income tax expense is represented by: Current tax 395, ,121 Deferred tax (395,382) (142,121) Income tax expense reported in Profit or Loss - - A deferred tax asset has not been recognised to the extent that it is not probable that taxable profit will be available against which the unused tax losses can be utilised. Future Mobility Solutions has tax losses of $26,135,383 (2016: $28,292,027) to carry forward. These taxation losses are subject to Inland Revenue Department approval and continued compliance with legislation for the carry forward of tax losses. 8. Imputation credit account The amount of imputation credits available for use in subsequent reporting periods
25 9. Earnings per share Gain (Loss) attributable to ordinary shareholders 648, ,003 Weighted average number of ordinary shares issued 133,591, ,517,795 Effect of dilution: Share based payment 22 1,500,000 - Total potential ordinary shares 135,091, ,517,795 Cents Cents Basic earning/(deficit) per share Diluted earning/(deficit) per share Basic EPS amounts are calculated by dividing the profit for the year attributable to ordinary equity holders of the parent by the weighted average number of ordinary shares outstanding during the year. Diluted EPS amounts are calculated by dividing the profit attributable to ordinary equity holders of the parent by the weighted average number of ordinary shares outstanding during the year plus the weighted average number of ordinary shares that would be issued on conversion of all the dilutive potential ordinary shares into ordinary shares. 10. Share capital Shares $ Shares $ Opening ordinary shares (issued and authorised) 133,517,795 56,432, ,517,795 56,432,440 Ordinary shares issued during the year 1,000, , Share options exercised during the year Closing ordinary shares 134,517,795 56,602, ,517,795 56,432,440 Total share capital 134,517,795 56,602, ,517,795 56,432, ,517,795 (2016: 133,517,795) ordinary shares are fully paid and have no par value. All ordinary shares have equal voting rights and share equally in dividends and surplus on winding up. There are no uncalled shares as at 31 March 2017 (2016: nil). (a) Capital management When managing capital, management s objective is to ensure the entity continues as a going concern as well as to maintain optimal returns to shareholders and benefits for other stakeholders. Management also aims to maintain a capital structure that ensures the lowest cost of capital available to the entity. Management consider shareholders equity as managed capital. As the market is constantly changing, management may issue new shares or rights. The has no externally imposed capital requirements. During 2017, no dividends were paid (2016: nil). Directors do not plan to pay dividends for the foreseeable future. notes continue over page 23
26 11. Trade and other payables Current Trade payables 1,067,338 1,169,891 Sundry payables and accruals 630, ,263 Total payables 1,697,865 2,139,154 Due to the short term nature of these payables, their carrying value is assumed to approximate their fair value. For terms and conditions relating to related party payables refer to note Financial Instruments The s principal financial instruments comprise receivables, payables, cash and short and long-term deposits. Risk exposures and responses The manages its exposure to key financial risks, including interest rate and currency risk in accordance with the 's financial risk management policy. The objective of the policy is to support the delivery of the 's financial targets while protecting future financial security. The main risks arising from the s financial instruments are credit risk and liquidity risk. The uses different methods to measure and manage different types of risks to which it is exposed. Aging analysis and monitoring of specific credit allowances are undertaken to manage credit risk. Liquidity risk is monitored through the development of future rolling cash flow forecasts. The board reviews and agrees policies for managing each of these risks as summarised below. Primary responsibility for identification and control of financial risks rests with management. The board reviews and agrees policies for managing each of the risks identified below, including credit allowances, and future cash flow forecast projections. (i) Credit risk Credit risk arises from the financial assets of the, which comprise cash and cash equivalents and trade and other receivables. The s exposure to credit risk arises from potential default of the counter-party, with a maximum exposure equal to the carrying amount of the financial assets (as outlined in each applicable note). The trades only with recognised, credit-worthy third parties, and as such collateral is not requested nor is it the s policy to securitise its trade and other receivables. Management has a credit policy in place and the exposure to credit risk is monitored on an on-going basis. This is assessed and monitored as follows: Cash and bank balances 3,236,047 1,787,328 Trade receivables 509, ,581 Other receivables 407, ,121 The regularly assesses the recoverability of debtor balances and makes provisions for specific debtors where the ultimate collection of balances owed are considered to be unlikely. At 31 March 2017, trade receivables at a nominal value of $Nil were impaired and fully provided for (2016: $10,118). Movements in the provision for impairment of receivables were as follows: 24
27 Individually Impaired Individually Impaired Balance at the start of the year 10,118 - Charged during the year (10,118) 10,118 At 31 March - 10,118 The status of trade and other receivables at the reporting date are as follows: Gross Receivable Gross Receivable 0-30 days 453, , days 25,529 20, days PDNI* 437, , days CI** days PDNI* days CI** - 10,118 * Past due not impaired ( PDNI ) ** Considered impaired ( CI ) 916,975 1,320,702 Receivables past due but not considered impaired are: $437,483 (2016: $806,165). The majority of this remaining balance outstanding was received in May Term deposits are only held with reputable financial institutions. (ii) Liquidity risk Liquidity risk arises from the financial liabilities of the and the 's subsequent ability to meet their obligations to repay their financial liabilities as and when they fall due. The 's objective is to maintain a balance between continuity of funding and flexibility through the use of finance leases, committed available credit lines and potential share issues. The manages its liquidity risk by monitoring the total cash outflows expected on a monthly basis. The following tables set out the contractual cash flows for all financial liabilities: Trade and other payables 6 months or less 2,130,090 2,863, months years years - - More than 5 years - - Total 2,130,090 2,863,771 notes continue over page 25
28 (iii) Foreign currency risk The foreign currency concentration of cash balances held at year end are as follows: New Zealand Dollar (NZD) 2,294,142 1,102,594 United States Dollar reported in NZD 452, ,168 Australian Dollar reported in NZD 488, ,566 3,236,047 1,787,328 The net assets employed through its subsidiary company exposes the to foreign currency risk as a result of changes in the USD/NZD exchange rate. The also has foreign currency risk resulting from sales of product in a currency which is other than that of the New Zealand Dollar. At 31 March 2017, had the New Zealand Dollar moved as illustrated in the following table with all other variables held constant, post tax profit and equity would have been affected as follows: IMPACT ON 2017 REPORTED IMPACT ON 2016 REPORTED Change in Income Statement Equity Change in Income Statement GROUP Equity NZD/USD +5% (4,372) 175,971 (4,348) 155,264 NZD/USD -5% 4,832 (194,495) 4,805 (171,608) NZD/AUD + 5% 27,986-18,882 - NZD/AUD - 5% (30,932) - (20,869) - The above table calculates the impact of a change in foreign exchange rates on closing equity and post-tax profits of the, as a result of the being counter-party to transactions which are foreign currency denominated. Foreign currency denominated balances include trade and other receivables, trade payables and accruals and cash on hand. The net foreign currency exposure is determined in aggregate and the impact on post-tax profits determined as a result of a +/- 5% movement in foreign exchange rates. The impact upon the 's equity balance is derived through determining the impact on post-tax profits as noted above. 13. Receivables Current Trade receivables 509, ,581 Sundry receivables 407, , ,975 1,320,702 26
 80,000 Utilised (81,000) (107,000) Balance as at 31 March")
29 14. Inventories Raw materials 1,680,020 2,513,148 Work in progress 732,269 1,382,453 Finished goods 2,289,858 1,354,826 Goods in transit 315,538 - Total inventories 5,017,685 5,250, Warranty Provision Movement in warranty provision Balance as at 1 April 198, ,000 Arising during the year 92,000 98,000 Other (77,000) 80,000 Utilised (81,000) (107,000) Balance as at 31 March 132, ,000 The has recognised a $1,000 per boat provision for all boats sold during the last 12 months to cover any warranty claims that may be made. This provision is based on the s experience of warranty claims. Cash outflows are expected to be settled within 12 months. 16. Subsidiaries Percent held Significant subsidiaries: Balance date Sealegs International Limited 31st March 100% 100% Sealegs (US) Corporation 31st March 100% 100% Sealegs International Limited Country of incorporation The Company manufactures amphibious marine craft. New Zealand Sealegs (US) Corporation The Company imports amphibious marine craft. United States of America Testing the Sealegs 7.7m Sport D-Tube for Alloy Boat Magazine notes continue over page 27
30 17. Property, plant and equipment Computer equipment - opening net book value 15,715 17,209 Additions 5,441 9,750 Disposals - - Impairment - (2,361) FX translation (41) 113 Depreciation (8,781) (8,996) Computer equipment - closing net book value 12,334 15,715 Computer Equipment - Cost 177, ,996 Accumulated depreciation and impairment losses (165,103) (156,282) Computer equipment - closing net book value 12,334 15,715 Plant and equipment - opening net book value 1,024,612 1,333,314 Additions 15,385 77,187 Transfers 91,851 28,869 Disposals (19,852) (84,778) Impairment (18,302) (19,900) FX translation (417) 4,628 Depreciation (251,427) (314,708) Plant and equipment - closing net book value 841,850 1,024,612 Plant and equipment - Cost 3,138,301 3,031,065 Accumulated depreciation and impairment losses (2,296,451) (2,006,453) Plant and equipment - closing net book value 841,850 1,024,612 Furniture and fittings - opening net book value 30,788 49,183 Additions 10,765 11,643 Disposals (147) - Impairment (970) (15,549) FX translation (120) 3,343 Depreciation (12,084) (17,833) Furniture and fittings - closing net book value 28,231 30,788 Furniture and fittings - Cost 212, ,751 Accumulated depreciation and impairment losses (184,286) (170,964) Furniture and fittings - closing net book value 28,231 30,788 Leased equipment - Cost 849, ,841 Accumulated depreciation and impairment losses (849,841) (849,841) Leased equipment - closing net book value - - Total cost 4,378,096 4,254,653 Total accumulated depreciation and impairment losses (3,495,681) (3,183,541) Total closing net book value 882,415 1,071,114 28
31 18. Intangible assets Reconciliation of carrying amounts at the beginning and end of the period Computer Software Development Costs Patents and Trademarks Total At 1 April 2016 net of accumulated amortisation and impairment 11,127 2,376, ,846 2,534,592 Acquisitions - 16,828 44,880 61,708 Internally developed Amortisation for the year (10,511) (214,187) (29,657) (254,355) Impairment charge - (145,262) - (145,262) Transferred to inventory - (106,311) - (106,311) At 31 March 2017 net of accumulated amortisation and impairment 616 1,927, ,069 2,090,370 Cost (gross carrying amount) 271,413 2,923, ,937 3,721,498 Accumulated amortisation and impairment (270,797) (995,463) (364,868) (1,631,128) Net carrying amount 616 1,927, ,069 2,090,370 Computer Software Development Costs Patents and Trademarks Total At 1 April 2015 net of accumulated amortisation and impairment 26,642 1,895, ,522 2,084,747 Acquisitions ,274 19,274 Internally developed - 1,088,750-1,088,750 Amortisation for the year (15,515) - (34,950) (50,465) Impairment charge Transferred to inventory - (530,049) - (530,049) Government grants applied - (77,665) - (77,665) At 31 March 2016 net of accumulated amortisation and impairment 11,127 2,376, ,846 2,534,592 Cost (gross carrying amount) 271,413 3,012, ,057 3,766,102 Accumulated amortisation and impairment (260,286) (636,013) (335,211) (1,231,510) Net carrying amount 11,127 2,376, ,846 2,534,592 notes continue over page 29

32 19. Deferred revenue At 1 April 1,012, ,242 Deferred during the year 778,196 1,012,714 Released to statement of profit or loss (1,012,714) (747,242) At 31 March 778,196 1,012,714 Current 778,196 1,012,714 Non-current ,196 1,012,714 Deferred revenue refers to boats on order where payment has being received in the current financial year but will not be delivered until post balance date which is in line with the s revenue recognition policy. 20. Commitments Operating lease commitments The has entered into a commercial lease on its premises. The lease is for 6 years, with a renewal option included within the contract which was exercised at 31 March 2016 for a further term of 3 years. There are no restrictions placed upon the lessee by entering into the lease. The has entered into a commercial lease on its USA premises. The lease is for 3 years, with a renewal option included within the contract which was exercised at 01 July 2016 for a further term of 2 years. There are no restrictions placed upon the lessee by entering into the lease. Other operating lease commitments include short-term car leases. Future minimum rentals payable under non-cancellable operating leases as at 31 March are as follows: Within one year 469, ,303 One to five years 389, ,778 Total minimum lease payments 858,992 1,158,081 Sealegs Luxury RIB on display at Auckland on Water Boat Show
33 21. Reconciliation of reported surplus (deficit) after taxation with cash flows from operating activities Reported income (deficit) after taxation 627, ,576 Add non-cash items and non-operating items: Amortisation of intangible assets 254,355 50,465 Depreciation and impairment of fixed assets 291, ,348 Impairment of development costs 145,262 - Other non cash items 400,846-1,092, ,812 Movement in working capital Increase (decrease) in payables & accruals (968,201) 184,373 (Increase) decrease in receivables 403,727 (711,665) (Increase) decrease in other current assets 118,974 18,686 (Increase) decrease in inventory 232,743 (123,991) Net cash flows from operating activities 1,507, , Related parties (a) Transactions with related parties Sealegs Europe is owned by QCPM Limited, a subsidiary of Avenport Investment Corporation Limited. Eric Series is a director of Future Mobility Solutions Limited and Avenport Investment Corporation Limited. Avenport is a significant shareholder in Future Mobility Solutions Limited. During the year, Sealegs Europe purchased four boats (2016: seven boats) for a total consideration of $588,364 (2016: $943,036). Roy Nourha is a director of ASIS Boats LLC and was a director of Future Mobility Solutions during the reporting period. During the year, Sealegs International Limited paid ASIS Boats LLC a total consideration of USD $Nil (2016: USD$112,830) The 2016 consideration paid was towards the development of three boats incorporating the Sealegs International Ltd amphibious enablement system. Damon Jolliffe is a director of West Rakino Limited trading under the names Quality Flags New Zealand, Apparel Direct NZ and Hauraki Fenders, and is considered a related party by virtue of being a member of key management of Sealegs. During the period, Sealegs International paid a total of $3,874 (2016: $5,790) to Quality Flags New Zealand, $23,599 (2016: $19,935) to Apparel Direct NZ and $Nil (2016: $1,820) to Hauraki Fenders. The payments were made under normal commercial terms and conditions. David McKee Wright and Maurice Bryham both have an interest in Blender Design Limited. David Mckee Wright is considered a related party by virtue of being a Director of Future Mobility Solutions Limited during the period and a member of key management personnel, and Maurice Bryham is considered a related party by virtue of being a member of key management of Sealegs International Limited. During the year, Sealegs International Limited paid Blender Design Limited a total consideration of $151,059 (2016: $178,554) towards various projects. notes continue over page 31
34 (b) Compensation for Key Management Personnel Included in the definition of related parties are Key Management Personnel having authority and responsibility for planning, directing and controlling the activities of the entity either directly or indirectly, including any Director. Management have assessed the composition of the Key Management and their compensation for the year ended 31 March 2017 is presented below: Short-term employee benefits 786, ,951 Incentives to key management personnel 195, ,000 Share-based payments 210,000 - Total compensation 1,191,293 1,109,951 David McKee Wright was issued 1,000,000 shares pursuant to an employment agreement between himself and Sealegs International Limited at an effective issue price of $0.25c per share to settle outstanding incentives from the prior reporting period. The FMS share price at grant date was $0.17c. Mark Broadley, through Capital Key Holdings Limited, has been contracted by Future Mobility Solutions Limited to provide certain investment banking and advisory services for the Company beyond those expected to be provided in his capacity as director. The contract is for a period of two years which ends 31 March Future Mobility Solutions Limited has recorded a share based payment of $210,000 in the reporting period being 1,500,000 shares at a price of 0.14c at grant date. 23. Contingent liabilities There are no contingent liabilities at balance date (2016: nil). 24. Revenue and Non-current Assets by Country (a) Revenues from external customers New Zealand 10,791,437 9,060,760 USA 2,153,407 2,759,888 Australia 1,519, ,245 Malaysia 570,000 2,070,187 United Kingdom 798,995 1,142,072 France 588, ,036 South Korea 211, ,000 China - 75,000 Germany - 330,586 Middle East - 257,765 Russia - 112,928 Other foreign countries 1,073, ,884 17,706,482 18,564,351 32
 Limited and S.A.")
35 (b) Non current assets Non current assets are located in the following geographic locations: Net book value Net book value New Zealand 3,009,309 3,636,076 USA 38,476 44,630 3,047,785 3,680, Going Concern The financial statements have been prepared on a going concern basis. The group has announced that it is in negotiations with Gemini Marine (PTY) Limited and S.A.S Sillinger to acquire a controlling stake in certain parts of those group s operations. The proposed consideration for those acquisitions comprises the issue of new shares and cash. The cash component is an amount up to NZD$3,350,000. In order for the to meet all obligations as they fall due, including financing the cash component of planned acquisitions, and providing working capital needs relating to those acquisitions, they are reliant upon raising additional capital through the placement of up to 13,400,000 new shares at a price of $0.25 per share or other means of financing. This creates a material uncertainty which may cast significant doubt on the ability of the group to continue as a going concern The Directors are confident that further capital can be raised from share placements or other means, to the extent required, should the planned acquisitions proceed. The Directors therefore consider the going concern assumption to be a valid basis on which to prepare these financial statements. In the event that the acquisitions proceed and the capital placements or other financing options are not achieved, the Directors would have to re-consider the going concern assumption and take appropriate action. If that process were to result in the Directors concluding that the was no longer a going concern, adjustments may have to be made to reflect the situation that assets may need to be realised other than at amounts at which they are currently recorded in the statement of financial position. In addition, the may have to provide for further liabilities that might arise. Sealegs amphibious craft up for charity auction at An Evening with Sir Richard Branson notes continue over page 33

36 26. Post balance date events The company held a Special General Meeting on 28 April 2017 at which the following items were approved: (i) The issue of 5,350,000 ordinary shares in the Company at an effective issue price of NZD 0.25 cents per share to QCPM Limited in satisfaction of the purchase price payable in connection with the acquisition, by the Company's wholly-owned subsidiary Sealegs International Limited, of all of the shares in Sealegs Europe SAS Limited. (ii) The issue of 3,566,000 ordinary shares in the Company at an effective issue price of NZD 0.25 cents per share to e Marck Holding to satisfy the non-cash portion of the purchase price payable in connection with the acquisition of 70% (5,432 shares) in S.A.S Sillinger. (iii) The issue of up to 4,300,000 ordinary shares in the Company at an effective issue price of NZD 0.25 cents per share to one or more current shareholders of Gemini Marine (Pty) Limited (but not including any Associated Persons) to satisfy the non-cash portion of the purchase price payable in connection with the acquisition by the Company of 50.1% of the shares in Gemini Marine (PTY) Limited. (iv) The issue of up to 13,400,000 ordinary shares in the Company to various investors (but not including any Associated Persons) at an issue price of NZD 0.25 cents per share in order for the Company to raise capital to satisfy the cash portion of the purchase price payable in connection with the acquisition by the Company of 5,432 shares in S.A.S Sillinger and the cash portion of the purchase price payable in connection with the acquisition by the Company of 50.1% of the shares in Gemini Marine (Pty) Limited. The rationale behind the acquisitions is to enable Future Mobility Solutions to both increase it's portfolio of brands in the marketplace and also to directly control the distribution of its products. It will ensure the Company has full control of its markets in continental Europe, Africa and various other countries and territories in the Indian Ocean rather than relying on a dealer for a portion of its selling activities. It will also help ensure consistency in its marketing, sales and pricing activities. The Company will benefit financially by eliminating the need to pay dealer margins on sales and also a level of cost rationalisation is expected to be achieved. In particular the cost of developing its own dealer platform would be expected to exceed the cost of the Sealegs Europe SAS Limited acquisition and any such development would take a number of years to complete risking the substantial network of goodwill and relationships that Sealegs Europe SAS Limited has built up. In the medium to long term this should give the Company greater flexibility to develop a coherent European and African strategy across all of its brands and will help to ensure the effective implementation of that strategy. This in turn will minimise the integration risk associated with the businesses that have been proposed to be acquired by the Company currently and those that the Company may acquire in the future. Competitors line up for the annual Sealegs Races as part of the Onetangi Beach Races
37 SHAREHOLDER INFORMATION Substantial Shareholders Future Mobility Systems Limited (a wholly owned subsidiary of Avenport Investment Corporation) Number of Shares Held Percentage Held 26,570, Avenport Investment Corporation 17,479, Capital Key Holdings Limited (the registered holder being the custodian - Citibank Nominees (New Zealand) Limited) 10,432, Statement of Directors Interests Present directors held an interest in the following equity securities in the Company: Eric Series Ordinary 44,049,864 44,049,864 Mark Broadley Ordinary 10,432,896 7,162,896 Wayne Mapp Ordinary 150, ,000 Share dealings by Directors Mark Broadley, through Capital Key Holdings Limited, has been contracted by Future Mobility Solutions Limited to provide certain investment banking and advisory services for the Company beyond those expected to be provided in his capacity as director. The contract is for a period of two years which ends 31 March Future Mobility Solutions Limited has recorded a share based payment of $210,000 in the reporting period being 1,500,000 shares at a price of 0.14c at grant date. Twenty Largest Shareholders as at 30 May 2017 Number of Shares Held Percentage Held Avenport Mobility Systems Limited 26,570, Avenport Investment Corporation 17,479, HSBC Nominees (New Zealand) Limited 14,862, Citibank Nominees 10,660, Raphael Chaikin 5,200, Brian Ernest Taylor 4,600, National Nominees New Zealand Limited 3,363, Izard Investments Ltd 3,153, Kenneth McKee Wright & Christina Carol McKee Wright 2,720, Tracy Ann Bryham 2,645, Pad Saint Riom SA 2,483, Marco Erwin Kleyn 1,898, Steve Napier Limited 1,408, J P Morgan Chase Bank 1,244, Brendan John Hodge & Lisa Ann Hodge 1,200, Fraser Wright Maddigan 1,126, Maurice Duncan Priest 1,100, David Kenneth McKee Wright 1,026, FNZ Custodians Limited 1,019, Glen James Robinson 950, ,712, Total number of shares on issue 137,517, Shareholder information continues over page 35
38 Distribution of Ordinary Shares Number of Holders Percentage Number of Shares Held 1,000 to 1, ,000 2,000 to 4, ,806,406 5,000 to 9, ,221,332 10,000 to 49, ,987,359 50,000 to 99, ,685, ,000 to 499, ,154, ,000 to 999, ,865,871 1,000, ,796,604 Principal Activities ,517,795 The principal activities of the Company and is the manufacture of amphibious marine craft. Directors Holding Office During the Year Parent: Future Mobility Solutions Limited Christopher Weir Appointed 20/10/2011 Eric Series Appointed 4/08/2010 Mark Broadley Appointed 16/02/2011 Wayne Mapp Appointed 11/11/2014 David McKee Wright Retired 31/12/2016 Roy Nouhra Retired 31/12/2016 Subsidiary: Sealegs International Limited David McKee Wright Appointed 11/11/2014 Christopher Weir Appointed 1/03/2017 Remuneration of Directors Non-Executive Directors Christopher Weir 40,000 25,000 Eric Series 25,000 25,000 Mark Broadley 1 250,000 33,625 Wayne Mapp 40,000 - Roy Nouhra (retired 31/12/16) 30,000 Executive Directors 2 David McKee Wright (retired 31/12/16) 229,475 NZ$ NZ$ 1 Includes share based payment for providing certain investment banking and advisory services for the Company beyond those expected to be provided in his capacity as Director. 2 Executive Directors remuneration includes salary and benefits received in their capacity as employees. Executive Directors do not receive Directors fees. 36
39 Remuneration of Employees Section 211(1)(g) of the New Zealand Companies Act 1993 requires disclosure of remuneration and other benefits, including redundancy and other payments made on termination of employment, in excess of $100,000 per year, paid by the Company or any of its subsidiaries worldwide to any employees who are not Directors of the Company. The number of employees as at 31 March 2017 who are not directors, whose remuneration and benefits exceeded $100,000 in the financial year was: Parent $100,001 - $110, $110,001 - $130, $130,001 - $140, $140,001 - $150, $150,001 - $200, $201,000 - $250,000 2 $250,001 - $300,000 1 Entries in the Interests Register The Company has entered into deeds of indemnity with each director pursuant to which it has agreed to indemnify them against liability incurred by them arising out of their acts or omissions in their capacity as a director of the Company, subject to certain exceptions which are normal in such indemnities. The Company has in place directors' and officers' liability insurance to cover risks normally covered by such policies arising our of acts or omissions of directors or employees of the Company in that capacity. There were transactions with directors. Refer note 22 for additional information. Independent Directors The board has determined the following directors to be Independent Directors: - Christopher Weir - Wayne Mapp - Roy Nouhra (retired 31/12/16) The remaining directors are not independent, due to their shareholding interests. Annual General Meeting The 2017 Annual General Meeting of Sealegs Corporation Limited is to be held on Friday 29 September 2017 at 9am, at the offices of Sealegs International Ltd, 5 Unity Drive South, Auckland, New Zealand. For and on behalf of the board: Christopher Weir Mark Broadley Director Director 2 June June
40 CORPORATE GOVERNANCE The Company and are committed to a high standard of corporate behaviour and ethics and has adopted a code of ethics and board, audit and remuneration committee charters. These principles differ from NZX's Corporate Governance Best Practice Code only in that: a) the Company has not established a nominations committee; and b) given the size of the board, the company s audit committee has a majority of non-executive directors. Directors & Officers Board meeting attendance Directors Board meetings Eric Series (Chairman) 5 Christopher Weir 5 David McKee Wright (retired 31/12/16) 4 Mark Broadley 6 Wayne Mapp 5 Roy Nouhra (retired 31/12/16) 2 Officers David McKee Wright 2 Audit Committee Christopher Weir (Chairman) Mark Broadley Wayne Mapp The function of this audit committee is to assist the board in carrying out its responsibilities regarding management's accounting practices, policies and controls relative to the Company and s' financial results and to review and make appropriate inquiry into the audits of the Company and s accounts. Diversity A breakdown of gender composition of directors and officers as at 31 March 2017 is shown below; Male Female Directors 4 - Officers 1,2 5-1 Excludes Chief Executive Officer (included in breakdown of Directors) 2 Officers includes those employees who the directors have deemed to have disclosure obligations under section 19T of the Securities Market Act 1988 and is consistent with that used for the Compensation for key management personnel disclosure in the Financial Statements (note 24). The Company does not have a formal Diversity policy. 38
41 DIRECTORY Company Number HN/ Date of Incorporation 16 July 1987 Directors Eric Series (Chairman) Christopher Weir Mark Broadley Wayne Mapp Registered Office 5 Unity Drive South, Albany, Auckland 0632 New Zealand Phone (+64 9) Fax (+64 9) info@futuremobilitysolutions.net Website Auditor Ernst & Young, Auckland, New Zealand Lawyers Buddle Findlay, Auckland, New Zealand Bankers ASB Bank Limited, Auckland, New Zealand ANZ Banking (New Zealand) Limited, Auckland, New Zealand Citibank, N.A., San Antonio, Texas, United States of America Share Registry Computershare Investor Services Limited Private Bag Auckland 1142 Phone (+64 9) Fax (+64 9) enquiry@computershare.co.nz 39
42 40

43 Sealegs at the Auckland on Water Boat Show, 2016
For personal use only
 FINANCIAL REPORT FOR THE FINANCIAL YEAR ENDED 30 JUNE 1 FINANCIAL STATEMENTS YEAR ENDED 30 JUNE CONTENTS Page Directors Responsibility Statement 3 Independent Auditor s Report 4 Consolidated Income Statement
Continuing operations Revenue 3(a) 464, ,991. Revenue 464, ,991
 464, ,991. Revenue 464, ,991") STATEMENT OF PROFIT OR LOSS For the year ended 30 June 2017 Consolidated Consolidated Note Continuing operations Revenue 3(a) 464,411 323,991 Revenue 464,411 323,991 Other Income 3(b) 4,937 5,457 Share
STATEMENT OF PROFIT OR LOSS For the year ended 30 June 2017 Consolidated Consolidated Note Continuing operations Revenue 3(a) 464,411 323,991 Revenue 464,411 323,991 Other Income 3(b) 4,937 5,457 Share
Financial Statements. - Directors Responsibility Statement. - Consolidated Statement of Comprehensive Income
 X.0 HEADER Financial Statements - Directors Responsibility Statement - Consolidated Statement of Comprehensive Income - Consolidated Statement of Financial Position - Consolidated Statement of Changes
powered by innovation
 INTERIM REPORT FOR THE SIX MONTHS ENDED 30 SEPTEMBER 2017 2 powered by innovation TABLE OF CONTENTS Chairman and Chief Executive Officer's Report 4-5 Interim Consolidated Statement of Comprehensive Income
FInAnCIAl StAteMentS
 Financial STATEMENTS The University of Newcastle ABN 157 365 767 35 Contents 106 Income statement 107 Statement of comprehensive income 108 Statement of financial position 109 Statement of changes in equity
Notes to the financial statements
 11 1. Accounting policies 1.1 Nature of business Super Group Limited (Registration number 1943/016107/06), the holding Company of the Group (the Company), is a Company listed on the Main Board of the JSE
NOTES TO THE FINANCIAL STATEMENTS
 NOTES TO THE FINANCIAL STATEMENTS 1. ACCOUNTING POLICIES 1.1 Nature of business Super Group Limited (Registration number 1943/016107/06), the holding Company (the Company) of the Group, is a Company listed
Evolve Education Group Limited. Consoltdated Financial Statements. For the Year Ended 31 March 2018
 evolve e d u c at io n gro u p Evolve Education Group Limited Consoltdated Financial Statements For the Year Ended 31 March 2018 The Directors present the Consolidated Financial Statements of Evolve Education
BLUESCOPE STEEL LIMITED FINANCIAL REPORT 2011/2012
 BLUESCOPE STEEL LIMITED FINANCIAL REPORT / ABN 16 000 011 058 Annual Financial Report - Page Financial statements Statement of comprehensive income 2 Statement of financial position 3 Statement of changes
BlueScope Financial Report 2013/14
 BlueScope Financial Report /14 ABN 16 000 011 058 Annual Financial Report - Page Financial statements Statement of comprehensive income 2 Statement of financial position 4 Statement of changes in equity
STATEMENT OF COMPREHENSIVE INCOME
 FINANCIAL REPORT STATEMENT OF COMPREHENSIVE INCOME for the year ended 30 June 2014 Notes $ 000 $ 000 Revenue Sale of goods 2 697,319 639,644 Services 2 134,776 130,182 Other 5 1,500 1,216 833,595 771,042
Financial statements. The University of Newcastle newcastle.edu.au F1
 Financial statements The University of Newcastle newcastle.edu.au F1 Income statement For the year ended 31 December Consolidated Parent Revenue from continuing operations Australian Government financial
Financial Statements For the Year Ended 30 June 2017
 Financial Statements Consolidated Statement of Comprehensive Income 1 Consolidated Statement of Changes in Equity 2 Consolidated Balance Sheet 3 Consolidated Statement of Cash Flows 4 Consolidated Operating
Consolidated Statement of Comprehensive Income For the year ended 31 March 2017
 Consolidated Statement of Comprehensive Income YEAR YEAR 31 MARCH 2017 31 MARCH 2016 $'000 Note Revenue 4 151,439 137,379 Other income 184 1,352 Share of profit of equity accounted joint venture - 204
Directors Report 3. Income Statements 4. Statements of Changes in Equity 5. Balance Sheets 6. Statements of Cash Flows 7-8
 Rakon Limited Annual Report 2009 Table of Contents Directors Report 3 Income Statements 4 Statements of Changes in Equity 5 Balance Sheets 6 Statements of Cash Flows 7-8 Notes to Financial Statements
Financial statements. The University of Newcastle. newcastle.edu.au F1. 52 The University of Newcastle, Australia
 Financial statements The University of Newcastle 52 The University of Newcastle, Australia newcastle.edu.au F1 Contents Income statement................. 54 Statement of comprehensive income..... 55 Statement
NOTES TO THE FINANCIAL STATEMENTS for the year ended 31 October 2015
 Financial Statements NOTES TO THE FINANCIAL STATEMENTS 2. SIGNIFICANT ACCOUNTING POLICIES (CONT D) 2.6 PLANT AND EQUIPMENT (CONT D) Likewise, when a major inspection is performed, its cost is recognised
Group Income Statement
 MASSMART GROUP ANNUAL FINANCIAL STATEMENTS 2014 Group Income Statement December 2014 December 2013 Rm Notes 52 weeks 53 weeks Revenue 5 78,319.0 72,512.9 Sales 5 78,173.2 72,263.4 Cost of sales (63,610.8)
SLI Systems Limited and its Subsidiaries Financial Statements For the year ended 30 June 2015
 SLI Systems Limited and its Subsidiaries Financial Statements For the year ended 30 June Contents Page Consolidated Statement of Comprehensive Income 6 Consolidated Statement of Changes in Equity 7 Consolidated
Notes To The Financial Statements For the year ended 31 December 2014
 1. Corporate information Ornapaper Berhad is a public limited liability company, incorporated and domiciled in Malaysia, and is listed on the Main Market of Bursa Malaysia Securities Berhad. The principal
Group accounting policies
 81 Group accounting policies BASIS OF ACCOUNTING AND REPORTING The consolidated financial statements as set out on pages 92 to 151 have been prepared on the historical cost basis except for certain financial
ANNUAL REPORT 2013/2014 C.28
 ANNUAL REPORT 2013/2014 C.28 Annual Report 2013/2014 Message from the Chair and Chief Executive............................................................... 1 Financial Performance... 3 Directors Responsibility
COMVITA LIMITED AND GROUP FINANCIAL STATEMENTS
 COMVITA LIMITED AND GROUP FINANCIAL STATEMENTS For the year ended 31 March 2015 Comvita Financial Statements 2015 - P2 CONTENTS P4 P5 P6 P7 P8 P9 P10 P52 P53 P58 DIRECTORS DECLARATION INCOME STATEMENT
COMVITA LIMITED AND GROUP FINANCIAL STATEMENTS
 COMVITA LIMITED AND GROUP FINANCIAL STATEMENTS For the year ended 31 March 2015 Comvita Financial Statements 2015 - P2 CONTENTS P4 DIRECTORS DECLARATION P5 INCOME STATEMENT P6 STATEMENT OF COMPREHENSIVE
Learn Africa Plc. Quarter 1 Unaudited Financial Statement 1 st January to 31 st March 2018
 Learn Africa Plc Quarter 1 Unaudited Financial Statement 1 st January to 31 st March 2018 1 Contents Statements of Accounting Policies 3 Statement of Comprehensive Income 11 Statement of Financial Position
Financial Statements For the Year Ended 30 June 2018
 Financial Statements Consolidated Statement of Comprehensive Income 1 Consolidated Statement of Changes in Equity 2 Consolidated Balance Sheet 3 Consolidated Statement of Cash Flows 4 Consolidated Operating
Annual. Financial Report. For personal use only. Contents. Company Directory 27. Directors' Responsibility Statement 28
 Annual Financial Report Contents Company Directory 27 Directors' Responsibility Statement 28 Statement of Comprehensive Income 29 Statement of Changes in Equity 30 Statement of Financial Position 30 Statement
notes to the Financial Statements 30 april 2017 (Cont d)
") 2.4 Summary of accounting policies (contd.) (d) Intangible assets (contd.) (ii) Research and development expenditure Research expenditure is recognised as an expense when it is incurred. Development expenditure
2.4 Summary of accounting policies (contd.) (d) Intangible assets (contd.) (ii) Research and development expenditure Research expenditure is recognised as an expense when it is incurred. Development expenditure
Livestock Improvement Corporation Limited (LIC) ANNUAL REPORT. Year Ended 31 May 2014
 ANNUAL REPORT. Year Ended 31 May 2014") Livestock Improvement Corporation Limited (LIC) ANNUAL REPORT Year Ended 31 May 2014 Income Statement For the year ended 31 May 2014 In thousands of New Zealand dollars Note 2014 2013 2014 2013 Revenue
Livestock Improvement Corporation Limited (LIC) ANNUAL REPORT Year Ended 31 May 2014 Income Statement For the year ended 31 May 2014 In thousands of New Zealand dollars Note 2014 2013 2014 2013 Revenue
Frontier Digital Ventures Limited
 Frontier Digital Ventures Limited Significant accounting policies This note provides a list of the significant accounting policies adopted in the preparation of these consolidated financial statements
Financial statements NEW ZEALAND POST LIMITED AND SUBSIDIARIES INCOME STATEMENTS FOR THE YEAR ENDED 30 JUNE 2009
 Financial statements NEW ZEALAND POST LIMITED AND SUBSIDIARIES INCOME STATEMENTS FOR THE YEAR ENDED 30 JUNE Note Group PARENT Revenue from operations 1 1,253,846 1,290,008 765,904 784,652 Expenditure 2
NOTES TO THE GROUP ANNUAL FINANCIAL STATEMENTS FOR THE YEAR ENDED 30 SEPTEMBER 2014
 14 NOTES TO THE GROUP ANNUAL FINANCIAL STATEMENTS 1. ACCOUNTING POLICIES The financial statements are presented in South African Rand, unless otherwise stated, rounded to the nearest million, which is
Maria Perrella. Andrew Hider. Chief Executive Officer. Chief Financial Officer
 MANAGEMENT S RESPONSIBILITY FOR FINANCIAL REPORTING The preparation and presentation of the Company s consolidated financial statements is the responsibility of management. The consolidated financial statements
Profit/(Loss) before income tax 112, ,323. Income tax benefit/(expense) 11 (31,173) (37,501)
 before income tax 112, ,323. Income tax benefit/(expense) 11 (31,173) (37,501)") Income statement For the year ended 31 July Note 2013 2012 Continuing operations Revenue 2,277,292 2,181,551 Cost of sales (1,653,991) (1,570,657) Gross profit 623,301 610,894 Other income 7 20,677 10,124
Income statement For the year ended 31 July Note 2013 2012 Continuing operations Revenue 2,277,292 2,181,551 Cost of sales (1,653,991) (1,570,657) Gross profit 623,301 610,894 Other income 7 20,677 10,124
QUAYSIDE HOLDINGS LIMITED AND SUBSIDIARIES
 QUAYSIDE HOLDINGS LIMITED AND SUBSIDIARIES ANNUAL FINANCIAL STATEMENTS For the year ended 30 JUNE 2015 CONTENTS PAGE Auditor s Report 1 Income Statement 4 Statement of Comprehensive Income 5 Statement
ANNUAL REPORT 2010 FYE 31/03/2010
 RESCUE ANNUAL REPORT 2010 FYE 31/03/2010 2 SEALEGS IS T FOR WATERF David McKee Wright CEO DEAR SHAREHOLDERS Sealegs announced an operating profit of $642,000 for the year ended 31 March 2010, representing
OAO SIBUR Holding. International Financial Reporting Standards Consolidated Financial Statements and Independent Auditor s Report.
 OAO SIBUR Holding International Financial Reporting Standards Consolidated Financial Statements and Independent Auditor s Report 31 December 2013 IFRS CONSOLIDATED STATEMENT OF PROFIT OR LOSS (In millions
Appendix 4D and Interim Financial Report for the half year ended 31 December 2015
 ABN 80 153 199 912 Appendix 4D and Interim Financial Report for the half year ended Lodged with the ASX under Listing Rule 4.2A 1 ABN 80 153 199 912 Half year ended: ( H1 FY2016 ) (Previous corresponding
This Preliminary Final Report is provided to the Australian Securities Exchange ( ASX ) under ASX Listing Rule 4.3A
 under ASX Listing Rule 4.3A") Preliminary Managing Directors Final Report Report of x Vita Life Sciences Limited This Preliminary Final Report is provided to the Australian Securities Exchange ( ASX ) under ASX Listing Rule 4.3A Current
Preliminary Managing Directors Final Report Report of x Vita Life Sciences Limited This Preliminary Final Report is provided to the Australian Securities Exchange ( ASX ) under ASX Listing Rule 4.3A Current
MANAGEMENT S RESPONSIBILITY FOR FINANCIAL REPORTING
 MANAGEMENT S RESPONSIBILITY FOR FINANCIAL REPORTING The preparation and presentation of the Company s consolidated financial statements is the responsibility of management. The consolidated financial statements
The Warehouse Group Limited Financial Statements For the 52 week period ended 27 July 2014
 The Warehouse Limited Financial Statements Financial Statements The Warehouse Limited is a limited liability company incorporated and domiciled in New Zealand. The address of its registered office is Level
NOTES TO THE FINANCIAL STATEMENTS
 PROGRAMMED ANNUAL REPORT 63 31 March 1. GENERAL NOTES 1.1 General Information Programmed Maintenance Services Limited (the Company) is a listed public company, incorporated in New South Wales and operating
Nigerian Aviation Handling Company PLC
 Nigerian Aviation Handling PLC Financial Statements -- Q1 2018 Nigerian Aviation Handling PLC Consolidated Statement of Comprehensive Income 1 Consolidated Statement of Financial Position 2 Statement of
Example Accounts Only
 CaseWare Australia & New Zealand Large Streamlined Pty Ltd Financial Statements Disclaimer: These financials include illustrative disclosures for a large proprietary company lodging financial statements
Nigerian Aviation Handling Company PLC
 Nigerian Aviation Handling PLC Financial Statements -- H1 2018 Nigerian Aviation Handling PLC Consolidated Statement of Comprehensive Income 1 Consolidated Statement of Financial Position 2 Statement of
COMVITA LIMITED AND GROUP. Financial Statements. 31 March 2014
 COMVITA LIMITED AND GROUP Financial Statements 31 March 2014 Contents Directors Declaration 2 Income Statement 3 Statement of Comprehensive Income 4 Statement of Changes in Equity 5 6 Statement of Financial
For personal use only
 Statement of Profit or Loss for the year ended 31 December Note Continuing operations Revenue 2 100,795 98,125 Product and selling costs (21,072) (17,992) Royalties (149) (5,202) Employee benefits expenses
Learn Africa Plc. Quarter 2 Unaudited Financial Statement 1 st January to 30 th June 2016
 Learn Africa Plc Quarter 2 Unaudited Financial Statement 1 st January to 30 th June 2016 1 Contents Statements of Accounting Policies 3 Statement of Comprehensive Income 11 Statement of Financial Position
ORASCOM CONSTRUCTION LIMITED
 ORASCOM CONSTRUCTION LIMITED Consolidated Financial Statements For the year ended 31 December 2016 TABLE OF CONTENTS Independent auditors report on the consolidated financial statements 1-8 Consolidated
STRUCTURED CONNECTIVITY SOLUTIONS (PTY) LTD (Registration number 2002/001640/07) Historical FInancial Information for the year ended 31 August 2012
 LTD (Registration number 2002/001640/07) Historical FInancial Information for the year ended 31 August 2012") STRUCTURED CONNECTIVITY SOLUTIONS (PTY) LTD Historical FInancial Information for the year ended 31 August 2012 Index The reports and statements set out below comprise the historical financial information
STRUCTURED CONNECTIVITY SOLUTIONS (PTY) LTD Historical FInancial Information for the year ended 31 August 2012 Index The reports and statements set out below comprise the historical financial information
Meridian Energy Financial Statements FOR YEAR ENDED 30 JUNE 2011
 Meridian Energy Financial Statements FOR YEAR ENDED 30 JUNE Contents Income Statement...1 Statement of Comprehensive Income... 2 Statement of Financial Position... 3 Statement of Changes in Equity...4
Auditor s Independence Declaration
 Financial reports The Directors Eumundi Group Limited Level 15, 10 Market Street BRISBANE QLD 4000 Auditor s Independence Declaration As lead auditor for the audit of Eumundi Group Limited for the year
CaseWare Australia & New Zealand Large General Purpose Company
 CaseWare Australia & New Zealand Large General Purpose Company Financial Statements Disclaimer: These financials include illustrative disclosures for a large proprietary company who is a reporting entity
FINANCIAL STATEMENTS. Approval by Directors FOR THE YEAR ENDED 30 JUNE 2017
 FINANCIAL STATEMENTS 1 FOR THE YEAR ENDED 30 JUNE 2017 Approval by Directors Your Directors have pleasure in presenting the Financial Statements for the year ended 30 June 2017. The Directors have approved
Accounting policies extracted from the 2016 annual consolidated financial statements
 Steinhoff International Holdings N.V. (Steinhoff N.V.) is a Netherlands registered company with tax residency in South Africa. The consolidated annual financial statements of Steinhoff N.V. for the period
Unaudited consolidated interim financial statements and independent auditor s review report BORETS INTERNATIONAL LIMITED 30 June 2015
 Unaudited consolidated interim financial statements and independent auditor s review report BORETS INTERNATIONAL LIMITED 30 June 2015 Contents Independent Auditor s Review Report Unaudited Consolidated
For personal use only
 Re-Issued Annual Special Purpose Financial Report 30 June 2015 Contents Page Trustees' report 1 Statement of profit or loss and other comprehensive income 3 Statement of financial position 4 Statement
1. Summary of Significant Accounting Policies
 FOR THE YEAR ENDED 31 DECEMBER 1. Summary of Significant Accounting Policies Statement of compliance The financial report is a general purpose financial report which has been prepared in accordance with
YIOULA GLASSWORKS S.A. AND SUBSIDIARIES NOTES TO THE CONSOLIDATED FINANCIAL STATEMENTS SEPTEMBER 30, 2012
 1. CORPORATE INFORMATION: Yioula Glassworks S.A., a corporation formed under the laws of the Hellenic Republic (also known as Greece), οn August 5, 1959, by Messrs Kyriacos and Ioannis Voulgarakis is the
DMX Corporation Limited and Controlled Entities Statement of Profit or Loss and Other Comprehensive Income for the year ended 30 June 2017 Note Consol
 Statement of Profit or Loss and Other Comprehensive Income for the year ended 30 June 2017 Note Consolidated 2017 Consolidated Revenue 3 1,814,949 1,711,808 Other income 4 8,785 84,169 Cost of goods sold
Consolidated financial statements PJSC Dixy Group and its subsidiaries for with independent auditor s report
 Consolidated financial statements PJSC Dixy Group and its subsidiaries for 2016 with independent auditor s report Consolidated financial statements PJSC Dixy Group and its subsidiaries Contents Page Independent
Total assets
 GROUP BALANCE SHEET AS AT 31 DECEMBER Notes R 000 R 000 ASSETS Non-current assets Property, plant and equipment 3 3 166 800 2 697 148 Intangible assets 4 66 917 59 777 Retirement benefit asset 27 142 292
 - CONSOLIDATED STATEMENT OF PROFIT OR LOSS AND OTHER COMPREHENSIVE INCOME Note 2015 2014 US$ 000s US$ 000s (Restated) Continuing operations Lease revenue 56,932 48,691 Other income 9 3,202 3,435 60,134
Contents. Directors Report 3 5. Statement of Financial Position 6 7. Statement of Comprehensive Income 8 9. Statement of Cash Flows 10
 FINANCIAL STATEMENTS MARCH 2018 Contents Directors Report 3 5 Statement of Financial Position 6 7 Statement of Comprehensive Income 8 9 Statement of Cash Flows 10 Statement of Changes in Equity 11 Notes
Index to the Annual Report
 Index to the Annual Report Index to Annual Report 1 Corporate Directory 2 Chairman and Managing Director s Report 3-4 Auditor's Report 5-6 Statement of Comprehensive Income 7 Statement of Changes in Equity
DANGOTE SUGAR REFINERY PLC INTERIM FINANCIAL STATEMENTS
 DANGOTE SUGAR REFINERY PLC INTERIM FINANCIAL STATEMENTS 30 September 2013 42 Contents Statement of profit and loss and other comprehensive income 3 Statement of financial position 4 Statement of changes
Notes to the Financial Statements
 For the financial year ended 31 March These notes form an integral part of and should be read in conjunction with the accompanying financial statements. 1. GENERAL Singtel is domiciled and incorporated
Kathmandu Holdings Limited. FINANCIAL STATEMENTS 31 July 2018
 Kathmandu Holdings Limited FINANCIAL STATEMENTS 31 July 2018 Introduction and Table of Contents In this section The financial statements have been presented in a style which attempts to make them less
Consolidated statement of comprehensive income
 Consolidated statement of comprehensive income Notes 2017 Revenue from continuing operations 5 24,232 23,139 Other income Net gain on fair value adjustment investment properties 13 80 848 Total revenue
Saving our customers money so they can live better
 Saving our customers money so they can live better MASSMART GROUP ANNUAL FINANCIAL STATEMENTS 2016 1 GROUP INCOME STATEMENT December 2016 December 2015 Rm Notes 52 weeks 52 weeks Revenue 5 91,564.9 84,857.4
GOODMAN PROPERTY TRUST
 GOODMAN PROPERTY TRUST Audited annual results for announcement to the market Reporting Period 12 months to 31 March Previous Reporting Period 12 months to 31 March Amount Percentage Change Revenue from
PAO SIBUR Holding. International Financial Reporting Standards Consolidated Financial Statements and Independent Auditor s Report.
 PAO SIBUR Holding International Financial Reporting Standards Consolidated Financial Statements and Independent Auditor s Report 31 December 2017 Table of Contents Independent Auditor s Report IFRS Consolidated
Financial reports. 10 Eumundi Group Limited & Controlled Entities
 Financial reports 10 Eumundi Group Limited & Controlled Entities The Directors Eumundi Group Limited Level 15, 10 Market Street BRISBANE QLD 4000 Auditor s Independence Declaration As lead auditor for
COMVITA LIMITED AND GROUP FINANCIAL STATEMENTS
 COMVITA LIMITED AND GROUP FINANCIAL STATEMENTS For the 15 month s end ed 30 June 2016 CONTENTS 2 3 4 5 6 7 8 39 40 45 DIRECTORS DECLARATION INCOME STATEMENT STATEMENT OF COMPREHENSIVE INCOME STATEMENT
Income Statements...39 Statements of Recognised Income and Expense...40 Balance Sheets...41 Statements of Cash Flows...42
 38 GWA INTERNATIONAL LIMITED 2007 ANNUAL REPORT CONTENTS Income Statements...39 Statements of Recognised Income and Expense...40 Balance Sheets...41 Statements of Cash Flows...42 Note 1 Significant accounting
(Continued) ~3~ March 31, 2017 December 31, 2016 March 31, 2016 Assets Notes AMOUNT % AMOUNT % AMOUNT % Current assets
 ~3~ March 31, 2017 December 31, 2016 March 31, 2016 Assets Notes AMOUNT % AMOUNT % AMOUNT % Current assets") Current assets DAVICOM SEMICONDUCTOR, INC. AND SUBSIDIARIES CONSOLIDATED BALANCE SHEETS (Expressed in thousands of New Taiwan dollars) (The consolidated balance sheets as of March 31,2017 and 2016 are
Current assets DAVICOM SEMICONDUCTOR, INC. AND SUBSIDIARIES CONSOLIDATED BALANCE SHEETS (Expressed in thousands of New Taiwan dollars) (The consolidated balance sheets as of March 31,2017 and 2016 are
For personal use only
 31 ST MARCH AUDITORS REPORT INDEPENDENT AUDITORS REPORT TO THE SHAREHOLDERS OF TRILOGY INTERNATIONAL LIMITED Report on the Financial Statements We have audited the financial statements of Trilogy International
Independent auditor s report on the consolidated financial statements of Lenta Limited and its subsidiaries for the year ended 31 December 2017
 Independent auditor s report on the consolidated financial statements of Lenta Limited and its subsidiaries for the year ended February 2018 Independent auditor s report on the consolidated financial statements
Annual Financial Report KONAMI CORPORATION and its subsidiaries Consolidated Financial Statements For the fiscal year ended March 31, 2015
 Annual Financial Report KONAMI CORPORATION and its subsidiaries Consolidated Financial Statements For the fiscal year ended March 31, 2015 KONAMI CORPORATION TABLE OF CONTENTS 1. Consolidated Financial
GROUP FINANCIAL STATEMENTS 45
 GROUP FINANCIAL STATEMENTS 45 CONSOLIDATED STATEMENT OF FINANCIAL POSITION for the year ended 31 March 2010 at 31 March 2010 Notes 2010 2009 2010 2009 ASSETS N$ '000 N$ '000 N$ '000 N$ '000 Non-current
A n n u a l f i n a n c i a l r e s u l t s
 A n n u a l f i n a n c i a l r e s u l t s DIRECTORS STATEMENT The directors of Air New Zealand Limited are pleased to present to shareholders the Annual Report* and financial statements for Air New
Consolidated Statement of Profit or Loss and Other Comprehensive Income
 Consolidated Statement of Profit or Loss and Other Comprehensive Income Note US$'000 US$'000 Revenue 6 1,222,853 2,011,507 Cost of goods sold (1,020,718) (1,499,060) Gross margin 202,135 512,447 Other
OUR GOVERNANCE. The principal subsidiary undertakings of the Company at 3 April 2015 are detailed in note 4 to the Company balance sheet on page 109.
 STRATEGIC REPORT OUR GOVERNANCE FINANCIAL STATEMENTS SHAREHOLDER INFORMATION POLICIES GENERAL INFORMATION Halfords Group plc is a company domiciled in the United Kingdom. The consolidated financial statements
159 Company Income Statement 160 Company Balance Sheet 162 Notes to the Company Financial Statements
 73 Annual Report and Accounts 2018 Consolidated and Company Financial Statements 2018 Page Consolidated Financial Statements, presented in euro and prepared in accordance with IFRS and the requirements
Mood Media Corporation
 Consolidated Financial Statements Mood Media Corporation For the year ended INDEPENDENT AUDITORS REPORT To the Shareholders of Mood Media Corporation We have audited the accompanying consolidated financial
UNITED INTERNATIONAL TRANSPORTATION COMPANY (A SAUDI JOINT STOCK COMPANY) AND IT S SUBSIDIARY
 AND IT S SUBSIDIARY") (A SAUDI JOINT STOCK COMPANY) AND IT S SUBSIDIARY CONSOLIDATED FINANCIAL STATEMENTS 31 DECEMBER 2018 CONSOLIDATED FINANCIAL STATEMENTS 31 DECEMBER 2018 INDEX PAGE 1-6 Consolidated Statement of Profit or
(A SAUDI JOINT STOCK COMPANY) AND IT S SUBSIDIARY CONSOLIDATED FINANCIAL STATEMENTS 31 DECEMBER 2018 CONSOLIDATED FINANCIAL STATEMENTS 31 DECEMBER 2018 INDEX PAGE 1-6 Consolidated Statement of Profit or
Comvita Financial Statements PI COMVITA LIMITED AND GROUP FINANCIAL STATEMENTS
 Comvita Financial Statements 2017 - PI COMVITA LIMITED AND GROUP FINANCIAL STATEMENTS FOR THE YEAR ENDED 30 JUNE 2017 Comvita Financial Statements 2017 - PII Comvita Financial Statements 2017 - P1 CONTENTS
NOTES TO THE FINANCIAL STATEMENTS
 NOTES TO THE FINANCIAL STATEMENTS NOTE 1. SUMMARY OF SIGNIFICANT ACCOUNTING POLICIES Insurance Australia Group Limited (IAG, Parent or Company) is a company limited by shares, incorporated and domiciled
Notes to Consolidated Financial Statements
 DP World Annual Report and Accounts Overview 67 Notes to Consolidated Financial Statements (forming part of the financial statements) 1 Reporting entity DP World Limited (the Company ) was incorporated
Changes in ownership interests in subsidiary companies without change of control
 Annual Report 2014 SERSOL BERHAD 59 3. Significant Accounting Policies (cont d) (a) Basis of consolidation (cont d) (i) Subsidiary companies (cont d) Inter-company transactions, balances and unrealised
For personal use only
 PRELIMINARY FINAL REPORT RULE 4.3A APPENDIX 4E APN News & Media Limited ABN 95 008 637 643 Preliminary final report Full year ended 31 December Results for Announcement to the Market As reported Revenue
Principal Accounting Policies
 1. Basis of Preparation The accounts have been prepared in accordance with Hong Kong Financial Reporting Standards ( HKFRS ). The accounts have been prepared under the historical cost convention as modified
Financial statements. Consolidated financial statements. Company financial statements
 73 Consolidated financial statements 74 CONSOLIDATED INCOME STATEMENT 74 CONSOLIDATED STATEMENT OF COMPREHENSIVE INCOME 75 CONSOLIDATED BALANCE SHEET 76 CONSOLIDATED CASH FLOW STATEMENT 78 CONSOLIDATED
PUSHPAY HOLDINGS LIMITED ANNUAL REPORT 2014
 ANNUAL REPORT 2014 ANNUAL FINANCIAL REPORT CONTENTS DIRECTORY 3 DIRECTORS RESPONSIBILITY STATEMENT 4 INDEPENDENT AUDITOR S REPORT 5 STATEMENT OF COMPREHENSIVE INCOME 6 STATEMENT OF CHANGES IN EQUITY 7
For the 52 weeks ended 2 May 2010
 36 Greene King plc Annual Report 2010 1 Accounting policies Corporate information The consolidated financial statements of Greene King plc for the 52 weeks ended 2 May 2010 were authorised for issue by
Corporate Travel Management Limited
 Corporate Travel Management Limited ABN 17 131 207 611 Registered office: 27A/52 Charlotte Street Brisbane Queensland 4000 Interim Report 31 December 2010 Contents Appendix 4D 3 Directors' Report 4 Corporate
Consolidated Financial Statements and Independent Auditor s Report
 Consolidated Financial Statements and Independent Auditor s Report For the year ended 31 March, 2018 Daiichi Sankyo Company, Limited Contents Page 1) Consolidated Statement of Financial Position 1 2) Consolidated
The consolidated financial statements were authorised for issue by the Board of Directors on 1 June 2015.
 ACCOUNTING POLICIES for the year ended 31 March 2015 Transnet SOC Ltd (the Company ) is a company domiciled in South Africa. The consolidated financial statements for the year ended 31 March 2015 comprise
Consolidated Financial Statements
 Consolidated Financial Statements NZME Limited for the year ended 31 December Page 1 CONTENTS CONSOLIDATED FINANCIAL STATEMENTS for the year ended 31 December Directors Statement 3 Consolidated Income
Consolidated financial statements and independent auditor s report BORETS INTERNATIONAL LIMITED 31 December 2017
 Consolidated financial statements and independent auditor s report BORETS INTERNATIONAL LIMITED 31 December 2017 Contents Independent Auditor s Report Consolidated Statement of Financial Position 1 Consolidated