The Nordic Puzzle. A study about the long-run performance of IPOs on the Nordic Markets. Authors: Supervisor/s: Department of Business Administration
|
|
|
- Lisa Gwen Roberts
- 5 years ago
- Views:
Transcription

1 Department of Business Administration FEKH80 Bachelor Thesis in Corporate Finance Autumn 2017 The Nordic Puzzle A study about the long-run performance of IPOs on the Nordic Markets Authors: Daniel Tegmark Filip Jedmo Gustav Jakobsson Supervisor/s: Anamaria Cociorva 1
2 Abstract Title: The Nordic Puzzle Seminar Date: 11/01/2018 Course: Authors: Advisor: Key words: Issues, IPO FEKH89 Gustav Jakobsson, Filip Jedmo, Daniel Tegmark Anamaria Cociorva Long run performance, Nordic Market, BHAR, Number of Purpose: To evaluate the Nordic IPO markets from an academic perspective taken from an investor's point view. Methodology: Quantitative research Theoretical perspective: Majority of previous research suggest that in the long run newly listed companies underperform comparable companies on the market when comparing changes in stock prices. However, there have been some studies that have found that IPOs in certain countries deliver a positive long run performance relative to comparable non-newly listed companies during the studied periods. This study looks at the Nordic market in order to see how Nordic IPOs perform in the long run relative to comparable companies on the market and what factors can be considered key drivers of the performance. Empirical foundation: 567 companies were studied in the paper. These were companies that went public on Oslo Børs, Nasdaq Stockholm, Nasdaq Copenhagen and Nasdaq Finland during the period Data from the companies and indexes were collected from Datastream. Conclusions: IPOs on the Nordic market on average tend to underperform their comparable benchmark. Number of issues, defined as number of new companies listed during a certain year, was shown to have a significant negative impact on long run performance of IPOs on the Nordic Market. With more IPOs during a specific year leading to a greater long run underperformance of IPOs listed during the same year. Long run performance of Nordic IPOs is also highly dependent on which country the IPOs occur in. Lastly, New Economy IPOs performed 32% better than IPOs active in Old Economy. 2
3 Word list IPO: Initial Public Offering Hot-Issue Market: Or high Number of Issues refers to time period when many IPOs occur New Economy: Companies active within sectors Media, Telecommunications, Healthcare and Technology Old Economy: Companies active in any other sectors. 3
4 Preface The authors would like to thank our supervisor Anamaria Cociorva for taking her time in guiding and giving wise advice to this study. Also, a special thanks to Eirik Ausland at Oslo Børs who showed a high level of cooperation and interest in our study. Lastly, we would like to thank Josef Schuster and Matti Keloharju for rewarding conversations and interesting viewpoints throughout this study. Gustav Jacobsson Filip Jedmo Daniel Tegmark 4
5 Table of Content 1. Introduction Background Purpose Research Question Limitations and Scope Target Group Structure 9 2. Theory IPO Patterns Underpricing Long-run performance The Divergence of Opinion Hypothesis The Impresario Hypothesis The Windows of Opportunity Hypothesis Previous Research The Long-Run Performance of initial Public Offerings - J Ritter Initial public offerings: International insights T Loughran, J Ritter, K Rydqvist IPOs: Insights from Seven European Countries J Schuster Decomposing and Testing Long-term Returns: an Application on Danish IPOs - J Jakobsen & B Sørensen The winner's curse, legal liability, and the long-run price performance of initial public offerings in Finland - M Keloharju Summary of previous research Explanatory Variables Country Size Old Economy or New Economy Cyclicality or Number of Issues Methodology Scientific Methodology Sample Selection Time frame Long-term Country selection Stock Exchanges End of Day Value Stock Prices No former listing A or B Stock Choosing the Benchmark Collecting and Processing of Data Calculation of abnormal return Explanatory Variables and Dummy Variables Country - Dummy New/Old Economy - Dummy Number of Issues, Cyclicality Reliability and Validity 24 5
6 3.7.1 Reliability Validity OLS - Ordinary Least Square Two Sample and One Sample t-test Level of Significance (α) & P-value Coefficient of Determination (R 2 ) Criticism and Motivation for choice of Method Stock prices Long-term Benchmark Calculation of Abnormal Return Results Data BHAR Size New/Old Economy Number of Issues Regressions Regression Diagnostics Jarque Bera test Heteroskedasticity Multicollinearity Ramsey RESET test Analysis BHAR - Dependent Variable Country Size New / Old Economy Number of Issues Concluding Discussion Bibliography Appendices 48 Appendix 1 - BHAR & Size 48 Appendix 2 - Regressions 50 Appendix 3 - White test 51 Appendix 4 - Ramsey s Reset 53 Appendix 5 - Multicollinearity 53 6
7 1. Introduction This chapter will introduce the reader to the background of our study and lift the vast body of previous research conducted within the area. Furthermore, this chapter will present the purpose and question(s) of the study. Lastly, limitations will be discussed and the disposition of this study will be presented. 1.1 Background In recent years the cost for investing in foreign countries has been lowered significantly. In fact, the brokerage fee for investing in the different Nordic stock markets is often the same independent of in which country you are buying the underlying stock (Degiro, 2017; Avanza, 2017). At the same time the IPO market is booming with 45 IPOs just in Sweden during , with choices of which companies to invest in being greater than ever (Nasdaq, 2018). Amongst all this, figuring out in which of all the companies you should invest is becoming increasingly difficult. As an investor you are probably aware of the winner's curse concept and that diversifying results in a higher expected value compared to the risk you take. Since many investors do not have either the time or knowledge needed to analyze every single company to successfully find good IPOs to invest in, some sort of guidelines are needed in order to determine how to invest. Factors such as size, sector or industry and cyclicality of the number of IPOs have previously been shown to have a significant effect on the long-term return. How can you as an Nordic investor pick a successful strategy when investing in IPOs? Should you buy based on industry, size or the number of issues introduced that year, or can selection of a specific country yield a significantly higher return relative the others? In this paper the authors aim to study if it is possible to determine if there is any significant abnormal return for the Nordic market when comparing the Nordic IPOs relative to country benchmarks. Alongside this the authors also aim determine if the variables studied can determine the performance of an IPO. Through the study the authors hope to develop on the empirical evidence regarding IPOs on the Nordic market, partly to guide Nordic investors and partly to contribute to the scientific field of IPO long-term performance 1.2 Problem Discussion After Ritter's famous study (1991) in which he found that IPOs on the US market underperform their comparable benchmark, it has been commonly accepted within IPO literature that IPOs underperform their local market over a three to five year period. However, as a subsequent study by Loughran, Ritter and Rydqvist (1994) showed overperformance for IPOs in a few markets. This resulted in researchers delving into comparing and explaining why long-run performance of IPOs differed from country to country. Schuster (2003) found IPO overperformance in Germany and The Netherlands compared to the respective country s benchmark. He tried to explain the over/underperformance with several factors such as size of company, new/old economy and cyclicality of the number of 7
8 issues just to mention a few. Schuster (2003) found one significant factor for long run performance, namely whether the IPO belonged to sectors such as New or Old Economy. New Economy industries were defined as Technology, Media, Telecommunications and Healthcare. In previous research Ritter (1991) instead found both size and cyclicality to be significant factors. Ritter (1991) found that smaller companies tended to underperform larger companies to a higher extent whilst a larger number of IPOs during a specific year had a negative impact on the performance of these IPOs listed that year, a result Schuster could not confirm for the European countries in his study. A few studies have been conducted on IPOs on the Nordic markets. Loughran et al. (1994) found an overperformance for Swedish IPOs compared to the benchmark. Whilst both a Finnish study conducted by Keloharju (1993) and a Danish study by and Jakobsen & Sørensen (2001) found underperformance for IPOs relative to comparable benchmark in their respective market of -20,8% and -30 %. There has not been any research on the long run performance of the Norwegian market. Jacobsen & Sørensen (2001) do not attempt to explain which factors that drive the bad long run performance. Keloharju (1993) drew the conclusion that number of issues may have had an impact on the long run performance on the Finnish market. However no statistical significance for this was found. Keloharju (1993) was also not able to find statistical significance that abnormal returns were industry-specific. Loughran et al. (1994) found that number of issues had a significant impact on a few of the studied markets. Given the ambiguity of results from the earlier studies presented above, no clear conclusion regarding the long run performance of IPOs on the Nordic market can be made. Alongside this no clear conclusion regarding which factor that determines long run performance in the Nordic markets can be made. Lastly the different time perspectives and methods used in determining long run performance vary between the studies. Therefore neither investors nor researcher can derive any significant results when comparing countries through looking at previous research. 1.3 Purpose The purpose of this paper is to extend the empirical evidence on the subject of IPO performance on the Nordic market. This will be done by examining the long run performance of IPOs on the Nordic market for the period The authors will look at a number of variables, including what country the IPOs are based in, number of issues, firm size and what industry the IPOs belong to, in order to determine which factors have an impact on the long performance of IPOs. In this way the authors aim to develop the empirical evidence on the subject of IPOs long run performance on the Nordic market, whilst also providing a guidance for an investor planning to invest in IPOs on the Nordic market. 1.4 Research Question 1. How do IPOs in the Nordic region perform in the long run relative to comparable benchmarks? Are there differences in long run performance between IPOs in the different Nordic countries? 8
9 2. Are the chosen variables able to explain the over or underperformance of IPOs on the Nordic market? 1.5 Limitations and Scope The time scope was limited to the period from 1997 to The start date of 1-jan 1997 was chosen since this was the earliest date the country benchmark used in the study were available from, whereas 21-november 2014 was a natural end date since the authors looked at 3 year performance, meaning a company listed 3 years prior to the date at the time of this study was the last possible company that could be included. The scope of the study was initially meant to incorporate all IPOs from the main lists for all of the five Nordic countries (Denmark, Finland, Iceland, Norway and Sweden), but after scanning the number of IPOs during the chosen time period on each market, the Icelandic market was excluded. This because both the overall size of the market and the number of IPOs were too few in order for the authors to derive any significant results. Hence, the focus switched to researching the remaining four countries. The data in each country was limited to the stock market that complies with all EU requirements. Smaller, less regulated stock markets do not have the same protections for investors and would therefore lead to unnecessary complication of the comparisons. The markets that met these requirements were: Oslo Børs, Nasdaq Copenhagen, Nasdaq Helsinki and Nasdaq Stockholm (Nasdaq) (Oslobørs). 1.6 Target Group The papers target group is mainly academics with basic knowledge in financial economics. Another possible audience are investors with an interest in business and financial economics, whom have a market perspective on the subject of IPOs rather than an academic one. 1.7 Structure The following part of the paper is structured in accordance with Bryman and Bell (2013) guidelines for structuring of quantitative studies. Theory: This part of the paper explains the most prominent theories developed in regards to the IPO subject, and then lifts previous studies conducted within the area. Method: This part of the paper includes the methodology that explains the approach to the questions asked, it includes the motivations for decisions made throughout the study, and explains how data was collected and analyzed. Results: This part of the paper presents the results of the regression as well as the results of the tests conducted to ensure the regression is valid. Analysis: The results received are analyzed and explained through connecting the results to relevant theories and earlier conducted studies. This in an attempt to answer the research questions. 9
10 Discussion: The conclusion of the paper contains reflections regarding the analysis and includes the author s own thoughts about the subject. Conclusion: The answers for the research questions are laid out and concluding remarks are lifted. Alongside this further potential studies that could be conducted within the area are also discussed 2. Theory This chapter will start by presenting and illustrating the different theories that are most relevant to the area of IPOs in order to introduce the reader to the basic background and theories of the area of IPOs. Later on, the chapter will present a section of previous research within the area of IPOs. Lastly, the different variables looked at in this study will be introduced to the reader. 2.1 IPO Patterns Initially the two main trends found throughout the studies conducted on IPOs will be lifted. These effects have been found on a global scale, as will be displayed in previous research. The causes behind these trends were first lifted by Ritter (1998) and will be discussed in detail below Underpricing The underpricing pattern is present during the first day of listing for IPOs. Given that this study looks at long run performance, and in doing so excludes the first day return. The underpricing pattern will merely be lifted from a perspective that allows the authors to motivate their decision of looking at the end of first day value as the initial observation, rather than the start of day value. Ritter (1998) discusses the phenomena of underpricing of IPOs during the first day of trading, which leads to an on average strong first day return for newly listed stocks. An example of underpricing is how Loughran et al. (1994) international study showed an average positive return on the first day. Ritter (1998) proposes seven theories to explain why IPOs in general are underpriced hence leading to a strong first day performance. (1) Winner's Curse states new issues in part need to be underpriced in order for uninformed investors to be willing to invest in them. (2) Market Feedback Hypothesis states underpricing is in part due to the banks pushing issuances prices down in order for institutional investors to reveal their private information regarding the newly listed companies (3) Bandwagon Hypothesis states that underpricing is attributable to the owners of the company being listed pushing down prices to create a perception of excess demand (4) Investment Bank Monopsony Power Hypothesis states that underpricing is in part attributable to Investment Banks using their superior knowledge to negotiate lower issuance prices, meaning less time and money needs to be spent on marketing the new issue 10
11 (5) The Signaling Hypothesis States that underpricing in part is attributable to banks pressing down prices to offer their institutional investor clients better investment opportunities, thus strengthening relations with them (6) Ownership Dispersion Hypothesis states that owners push prices lower in order to generate a higher amount of demand from the public leading to a more dispersed ownership, making it harder for shareholders to challenge the management and increases liquidity The occurrence of abnormal first day returns has been known for many years. Despite this it is not possible to profit from them, as discussed in an earlier study by Levis Maro (1990). Maro explains that an investor who wishes to buy into an IPO will get a larger number of stocks in the company if the demand is lower, whilst a lower demand also will lead to a decrease in the stock price. A larger number of stocks held in combination with a decreasing stock price will cause a negative return for the investor. On the other hand, a higher demand will entail a rising stock price meaning an investor who wishes to invest at the time of the IPO will get less shares in the company. A fewer number of stocks held in combination with an increasing stock price will lower the total gain from the share price increase from the investor's perspective. Maro finally states that the aggregate return received from investing in IPOs will therefore not entail any abnormal returns (Maro, 1990) Long-run performance As the title suggests, the second trend found is attributed to the long run performance of newly listed stocks. Given the focus of this study, the trend and its causes as lifted by Ritter (1998) will be lifted in greater detail. The hopes are that a detailed discussion of the potential causes of long run performance can be used to explain the results found in this paper. An initial study conducted by Ritter (1991) showed that the average IPO underperformed its corresponding benchmark after three years. This has been confirmed by subsequent studies, such as Brav et al. (2000) whom reached the conclusion that during the average IPO on the US market underperformed the S&P500 by 44%. After Ritter s (1991) study, poor long run performance has been a widely researched area. Studies have also shown that longrun underperformance is present after a longer time period of five years when evaluating IPOs relative to the New York NASDAQ benchmark, this during the time period of (Loughran, 1993). As stated above, Ritter (1998) found several causes for the performance, which he defined as hypotheses. These will be presented below The Divergence of Opinion Hypothesis States that the most optimistic investors of an IPO often are the buyers. Due to this, if there is a high uncertainty regarding the real value of an IPO, the valuation made by the optimistic investors will be much higher compared to the valuation made by the pessimistic investors. However, as time passes and more information reaches the market this divergence of opinion between these different investors will minimize. This will make the price of the security drop, which will cause long-run underperformance. (Ritter, 1998) The Impresario Hypothesis This hypothesis has a focus on the investment banker s role in regards to the underpricing of IPOs. It states that investment bankers have superior knowledge in regards to pricing IPOs. 11
12 Based on this they are able to underprice the IPOs in order to create a surplus demand for the given IPO. In this way they can create an impression of there being excess demand on the market, which attracts a greater number of investors. This leads to an overreaction that entails an upswing in the stocks price, giving publicity to the Investment Bank. However as time passes and information reaches the market investors will able to determine that the initial demand was purely artificial, and the price will decrease. Leading to long run underperformance. (Ritter, 1998) The Windows of Opportunity Hypothesis The windows of opportunity hypothesis argues that during the period of time when firms are the most likely to be overvalued, most IPOs will occur. Since it will then be the most beneficial for the firm owners to list their company. The IPOs going public during these high volume periods should therefore be associated with lower long-run returns. Since more IPOs occur during these periods the average IPO should underperform the market. (Ritter, 1998) Ritter (1998), Ritter (1995) and Loughran et al. (1994) used number of IPOs issued during a certain period in order to see if there was a relationship between number of IPOs and underperformance and found that there was a negative relationship among these. 2.2 Previous Research In this section the authors describe and examine previous research within IPOs. In examining previous research the authors explain why the previous research is of significance for this paper, whilst lifting problems regarding them. The studies brought up in this section have had a big impact on the academic area of IPOs or are of significance for the study that will be conducted. This sections uses studies conducted worldwide but also studies focused on Sweden, Finland, Denmark and Norway that are the countries focused on in this paper The Long-Run Performance of initial Public Offerings - J Ritter In his article Ritter (1991) argues that IPO s are not underpriced as certain research prior to the study suggested, but rather overpriced if compared to matching companies over a set period of three years. An overpricing means the IPOs have underperformed their comparable benchmark over the period looked at. Ritter s study (1991) included a sample of 1526 different companies going public on the American and New York Stock Exchange from Ritter first used aftermarket closing price as start date and compared this to the third year anniversary price of the stock, or the price at the last day of trading, if the stock was delisted before three year, in order to calculate the return. Ritter s (1991) explanation to why these IPO s underperform is because of risk mismeasurement, bad luck and/or fads and overoptimism. Ritter (1991) shows that long run performance is industry specific stating that Oil & Gas underperformed and Financial institutions overperformed due to low oil prices and low interest rates during studied period. Ritter (1991) also found that number of issues had a negative relationship with long run performance due to investors being over optimistic and paying to high multiples in a belief of high growth opportunities during periods when many IPOs occur. This later results in a price decline as investors realize their overoptimism. 12

13 With consideration taken to the study being several years old, the authors still consider it vital for the paper, since it is the most widely cited source within the subject of long run performance of IPO s. This makes it an important for the discussion portion of the paper whilst also serving as an important reference for the American market Initial public offerings: International insights T Loughran, J Ritter, K Rydqvist This international study conducted by Loughran, Ritter & Rydqvist (1994) refers to data collected from previous studies in order to discuss the long run and short run performance of IPO s in 25 countries worldwide. The study shows that there is an underpricing phenomena in all the studied countries but the extent of the underpricing differs significantly amongst the countries. The study uses the term average initial return to determine short-term performance. This is defined as the return earned on first day of the listing, or in cases in which the countries have restricted price movements or restricted trading, the return over the first week or months. In Malaysia the short run performance was as much as 80%, in Finland 9,6%, Sweden 39% and 8,1% in Norway. Loughran et al. (1994) argue that the differences in short run performance among these countries depend on the selling mechanisms, the characteristics of firms going public and institutional constraints. In turn, when the study looked at the long run performance of these IPO s Finland showed a significantly negative abnormal return (defined as return relative to comparable benchmark) whilst Sweden showed a positive return of 1,2% (Loughran et al. 1994). Another finding was that investors in 9 of the 13 countries are better off not investing in IPOs during high volume years due to high valuation of the companies going public. In the study, the data used for Finland was from whereas it encompassed the period of in Sweden. The difference in time periods and the shorter time period looked at in Finland can create difficulties in comparisons and affect statistical significance of the study. Alongside this, the differences regarding when the initial return is calculated can also reduce comparability. With this said, the authors of this paper consider the study an important benchmark as it compares performance between countries, which provides important discussion points for the later parts of this paper IPOs: Insights from Seven European Countries J Schuster Schuster (2003) conducts a comparative study between countries on a short and long term basis. The study includes six of the largest European markets (Spain, Germany, France, Italy, The Netherlands & Switzerland) and the smaller market of Sweden. Schuster (2003) uses data from and reaches the conclusion that long-term performance of IPOs varies between the countries. In Sweden the overall long run performance shows that Swedish stocks 13
14 in general slightly underperformed compared to AFGX (Affärsvärdlens Generalindex). Schuster (2003) argues that the reason Loughran et al. (1994) found overperformance on Swedish IPOs during the period their study looked at was mainly driven by tax effects between Alongside this Schuster (2003) found that countries with high involvement of New Economy IPOs had a better positive long run performance compared to countries with almost no involvement. New Economy is IPOs are defined as companies active within the sectors of Technology, Media, Telecommunication and Healthcare. Schuster (2003) also tries to describe the differences in performance by looking at the size of the IPO s. The size is calculated as number of shares times the final offer price and the company is then defined as Small, Medium or Large. However, there is no explanation why the definition of size differs from country to country and how different size caps are defined, with this being said he did not find any statistical significance that size affects long run performance of IPOs. The study is of importance for this paper for many reasons. First and foremost the study is conducted in a way that tries to not only show differences in performance on the different markets but also attempts to explain why that is the case. This paper will also try to investigate if there is a significant difference of BHAR performance between the nordic markets and factors behind it. Secondly, Schuster s (2003) study is important since it looks at one of the markets focused on in this study, namely Sweden. Unlike Loughran et al. (1994), Schuster (2003) found that Swedish IPO underperformed over a 3-year period compared to AFGX. Critique that could be directed towards the study is that it looks at a shorter period of time, which can affect statistical significance and therefore predictive power. With this being said the study also provides this paper with important discussion points as it looks at the period of time before that of this study Decomposing and Testing Long-term Returns: an Application on Danish IPOs - J Jakobsen & B Sørensen In this Danish study by Jakobsen & Sørensen (2001) the long-term return on 76 stocks is evaluated with exclusion for stocks in the financials sector. The data is collected from companies being listed on Copenhagen stock exchange during the period of Jakobsen & Sørensen (2001) define long term as 5 years and find that the IPOs underperformed the Danish Total Stock Index by 30%. Jakobsen & Sørensen (2001) mean their findings in long term performance is in accordance with previous research in the area, which states that IPOs in general underperform in the long run. In the study 84% of the studied samples were listed during the same period of ( ), during which Denmark was a hot-issue market ie. a it was a period of strong economic growth in which multiple IPOs occurred. 14

15 Due to the large portion of the sample coming from a small period of time, this can skew results of the study. Despite this the authors of this paper believe the study is important since it sheds light on the previous IPO performance on the Danish market, before the time period this paper encompasses The winner's curse, legal liability, and the long-run price performance of initial public offerings in Finland - M Keloharju The Finnish study conducted by Keloharju (1993) and cited by Loughran et al. (1994) analyses and discusses whether the winner s curse hypothesis can be applicable to the Finnish stock market between the years of The study looks at the long-run performance of IPOs in Finland during the same period. Keloharju (1993) first calculates long-run performance through using the start price of the IPOs during market opening and then again through setting the start date as the average bid and ask spread, throughout the day. Through the use of the market opening stock price the study finds that the winner's curse phenomenon is clearly present within the Finnish markets. Through the use of the average bid and ask spread as the initial stock price, the study finds that over a period of three years the total average IPO on the Finnish market performed 22,4% worse than the market index. During this time the total market return was -1,6% making the average IPO return compared to market -20,8%. During the period of the study Finland experienced a hot-issue market where 43 out of the total of 80 IPOs looked at in the study went public in Keloharju (1993) argues that the high number of IPOs during these years can have had effect on the long run performance but could not say for sure as a result of a too short period studied. Due to a large portion of the sample being obtained over one year, the results received will be skewed towards the specific year of This means critique can be directed towards whether the study can be considered fully representative of the time period. The authors of this paper still believe the study is important as it looks at a time period prior to the one in this paper and is one of the only IPO studies conducted on the Finnish market. Furthermore, this the study finds evidence of the winner's curse phenomenon within the Finnish market, which argues for using the end of day stock value when measuring long term performance Summary of previous research 15

.")

16 2.3 Explanatory Variables Country In previous studies variables such as countries have not been used to explain the abnormal return, instead studies such as Schuster (2003) tested for abnormal return for the different countries separately. Using different countries as an explanatory variable has not been done before, but in light of the lowered transaction costs within larger regions it is now possible for investors to buy IPOs from different countries without transaction costs complicating the real return. (Degiro, 2017; Avanza, 2017). Using the country variable as an explanatory variable means statistically significant comparisons can be made between countries and inferences can be drawn Size In his 1991 article Ritter lifts Size of Issuance as a determining factor that could have effect on the long run underperformance. He mentions how smaller offerings tend to underperform their comparable benchmark to a greater extent than bigger firms. Schuster (2003) expanded on this to look at all of the shares in the company, and total market value instead of only the shares included in the issuance. In doing so he defined size as a dummy variable varying from small to medium to large. Whilst Schuster (2003), general findings points towards smaller firms being expected to underperform their comparable benchmark relative to bigger firms, displayed as a higher percentage negative relative to the benchmark. He is not able to find a statistical significance for this in the countries looked at. With this being said, other studies 16
17 within Europe have found size to be a relevant factor. Such as how the study by Álvarez and Gonzáles (2001) which looked at the Spanish market found that smaller firms had a tendency to underperform their comparable benchmark to a greater extent than larger firms. The definition of size is market value or market capitalization, which the authors define as outstanding shares times the end of day share price when introduced to market, this in accordance with Schuster (2003) Old Economy or New Economy As mentioned in previous research, Schuster (2003) found that companies active within industries included in the New Economy classification performed significantly better than others. In regards to countries with companies that had a greater involvement in the Old Economy, these countries showed a worse long run performance. The findings were robust and applicable to all of the countries that were looked at. Schuster defines New Economy as Media, Telecommunication, Healthcare and Technology and industries other than these are defined as Old Economy Cyclicality or Number of Issues Ritter found that the number of IPOs that were introduced each year to the market had a negative connection to long run performance. During years when there was a high number of IPOs, the IPOs tended to underperform a comparable benchmark to a higher degree than during years with a lower number of IPOs. This is explained as, firms goes public when investors are optimistic and willing to pay high multiples due to beliefs of strong growth opportunities. However, when investors realize that these beliefs are too strong they adjust and the price declines. (Ritter, 1991) Schuster (2003) also tried to find evidence that supported that number of issues had a negative impact on long run performance but was not able to find any statistical significance. Furthermore, Keloharju (1993) argues that the high number of IPOs during the time of the study could have been one of the factors influencing the underperformance of Finnish IPOs during the time period. With this being said Keloharju only mentions this briefly as a thought since the whole period looked at was characterized as a hot-issue market, but is not able to find any significance for it. 3. Methodology This chapter will start of by describing the research approach and then continue with describing how we reach our final sample. Later on, this chapter will also explain how the authors decided to classify the different variables. Lastly, the statistical methods and the study s validity and reliability will be discussed. 3.1 Scientific Methodology In regards to the questions proposed in this study, a quantitative method with a deductive approach was the natural research method to choose (Bryman & Bell, 2003). To commence the study an initial reading of literature related to the topic of IPOs performance was conducted. After analyzing the existing theory, hypotheses regarding the result of the study 17

18 were developed. The hypotheses were then tested in accordance with the method presented in this chapter. 3.2 Sample Selection The selection of data in the study is based on seven main criteria, which all are described in the following chapter. The size of the final sample of IPOs is 567, as shown in Figure 1. (Figure 1) Time frame The selection encompasses data that is limited to a period from to , whereas the last IPO in the sample was done As previous studies on the topic, in the selected regions, have a shorter time frame for their data (see table Summary of Previous Research) a longer period was chosen to get a higher significance even on the less active IPO markets. The longer period of time was also chosen to eliminate the potential problem in which companies have another risk profile than that of the index. The larger sample sizes due to the longer time-period are assumed to cause companies with varying risk profiles to cancel each other out. Resulting in a sample with equal risk to that of the chosen index for that market. The varying distribution between the sectors among the four marketplaces, as of today, (see Figure 2) also means that the markets and indirectly the IPOs will correlate with different macro factors. The longer time period the sample encompasses will help avoid cases in which macro trends could have a higher impact on the IPO market than the comparable index. This because positive and negative trends are more likely to cancel each other out, which is particularly important for this study since the benchmarks are characterized of companies dependent on various macro factors (see Figure 2). 18
19 3.2.2 Long-term A long-term perspective was chosen due to the belief that the long term share price better represent the actual value of the underlying company, meaning the return calculated is more representative of the actual return. This holds since a longer perspective allows more information regarding the company to reach the public and be incorporated in the price. Earlier studies find that incorporation of the additional information leads to a long-term underperformance relative to the market benchmark. In an attempt to test if this hypothesis holds a long term perspective has been chosen. The study has calculated long-term as three years, this in accordance with what previous studies by Loughran et al. (1994), Ritter (1991) and Schuster (2003) has defined it as Country selection The Nordic region was selected due to the similarity in culture and regulations among the different countries. The five Nordic countries were then initially scanned to find potential problems when comparing between them. It was found that the Icelandic market was too small, with too few IPOs to give a significant result. The remaining four (Denmark, Finland, Norway and Sweden) was then used in this study Stock Exchanges Nasdaq Stockholm, Nasdaq Helsinki, Nasdaq Copenhagen and Oslo Børs are the biggest marketplaces in their respective country and all complying with EU regulations. (Nasdaq, 2017; Oslo Bors, 2017) Markets such as Nasdaq First North and Oslo Axess mainly target smaller companies that for various reasons want to be publicly traded. Due their target group being smaller companies they have different regulations compared to the other Nordic markets and were therefore excluded from the study. Comparing markets in which the regulations are too different from each other could potentially lead to a misleading result End of Day Value Looking at the end of day share value makes the comparison between countries valid to a greater extent. This since a multitude of different factors affect the extent to which an IPO is underpriced, as discussed in the theory section of the paper. The magnitude of the effects also vary greatly between countries as can be seen in the great variance between first day results of previous studies looking at different countries. Given that these effects are highly difficult to control for, the end of day price is to be preferred. Since fewer factors then need to be controlled for in calculating the returns, meaning more significant inferences can be drawn. The end of day price on day of listing is not subject to influences from the aforementioned factors since market information is assumed to be incorporated in the price by the end of the first trading day. Using the end of day value is also in accordance with what subsequent studies within the area by Loughran et al. (1994), Ritter (1991) and Schuster (2003) have done. Using the end of day value also makes the study more applicable from the investor's perspective. This in accordance with Maros (1991) study as mentioned in the theory section above. In which he states that the amount of shares obtained and therefore return gained or 19
20 lost varies depending on the demand and therefore performance of the underlying IPO. The end of day value is instead the value of the stock on the second hand market, in which the investor is not limited in the amount she can purchase, as is the case at the initial IPO price Stock Prices In valuing and comparing returns over the time period, total return adjusted stock prices were used. Total return adjusted stock prices is stock prices adjusted for corporate actions such as dividend payments and splits. These were used since adjusted stock prices best represent the total return, in accordance with the majority of previous studies mentioned in this paper No former listing All introductions that occurred due to a list change, even if from outside the analyzed stock markets, were excluded. Companies that were introduced into the chosen markets as a secondary source of listing or as spin offs from already listed companies were also excluded from the sample. This since the value of the spin off company has already be incorporated into the mother companies price before the spin off and hence been indirectly listed through the mother company. Lastly, all cases in which mergers led to new listings were also excluded from the sample. This also in accordance with the same principal, meaning the firm s individual prices already has been incorporated into the price before the listing. Given that a stock already has been priced by the market, looking at these listings would skew results since they already have been indirectly listed on the market, meaning their 3 year initial listing has already indirectly started or finished A or B Stock In cases when both A and B stocks have been listed, the first stock listing has been chosen. In the cases when A and B stocks have been listed simultaneously the stock with the highest average turnover according to Datastream has been chosen. This since a higher turnover leads to information being incorporated into the price quicker. 3.3 Choosing the Benchmark Earlier studies within the area of IPOs have defined BHAR as the country specific IPOs under or over performance relative to the country specific benchmark. This paper has defined BHAR in the same way in order to enable comparisons with earlier studies later on in the paper, allowing for a better analysis of results. This also allows the regression to find if the specific country performed better or worse than the other countries relative to the country index. Comparing all countries to an overall Nordic index would lead to unwanted differences between the countries weight relative to the total Nordic benchmark (This is discussed in greater detail under Method Discussion Benchmark ). The gross index was chosen at each market, except Helsinki where the similar total return index were used, instead of the otherwise commonly used price index. This because of the fact that a gross index is reinvesting the dividends while a price index does not. Hence, the gross index reflects the true return and the price index only the actual price per stock. The IPOs included in the samples are therefore adjusted the same way as the indexes. 20
, Nasdaq Copenhagen - OMXCCAPGI and Nasdaq Helsinki - OMXH. (Figure 2) (Datastream, 2017) 3.")


21 The benchmarks for the selected countries are as follows: Oslo Børs - OSEAX, Nasdaq Stockholm - Affärsvärldens General Index (AFGX), Nasdaq Copenhagen - OMXCCAPGI and Nasdaq Helsinki - OMXH. (Figure 2) (Datastream, 2017) 3.4 Collecting and Processing of Data The collecting of data started with a quick scan for what type of data that efficiently could be imported from Datastream. The price adjusted closing rate, total market capitalization and the ICB classification were then imported for the IPOs from each year included in the study. Since Datastream for Sweden also includes Nasdaq First North (formerly called Nya Marknaden ), the original source of listing was double checked towards the register provided on the website of the Swedish tax agency, Skatteverket. If first listed on another market then Nasdaq Stockholm (formerly called A and O list) these were excluded, in accordance with previous studies in the field and this study s chosen limitations. As Datastream indicates 21
22 if a company is a merger, a formerly listed company or a spin off from another listed company, these could easily be excluded from the imported sample without any crosscheck with other sources. The chosen benchmarks were if available for all years obtained from Datastream. The history from the Nasdaq Copenhagen and the Oslo Børs indexes did not go back as far as the study s samples in Datastream and were therefore fetched from Nasdaq and Oslo Børs respectively, and inserted. 3.5 Calculation of abnormal return The authors have chosen to calculate and define abnormal returns in accordance with what Barber and Lyon (1997) consider as being optimal when calculating long term abnormal returns. In their study they advocate calculating long term abnormal returns as the long-run buy-and-hold return of a sample firm less the long-run return of an appropriate benchmark. The buy and hold abnormal return (BHAR) is calculated through calculating the geometric average return of the sample firm (BHR Stock), then calculating the geometric average return of the benchmark (BHR Market). BHR = P! P! P! Finally one deducts the calculated benchmark return from the calculated sample firm return as the equation below states, in accordance with Barber & Lyon (1997).! BHAR!" = 1 + R!"!!!!!!! 1 + E(R!" )!!!! 1 + R!" = BHR!"#!!!! 1 + E(R!" ) = BHR!"#$% 3.6 Explanatory Variables and Dummy Variables The purpose for the following section is to describe variables aiming to explain the BHAR. Hypotheses were formulated based on conclusions from previous research Country - Dummy The variable is based on which country the issue occurred in and is intended to explain if the selection of any country gives a significantly different return from the others. The countries were defined as dummy variables and set to a specific number between 1 and 4 (1:Sweden, 2:Denmark, 3:Norway, 4:Finland). In the regression the country with largest sample meaning the highest probability of significance (3:Norway) was dropped in order to bench the remaining three against this sample. 22
23 Given the fact that no major recognized study using Country as a dummy variable for IPOs has been done, it is hard to know whether the study will yield a significant result or not. Taking into account individual studies by Loughran et al. (1994), Jacobsen & Sørensen (2001), Keloharju (1993) and Schuster (2003) a higher return in Sweden would be expected compared to Denmark and Finland. The lack of studies on the Norwegian market makes the level of significance unsure, but since all major previous research shows long-run underperformance for a majority of countries, the Norwegian IPOs are most likely to underperform their benchmark H0: There are no significant differences amongst IPOs long run performance on the Nordic market dependent on which country they are listed in H1: There are significant differences amongst IPOs long run performance on the Nordic market dependent on which country they are listed in Size Schuster (2003) defined size in classes of small or large, in doing so he was not able to receive a significant result. The authors of this study have instead used logarithmized size to explain the result in the BHAR result, in order to see if including more information in the variable through making it a continuous variable will lead to significant results. Ritter (1991) defined size of issuance as a continuous variable in order to find significance, the hope is that logarithmized size will give a more exact result without any rounding to either classes of small or large, leading to a significance not found by Schuster. When determining size the market value of the listed company, defined as total number of shares multiplied by the share price in the local country currency, was multiplied with the dollar exchange rate at the time of issuance. The dollar was used since it has been in existence throughout the entire time period looked at is often used as a benchmark currency being considered one of the most stable currencies in the world. H0: IPOs with a smaller market value will not have a lower long run performance than IPOs with a larger market value H1: IPOs with a smaller market value will have a lower long run performance than IPOs with a larger market value New/Old Economy - Dummy The authors use the definition lifted by Schuster (2003) when defining the New/Old economy variable, as the studies share similarities regarding comparing countries. The ICBclassification benchmark was used by Schuster (2003) when he classified the IPOs as New or Old Economy. Schuster (2003) defines New Economy as stocks within the industries of Technology, Telecommunications, Healthcare and Media. According to ICB (2017), Media is not an industry but sector that includes Broadcasting & Entertainment, Media Agencies and Publishing. H 0 = IPOs within New Economy will not deliver a higher long run performance than those of Old Economy. 23
 in which he finds significant underperformance of companies")

24 H 1 = IPOs within New Economy will deliver a higher long run performance than those of Old Economy. (Figure 3) (Datastream, 2017) Number of Issues, Cyclicality This paper has set number of issues to be a continuous variable as is done in the study by Ritter (1991) in which he finds significant underperformance of companies listed during years when many other listings occur as well, defined as high volume years. Since the Nordic market is being looked at, the total number of issues on the Nordic market each year is looked at. When calculating number of issues each year, companies that were delisted within 3 years were included in accordance with Ritters (1991) study. H0: Companies listed during high volume years will not deliver lower long run performance than those listed during low volume years. H1: Companies listed during high volume years will deliver lower long run performance than those listed during low volume years. 3.7 Reliability and Validity In this section reliability and validity will be tested and discussed. In order to draw significant inferences from the results the work leading up to the results need to be reliable and valid Reliability Bryman & Bell (2011) partly defines reliability as such so that anyone following the methods described in the research could reproduce the same results. To ensure this the authors of this study made sure that manual exclusions from the sample were excluded through a motivated and highly precise method. The data for the study was mainly fetched from DataStream, a database by Thomson Financial that is widely used within the field of Corporate Finance. The database collects its data from official sources, which ensures reliability of the data collected. Chosen benchmarks that did not have enough history in DataStream were instead fetched from Nasdaq or Oslo Bors and then manually inserted. Even if the manual insertion opens for human faults, and 24
25 solely relying on Datastream exposes the study towards faults by Datastream. The authors believe the controls conducted through using reviewed official sources, in unsure cases in order to minimize faulty information, entails that the process of collecting data can be considered reliable. When performing statistical tests, the commonly used program Eviews was mainly used. For the ANOVA and t-test Microsoft Excel was used, to ensure no human faults for these tests two independent tests were conducted for both the ANOVA and t-test. The authors as acknowledge the utilized sources for processing data as reliable. Bryman & Bell (2011) also advocate that a reliable study should ensure that factors that only are temporary are excluded. To ensure that this was met, the authors of the study chose a period including both economic depressions as well as good economic times. Both the dot.com bubble and the financial crisis are included in the sample, resulting in a higher probability of excluding random, short-term factors affecting the result. Moreover, the sample contains 567 IPOs and are can hence be considered great enough to ensure that abnormalities do not have a large effect on the study Validity Validity refers to the extent which the study is able to measure what it is meant to measure. This holds if there are said to be no systematic errors in the measurement in accordance with a set of assumptions lifted by Gauss Markov. (Brooks, 2014) To control for this a set of tests were conducted which will be explained in greater detail on the following section OLS - Ordinary Least Square Ordinary least square (OLS) is a method that investigates the unknown parameters in a regression model. It does this through minimizing the sum of the squared deviations of the residuals to find a best fitting line to describe the relationship between the dependent and independent variables. (Brooks, 2014). This paper will use OLS to conduct a multiple linear regression model, using multiple independent variables to try and determine the outcome of the dependent variable. For this method to work a number of assumptions need to hold in order for the analysis to be considered valid and relevant. In accordance with the Gauss Markov theorem the following set of 5 assumptions need to hold (Brooks, 2014) (1) The errors have zero mean This assumption implies there is linearity between the parameters being estimated. If the regression includes a y intercept this assumption is therefore expected to hold. (Brooks, 2014) (2) The variance of the errors is constant If this assumption does not hold true there is said to be heteroskedasticity. A White test should be conducted to find if this is the case, and if heteroskedasticity is found heteroskedasticityrobust standard errors should be implemented. (Brooks, 2014) (3) The errors are uncorrelated with one another 25
26 Violation of this assumption can lead to errors attributed to endogenous variables due to omitted variable bias. A low adjusted R squared as is common in studies regarding IPOs means a greater possibility for this type of error. Given that most previous studies have excluded controlling for this error due to complexity and problems it may cause the authors of this study have chosen to do the same. Violation of the assumption above can also lead to reverse causality errors. To avoid potential error, the authors of this paper have focused on using independent variables from the start of the measurement period. Which minimizes the potential for causality error in comparison to using independent variables from during or at the end of the measurement period. (4) There is no correlation between the dependent variable and the corresponding error Since this study does not continuously monitor the dependent variable there is no need to conduct an autocorrelation test, as the dependent variable will not have the ability to impact themselves. (Brooks, 2014) (5) The error term is normally distributed The Jarque Bera test is used to test whether the variables are normally distributed. In the case of non-normality extreme outliers who skew results should be excluded and continuous variables should be logarithmized. (Brooks, 2014) If all these assumptions hold the regression is said to be the Best Linear Unbiased Estimator. Meaning the regression and observations are valid, and valid inferences can be drawn from the results (Brooks, 2014) Jarque Bera test A Jarque Bera test was conducted to ensure the error terms of the continuous variables were normally distributed. A normal distribution is not expected to have any skewness, since it measures to what extent a distribution is symmetrically distributed around its mean. Alongside this a normal distribution is expected to have a coefficient kurtosis of 3, measured as how fat the tails of the distribution are. In order for these conditions to hold and the error terms to be normally distributed, a histogram should be Bell shaped. Alongside this the null hypothesis of the Jarque Bera test, stating the error terms are not normally distributed, should be rejected at the 5 percent level, implying a p value greater than If the error terms are not normally distributed in accordance with Jarque Bera test, it is probable that there are extreme outliers that skew results and data. Through excluding extreme outliers one can avoid this and improve the results of the Jarque Bera test. Alongside this logarithmizing a continuous variable can also lead to an increased normal distribution of the error terms around the mean (Brooks, 2014) Brooks (2014) goes on to state that if non normality is found despite excluding extreme outliers For sample sizes that are sufficiently large, violation of the normality assumption is virtually inconsequential (Brooks, 2014, p.210.), which is important to this specific study as we use a very large sample size Heteroskedasticity test 26
27 A White test was conducted to ensure the variance of the error terms was constant, when this is the case there is said to be homoscedasticity, which is needed for the analysis to be relevant. Heteroskedasticity instead implies that the variance of the error terms is systematic. If so OLS will not give the most efficient estimator since heteroskedasticity implies others estimators could be found which could provide a better fitted line. In EViews the White test presents three different sub tests for heteroskedasticity. To be certain heteroskedasticity is not present, each of the test should be rejected at the 5 percent level, implying the p values received should be greater than If the White test cannot be rejected at the 5 percent level heteroskedasticity-robust standard errors should be implemented through EViews (Brooks, 2014) Multicollinearity test When independent variables are correlated with one another to a non-negligible extent it is referred to as near multicollinearity. This is undesirable, as it will cause loss of precision in the study through a high R squared, whilst the individual variables will show low significance since they will have high standard error. Alongside this, multicollinearity makes it hard to draw inferences from the coefficients received. To test for multicollinearity a correlation matrix should be constructed and independent variables dropped if correlation between two exceeds 0.8. (Brooks, 2014) Ramsey RESET test In order for the regression to be valid one must also test for whether a linear regression is the best approximation for the relationship between the dependent and independent variables. The test uses non linear combinations of the dependent variables to attempt to explain the independent variable. Then tests if these new coefficients can reject the null hypothesis. If the p values received are higher than 0.05 the functional form originally assumed is said to be incorrect. (Brooks, 2014) Two Sample and One Sample t-test A two sample two-tailed t-test was conducted which entails testing two sets of data against each other. A two-tailed test indicates it tests for both positive and negative variances, meaning the absolute value of the t stat received should be compared to the absolute value of the critical t stat. In the case of this paper BHR Market was tested against BHR Stock. When conducting a two sample t-test equal or unequal variances can be assumed, which means a variance analysis of the samples looked at should be conducted. A variance analysis in turn considers if one is looking at a population meaning all possible observations in the universe being looked at, or a sample meaning a smaller portion of the universe. Given that this study has included all observations within the universe a population variance analysis was undertaken. Thereafter a two sample two tailed t-test assuming unequal variances presents a t value, if this is higher than the critical t value the null is rejected. Rejecting the null implies there are significant differences between the outcomes of the samples looked at. (Wahlgren, 2012) In order to find if the dependent variable BHAR was significantly different from zero and understand if the variable was expected to be negative or positive, implying 27
28 underperformance or overperformance respectively. A one sample two-tailed t-test was conducted, which entails testing one sample of observations relative to a null hypothesis. If the t stat received is greater than the critical t stat the null is said to be rejected meaning the expected value of the sample can be said to be significantly different from zero. Given that the test is two tailed, a negative t value implies a positive BHAR and a positive value implies a negative BHAR. (Wahlgren, 2012) ANOVA test ANOVA is an abbreviation for ANalysis Of VAriance and focuses on analyzing the variance of mean value (Gujarati & Porter, 2010). The ANOVA tests the statistical difference between three or more populations and compares the means between the different groups. The ANOVA was conducted in order to test for the null hypothesis that there was no difference between the BHAR averages for the different countries. If differences are found this entails further calculations could be made and potential inferences can be drawn. When performing a test such as the ANOVA but between only two different variables it is called a t-test. Since multiple single t-tests would risk concluding significance even if no real significance exists, due to alpha inflation (type I error) ANOVA is the preferable test when testing more than two variables. If the F stat received is higher than the critical F stat the null hypothesis is rejected meaning the means between the groups looked at are significantly different. (Wahlgren 2012) Level of Significance (α) & P-value Level of significance, or the risk of error is often set to 1%, 5% or 10%. This describes the risk of rejecting the null hypothesis given that the null hypothesis is true. A better way to find a more exact significance level is using the p-value or probability value, which is defined as the lowest significance level at which the null hypothesis can be rejected. The lower the p- value the stronger is the evidence against the null hypothesis. (Gujarati & Porter, 2010) Coefficient of Determination (R 2 ) Coefficient of determination or R 2 shows how much the explanatory variables explain the variability of the dependent variable in the regression analysis. R 2 can take values from 0 to 1, a value of 1 means that the models explanatory degree is very high and all variability of the dependent variable is explained by the explanatory variables. A R 2 value close to zero means the independent variables are able to explain the variability of the dependent variable poorly. (Brooks, 2014) When using more than one explanatory variable the adjusted coefficient of determination is a better indicator for the explanatory degree of the regression model. When adding an extra variable the R 2 will always increase even though the extra variable might not add any particular explanatory power. The adjusted R 2 takes this information into consideration and lowers the R 2 for extra values added, which gives a more justified result. (Brooks, 2014) Determining what is a good or bad adjusted R 2 is hot topic and there is no real answers to what is considered bad, it tends to be very dependent on the topic being studied and adjusted R 2 found by previous studies. In regards to the field of IPOs, the most prominent study in the field by Ritter (1991) got an adjusted R 2 of 0,07 when using stock return as a dependent variable and six different explanatory variables, where number of issues was one of them. The 28
29 findings of the study were considered significant and the study is widely cited within the subject of IPOs today. 3.8 Criticism and Motivation for choice of Method Stock prices Alternative factors such as assets could have been used instead of stock price to evaluate the return of the individual companies in the study. The change in assets over the time period could then be compared to the decrease or increase in assets for the chosen benchmark. With this being said, the choice to use stock prices was mainly based on the fact that previous studies have used this method. It could also be argued that stock prices are the natural factor to look at since the study takes an academic empirical viewpoint of an investor Long-term Ritter (1991) defines long term to be three years as he saw changes of the IPOs performance after approximately three years. Studies made by Schuster (2003), Loughran et al. (1994) and Keloharju (1993) follow this definition of long term. However, Ritter & Loughran (1995) used both three and five years in their study to evaluate the long run performance. Alongside this, five years was used in the study by Loughran (1993), which found that after approximately five years the IPOs underperformed on the New York Nasdaq exchange. Furthermore, in the Danish study conducted by Jakobsen & Sørensen (2001) also define long term as five years instead of three. The authors of this study made the decision to define long term as three years in order to enable better comparisons with previous research conducted on the Swedish and Finnish market. Alongside this, both Loughran (1993) and Ritter & Loughran (1995), whom looked at a five-year period, had a bigger sample of IPOs than achieved in this study. By using three years the authors are able to get a greater sample relative to using a five years which in turn leads to greater validity Benchmark Previous studies have used different types of benchmarks in order to compare if IPOs have overperformed comparable benchmarks. These different studies have used benchmarks such as comparable firms, all share indexes and other types of indexes. The authors of the this study have used a gross adjusted/total return all share index for the included countries. The total return has been used since it is comparable with the adjusted stock prices. Comparable firms could have been used, but since defining which firms are comparable is subjective this would open up for criticism on the authors picking the firms that gives the most favorable result. All the IPOs in the study are also included in the benchmark to which they are compared. In this benchmark all companies including the IPOs are weighted in accordance to their size compared to the rest. Since the IPOs affect the benchmark, the results will be a little bit skewed, but since excluding all IPOs from index would mean building a completely new, not generally accepted, weighted index, this small skewness was accepted. This is also in accordance with all major previous studies in the field of IPO long-term performance. 29
30 The problem with weighting would have occurred on a larger scale, if a Nordic Index would have been used as benchmark for the total Nordic market. In a Nordic index the companies on the different Nordic stock markets would be weighted in accordance to size, resulting in a skewed BHAR-market towards the biggest total market Sweden. In the case of this paper, Norway has the largest amount of IPOs represented in the sample being looked at. A comparison to the overall Nordic Index which is skewed towards Sweden would therefore lead to worsened results meaning less relevant inferences can be drawn from the study. Due to an underweighting of Norway in the Nordic All Share Index relative to our sample of IPOs, the other countries will have a total overweight in the Nordic Index relative to how they are represented in the sample. Taking this into account combined with the fact that using company specific benchmark increases the potential for comparability with previous studies, the authors used country specific benchmarks in calculating BHAR this paper. Calculating the average BHAR through weighting all the BHARs received, will lead to a more correct result. In the case of Norway, which represents 242 companies in the sample, 242 BHAR, which in turn are calculated relative to the Norwegian market, will be included in the average. Leading to a greater weighting towards the Norwegian market Index. Which, as discussed above, will lead to a more correct end result Calculation of Abnormal Return When calculating the abnormal returns the most common methods are CAR and BHAR. Which one of the methods that is most applicable varies depending on several factors, however a key difference is that the CAR is calculated through deducting the benchmark returns in every observation point from its corresponding sample firm return. Then taking the arithmetic average of the abnormal returns, whilst BHAR uses geometric sums. The authors of this study decided to utilize the BHAR method rather than CAR mainly because of the strong evidence well-reputed economists, such as Barber & Lyons (1997), have put forward against CAR being a biased long term predictor, that even when correct miscalculates the magnitude of investing in the sample firm relative to the benchmark. Ritter (1991) and Barber & Lyons (1997) have also argued that a CAR calculation is not appealing on economic grounds, which gave further incentives to use BHAR instead of CAR. 4. Results In this chapter the results from the study will be presented, this includes the results of the statistical testings and regressions. The dependent variable BHAR will be interpreted and the result for the explanatory variables will be reported. 4.1 Data The study started with 570 companies going public from until but after adjusting for extreme outliers in size and BHAR. The final sample was set to BHAR Initially a Two Sample t-test was conducted between the BHR of the market and the BHR of the stocks. This to assure there are significant differences between the performance of the markets and of the stocks, if no difference were to be found further studies would be useless 30


31 as no inferences could be drawn based on the fact that there is no certainty differences any abnormal returns occur to begin with. As stated above, a variance analysis initially needs to be conducted, which as displayed below, shows the variances between BHR Stock and BHR Market are significantly different. Therefore a two-sample t test assuming unequal variances should be undertaken. Given the results of the two-sample t-test displayed below, we see how there are significant differences between the performance of the market and performance of IPOs over a three-year period. Therefore we can continue with our study and see if any inferences can be drawn from the potential results. To further analyze the BHAR a one-sample t-test was conducted, with the null hypothesis assuming the expected BHAR value would be 0. As displayed below the t stat received from this test is significantly higher than the required critical value. Since BHAR is expected to be different than zero this means that abnormal returns do exist on the Nordic IPO market. The t- stat displayed below is negative, which entails IPOs on the Nordic market generally underperform their comparable benchmark over a three-year period. Which is also what was found, as the average BHAR of the Nordic market was -58% Country Out of the 567 companies included in the sample only 117 companies showed a positive BHAR. The most companies that showed a positive BHAR were from Sweden with a number of 61 companies representing 44,6% of the Swedish sample. The country with the lowest ratio of companies showing a positive BHAR was Norway with only 9,9% of the Norwegian sample. The country factor was represented as a dummy variable in the regression. Thereby it requires one country to be dropped whilst running the regression. To enable better comparison 31


32 between the countries multiple regressions have been run whilst rotating the country base variable. The graph below displays the coefficients for each dummy with the vertical column representing which dummy has been dropped. As displayed below Sweden performed the best, as can be seen with a significantly higher BHAR relative to all other countries, delivering between 52.4% to 109.2% higher returns. Thereafter comes Denmark whose IPOs delivered 56.8% and 23.9% higher BHAR than Norway and Finland respectively. Finland has only delivered a higher BHAR than Norway by 32.8%. Finally Norway has delivered the lowest BHAR of all underperforming all other Nordic countries. The table above shows how the coefficients of the dummy variables can be considered highly significant with many 4 star significances. However, it also displays how no significance can be found between Denmark and Finland, with a p value of Due to this no statistically significant inferences can be drawn regarding whether there are differences between the BHAR of Denmark and Finland over the time period being looked at. A more in-depth look at the country performance highlights the differences discussed above. Instead of looking at relative performance the table below shows absolute performance. As seen below Sweden is the only country that on average has been able to deliver a positive BHAR. Alongside this the volatility of BHAR seems to be drastically across the countries, implying IPOs tend to have a high level of volatility and thereby risk. Given the high levels of volatility there is a potential risk for the means not being significantly different from each other. Whilst the regression has found significance, there is potential for a type 1 error to occur due to the use of multiple dummy variables. Therefor an ANOVA analysis was conducted. As shown below, the F value received is higher than the critical F value, which means the null hypothesis can be rejected. Therefore we can conclude the means received above are statistically different from one another. Based on what is mentioned above. We can conclude that the country variable has a significant impact on performance with the expected BHAR in each country being significantly different from one another, and Sweden being the only country who delivers an 32
 (Appendix 1.5), the size variable delivers a p value of 0.")
33 on average positive BHAR. This indicates that Swedish IPOs in general outperform their market benchmark Size After excluding extreme outliers and logarithmizing the size (explained in greater detail in 4.3 Regression Diagnostics ) (Appendix 1.5), the size variable delivers a p value of 0.59 (Appendix 2.1). As this is higher than 0.05 the null cannot be rejected, showing that size, or market value, of the IPOs has no significant impact on the BHAR of newly listed companies on the nordic markets. An argument can be made that the country variable partially captures the explanatory power of size. This effect should however be small, since the variance of size of the companies being listed is fairly similar across countries. To control for this an alternate regression has been run, in which the country variable has been dropped. As can be seen in Appendix 2.2 this gives a lower p-value than before of 0.4 indicating increased statistical significance. As this is still much higher than the critical value of 0.05 statistical significance cannot be found New/Old Economy As the table below displays, 178 companies representing 31% of the total sample are New Economy companies, whereas 389 companies representing 69% of the total sample are Old Economy companies. Out of the 178 companies within New Economy only 35 companies showed a positive BHAR. The regression showed that the null hypothesis should be rejected with a p-value of 0,1053 (See Appendix 2.1). As this paper looks at significance on the 0.01, 0.1, 1 and 5% level, the conclusion can therefore be drawn that there is no clear evidence New Economy IPOs (as defined by Schuster) has an significant effect on BHAR. A potential reason for the low statistical significance of the dummy variable is that the country variables already are able to capture a large portion of the New/Old economy variables explanatory power. This since the countries looked at tend to vary greatly in regards to what industries are represented within them. To test this the country variables were excluded and an alternate regression was run. Yielding the results displayed in Appendix 2.2. As can be seen in the table this leads to a 2 star significance for the New/Old economy variable. The coefficient indicates that a company active within an industry included in the New Economy classification is expected to deliver a 32.2% higher BHAR over a 3 year period relative to a company active within an industry classified as Old economy. Given the new regression has a much lower explanatory power as can be seen in the lower adjusted R squared. It can be concluded that whilst the alternate regression shows New/Old economy can have a significant impact on BHAR the country variable is able to explain a much greater portion of the variance of BHAR. Therefore the authors will use the original regression going forward (Appendix 2.1). 33
34 An more in depth look at New/Old economy shows Sweden and Finland have the highest percentage of companies active within New Economy industries with 39% and 43% respectively, whereas Norway has the lowest percentage with 21% Number of Issues The numbers of issues during the period from 1997 to 2014 are displayed in the Table below. Note the total number of issues stated is 730 instead of 567, this is since companies that were delisted within three years are included. The regression (Appendix 2.1), shows a p-value of 0,0018 meaning that null hypothesis is accepted at the 1% level. Due to this we can draw inferences from the coefficient. Which implies that for every extra company listed during a specific year in the Nordic region, the other companies listed during that same year are expected to deliver a 0.6% lower BHAR over a 3 year period. A more in depth look at the Number of Issues shows that they vary greatly between years with a maximum of 101 companies being listed in 1997 and a minimum of 6 companies being listed, which occurred in years 2009 and As can be seen the variance of the number of IPOs of a specific country relative to the total each year is high. 34
35 4.2 Regressions 4.2 Regression Diagnostics Jarque Bera test Adjustments have been made in order to ensure normally distributed errors in accordance with what is described in The initial BHAR results were highly skewed due to an extreme outlier, namely Vestas Wind Systems with a BHAR of 1213% (Appendix 1.1). This can be seen through the boxplot and high Jarque Bera. The authors made the decision to exclude the outlier in order to receive a more normally distributed result. However as can be seen in Appendix 1.2 the p-value remained below Despite this no additional adjustments were made, in accordance with Brooks (2014) who states that given a sufficiently large sample size, such as the one looked at in this paper, a potential violation of the normality assumption is inconsequential. In regards to the size variable (Appendix 1.3) it was initially highly unevenly distributed. As can be seen through a high Jarque Bera and a p-value significantly lower than 0.05, with two extreme outliers potentially skewing the results. The extreme outliers, Telia Company and Statoil with sizes of and million dollars respectively were excluded (Appendix 1.4). Despite the actions taken the Jarque Bera was still high and p-value was still significantly lower than To further mitigate risk for worsened results due to higher skewness and kurtosis than a normal distribution would expect. The size variable was logarithmized (Appendix 1.5) this significantly lowered the Jarque Bera and drove the p value above 0.05 to 0.15, leading to the null being rejected. Therefore the logarithmized size variable can be considered normally distributed, meaning potential inferences can be drawn from the results Heteroskedasticity A white test was conducted on the regression in order to find if heteroskedasticity was present (Appendix 3). The F and χ 2 version of the White test conclude that there is no presence of heteroskedasticity, whilst the Scaled Explained SS indicates potential heteroskedasticity. Given the ambiguity in the results, a test was conducted where heteroskedasticity-robust standard errors were implemented. However the inferential effects after the implementation were negligible Multicollinearity The correlation matrix presented in Appendix 5 shows that there is no evidence of multicollinearity in any of the explanatory variables. The highest level of correlation was 0,25 found between the dummy variables representing Sweden and Finland's performance relative to Norway (Appendix 5). Given the correlation between all coefficients is significantly lower than 0.8 it can be asserted no multicollinearity is present. Which entails clear and significant inferences can be drawn regarding the coefficients. 35
36 4.2.4 Ramsey RESET test As displayed in Appendix 4 the Ramsey RESET test produced p-value of 0.395, which is higher than the critical p value of This implies the null can be rejected meaning a linear regression is the best approximation for the model 5. Analysis The chapter will first analyze the result received from our dependent variable BHAR, and then analyze the explanatory variables effects on the BHAR. The analysis will also included comparisons to previous research within the area and analyze these as well. 5.1 BHAR - Dependent Variable The long run performance of IPOs has been and still is a very hot topic. Ritter (1991) found that the overall long run performance of IPOs on the US market underperformed their comparable benchmark. Whilst this phenomenon was found to be present in many countries, Loughran et al. (1994) were able to find exceptions in Sweden Korea and Japan who instead were able to overperform their comparable benchmark. The authors will refrain from making a too in depth comparison with earlier studies when looking at the overall BHAR received, as well as avoid drawing too in depth inferences based on comparisons with earlier studies. The reasoning behind this is that the paper looks at a greater geographical region, namely the Nordics, therefore deeper comparison with country specific results may yield faulty inferences. Out of the sample studied, 450 companies showed a negative BHAR and only 117 showed a positive BHAR, hence the median IPO has a negative BHAR. When looking at the average performance, the results display a BHAR in the Nordic region is -58% which implies a 3 year underperformance of IPOs in the Nordic region. The underperformance is statistically significant as shown by the T-test generating a negative t-stat. The underperformance is in accordance with the majority of previous research, such as Schuster (2003) and Ritter (1991), whom also found a significantly higher underperformance relative to comparable benchmarks, whilst the magnitude of the underperformance differs. The magnitude of underperformance in general differs from subsequent country specific studies conducted within the Nordic region, as well as other international studies. The underperformance can be attributed to the divergence of opinion hypothesis (Ritter, 1998) stating that as time passes and more information reaches the market the divergence of opinion between optimistic and pessimistic investors minimizes, leading to the price dropping as the over optimistic investors revise their opinion. Given the greater underperformance of 58% found, is this study relative to other studies on previous markets such as the one conducted by Brav. et al. (2000), who found IPOs on the American market to underperform the S&P with 44% the results could indicate that the effect of the divergence of opinion greater in the Nordic region. The underperformance can also be attributed to the Impresario hypothesis, and the greater magnitude of the underperformance a result of a greater impact of the hypothesis on countries in the Nordic region. Whilst it is probable that these effects have had an impact given the robust findings of previous studies, no direct conclusion regarding their exact 36
37 impact can be drawn, since the hypotheses have not been tested directly. These two hypotheses are discussed in greater detail in 6.1 Concluding discussion. 5.2 Country As mentioned earlier, given that studies so far have mainly focused on specific countries and not looked across country borders to focus on regions, this study can be considered to stand out from previous research. As the results above show and the following analysis will highlight, this allows the authors are to make direct comparisons between countries and determine if there are significant differences between the performances of their IPOs Studies that may be attributable to the country variable have been discussed above, therefore they will not be discussed in greater detail again. The results of the studies conducted on companies used as variables will be used in the following analysis. In sum, Loughran et. al (1994) found Sweden a positive BHAR of 1.2% whilst Schuster (2003) found Sweden underperformed the comparable benchmark, be it only slightly. Keloharju (1993) and Jakobsen & Sørensen (2001) showed that Finnish and Danish IPOs underperformed comparable benchmarks with -20,8% and -30%. An initial look at the results show Sweden is the only country that delivers a positive BHAR of 8%, whilst Denmark, Finland and Norway deliver negative BHARs of -45%, -63% and - 99% respectively. In regards to Sweden the results strengthen the conclusion of Loughran et al (1994) whilst they are in contrast to the findings of Schuster (2003), which indicated an underperformance relative to the country benchmark. Schuster s explanation for Loughran et al (1994) positive BHAR was beneficial taxation rules in Sweden prior to However as this study shows, through looking at a similar period as Schuster (after the year of 1990), using the same benchmark and expanding to looking at a 20-year period instead of a 10 year period, a positive BHAR can still be found in Sweden. In regards to Denmark a negative return relative to benchmark was found, which is in accordance with the research done by Jakobsen & Sørensen (2001) whom found a negative return relative to benchmark of -30%. The results of this study are of interest as it found a significantly higher negative return of - 45%. Given that Jakobsen & Sørensen defined long term of 5 years, the results of this study open up the possibility of underpricing of Danish IPOs reducing over time. In regards to the study by Keloharju (1993), which found IPOs to underperform by 20,8% relative to the Finnish market, the results of this study were much, more extreme. With Finland delivering a negative return relative to benchmark of -63%. The significant differences in results may be due to an extreme market return for Finland during the late 90s increasing the negative magnitude of the return, as it is measured relative to the market return. Alongside this Keloharju s (1993) sample was highly skewed towards one year with over 50% of the total sample of IPOs listed during 1988 which may compromise the validity of the studies. In regards to Norway no previous research has been conducted on IPOs within the country giving this paper no study to compare against. The negative BHAR of -99% may seem extreme however it is important to consider that BHAR is measured as the underperformance of the stocks relative to the benchmark and not purely the performance of the stock. An interesting aspect of this study is the subsequent regression that was run. Through it the authors were able to test if a country variable could be said to have a significant impact on the BHAR, and thus test if the performances were significantly different from country to country. 37
38 Previous studies within the area, specifically within the Nordic region, have been done on a country-by-country basis, which does not allow for this type of comparison. As displayed in the results the country variables have a high significance, with the exclusion of the dummy variable comparing the performance of Finland and Denmark. The p value of 0.18 indicates that we are not able to draw any inferences regarding Finland's performance relative to Denmark or vice versa. Given that statistical significance was found, it is of interest to see if economical significance can be found. Norway will be used as the base variable in the following analysis, as it has the greatest sample size. Given Norway as a base (Appendix 2.1), the coefficient for Sweden is 1.093, implying a 109.3% higher BHAR if an IPO occurs in Sweden relative to if it occurs in Norway. The standard error is 0.135, which means the BHAR can vary between being 95.8% to 122.8% higher. The coefficient for Denmark is with a standard error of 0.152, implying that over a 3-year period, a company listed in Denmark is expected to deliver a BHAR that is between 41.6% to 72% higher than a company listed in Norway. The coefficient for Finland is with a standard error of 0.150, meaning that a company listed in Denmark is expected to deliver a 17.8% to 47.8% higher BHAR than a company listed in Norway. Since all the results span highly positive results there can be said to be economic significance. As an example, when all else is held equal an investor would benefit highly from investing in a Swedish IPO relative to a Norwegian IPO, she would also benefit highly from investing in a Danish or Finnish IPO relative to investing in one from Norway. 5.3 Size Size of issuance was in Ritter (1991) showed to have a significantly negative impact on long run performance, his findings displayed that a smaller initial offering led to worse long run performance. As this study examined total size of company, meaning market value, and no significance was found comparisons to Ritters study (1991) should be avoided. The authors of this study instead chose to define size as Schuster (2003), with the exception of using size as a continuous variable instead of using it as a dummy. The hopes were to receive a higher significance than Schuster (2003) through more information incorporated in the continuous variable. As displayed in the results no statistical significance was found given the new variable, this despite running a new regression in which the country variable was dropped. Given this one should be careful when attempting to make comparisons and drawing any potential inferences. A potential conclusion, with consideration taken to that no statistical significance was found. Is that despite attempting to include more information in the size variable no effect on BHAR was found. It is therefore probable that size is not an influencing factor when looking at the long run return of IPO. 5.4 New / Old Economy Schuster (2003) showed that countries with high involvement in IPOs within New Economy tend to perform better in the long run compared to countries with high involvement in Old Economy IPOs. As displayed in the above results, when dropping the country variable, the overperformance of New Economy companies, as defined by Schuster still holds today. This is interesting as Schuster conducted his study in 2003 using a time period of One 38
39 could expect the definition of New Economy industries to change over time leading to varied results but as this study shows that is not the case with the significance of the variable remaining high. Schuster only looked at Sweden in regards to the countries in this study. The results therefore also shed light on the fact that the results are applicable to the entire Nordic region and not merely Sweden. In Schusters (2003) study, Sweden's relatively higher BHAR than the other countries was due to its greater involvement in New Economy IPOs, with 37% of the Swedish IPOs active within a New Economy industry. As stated above this paper found New Economy companies had a positive effect on BHAR, alongside the finding that 39% of Swedish IPOs were active within a New Economy industry. In accordance with Schusters study, when looking at the specific variable. The results should entail a greater performance of Swedish IPOs relative to Denmark and Norway with 35% and 21% New Economy IPOs respectively. Alongside this Finland should deliver a higher abnormal return in the long run than Sweden, however as displayed above, this is not the case. The authors attribute this to the large number of variables impacting performance of IPOs in general. It is probable that another variable has had a greater negative impact on the long run performance on IPOs on the Finnish market than positive impact from the New Economy companies. Furthermore the much lower explanatory power when dropping the country variable is an interesting finding as can be seen by the lower adjusted R squared. The authors decided not to regress BHAR purely on New/Old Economy due to the potential negative effect it would have on the validity of the OLS regression. Due to this, the authors cannot draw any direct inferences regarding New/Old Economies specific explanatory power, given that other variables are represented in the alternate regression as well, however a comparison can be made. A comparison yields that whilst New/Old Economy has a significant impact, it is only able to explain a small amount in the total variation of BHAR with the alternate regression generating a adjusted R squared of This in comparison to the country variable, which seems to explain a much higher variation of the total BHAR with the regression generating an adjusted R squared of when including the country variable. As the study found statistical significance, it is of interest to consider if the results yield any economic significance. As described in the results the coefficient implies a 32.2% higher expected BHAR over a 3- year period if the company is active within a New Economy industry. In Appendix 2.3 we can see the standard error of the coefficient to be 0.118, ie. The result can expect to fluctuate up or down by 11.8%. Comparing this relative to the coefficient we see that the results will vary between +20.4% and +44%. This can be considered economically significant as the results are always expected to be highly positive. As an example, an investor considering investing in Nordic IPOs, could expect a higher BHAR if he focuses on New Economy IPOs given the results of this study. Given that statistical significance was found when the country variable was dropped. This means that the variable and economically significant results will only be of interest if the country variable is excluded. As an example, the results displayed above will only be of interest to an investor if he has decided to not look at countries when investing in IPOs on the 39
40 Nordic market. It is first then it will be of interest for him to look at the New/Old economy variable. 5.6 Number of Issues Ritter (1991) showed that the number of issues had a significant impact on the abnormal return relative the benchmark. Later, Ritter (1998) named this Windows of Opportunity hypothesis. Number of Issues was also found to have a significant impact on the long run performance of IPOs in the study conducted by Loughran et al. (1994). The results of this paper are congruent with the Windows of Opportunity hypothesis as we find the variable to be significant for the whole Nordic region. As seen in Appendix 2.1, for every additional IPO listed during a specific year on the Nordic market, the overall BHAR of all other IPOs on the market will be lowered by 0.6% over a 3-year period. As discussed in Ritter (1991) the impact Number of Issues has on the long run performance of IPOs is in part attributable to the optimism of investors during high volume years. Given this, the results found in this study for the variable Number of Issues, can also have been impacted by the Divergence of Opinion hypothesis (Ritter, 1998). Stating that as time passes and more information reaches the market the divergence of opinion between optimistic and pessimistic investors minimizes, leading to the price dropping as the over optimistic investors revise their opinion. Given more optimistic investors, which is the case during period with a higher number of new issues (Ritter, 1991) this effect should be greater. This shows how good economic times with a high number of issuances have an impact on investors and companies causing long run underperformance. Whilst the Divergence of Opinion can be said to be impact to the hypothesis tested here, namely the Windows of Opportunity Hypothesis. No inference regarding the Divergence of Opinions direct impact can be drawn. Once again this is due to the Hypotheses not being tested directly. The analysis will therefore not touch on the hypotheses any further, and it will instead be lifted in 6.1 Concluding Discussion as mentioned above. As can be seen in table presented in Number of Issues, the number of issues varies a lot between years in the Nordic region. One could potentially argue that a high issuance of IPOs in one Nordic country historically would affect the return in its own country in a higher grade than in the other Nordic countries. However, looking at the countries one by one could mean a potential wrongful result; since a high number of IPOs in for example Sweden would impact the performance in the other Nordic countries. The reason behind this is that the Nordic countries in many other perspectives can be considered one region with its free trade, free movement, very similar culture, and closely related laws. The authors therefore conclude that investor optimism and high growth opportunities, which are described as the drivers behind the Number of Issues variable in Ritter (1991), in one country will affect the whole region. Looking at the listings on each country alone would therefore lead to wrongful results and hence also wrongful conclusions, which strengthens the authors choice of looking at the number of issues for the region in total when explaining the abnormal return. Given that statistical significance was found, it is of importance to consider if economic significance can be found as well. Appendix 2.1 shows a coefficient of 0.006, with a standard error of This implies that when an additional IPO occurs on the Nordic market, Companies listed during that same year are expected to deliver a between 0.4% and 0.8% lower BHAR over a 3 year period. Whilst the impact can be lower than one might expect 40
41 purely by looking at the coefficient, the overall impact is always expected to be negative meaning the authors can conclude economic significance can be found. Given the percentages listed above are attributable to merely one IPO, the small variance between 0.4% to 0.8% can increase greatly if many listing occur on the Nordic market during a specific year. From an investor perspective 100 listings during a year would mean the expected BHAR could differ between 40% and 80% lower over a 3-year period. 6. Conclusion In this chapter the authors will summarize the results of the study. Alongside this conclusions will be drawn from the findings of the research. Potential weaknesses will be lifted and lastly suggestions for further research will be made. How do IPOs in the Nordic region perform in the long run relative to comparable benchmarks? Are there differences in long run performance between IPOs in the different Nordic countries? The authors of this study can after calculating BHAR over a 3-year period, starting at the end of day value on the day of listing, with significance say that the Nordic region can on average be said to have a negative BHAR. Which answers the initial part of the first research question. Looking at the second part of the question, it can be concluded that differences between the Nordic countries exists. Companies listed in Sweden, Denmark and Finland have a tendency to deliver a higher BHAR over a 3 year period than those listed in Norway, by 109.2%, 52.8% and 32.8% respective, which leads in to the second research question. Are the chosen variables able to explain the over or underperformance of IPOs on the Nordic market? Countries: To test how the countries affect the BHAR, a country dummy was used. Through the statistical tests and regression run, it was found that the country variables had a significant impact on BHAR. Thus strengthening the answer to the second question. However, no significant differences were found in the case of Denmark relative to Finland and vice versa. From the results the authors can conclude that the country variable can explain long run over or underperformance of IPOs on the Nordic market. Number of Issues: The authors wanted to examine if the number of issues could explain the long run performance of IPOs on the Nordic market. This is especially interesting since Ritter (1991) and Loughran et al. (1994) received different results despite defining the variable the same way. The authors fund two-star significance in that a greater number of issues in the Nordic region will decrease the long run performance of all issues listed during the same year by 0.6% over a 3-year period per extra company listed. Hence, the authors conclude that the Number of Issues variable is significant for the long run performance. New/Old Economy: When running a regression for all the variables the New/Old-Economy did not show any significance, but when dropping the country variable, the variable showed a clear significance through New Economy IPOs outperforming the Old Economy IPOs. This can be explained through the country variable containing part of the explanatory power of the New/Old economy variable. The authors concluded that the results are in line with Schuster (2003) earlier findings, which states that countries with a large amount of New Economy IPOs will outperform those with less. 41
42 Size: The authors hoped to find significance for the size variable by including more information in the variable in comparison to Schuster (2003) whom was not able to find significance for size when looking at it as a dummy variable. Given that no significance was found the authors can conclude size defined as market value does not have an impact on the long run performance of IPOs on the Nordic Market. 6.1 Concluding Discussion The authors find it interesting that Sweden displayed a positive BHAR of 8%. Schuster (2003) argues that the reason for Loughran et al. (1994) receiving a positive abnormal return in Sweden, compared to the country benchmark, was due to taxation policies. However, an argument for favorable taxation policies in the case of Sweden can not be made within this paper, since the taxation policies within the Nordic region are all almost identical, these are amongst the highest capital gains and personal income taxations in the world. As displayed in the results section above the authors instead attribute part of Sweden's positive performance to having a high concentration of IPOs within New Economy industries. With this being said the explanatory power of the New Economy variable is low. At the same time the explanatory power of the country variable is relatively high, meaning there are a multitude of variables incorporated in the country variable that are able to explain long run IPO performance. The authors therefore believe it would be interesting for further research to look at country specific variables affecting long run performance, in order to in greater detail determine the reasons for the significantly higher average BHAR found within Sweden. An example would be looking at disposable income within the country. On the other side of the abnormal return spectre, the bad performance of Norwegian IPOs could be due to many factors, however the authors once again believe that macro factors are the key driver here. Ritter (1991) concluded that the underperformance of IPOs within Oil & Gas found in his study, were attributable to low oil prices during the period of time he studied. As stated in the result section above Norway has the highest exposure to the Oil & Gas industry out of all the Nordic countries, with 27.7% of the sample IPOs from Norway being active within the industry. Denmark had the second biggest concentration of IPOs within the Oil & Gas industry with merely 2.2% of their total sample active within the industry. When looking at the price levels of oil for the time period studied, the authors find it increased heavily leading up to the financial crisis in Thereafter oil prices drastically dropped, which was followed by a price increase leading up to another significant drop in Given the high volatility of Oil prices during the time period, the authors believe it is possible that IPOs on the Norwegian market are affected negatively by the volatility of oil prices to a greater extent than the Norwegian market index. Which in turn would lead to a negative BHAR. The authors believe this would be an interesting topic for further studies. In regards to looking at industry exposure within the countries and the effect macro factors may have on them. The same logic can be applied on Denmark and Finland, where Denmark is heavily exposed to Financials meaning that macro factors such as interest will be of significance. In Finland there was the biggest amount of IPOs within Industrials meaning that Finland are exposed to fluctuation in raw material prices. Looking at this study s adjusted R-square as well as previous studies, the reader may question whether the result is enough. The fact that it is common within the area of IPOs to have a low 42
43 adjusted R-square (despite the use of multiple variables) is an indicator that many variables influence the outcome of a newly listed companies long run performance. Whilst the most robust variables found in previous studies ie. Number of Issues, which was a key takeaway from the study by Ritter (1991) and New/Old Economy, the main takeaway from the study by Schuster (2003), were found to have significance. The fact remains that their explanatory power was quite low, as can be seen in the regression excluding the country variable generating an adjusted R squared of Given this it was interesting for the authors to find one variable with a such high explanatory power relative to the other variables namely the country variable. Whilst one in part would expect the country variable to have a higher significance given the many factors it potentially encompasses, the results are also indicative of the performance of IPOs on the Nordic Market being highly driven by the country variable. Therefore BHAR can be said to be very country specific and dependent. Alongside this the authors believe the performance of IPOs are highly dependent on a multitude of behavioral and psychological factors that can be hard to quantify. With this being said the authors hope the increased research on behavioral economics will produce variables that reliably can be used to quantify the effects of human behavior on the stock market. One of the three main hypotheses regarding the causes of long run underperformance, widely accepted within the study of IPOs have been tested directly in this study. The Impresario Hypothesis, which is an indicator for underpricing, is not tested since this paper chooses to neglect looking at first day performance. Moreover, to test this with certainty, a combination of quantitive and qualitive research would be preferred. This could be tested through conducting interviews with representatives of Investment Banks and combining these results with the percentual first day returns for the sample of IPOs. However even in doing so it is far from certain the representatives would be fully truthful. Since if the hypothesis holds and Investment Bankers really do underprice for this specific reason, admitting to creating artificial demand would lead to less public trust. With the public knowing a high demand during the time of listing could be purely artificial they would be less willing to invest, and Investment Bankers would in turn not be able to generate an artificial excess demand to the same extent going forward. However, if the hypothesis could be tested it would be of interest to see if the underpricing of investment banks vary dependent on which country or industry the company is being listed in. It is possible that part of the New Economy companies overperformance is attributable to less underpricing from Investment Banks when listing companies active within the New Economy industries. The industries included in New Economy all have a high degree of innovation within them, generating new ideas and products to a greater extent than other industries. Given this Investment Bankers have less of an ability to benchmark to previous listings. Which means a lower degree of superior knowledge relative to the representatives from the firms being listed. If this holds, they would have less of an ability to underprice the initial offering to the same extent. This would in turn lead to lower excess demand and less of an upswing in price, resulting in a lower long run underperformance. In regards to country it is possible that the significantly lower BHAR in Norway in part is due to the Norwegian Investment Banks underpricing the newly listed companies to a much greater extent. In regards to the Divergence of Opinion Hypothesis it is possible that this in part explains the differences in BHAR between countries and industries. In regards to countries it is possible that the number of optimistic investors is greater in Norway, whereas investors in Sweden are 43
44 less optimistic, leading to a lower divergence of opinion initially and in turn a better long run performance since the gap between optimistic and pessimistic investors is lower to begin with. In regards to industries, it is possible that investors in companies active within New Economy Industries are more like-minded in regards to how optimistic they are over the broad spectrum leading to better long run performance. However, given that the New Economy industries (Tech, Telecom, Healthcare and Media) are known for being quite volatile with many overreactions due to investor optimism, this may not be the case. The Divergence of Opinion Hypothesis could given this instead have a negative impact on the long run performance of these industries, meaning other factors must have a greater positive impact in order to for New Economy companies to on average generate higher returns than Old Economy companies. 6.2 Potential weaknesses A potential weakness with the study and for studies on IPOs overall is the low adjusted R- square received. While previous studies also had low R-squared, a low R-squared means that only a small part of the abnormal return can be explained through the chosen independent variables. The authors have considered this as a potential problem, but conclude that within the area of IPOs abnormal returns is a complex area that depends on a high number of factors, which are highly dependent on investor s behavior, something that is hard to quantify. Therefore the authors consider the R-squared received as adequate. Another potential weakness can be the lack of previous research included. The authors have focused on the most highly cited, peer reviewed and relevant studies regarding IPOs in relation to the purpose of this study. Given that the subject of IPOs is a widely studied area, it would be very time inefficient to try and incorporate them all into this paper, it is also the authors belief that a more highly condensed paper that lifts only relevant and trustworthy sources is to be preferred. Based on this the authors consider the amount of previous research included in the paper to be sufficient. 6.3 Further research The authors of this study would like to see a deeper analysis of the long run performance of IPOs on the Nordic market, through the inclusion of more explanatory variables. A few examples of explanatory variables that the authors believe to be interesting and highly relevant are: 1. Does Female/Male-ratio within the board of directors have an affect on the long run performance of IPOs? Given it is broadly discussed topic both in the academic and political world. 2. Do the management's incentive scheme have an affect on the long run performance of IPOs? How does the degree of stocks or options owned by management affect abnormal return of an IPO, and can any significance be derived from this? 3. Can country specific variables such as disposable income contribute to explaining the significantly higher BHAR found in Sweden relative to the other Nordic countries? 4. Could macro factor such as the oil price affect the Norwegian IPOs to a greater extent than the benchmark in Norway's largest industry leading to a lower BHAR? 44
45 5. Can behavioral variables be incorporated into the study of IPO performance to increase the overall adjusted R squared generally found within the field? 6. Do different banks within the Nordic region underprice IPOs to different extents, and does this have an affect on the long-run performance of those the same IPOs? This with basis in The Impresario Hypothesis first introduced by Ritter (1998). 7. Does the effect of the Divergence of Opinion vary across industries and countries? Are there for example some industries which investors are more optimistic when investing within, leading to a greater long run underperformance? 45
46 6. Bibliography Avanza (2017) Handel utlandet. ( ) Barber, B. & Lyon, J. (1997). Detecting Long-run Abnormal Stock Returns: The Empirical Power and Specification of Test Statistics. Journal of Financial Economics, vol. 43, ss Berk, J., & DeMarzo, P. (2017). Corporate Finance. 4th edition. Boston: Pearson Educated Limited. Brav, A., Geczy, C. & Gompers, P. (2000). Is the abnormal return following equity issuances anomalous, Journal of Financial Economics, vol. 56(2000), ss Datastream. Thomson Reuters. ( ) Degiro (2017). Feeschedule [PDF]. ( ) Dunbar, C. (2000) Factors Affecting Investment Banks Initial Public Offering Market Share, Journal of Financial Economics 55(1) ss FTSE Russell (2017). Industry Classification Benchmark (ICB). ( ) Gujarati, D. N. & Porter, D. C. (2010). Essentials of Econometrics. 4th edition. New York McGraw-Hill Jakobsen, J. & Sørensen, O. (2001). Decomposing and Testing Long-term Returns: an Application on Danish IPOs. European Financial Management, vol. 7(3), ss Loughran, T., Ritter, J.R. & Rydqvist, K. (1994). Initial Public Offerings: International Insights, Pacific-Basin Finance Journal, vol. 2(2-3), ss Updated May 21, Loughran, T. (1993) NYSE vs. NASDAQ returns: Market microstructure or the poor performance of Initial Public Offerings?, Journal of Financial Economics 33, ss Loughran, T. & Ritter, J. (1995). The New Issues Puzzle, Journal Of Finance, vol. 50(1), ss NASDAQ (2011). Market Cap Segment Review at Nasdaq Nordic Exchanges. 19/ ( ) NASDAQ (2017) European market Regulations - Nasdaq. ( ) NASDAQ (2018) Listings ( ) Oslo Bors (2017) The difference between Oslo Bors and Oslo Axess 46
47 shares/oslo-boers-and-oslo-axess/the-difference-between-oslo-boers-and-oslo-axessn ( ) Mario, L. (1990) "The Winner's Curse Problem, Interest Costs and the Underpricing of Initial Public Offerings," Economic Journal, Royal Economic Society, vol. 100(399), ss 76-89, March. Ritter, J. (1991). The Long-Run Performance of Initial Public Offerings. Journal of Finance, vol. 46(1), ss Ritter, J. (1998). Initial Public Offerings. Contemporary Finance Digest, vol. 2(1), ss Schuster, J. (2003). IPOs: Insights from Seven European Countries. London School of Economics. 47
48 7. Appendices Appendix 1 - BHAR & Size Boxplot and Jarque-Bera of BHAR before adjustments for outliers Jarque-Bera of BHAR after adjustments for outliers 48
49 1.3 - Size before adjusting for outliers Size after adjusting for outliers 49


50 1.5 - Logarithmized size after adjusting for outliers Appendix 2 - Regressions New / Old Economy 50

51 2.2 - New / Old Economy - Country variable excluded Appendix 3 - White test 51
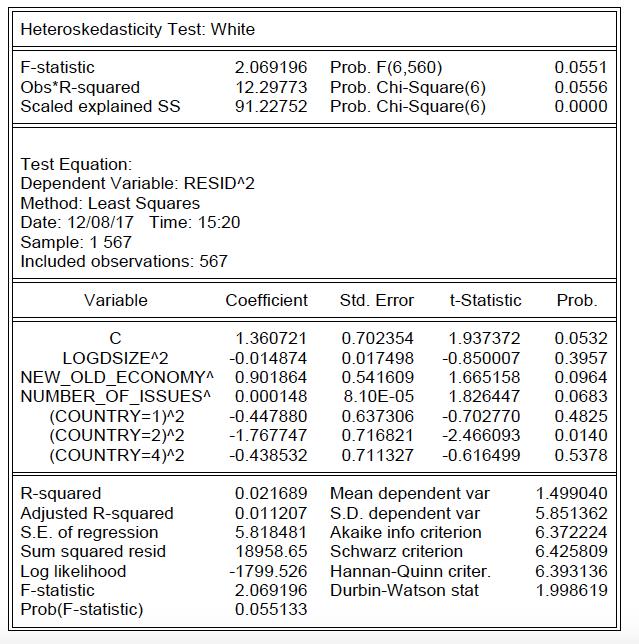
52 52

53 Appendix 4 - Ramsey s Reset Appendix 5 - Multicollinearity 5 - New / Old 53

54 54
MERGERS AND ACQUISITIONS: THE ROLE OF GENDER IN EUROPE AND THE UNITED KINGDOM
 ) MERGERS AND ACQUISITIONS: THE ROLE OF GENDER IN EUROPE AND THE UNITED KINGDOM Ersin Güner 559370 Master Finance Supervisor: dr. P.C. (Peter) de Goeij December 2013 Abstract Evidence from the US shows
How Good Are Analysts at Handling Crisis? - A Study of Analyst Recommendations on the Nordic Stock Exchanges during the Great Recession
 Stockholm School of Economics Department of Finance Bachelor s Thesis Spring 2014 How Good Are Analysts at Handling Crisis? - A Study of Analyst Recommendations on the Nordic Stock Exchanges during the
Corporate Governance, IPO (Initial Public Offering) Long Term Return in Malaysia
 Long Term Return in Malaysia") 2012 International Conference on Economics, Business and Marketing Management IPEDR vol.29 (2012) (2012) IACSIT Press, Singapore Corporate Governance, IPO (Initial Public Offering) Long Term Return in
2012 International Conference on Economics, Business and Marketing Management IPEDR vol.29 (2012) (2012) IACSIT Press, Singapore Corporate Governance, IPO (Initial Public Offering) Long Term Return in
Long-Run IPO Performance for Family Firms
 Long-Run IPO Performance for Family Firms A study on the Swedish market by Linus Olsson Marcus Östman May 2015 Master s Programme in Corporate and Financial Management Supervisor: Naciye Sekerci Abstract
Performance of Initial Public Offerings in Public and Private Owned Firms of Pakistan. Henna and Attiya Yasmin Javid
 Performance of Initial Public Offerings in Public and Private Owned Firms of Pakistan Henna and Attiya Yasmin Javid Introduction When any private company first time sells his stock to general public is
Initial Public Offerings
 NORGES HANDELSHØYSKOLE Bergen, Spring 2012 Initial Public Offerings An empirical study of how the IPOs on Oslo Stock Exchange are priced relative to the indicative price range Birgitte Heskestad Ellingsen
Return Behavior of Initial Public Offerings and Market Efficiency
 Spring 2007 Return Behavior of Initial Public Offerings and Market Efficiency Authors: Supervisor: Fernando Belden Saro Mohammad Tayseer Chenine Hossein Asgharian Abstract This paper is an event study
Short Selling and the Subsequent Performance of Initial Public Offerings
 Short Selling and the Subsequent Performance of Initial Public Offerings Biljana Seistrajkova 1 Swiss Finance Institute and Università della Svizzera Italiana August 2017 Abstract This paper examines short
Degustando La Bombonera de ADRs (Tasting the ADR chocolate box)
") Department of Business Administration FEKH89 Corporate Finance, Degree Project Undergraduate Level Autumn term 2017 Degustando La Bombonera de ADRs (Tasting the ADR chocolate box) A study on the determinants
Department of Business Administration FEKH89 Corporate Finance, Degree Project Undergraduate Level Autumn term 2017 Degustando La Bombonera de ADRs (Tasting the ADR chocolate box) A study on the determinants
MUTUAL FUND PERFORMANCE ANALYSIS PRE AND POST FINANCIAL CRISIS OF 2008
 MUTUAL FUND PERFORMANCE ANALYSIS PRE AND POST FINANCIAL CRISIS OF 2008 by Asadov, Elvin Bachelor of Science in International Economics, Management and Finance, 2015 and Dinger, Tim Bachelor of Business
Comparison in Measuring Effectiveness of Momentum and Contrarian Trading Strategy in Indonesian Stock Exchange
 Comparison in Measuring Effectiveness of Momentum and Contrarian Trading Strategy in Indonesian Stock Exchange Rizky Luxianto* This paper wants to explore the effectiveness of momentum or contrarian strategy
Private Equity and IPO Performance. A Case Study of the US Energy & Consumer Sectors
 Private Equity and IPO Performance A Case Study of the US Energy & Consumer Sectors Jamie Kerester and Josh Kim Economics 190 Professor Smith April 30, 2017 2 1 Introduction An initial public offering
The Effect of Cross-Border Acquisitions on Shareholders Wealth in the Nordic Market
 Stockholm School of Economics Department of Finance Thesis in Finance Fall 2012 The Effect of Cross-Border Acquisitions on Shareholders Wealth in the Nordic Market Abstract: This study examines the short-term
Lund University School of Economics and Management. Master s thesis June 2008
 Lund University School of Economics and Management Master s thesis June 2008 THE UNDERPRICING AND LONG RUN PERFORMANCE OF INITIAL PUBLIC OFFERINGS - Evidence from Turkey Kivilcim Eraydin* ABSTRACT This
Privatization versus Private Sector Initial Public Offerings in Poland*
 1 Privatization versus Private Sector Initial Public Offerings in Poland* Wolfgang Aussenegg Vienna University of Technology, Austria This article compares the characteristics and the price behavior of
How Markets React to Different Types of Mergers
 How Markets React to Different Types of Mergers By Pranit Chowhan Bachelor of Business Administration, University of Mumbai, 2014 And Vishal Bane Bachelor of Commerce, University of Mumbai, 2006 PROJECT
Elisabetta Basilico and Tommi Johnsen. Disentangling the Accruals Mispricing in Europe: Is It an Industry Effect? Working Paper n.
 Elisabetta Basilico and Tommi Johnsen Disentangling the Accruals Mispricing in Europe: Is It an Industry Effect? Working Paper n. 5/2014 April 2014 ISSN: 2239-2734 This Working Paper is published under
GRA Master Thesis. BI Norwegian Business School - campus Oslo
 BI Norwegian Business School - campus Oslo GRA 19502 Master Thesis Component of continuous assessment: Forprosjekt, Thesis MSc Preliminary thesis report Counts 20% of total grade Preliminary Thesis Report
FE670 Algorithmic Trading Strategies. Stevens Institute of Technology
 FE670 Algorithmic Trading Strategies Lecture 4. Cross-Sectional Models and Trading Strategies Steve Yang Stevens Institute of Technology 09/26/2013 Outline 1 Cross-Sectional Methods for Evaluation of Factor
Most public firms tend to finance their projects first with retained earnings, then with debt, and only finally with equity (as a last resort)
") LECTURE 1: RAISING CAPITAL- EQUITY 1. FINANCING POLICY Sources of funds: 1. Internal funds i.e. Retained earnings, cash 2. External funds Debt i.e. Borrowing Equity i.e. Issuing new shares Hybrids Pecking
LECTURE 1: RAISING CAPITAL- EQUITY 1. FINANCING POLICY Sources of funds: 1. Internal funds i.e. Retained earnings, cash 2. External funds Debt i.e. Borrowing Equity i.e. Issuing new shares Hybrids Pecking
Initial Public Offering. Corporate Equity Financing Decisions. Venture Capital. Topics Venture Capital IPO
 Initial Public Offering Topics Venture Capital IPO Corporate Equity Financing Decisions Venture Capital Initial Public Offering Seasoned Offering Venture Capital Venture capital is money provided by professionals
UNDERPRICING IN COLD AND HOT ISSUE MARKETS:
 UNDERPRICING IN COLD AND HOT ISSUE MARKETS: Testing the Changing Risk Composition Hypothesis on the Swedish IPO Market DAVID JOHANSSON & DAVID ÖSTERMAN JUNE 8, 2017 BACHELOR OF SCIENCE IN FINANCIAL ECONOMICS
EXPECTED AND ACTUAL PROCEEDS FROM SHARE ISSUE ON THE WARSAW STOCK EXCHANGE
 EXPECTED AND ACTUAL PROCEEDS FROM SHARE ISSUE ON THE WARSAW STOCK EXCHANGE Anna Wawryszuk-Misztal Maria Curie Skłodowska University, Poland anna.w-misztal@wp.pl Abstract: The paper aims to assess the impact
Advanced Corporate Finance. 8. Raising Equity Capital
 Advanced Corporate Finance 8. Raising Equity Capital Objectives of the session 1. Explain the mechanism related to Equity Financing 2. Understand how IPOs and SEOs work 3. See the stylized facts related
Winner s Curse in Initial Public Offering Subscriptions with Investors Withdrawal Options
 Asia-Pacific Journal of Financial Studies (2010) 39, 3 27 doi:10.1111/j.2041-6156.2009.00001.x Winner s Curse in Initial Public Offering Subscriptions with Investors Withdrawal Options Dennis K. J. Lin
Grandstanding and Venture Capital Firms in Newly Established IPO Markets
 The Journal of Entrepreneurial Finance Volume 9 Issue 3 Fall 2004 Article 7 December 2004 Grandstanding and Venture Capital Firms in Newly Established IPO Markets Nobuhiko Hibara University of Saskatchewan
Online Appendix Results using Quarterly Earnings and Long-Term Growth Forecasts
 Online Appendix Results using Quarterly Earnings and Long-Term Growth Forecasts We replicate Tables 1-4 of the paper relating quarterly earnings forecasts (QEFs) and long-term growth forecasts (LTGFs)
Potential drivers of insurers equity investments
 Potential drivers of insurers equity investments Petr Jakubik and Eveline Turturescu 67 Abstract As a consequence of the ongoing low-yield environment, insurers are changing their business models and looking
An Empirical Investigation of Short-Run Performance of Ipos in India
 An Empirical Investigation of Short-Run Performance of Ipos in India Himanshu Puri Abstract Initial Public Offering (IPO), is a way for companies to go public and meet its financing needs. IPOs are known
Investor Competence, Information and Investment Activity
 Investor Competence, Information and Investment Activity Anders Karlsson and Lars Nordén 1 Department of Corporate Finance, School of Business, Stockholm University, S-106 91 Stockholm, Sweden Abstract
Initial Public Offerings (IPOs), Lock-ups and Market Efficiency Andreas Spjelkevik Evensen and Øivind Christian Thuen
, Lock-ups and Market Efficiency Andreas Spjelkevik Evensen and Øivind Christian Thuen") Andreas Spjelkevik Evensen Øivind Christian Thuen BI Norwegian Business School Thesis Initial Public Offerings (IPOs), Lock-ups and Market Efficiency Andreas Spjelkevik Evensen and Øivind Christian Thuen
Andreas Spjelkevik Evensen Øivind Christian Thuen BI Norwegian Business School Thesis Initial Public Offerings (IPOs), Lock-ups and Market Efficiency Andreas Spjelkevik Evensen and Øivind Christian Thuen
Stock recommendations in Swedish business magazines
 STOCKHOLM SCHOOL OF ECONOMICS Master Thesis in Finance Spring 2012 Stock recommendations in Swedish business magazines Announcement effect and long-term performance Henrik Rinaldo 1 Abstract From the three
Open Market Repurchase Programs - Evidence from Finland
 International Journal of Economics and Finance; Vol. 9, No. 12; 2017 ISSN 1916-971X E-ISSN 1916-9728 Published by Canadian Center of Science and Education Open Market Repurchase Programs - Evidence from
Does Calendar Time Portfolio Approach Really Lack Power?
 International Journal of Business and Management; Vol. 9, No. 9; 2014 ISSN 1833-3850 E-ISSN 1833-8119 Published by Canadian Center of Science and Education Does Calendar Time Portfolio Approach Really
CESR s Draft Technical Advice on Possible Implementing Measures of the Directive 2004/39/EC on Markets in Financial Instruments
 CESR Secretariat Stockholm, 21 January 2005 11-13, avenue Friedland F-75008 Paris France CESR s Draft Technical Advice on Possible Implementing Measures of the Directive 2004/39/EC on Markets in Financial
IPO Underpricing in Hong Kong GEM
 IPO Underpricing in Hong Kong GEM by Xisheng Wang A research project submitted in partial fulfillment of the requirements for the degree of Master of Finance Saint Mary s University Copyright Xisheng Wang
HEDGE FUND PERFORMANCE IN SWEDEN A Comparative Study Between Swedish and European Hedge Funds
 HEDGE FUND PERFORMANCE IN SWEDEN A Comparative Study Between Swedish and European Hedge Funds Agnes Malmcrona and Julia Pohjanen Supervisor: Naoaki Minamihashi Bachelor Thesis in Finance Department of
IPO s Long-Run Performance: Hot Market vs. Earnings Management
 IPO s Long-Run Performance: Hot Market vs. Earnings Management Tsai-Yin Lin Department of Financial Management National Kaohsiung First University of Science and Technology Jerry Yu * Department of Finance
Internet Appendix for: Does Going Public Affect Innovation?
 Internet Appendix for: Does Going Public Affect Innovation? July 3, 2014 I Variable Definitions Innovation Measures 1. Citations - Number of citations a patent receives in its grant year and the following
The Variability of IPO Initial Returns
 The Variability of IPO Initial Returns Journal of Finance 65 (April 2010) 425-465 Michelle Lowry, Micah Officer, and G. William Schwert Interesting blend of time series and cross sectional modeling issues
LIQUIDITY EXTERNALITIES OF CONVERTIBLE BOND ISSUANCE IN CANADA
 LIQUIDITY EXTERNALITIES OF CONVERTIBLE BOND ISSUANCE IN CANADA by Brandon Lam BBA, Simon Fraser University, 2009 and Ming Xin Li BA, University of Prince Edward Island, 2008 THESIS SUBMITTED IN PARTIAL
Handelsbanken Capital Markets
 www.handelsbanken.com/capitalmarkets Handelsbanken Capital Markets Handelsbanken Capital Markets is a full-service investment bank, and at the same time an integrated part of Handelsbanken. The focus and
CSR disclosures and the volatility of the stock market
 CSR disclosures and the volatility of the stock market A study of the Swedish and Danish stock markets Authors: Supervisor: Marko Ravlic Jonathan Yarnold Catherine Lions Student Umeå School of Business
Mergers & Acquisitions in Banking: The effect of the Economic Business Cycle
 Mergers & Acquisitions in Banking: The effect of the Economic Business Cycle Student name: Lucy Hazen Master student Finance at Tilburg University Administration number: 507779 E-mail address: 1st Supervisor:
SHORT RUN PERFORMANCE OF INITIAL PUBLIC OFFERINGS IN INDIA
 CHAPTER 5 SHORT RUN PERFORMANCE OF INITIAL PUBLIC OFFERINGS IN INDIA It is a pervasive feature of markets, the world over, those investors who subscribed to initial public offerings, on the offer day,
Nasdaq s Equity Index for an Environment of Rising Interest Rates
 Nasdaq s Equity Index for an Environment of Rising Interest Rates Introduction Nearly ten years after the financial crisis, an unprecedented period of ultra-low interest rates appears to be drawing to
Do Pre-IPO Shareholders Determine Underpricing? Evidence from Germany in Different Market Cycles
 Do Pre-IPO Shareholders Determine Underpricing? Evidence from Germany in Different Market Cycles Susanna Holzschneider* 19. December 2008 Abstract This paper analyzes shareholder ownership of IPO firms
Greenwich Global Hedge Fund Index Construction Methodology
 Greenwich Global Hedge Fund Index Construction Methodology The Greenwich Global Hedge Fund Index ( GGHFI or the Index ) is one of the world s longest running and most widely followed benchmarks for hedge
Survey on Round Lots
 Survey on Round Lots 2005-09-12 Table of contents 1 INTRODUCTION... 3 1.1 Feedback and response to this paper... 3 2 Change of the Round Lot Sizes... 5 2.1 Current NOREX Environment... 5 2.2 Lot sizes
Household Balance Sheets and Debt an International Country Study
 47 Household Balance Sheets and Debt an International Country Study Jacob Isaksen, Paul Lassenius Kramp, Louise Funch Sørensen and Søren Vester Sørensen, Economics INTRODUCTION AND SUMMARY What are the
Income smoothing and foreign asset holdings
 J Econ Finan (2010) 34:23 29 DOI 10.1007/s12197-008-9070-2 Income smoothing and foreign asset holdings Faruk Balli Rosmy J. Louis Mohammad Osman Published online: 24 December 2008 Springer Science + Business
The relationship between share repurchase announcement and share price behaviour
 The relationship between share repurchase announcement and share price behaviour Name: P.G.J. van Erp Submission date: 18/12/2014 Supervisor: B. Melenberg Second reader: F. Castiglionesi Master Thesis
European Equity Markets and EMU: Are the differences between countries slowly disappearing? K. Geert Rouwenhorst
 European Equity Markets and EMU: Are the differences between countries slowly disappearing? K. Geert Rouwenhorst Yale School of Management Box 208200 New Haven CT 14620-8200 First Draft, October 1998 This
DOES IPO GRADING POSITIVELY INFLUENCE RETAIL INVESTORS? A QUANTITATIVE STUDY IN INDIAN CAPITAL MARKET
 DOES IPO GRADING POSITIVELY INFLUENCE RETAIL INVESTORS? A QUANTITATIVE STUDY IN INDIAN CAPITAL MARKET Abstract S.Saravanan, Research Scholar, Sathyabama University, Chennai Dr.R.Satish, Associate Professor,
PROSIDING PERKEM IV, JILID 1 (2009) ISSN: X
 ISSN: X") PROSIDING PERKEM IV, JILID 1 (2009) 395-412 ISSN: 2231-962X SIGNIFICANCE OF INVESTOR DEMAND, FIRM SIZE, OFFER TYPE AND OFFER SIZE ON THE INITIAL PREMIUM, FIRST-DAY PRICE SPREAD AND FLIPPING ACTIVITY OF
PROSIDING PERKEM IV, JILID 1 (2009) 395-412 ISSN: 2231-962X SIGNIFICANCE OF INVESTOR DEMAND, FIRM SIZE, OFFER TYPE AND OFFER SIZE ON THE INITIAL PREMIUM, FIRST-DAY PRICE SPREAD AND FLIPPING ACTIVITY OF
The Benefits of Market Timing: Evidence from Mergers and Acquisitions
 The Benefits of Timing: Evidence from Mergers and Acquisitions Evangelos Vagenas-Nanos University of Glasgow, University Avenue, Glasgow, G12 8QQ, UK Email: evangelos.vagenas-nanos@glasgow.ac.uk Abstract
Syndicate Size In Global IPO Underwriting Demissew Diro Ejara, ( University of New Haven
 Syndicate Size In Global IPO Underwriting Demissew Diro Ejara, (E-mail: dejara@newhaven.edu), University of New Haven ABSTRACT This study analyzes factors that determine syndicate size in ADR IPO underwriting.
CARRY TRADE: THE GAINS OF DIVERSIFICATION
 CARRY TRADE: THE GAINS OF DIVERSIFICATION Craig Burnside Duke University Martin Eichenbaum Northwestern University Sergio Rebelo Northwestern University Abstract Market participants routinely take advantage
Assessing integration of EU banking sectors using lending margins
 Theoretical and Applied Economics Volume XXI (2014), No. 8(597), pp. 27-40 Fet al Assessing integration of EU banking sectors using lending margins Radu MUNTEAN Bucharest University of Economic Studies,
Leverage Buyout Activity: A Tale of Developed and Developing Economies ( Preliminary and not to be Quoted). ABSTRACT
. ABSTRACT") Leverage Buyout Activity: A Tale of Developed and Developing Economies ( Preliminary and not to be Quoted). ABSTRACT In this study we explain and compare the returns on Leveraged Buyouts (LBOs) in developed
Leverage Buyout Activity: A Tale of Developed and Developing Economies ( Preliminary and not to be Quoted). ABSTRACT In this study we explain and compare the returns on Leveraged Buyouts (LBOs) in developed
Capital allocation in Indian business groups
 Capital allocation in Indian business groups Remco van der Molen Department of Finance University of Groningen The Netherlands This version: June 2004 Abstract The within-group reallocation of capital
Focused Funds How Do They Perform in Comparison with More Diversified Funds? A Study on Swedish Mutual Funds. Master Thesis NEKN
 Focused Funds How Do They Perform in Comparison with More Diversified Funds? A Study on Swedish Mutual Funds Master Thesis NEKN01 2014-06-03 Supervisor: Birger Nilsson Author: Zakarias Bergstrand Table
Why Are Stock Exchange IPOs So Underpriced and Yet Outperform in The Long Run? A Test of the Signaling Hypothesis
 Why Are Stock Exchange IPOs So Underpriced and Yet Outperform in The Long Run? A Test of the Signaling Hypothesis Abstract: Isaac Otchere Sprott School of Business Carleton University Ottawa, Canada [This
Ownership effects on underpricing of Norwegian SEOs
 Oscar A. B. Merckoll Lasse Hafsten-Mørch BI Norwegian Business School Thesis Ownership effects on underpricing of Norwegian SEOs Date of submission: 02.09.2013 Campus: BI Oslo Supervisor: Siv J. Staubo
Natural Resources 2018: The Resurgence
 Natural Resources 2018: The Resurgence 2017 became a second consecutive year of strong positive returns for the natural resources sector, with the S&P Natural Resources TR Index finishing up +22% (Source:
The Role of Industry Affiliation in the Underpricing of U.S. IPOs
 The Role of Industry Affiliation in the Underpricing of U.S. IPOs Bryan Henrick ABSTRACT: Haverford College Department of Economics Spring 2012 This paper examines the significance of a firm s industry
Vas Ist Das. The Turn of the Year Effect: Is the January Effect Real and Still Present?
 Utah State University DigitalCommons@USU All Graduate Plan B and other Reports Graduate Studies 5-2015 Vas Ist Das. The Turn of the Year Effect: Is the January Effect Real and Still Present? Michael I.
The Case for TD Low Volatility Equities
 The Case for TD Low Volatility Equities By: Jean Masson, Ph.D., Managing Director April 05 Most investors like generating returns but dislike taking risks, which leads to a natural assumption that competition
INTERNATIONAL JOURNAL OF ECONOMICS AND FINANCE STUDIES Vol 3, No 1, 2011 ISSN: (Online)
") The Initial and First Year Returns of Firms Listed on the Damascus Securities Exchange: Some Preliminary Findings. Zeina AL-AHMAD Faculty of Economics, Tishreen University, Lattakia, Syria. Email: zalahmad@scs-net.org
The Initial and First Year Returns of Firms Listed on the Damascus Securities Exchange: Some Preliminary Findings. Zeina AL-AHMAD Faculty of Economics, Tishreen University, Lattakia, Syria. Email: zalahmad@scs-net.org
Comparison of OLS and LAD regression techniques for estimating beta
 Comparison of OLS and LAD regression techniques for estimating beta 26 June 2013 Contents 1. Preparation of this report... 1 2. Executive summary... 2 3. Issue and evaluation approach... 4 4. Data... 6
The Consistency between Analysts Earnings Forecast Errors and Recommendations
 The Consistency between Analysts Earnings Forecast Errors and Recommendations by Lei Wang Applied Economics Bachelor, United International College (2013) and Yao Liu Bachelor of Business Administration,
Initial public offering in ports: The determinants of the long-term aftermarket performance
 Initial public offering in ports: The determinants of the long-term aftermarket performance Author(s): G. Satta, T. Notteboom, F. Parola, L. Persico This paper had been presented at: IAME Conference 2016,
LPT IPO DIVIDEND FORECASTS.
 1 LPT IPO DIVIDEND FORECASTS. William Dimovski School of Accounting, Economics and Finance, Deakin University Correspondence to: Bill Dimovski, School of Accounting, Economics and Finance, Deakin University,
THE PERFORMANCE OF INITIAL PUBLIC OFFERINGS: THE THAI STOCK MARKETS EVIDENCE WISARUT WIKYANONT
 THE PERFORMANCE OF INITIAL PUBLIC OFFERINGS: THE THAI STOCK MARKETS EVIDENCE By WISARUT WIKYANONT An Independent Study Submitted in partial fulfillment of the requirements for the Degree of MASTER OF SCIENCE
IPO Underpricing on Aktietorget & First North - An empirical study on how Guarantors, Management ownership and
 Master Degree Project in Finance IPO Underpricing on Aktietorget & First North - An empirical study on how Guarantors, Management ownership and Management commitments affect underpricing Alexander Erlingsson
PERFORMANCE STUDY 2013
 US EQUITY FUNDS PERFORMANCE STUDY 2013 US EQUITY FUNDS PERFORMANCE STUDY 2013 Introduction This article examines the performance characteristics of over 600 US equity funds during 2013. It is based on
Global Private Equity Barometer
 Global Private Equity Barometer SUMMER 2005 A UNIQUE PERSPECTIVE ON THE ISSUES AND OPPORTUNITIES FACING INVESTORS IN PRIVATE EQUITY WORLDWIDE Coller Capital s Global Private Equity Barometer Coller Capital
NordREG Activities 2008
 NordREG Activities 2008 NordREG Activities 2008 NordREG c/o Norwegian Water Resources and Energy Directorate P.O. Box 5091, Majorstua N-0301 Oslo Norway Telephone: +47 22 95 95 95 Telefax: +47 22 95 90
SHARE PRICE ANALYST WITH PBV, DER, AND EPS AT INITIAL PUBLIC OFFERING
 SHARE PRICE ANALYST WITH PBV, DER, AND EPS AT INITIAL PUBLIC OFFERING Kriswanto Accounting Department, Faculty of Economic and Comunication, Bina Nusantara University Jln. K.H. Syahdan No 9, Palmerah,
WHAT EXPLAINS IPO UNDERPRICING ACROSS COUNTRIES?
 WHAT EXPLAINS IPO UNDERPRICING ACROSS COUNTRIES? The Influence of Country Characteristics on the IPO Underpricing Anomaly Hugo Lai 430142 Supervisor: Dr. Ran Xing Bachelor Thesis Financial Economics Erasmus
SME Access to Finance
 Flash Eurobarometer European Commission SME Access to Finance Executive Summary Fieldwork: September 2005 Publication: October 2005 Flash Eurobarometer 174 - TNS Sofres / EOS Gallup Europe This survey
2018 risk management white paper. Active versus passive management of credits. Dr Thorsten Neumann and Vincent Ehlers
 2018 risk management white paper Active versus passive management of credits Dr Thorsten Neumann and Vincent Ehlers Public debate about active and passive management approaches generally fails to distinguish
Nasdaq Global ex-australia Sector Indexes Methodology
 Nasdaq Global ex-australia Sector Indexes Methodology Index Description Australia Sector Indexes are designed to track the performance of global ex-australian companies that are in the Bank, Healthcare
DIVIDEND POLICY AND THE LIFE CYCLE HYPOTHESIS: EVIDENCE FROM TAIWAN
 The International Journal of Business and Finance Research Volume 5 Number 1 2011 DIVIDEND POLICY AND THE LIFE CYCLE HYPOTHESIS: EVIDENCE FROM TAIWAN Ming-Hui Wang, Taiwan University of Science and Technology
Contrarian Trades and Disposition Effect: Evidence from Online Trade Data. Abstract
 Contrarian Trades and Disposition Effect: Evidence from Online Trade Data Hayato Komai a Ryota Koyano b Daisuke Miyakawa c Abstract Using online stock trading records in Japan for 461 individual investors
NASDAQ HELSINKI LTD RULES OF THE EXCHANGE. 3 Jan Unofficial translation version added
 NASDAQ HELSINKI LTD RULES OF THE EXCHANGE 3 Jan 2018 version 21122017added RULES OF THE EXCHANGE INTRODUCTION According to the Act on Trading in Financial Instruments (1070/2017), the Exchange shall draw
A Comparative Study of Initial Public Offerings in Hong Kong, Singapore and Malaysia
 A Comparative Study of Initial Public Offerings in Hong Kong, Singapore and Malaysia Horace Ho 1 Hong Kong Nang Yan College of Higher Education, Hong Kong Published online: 3 June 2015 Nang Yan Business
Buy-in Procedure and Guideline, version 1.8
 Buy-in Procedure and Guideline, version 1.8 Nasdaq Nordic Member Rules September 12 2016 1(17) Table of contents Introduction... 3 References... 3 Change to the Buy-in Procedure and Guideline... 3 General
Comments from the Norwegian Ministry of Finance to the EU Commission CMU Midterm Review, March Description of the Norwegian capital markets
 Comments from the Norwegian Ministry of Finance to the EU Commission CMU Midterm Review, March 2017 The Norwegian capital markets are well-functioning vehicles for providing capital to small and medium-sized
The Changing Influence of Underwriter Prestige on Initial Public Offerings
 Journal of Finance and Economics Volume 3, Issue 3 (2015), 26-37 ISSN 2291-4951 E-ISSN 2291-496X Published by Science and Education Centre of North America The Changing Influence of Underwriter Prestige
Under pricing in initial public offering
 AMERICAN JOURNAL OF SOCIAL AND MANAGEMENT SCIENCES ISSN Print: 2156-1540, ISSN Online: 2151-1559, doi:10.5251/ajsms.2011.2.3.316.324 2011, ScienceHuβ, http://www.scihub.org/ajsms Under pricing in initial
April The Value Reversion
 April 2016 The Value Reversion In the past two years, value stocks, along with cyclicals and higher-volatility equities, have underperformed broader markets while higher-momentum stocks have outperformed.
Chapter 5: Answers to Concepts in Review
 Chapter 5: Answers to Concepts in Review 1. A portfolio is simply a collection of investment vehicles assembled to meet a common investment goal. An efficient portfolio is a portfolio offering the highest
Investor Behavior and the Timing of Secondary Equity Offerings
 Investor Behavior and the Timing of Secondary Equity Offerings Dalia Marciukaityte College of Administration and Business Louisiana Tech University P.O. Box 10318 Ruston, LA 71272 E-mail: DMarciuk@cab.latech.edu
CHAPTER 5 FINDINGS, CONCLUSION AND RECOMMENDATION
 199 CHAPTER 5 FINDINGS, CONCLUSION AND RECOMMENDATION 5.1 INTRODUCTION This chapter highlights the result derived from data analyses. Findings and conclusion helps to frame out recommendation about the
Restructuring through Spinoffs: The Effect on Shareholder Wealth
 Sverre Eilert-Olsen Restructuring through Spinoffs: The Effect on Shareholder Wealth Date of submission: 01.09.2012 BI Norwegian Business School - Thesis Oslo Examination code and name: GRA 19003 Master
EQUITY RESEARCH AND PORTFOLIO MANAGEMENT
 EQUITY RESEARCH AND PORTFOLIO MANAGEMENT By P K AGARWAL IIFT, NEW DELHI 1 MARKOWITZ APPROACH Requires huge number of estimates to fill the covariance matrix (N(N+3))/2 Eg: For a 2 security case: Require
DO SEASONED EQUITY OFFERINGS REALLY UNDERPERFORM IN THE LONG RUN? EVIDENCE FROM NEW ZEALAND
 DO SEASONED EQUITY OFFERINGS REALLY UNDERPERFORM IN THE LONG RUN? EVIDENCE FROM NEW ZEALAND By Marcus Traill and Ed Vos* University of Waikato Department of Finance Private Bag 3105 Hamilton, New Email:
Journal Of Financial And Strategic Decisions Volume 7 Number 3 Fall 1994 ASYMMETRIC INFORMATION: THE CASE OF BANK LOAN COMMITMENTS
 Journal Of Financial And Strategic Decisions Volume 7 Number 3 Fall 1994 ASYMMETRIC INFORMATION: THE CASE OF BANK LOAN COMMITMENTS James E. McDonald * Abstract This study analyzes common stock return behavior
JACOBS LEVY CONCEPTS FOR PROFITABLE EQUITY INVESTING
 JACOBS LEVY CONCEPTS FOR PROFITABLE EQUITY INVESTING Our investment philosophy is built upon over 30 years of groundbreaking equity research. Many of the concepts derived from that research have now become