Senior Research. Topic: Testing Asset Pricing Models: Evidence from Thailand. Name: Wasitphon Asawakowitkorn ID:
|
|
|
- Lydia Beasley
- 5 years ago
- Views:
Transcription
 The Bachelor of Arts Program in Economics")
1 Senior Research Topic: Testing Asset Pricing Models: Evidence from Thailand Name: Wasitphon Asawakowitkorn ID: Advisor: Assistant Professor Pongsak Luangaram, Ph.D Date: 16 May 2018 Senior Research Submitted in Partial Fulfillment of the Requirements for the Bachelor of Arts degree in Economics (International Program) The Bachelor of Arts Program in Economics Faculty of Economics Chulalongkorn University Academic Year 2017 Approved By: (Assoc.Prof.Sothitorn Mallikamas, Ph.D.) Chairman Date of Aproval
2 Abstract This research investigates the performance of eight asset pricing models in the Stock Exchange of Thailand including Fama-French three-factor model (3FF), 5FF, and Cahart s four-factor model. Two models are formed by replacing relative momentum in Cahart s model with absolute and probabilistic momentum respectively. The other three models are formed by discarding factors from the 5FF model. These models are tested on three sets of 25 portfolios. By comparing average absolute intercepts (A a i ) produced by the multi-variate regression of each model, we find that the model that includes probabilistic momentum factor is the best model to explain the return of Thai stocks. However, after comparing A a i to magnitude and dispersion unexplained by average returns, we find that A a i is larger than unexplained return dispersion. This means that the asset pricing models are inadequate for predicting Thai stocks return. The average returns of 25 portfolios have more predictive accuracy than all models. We find that asset pricing models can indicate risk exposures in various portfolios. Stocks with different characteristics are exposed to different types of risks. Additionally, this study also form two trading strategies inspired by factor construction methods. We found that investing in stocks from small, heavy investing and profitable firms and investing in stocks with strong positive momentum yield exceptionally good and consistent returns. 1
3 Content Abstract... 1 Section 1: Introduction... 4 Section 2: Literature Review ) Capital Asset Pricing Models (CAPM) ) Development of Fama-French Three Factor Model ) Theory ) Empirical Evidence ) Development of Cahart s Four Factor model ) Theory ) Empirical Evidence ) Absolute momentum and Relative momentum ) Probabilistic Momentum ) Development of Fama-French Five Factor Model ) Theory ) Empirical Evidence Section 3: Research Methodology ) Econometric Methods ) Risk Factors ) Market Factor ) Size factor ) Value factor ) Relative Momentum factor ) Absolute Momentum factor
4 3.2.6) Probabilistic Momentum ) Investment factor ) Profitability factor ) Testing portfolio formation Section 4: Results ) Factor Descriptive Statistic ) SMB Factor ) HML Factor ) CMA Factor ) RMW Factor ) WML factor ) AbsMOM factor ) ProbMOM factor ) Factor Summary ) Testing Portfolio statistics ) Model Comparison ) Regression Details and Risk Exposure Analysis Section 5: Discussion ) Trading small, aggressive and robust stocks ) Trading stocks with positive probabilistic and absolute momentum Section 6: Conclusion References
5 Section 1: Introduction Factor asset pricing models have been developed since 1980 s. They are built based on financial theories to determine the prices of stocks in any market. There are several popular asset pricing models such as Capital Asset Pricing Model (Sharpe, 1964 and Linter, 1965) and Fama-French three-factor model (Fama & French, 1992). The objective of this study is to test the ability of asset pricing models to explain Thai stock returns. As the model performances depend on various risk factors, this research also investigates relationships among the risk factors as well as analyzing factors effects on stock returns in different portfolio formations. Studying these models is important for both investors and academia. Investors utilize asset pricing models to manage risks in their portfolio. For example, investors can simply use beta derived from CAPM to help them make investment decisions. As factor asset pricing models become more complicated, they contain more risk factors. The three-factor asset pricing model adds two more risk factors to CAPM, which are size and book to market ratio (Fama & French 1992). Then, investors can use the new model to identify more type of risk exposures other than beta. Another importance of asset pricing models for investors is the interpretation of the model intercepts. Scholars would try to create the lowest intercepts implying the model generates low unexplained returns. However, investors can use model s intercept to evaluate trading strategies. As the model adopt multi-variate regression analysis, factors included in the model can be control variables for their effects on stock prices. This means that the trading portfolios with high model intercept after controlling for risk factors are attractive portfolios. They can generate excess returns after controlling for all types of identified risks. Hence, the development of a diverse asset pricing models helps investors trade safely, systematically and efficiently. This study also discusses the implications and applications of the models to assist investing activities. In section 5, the author discuss how factor trading strategy can be constructed. After that, portfolios are formed according to the strategy and a model is used to indicate risk exposures of trading strategy as well as evaluating the returns. Scholars also use factor asset pricing models to study relationships of factors affecting stock returns. Firstly, the models help researchers further develop asset pricing models per se. They use these models to identify a new factor, which can significantly reduce the amount of unexplained returns. Scholars could try adding various factors into the model and test whether the model accuracy is improved. This would not be possible without a good prior knowledge on pricing factors and existing robust model. Secondly, a robust model can be used to separate and identify structure of stock returns. This helps them develop empirical support for return theories. There are lots of studies indicating that asset pricing models work well in the US. The models could leave little unexplained returns for some portfolio allocations. Furthermore, there are several researches which test asset pricing models in continental level including emerging 4
6 markets and developed markets. However, there have been only few studies done in Thailand, which has one of the oldest stock market in South East Asian region. Therefore, the author investigates the performance of asset pricing models in Thailand as well as studies the relationships of pricing factors. The findings in this study will be compared to the theories and empirical results found in the US. The importance of this research is in its contribution to build an asset pricing model that fits Thai stock market or the Stock Exchange of Thailand. Constructing an effective model in Thailand, which adequately includes significant factors, can help create better theories describing Thai stocks. For Thai investor, this research could help them identify relevant risk factors and form a good trading strategy in Thai stock market. 5
7 2.1) Capital Asset Pricing Models (CAPM) Section 2: Literature Review The Sharpe (1964) Linter (1965) capital asset pricing model (CAPM) is built upon meanvariance portfolio. It postulates a linear trade-off between expected returns and risk measured by beta. The model implies that portfolio risk can be diversified except for systematic risk or the market risk. Investors would ask for higher returns when holding portfolio with high systematic risk. CAPM can be written as follows: R it R Ft = a i + b i (R Mt R Ft ) + e it R it R Ft is an excess return or the portfolio s return minus risk-free rate (R Ft ). a i is the intercept of the equation, which is the return unexplained by the model. When a portfolio is well diversified, a i should be virtually equal to zero according to CAPM (Merton, 1973). b i is known as beta describing a linear relationship between market return and the portfolio s return. R Mt R Ft represents market performance relatively to risk free rate. 2.2) Development of Fama-French Three Factor Model 2.2.1) Theory Fama and French (1992) study risk factors affecting stock and bond returns. They indicated two relevant risk factors besides the market risk. The first risk factor is size of the firm measured by market capitalization. The second factor is value, which is measured by book-to-market ratio. Firms with low BE/ME will have low earnings on asset. To test the influence of risks on returns, they formed 6 portfolios sorted on size and BE/ME ratio. Every June of each year, the stocks are ranked on size. Stocks with market capitalization higher than the median of NYSE would be put in big portfolios. If the size is lower than the median, they will be put in small portfolios. For BE/ME, stocks above 70 percentiles of NYSE would be considered as high BE/ME stocks or growth stocks. Stocks below 30 percentiles of NYSE would be considered as low BE/ME or value stocks. As a result, six portfolios are formed (S/L, S/M, S/H, B/L, B/M, B/H where S is small, B is big, H M L are high, medium and low book-to-market ratio respectively). Their value-weighted returns are calculated monthly. Once portfolios are formed, factors can be constructed. Size factor or SMB (Small Minus Big) are formed by calculating monthly returns of S/L + S/M + S/H - B/L - B/M - B/H. Value factor or HML (High Minus Low) are formed by calculating monthly returns S/H + B/H - S/L - B/L. Fama-French Three factors model can be written as follows: R it R Ft = a i + b i (R Mt R f ) + s i (SMB t ) + h i (HML t ) + e it 6
8 The samples in their study suggest that bigger stocks generally have smaller returns. Additionally, value stocks usually have higher returns than growth stocks. Augmenting CAPM with size and value factor, Fama and French could reduce the model s intercepts. They also found that slopes of market factor become lower and closer to 1. These suggest size and value factor could explain differences in stocks return ) Empirical Evidence In Thai stock exchange, size and value are statistically significant factors to determine returns (Chancharat, Valadkhani, & Harvie, 2007). Slopes of size factor increase for portfolios that contain smaller stocks. This means bigger stocks are less exposed to size risk. Value stocks report small positive HML coefficients while growth stocks have larger HML negative slopes. 2.3) Development of Cahart s Four Factor model 2.3.1) Theory Cahart s (1997) observed mutual funds performance and found a strong persistence in their return. He found that one-year past return is positively correlated to the next year return. To back up his argument, Cahart sorted fund portfolios according to sum of its one-year past return. He formed momentum factor by using equal-weighted returns of stocks in the highest 30 percentile of one-year past return minus with equal-weighted returns of stock in the lowest 30 percentile of one-year past return. He found that momentum factor could explain mutual fund s persistence well. Especially funds on the top and bottom performance decile, effects from momentum are stronger. Cahart reported that buying funds in top momentum decile and selling funds in bottom momentum decile could yield 8% average return. In addition, he found that CAPM fails to explain the mutual fund returns persistence. His sorted momentum portfolios share similar beta. Ultimately, he could explain mutual fund returns using market, size, value and momentum factor. His 4-factor model explains most spreads and patterns in the portfolios. In this study, Cahart s Four-Factor model can be written as follows: R it R Ft = a i + b i (R Mt R f ) + s i (SMB t ) + h i (HML t ) + w i (WML t ) + e it Added to the three-factor model is the WML factor, it is a value-weighted return of winner stocks minus loser stocks. In Cahart s orginal work, WML is referred as PR1YR t ) Empirical Evidence There are several evidences that momentum factor works well in Asian emerging market. Cakici, Fabozzi, and Tan (2013) study effectiveness of Cahart s model in emerging markets across continents. In Asia, they include over 800 stocks from China, India, Indonesia, South 7
9 Korea, Malaysia, Philippines, Taiwan, and Thailand using data from 1990 to They found that momentum factor could explain stock returns in Asia; in addition, they reported that value factor is negatively correlated with momentum factor. In Vietnam, trading stocks with momentum strategy could yield return as high as 6% from (Vo & Truong, 2018). Vo and Truong form 16 portfolios by sorting stocks based on past returns. They found that momentum effect is significant in 10 out of 16 portfolios. However, in Thailand, the momentum effect is reported to be rare (Chancharat, Valadkhani, & Harvie, 2007). As this paper only focuses on the effectiveness of asset pricing models in Thailand, the author will not investigate why momentum factor works in outside Thailand ) Absolute momentum and Relative momentum As momentum factor can poorly predict returns in Thailand, this paper explores alternatives to form momentum factor. Cahart s momentum factor is also known as relative momentum (Kolanovic & Wei, 2015). To classify winners and losers, stocks are relatively compared to each other. In literature on Cahart s four factor model, scholars usually sort stocks by one-year past performance excluding last month. Then, the momentum factor (WML) is the value-weighted return of top 30 percentile minus the return of bottom 30 percentile. By this classification, winner stocks are the ones that relatively outperform others. Absolute momentum is different. Stocks can be indicated as a winner alone by itself. If a stock s one-year past performance is positive, then it is a winner (Antonacci, 2013). By contrast, if its past return is negative, it is a loser. With this method, stocks can be identified as winners or losers without relative comparison to others. Kolanovic and Wei (2015) shows that absolute momentum trading strategy is superior to relative momentum strategy. Long absolute winners and short absolute losers give higher returns and lower volatility. This implies that absolute momentum has stronger relationship with future returns. Ultimately, using absolute momentum to construct momentum factor should reduce four-factor model s intercepts ) Probabilistic Momentum David Varadi (2014) improved absolute momentum by adding a probability element. He formed a trading strategy from the probability of stocks to outperform the market, which is determined by information ratio. Information Ratio = (R p R m ) S p m R p R m is the spread of portfolio s return relative to the market and S p m is the standard deviation of portfolio s return minus market return. The information ratio is then used as t- value to obtain the probability of portfolio to outperform the market from the t-distribution. 8
10 2.4) Development of Fama-French Five Factor Model 2.4.1) Theory Fama-French (2006) discuss dividend evaluation model and suggests profitability and investment could affect expected returns. They used empirical data to test their hypothesis adopting current earning as a simple proxy for profitability and found that firms with high profit generate higher expected rate of return. By contrast, using the valuation theory as the base, they argued that firms with high investment generally have lower expected rate of return. However, Fama and French thought that profitability and investment relationships to stock returns are already captured by the value factor. Novy-Marx (2013) use gross profits instead of current earnings to measure profitability. He argued that gross profit is a better representation of profitability as current earnings might be affected activities unrelated to profit generation. The examples of those activities are R&D investment or interest expenses. He ran 3 factor model cross-sectional regressions on portfolios sorted on size and gross-profitability. The result suggested that profitability once controlled for size, value and market yields excess returns. Unlike Fama and French (2006), Marx proved that profitable firm is not the same as value firm. Furthermore, he argues that value premium in value strategy is not driven by unprofitable stocks because there is a difference of duration in profitability and value strategy. Hence, gross profit can explain other aspects of return. Titman, Wei and Xie (2004) study abnormal returns related to capital investment. He noted that increase in investment could provide both favorable and unfavorable information. Investment could signal good opportunity for growth. On the other hand, it could also imply over investment. He found that firms with higher cash flows and debt ratios experience stronger negative effect from capital investment. Sorting portfolios by abnormal capital investment and running Cahart s four factor model regression, the negative relationship between abnormal investment and returns can be established after controlling for four factors in Cahart s model. This means that investment can explain return anomalies aside from size, value and market. Fama and French (2015) revisited their conclusion on relations of profitability and investment on stock returns from valuation theory. Given more evidences pointed out that value factor is inadequate to capture profitability and investment effect, they constructed two more factors aiming to reduce anomaly in three-factor models. Fama and French reformed their theory and argued that investment and profitability are relevant for forecasting future cash flows. Looking at long-term rate of return, cash flows is a better proxy which captures horizon effects in the term structure of expected returns. Hence, investment and profitability factor could offer explanatory power differently from value factor. Fama-French Five-Factor model can be written as follows: R it R Ft = a i + b i (R Mt R f ) + s i (SMB t ) + h i (HML t ) + r i (RMA t ) + c i (CMA t ) + e it 9
11 where RMA t represents profitability factor calculated by subtracting value-weighted returns of robust profit stocks by the returns of weak profit stocks (robust minus weak). CMA t is investment factor calculated by the value-weighted returns of low investing stock minus high investing stock (conservative minus aggressive). There are many interesting findings in the empirical test of five-factor model in the US. Firstly, the accuracy of the model improved significantly. This applies especially for the firms with strong investment or profitability. In general, the value of intercept is reduced comparatively to three-factor model. HML factor or value factor lost its significance in some portfolios meaning that the added factors can capture all effects of value factor. Secondly, five-factor model has issues in predicting returns of small stocks and stocks in the highest investment quintile. For some small stock portfolios, they have a negative exposure to profitability and investment factor. By sorting Left Hand Side portfolios differently taking in account of both profitability and investment, Fama and French explain that these small firms are likely to invest a lot despite low profitability. As a result, small firms report negative coefficients. For big stocks in highest investment quintile, the model under-estimate the returns for these stocks ) Empirical Evidence In addition to evidence in NYSE in Fama and French s Five-factor asset pricing model paper, they also do international empirical test in the same year, Fama and French formed continental portfolios from four regions which are North America, Europe, Japan and Asia Pacific (AP). Firstly, they found that the profitability factor and investment factor fail to improve the model in Japan. This is because there is a strong value effect, but weak profitability and investment effect. Secondly, in North America, the five-factor model outperforms three-factor model; nevertheless, the model can still be improved further by dropping investment factor. In Europe and Asia Pacific, five-factor model also significantly lower intercepts. Thirdly, when looking at intercept dispersion throughout portfolios; five-factor model fails miserably in AP. The intercepts variation is as high as the variation of AP portfolios return implying that the model cannot accurately predict the returns across various AP portfolios. The author suggests that selected countries in AP including Australia, Hong Kong, New Zealand, and Singapore are disintegrated creating model s poor performance. As Thailand is geographically in Asia-Pacific region and close to Japan, it is possible that the five factor asset pricing model will perform poorly as well. Chancharat, Valadkhani and Harvie (2007) provided evidence that Thai stock market is positively influenced by the Singapore stock market return. However, they cannot find evidence that supports relationship between Australian and Thai stock market. This means that Thailand might be different, and the effectiveness of five-factor model in Thai stock market is still worth exploring. 10
12 Section 3: Research Methodology The data used in this research is drawn from Bloomberg Terminal which contains historical data on total return index, market capitalization, market-to-book ratio, return on equity, capital expenditure, and total asset for listed stocks in the Stock Exchange of Thailand. The author analyzes SET100 stock data from February 2002 December Instead of using the whole stock market data like Fama and French (2015) study, SET100 data could draw similar conclusion and remove liquidity issue which creates noises in returns. Also, stocks in SET100 data tend to have fewer missing data, facilitating analytical process in this research. 3.1) Econometric Methods This study employs test on 8 asset pricing models including Fama-French three-factor asset pricing model, Cahart s four-factor asset pricing model and Fama-French five-factor asset pricing model. Three models are formed by dropping out value, investment, and profitability factor from Five-factor model respectively. The other two are created by replacement of WML with absolute momentum and probabilistic momentum respectively. Every model includes market factor. The comparison of model is done by applying multivariate regression to 75 LHS portfolios. The intercept produced from the regression will be compared. The model that produce lowest average intercepts (A a i ) means that they have the lowest value of unexplained returns. Hence, it would be considered a superior model. In addition, two ratios are also used to compare models. First, average absolute intercept over absolute value of r, which is average value of return on portfolio i minus the average of all portfolio returns (Fama & French, 2015). This can be written as A a i and used to measure ability of model to explain return dispersion. Second, A a i 2 A(r or the average squared intercept over 2 ) average squared r will be used to compare intercepts dispersion with the return dispersion. 3.2) Risk Factors 3.2.1) Market Factor (R Mt R f ) The market factor is the return of market portfolio minus the risk-free rate. The SET Index is used as market portfolio. The return of market portfolio is based on total return index which assumes that dividends and rights offerings are reinvested into the market. For the risk-free rate, F12203M Index data from Bloomberg is used, which contains group of government s 3 month bill ) Size factor (R Mt R f ) Size is constructed by ranking firms on size measured by market capitalization at the end of December in the prior year. Small stocks (S) and big stocks (B) are indicated by the median size A r 11
13 value among SET100 stocks. Size factor (SMB or Small Minus Big) is the subtraction of equalweighted small stocks returns and equal-weigted big stocks retrun. Following approach in Kaewthammachai, et al. (2016), the size factor portfolio is rebalanced at the end of January every year. The lag of stock allocation is for the market to absorb firm s information. Conversely in Fama and French (2015), they rebalanced portfolios later which is in June ) Value factor (HML t ) Similarly, to construct value factor, stocks are sorted according to the reverse of market-tobook ratio obtained from Bloomberg Terminal at the end of December in the prior year. Stocks are classified in three groups: low (L), neutral (N) and high (H) book-to-market ratio by using 30 th and 70 th SET100 value breakpoints respectively. Considering both division in size and value, 6 portfolios are formed and illustrated in diagram as follows. B/M (Book-to-Market Ratio) Size (break by median) S(50) B(50) H (30) SH BH N(40) SN BN L (30) SL BL Value factor (HML or High Minus Low) is the difference in value-weighted return of value stocks (high B/M) and growth stocks(low B/M). The equation can be expressed as follows: HML t = 1 2 (r SH + r BH ) 1 2 (r SL + r BL ) Similarly to size factor, the value factor portfolio is rebalanced at the end of every January ) Relative Momentum factor (WML t ) For relative momentum, stocks are ranked based on their past cumulative one-year return excluding last month. For example, if current period is January year t, stocks are ranked based on sum of January to November returns in year t-1. Stocks are classified into three groups: losers (L), neutral (N) and winner (W) using 30 th and 70 th SET100 breakpoints of past return respectively. Considering both division in size and momentum, 6 portfolios are formed in the similar manner as value factor construction. WML (Relative Momentum) S(50) B(50) W (30) SW BW N(40) SN BN L (30) SL BL Momentum factor (WML or Winner Minus Loser) is the difference in value-weighted return of winner and loser stocks. The equation can be expressed as follows: 12
14 WML t = 1 2 (r SW + r BW ) 1 2 (r SL + r BL ) Following approach in Kaewthammachai, et al. (2016), the relative momentum factor portfolio is rebalanced every month ) Absolute Momentum factor (Abs_MOM t ) For absolute momentum, the mothod used in this study is different from Gary Antonacci s. Stocks are put in winner portfolio when the prediction of return is greater than the current risk free rate. The prediction is done by using simple auto-regressive model. r t = a + b(r t 1 ) + e t r t stands for current period return and r t 1 refers to the past period return. After running timeseries regression on past 12 month return data, the coefficient and intercept value will be produced. To predict the next month return, the current period return can be plugged into the equation at the end of every month. E(r t+1 ) = a + b (r t ) If E(r t ) is greater than current risk-free rate, then it is a winner stock. If E(r t ) < 0, it is considered as loser. Absolute momentum factor (Abs_MOM) is the difference in valueweighted return of winner and loser stocks. The equation can be expressed as follows: Abs_MOM t = 1 2 (r SW + r BW ) 1 2 (r SL + r BL ) The factor portfolio is rebalanced at the end of every month from the updated prediction and new risk-free rate. Monthly value-weighted returns of the portfolio is the Abs_MOM factor ) Probabilistic Momentum (ProbMOM t ) Probabilistic momentum factor is the monthly value-weighted returns of ProbMOM portfolio. Using Varadi (2014) method, each stock s monthly information ratio (IR) is derived. At the end of each month, ProbMOM factor portfolio is adjusted. It adds new stocks with IR more than 0.26, which is the t-value of 10% confidence level that the stocks will outperform the market. For stocks that is already in the portfolio, they will be sold off once the IR falls below This gives at least 10% confidence level that their performances are below the market ) Investment factor (CMA t ) Forming investment factor, stocks are ranked based on abnormal captial investment. Following Titman, Wie and Xie (2004) equation, abnormal investment is calculated as: CI t 1 = CE t 1 (CE t 2 + CE t 3 + CE t 4 )/3 1 13
15 CE t 1 is firm s captial expenditure divided by total asset in year t-1. CI t 1 is the abnormal investment in year t-1. Stocks are then classified into three groups: conservative (C), neutral (N) and aggressive (A) using 30 th and 70 th SET100 breakpoints of abnormal investment respectively. Considering both division in size and investment, 6 portfolios are formed. Investment factor (CMA or Conservative Minus Aggressive) is the difference in value-weighted return of conservative and aggressive stocks. The equation can be expressed as follows: CMA t = 1 2 (r SC + r BC ) 1 2 (r SA + r BA ) Follwing approach in Kaewthammachai, et al. (2016), the investment factor portfolio is rebalanced at yearly at the end of January ) Profitability factor (RMW t ) As discussed in section 2, it is ideal to use gross profit to form profitability factor. However, due to missing data in Bloomberg Terminal, the author decided to substitute gross profit with net profit. In Fama and French (2015), they used operating profit scaled by total equity. In other words, return on total equity ratio (ROE) is used to allocate stocks. Similarly, stocks are classified into three groups: robust (R), neutral (N) and weak (W) using 30 th and 70 th SET100 breakpoints of ROE. Dividing further by size, 6 portfolios are then formed. The profitabilty factor portfolio is rebalanced at the end of January. Profitability factor equation can be expressed as follows: RMW t = 1 2 (r SR + r SR ) 1 2 (r SW + r BW ) 3.3) Testing portfolio formation Following Fama and French (2015), the left hand side portfolio is formed by constructing 25- Size-B/M, 25-Size-OP and 25-Size-Inv portfolios. Adding them up, the models are tested on 75 portfolios. To form each 25 portfolio, the SET100 stocks are ranked by two factors. They are then split by SET100 quintile breakpoints. Consider diagram below: 25-Size-B/M testing portfolios Low High B/M Small SBM11 SBM12 SBM13 SBM14 SBM15 2 SBM21 SBM22 SBM23 SBM24 SBM25 3 SBM31 SBM32 SBM33 SBM34 SBM35 4 SBM41 SBM42 SBM43 SBM44 SBM45 Big SBM51 SBM52 SBM53 SBM54 SBM55 14
16 The diagram above illustrates 25 testing portfolios formed by classifying each stock on size and book-to-market value. They are split by size and B/M quintile. SBM11 stands for Size-B/M portfolio with size in 1 st quintile and B/M in 1 st quintile. SBM 21 stands for Size-B/M portfolio with size in 2 nd quintile and B/M in 1 st quintile. Additionally, SBM12 stands for Size-B/M portfolio 1 st size quintile and 2 nd B/M quintile. Reading vertically, Stocks in SBM11 are ones that have smallest size as well as has lowest bookto-market ratio. Moving down, stocks in SBM21 are ones that are in 2 nd size quintile and 1 st B/M quintile. Portfolio s size increases as the SBM portfolio has higher first digit number. Reading this diagram horizontally, stocks in SBM12 are ones that its size falls in smallest quintile similarly to SBM11; however, these stocks have B/M ratio in 2 nd quintile. The stock B/M ratio increases as the portfolio has higher second digit number. 25-Size-OP and 25-Size-Inv portfolios are constructed and interpreted similarly. 25-Size-OP testing portfolios Weak Robust OP Small SOP11 SOP12 SOP13 SOP14 SOP15 2 SOP21 SOP22 SOP23 SOP24 SOP25 3 SOP31 SOP32 SOP33 SOP34 SOP35 4 SOP41 SOP42 SOP43 SOP44 SOP45 Big SOP51 SOP52 SOP53 SOP54 SOP55 25-Size-Inv testing portfolios Conservative Aggressive Inv Small SInv11 Sinv12 Sinv13 Sinv14 Sinv15 2 Sinv21 Sinv22 Sinv23 Sinv24 Sinv25 3 Sinv31 Sinv32 Sinv33 Sinv34 Sinv35 4 Sinv41 Sinv42 Sinv43 Sinv44 Sinv45 Big Sinv51 Sinv52 Sinv53 Sinv54 Sinv55 15
17 Section 4: Results This section discusses the results obtained from the data and portfolio testing. First, the descriptive statistics as well as the returns behavior in each factor portfolios are shown. Second, the method to form 75 testing portfolios is discussed and the statistics on those portfolios are presented. Third, the author investigates the effectiveness of 8 factor models tested in this study. Lastly, we go into the details of regression coefficients, statistical significance, and effects of different factors on portfolios. 4.1) Factor Descriptive Statistic 4.1.1) SMB Factor The table below shows average monthly excess returns, standard deviation and Sharpe ratio of Small and Big stock portfolio from Small stocks report small investment premiums which support Fama and French (2015) thesis in the US. However, the result contradicts with the existing evidence in Thai stock market. In Kaewthammachai et al. (2016) work, big stock has investment premium over small stocks in SMB ( ) Small Big Average Return 1.59% 1.06% SD 8.12% 6.12% Sharpe As expected, the bigger stocks have lower risk measured by standard deviation. This result is consistent with what is reported in NYSE study as well as Thai stock exchange SMB Portfolio Consider the graph above, which assumes that 100 Baht is invested in SMB strategy on 1 st of February 2002, the portfolio value always exceed 100 Baht later-on. This implies that during , there is always a premium for small and big stocks contradicting with what is found 16
18 before. The author believes that this is caused by missing stocks return data in some months from Bloomberg Terminal ) HML Factor The table below shows average monthly excess return, standard deviation and Sharpe ratio of value factor from Value stocks have higher rate of return than growth stocks (1.51% and 1.17% respectively). The table implies that sorting stocks according to B/M can reduce size premium. The premium here is 0.41% whereas the last section premium is 0.53%. On average, value stocks have lower standard deviation in excess return comparing to growth stocks (7.33% and 7.45%). Looking BN and BL portfolios, the standard deviation is interestingly lower than SN and SL respectively. Comparing to the report by Kaewthammachai, et al. (2016), the returns for growth stock is significantly higher than the statistics below. Monthly excess returns in Kaewthammachai, et al. for SL and BL are greater than 3.3%. As a result, their work found that HML factor grants negative average excess returns as growth stocks perform amazingly well. Here, the HML factor grants positive average excess return of 0.34%. The author hypothesizes that the difference in statistics is caused by missing data or the difference in treatment of the missing data. Returns S B Avg. STD S B Avg. R 1.74% 1.27% 1.51% R 7.55% 7.11% 7.33% N 0.82% 1.02% 0.92% N 8.28% 5.98% 7.13% W 1.65% 0.69% 1.17% W 9.03% 5.87% 7.45% Avg. 1.40% 0.99% Avg. 8.29% 6.32% Sharpe S B Avg. R N W Avg In addition, standard deviations shown above are significantly lower than Kaewthammachai, et al. (2016). Especially for BN and BL portfolios, the standard deviation was no less than 9.51% in Kaewthamachai, et al. study. 17
19 HML Portfolio The graph above shows portfolio performance by using HML strategy assuming initial investment of 100 Baht on 1 st February ) CMA Factor The table below shows average monthly excess return, standard deviation and Sharpe ratio of investment factor portfolios. While this study finds that SMB and HML factors behave similarly to the US factors. This does not apply to CMA factor. Conservative stocks have lower returns than aggressive stocks giving -0.57% monthly average excess return for CMA. Sharpe ratios for small and big stocks are the same as B/M allocation. This means that the change of stock allocation from B/M to investment does not affect the size premium. Returns S B Avg. STD S B Avg. A 2.11% 1.04% 1.57% A 8.83% 6.76% 7.80% N 1.59% 0.99% 1.29% N 8.12% 5.78% 6.95% C 0.93% 1.08% 1.00% C 7.92% 6.07% 6.99% Avg. 1.54% 1.04% Avg. 8.29% 6.20% Sharpe S B Avg. H N L Avg The graph below shows portfolio performance by using CMA strategy assuming initial investment of 100 Baht on 1 st February In this study, the portfolio experience huge drop in value during 2002 to Then, the return remains constant later-on. 18
20 CMA Portfolio ) RMW Factor The table below shows average monthly excess return, standard deviation and Sharpe ratio of profitability factor portfolio from There is evidence of robust profit stocks outperforming weak profit stocks. In addition, weak stocks also have higher risks making their Sharpe ratio far worse than robust stocks. Considering size premium by profitability allocation, the small and big premium rises to 0.64%. The change in size premium caused by different portfolios allocations is also reported in Fama and French (2015). This means trading SMB strategy by profitability allocation creates bigger gains than trading by B/M allocation. However, the standard deviation also increases by 0.2% for small stocks and 0.66% for big stocks from the reallocation. Returns S B Avg. STD S B Avg. R 1.95% 1.13% 1.54% R 8.68% 6.31% 7.50% N 1.27% 1.06% 1.16% N 8.60% 5.40% 7.00% W 1.38% 0.47% 0.92% W 7.93% 8.87% 8.40% Avg. 1.53% 0.89% Avg. 8.40% 6.86% Sharpe S B Avg. R N W Avg
21 RMW Portfolio The graph above shows portfolio performance of RMW strategy assuming initial 100 Baht investment on 1 st February The portfolio value increases consistently over the long run. The performance tails off at the end of 2015 giving reasonable doubt on the persistence of increasing trends in the future ) WML factor The table below shows average monthly excess return, standard deviation and Sharpe ratio of relative momentum factor portfolios from Winner stocks have both higher return and lower risk comparing to loser stocks. This supports Cahart s evidence that there is a persistence in stock returns. Returns S B Avg. STD S B Avg. W 2.40% 0.92% 1.66% W 8.51% 7.19% 7.85% N 0.97% 1.10% 1.04% N 8.19% 6.37% 7.28% L 1.32% 0.48% 0.90% L 10.37% 7.44% 8.91% Avg. 1.56% 0.83% Avg. 9.02% 7.00% Sharpe S B Avg. W N L Avg Comparing the reported statistic to Kaewthamachai, et al. (2016), the returns of both winners and losers are approximately 1% lower than their report in From the graph below, the portfolio grows substantially after February
22 WML Portfolio We can conclude that the data on excess returns shown in the table above is significantly lower. Furthermore, winner stocks in this study also have lower risk than Kaewthamachai, et al evidence. Again, the author believes that this is caused by difference in treatment of missing data or the missing data by itself. 21
23 4.1.6) AbsMOM factor Winners Losers AbsMOM Avg. Return 1.08% 0.79% 0.29% SD 6.37% 6.15% 3.87% Sharpe The table above shows average monthly excess return, standard deviation and Sharpe ratio of absolute momentum factor portfolios from Buying winners with predicted positive return and selling losers with negative predicted returns yields 0.29% gains. However, excess returns and Sharpe ratio of AbsMOM strategy deteriorates greatly comparing to buying winners alone. This happens unexpectedly as loser portfolio generates positive returns. Looking at historical return, there is also a huge drop in return during shown by the graph below AbsMOM Portfolio 4.1.7) ProbMOM factor ProbsMOM Return 1.36% STD 9.37% Sharpe 0.15 The table above shows average monthly excess return, standard deviation and Sharpe ratio of probabilistic momentum factor portfolios from Buying winning stock with past positive return yields positive return in the long run as the graph illustrated below. 22
24 ProbMOM ) Factor Summary Ultimately, factors descriptive statistics can be shown as following: Variable Mean Std. Dev. Min Max RmRf -8.81% 6.81% % 12.62% SMB 0.53% 4.19% % 27.21% HML 0.34% 4.09% % 14.39% WML 0.76% 5.61% % 17.25% RMW 0.62% 4.57% % 22.83% CMA -0.57% 3.85% % 8.10% AbsMOM 0.29% 3.88% % 12.71% ProbMOM 1.06% 6.38% % 22.66% Factors correlation matrix is shown below. Similar to Fama and French (2015), size correlates with market factor as small stocks tends to have higher beta granting higher return. The fact that RMW factor negatively correlates with HML fits with value theory discussed by Fama and French. They argued that firms with high book-to-market value tend to have low profitability. However, the investment factor should also correlate with HML factor as well. Instead, investment negatively correlates with size factor and profitability implying that big firms and profitable firms tend to invest more. Lastly, it is interesting that probabilistic momentum shares positive correlation to size. It is possible that small firms tend to have long period of positive return. 23
25 RmRf SMB HML WML RMW CMA AbsMOM ProbMOM RmRf % SMB 31.19% % HML 9.77% 7.49% % WML -8.16% -3.67% % % RMW 6.94% 8.67% % -0.19% % CMA % % 7.07% -6.67% % % AbsMOM 7.26% 9.42% % 38.71% -4.98% % % ProbMOM 17.67% 25.84% -8.25% 9.95% -8.80% % 28.86% % 4.2) Testing Portfolio statistics Here, there are no clear trends of increasing returns from conservative to aggressive stocks. This matches with the graph shown earlier that CMA factor portfolio value is flat in the long run. In all investment quintiles, there is a trend of decreasing risk as stock size got bigger. The difference in size premiums can only be seen clearly by comparing smallest and biggest. The table below show average monthly returns, standard deviation and Sharpe ratio of each LHS portfolio. On the left panel, it represents 25 Size-B/M portfolios (SBM) while on the right, 25 Size-OP portfolios (SOP) are shown. SBM11 SBM12 SBM13 SBM14 SBM15 SOP11 SOP12 SOP13 SOP14 SOP15 AVERAGE 1.78% 2.21% 1.38% 2.04% 2.09% 2.39% 1.21% 0.90% 3.21% 2.33% STD 13.52% 12.60% 12.00% 11.70% 10.28% 12.52% 10.41% 10.78% 11.32% 11.56% SHARPE SBM21 SBM22 SBM23 SBM24 SBM25 SOP21 SOP22 SOP23 SOP24 SOP25 AVERAGE 1.85% 0.97% 0.70% 2.21% 1.03% 0.44% 1.22% 0.76% 1.85% 1.63% STD 8.75% 10.05% 9.84% 11.71% 9.62% 11.78% 9.23% 9.07% 11.29% 10.31% SHARPE SBM31 SBM32 SBM33 SBM34 SBM35 SOP31 SOP32 SOP33 SOP34 SOP35 AVERAGE 1.06% 0.49% 1.49% 1.74% 1.96% 1.36% 1.25% 0.87% 1.37% 1.66% STD 11.07% 7.60% 8.84% 9.24% 9.49% 10.81% 8.10% 8.80% 8.17% 11.21% SHARPE SBM41 SBM42 SBM43 SBM44 SBM45 SOP41 SOP42 SOP43 SOP44 SOP45 AVERAGE 0.29% 0.37% 1.03% 1.36% 0.91% 0.55% 0.88% 0.99% 0.71% 0.68% STD 7.88% 8.04% 7.26% 7.24% 9.18% 12.08% 8.90% 8.32% 6.84% 8.53% SHARPE SBM51 SBM52 SBM53 SBM54 SBM55 SOP51 SOP52 SOP53 SOP54 SOP55 AVERAGE 0.57% 1.61% 0.71% 1.75% 0.71% 0.19% 1.10% 1.23% 1.21% 1.37% STD 6.10% 7.30% 6.88% 8.15% 6.17% 10.49% 8.10% 6.30% 5.78% 7.86% SHARPE
26 There is a trend of increasing returns as stock has higher book-to-market. This can be seen clearly when reading average return horizontally in the first, third and fourth size quintile. Fama and French (2015) refer this as value effect. In Size-OP portfolios, the trend of increasing return following profitability quintile is only clear in second and fifth size quintile. Nevertheless, except for the fourth quintile, returns of stocks in fourth and fifth profitability quintiles are always higher than returns of stocks in the second and first profitability quintile. The table below show average monthly returns, standard deviation and Sharpe ratio of each LHS portfolio in 25 Size-Investment allocations. Again, the two-digit numbers after portfolio name represent size quintile and investment quintile respectively. SInv11 SInv12 SInv13 SInv14 SInv15 AVERAGE 2.28% 2.04% 3.40% 1.17% 1.96% STD 13.82% 11.05% 12.63% 11.21% 12.83% SHARPE SInv21 SInv22 SInv23 SInv24 SInv25 AVERAGE 0.67% 1.70% 1.30% 1.56% 1.99% STD 9.75% 11.07% 10.57% 9.99% 10.38% SHARPE SInv31 SInv32 SInv33 SInv34 SInv35 AVERAGE 1.49% 0.84% 1.89% 2.07% 0.45% STD 11.25% 9.33% 9.13% 10.13% 8.74% SHARPE SInv41 SInv42 SInv43 SInv44 SInv45 AVERAGE 1.48% 1.01% 1.03% 0.63% 0.74% STD 9.71% 8.48% 9.57% 6.97% 8.44% SHARPE SInv51 SInv52 SInv53 SInv54 SInv55 AVERAGE 0.76% 0.97% 0.92% 0.96% 1.05% STD 8.10% 7.61% 6.47% 6.83% 9.54% SHARPE Here, there are no clear trends of increasing returns from conservative to aggressive stocks. This matches with the graph shown earlier that CMA factor portfolio value is flat in the long run. In all investment quintiles, there is a trend of decreasing risk as stock size got bigger. The difference in size premiums can only be seen clearly by comparing smallest and biggest. 25
27 4.3) Model Comparison There are 8 models tested with 75 LHS portfolios. There are three classic models: Fama-French Three-factor (3FF), Five-factor (5FF), and Cahart s 4 factor model. Five adjusted models are created to test if there are improvements. Three models are formed by dropping out, value, investment and profitability factor from Five-factor model respectively. Another two are created by replacement of WML with absolute momentum and probabilistic momentum respectively. Every model includes market factor. The results shown below are sorted based on average absolute intercept produced by the model where its value is reported in the second column. Apparently, the model with probabilistic momentum produces lowest average intercepts. Hence, it is the dominant model in all portfolio sorts. For Size-OP and Size-Inv, the adjusted model that dropped out profitability from 5FF followed by absolute momentum model are the runner ups in performance. We found that profitability is already explained by value factor in Thailand. From the table, 5FF never dominates its derivative that omits either profitability or value factor. This means that there is a redundancy in these two factors and they decrease 5FF effectiveness. Furthermore, dropping out profitability factor is always better than dropping value factor. In conclusion, omitting profitability factor improves models efficiency. This is different from Fama and French evidence discussed in section 2 where HML is totally explained by RMW and CMA. Comparing classic models, 3FF dominates both 5FF and Cahart s 4 factor model in most of the time. In Size-Inv, 5FF dominates 3FF, but only removes 0.08% of average intercepts. Comparing to the adjusted model, 3FF performs well only in Size-B/M allocation. In other allocation, adding investment factor or alternatives of momentum could improve effectiveness to 3FF. Looking at momentum models, Cahart s four factor model is always inferior to 3FF model. This result gets along with Kaewthammachai et al (2016) evidence suggesting that WML factor is not significant. Nevertheless, 3FF cannot match with four factor probabilistic momentum and absolute momentum model. To conclude, value factor in 3FF cannot capture all aspect of investment and momentum in Thailand. To conclude, four-factor model is likely to work best in Thailand. Four-factor probabilistic momentum model is the most effective. Four factor model that augment investment factor to Fama-French 3 factor model could also reduce average intercept in most cases. In some cases, four-factor absolute momentum model is more preferable to investment augmented model. As a final twist, the reported statistic and ratios suggest the accuracy of predictions formed by factor models is still inadequate. In the third column, the average intercept over average r determines how much intercept explain anomalies in returns. As the value exceeds 1, it means the model is not efficient enough to predict returns unexplained by simple average. In other words, using simple average can predict portfolios returns better in long run. The same goes for ratio in the fourth column, which measure dispersion of intercepts over dispersion of returns. If the value is more than 1, model should be rejected as the variance of intercept s 26
28 error is higher than that of simple average. The reason that ratios turn out to be more than one is LHS portfolios deviation from average returns or r are low. 25-Size-OP has the highest r only at 0.54%. Overall, this means factor models are not a good predictor of returns in Thailand unless their average intercepts fall below 0.54%. However, the models can still be used to analyze factor effects on portfolios which will be discussed in next session. In appendix, the author also demonstrates how investor could use the models to analyze investment strategy. 25 Size-Inv Portfolios A a i A a i / A r 25 Size-OP Portfolios A a i A a i / A r A(a 2 i )/ A( r 2 ) SMB HML ProbMOM 1.19% SMB HML CMA 2.54% SMB HML AbsMOM 2.66% SMB CMA RMW 2.71% FF - (SMB HML CMA RMW) 2.73% FF - (SMB HML) 2.81% SMB HML RMW 2.86% Cahart's % A(a 2 i )/ A( r 2 ) SMB HML ProbMOM 0.66% SMB HML CMA 2.17% SMB HML AbsMOM 2.18% FF - (SMB HML) 2.29% Cahart's % SMB CMA RMW 2.37% FF - (SMB HML CMA RMW) 2.40% SMB HML RMW 2.57% Size-B/M Portfolios A a i A a i / A r A(a 2 i )/ A( r 2 ) SMB HML ProbMOM 0.74% SMB HML AbsMOM 2.13% FF - (SMB HML) 2.19% Cahart's % SMB HML CMA 2.36% SMB CMA RMW 2.46% FF - (SMB HML CMA RMW) 2.55% SMB HML RMW 2.65%
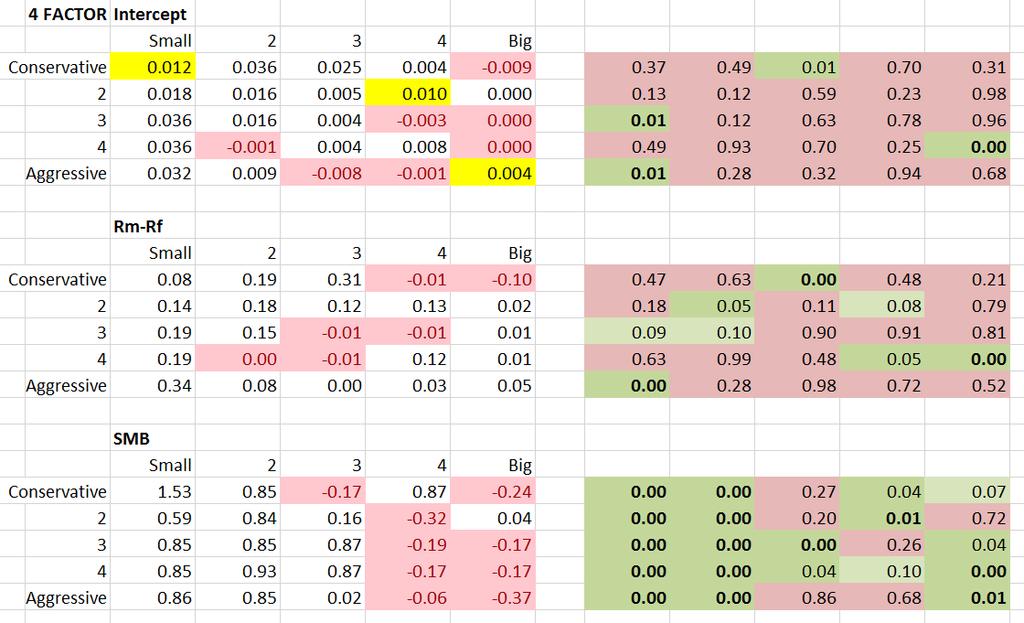
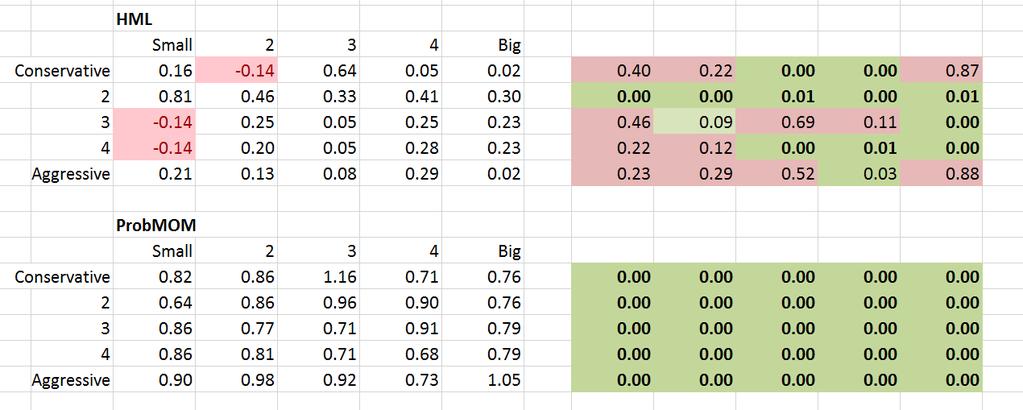
29 4.4) Regression Details and Risk Exposure Analysis In this section, the coefficient produced by regression of probabilistic four factor model, Fama- French five-factor and three-factor model are analyzed. Furthermore, the t-value and significance of the factors will also be discussed to describe the effects of factors on returns. First, for all portfolios sorts, small stock portfolios are exposed to size factor risk more. The coefficients are usually around 1 in small size quintiles. In big stock quintiles, the coefficients are below one and some report no statistical significance. This is similar to what is found by Kaewthammachai, et al. (2016) as well as Fama and Frech (2015). Second, to further prove redundancy in HML and RMA, HML factor in five-factor model lost its significance in all portfolios sorts. Unreported in this paper, this also happens in Cahart s four factor model when adding WML factor to Fama-French three factor models. The result is not surprising as correlation matrix in the section 4 reports around 30% of correlation between HML and WML. However, in Kaewthammachai et al. (2016), HML factor does not lose significance in the analysis of four-factor model. Third, five-factor models produce lower intercepts when analyzing small stocks in high investment and profitability quintile. Fama and French (2015) argue that small stocks behave like high investment firms despite low profitability. Hence, adding profitability factor and investment factor can help explain their returns better. In addition, they found that CMA and RMW works better in stocks with extreme investment or high profit. These seems to hold true in Thailand as well in small stocks. CMA factor reports negative coefficient, but low statistical significance suggesting slight positive relationship between firm s investment and stock returns. Fourth, adding probabilistic momentum to three-factor model, coefficients for market and size factor are lowered when compared to three-factor model. This means momentum can explain some of the size and market factor movements. Interestingly, stocks in 4 th and 5 th quintiles usually report negative exposure to size factor after adding momentum factor. As big stocks pay lower returns, this makes the size coefficient matches well with empirical data. 25 Size-Inv Portfolios As discussed earlier, investment factor can work well in stocks with high investment and profitability. Here, profitability factor tends to be significant in big stocks. Adding these two effects together, HML factor lost its significance in almost all portfolios. In Fama-French three factor model, value factor reports negative coefficient in small and aggressive stocks. This may suggest that small and high investment stocks are usually growth stock, which matches with the value theory (Fama and French, 2006). In Size-Inv portfolios, adding profitability and investment factor in five factor model reduces intercepts in small stocks of 4 th and 5 th investment quintile. Furthermore, HML factor also lost its significance in these portfolios strengthening our evidence that profitability and investment is needed to explain extreme stocks. 28
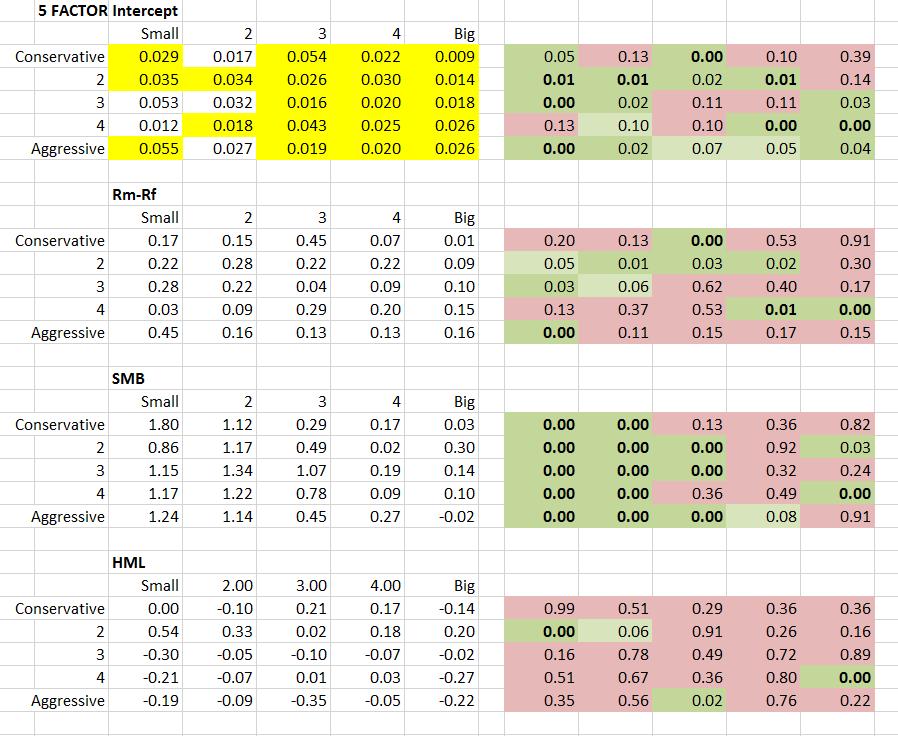
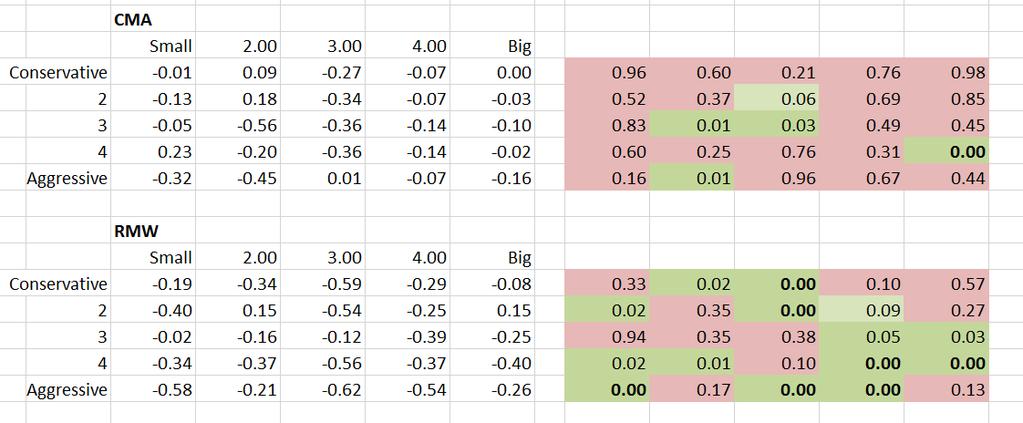
30 25-Size-OP Portfolios Here, Fama-French five factor model works better than three factor model in robust stocks. In 4 th and 5 th profitability quintile portfolios, five-factor model reports lower intercepts. HML factor of five-factor model is statistical insignificant in most of 4 th profitability quintile. This means investment and profitability factor can absorb inaccuracies caused by size and value factor especially in high profit stocks. Interestingly, investment and profitability factor reports negative coefficient and low statistical significance in most Size-OP portfolios. While these factors improve the intercepts for high profit stocks, results are not statistically robust. Probabilistic momentum augmented model can resolve this issue. In this model, ProbMOM factor removes HML factor significance in 5 th quintile of profitability factor. In 4 th profitability quintile, HML still have statistical significance, but the intercepts are dramatically lower to less than 1% in most cases. Hence we can conclude that high-profit stocks are exposed to momentum risk and can be explained by momentum factor rather than profitability and investment factor. 25-Size-B/M Portfolios There is one interesting output from Fama-French three-factor model in this portfolio sort. Almost all portfolios show positive exposure to size factor. However, in smallest and biggest size quintile, they have negative HML coefficient. Given that value factor is already controlled by portfolio sort. This means three factor cannot adequately explain returns in these portfolios. Furthermore, HML factor is not robust in terms of statistical significance for small stocks and growth stock. In five factor model, HML lost significance in most portfolios in the 2 nd size and value quintile. In probabilistic augmented momentum model, HML lost significance in 50% of portfolios that contain small and low B/M stock. In this portfolio sort, it seems that five factor model can explain the negative coefficient. Firstly, after augmenting new factors to three-factor model, the size factor coefficient becomes statistically insignificant in big stocks. This means big stock is not exposed to positive size return anymore. Secondly, it makes negative HML coefficient in growth stocks portfolios more robust. This goes along with theory that growth stock should have negative exposure to value factor. Thirdly, it makes negative coefficients in value portfolio becomes statistically insignificant. This implies that value stocks are not exposed to positive correlation with value factor. Momentum augmented portfolio can also make coefficients go along with theory better. Firstly, size coefficients become negative for big stocks implying big stock has lower return due to size. Secondly, for big stock with high B/M ratio, HML coefficient becomes positive and fits with theory better. In other words, after controlling momentum effect, negative returns can be explained better by size risk rather than value. Lastly, momentum factor makes most negative HML coefficient insignificant including the small stocks with negative coefficients. This might imply that growth stock returns are more influenced by momentum factor more than B/M. By contrast, in five factor model, growth stock has strong negative relationship with value factor. 29

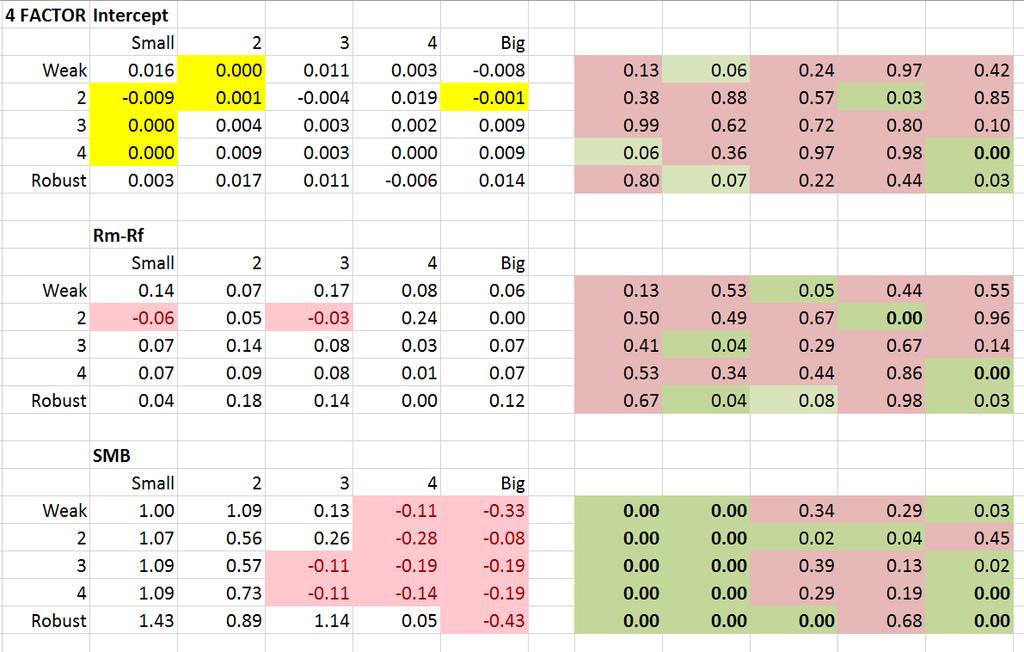
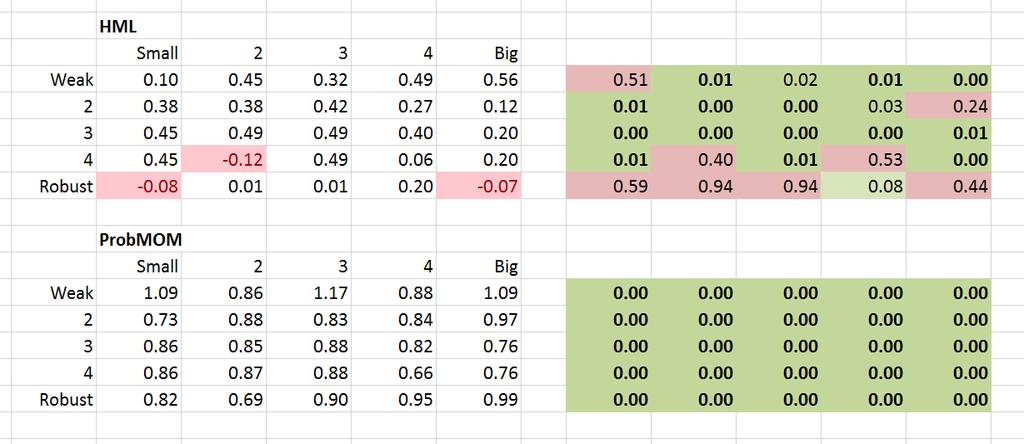
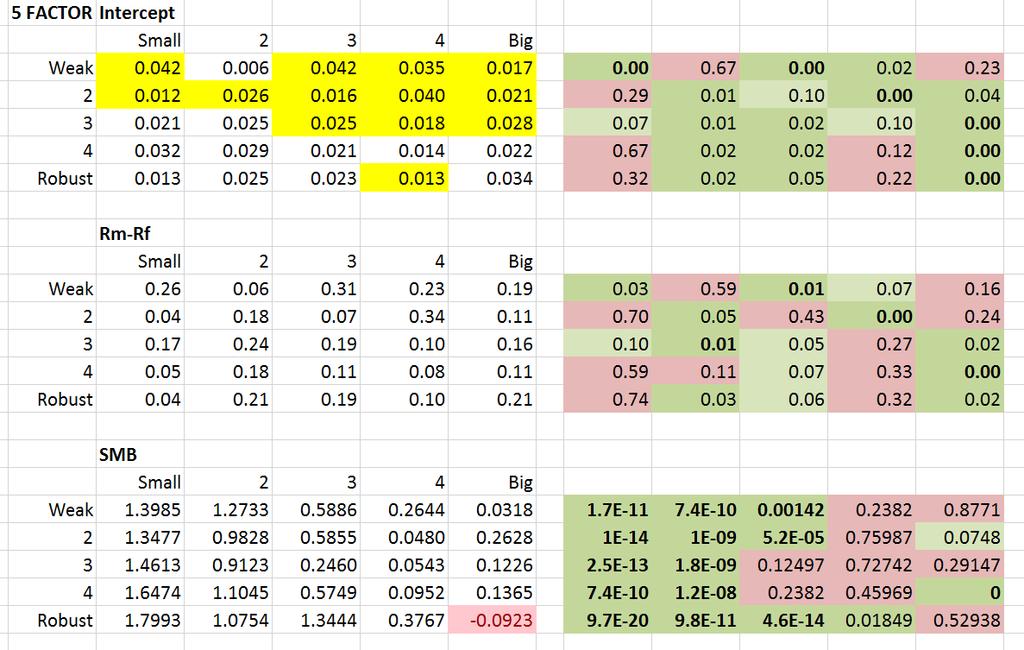
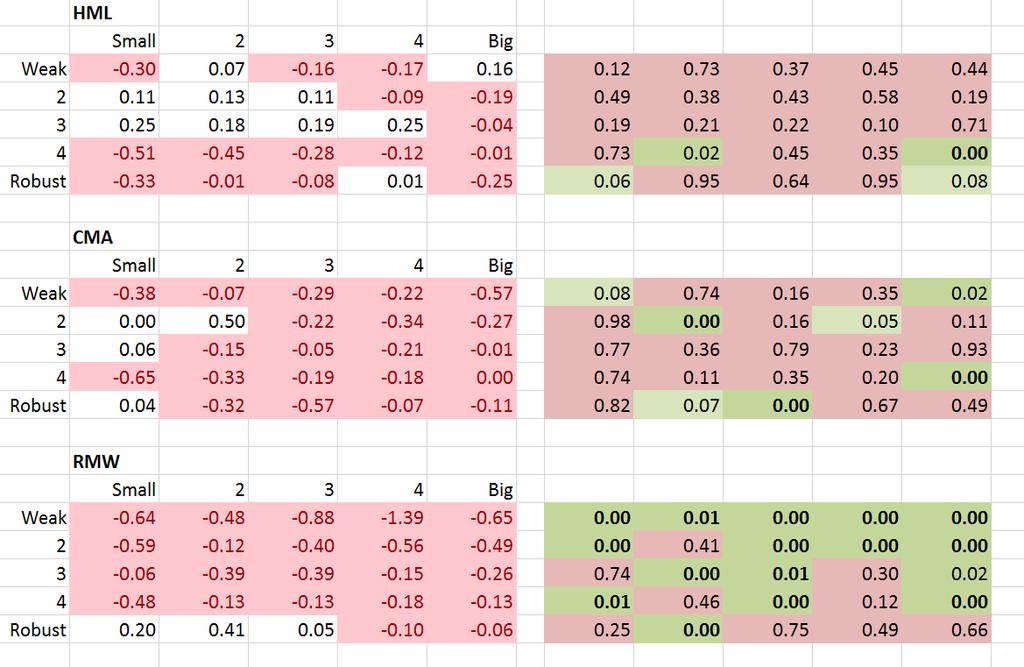
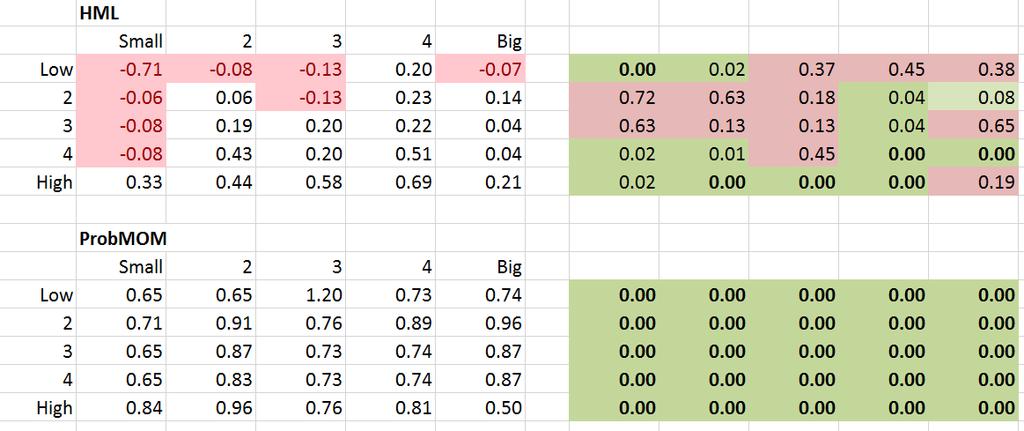
31 25 Size-Inv Portfolios (Note that size is shown in columns unlike other tables shown earlier where size is in rows) The left panel shows the coefficient of factors per portfolio while the right side shows the p- values. Box colored light green, dark green and dark green with bold show 10%, 5% and 1% level of significance respectively. For intercepts, box colored in yellow means the portfolio intercept is dominated by 3FF model. 30
32 31
33 32
 The left panel shows the coefficient of factors per portfolio while the right side shows the p-")

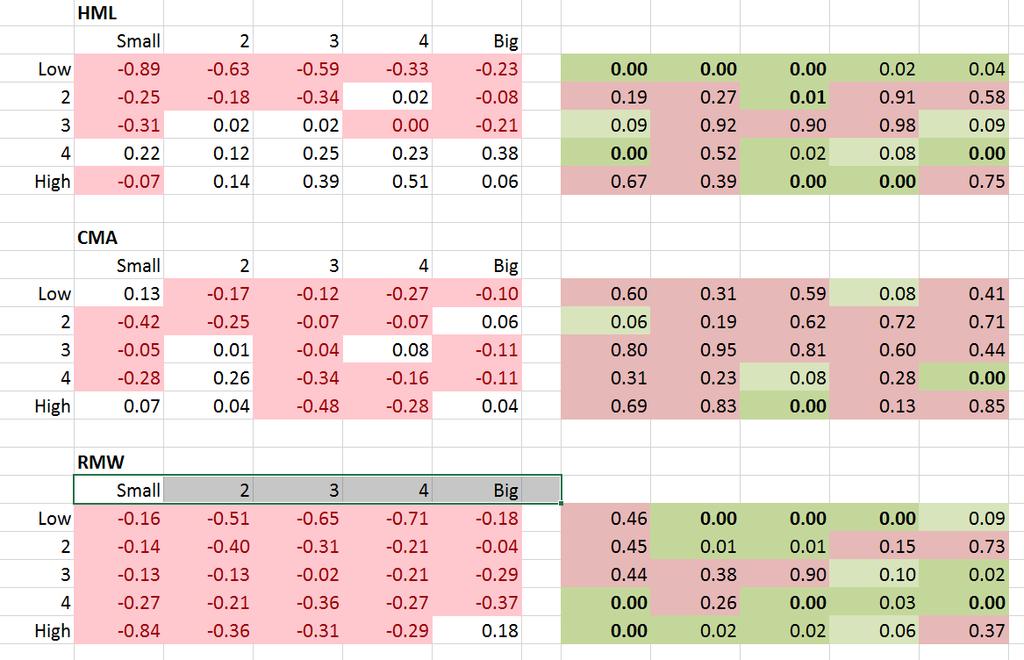
34 25 Size-OP Portfolios (Note that size is shown in columns unlike other tables shown earlier where size is in rows) The left panel shows the coefficient of factors per portfolio while the right side shows the p- value. Box colored light green, dark green and dark green with bold show 10%, 5% and 1% level of significance respectively. For intercepts, box colored in yellow means the portfolio intercept is dominated by 3FF model. 33
35 . 34
36 35

37 25 Size-B/M Portfolios (Note that size is shown in columns unlike other tables shown earlier where size is in rows) The left panel shows the coefficient of factors per portfolio while the right side shows the p- value. Box colored light green, dark green and dark green with bold show 10%, 5% and 1% level of significance respectively. For intercepts, box colored in yellow means the portfolio intercept is dominated by 3FF model. 36
38 37
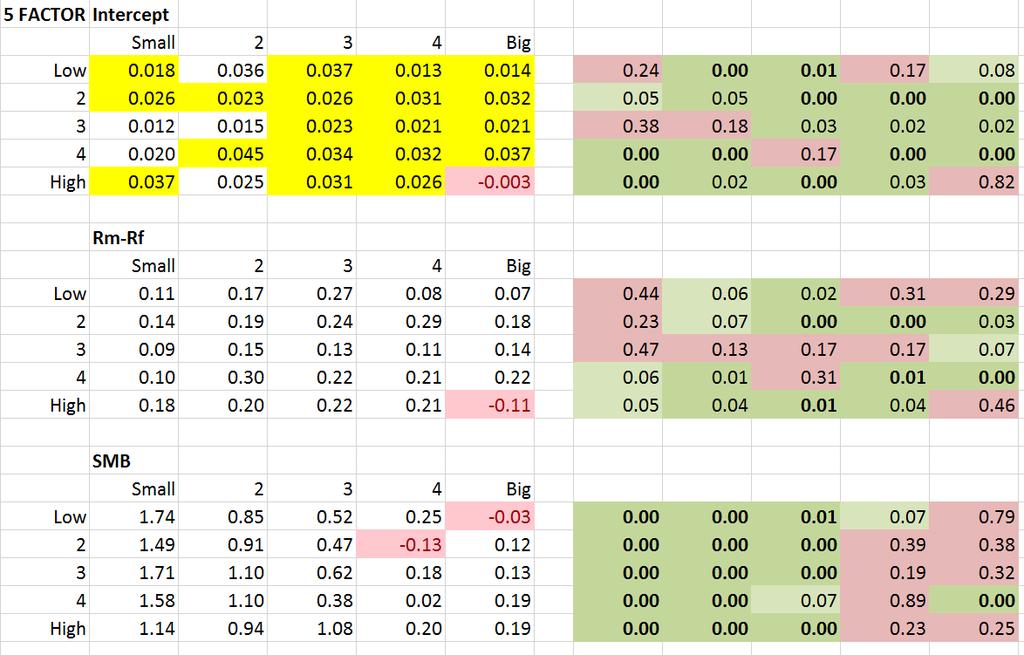
39 38
Economic Review. Wenting Jiao * and Jean-Jacques Lilti
 Jiao and Lilti China Finance and Economic Review (2017) 5:7 DOI 10.1186/s40589-017-0051-5 China Finance and Economic Review RESEARCH Open Access Whether profitability and investment factors have additional
Statistical Understanding. of the Fama-French Factor model. Chua Yan Ru
 i Statistical Understanding of the Fama-French Factor model Chua Yan Ru NATIONAL UNIVERSITY OF SINGAPORE 2012 ii Statistical Understanding of the Fama-French Factor model Chua Yan Ru (B.Sc National University
The Effect of Fund Size on Performance:The Evidence from Active Equity Mutual Funds in Thailand
 The Effect of Fund Size on Performance:The Evidence from Active Equity Mutual Funds in Thailand NopphonTangjitprom Martin de Tours School of Management and Economics, Assumption University, Hua Mak, Bangkok,
Testing The Fama-French Five-Factor Model In Explaining Stock Returns Variation At The Lusaka Securities Exchange
 Testing The Fama-French Five-Factor Model In Explaining Stock Returns Variation At The Lusaka Securities Exchange (Conference ID: CFP/150/2017) Nsama Njebele Department of Business Studies Mulungushi University
Empirical Study on Five-Factor Model in Chinese A-share Stock Market
 Empirical Study on Five-Factor Model in Chinese A-share Stock Market Supervisor: Prof. Dr. F.A. de Roon Student name: Qi Zhen Administration number: U165184 Student number: 2004675 Master of Finance Economics
DOES FINANCIAL LEVERAGE AFFECT TO ABILITY AND EFFICIENCY OF FAMA AND FRENCH THREE FACTORS MODEL? THE CASE OF SET100 IN THAILAND
 DOES FINANCIAL LEVERAGE AFFECT TO ABILITY AND EFFICIENCY OF FAMA AND FRENCH THREE FACTORS MODEL? THE CASE OF SET100 IN THAILAND by Tawanrat Prajuntasen Doctor of Business Administration Program, School
We are IntechOpen, the world s leading publisher of Open Access books Built by scientists, for scientists. International authors and editors
 We are IntechOpen, the world s leading publisher of Open Access books Built by scientists, for scientists 3,900 116,000 120M Open access books available International authors and editors Downloads Our
MUTUAL FUND PERFORMANCE ANALYSIS PRE AND POST FINANCIAL CRISIS OF 2008
 MUTUAL FUND PERFORMANCE ANALYSIS PRE AND POST FINANCIAL CRISIS OF 2008 by Asadov, Elvin Bachelor of Science in International Economics, Management and Finance, 2015 and Dinger, Tim Bachelor of Business
The study of enhanced performance measurement of mutual funds in Asia Pacific Market
 Lingnan Journal of Banking, Finance and Economics Volume 6 2015/2016 Academic Year Issue Article 1 December 2016 The study of enhanced performance measurement of mutual funds in Asia Pacific Market Juzhen
Modelling Stock Returns in India: Fama and French Revisited
 Volume 9 Issue 7, Jan. 2017 Modelling Stock Returns in India: Fama and French Revisited Rajeev Kumar Upadhyay Assistant Professor Department of Commerce Sri Aurobindo College (Evening) Delhi University
Optimal Debt-to-Equity Ratios and Stock Returns
 Utah State University DigitalCommons@USU All Graduate Plan B and other Reports Graduate Studies 5-2014 Optimal Debt-to-Equity Ratios and Stock Returns Courtney D. Winn Utah State University Follow this
The American University in Cairo School of Business
 The American University in Cairo School of Business Determinants of Stock Returns: Evidence from Egypt A Thesis Submitted to The Department of Management in partial fulfillment of the requirements for
Dissecting Anomalies. Eugene F. Fama and Kenneth R. French. Abstract
 First draft: February 2006 This draft: June 2006 Please do not quote or circulate Dissecting Anomalies Eugene F. Fama and Kenneth R. French Abstract Previous work finds that net stock issues, accruals,
Empirical Study on Market Value Balance Sheet (MVBS)
") Empirical Study on Market Value Balance Sheet (MVBS) Yiqiao Yin Simon Business School November 2015 Abstract This paper presents the results of an empirical study on Market Value Balance Sheet (MVBS).
Empirical Study on Market Value Balance Sheet (MVBS) Yiqiao Yin Simon Business School November 2015 Abstract This paper presents the results of an empirical study on Market Value Balance Sheet (MVBS).
Applied Macro Finance
 Master in Money and Finance Goethe University Frankfurt Week 2: Factor models and the cross-section of stock returns Fall 2012/2013 Please note the disclaimer on the last page Announcements Next week (30
An alternative approach for investigating risk factors
 An alternative approach for investigating risk factors Using asset turnover levels to understand the investment premiums Erik Graf Oskar Rosberg Stockholm School of Economics Master Thesis in Finance December
Size and Book-to-Market Factors in Returns
 Utah State University DigitalCommons@USU All Graduate Plan B and other Reports Graduate Studies 5-2015 Size and Book-to-Market Factors in Returns Qian Gu Utah State University Follow this and additional
Comparison in Measuring Effectiveness of Momentum and Contrarian Trading Strategy in Indonesian Stock Exchange
 Comparison in Measuring Effectiveness of Momentum and Contrarian Trading Strategy in Indonesian Stock Exchange Rizky Luxianto* This paper wants to explore the effectiveness of momentum or contrarian strategy
Exploring Fama-French Five-Factor Model on Chinese A- Share Stock Market
 Exploring Fama-French Five-Factor Model on Chinese A- Share Stock Market Wenting JIAO 1 Jean-Jacques LILTI 2 ABSTRACT Motivated by the valuation theory and recent empirical findings on the strong profitability
Some Features of the Three- and Four- -factor Models for the Selected Portfolios of the Stocks Listed on the Warsaw Stock Exchange,
 Some Features of the Three- and Four- -factor Models for the Selected Portfolios of the Stocks Listed on the Warsaw Stock Exchange, 2003 2007 Wojciech Grabowski, Konrad Rotuski, Department of Banking and
The Effect of Kurtosis on the Cross-Section of Stock Returns
 Utah State University DigitalCommons@USU All Graduate Plan B and other Reports Graduate Studies 5-2012 The Effect of Kurtosis on the Cross-Section of Stock Returns Abdullah Al Masud Utah State University
The Tangible Risk of Intangible Capital. Abstract
 The Tangible Risk of Intangible Capital Nan Li Shanghai Jiao Tong University Weiqi Zhang University of Muenster, Finance Center Muenster Yanzhao Jiang Shanghai Jiao Tong University Abstract With the rise
Problem Set 4 Solutions
 Business John H. Cochrane Problem Set Solutions Part I readings. Give one-sentence answers.. Novy-Marx, The Profitability Premium. Preview: We see that gross profitability forecasts returns, a lot; its
Ulaş ÜNLÜ Assistant Professor, Department of Accounting and Finance, Nevsehir University, Nevsehir / Turkey.
 Size, Book to Market Ratio and Momentum Strategies: Evidence from Istanbul Stock Exchange Ersan ERSOY* Assistant Professor, Faculty of Economics and Administrative Sciences, Department of Business Administration,
Does the Fama and French Five- Factor Model Work Well in Japan?*
 International Review of Finance, 2017 18:1, 2018: pp. 137 146 DOI:10.1111/irfi.12126 Does the Fama and French Five- Factor Model Work Well in Japan?* KEIICHI KUBOTA AND HITOSHI TAKEHARA Graduate School
The Value Premium and the January Effect
 The Value Premium and the January Effect Julia Chou, Praveen Kumar Das * Current Version: January 2010 * Chou is from College of Business Administration, Florida International University, Miami, FL 33199;
Performances Appraisal of Real Estate Investment Trust in Borsa Istanbul
 International Journal of Economics and Financial Issues ISSN: 2146-4138 available at http: www.econjournals.com International Journal of Economics and Financial Issues, 2018, 8(6), 187-191. Performances
Common Risk Factors in Explaining Canadian Equity Returns
 Common Risk Factors in Explaining Canadian Equity Returns Michael K. Berkowitz University of Toronto, Department of Economics and Rotman School of Management Jiaping Qiu University of Toronto, Department
Online Appendix to. The Structure of Information Release and the Factor Structure of Returns
 Online Appendix to The Structure of Information Release and the Factor Structure of Returns Thomas Gilbert, Christopher Hrdlicka, Avraham Kamara 1 February 2017 In this online appendix, we present supplementary
The Fama-French Three Factors in the Chinese Stock Market *
 DOI 10.7603/s40570-014-0016-0 210 2014 年 6 月第 16 卷第 2 期 中国会计与财务研究 C h i n a A c c o u n t i n g a n d F i n a n c e R e v i e w Volume 16, Number 2 June 2014 The Fama-French Three Factors in the Chinese
THE PENNSYLVANIA STATE UNIVERSITY SCHREYER HONORS COLLEGE DEPARTMENT OF FINANCE
 THE PENNSYLVANIA STATE UNIVERSITY SCHREYER HONORS COLLEGE DEPARTMENT OF FINANCE EXAMINING THE IMPACT OF THE MARKET RISK PREMIUM BIAS ON THE CAPM AND THE FAMA FRENCH MODEL CHRIS DORIAN SPRING 2014 A thesis
Comparing Cross-Section and Time-Series Factor Models. Eugene F. Fama and Kenneth R. French * Abstract
 Comparing Cross-Section and Time-Series Factor Models Eugene F. Fama and Kenneth R. French * Abstract First draft: June 2017 This draft: October 2018 We use the cross-section regression approach of Fama
Revisiting Idiosyncratic Volatility and Stock Returns. Fatma Sonmez 1
 Revisiting Idiosyncratic Volatility and Stock Returns Fatma Sonmez 1 Abstract This paper s aim is to revisit the relation between idiosyncratic volatility and future stock returns. There are three key
Common risk factors in returns in Asian emerging stock markets
 International Business Review 14 (2005) 695 717 www.elsevier.com/locate/ibusrev Common risk factors in returns in Asian emerging stock markets Wai Cheong Shum a, Gordon Y.N. Tang b,c, * a Faculty of Management
Liquidity skewness premium
 Liquidity skewness premium Giho Jeong, Jangkoo Kang, and Kyung Yoon Kwon * Abstract Risk-averse investors may dislike decrease of liquidity rather than increase of liquidity, and thus there can be asymmetric
Further Test on Stock Liquidity Risk With a Relative Measure
 International Journal of Education and Research Vol. 1 No. 3 March 2013 Further Test on Stock Liquidity Risk With a Relative Measure David Oima* David Sande** Benjamin Ombok*** Abstract Negative relationship
Applying Fama and French Three Factors Model and Capital Asset Pricing Model in the Stock Exchange of Vietnam
 International Research Journal of Finance and Economics ISSN 1450-2887 Issue 95 (2012) EuroJournals Publishing, Inc. 2012 http://www.internationalresearchjournaloffinanceandeconomics.com Applying Fama
Fama-French in China: Size and Value Factors in Chinese Stock Returns
 Fama-French in China: Size and Value Factors in Chinese Stock Returns November 26, 2016 Abstract We investigate the size and value factors in the cross-section of returns for the Chinese stock market.
A Study to Check the Applicability of Fama and French, Three-Factor Model on S&P BSE- 500 Index
 International Journal of Management, IT & Engineering Vol. 8 Issue 1, January 2018, ISSN: 2249-0558 Impact Factor: 7.119 Journal Homepage: Double-Blind Peer Reviewed Refereed Open Access International
Economics of Behavioral Finance. Lecture 3
 Economics of Behavioral Finance Lecture 3 Security Market Line CAPM predicts a linear relationship between a stock s Beta and its excess return. E[r i ] r f = β i E r m r f Practically, testing CAPM empirically
The Free Cash Flow and Corporate Returns
 Utah State University DigitalCommons@USU All Graduate Plan B and other Reports Graduate Studies 12-2018 The Free Cash Flow and Corporate Returns Sen Na Utah State University Follow this and additional
Exploiting Factor Autocorrelation to Improve Risk Adjusted Returns
 Exploiting Factor Autocorrelation to Improve Risk Adjusted Returns Kevin Oversby 22 February 2014 ABSTRACT The Fama-French three factor model is ubiquitous in modern finance. Returns are modeled as a linear
On the robustness of the CAPM, Fama-French Three-Factor Model and the Carhart Four-Factor Model on the Dutch stock market.
 Tilburg University 2014 Bachelor Thesis in Finance On the robustness of the CAPM, Fama-French Three-Factor Model and the Carhart Four-Factor Model on the Dutch stock market. Name: Humberto Levarht y Lopez
The Formulation of the Four Factor Model when a. Considerable Proportion of Firms is Dual-Listed
 The Formulation of the Four Factor Model when a Considerable Proportion of Firms is Dual-Listed by Sharon Garyn-Tal* and Beni Lauterbach** August 2014 Abstract We examine the performance of the Fama-French-Carhart
Premium Timing with Valuation Ratios
 RESEARCH Premium Timing with Valuation Ratios March 2016 Wei Dai, PhD Research The predictability of expected stock returns is an old topic and an important one. While investors may increase expected returns
Does fund size erode mutual fund performance?
 Erasmus School of Economics, Erasmus University Rotterdam Does fund size erode mutual fund performance? An estimation of the relationship between fund size and fund performance In this paper I try to find
Return Reversals, Idiosyncratic Risk and Expected Returns
 Return Reversals, Idiosyncratic Risk and Expected Returns Wei Huang, Qianqiu Liu, S.Ghon Rhee and Liang Zhang Shidler College of Business University of Hawaii at Manoa 2404 Maile Way Honolulu, Hawaii,
BOOK TO MARKET RATIO AND EXPECTED STOCK RETURN: AN EMPIRICAL STUDY ON THE COLOMBO STOCK MARKET
 BOOK TO MARKET RATIO AND EXPECTED STOCK RETURN: AN EMPIRICAL STUDY ON THE COLOMBO STOCK MARKET Mohamed Ismail Mohamed Riyath Sri Lanka Institute of Advanced Technological Education (SLIATE), Sammanthurai,
Pairs-Trading in the Asian ADR Market
 Pairs-Trading in the Asian ADR Market Gwangheon Hong Department of Finance College of Business and Management Saginaw Valley State Universtiy 7400 Bay Road University Center, MI 48710 and Raul Susmel Department
Common Macro Factors and Their Effects on U.S Stock Returns
 2011 Common Macro Factors and Their Effects on U.S Stock Returns IBRAHIM CAN HALLAC 6/22/2011 Title: Common Macro Factors and Their Effects on U.S Stock Returns Name : Ibrahim Can Hallac ANR: 374842 Date
Asian Economic and Financial Review AN EMPIRICAL VALIDATION OF FAMA AND FRENCH THREE-FACTOR MODEL (1992, A) ON SOME US INDICES
 ON SOME US INDICES") Asian Economic and Financial Review ISSN(e): 2222-6737/ISSN(p): 2305-2147 journal homepage: http://www.aessweb.com/journals/5002 AN EMPIRICAL VALIDATION OF FAMA AND FRENCH THREE-FACTOR MODEL (1992, A)
Asian Economic and Financial Review ISSN(e): 2222-6737/ISSN(p): 2305-2147 journal homepage: http://www.aessweb.com/journals/5002 AN EMPIRICAL VALIDATION OF FAMA AND FRENCH THREE-FACTOR MODEL (1992, A)
How Markets React to Different Types of Mergers
 How Markets React to Different Types of Mergers By Pranit Chowhan Bachelor of Business Administration, University of Mumbai, 2014 And Vishal Bane Bachelor of Commerce, University of Mumbai, 2006 PROJECT
Supplementary Appendix to Financial Intermediaries and the Cross Section of Asset Returns
 Supplementary Appendix to Financial Intermediaries and the Cross Section of Asset Returns Tobias Adrian tobias.adrian@ny.frb.org Erkko Etula etula@post.harvard.edu Tyler Muir t-muir@kellogg.northwestern.edu
In Search of a Leverage Factor in Stock Returns:
 Stockholm School of Economics Master s Thesis in Finance Spring 2010 In Search of a Leverage Factor in Stock Returns: An Empirical Evaluation of Asset Pricing Models on Swedish Data BENIAM POUTIAINEN α
AN ALTERNATIVE THREE-FACTOR MODEL FOR INTERNATIONAL MARKETS: EVIDENCE FROM THE EUROPEAN MONETARY UNION
 AN ALTERNATIVE THREE-FACTOR MODEL FOR INTERNATIONAL MARKETS: EVIDENCE FROM THE EUROPEAN MONETARY UNION MANUEL AMMANN SANDRO ODONI DAVID OESCH WORKING PAPERS ON FINANCE NO. 2012/2 SWISS INSTITUTE OF BANKING
David Hirshleifer* Kewei Hou* Siew Hong Teoh* March 2006
 THE ACCRUAL ANOMALY: RISK OR MISPRICING? David Hirshleifer* Kewei Hou* Siew Hong Teoh* March 2006 We document considerable return comovement associated with accruals after controlling for other common
IMPLEMENTING THE THREE FACTOR MODEL OF FAMA AND FRENCH ON KUWAIT S EQUITY MARKET
 IMPLEMENTING THE THREE FACTOR MODEL OF FAMA AND FRENCH ON KUWAIT S EQUITY MARKET by Fatima Al-Rayes A thesis submitted in partial fulfillment of the requirements for the degree of MSc. Finance and Banking
Persistence in Mutual Fund Performance: Analysis of Holdings Returns
 Persistence in Mutual Fund Performance: Analysis of Holdings Returns Samuel Kruger * June 2007 Abstract: Do mutual funds that performed well in the past select stocks that perform well in the future? I
Focused Funds How Do They Perform in Comparison with More Diversified Funds? A Study on Swedish Mutual Funds. Master Thesis NEKN
 Focused Funds How Do They Perform in Comparison with More Diversified Funds? A Study on Swedish Mutual Funds Master Thesis NEKN01 2014-06-03 Supervisor: Birger Nilsson Author: Zakarias Bergstrand Table
Evaluate Multifactor Asset Pricing Models to Explain Market Anomalies Applicable Test in the Saudi Stock Market
 Arab Journal of Administration, Vol. 35, No. 1, June 2015 Evaluate Multifactor Asset Pricing Models to Explain Market Anomalies Applicable Test in the Saudi Stock Market Dr. Sahar M. R. Mahran, Associate
Asian Economic and Financial Review THE CAPITAL INVESTMENT INCREASES AND STOCK RETURNS
 Asian Economic and Financial Review ISSN(e): 2222-6737/ISSN(p): 2305-2147 journal homepage: http://www.aessweb.com/journals/5002 THE CAPITAL INVESTMENT INCREASES AND STOCK RETURNS Jung Fang Liu 1 --- Nicholas
A 5-Factor Risk Model for European Stocks
 Master Thesis HEC Paris 2017 A 5-Factor Risk Model for European Stocks Supervised by Prof. Ioanid Rosu Luis Amézola Miguel Dolz A 5-Factor risk model for European stocks Master Thesis HEC Paris 2017 Supervised
Hamid Reza VAKILIFARD 1 Forough HEIRANY 2. Iran,
 Vol. 3, No.3, July 2013, pp. 118 124 ISSN: 2225-8329 2013 HRMARS www.hrmars.com A Comparative Evaluation of the Predictability of Fama-French Three- Factor Model and Chen Model in Explaining the Stock
Testing Multi-factor Models Internationally: Developed and Emerging Markets
 ERASMUS UNIVERSITY ROTTERDAM Erasmus School of Economics Testing Multi-factor Models Internationally: Developed and Emerging Markets Koen Kuijpers 432875 Supervised by Sjoerd van den Hauwe Abstract: Previous
Using Pitman Closeness to Compare Stock Return Models
 International Journal of Business and Social Science Vol. 5, No. 9(1); August 2014 Using Pitman Closeness to Compare Stock Return s Victoria Javine Department of Economics, Finance, & Legal Studies University
Do stock fundamentals explain idiosyncratic volatility? Evidence for Australian stock market
 Do stock fundamentals explain idiosyncratic volatility? Evidence for Australian stock market Bin Liu School of Economics, Finance and Marketing, RMIT University, Australia Amalia Di Iorio Faculty of Business,
Is Infrastructure An Asset Class? An Asset Pricing Approach
 Is Infrastructure An Asset Class? An Asset Pricing Approach Robert J. Bianchi* and Michael E. Drew Department of Accounting, Finance and Economics Griffith Business School Griffith University Nathan, Brisbane,
Dissecting Anomalies EUGENE F. FAMA AND KENNETH R. FRENCH ABSTRACT
 Dissecting Anomalies EUGENE F. FAMA AND KENNETH R. FRENCH ABSTRACT The anomalous returns associated with net stock issues, accruals, and momentum are pervasive; they show up in all size groups (micro,
The bottom-up beta of momentum
 The bottom-up beta of momentum Pedro Barroso First version: September 2012 This version: November 2014 Abstract A direct measure of the cyclicality of momentum at a given point in time, its bottom-up beta
Decimalization and Illiquidity Premiums: An Extended Analysis
 Utah State University DigitalCommons@USU All Graduate Plan B and other Reports Graduate Studies 5-2015 Decimalization and Illiquidity Premiums: An Extended Analysis Seth E. Williams Utah State University
ATestofFameandFrenchThreeFactorModelinPakistanEquityMarket
 Global Journal of Management and Business Research Finance Volume 13 Issue 7 Version 1.0 Year 2013 Type: Double Blind Peer Reviewed International Research Journal Publisher: Global Journals Inc. (USA)
The Effect of Financial Constraints, Investment Policy and Product Market Competition on the Value of Cash Holdings
 The Effect of Financial Constraints, Investment Policy and Product Market Competition on the Value of Cash Holdings Abstract This paper empirically investigates the value shareholders place on excess cash
Trading Volume and Momentum: The International Evidence
 1 Trading Volume and Momentum: The International Evidence Graham Bornholt Griffith University, Australia Paul Dou Monash University, Australia Mirela Malin* Griffith University, Australia We investigate
A Multifactor Explanation of Post-Earnings Announcement Drift
 JOURNAL OF FINANCIAL AND QUANTITATIVE ANALYSIS VOL. 38, NO. 2, JUNE 2003 COPYRIGHT 2003, SCHOOL OF BUSINESS ADMINISTRATION, UNIVERSITY OF WASHINGTON, SEATTLE, WA 98195 A Multifactor Explanation of Post-Earnings
Empirics of the Oslo Stock Exchange:. Asset pricing results
 Empirics of the Oslo Stock Exchange:. Asset pricing results. 1980 2016. Bernt Arne Ødegaard Jan 2017 Abstract We show the results of numerous asset pricing specifications on the crossection of assets at
International Journal of Asian Social Science OVERINVESTMENT, UNDERINVESTMENT, EFFICIENT INVESTMENT DECREASE, AND EFFICIENT INVESTMENT INCREASE
 International Journal of Asian Social Science ISSN(e): 2224-4441/ISSN(p): 2226-5139 journal homepage: http://www.aessweb.com/journals/5007 OVERINVESTMENT, UNDERINVESTMENT, EFFICIENT INVESTMENT DECREASE,
INVESTING IN THE ASSET GROWTH ANOMALY ACROSS THE GLOBE
 JOIM Journal Of Investment Management, Vol. 13, No. 4, (2015), pp. 87 107 JOIM 2015 www.joim.com INVESTING IN THE ASSET GROWTH ANOMALY ACROSS THE GLOBE Xi Li a and Rodney N. Sullivan b We document the
Changes in Analysts' Recommendations and Abnormal Returns. Qiming Sun. Bachelor of Commerce, University of Calgary, 2011.
 Changes in Analysts' Recommendations and Abnormal Returns By Qiming Sun Bachelor of Commerce, University of Calgary, 2011 Yuhang Zhang Bachelor of Economics, Capital Unv of Econ and Bus, 2011 RESEARCH
Long-run Consumption Risks in Assets Returns: Evidence from Economic Divisions
 Long-run Consumption Risks in Assets Returns: Evidence from Economic Divisions Abdulrahman Alharbi 1 Abdullah Noman 2 Abstract: Bansal et al (2009) paper focus on measuring risk in consumption especially
Problem Set 6. I did this with figure; bar3(reshape(mean(rx),5,5) );ylabel( size ); xlabel( value ); mean mo return %
,5,5) );ylabel( size ); xlabel( value ); mean mo return %") Business 35905 John H. Cochrane Problem Set 6 We re going to replicate and extend Fama and French s basic results, using earlier and extended data. Get the 25 Fama French portfolios and factors from the
Business 35905 John H. Cochrane Problem Set 6 We re going to replicate and extend Fama and French s basic results, using earlier and extended data. Get the 25 Fama French portfolios and factors from the
Income Inequality and Stock Pricing in the U.S. Market
 Lawrence University Lux Lawrence University Honors Projects 5-29-2013 Income Inequality and Stock Pricing in the U.S. Market Minh T. Nguyen Lawrence University, mnguyenlu27@gmail.com Follow this and additional
Accruals, cash flows, and operating profitability in the. cross section of stock returns
 Accruals, cash flows, and operating profitability in the cross section of stock returns Ray Ball 1, Joseph Gerakos 1, Juhani T. Linnainmaa 1,2 and Valeri Nikolaev 1 1 University of Chicago Booth School
Common Risk Factors in the Cross-Section of Corporate Bond Returns
 Common Risk Factors in the Cross-Section of Corporate Bond Returns Online Appendix Section A.1 discusses the results from orthogonalized risk characteristics. Section A.2 reports the results for the downside
Concentration and Stock Returns: Australian Evidence
 2010 International Conference on Economics, Business and Management IPEDR vol.2 (2011) (2011) IAC S IT Press, Manila, Philippines Concentration and Stock Returns: Australian Evidence Katja Ignatieva Faculty
Australian stock indexes and the four-factor model
 Southern Cross University epublications@scu Southern Cross Business School 2014 Australian stock indexes and the four-factor model Bruce A. Costa University of Montana Keith Jakob University of Montana
Volatility Appendix. B.1 Firm-Specific Uncertainty and Aggregate Volatility
 B Volatility Appendix The aggregate volatility risk explanation of the turnover effect relies on three empirical facts. First, the explanation assumes that firm-specific uncertainty comoves with aggregate
Assessing the reliability of regression-based estimates of risk
 Assessing the reliability of regression-based estimates of risk 17 June 2013 Stephen Gray and Jason Hall, SFG Consulting Contents 1. PREPARATION OF THIS REPORT... 1 2. EXECUTIVE SUMMARY... 2 3. INTRODUCTION...
Elisabetta Basilico and Tommi Johnsen. Disentangling the Accruals Mispricing in Europe: Is It an Industry Effect? Working Paper n.
 Elisabetta Basilico and Tommi Johnsen Disentangling the Accruals Mispricing in Europe: Is It an Industry Effect? Working Paper n. 5/2014 April 2014 ISSN: 2239-2734 This Working Paper is published under
Portfolio performance and environmental risk
 Portfolio performance and environmental risk Rickard Olsson 1 Umeå School of Business Umeå University SE-90187, Sweden Email: rickard.olsson@usbe.umu.se Sustainable Investment Research Platform Working
Does Transparency Increase Takeover Vulnerability?
 Does Transparency Increase Takeover Vulnerability? Finance Working Paper N 570/2018 July 2018 Lifeng Gu University of Hong Kong Dirk Hackbarth Boston University, CEPR and ECGI Lifeng Gu and Dirk Hackbarth
Interpreting the Value Effect Through the Q-theory: An Empirical Investigation 1
 Interpreting the Value Effect Through the Q-theory: An Empirical Investigation 1 Yuhang Xing Rice University This version: July 25, 2006 1 I thank Andrew Ang, Geert Bekaert, John Donaldson, and Maria Vassalou
CHAPTER 4: RESEARCH RESULTS
 CHAPTER 4: RESEARCH RESULTS CHAPTER 4: RESEARCH RESULTS 4.1. Summary of Statistics Table 1 : Summary of Value Portfolio Result Table 1 provide the result obtained from the research analysis for the value
Investigation the strength of Five-factor model of Fama and French. (2015) in describing fluctuations in stock returns
 in describing fluctuations in stock returns") Investigation the strength of Five-factor model of Fama and French (2015) in describing fluctuations in stock returns Roya mirzaei 1 Amir Abbas Sahebgharani 2 Nazanin Hashemi 3 Abstract Prediction of stock
Investigation the strength of Five-factor model of Fama and French (2015) in describing fluctuations in stock returns Roya mirzaei 1 Amir Abbas Sahebgharani 2 Nazanin Hashemi 3 Abstract Prediction of stock
FACTOR ALLOCATION MODELS
 FACTOR ALLOCATION MODELS Improving Factor Portfolio Efficiency January 2018 Summary: Factor timing and factor risk management are related concepts, but have different objectives Factors have unique characteristics
PROFITABILITY OF CAPM MOMENTUM STRATEGIES IN THE US STOCK MARKET
 International Journal of Business and Society, Vol. 18 No. 2, 2017, 347-362 PROFITABILITY OF CAPM MOMENTUM STRATEGIES IN THE US STOCK MARKET Terence Tai-Leung Chong The Chinese University of Hong Kong
FE670 Algorithmic Trading Strategies. Stevens Institute of Technology
 FE670 Algorithmic Trading Strategies Lecture 4. Cross-Sectional Models and Trading Strategies Steve Yang Stevens Institute of Technology 09/26/2013 Outline 1 Cross-Sectional Methods for Evaluation of Factor
Online Appendix for Overpriced Winners
 Online Appendix for Overpriced Winners A Model: Who Gains and Who Loses When Divergence-of-Opinion is Resolved? In the baseline model, the pessimist s gain or loss is equal to her shorting demand times
Fresh Momentum. Engin Kose. Washington University in St. Louis. First version: October 2009
 Long Chen Washington University in St. Louis Fresh Momentum Engin Kose Washington University in St. Louis First version: October 2009 Ohad Kadan Washington University in St. Louis Abstract We demonstrate
 Table I Descriptive Statistics This table shows the breakdown of the eligible funds as at May 2011. AUM refers to assets under management. Panel A: Fund Breakdown Fund Count Vintage count Avg AUM US$ MM
Models explaining the average return on the Stockholm Stock Exchange
 Models explaining the average return on the Stockholm Stock Exchange BACHELOR THESIS WITHIN: Economics NUMBER OF CREDITS: 15 ECTS PROGRAMME OF STUDY: International Economics AUTHOR: Martin Jämtander 950807