Trayport Euro Commodities Report
|
|
|
- Oswin Lucas
- 5 years ago
- Views:
Transcription
1 Trayport Euro Commodities Report Trayport Analysis Team April 2018
2 Legal disclaimer DISCLAIMER The content may not be copied, reprinted, published, transmitted, transferred, disseminated or distributed in any manner without prior written approval by Trayport Ltd. The contents of the report are provided AS IS. Trayport does not make any representation or warranty as to the accuracy, reliability, fitness of purpose, completeness, and or merchantability of the contents of the report or any part thereof and Trayport expressly disclaims liability of any kind whether statutory or implied whatsoever whether arising of and or in relation to the report or any part thereof. Nothing contained in the report shall be construed as legal, technical or other professional advice or be relied upon as such advice. Any clause of this disclaimer that is declared invalid shall be deemed severable and not affect the validity or enforceability of the remainder. Trayport and the names of Trayport s products are Trademarks and Service Marks of Trayport Limited, and where relevant have been registered as such. Other products, services, or company names mentioned herein are the property of, and may be the service mark or trademark of, their respective owners. Trayport Limited All Rights reserved
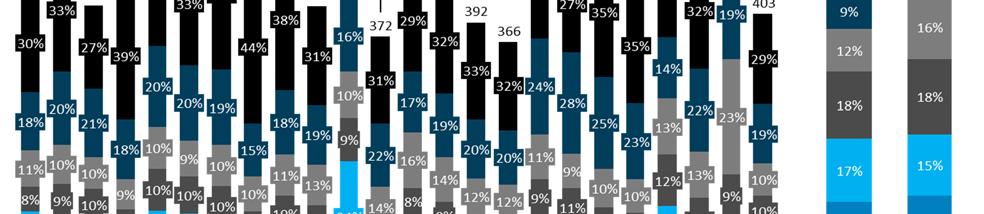
3 Editorial summary April 2018: Volumes drops following a strong March, Euro Power up YoY, broker bilateral gains in EUA. April 2018 saw million monthly contracts traded, down 15.7% vs March All groups except Emissions saw MoM declines, with Euro Gas the greatest, down 28% (1,199 TWh) to 3,155 TWh. UK Power and Coal also saw noticeable drops of 11% and 7% respectively, with UK Gas and Euro Power experiencing a smaller percentage but higher nominal declines, down 3% and 2% respectively. YTD we have seen million monthly contracts traded, up 6% vs YTD Europe has basked in record high April temperatures, has this further magnified the tradition April drop in volumes? Euro Gas saw a reversal of the March 2018 growth, with all but one regional market experiencing declining volumes MoM. Although TTF volume eased back from a record month in March to 1,869 TWh in April it was still up 25% YoY and up 18% YTD. NBP has continued to record lower volumes YoY, down 9% and TTF s value of NBP stood at 155%, the lowest figure since November France Hubs experienced strong volume growth in March however April was a different story. MoM it declined 72% to 42 TWh, the lowest monthly total of However, YTD it remains up 48% but down 21% YoY. The broker bilateral market share gains from March were undone, dropping 16% back to 69%. Looking at Euro Power, despite German Power declining 3% YoY the commodity group advanced volumes 5% YoY. Italian and French Power providing the majority of the growth up 62% and 26% respectively. Broker cleared made market share gains in five of the eight European markets, Spanish Power the most notable with an 11% increase MoM at the expense of broker bilateral. Coal continues with lower YTD volumes with all three commodities in the group down double digits YTD and the group collectively down 18%. The only shimmer of growth was API2, up 5% YoY. The cleared market battle between ICE and CME was flat vs. March as ICE retained 76% of the cleared market with CME holding the remaining 24%. Emissions were the only group to increase MoM, with a 1% growth. It continues to be a strong performer in 2018 with April 2018 volumes for EUA the second highest on record at 953 tonnes (since Jan 11). These gains came from broker bilateral volumes rising to the highest figure seen since records began (496 tonnes) and increasing EUA broker bilateral market share MoM from 1% to 17%, primarily at the cost of broker cleared. From May 2018 we shall be including OMIE Spot Spanish Power data. Growth Current Month Market Share Exchange volume Growth Metric Broker Broker Exchange Bilateral Cleared Executed Auction Continuous Total Gas TWh NBP 3% MoM 41% 11% 48% TTF 25% MoM 72% 10% 18% NCG 35% MoM 85% 0% 15% Gaspool 34% MoM 85% 0% 15% France Hubs 72% MoM 69% 0% 31% Austria VTP 27% MoM 73% 1% 26% PSV 29% MoM 98% 1% 1% ZEE 35% MoM 100% 0% 0% Power TWh UK Power 11% MoM 81% 0% 19% German Power 2% MoM 68% 12% 20% French Power 14% MoM 57% 18% 25% Nordic Power 13% MoM 0% 41% 59% Italian Power 6% MoM 14% 72% 14% Spanish Power 11% MoM 24% 67% 9% CEE Power 6% MoM 41% 11% 48% Dutch Power 8% MoM 55% 14% 31% Belgian Power 17% MoM 57% 3% 40% Coal MMT API2 11% MoM 0% 60% 40% API 4 1% MoM 0% 84% 16% gc NEWC 17% MoM 1% 81% 18% Emissions MMT EUA 1% MoM 17% 31% 52% CER 28% MoM 0% 0% 100%


4 European Energy Markets Composition: Broker Bilateral, Broker Cleared and Exchange Execution Note: Data sources on page 11. Table 1: Key Term Definitions Term Definition Calculation Broker Bilateral Total volume executed at a broker and settled bilaterally, without the involvement of a clearinghouse LEBA published total volume minus LEBA published cleared volume Broker Cleared Total volume executed at a broker or off exchange and given up for clearing to a clearinghouse Aggregated clearinghouse reported broker cleared volume Exchange Execution Total volume executed directly on exchange and cleared with the relevant clearinghouse Aggregated exchange reported executed volume Cleared Market Total volume cleared at a clearinghouse Broker cleared plus exchange execution Total Execution Total executed volume, at a broker or an exchange Broker bilateral plus broker cleared plus exchange executed 2

 UK Gas 3% 9% 17% Euro Power 2% 5% 3% Euro Gas 28% 22% 17% UK Power")

5 European Energy Markets Composition: YTD Trends Table 2: Volume Traded Change Commodity Class MoM YoY YTD Term Definition Emissions 1% 95% 47% Coal 7% 2% 18% MoM Current month volume versus previous month volume (e.g. October 2012 vs. September 2012) UK Gas 3% 9% 17% Euro Power 2% 5% 3% Euro Gas 28% 22% 17% UK Power 11% 17% 18% Note: Data sources on page 11. YoY YTD Current month volume versus same month last year volume Total volume YTD 2014 versus total volume YTD 2013 (e.g., Jan Oct 2014 vs. Jan Oct 2013) 3
: Commodity Class Volume Unit")


6 European Energy Markets Composition: Total Euro Commodity Market Volumes (Monthly Contract Equivalents* 000 s) Note: Data sources on page 11. *Monthly Contract Equivalents calculated as total volume divided by a standard monthly contract lot size (30 day month): Commodity Class Volume Unit Standard Monthly Contract Lot Size Monthly Contract Equivalent Calculation Emissions Metric tonnes 1,000 tonnes Total volume in metric tonnes divided by 1,000 tonne Coal Metric tonnes 1,000 tonnes Total volume in metric tonnes divided by 1,000 tonne UK Gas Therms / MWh 30,000 therms / 879 MWh Total volume in MWh divided by 879 MWh Euro Power MWh 720 MWh Total volume in MWH divided by 720 MWh UK Power MWh 720 MWh Total volume in MWH divided by 720 MWh Euro Gas MWh 720 MWh Total volume in MWH divided by 720 MWh Monthly Contract Equivalents allow us to compare trading volumes across commodity classes that are traded in different volume units. 4


7 European Energy Markets Composition: Total Euro Commodity Market Volumes (Monthly Contract Equivalents* 000 s) Note: Data sources on page 11. *Monthly Contract Equivalents calculated as total volume divided by a standard monthly contract lot size (30 day month): 5

8 European Energy Markets Composition: Rebased Price Trends over Time All prices are Front Month, except EUAs, which are Front Vintage. Prices rebased 24 Months previous Note: Data sources on page 11. 6


9 Gas Hub Evolution NBP, TTF & Other Gas Chart Other Gas Chart 7


10 Broker Bilateral / Broker Cleared / Exchange Executed chart Price Indexation Chart 8


11 Power Market Evolution German Power & Other Power Chart Other Power Chart 9

12 Broker Bilateral / Broker Cleared / Exchange Executed chart Price Indexation Chart 10
13 Data Sources OTC brokers data LEBA Exchange data APX ENDEX Borsa Italiana S.p.A. CME EEX ICE NASDAQ OMX BMEClearing OMIP CEGH Nord Pool Spot PolPx GME Bluenext Clearing house data LCH Data source Jan 2011 Oct 2013, TTF futures data only; source no longer available Terms of use of PolPX data are available on Data source Jan 2011 Nov 2012; source no longer available 11
Trayport Euro Commodities Report
 Trayport Euro Commodities Report Trayport Analysis Team July 2017 Legal disclaimer DISCLAIMER The content may not be copied, reprinted, published, transmitted, transferred, disseminated or distributed
Trayport Euro Commodities Report
 Trayport Euro Commodities Report Trayport Analysis Team February 2017 Legal disclaimer DISCLAIMER The content may not be copied, reprinted, published, transmitted, transferred, disseminated or distributed
Trayport Euro Commodities Market Dynamics Report
 Trayport Euro Commodities Market Dynamics Report Trayport Analysis Team October 2014 Legal disclaimer DISCLAIMER The content may not be copied, reprinted, published, transmitted, transferred, disseminated
Trayport Euro Commodities Market Dynamics Report
 Trayport Euro Commodities Market Dynamics Report Trayport Analysis Team March 2015 Legal disclaimer DISCLAIMER The content may not be copied, reprinted, published, transmitted, transferred, disseminated
Trayport Euro Commodities Market Dynamics Report
 Trayport Euro Commodities Market Dynamics Report Trayport Analysis Team December 2014 Legal disclaimer DISCLAIMER The content may not be copied, reprinted, published, transmitted, transferred, disseminated
Market report January Power - Certificates - Coal
 Market report January 2008 - Power - Certificates - Coal Disclaimer: This document is published by RWE Trading GmbH for information purposes only. It was not written or compiled with the intention that
Market report December 2007
 Market report December 2007 - Power - Certificates - Coal Disclaimer: This document is published by RWE Trading GmbH for information purposes only. It was not written or compiled with the intention that
Powernext Derivatives - Market Notices - September 28 th 2018
 Powernext Derivatives - Market Notices - September 28 th 2018 CONTENTS TABLE OF MARKET NOTICES... 2 POWERNEXT DERIVATIVES MARKET NOTICES... 7 APPLICATION DOCUMENTS... 8 PRICE COMMITTEE... 9 RULES OF CONDUCT
EoD XLS Market Results Interface Specification
 EoD XLS Market Results Interface Specification EEX Info-Products 08.08.2018 Leipzig Ref. 27 Table of s 1. Document History 7 2. List of Abbreviations 9 3. Management Overview 11 4. Definitions 12 4.1 General
16 th edition of this popular report
 European European Power Power Trading Trading 2017 2017 16 th edition of this popular report This document includes a report summary, a table of contents, report format and price information, and an order
MARKET REPORT. December 2010
 December 21 MARKET REPORT Highlights physical markets December 21: POWER: Nord Pool Spot market share of Nordic consumption was 73.4 per cent in December. The total Nordic preliminary consumption for December
Correlation between Carbon and Energy Markets Workshop HEC Energy & Finance Chair
 Correlation between Carbon and Energy Markets Workshop HEC Energy & Finance Chair January 2012 Franck Schuttelaar, GDF SUEZ Trading Agenda 1 Carbon market players 2 3 Fundamental drivers, switching Correlation
Position paper on the further development of the German gas market areas in the light of the Gas Target Model II
 Position paper on the further development of the German gas market areas in the light of the Gas Target Model II Leipzig/Paris, 22 nd of November 2016 Introduction The PEGAS platform, operated by the French
MARKET REPORT. August 2011
 ust MARKET REPORT Highlights physical markets ust : POWER: Nord Pool Spot market share of Nordic consumption was 72.6 per cent in ust. The total Nordic preliminary consumption for ust was 26.8 TWh compared
Introduction to Trayport
 Introduction to Trayport Tokyo Power Market Seminar 2018 Richard Everett Head of Product and Markets 14 June 2018 TRAYPORT TRAYPORT WHAT WE DO Trayport is a software, networks and connectivity company
Design of the gas hubs & exchanges and evolution on the example of the Central European Gas Hub
 Design of the gas hubs & exchanges and evolution on the example of the Central European Gas Hub Stefan PHILIPP Dipl.-Wirt.-ing. (FH) Central European Gas Hub AG This presentation including its content
PEGAS Trader Workshop Germany Market Developments and Product Initiatives
 PEGAS Trader Workshop Germany Market Developments and Product Initiatives Roman Zyuzev, Sirko Beidatsch 16/11/217, Berlin Legal disclaimer This presentation does not provide or substitute legal advice.
Argus White Paper: Are transactional indexes appropriate for European gas and electricity markets?
 Argus White Paper: Are transactional indexes appropriate for European gas and electricity markets? Contents: Executive Summary 2 Price benchmarks for physical OTC gas and electricity 2 Problems with transactional
Exchange Trading and Clearing Key Elements of a Liquid Energy Market
 Exchange Trading and Clearing Key Elements of a Liquid Energy Market Argus Turkish Power and Gas Trading, 8 th May 2013, Istanbul Dr.-Ing. Dr. Tobias Paulun, Managing Director Exchange, EEX AG European
Central European Gas Hub
 Central European Gas Hub 12 th CEGH Feedback Workshop Vienna, 30 June 2016 1 1 12 th CEGH Feedback Workshop Agenda Welcome, Opening Words Update CEGH OTC Market Update CEGH Gas Exchange AT, CZ CEGH Powernext
CO 2 Markets. Maria Mansanet Bataller
 CO 2 Markets Maria Mansanet Bataller Motivation Climate Change Importance Increasingly Kyoto Protocol: International Response to Climate Change Flexibility Mechanisms EMISSIONS TRADING CARBON MARKETS The
Nord Pool the Nordic power exchange GROUP MARKET REPORT
 Nord Pool the Nordic power exchange GROUP MARKET REPORT Highlights physical markets : POWER: Nord Pool Spot market share of Nordic consumption was 74.3 per cent in. Volumes traded were 18.5 TWh in compared
Trading at French PEGs. EFET workshop on Spanish Gas Hub - 23 July 2008
 Trading at French PEGs EFET workshop on Spanish Gas Hub - 23 July 2008 Agenda GRTgaz project for the French market At the heart of the European market How can TSOs make a difference? The Basics Latest
GROUP MARKET REPORT. CARBON: Volume EUAs and CERs 9.3 million tonnes in October and million tonnes YTD
 October 28 GROUP MARKET REPORT Highlights physical markets: POWER: Volume Elspot 24.5 in October and 242.8 TWh YTD Volume Elbas 224.1 GWh in October and 1 44.7 GWh YTD The exchange's market share in October
Continental Gas Snapshot Methodology
 Continental Gas Snapshot Methodology ESGM Price Assessments - General Definitions 01 Heren Volatility Index 04 The Heren Index - General Definition 04 ESGM Trades Tables - General and Country-specific
European Federation of Energy Traders. European Gas Hub Development
 European Federation of Energy Traders European Gas Hub Development 1 Disclaimer The results here are based on the views of EFET members, exercising all reasonable care to determine the best practice model
Nordic Market Report
 Nordic Market Report Status as of May 8 th, 17 1. SUMMARY The average spot price in April was 29.2 /MWh, down 1.2 /MWh from March and up 7.1 /MWh year-onyear. The average price in April in the period 1993
Functioning of European Gas Wholesale Markets
 Functioning of European Gas Wholesale Markets Quantitative Study Vienna, July 2014 Dr. Albrecht Wagner Wagner, Elbling & Company Management Advisors Seilerstätte 18-20, 3. OG A-1010 Wien office: +43 664-849
MIBEL MONTHLY INFORMATION NOVEMBER Board of Regulators
 MIBEL MONTHLY INFORMATION NOVEMBER 213 Board of Regulators HIGHLIGHTS OF THE MONTH November 213 The arithmetic mean price of the month was 41,81 /MWh in the Spanish bidding area and 42,1 /MWh in the Portuguese
Auctioning German Auctioning of Emission Allowances Periodical Report: Annual Report 2016
 Auctioning German Auctioning of Emission Allowances Impressum Publisher German Emissions Trading Authority (DEHSt) at the German Environment Agency Bismarckplatz 1 D-14193 Berlin Phone: +49 (0) 30 89 03-50
Corporate Overview. Oil. FEOP (Far East Oil Price) Index FMC (Forward Market Curve) OMR (Oil Market Report)
 Index FMC (Forward Market Curve) OMR (Oil Market Report)") Genic DataHub facilitates the organisation and consolidation of fragmented data sources that exist in the marketplace. Data includes Oil, Natural Gas, Power, Emissions, Coal, Freight, Petrochemicals, Financials,
Genic DataHub facilitates the organisation and consolidation of fragmented data sources that exist in the marketplace. Data includes Oil, Natural Gas, Power, Emissions, Coal, Freight, Petrochemicals, Financials,
One Clear Connection to Commodities. European Commodity Clearing clearing and settlement of energy and commodity products
 One Clear Connection to Commodities European Commodity Clearing clearing and settlement of energy and commodity products What actually is clearing? Clearing assures the proper fulfilment of each contract
Trading Appendix 7 / Clearing Appendix 7. Fee List. Commodity Derivatives. Issued by Nasdaq Oslo ASA and Nasdaq Clearing AB
 Trading Appendix 7 / Clearing Appendix 7 Fee List Commodity Derivatives Issued by Nasdaq Oslo ASA and Nasdaq Clearing AB Effective date: 8 26 May June 2017 FEE LIST 1 GENERAL The Fee List is valid for
ICE Futures Implied Prices
 ICE Futures Implied Prices ICE Futures has expanded implied pricing capability for each of its Futures contracts. The platform fully implies prices much farther out the curve. It broadcasts implied prices
MARKET REPORT. March 2012
 ch 212 MARKET REPORT Highlights physical ch 212: POWER: Nord Pool Spot market share of Nordic consumption was 72.1% in ch. The total Nordic preliminary consumption for ch was 34.8 TWh compared to 38.3
Contract Specifications
 Contract Specifications The English version is for informal use only. The German version is legally binding. 07.06.2018 Leipzig Release 0061a Table of Contents A. Subject of the Contract and Underlying
MIBEL MONTHLY INFORMATION OCTOBER Board of Regulators
 MIBEL MONTHLY INFORMATION OCTOBER 213 Board of Regulators HIGHLIGHTS OF THE MONTH October 213 The arithmetic mean price of the month was 51,5 /MWh in the Spanish bidding area and 51,59 /MWh in the Portuguese
Connecting European Energy Markets. Warsaw Power Ring, 5th December 2007 Maik Neubauer, COO - European Energy Exchange
 Connecting European Energy Markets Warsaw Power Ring, 5th December 2007 Maik Neubauer, COO - European Energy Exchange 1 Agenda 1 Introduction to EEX 2 The European Energy Market 3 Market coupling in practice
Contract Specifications
 Trading Appendix 2 / Clearing Appendix 2 Contract Specifications Commodity Derivatives Issued by Nasdaq Oslo ASA and Nasdaq Clearing AB Effective Date: Day27021 MonthJuneNovember 2016 INDEX PART A General
Gas Exchange in France. EFET Workshop Madrid 23rd July 2008
 Gas Exchange in France EFET Workshop Madrid 23rd July 2008 1 Outline Steps to the Project Powernext Balancing GRTgaz New liquidity factors Comparaison with the other markets Expectation of the market players
MIBEL MONTHLY INFORMATION OCTOBER Board of Regulators
 MIBEL MONTHLY INFORMATION OCTOBER 215 Board of Regulators HIGHLIGHTS OF THE MONTH October215 The arithmetic mean price of the month was 49,9 /MWh in the Spanish bidding area and 49,89 /MWh in the Portuguese
ECC PRICE LIST Leipzig. Document Release: 037. The English version is for informal use only and is not legally binding.
 ECC PRICE LIST 02.07.2018 Leipzig Document Release: 037 The English version is for informal use only and is not legally binding. Table of contents 1. General Regulations 4 1.1 Definition of Terms 4 1.1.1
Trading Appendix 7 / Clearing Appendix 7. Fee List. Commodity Derivatives. Issued by Nasdaq Oslo ASA and Nasdaq Clearing AB
 Trading Appendix 7 / Clearing Appendix 7 Fee List Commodity Derivatives Issued by Nasdaq Oslo ASA and Nasdaq Clearing AB Effective date: 11 June 2018 FEE LIST 1 GENERAL The Fee List is valid for Exchange
MARKET REPORT. January 2012
 uary 212 MARKET REPORT Highlights physical uary 212: POWER: Nord Pool Spot market share of Nordic consumption was 72.9% in uary. The total Nordic preliminary consumption for uary was 39.8 TWh compared
Gaspoint Nordic A/S. Nordic Gas Exchange. Introduction to the. Updated 1 st quarter 2015
 Gaspoint Nordic A/S Introduction to the Nordic Gas Exchange Updated 1 st quarter 2015 Introducing Gaspoint Nordic Company Background Established in 2008, first trade March 4th Strong ownership - With effect
Financial Statements Fortum Corporation 2 February 2017
 Financial Statements 2016 Fortum Corporation 2 February 2017 Disclaimer This presentation does not constitute an invitation to underwrite, subscribe for, or otherwise acquire or dispose of any Fortum shares.
Fortum Corporation Interim report January June July 2014
 Fortum Corporation Interim report January June 2014 18 July 2014 Disclaimer This presentation does not constitute an invitation to underwrite, subscribe for, or otherwise acquire or dispose of any Fortum
Auditor's report. Our audit has not led to any reservations
 Auditor's report We have audited the financial statements, comprising the balance sheet, the income statement and the notes to the financial statements, together with the bookkeeping system, and the management
Fee List. Trading Appendix 7 / Clearing Appendix 7. Commodity Derivatives. Issued by Nasdaq Oslo ASA and Nasdaq Clearing AB
 Trading Appendix 7 / Clearing Appendix 7 Fee List Commodity Derivatives Issued by Nasdaq Oslo ASA and Nasdaq Clearing AB Effective date: 16 2 JanuaryOctober 20187 FEE LIST 1 GENERAL The Fee List is valid
C E gi a gi af, ece OXPS a, a 2 T d 12.
 - 07 8 5 F12 8 8 53 7 C E -1 -.3-1gi a gi af, ece OXPS a, a2 T d12. 1. 2, 2 406 42g A2, 2 43 ),2,2( r npcz ByPʼm 114.2E a kf lsc du np ci ʻo P Bnp Ce P Cnp d Xe Z t 3B B 1) 3 B 43 3 B nc g g3 r r8 1) Bg
ECC PRICE LIST Leipzig. Document Release: 031. The English version is for informal use only and is not legally binding.
 ECC PRICE LIST 03.01.2018 Leipzig Document Release: 031 The English version is for informal use only and is not legally binding. Table of contents 1. General Regulations 4 1.1 Definition of Terms 4 Annual
MARKET REPORT. April Highlights physical April 2012:
 il 212 Highlights physical il 212: MARKET REPORT POWER: Nord Pool Spot market share of Nordic consumption was 72.7% in il. The total Nordic preliminary consumption for il was 31.6 TWh compared to 34.8
once per trading day. The time of day that the NAV is struck depends on the underlying asset or index that the ETP tracks.
 1 30 November 2018 Following recent volatility in the natural gas futures market, and with our constant focus on investors education, we thought it would be opportune to summarise some relevant key points.
MIBEL MONTHLY INFORMATION AUGUST Board of Regulators
 MIBEL MONTHLY INFORMATION AUGUST 213 Board of Regulators HIGHLIGHTS OF THE MONTH August 213 The arithmetic mean price of the month was 48,9 /MWh in the Spanish bidding area and 48,12 /MWh in the Portuguese
MIBEL MONTHLY INFORMATION JULY Board of Regulators
 MIBEL MONTHLY INFORMATION JULY 213 Board of Regulators HIGHLIGHTS OF THE MONTH July 213 The arithmetic mean price of the month was 51,16 /MWh in the Spanish bidding area and 51,4 /MWh in the Portuguese
European & Global Hub Markets:
 PatrickHeatherConsultancy European & Global Hub Markets: What does the future hold for hubs in the spot-priced gas market? Gas and LNG Supply Contracts Forum Berlin, 21 st June, 2018 The contents of this
11 May Energy Coal
 11 May 217 Energy Coal Energy coal: dislocation from fundamentals Size of the Asia Pacific market 2 Energy Coal Market Volumes by Basin (Million Tonnes) 1, 9 8 7 6 5 4 3 2 1 The Asia-Pacific market is
European traded gas hubs:
 PatrickHeatherConsultancy European traded gas hubs: Latest developments and underlying trends EMART Energy conference - gas trading stream Amsterdam, 4 th October, 2017 The contents of this presentation
Rule 17 of the Rulebook expressly provides Griffin with the power to monitor participants open interest positions in commodity derivatives.
 Griffin Markets Limited Position management controls MIC: GRIF (Operating MIC)/GRIO (Segment MIC) Competent authority: FCA 1. Powers that the trading venue has to monitor the open interest positions of
Fortum's energy market review Keilaniemi 27 May 2009
 Fortum's energy market review Keilaniemi 27 May 9 Lotta Forssell Vice President, Communication Fortum Portfolio Management and Trading Timo Liiri Customer Manager Fortum Markets 27/5/9 1 Background of
Nord Pool the Nordic power exchange GROUP MARKET REPORT
 August 28 Nord Pool the Nordic power exchange GROUP MARKET REPORT Highlights physical markets: POWER: Volume Elspot 2.7 TWh in August and 196.2 TWh YTD Volume Elbas 15.3 GWh in August and YTD 1 69.6 GWh
Directed Contract Subscription Guidelines AIP-SEM
 Directed Contract Subscription Guidelines AIP-SEM-07-145 10 th May 2007 Table of Contents 1 Introduction...1 2 Dates for Directed Contract Subscriptions...1 3 Execution of Master Agreement...1 4 Supplier
Vattenfall Q3 and 9M 2012 results
 Vattenfall Q3 and 9M 2012 results Øystein Løseth, CEO and Ingrid Bonde, CFO Conference Call, 30 October 2012 Q3 Highlights (1) Underlying operating profit SEK 1.3 bn below last year - 12% higher production
Info Workshop Central European Gas Hub. General Presentation of ECC
 Info Workshop Central European Gas Hub General Presentation of ECC Vienna, 6 th November 2012 AGENDA 1. About ECC 2. Clearing Process - Spot market 3. Connectivity, Software and Reporting 4. Risk Management
European Commodity Clearing. one clear connection
 European Commodity Clearing one clear connection European Commodity Clearing one clear connection to commodity markets to an international network of partners to safe business to ECC European Commodity
Market News. IETA/IEA/EPRI Workshop Paris, September 22, Andrei Marcu, CEO, BlueNext
 Market News IETA/IEA/EPRI Workshop Paris, September 22, 2008 Andrei Marcu, CEO, BlueNext What is BlueNext? since 2005 Powernext Carbon 2008 BlueNext SA BlueNext is the environmental exchange with global
Price Coupling of Regions PCR
 Supported by Europex Price Coupling of Regions PCR June 2010 Florence Forum Development of the Price Coupling of Regions (PCR) Initiative Markets initially included in PCR - 2860 TWh Markets which showed
European Spot Gas Markets Methodology. Methodology last updated: 3 November 2015
 European Spot Gas Markets Methodology Methodology last updated: 3 November 2015 Date of last formal methodology consultation: 16 February 2015 Expiry date for this methodology: 16 February 2017 List of
Nord Pool the Nordic power exchange GROUP MARKET REPORT. TWh
 November Nord Pool the Nordic power exchange GROUP MARKET REPORT Physical market Nord Pool Spot AS Turnover in the physical market in November was 26.7 (1 TWh = 1 billion KWh). This was an increase of
Nord Pool the Nordic power exchange GROUP MARKET REPORT. TWh
 Augus t 27 Nord Pool the Nordic power exchange GROUP MARKET REPORT Physical market Nord Pool Spot AS Turnover in the physical market in August was 21. TWh (1 TWh = 1 billion KWh). This was an increase
2 September Agency for the Cooperation of Energy Regulators Trg republike Ljubljana Slovenia. Public Consultation Paper.
 2 September 2014 Agency for the Cooperation of Energy Regulators Trg republike 3 1000 Ljubljana Slovenia Re: ICE Trade Vault Europe Limited s Response to the REMIT Transaction Reporting User Manual Public
GásNatural UmMercado emmovimento
 GásNatural UmMercado emmovimento AGN. Lisboa November 2018 1 TheEvolution Data fromjanuary1st October31th 2018 THE IBERIAN ORGANIZED GAS MARKET REGISTERED AND ACTIVE PARTICIPANTS Data fromjanuary1st October31th
At the Centre of European Energy Trading
 At the Centre of European Energy Trading connecting markets EEX the one-stop shop for energy trading and clearing Products & Services 236 24 trading participants from countries 1 USA 2 Finland 5 Norway
Nord Pool the Nordic power exchange GROUP MARKET REPORT
 April 28 Nord Pool the Nordic power exchange GROUP MARKET REPORT Highlights physical markets: POWER: Volume Elspot 25 TWh in April and 11.5 TWh YTD. Volume Elbas 96.5 GWh in April and YTD 442.2 GWh. The
Nord Pool the Nordic power exchange GROUP MARKET REPORT
 Nord Pool the Nordic power exchange GROUP MARKET REPORT Highlights physical markets: POWER: Volume Elbas 114.5 GWh in and YTD 345.7 GWh Volume Elspot 28.3 TWh in and 85.5 TWh YTD The exchange's market
Auctioning German Auctioning of Emission Allowances Periodical Report: Annual Report 2015
 Auctioning German Auctioning of Emission Allowances Impressum Publisher German Emissions Trading Authority (DEHSt) at the German Environment Agency Bismarckplatz 1 D-14193 Berlin Phone: +49 (0) 30 89 03-50
CONTENTS CONTRACT SPECIFICATIONS FOR INSTRUMENTS FO WHICH THE CO-OPERATING EXCHANGE IS THE PRIMARY EXCHANGE
 CONTENTS 3A CONTRACT SPECIFICATIONS FOR INSTRUMENTS FO WHICH THE CO-OPERATING EXCHANGE IS THE PRIMARY EXCHANGE Part A 3A.1 Application... 4 3.A2 Determination of Contract Base Fix... 4 3A.3 Contract Events...
Commerzbank Energy & Carbon Seminar
 Commerzbank Energy & Carbon Seminar Trends, challenges and outlook for the energy and carbon markets in 2016 marketing material for information purposes only Ingo Ramming A 5 bet on Leicester City winning
Gaspoint Nordic A/S. Nordic Gas Exchange. Introduction to the. Updated Q1 2016
 Gaspoint Nordic A/S Introduction to the Nordic Gas Exchange Updated Q1 2016 Introducing Gaspoint Nordic The slide package contain info on the following topics Introduction to the Nordic Gas Exchange slides
ICE WESTERN BARLEY OVERVIEW OF CHANGES
 ICE WESTERN BARLEY IntercontinentalExchange (ICE ) began offering risk management and trading for the grain markets through its acquisition of the Winnipeg Commodity Exchange (WCE) in September 2007. Today,
Hedging prices and spot prices 1
 Introduction In Appendix 1, you ll find slides giving examples of how the Closing Prices for financial contracts can change during the contracts trading period. In appendix 2, you ll find a list of the
Contract Specifications
 Trading Appendix 2 / Clearing Appendix 2 Contract Specifications Commodity Derivatives Issued by Nasdaq Oslo ASA and Nasdaq Clearing AB Effective Date: 16 October 2017 INDEX PART A General Provisions...
Interim Report January-March Fortum Corporation 26 April 2018
 Interim Report January-March 2018 Fortum Corporation 26 April 2018 Strong performance in Q1 2018 Increased wholesale power prices in the Nordics Cold weather in February and March Lower than normal precipitation
February 2008 TWh Spot turnover monthly EUR/MWh Average system price/month
 February Nord Pool the Nordic power exchange GROUP MARKET REPORT Physical market Nord Pool Spot AS Turnover in the physical market in February was 27.6 TWh (1 TWh = 1 billion KWh). This was a decrease
Price report Index. Daily Market. MIBEL: Energy, economic volume and technologies. Intraday Market. Settlement of the Daily and Intraday Market
 Price report 217 Index. Price report 217 1. MIBEL: Energy, economic volume and technologies pag. 2 2. Daily Market pag. 7 3. Intraday Market pag. 12 4. Settlement of the Daily and Intraday Market pag.
Wholesale markets for electricity : The point of view of a trader
 Wholesale markets for electricity : The point of view of a trader Francis HERVÉ (Chief Executive Officer) Philippe GIRARD (Senior Advisor) Vincent MAILLARD (Head of Analytics) EDF TRADING Limited 1 CONTENTS
Liquidity Anders Plejdrup Houmøller CEO, Houmoller Consulting
 Liquidity Anders Plejdrup Houmøller CEO, Houmoller Consulting At the three following slides, for EEX and Nasdaq OMX, the blue and the green curves illustrate the cleared volume: (contracts traded off-exchange
Electricity market and gas market on the Polish Power Exchange in May 2013
 Warsaw, 7 June 2013 Electricity market and gas market on the Polish Power Exchange in May 2013 Press Release The volume of trade in electricity in May totalled 11,592 TWh, which corresponds to YoY growth
INTERIM FINANCIAL REPORT FIRST NINE MONTHS 2013
 INTERIM FINANCIAL REPORT FIRST NINE MONTHS 2013 Moving Energy Forward 23 October 2013 Disclaimer Certain statements in this presentation are based on the beliefs of our management as well as assumptions
Markit Commodities Pricing Data
 4th Floor tel +44 7260 2000 Ropemaker Place fax +44 7260 2001 25 Ropemaker Street www.ihsmarkit.com London EC2Y 9LY United Kingdom Highlights World Coal Coal prices continued to increase for the third
Hub Score NBP. 2 Fully firm through OTD market 2 2. TSO Credit arrangements non punitive Previously instituted, no longer required
 Analysis Hub Score NBP Responsible party What should be done guideline for assessment Score 24 Comments 24 Score 25 Comments 25 Score 26 Comments 26 UNC governance, transmission workstreams if set up and
Fortum Corporation Interim report January-March April 2010
 Fortum Corporation Interim report January-March 21 27 April 21 Disclaimer This presentation does not constitute an invitation to underwrite, subscribe for, or otherwise acquire or dispose of any Fortum
Genium INET Market Model
 Genium INET Market Model Nasdaq Commodities Europe Version 3.7 Valid from July 7, 2017 1(43) Table of Contents 1 Introduction... 8 2 Overview of the commodity markets... 9 2.1 Market structure... 9 2.1.1
Nord Pool the Nordic power exchange GROUP MARKET REPORT
 May 28 Nord Pool the Nordic power exchange GROUP MARKET REPORT Highlights physical markets: POWER: Volume Elspot 23.4 TWh in May and 133.9 TWh YTD. Volume Elbas 161.4 GWh in May and YTD 63.6 GWh. The exchange's
Vattenfall Q results
 Vattenfall Q1 2012 results Øystein Løseth, CEO and Peter Smink, acting CFO Press Conference, 3 May 2012 Successful first quarter continued consolidation Vattenfall continues to deliver on its strategy:
Ukrainian Energy Exchange
 Ukrainian Energy Exchange Development of the Ukrainian Energy Exchange for gas trading according to European standards www.ueex.com.ua Ukrainian Energy Forum 2018, Kyiv, Ukraine Ukrainian Energy Exchange
Consolidated Management Report
 EEX Group Annual 2017 40 Brand Guest Contribution Corporate for the 2017 Financial Year 41 41 45 47 47 47 51 59 61 63 63 64 1. Basics regarding the Group Business activities and group structure Strategy
Chart Collection for Morning Briefing
 Chart Collection for Morning Briefing April 3, 212 Dr. Edward Yardeni 516-972-7683 eyardeni@ Please visit our sites at www. blog. thinking outside the box Figure 1. SPANISH CREDIT INSTITUTIONS * EXPOSURE
WARSAW STOCK EXCHANGE
 WARSAW STOCK EXCHANGE THE MARKET DRIVEN BY INFORMATION WARSAW, 4 DECEMBER 2013-1- Table of contents Introduction WSE business lines and its internationalization Financial highlights Here and beyond the
Interim report January-September Fortum Corporation 22 October 2015
 Interim report January-September 2015 Fortum Corporation 22 October 2015 Disclaimer This presentation does not constitute an invitation to underwrite, subscribe for, or otherwise acquire or dispose of