2015/16 ANNUAL REPORT
|
|
|
- Daniela Wilkinson
- 5 years ago
- Views:
Transcription


1 PHYSICAL ADDRESS Fidel Castro Building 55 Elizabeth Street Bloemfontein 9300 PR306/2016 ISBN: Title of Publications: Free State Department of Education Annual Report 2015/2016 DEPARTMENT OF EDUCATION FREE STATE DEPARTMENT OF EDUCATION FREE STATE Private Bag X20565 Bloemfontein /16 ANNUAL REPORT
2 1 DEPARTMENT OF EDUCATION PROVINCE OF FREE STATE VOTE NO. 6 ANNUAL REPORT 2015/2016 FINANCIAL YEAR
3 2 Table of contents: PART A: GENERAL INFORMATION 1. DEPARTMENT GENERAL INFORMATION 5 2. LIST OF ABBREVIATIONS/ACRONYMS 6 3. FOREWORD BY THE MINISTER/MEC 6 4. DEPUTY MINISTER STATEMENT (if applicable) REPORT OF THE ACCOUNTING OFFICER STATEMENT OF RESPONSIBILITY AND CONFIRMATION OF ACCURACY FOR ANNUAL REPORT STRATEGIC OVERVIEW Vision Mission Values LEGISLATIVE AND OTHER MANDATES ORGANISATIONAL STRUCTURE ENTITIES REPORTING TO THE MINISTER/MEC 19 PART B: PERFORMANCE INFORMATION 1. AUDITOR GENERAL S REPORT: PREDETERMINED OBJECTIVES OVERVIEW OF DEPARTMENTAL PERFORMANCE Service Delivery Environment Service Delivery Improvement Plan Organisational environment Key policy developments and legislative changes STRATEGIC OUTCOME ORIENTED GOALS PERFORMANCE INFORMATION BY PROGRAMME Programme 1: Administration Programme 2: Public Ordinary School Education TRANSFER PAYMENTS Transfer payments to public entities Transfer payments to all organisations other than public entities 85
4 3 6. CONDITIONAL GRANTS Conditional grants and earmarked funds paid Conditional grants and earmarked funds received DONOR FUNDS Donor Funds Received CAPITAL INVESTMENT Capital investment, maintenance and asset management plan 93 PART C: GOVERNANCE 1. INTRODUCTION RISK MANAGEMENT FRAUD AND CORRUPTION MINIMISING CONFLICT OF INTEREST CODE OF CONDUCT HEALTH SAFETY AND ENVIRONMENTAL ISSUES PORTFOLIO COMMITTEES SCOPA RESOLUTIONS PRIOR MODIFICATIONS TO AUDIT REPORTS INTERNAL CONTROL UNIT INTERNAL AUDIT AND AUDIT COMMITTEES AUDIT COMMITTEE REPORT 122 PART D: HUMAN RESOURCE MANAGEMENT 1. INTRODUCTION OVERVIEW OF HUMAN RESOURCES HUMAN RESOURCES OVERSIGHT STATISTICS 126 PART E: FINANCIAL INFORMATION 1. REPORT OF THE AUDITOR GENERAL ANNUAL FINANCIAL STATEMENTS 171
5 4 PART A: GENERAL INFORMATION
6 5 1. DEPARTMENT GENERAL INFORMATION PHYSICAL ADDRESS: Fidel Castro Building 55 Elizabeth Street BLOEMFONTEIN 9301 POSTAL ADDRESS: Private Bag X20565 BLOEMFONTEIN 9300 CONTACT DETAILS Office of the MEC Tel Fax: / mec@fseducation.gov.za Office of the HOD Tel /32 Fax: hod@fseducation.gov.za WEBSITE ADDRESS :
7 6 2. LIST OF ABBREVIATIONS/ACRONYMS AGSA ACE ANA AO BBBEE CAPS CFO CEM CEO CIPELT DTDC EFAL ELITS ERC FAL FSS ICT LOLT MEC HOD PFMA PME SDT TDC TR MTEF NSC NSNP PPP PSLA SACE SA-SAMS SGB SIAS SIP Auditor General of South Africa Advanced Certificate in Education Leadership Annual National Assessment Accounting Officer Broad Based Black Economic Empowerment Curriculum and Assessment Policy Statement Chief Financial Officer Council of Education Ministers Chief Executive Officer Certificate in Primary English Language Teaching District Teacher Development Centres English First Additional Language Education Libraries and Information Technology System Education Resource Centre First Additional Language Full Service Schools Information and Communications Technology Language of Learning and Teaching Member of Executive Council Head of Department Public Finance Management Act Performance Monitoring and Evaluation School Development Teams Teacher Development Centres Treasury Regulations Medium Term Expenditure Framework National Senior Certificate National School Nutritional Programme Public Private Partnership Provincial Strategy for Learner Attainment South African Council of Educators South African Schools Administration System School Governing Body Screening, Identification, Assessment and Support School Improvement Plan
8 7 SMME SCM EU SITA SDIP Small Medium and Micro Enterprises Supply Chain Management European Union State Information Technology Agency Service Delivery Improvement Plan

9 8 3. FOREWORD BY THE MEC PHI Makgoe Honourable MEC Education Since 2009 the Free State Department of Education has made remarkable strides towards transforming the education landscape and service delivery in the province. Our strategies have been driven by gaps and challenges that we had identified. As a sector we developed a plan, Action Plan to 2019: towards the realisation of schooling This long-term sector plan was boosted by the decision of the ruling party to make education a priority number of government. Some of the few achievements we can highlight include the following: There has been improvement in Matric results since We congratulate the class of 2013 for achieving 87.4% and number one position in the Country. The differentiated support provided by the department jointly with the districts made it possible for it to retain position three in the 2015 NSC examination, with a pass rate of 81.6% after the Western Cape and Gauteng. This passrate increased to 83,0% after remarking and supplementary examinations which were concluded during by March In the 2015 Academic Year, the department registered candidates for the NSC examinations which was an increase of from This was the highest enrolment in the history of the Department. The department had the highest percentage (28%) of progressed NSC candidates in the country with the 2 nd highest province being Limpopo and Nationally the figure stands at 12.7%. Our target for the 2016 academic year in the National Senior Certificate (NSC) is 90% pass rate and 40% bachelor passes. To ensure quality of ECD programme for 0-4 year-old children registered at ECD centres, the department has successfully piloted the National Curriculum Framework (NCF) at 50 ECD sites in Mangaung Metropolitan Municipality. In 2015/2016 we continued to open the doors of learning to all by awarding bursaries to deserving and needy young people of the province. By 2015 there were 6009 full-time bursary holders that are being maintained and paid for by the department. Currently more 7000 young people have been awarded the Free State Provincial Government Bursary Scheme. The Free State Department of Education in consultation with parents is continuously making sure that where schools cannot sustain learners due to low numbers, learners are moved to hostels near schools that are well resourced. In 2009 there were 12 hostels accommodating learners from farms. This number increased to 33 hostels at the beginning of 2016 accommodating learners. The project also increased from R20 million in 2009 to over R52 million in To ensure more equitable system, we will continue with our pro-poor policies. Schools in quintile 1, 2 and 3 receive substantial subsidies per learner for educational resources from the department. The no-fee policy has expanded access to education by children from poor communities. In addition, through National School Nutrition Programme (NSNP) we have ensured that our learners don t go classes on empty stomach. To date the department is feeding almost learners. This number has gone up from in The launch of Human Papilloma Virus (HPV) campaign at Gonyane Primary School in Bloemfontein in 2014 was very
10 9 pleasing. The aim of this noble initiative is to protect girls from getting cervical cancer caused by Huma Papilloma Virus. All grade 4 girls who are nine years and older now have an opportunity to receive the HPC vaccination at schools. The HPV vaccination campaign is part of the Integrated School Health Programme. We take this opportunity to thank the Department of Health for making the HPV Vaccination Programme a reality. Since 2009 the focus of the sector has been on teachers, text books and time as crucial levers of providing quality education and going forward we will continue to build on this in our efforts to move South Africa forward. Since 2012 we have made significant progress in the delivery of learning and teaching support materials (LTSM). In 2015/16 financial year R97.2 million was set aside for textbooks and stationery. As we conclude the Free State Department of Education pledges to be a high performance organisation. We urge all stakeholders in education to actively participate in the Quality Learning and Teaching Campaign (QLTC) structures, to deliver quality education to all our children. We appreciate and acknowledge the positive contribution of our dedicated teachers, teacher unions, principals associations, and school governing body associations, learner representative councils, civil society, parents, business sector and NGOs in working with us to improve the quality of education in our province. I hereby present the Annual Report for the Free State Department of Education for the 2015/16 financial year to the provincial Legislature. PHI Makgoe, MPL Free State Education MEC Date: 31 July 2016


11 10 4. DEPUTY MINISTER STATEMENT Not applicable 5. REPORT OF THE ACCOUNTING OFFICER Photo of Accounting Officer Education & Photo of Superintendent General Education Mr MNG Mahlatsi Accounting Officer: Education Mr RS Malope Superintendent General Education Overview of the operations of the Department The Department of Education experienced a challenging year in terms of financial resources during the year under review, but despite all the challenges the Department was able to deliver on some its mandates, including quality education. The department also ensured that all schools in quintile 1, 2 and 3 continued to be no fee schools. Overview of the financial results of the department: o Departmental receipts
12 11 Departmental receipts Sale of goods and services other than capital assets Fines, penalties and forfeits Interest, dividends and rent on Land Estimate 2015/ /15 Amount Collected (Over)/ Under Collection Estimate Amount Collected R 000 R 000 R 000 R 000 R 000 R Sale of Capital assets Financial transactions in assets and liabilities TOTAL (Over)/ Under Collection The Departmental tariff structure for the year under review was approved by the Provincial Treasury as required by Treasury Regulation The tariff policy is also reviewed on an annual basis as required. Selling of tender documents is an example of an annual tariff but is currently prescribed by Provincial Treasury. The Department also use national tariff structures of the Council for Quality Assurance in General and Further Education and Training (Umalusi) as recommended fee structure to raise revenue. The Department does not offer any free services which might yield significant revenue The Department over collected revenue by R447, of the adjustment budget during the year. The original budget of R was adjusted downwards by 5,59% or R1,138, to R19,206 million and this revised target was over achier by R447, There were no sales of capital assets.

13 12 Programme expenditure Programme 2 overspending is as a result of insufficient budget allocations for the Department. The overspending is mainly on compensation of employees. Virements / Roll Overs The final virement approval was granted by the CEO Provincial Treasury on 18 May 2015 for the 2015/2016 financial year. The main purpose of this virement was to reduce unauthorised expenditure. The Department shifted the maximum allowable 8% per programme. The following conditional grants received roll overs of unspent funds during the 2014/2015 financial year which were received in the 2015/2016 financial year: HIV/AIDS - R1.237 million National School Nutrition Programme - R3.712 million Education Infrastructure Grant - R million EPWP Integrated Grant for Infrastructure to Provinces R0.585 million Unauthorised Expenditure The financial statements reflect an opening balance of R887,429 million for the 2015/16 financial year. At the end of the 2015/16 financial year a total of R746,463 million were recorded as unauthorised expenditure for the year. The main contributing factor are insufficient budget allocations for compensation of employee payments. An amount of R298,066 million was subsequently charged against the vote in the 2015/16 financial year in terms of the Financial Act as expenditure against the departmental vote. This unauthorised expenditure is due to insufficient budget allocation to the department to sustain ongoing activities and to improve on service delivery. Details of unauthorised expenditure are disclosed in the notes to the annual financial statements. Fruitless and Wastefull Expenditure The financial statements reflect an opening balance of R3,195 million for the 2015/16 financial year. At the end of the 2015/16 financial year the closing balance amounted to R1,605 million. This is a net reduction of R1,590 million over the reporting period. Details of fruitless and wasteful expenditure are disclosed in the notes to the annual financial statements.
14 13 Future Plans of the department One of the major departmental focus points for the new financial year is to ensure that the Free State Province achiever the 90% Grade 12 pass rate with a 40% bachelors for the province. Special attention is also focused on progression of learners. Good governance and leadership remain critical, therefore additional measures will be implemented towards stabilizing the financial position of the department. Public Private Partnerships The Department did not have any Public Private Partnerships during the 2015/2016 financial year. Discontinued activities / activities to be discontinued No services were discontinued during 2015/2016 financial year. New or proposed activities No new or proposed activities were implemented by the Education Department during the year under review. Supply chain management Supply chain management processes and systems are in place to prevent irregular expenditure: Central Procurement Committee (CPC) meets weekly and no order may be placed/ service rendered without CPC approval Order and Payment checklists are completed with each request order and payment Monthly reporting on Irregular expenditure Financial Accounting Circular on Irregular expenditure National Treasury Circulars & Instruction Notes Financial and SCM Delegations Challenges experienced in supply chain management: 30 day payment is a challenge due to cash flow. Remedial action: BAS reports are attached to each request for procurement sent to the Central Procurement Committee Urgent requests results into limited time to do things properly. Officials for instance hear on a Thursday or Friday that they need to be in Pretoria on the Monday. No unsolicited bid proposals were concluded during 2015/2015 financial year Gifts and donations received in kind from non related parties The Department of Education did not make any donations during the 2015/2016 financial year. The Department of Education accepted donations during the 2015/2016 financial year. Details of all donations received in kind are provided in the Annexures to the annual financial statements.
15 14 Exemptions and deviations received from National Treasury No deviations or exemptions were requested or received from the National Treasury for the 2015/2016 financial year. Events after the reporting date: The financial statements were authorised for issue on 31 July 2016 by the Accounting Officer. On 28 June 2016, subsequent to the reporting date, the Free State Finance Management Amendment Act, no. 4 of 2016, was assented to. As a result of this an amount of R222,544 million was recorded as Unauthorised expenditure approved without funding. The financial statements were adjusted accordingly. No other events after the reporting date were identified by management that would affect the operations of the department or the results of those operations significantly. Other The Department of Education has re-stated amounts in the comparative figures as a direct result of the correction of the previous year s audit qualification matter in terms of expenditure classification. The total population of capital and goods & services expenditure were evaluated and corrected in order to properly address and clear the 2014/15 audit matters. Details of the restatements forms part of the annual financial statements. During the 2015/2016 financial year the Department of Education experienced serious challenges with regard to the availability of cash which was due to budget and other operational pressures (priorities and contractual obligations) facing the Department. It is important for the readers of the annual financial statements to take note of the fact that the Department started the financial year with outstanding cash transfers as well as commitments which immediately placed additional pressure on the availability of the cash for the new financial year. The Department had to follow a process of prioritisation for all payments including compensation of employees. The Department therefore closed the financial year once again with a large amount of accruals which will have an effect on the 2016/2017 financial year. Acknowledgement/s or Appreciation It is only due to joint efforts, hard work and dedication by all relevant roll payers and departmental staff that the department was able to deliver on its Constitutional mandate. Conclusion The Free State Department of Education is a dynamic department which adopt and implement strategies to ensure service delivery to improve teaching and learning and to serve the community of the Free State Province. Approval and sign off In our opinion, the information provided in the annual report including both the performance information and annual financial statements reflects the operations of the department for the financial year 2015/2016. Mr MNG Mahlatsi Mr RS Malope Accounting Officer Superintendent Department of Education Department of Education Date: 31 July 2016 Date: 31 July 2016
16 15 6. STATEMENT OF RESPONSIBILITY AND CONFIRMATION OF ACCURACY FOR THE ANNUAL REPORT To the best of our knowledge and belief, I confirm the following: All information and amounts disclosed throughout the annual report are consistent. The annual report is complete, accurate and is free from any omissions. The annual report has been prepared in accordance with the guidelines on the annual report as issued by National Treasury. The Annual Financial Statements (Part E) have been prepared in accordance with the modified cash standard and the relevant frameworks and guidelines issued by the National Treasury. The Accounting Officer is responsible for the preparation of the annual financial statements and for the judgements made in this information. The Accounting Officer is responsible for establishing, and implementing a system of internal control that has been designed to provide reasonable assurance as to the integrity and reliability of the performance information, the human resources information and the annual financial statements. The external auditors are engaged to express an independent opinion on the annual financial statements. In my opinion, the annual report fairly reflects the operations, the performance information, the human resources information and the financial affairs of the department for the financial year ended 31 March Yours faithfully Accounting Officer Education Superintendent General Education Mr MNG Mahlatsi Mr RS Malope Date: 31 July 2016 Date: 31 July 2016
17 16 7. STRATEGIC OVERVIEW 7.1 Vision To be a Department that strives to ensure progressive realization of universal schooling, improving quality of education and eliminating disparities amongst Free State citizens. 7.2 Mission To provide an education system that is free, compulsory, universal and equal for all children of the Free State Province. 7.3 Values Free from barriers to educational opportunities Universal access and completion Redress past imbalances Quality education for all Courteous and timely service Committed and accountable staff 8. LEGISLATIVE AND OTHER MANDATES The main Legislative Framework The following are the main legislative mandates under which Free State Department of Education operate: 8.1 The Constitution of the Republic of South Africa Act 108 of 1996 The Constitution which is the supreme law of the Country confers to everyone, in terms of Section 29, a right to education (including basic and further education), which the state, through reasonable measures, must make progressively available and accessible, receive education in the official language or languages of their choice in public educational institutions where that education is reasonably practicable, establish and maintain at one s expense independent educational institutions. 8.2 South African Schools Act (SASA) 84 of 1996 To provide a uniform system for the organisation, governance and funding of schools. It promotes access, quality and democratic governance in the schooling system. It ensures that all learners have the right of access to quality education without discrimination, and makes schooling compulsory for children aged seven (7) to fifteen (15) years or the ninth (9th) grade, whichever occurs first. It provides for two types of schools independent schools and public schools. The provision in the Act for democratic school governance through School Governing Bodies (SGB) is now in place in all public schools countrywide. The school funding norms, outlined in SASA, prioritise redress and target poverty with regard to the allocation of funds for the public schooling system. 8.3 Free State Schools Education Act 2 of 2000 This Act should be read with and subject to the South African Schools Act 84 of It addresses those issues which are peculiar to the Free State and are covered in the National Act. The Act further gives the MEC the authority to make regulations on any matter relating to education in the Province such as:
18 17 Regulations for discipline of learners in Public Schools, Provincial Notice 156 of 2001: It states which misconduct are considered to be serious enough to warrant expulsion of learners from Public Schools. It also regulates the procedure to be followed by the School Governing Body, the District Office and the Provincial Office when dealing with recommendations for expulsions and the time frames thereof. Regulations for financial records of Public Schools, Provincial Notice 154 of 2001: To ensure that all Public Schools have proper financial systems to handle and control their finances and the finances transferred to them by the Department and also to ensure accountability by the School Governing Body. Regulations for the examinations: Irregularities and the Examination Board, Provincial Notice 157 of 2001: The objective is to regulate the matters relating to the conducting of exams, to define the nature of examination irregularities by the Departmental officials and candidates, and also to establish the Provincial Examination Board and the Irregularities Committees. Code of Conduct for members of Governing Bodies of Public Schools, Provincial Notice 263 of Measures Relating to Election of School Governance Bodes of Special Schools for Learners with Special Needs Measures relating to the Election of School Governing Bodies of Ordinary Public Schools Measures relating to the Registration of Independent Schools Measures for SGB Councils and Principal Councils 8.4 The National Education Policy Act 27 of 1996 The purpose of the act is to provide for the determination of national policy for educators, including the determination of policy on salaries and conditions of employment of educators. It was designed to inscribe in law policies, as well as the legislative and monitoring responsibilities of the Minister of Education, and to formalise relations between national and provincial authorities. It laid the foundation for the establishment of the Council of Education Ministers (CEM), as well as the Heads of Education Committee. 8.5 Preferential Procurement Policy Framework Act 5 of 2000 The general conditions and procedures are subject to the Preferential Procurement Policy Framework Act, 2000 (Act No 5 of 2000), and the Preferential Procurement Regulations, 2001 and are applicable to all tenders, contracts and orders, unless otherwise decided by the Accounting Officer prior to the invitation of tenders. 8.6 Public Finance Management Act 1 of 1999 and its Regulations Public Finance Management Act, No 1 of 1999 (as amended by Act 29 of 1999), deals with funding and spending of the state monies. The Act promotes the objective of good financial management in order to maximize delivery through the efficient and effective use of limited resources. 8.7 Acts governing Human Resource Management The following Acts govern the relations with employees, conditions of service and appointment measures to eradicate injustices of the past regarding employment practices: Public Service Act (Proclamation No 103 of 1994) and its Regulations Employment of Educators Act, No 76 of 1998, Personnel Administrative measures (PAM)
19 18 Basic Conditions of Employment Act No 74 of 1997 Labour Relations Act No 66 of 1995 Employment Equity Act, Act no 55 of Skills Development Act 97 of 1998 The purpose of this Act is to provide an institutional framework to devise and implement national, sector and workplace strategies to develop and improve the skills of the South African workforce, to provide learnerships that lead to recognised occupational qualifications and regulate employment services. 8.9 Skills Development levies Act 9 of 1999 To provide for the imposition of the levy with regard to improvement of work force skills where every employer is obliged to pay a skills development levy at a certain rate of percentage of the leviable amount Occupational Health and Safety Act 85 of 1993 The Occupational Health and Safety Act, No 85 of 1993 provides for the health and safety of persons at work as well as the protection of persons other than persons at work against hazards to health and safety arising out of or in connection with the activities of persons at work Government Immovable Asset Management Act 19 of 2007 To provide for a uniform framework for the management of an immovable asset that is held or used by a national or provincial department; to ensure the coordination of the use of an immovable asset with the service delivery objectives of a national or provincial department; to provide for issuing of guidelines and minimum standards in respect of immovable asset management by a national or provincial department; and to provide for matters incidental thereto Free State Land Administration Act 1 of 1998 The objective is to provide for the acquisition and disposal of land by the Provincial Government and for matters incidental thereto.

20 19 9. ORGANISATIONAL STRUCTURE ENTITIES REPORTING TO THE MEC Not applicable.

21 20 PART B: PERFORMANCE INFORMATION
22 21 1. AUDITOR GENERAL S REPORT: PREDETERMINED OBJECTIVES The AGSA currently performs certain audit procedures on the performance information to provide reasonable assurance in the form of an audit conclusion. The audit conclusion on the performance against predetermined objectives is included in the report to management, with material findings being reported under the Predetermined Objectives heading in the Report on other legal and regulatory requirements section of the auditor s report. Refer to page 164 on page 170 of the Report of the Auditor General, published as Part E: Financial Information. 2. OVERVIEW OF DEPARTMENTAL PERFORMANCE 2.1 Service Delivery Environment Basic education is a priority for South Africa in the Medium Term Strategic Framework (MTSF) and is central to the Government s National Development Plan 2030 (NDP). The Department s strategies and plans in the sector conform to the articulations in the NDP and MTSF, which necessitate that the sector prioritises the following outcomes: improved quality of teaching and learning; an increased capacity to intervene and support quality education; increased accountability for improved learning; human resources development and management of schools; provision of infrastructure and learning materials to support effective education. These outcomes are realised through the achievement of the outputs in the delivery agreement signed in 2010 and the sector plan with its 27 goals. The goals articulated in these plans guide the work that has already begun in the FSDoE and will be deepened over the MTSF. The Annual Report 2015/2016 covers the first year of the implementation of the Strategic Plan of the Free State Department of Education which aims to improve the quality of basic education. The well-being of the province depends on the extent to which the department is able to create an enabling environment for the delivery of quality basic education to the learner population in the province. The broader population context in which the department operates is briefly explained. THE POPULATION According to STATS South Africa, the Mid Year Population Estimates (July 2015) the following statistics are of importance for the Free State in this regard: The Free State fertility rate is 2.26 down from 2.57 in 2006 and down from 2.39 in The average life expectancy rate at birth for males is 53 years and for females it is 54.7 years. According to the projections the Western Cape has the highest life expectancy at birth for both males and females, while the Free State has the lowest life expectancy at birth (Mid-Year Population Estimates, July 2015, page 11). According to STATS SA (Mid-Year Population Estimates of July 2015, page 11) the estimated percentage of total population residing in each of the provinces from 2002 to 2015 shows that Gauteng has the largest share of the population and the Free State has the second smallest population (after Northern Cape with 2,2%) with just over 5% of the population. According to the migration patterns Gauteng, Western Cape, Mpumalanga and North West Provinces experience positive net migrations, whilst the Eastern Cape, Free State and Limpopo experience the largest outflows (Page 12). The overall population of the Free State is estimated at SCHOOLS The number of schools in the Free State province has decreased (Graph 1) over time due to the movement of the population from rural areas to cities and towns.

23 22 Graph 1: Number of schools in the Free State: Source: EMIS School Portal SNAP data This phenomenon can be attributed to job losses in the agricultural sector, people looking for better living conditions and higher income job opportunities as well as better education for their children. Over the years, many schools on farms were left with no learners and these schools subsequently became non-operational resulting in a decrease in actual numbers of schools (farm schools decreased from 527 in 2010 to 330 in 2016) as depicted in Graph 3. From the graph is can also be seen that there is an increase in the number of town and township public schools i.e. from 897 in 2010 to 905 in 2016 which supports the statement that the learners are migrating from farm schools to schools in towns and townships. By end March 2016, out of the total number of 1306 schools there were 1237 operational public schools, comprising of farm schools and schools located in towns and townships. Graph 2: Number of schools per district: Source: EMIS School Portal SNAP data In the Free State the Department of Education comprises of five education districts, ie Xhariep (DC 16), Motheo (DC 17), Lejweleputswa (DC 18), Thabo Mofutsanyana (DC 19) and Fezile Dabi (DC 20). The smallest district is Xhariep and the largest is Thabo Mofutsanyana. Although Thabo Mofutsanyana is the largest district, Motheo has the largest learner population density

24 23 Graph 3: Type of schools in the province: Source: EMIS School Portal Table 1: Number of schools per municipality: Municipality Dihlabeng Kopanong Letsemeng Mafube Maluti a Phofung Mangaung Mantsopa Masilonyana Matjhabeng Metsimaholo Mohokare Moqhaka Nala Naledi Ngwathe Nketoana Phumelela Setsoto Tokologo Tswelopele Free State Source: EMIS School Portal SNAP data The municipalities with the highest number of schools are Mangaung, Maluti a Phofung, Matjhabeng, Moqhaka and Dihlabeng.


25 24 LEARNER NUMBERS Graph 4: Number of learners in primary school grades Source: EMIS School Portal Graph 5: Number of learners in the secondary school grades Source: EMIS School Portal
26 25 Despite the number of schools decreasing over time (Graph 1), the total number of learners in primary and secondary schools in the province have increased over the years. LEARNER FUNDING As part of the school funding system each quintile have a minimum fund allocation per learner, with Quintile 1, 2 and 3 schools, comprising of learners from poor and working class households, receiving R per learner in 2015/2016 up from R1116 per learner in 2014/15. Allocations for Quintile 4 schools went up from R550 to R590 while Quintile 5 allocations remained unchanged at R240. All Quintile 1 to 3 learners benefit from the no fee policy. Table 2: Learner allocations in the funding of schools as per the quintiles PER LEARNER ALLOCATION QUINTILE Q1- No Fee R 817 R 905 R 960 R 1010 R 1059 R Q2- No Fee R 784 R 829 R 880 R 1010 R 1059 R Q3- No Fee R 784 R 829 R 880 R 1010 R 1059 R Q4 R428 R453 R480 R505 R530 R550 R590 Q5 R240 R240 R240 R240 R240 R240 R240 Graph 6: Number of schools per quintile classification: Source: EMIS School Portal SNAP data The EMIS SNAP data indicates that the highest number of schools (81%) are found in the Quintile 1 3 category. This correlates with the socio-economic classification of the population as well as the vast rural geographical areas in the province. This places a huge responsibility on the provincial government to spend a considerable amount of allocated funds to provide quality education for learners in the poorer communities through the No Fee Schools model. All Quintile 1 3 schools are no fee paying schools and subsidised by the province in equal manner (amount per learner).
27 26 Graph 7: Percentage of learners and schools per quintile classification Source: EMIS School Portal When doing a comparison between the percentage of schools per Quintile vis a viz the percentage of learners per Quintile (Graph 7) it is evident that the Q1 schools represent 47.9% of schools but only 30.3% of learners attend Q1 schools. This is attributed to the fact that most farm schools are in category Q1, but has very low learner numbers, ie learners in 330 schools (on average 46 learners per farm school). The 81.3% of Q1 Q3 schools caters for 81.8% of the learners in the province LEARNER SUPPORT AND WELL-BEING The challenge of poverty and inequality constitutes an important contextual factor that led to a dedicated emphasis on learner well-being programs that create an enabling environment for better teaching and learning. These programs are no-fee schools (as alluded to above) the National School Nutrition Programme (NSNP), safety of learners, learner transport, subsidized hostels for learners residing on farms and an inclusive education program which address barriers to learning. An inclusive education system seeks to incorporate moderately physically challenged learners in identified schools (referred to as full service schools) and provide support to learners with barriers to learning in all schools. Learners with barriers are identified with the SIAS tool for the screening, identification, assessment and support of learners. The tool is also used to develop a personalised development program for each learner to address his/her barriers to learning and motivate for the allocation of a post for a support teacher to a particular school. To implement this, at least one educator is trained per school on Screening, Identification, Assessment and Support (SIAS) Strategy and on Responding to learner diversity in the classroom through Curriculum Differentiation (CD) reaching:

28 27 Graph 8: Provincial progress in the training of SIAS 2011/12 to 2015/16 *Data Source: Inclusive Education (attendance registers) Advocacy sessions on barriers to learning and disabilities were conducted reaching 2000 community members in order to address discrimination at schools. The application of SIAS is especially important for learners who have fallen behind their age cohort and are not progressing as expected, causing bottlenecks in the system. Although the focus in the past has been on primary schools for the application of SIAS, the department has taken a strategic decision to apply SIAS in secondary schools as well so that overaged learners and progressed learners are put in fast tracking programs to enable them to complete their schooling and are not held back in lower grades due to their poor performance. The inclusive education system works best when school based support teams are functional and are supported by the district-based support teams with psychological and therapeutic and occupational services. The biggest factor for learners not progressing as expected at school and make them at risk to drop out all together are socio economic conditions. Therefore the department offers learner well being programs to try and keep learners at school until they have completed their schooling. Learners fail to progress through the system due to a range of factors that create barriers to learning such as poverty, hunger, learners in child-headed households, orphaned learners, gangsterism as well as learners with special education needs. Inclusive education provides psycho-social support for learners with special education needs and, through training of teachers in SIAS, capacitates teachers to deal with such cases. Public schools are identified for transformation into Full Service Schools that provide additional support for learners with special education needs. In addition, together with social workers from the department of social development, child-headed households and orphans are supported.

29 28 Graph 9: Number of Full Service Schools from 2005 to 2015 (one more school was added in 2016 to take the total to 155 schools) Data Source: Inclusive Education Further learner support is provided with the farm school hostel project which is a special project to accommodate learners living on farms who cannot attend a school close to where they reside. 33 Hostels are accommodating learners - 2 more hostels that is Sediti in Thaba Nchu and Ventersburg (in Ventersburg) will accommodate additional learners in In 2009 there were 12 hostels, accommodating 1864 learners from farms. This number increased to learners being accommodated in 33 hostels at the beginning of The learners are supported with a subsidy which covers food, laundry, medical supplies, toiletries, sporting activities, minor repairs and maintenance, water, electricity and transport for out weekends and for going to their homes on farms during school holidays. There is also administrative support provided to the hostels in the form of a subsidy for the telephone, payments of auditor s fee and stationery The hostels are further supported and monitored via site visits and staff development programs on learner s well being, cleanliness of the hostel, to plan meals, administer/monitor the hostel budget through proper procurement procedures and supporting learners with their studies and involve them in recreational activities. NSNP The National School Nutrition Programme is one of Government s learner support initiatives towards addressing poverty and improving access to quality of education in the Province. The programme targets schools in the poorest communities and benefit multitudes of learners throughout the Province. The programme currently provides nutritious meals to learners in Q1-3 primary, secondary as well as identified special schools with the budget of R NSNP is also used as a channel for local economic development and creation of job opportunities for the local people through the use of cooperatives as service providers. There are 362 cooperatives that are currently contracted in 401 schools to procure and deliver food stuffs for the feeding of learners. The unemployed parents of learners are appointed as Volunteer Food Handlers (VFHs) to prepare meals for learners. There are VFHs appointed over a period of six months who are receiving a stipend of R960 per person per month. Under the National School Nutrition Programme Category, Motheo district won in the District Excellence Award 2016 due to their good implementation of the programme and record keeping, also due to their excellence in managing the nutrition programme in partnership with private sectors. The district caters for approximately Quintile 1 to 3 learners. The National School Nutrition Programme Best School Award went to Seithati Primary School in Botshabelo and approximately R and Breakfast Meals for three years from Tiger Brand. The School produces the best spinach and cabbage. South Africa is a signatory to World Health Assembly (WHA) resolution (May 2001), which calls for regular, synchronised treatment of worms in high-risk groups and as a result the Department introduced the Deworming Programme for Grades R to 7 in all Quintile 1 to 3 schools, including special schools. According to Deworm the World, deworming ranks 1st among 5

30 29 most innovative strategies for tackling poverty. It also aims to improve health, reduce absenteeism and increase the potential to learn. The benefits are immediate, long lasting and will have a wide reach. LEARNER PERFORMANCE The Department has over the past years made great strides in relation to improvement in learner performance in Grade 12. In 2013 the pas rate was 87,4% when the province attained position one in the country. In 2014 the National Senior Certificate pass rate was 82.8%, which was much higher than the national average of 75.8 and put the Free State in the third position in provincial standing. In 2015 however, the Free State increased this gap of 7% by 3.9%. At 81.6% (before remarking and supplementary exams) the Free State has now performed 10.9% better than the National pass percentage of 70.7%. After remarking and supplementary exams an additional 594 learners passed, increasing the total number of learners who passed to with a percentage of 83%. The number of learners who obtained bachelors passes increased from (30.2%) in 2014 to (29.8%) in After supplementary exams and remarking these figures increased to (29,9%). The province got position one in Life Science, Accounting and Agricultural Science; position two in Physical Science; and position three in Mathematics and Geography, nationally before remarking and supplementary exams. Out of the 329 schools that wrote the NCS exams in 2015, 49 obtained a 100% pass. After remarking and supplementary exams this increased to 58 schools with 180 schools that performed between 80% to 99,9% and 71 schools performed between 80% and 60%. After remarking and supplementary exams there were only 20 schools that performed below 60% and one school that obtained below 40%. However it should be noted that the performance of the class of 2015 showed a decline when compared to the class of In 2014 the NSC examination pass rate was 82.8%, there was a decline of 1.2% in In 2013 the province achieved position 1, and in 2014 it declined two positions to number 3. The class of 2015 kept the 3 rd position nationally. After supplementary exam results between 2014 and 2015 compare as follows: ,1% and %. The performance in Physical Science dropped by 0.58% since 2014, to 68.04% in The 2015 Mathematics class however outperformed their 2014 counterparts by 2.34%, they achieved a 67.85% pass percentage. After supplementary exams, the performance in Physical Science improved by 3,8% since 2014 to 69,7% in 2015 and the Maths is up 5,9% from 2014 to 69,1% pass percentage. Table 3: The top performing municipalities in 2015 (after remarking and supplementary exams) are as follows:
.")
31 30 Table 4: After remarking and supplementary exams: The performance of the province in the National Senior Certificate has over the last six years been significantly above the national average. The improvement can to a large extent be attributed to the implementation of intervention programmes that have found expression in the Provincial Strategy on Learner Attainment (PSLA). It is important to recognize that the PSLA is an initiative that seeks to bring about continuous improvement in learner attainment in relation to the National Senior Certificate (NSC) examinations. In this context, the PSLA continues to represent a strategic response that focuses on the qualitative improvement of schools with a view to build a strong culture of effective curriculum leadership and school organization. In this culture, the school develops an enabling environment for effective teaching and learning with a view to continuous improvement in learner attainment. The strategies implemented by the Department to achieve these results and improve efficiency are detailed in the Section dealing with Strategic Outcome Oriented goals and in the Programs. EDUCATORS The department has in its employ permanent, temporary and part time educators. Details of the Human Resources in the Department are to be found in Part D of this Annual Report. Teacher development, supply and effective utilization of teachers are covered in this Part B: Performance Information of the Annual Report under Sub-Outcome 1 of the Section dealing with the Strategic Outcome Oriented Goals. Since April 2015, the department appointed 872 educators aged 30 and below, 331 of whom were permanently employed. Out of the total 338 allocated Funza Lushaka posts for the 2014 Funza Lushaka bursars, 297 bursars (87.87%) were placed by June 2015 while 334 bursars (98.81%) were placed by December 2015 including SGB posts. Challenges include the matching of graduates to available posts relative to phase and subject specialisation as well as profiling of vacancies, subjects combinations of graduates, for example Mathematics, Natural Sciences and Technology and English. In the Intermediate and Senior Phases educators are expected to specialise while schools expect general subject combinations. The profiles expected by schools differ significantly within the profiles of educators. Further challenges are the submission of proof of results and signed placement form by the graduates, contacting graduates for placements. Most students don t comply and submit beyond or on due date given in their contracts, and this causes administrative burdens on the department. Defaulters are also a major challenge and it becomes difficult for the province to place all the graduates in the set time frames. District Offices are supported by Funza Lushaka officials to provide guidance to schools in prioritising graduates if their profiles match the vacancies at schools. Graduates are informed to provide the department with updated contact details before leaving tertiary, or contact the Funza Lushaka offices responsible for enquiries at the provincial office.
32 Service Delivery Improvement Plan achievement Main services and standards Main services Beneficiaries Current/actual standard of service Improve communica-tion School Management 300 secondary schools, with secondary schools Teams on matters relating to (SMT), their performance. Educators and The principal of each under performing secondary Learners. school receive an individual letter signed by the Superintendent General with the content based on the school s performance Improve communica-tion with primary schools on matters relating to their performance. Provide support and monitoring to underper-forming and fluctuating schools. Man- Teams School agement (SMT), Educators and Learners. School management teams, Educators Learners Parents Members of school governing bodies. 750 primary schools, The principal of each under performing primary school receive an individual letter signed by the Superintendent General with the content based on the school s performance All underperforming schools receive support and monitoring by Circuit Managers and Subject Advisors. Desired standard of service All principals in under performing secondary schools to receive an individual letter signed by the Superintendent General with the content based on the school s performance within the 1 st month of re-opening. All principals in under performing primary schools, to receive an individual letter signed by the Superintendent General with the content based on the school s performance within the 1 st month of re-opening General performance improvement of identified schools All principals in under performing secondary schools received a letter re the performance of the school. All principals in of under performing secondary schools received a letter re the performance of the school. Number of underper-forming schools reduced by improving performance of identified schools Batho Pele arrangements with beneficiaries (Consultation access etc.) Current/actual arrangements Desired arrangements achievements All secondary schools are consulted each quarter of the academic year. SMT members who are involved with examinations at schools are consulted monthly to address the needs of schools in this regard. The contents of the letters are for the attention of every member of the school community and thus all have access to it. Broad Management Members visit schools at least twice per annum in addition to monthly visits by Circuit Managers. The letter will be displayed on the notice board of the school Schools include valuable inputs from the educators, learners & parents into the School Improvement Plans Principals discuss the content of the letters with educators, learners and SGBs within the 1 st school term
33 32 Service delivery information tool Current/actual information tools Desired information tools achievements The Service Delivery Charter Service Delivery Charter Service Delivery Charter re Learner registration announced Learner registration announced Learner registration announced Complaints mechanism Current / actual complaints mechanism Desired complaints mechanism achievements Departmental hotline Departmental hotline Departmental hotline Presidential Hotline Presidential Hotline Presidential Hotline N/A Complaints Officers at every District Office Not implemented yet. 2.3 Organisational environment The environment of the FSDoE encompasses the provincial head office, district offices that link Head office and education institutions, ordinary and special public schools as well as ECD sites that are subsidised by the department. Three branches, District & Curriculum Management and Educational Support; Financial Management and Corporate Services are each headed by a Deputy Director General. Apart from the three branches, two other directorates, Internal Audit and Communication Services report directly to the Head of Department. 2.4 Key policy developments and legislative changes There were no key policy developments nor legislative changes during 2015/ STRATEGIC OUTCOME ORIENTED GOALS The strategic outcome oriented goals as per the Strategic Plan are: Promotion of sound corporate governance through sustainable use of resources. Improved school functionality through teacher development, management support and increased accountability Increased access to grade R Improved learner performance in grade 3,6,9 and 12 as demonstrated through regular assessment and tracking of progress Provision of infrastructure and learning materials to support quality education The NDP s vision for 2030 is for South Africans to have access to education and training of the highest quality, characterised by significantly improved learning outcomes. Chapter 9 of the vision seeks to strengthen the educational system, beginning from early childhood development, through primary, secondary, tertiary and further education, thus eradicating poverty and addressing inequality, as well as contributing to nation building by increasing skilled and specialised labour.
34 33 Basic Education Sector Plan, Action Plan 2019: Towards the Realisation of Schooling 2030, incorporates key targets of the NDP and is rooted within the outcomes of the MTSF. Outcome 1 of the MTSF deals with Quality Basic Education and has the following sub-outcomes: Improved quality of teaching and learning through development, supply and effective utilisation of teachers Improved quality of teaching and learning through provision of infrastructure and learning materials Regular Annual National Assessments to track improvements in the quality of teaching and learning. Improved Grade R and planning for extension of ECD A credible, outcomes focussed planning and accountability system (building of the capacity of the state to intervene and support quality education) Partnerships for a Strong Education System The department works closely with schools through the districts to realise the strategic goals, the sub-outcomes of the MTSF 2019 and the 27 output goals that are contained in the Action Plan 2019: Towards the Realisation of Schooling The annual report alludes to the role of the department in establishing an enabling environment and providing strategic support to ensure that the outputs of Outcome 1 in the NDP are realized. Achievement of the abovementioned strategic goals will contribute to achieving the MTSF sub-outcomes. How these goals are realized in an interphased manner between the Strategic Goals, the six Outcomes and the programmatic performance are displayed in the table below: Table 5: Linking Strategic Goals, Objectives to Program objectives and targets and the Outcomes Based Plan Strategic goal 1 Promotion of sound corporate governance through sustainable use of resources. Strategic Objective Interphased Delivery Goal Statement Improved: Financial Management systems Human resource strategy Communication strategies Security Systems Internal Audit processes Risk Management Systems Audit opinion. Program 1: To provide education management services and support for the education system through optimal utilization of resources, increased application of ICT, knowledge and data based decision-making, including impact assessments by provincial and district offices. Delivery reports are detailed in Part C Governance and Part D Human Resources and Part E Financial Statements of this Annual Report.
35 34 2 Strategic goal Improve the functionality of schools through teacher development and management support and increased accountability Goal Statement Ensure availability and utilization of teachers to avoid large classes Implement a strategy for attracting sufficient qualified, young teachers including for Grade R Implement an appropriate framework for teacher development Strengthen districts to support schools in curriculum through subject advisors. Promote oversight and support in the delivery of curriculum in the classroom Circuit Managers (SMG- D),subject advisors and inclusive officials to visit schools and provide support on management Implement a strategy to strengthen school management Strategic Objective: Program 1: To provide education management services and support for the education system through optimal utilization of resources, increased application of ICT, knowledge and data based decision-making, including impact assessments by provincial and district offices. Program 2: Provision of quality teaching and learning to all learners from Grade 1 to 12. Improve Teacher capacity and practices Increase access to high quality learning material. Interphased delivery Delivery reports are detailed in Sub-outcome 1 below: Ïmproved quality of learning and teaching through teacher development and progress on the targets are found in Program 1: Administration and Program 2: Public Schools. 3 Strategic goal Increased access to grade R Strategic Objective Interphased Delivery Goal Statement Increase Grade R enrolment and expand Grade R classes so that an increasing number of grade 1 learners have been to a Grade R class. Train ECD practitioners in registered Grade R classes Increase the percentage of Grade 1 entrants who attended a Grade R that are school ready. Program 5 Access to quality early childhood development. Delivery reports are detailed in Sub-Ouctome 4: Improve quality of Grade R and extension of early childhood development and progress on the targets are found in Programme 5: Early Childhood Development.
36 35 4 Strategic goal Improve learner performance in grade 3,6,9 and 12 as demonstrated through regular assessment and tracking of progress Strategic Objective Interphased Delivery Goal Statement Increase the number of learners in Grade 3 who, by the end of the year, have mastered the minimum language and numeracy competencies for Grade 3. Increase the number of learners in Grade 6 and 9 who, by the end of the year, have mastered the minimum language and mathematics competencies for Grade 6 and 9. Increase the number of Grade 12 learners who become eligible for a Bachelors programme at a university. Increase the number of Grade 12 learners who pass mathematics, physical science and accounting. Improve the average performance of Grade 6 learners in languages and mathematics. Improve the average performance of Grade 9 learners in mathematics. Improve the grade promotion of learners through Grades 1 to 9. Program 2: Provision of quality teaching and learning to all learners from Grade 1 to 12. Improve Teacher capacity and practices Increase access to high quality learning material Program 7: Prepare and administer ANA for Grades 3,6 and 9 and the NSC for Grade 12. Delivery reports are detailed in Sub-Outcome 3: Regular annual assessments of Grade 3, 6, 9 and NSC level to track improvements in the quality of learning and teaching and progress on the targets are found in Program 2: Public Schools and Program 7: Examination and Education Related Services. 5 Strategic goal Provision of infrastructure and learning materials to support quality education Goal Statement Build new schools; refurbish old schools, built laboratories, libraries, halls, admin blocks and toilets for educators and learners. Provide sewerage, electricity and water to those schools without. Supply each learner with the nationally defined text book package. Strategic Objective Program 6: To provide new physical infrastructure, maintain and renovate existing infrastructure in education institutions in line with the infrastructure plan. Interphased delivery Delivery reports are detailed in sub-outcome 2: Improved quality of learning and teaching through provision of adequate, quality infrastructure and learning material and progress on the targets are found in Program 6: Infrastructure Development.

37 36 Sub-outcome 1: Improved quality of teaching and learning through teacher development and effective utilization of teachers This sub-outcome is linked to the department s strategic goal to have improved school functionality through teacher development, management support and increased accountability. As stated in the MTSF, the quality of the South African education system depends on the expertise (understanding of the curriculum, content knowledge and teaching skills) and commitment of its teachers. Providing motivational and developmental activities and training for teachers is key to contributing to these objectives to ensure their effectiveness. The sector strives to improve and monitor the supply of new teachers to the education system. School functionality is enhanced by having sufficiently qualified teachers, and on-going development ensures that teachers are able to remain motivated and present inspired lessons. A key delivery point in the in-service training of teachers, are the District Teacher Development Centres (DTDC). The Teacher Development Training Centres (DTDC) recorded and documented training that took place from April 2015 to March Training included, among others, Mathematics and Literacy training to GET and FET phase teachers, training in Accounting and Physical Sciences, Training in the CPTD Management System, Curriculum Management for SMTs and Office Based Officials, ICT, SIAS and IBP as summarised in the graph below. Graph 10: Number of training sessions for select subjects and programmes Source: Teacher Development The Free State Department of Education provided funding for 117 teachers across the province to attend the 7th biennial conference of SAASTE (South African Association of Science and Technology Educators) from 6 to 9 July 2015 at the College of Education, UNISA, in Pretoria. Keynote speakers from the Universities of São Paulo and Wisconsin-Madison presented topics on barriers to practical work, ICT competencies of teachers, teaching the periodic table by using technology and learning science through practical work among others, as well as several chemistry workshops. Nine sessions were conducted for the PLC Model for Maths workshops, held for Grades 8 and 9 Mathematics teachers, between April and June 2015, with. Teachers were trained in the afternoon and full-day workshops were held on development of lesson plans as well as emphasis on areas of weakness. A total number of 758 out of 1254 teachers participated in the workshops during this period. Pre and Post tests were administered during each cluster meeting to reveal the professional training needs of educators that attend these sessions.
38 37 Through a partnership with the CHIETA SETA and the UFS, 30 Grade 9 teachers were trained on Mathematics content. Mathematics Summits for Foundation phase and Grades 4 to 7 teachers were held in four districts, focussing on the challenging topics which were presented by expert teachers. A total of 650 Maths teachers of Grades R - 7 participated, including multi-grade teachers. Start-up workshops were held for 17 FET phase subjects from 25 January to 3 February 2016 in all districts. In the workshops, the 2015 NSC Examination Results were discussed; the Provincial Internal Moderators reports, the targets for 2016, subject improvement strategies, strategies on how to handle progressed learners and the provincial and UMALUSI moderation reports. Of the 2661 Grades 10 to 12 teachers expected, 2296 were trained. More teachers than planned for, requested to attend content specific workshops, 1267 of the expected 850, for Mathematics, English Home Language, English First Additional Language, Economics and Business Studies. Training encompassed 10 workshops with dates ranging from 25 January to 3 March In workshops conducted by Shuter and Shooter from 25 January to 3 February 2016, 110 Grade 11 English First Additional Language (FAL) teachers were introduced to the new prescribed text short stories. Again in training to strengthen classroom teaching in FAL, 289 teachers were trained from 25 to 29 January 2016 using material that was provided by the British Council. Subject matters, including policies, planning, formal and informal assessment, marking, daily class work activities, SBA and lesson preparation for new teachers, as well as setting of examination question papers, were amongst the topics discussed at the trainings. Mathematics, Mathematical Literacy and Physical Sciences subject advisors received a 5-day CAPS training in Technical Mathematics and Technical Sciences in Bloemfontein from 24 to 28 August The training was conducted by the National Training Team (NTT) from DBE. A total of teachers participated in the Residential Teacher Development trainings and spent a total of 310 hours for professional development. In summary, the number of training sessions documented by teacher development was as follows: Table 6: Total number of trainings per quarter and average hours of training Number of training sessions held Foundation Phase Interme- diate Phase Senior Phase FET Phase SMTs and Officials GRAND TOTAL 1st Quarter nd Quarter rd Quarter th Quarter Average hours of training Annual Data Source: Teacher Development Educator Self evaluation The Department of Basic Education (DBE) piloted the self evaluation APTIS tests (English) in 2015 in the province where 79 teachers in all phases (Foundation, Intermediate, Senior & FET) participated in Self-Diagnostic Assessment. Once the process has been finalized in all other provinces, training will be conducted on a full scale and provinces will be allowed to continue with the APTIS tests. Use of learning and teaching resources It has been widely observed that the teaching and learning materials currently used at schools are not optimally utilized due to various reasons from lack of skills by teachers to poor management of these resources. To address this, all newly appointed principals and circuit managers are trained on effective utilization and monitoring of resources.

39 38 Teacher attendance There was a decrease in the absenteeism of teachers from the second to the first quarter from 5.5% to 4.9% and an overall decline from 2010 at 8.7% absenteeism to 2015 at 4.9%. Factors contributing to the decrease include measures taken by districts to conduct leave analysis to check and monitor absenteeism in schools. Attendance Registers are controlled daily, leave taken is submitted through a register and recorded on SA-SAMS, and SA-SAMS is printed out and submitted by schools for reconciliation. In some districts, a monthly Graphical Leave Analysis Report is submitted to the DMT for all schools. Workshops on leave management and change on leave determination are also organised for public servants. As shown in the table below, the FSDoE is on course with the reduction in teacher absenteeism which was standing at an average rate of 4.4% at the end of the 2015 academic year, 3.4% below the national target of 8%. Sub-outcome 2: Improved quality of teaching and learning through provision of adequate, quality infrastructure and learning materials The strategic goal on Provision of infrastructure and learning materials to support quality education is linked to sub-outcome 2 and is important in creating a conducive atmosphere for learning. School buildings, desks and chairs and basic services make up hard infrastructure while books and computers provide soft infrastructure and are important in providing enabling conditions for learning. Some of the hard infrastructure projects are provided as examples of progress made in this regard. The details of which is to be found in Program 6, dealing with infrastructure. School Library Services New library facilities was built at Six primary schools in Thabo Mofutsanyana, ie Bodibeng P/S, Boitelo P/S, Kgoledi ya Manka P/S, Nexus P/S, Sekgothadi P/S and Sentebale P/S, with a total of 5,597 learners, bringing the total percentage of learners in schools that have access to a centralized or dual-purpose library to 35%. There are different models through which a library service can be provided in addition to a centralized library, for example a shared school and community library, a mobile library bus, mobile classroom units and classroom collections. The overall picture of the status of library services are provided below in Graph 11. Graph 11: Types of library services and percentages of learners they serve LTSM (learning and teaching support material) When CAPS was implemented the Department took a decision to buy Textbooks for all Public Schools in the Free State in order to address Universal Coverage of Textbooks. Of the 1, Textbooks ordered, 1, were delivered to schools (99.2%). Total amount of text books procured amounted to R for the 2015/16 financial year.
40 39 Workbooks are provided by the National Department of Basic Education (DBE). This is co-ordinated between the FSDoE and DBE. Workbooks were printed and distributed to public (ordinary and special) schools for Grades 1 to 9 Volume 1 were delivered from 23 July to 23 September 2015 while Volume 2 were delivered from 19 October to 30 November Workbooks included Grades 1 to 6 Home Languages and First Additional Languages; Grades 1 to 3 Mathematics in LoLT and Life Skills; Grades 4 to 9 Mathematics in English and Afrikaans. In addition to text books and workbooks, the provincial office makes available developed material to improve the teaching of English Papers 1, 2 and 3. This material is developed by the provincial subject co-ordinators and Subject Advisors. The Provincial Office and the English Subject Advisors developed the Grade 6 English Study Guide on Language Structures and Conventions. A total of 1700 copies were printed and distributed. The Department is planning to expand this project to more struggling primary schools in townships. This initiative attempts to address language deficiencies that have been identified through ANA 2014 and the 2015 Provincial common quarterly tests. It was observed that since CAPS compliant workbooks and text books were introduced in schools, the quality and quantity of written work in Grades 4 to 7 improved considerably, particularly in Mathematics and in Languages. Sub-outcome 3: Regular annual national assessments at Grades 3, 6, 9 and NSC level to track improvements in the quality of teaching and learning The performance of the department of education as an institution is measured, amongst other things, through learner attainment and improved learner performance in grade 3, 6, 9 and 12 as demonstrated through regular assessment and tracking of progress. Therefore this is a key strategic goal of the department. A focus of the MTSF is to improve the quality of ANA and the NSC. By analysing performance of both ANA and NSC, appropriate support can be provided to struggling schools to ensure that every learner has a chance to excel and progress, ensuring that the educational system is strengthened and that every child can achieve a National Certificate. Below follow some examples of the analyses done. More details on the NSC analyses and interventions appear in Items 2.1 Service Delivery Environment and Sub-outcome 1: Improved quality of teaching and learning through teacher development and in Program 7. Those details are not repeated here. National Senior Certificate (NSC) - Grade 12 The 2015 cohort was the second National Senior Certificate (Matric) class to sit for the second Curriculum and Assessment Policy Statement (CAPS) exam. A total of candidates enrolled for the NCS Examinations, the highest enrolment in the history of the Department. A total of candidates of the who wrote in 2015 passed, which gave the Free State pass rate of 81.6% (before remarking and supplementary exams). This increased to and 83% after remarking and supplementary exams. The graph below shows the NSC Pass Rate per district from 2011 to The 2015 results are given before remarking and supplementary exams, however the pattern remains the same with Thabo Mofutsanyana remaining the best performing district by performing at 87, 5% for the third year running while Motheo district performance dropped from second position in 2013 to fifth in Fezile Dabi went from fifth position in 2013 to second for the second year running in 2015.
 of progressed National Senior Certificate candidates in the country, with the 2nd highest standing at 17.7%")
41 40 Graph 12: NSC Pass Rate per District: 2011 to 2015 (before remarking and supplementary exams) Data Source: Examinations and Assessment In the 2015 NSC examinations, the Free State had the highest percentage (28%) of progressed National Senior Certificate candidates in the country, with the 2nd highest standing at 17.7% (Limpopo) and nationally the figure stands at 12.7%. Analyses of the Performance of progressed learners per district showing the tendencies (before remarking and supplementary exams) follows.

42 41 Graph 13: Impact of Progressed learners on NSC Pass Rate per District: 2014 to 2015 (before remarking and supplementary exams). Data Source: Examinations and Assessment Thabo Mofutsanyana had the highest pass percentage in progressed learners, 67.5%, followed by Fezile Dabi with 59%. Motheo had the lowest pass rate at 41.3%, a drop of one percent from 2014 while Xhariep had the second lowest at 42.9%. The biggest impact on the Free State pass rate was the negative effect of the Motheo pass percentage which in turn was affected by the large failure rate of learners in Botshabelo. This caused the provincial pass percentage to drop by 3.6%. The most positive impact came from Thabo Mofutsanyana district which boosted the Free State pass rate by 2.1%. The districts had minimal impact on the overall bachelor pass percentage, with the most impact being felt from the negative effect of the Botshabelo pass rate at 1.9% while the overall Motheo Diploma pass rate impacted negatively on the provincial pass rate by effecting a drop of 2.5%. A total of of the candidates who wrote 7 or more subjects, passed at Bachelor level. This gave us 29.8% (before remarking and supplementary exams). This increased to learners giving us 29,9% after remarking and supplementary exams.


43 42 Graph 14: Comparison of Number of Bachelor and Diploma passes compared to Registrations: 2012 to 2015 (before remarking and supplementary exams) Data Source: Examinations and Assessment The Free State province has consistently performed well in Accounting, receiving position 2 in 2013 and position 1 in both 2014 and The Free State obtained position 2 for three consecutive years in Physical Sciences from 2013 to Physical Sciences (69.7%): Position 2. The graph below compares the pass rates of Mathematics and Physical Sciences to Accounting before remarking and supplementary exams. Graph 15: Comparison of Mathematics and Physical Sciences Pass Rates against Accounting (before remarking and supplementary exams). Data source: Examinations and Assessment The provincial pass percentage Accounting has consistently been above that of Mathematics and Physical Sciences, with the exception of 2013 when the provincial pass rates of Mathematics were 72%, Physical Sciences 74% while Accounting was

44 %. The average pass mark of Accounting in this year was still higher than in both Mathematics, at 41.7% and Physical Sciences, at 41.9%. In 2015 Accounting pass rate was 73% while Mathematics and Physical Sciences pass rates were 69.1% and 69.7% respectively. Although Physical Sciences consistently outperforms Mathematics, the average Mathematics pass mark of 2015 was 0.3% higher than the average Physical Sciences pass mark. There was a high increase in learner numbers in the 2015 NSC examinations from compared to the candidates that registered in 2014, an increase of learners (before remarking and supplementary exams) with the majority being progressed learners which constituted 28% of the 2015 NSC cohort. This most likely contributed to the decrease in NSC results in 2015 compared to the previous year and was below the set target of 90%. In some township schools class sizes in Grade 12 doubled in In certain areas and schools learners are at risk and increasingly vulnerable to psycho-social ills like drugs, gansterism, etc. Proficiency in the language of learning and teaching, mainly English first additional language remain a challenge to learners in handling contextual and contemporary questions. To improve the results, districts assisted schools, with the support of the SGBs and the broader school community. Communities are mobilised around issues that may disturb quality teaching and learning such as initiations, drug abuse, learners loitering in the streets during school hours. During parents meetings they are encouraged to ensure that their children perform on Level 4 and above. Another key lever in improving learner performance is to address the underperforming schools. Out of the 329 schools that wrote the NCS exams in 2015, 49 obtained a 100% pass. After remarking and supplementary exams this increased to 58 schools obtaining a 100% pass and 180 schools that performed between 80% to 99,9% and 71 schools performed between 80% and 60%. After remarking and supplementary exams there were only 20 schools that performed below 60% and one school that obtained below 40%. The graph below illustrates the figures before remarking and supplementary exams, but the pattern remains the same. Graph 16: Category of School Performance, Gold, Silver, Bronze and Underperforming: 2011 to 2015 (before remarking and supplementary exams) Data Source: Examinations and Assessment To address the underperforming schools, co-ordinated, improve and monitored support was provided through holiday schools, weekend classess, afternoon classess and examination preparation camps. Via the Internet Broadcasting Program of the University of the Free State, dedicated support was given to each subject and preparing learners for the examinations. The following guides were provided to schools: Euclidean Geometry summaries for Maths learners, HeyMath! revision packs to all townships schools and copies of topographical maps to geography learners.
45 44 Sub-outcome 4: Improve quality of Grade R and extension of Early Childhood Development Research has shown that children who receive quality ECD education perform better in Grade 1 and in subsequent school years. For this reason there is a significant drive to increase numbers of children accessing this education as well as improving the quality of tuition by ensuring that teachers are relevantly qualified. Universalise access to Grade R Grade R learners are supported in both the community based sites and public schools at about 85% in public schools and 15% in community based sites. The plan is to gradually, as facilities become available, migrate Grade R learners from early childhood community sites to public schools. The Department is currently supporting Grade R learners who are accommodated in 263 ECD sites. There are more Grade R learners being accommodated in community sites under the auspices of the Department of Social Development. To increase numbers of learners who receive formal Grade R in public schools, infrastructure finished construction of 49 Grade R classrooms in 2015/16 and forward projections have been made in order to ensure space is available for all Grade R learners by the time Grade R becomes compulsory in The FSDoE currently has 646 public schools that offer Grade R, bringing the percentage of Grade R learners who receive formal Grade R to 77,2%. In July 2015, the DBE supplied 646 public schools with Grade R workbooks in public schools. In addition Grade R resource packs were provided by DBE, containing posters for Grade R themes, DVDs for teachers, big books, teacher guides as well as lesson plans and assessments. Increasing the number of Grade R practitioners with appropriate qualifications All of the Grade R practitioners on PERSAL have at least Grade 12 (NQF Level 4). 20% of practitioners have REQV 13 (NQF level 6, 7 or 8 depending on the qualification) and upwards. The Non-Governmental Organisation, Save the Children, is working in collaboration with the department to recruit youth to study B. Ed in Foundation Phase. These recruits can, once qualified, be utilized as Grade R teachers. As a result, a total of 50 students were provided with bursaries to study B.Ed. with UNISA. A hundred Grade R teachers have been selected across the province to enrol towards a Diploma in Grade R teaching as of January The province has been allocated 17 Grade R practitioners to receive training on the ECD Diploma qualification in These initiatives as supported by the ETDP SETA. Sub-outcome 5: A credible, outcomes-focused planning and accountability system through intervention and monitoring at school, community and district level Good management and governance at school level is crucial to ensuring functionality and efficiency of the institution, creating an environment conducive to teaching and learning. Departments of Police, Roads and Transport as well as Health contribute to learner safety and well-being as well as addressing social and health barriers to learning. Systems need to be in place to ensure that all learners are retained and that learners can progress through the system. Socio-economic circumstances, vulnerable, orphaned, or learners with barriers to learning are some of the factors to be overcome in addressing the challenges of drop-out and repeaters. Monitoring and support of education in schools include ensuring that all children are at school and learning, that vulnerable children are supported, and that those with learning difficulties are assisted so that they can move with their age-cohorts. Good governance and functional schools underpin these outcomes. School Governance SGB elections were conducted in March of 2015 and completed at public schools. The remaining two schools completed the process by 14 June members were elected. The newly elected SGB s were inducted and schools held meetings to elect office bearers. Management Plans were developed to train members on Finance Management and Procurement Procedures. 60% of SGB members elected in March 2015 were orientated and trained from May to December 2015 on Planning for School Support, Legislation and Policy, School Funding and Financial Management, Maintenance of School Assets, Policy Development, Recruitment and Selection, School Safety, Skill and Attribute development.
46 45 School Functionality One indicator of basic school functionality is the extent to which schools are compliant with regard to producing the minimum set of management documents at a required standard for example a school improvement plan, a school budget before the end of the academic year, a school timetable, a calender of events, teacher work schedules and timetables, learner and educator attendance registers, etc. The documents are checked during the School Readiness Visits, District Support Team Visits, and Curriculum Support Team Visits. Functional school time-tables exist at most of the schools and are verified by the Subject Advisors and Circuit Managers. Attendance registers are kept for educators and learners at all schools. All educators have work schedules, the implementation of which is monitored by Subject Advisors Curriculum coverage is another key area of school functionality stemming from instructional leadership that should be more effectively monitored. Reviews of learner workbooks can provide telling information about the coverage of curriculum and practice of exercises within classrooms, and could therefore be used for the purposes of monitoring. Since macro pacing of the curriculum has now been specified in the Curriculum Assessment Policy Statements (CAPS) and very prescriptive workbooks have now been distributed, the scaffolding for accurate monitoring of curriculum coverage is already in place. The participation of schools in the Provincial Quarterly Tests or Examinations makes it compulsory for schools to cover curriculum. The Primary Schools Directorate has updated the newly introduced Gear-up tools to monitor topics and skills to be covered per week against number of informal assessment tasks, daily class activities and homework. The Secondary Schools Directorate reported that most schools are up to date with the Grade 12 curriculum as determined by the content coverage per week as prescribed. Subject Advisors focussed only on curriculum coverage as per work schedule and the number of homework tasks. Table 7: Summary of number of secondary schools monitored in February 2016 per grade and the percentage coverage for these schools Grade 12 Grade 11 Grade10 Number of schools % Coverage Number of schools % Coverage Number of schools Physical Sciences English Source: Curriculum Secondary Schools % Coverage Compliance with the minimum number of homework tasks, experiments and informal tests in the schools monitor was at an average of 85,7% for homework, 7% for practical work done and 21,3% for informal tests written. Where curriculum coverage is not up to expectations, schools were advised that a recovery plan must be developed that is monitored internally by the school. Catch up programs are developed and implemented. Morning, afternoon and Saturday classes are held to cover the work and schools participate in extra classes to catch-up on curriculum. Holiday classes were also implemented as well as the extended hours programme. As shown in the graph below, learner absenteeism has also shown a gradual decline from 6% in 2009 to 2.6% in 2015, which could be attributed to, inter alia, measures taken by the department to expand its feeding scheme as well as increasing the number of no fee paying schools and improved school functionality.
47 46 Graph 17: Learner Absenteeism Rate: 2010 to 2015 Data source: EMIS District Support According to the medium term strategic framework, the expectation is that all schools should be visited at least twice per year by their circuit managers. Due to the importance of support to underperforming primary and secondary schools it happens that there are schools that are visited more than two times throughout the year and likewise schools not needing so much support, are visited fewer times. However, all schools were supported through cluster visits to ensure that important information is shared with all public schools. All district officials visiting schools must complete the school journal (logbook) and submit a copy of the original report, signed off by the principal and district official and educator where relevant, to the respective district offices as evidence of the visit. The 2015 School Survey on District Support indicates that 65.7% of principals rate the services of districts as being useful and very useful which was used as the indicator for satisfactory. The graph below indicates the specific ratings per category of official given by principals. 4. PERFORMANCE INFORMATION BY PROGRAMME 4.1 Programme 1: Administration Program purpose: To provide overall management of the education system in accordance with the National Policy Act, the Public Finance Management Act and other policies. The sub-programmes 1. Office of the MEC 2. Corporate Services 3. Education Management 4. Human Resource Development 5. Education Management Information System (EMIS)
48 47 Strategic objectives, performance indicators, planned targets and actual achievements The Schools are supported by the 5 District Offices and the Provincial Offices. Schools visits are undertaken by provincial and district based officials to monitor and support schools for improved learner performance and school functionality. The visits are conducted with a clear purpose linked to the school improvement plans and expectations on corrective measures are provided in writing for further monitoring and ensuring accountability. The department relies on a national school administration system for the collection of it management data which is used for information based decisionmaking and allocation of resources. The electronic school management administration system is rolled out to all schools. The challenge is that all schools submit their complete reports with signed off accountability certificates for correctness in the uploaded information. The detailed report on the achievement of the strategic objectives and the performance indicators can be found in Sub-Outcome 5: A credible, outcomes, focused planning and accountability system through intervention and monitoring at school, community and district level which contributes to the Strategic Goal 2 to improve the functionality of schools through teacher development, management support and increased accountability as envisaged in the NDP. Strategic objectives: Programme Name: Administration Strategic objectives Achievement 2014/2015 Planned Target 2015/2016 Achievement 2015/2016 Deviation from planned target to Achievement for 2015/2016 Comment on deviations To provide education management services and support for the education system through optimal utilization of resources, increased application of ICT, knowledge and data based decision making including impact assessments by provincial and district offices number of schools There are fewer schools due to a number of farm schools that no longer have any learners and therefore these schools are no longer operational. The learners move away from the farm schools when their parents re-locate to towns and townships. Performance indicators Programme Administration Performance Indicator Achievement 2014/2015 Planned Target 2015/2016 Achievement 2015/2016 Deviation from planned target to Achievement for 2015/2016 Comment on deviations PPM 101 Number of public schools that use SASAMS to electronically provide data to the national learner tracking system (LURITS) Farm schools running empty of learners and not all principals submitting signed off LURITS forms when they submit their SASAMS data electronically.
49 48 Programme Administration Performance Indicator Achievement 2014/2015 Planned Target 2015/2016 Achievement 2015/2016 Deviation from planned target to Achievement for 2015/2016 Comment on deviations PPM 102 Number of public schools that can be contacted electronically PPM 103 Percentage of education current expenditure going towards non personnel items Through partnerships with connectivity providers and Schools / principals getting their own addresses, the target was exceeded at no additional costs to the Department. 21% 17% 16% -1% The target on non personnel spending is lower than projected due to a higher than expected salary increase for employees and the settling of accruals from the previous financial year. Both these factors had a direct bearing on the amount of cash available in 2015/2016. PPM 104 Number of schools visited by district officials for monitoring and support purposes New PM Schools are visited in accordance with their school improvement plans and in some instances schools may need more support than anticipated, especially with regard to learner performance and functionality. STATISTICAL TABLES (Not Audited) ST No Programme 1 Stats as on 31 March 2016 ST101 Percentage of learners in schools that are funded at a minimum level 75% ST102 ST103 Percentage of schools with full set of financial management responsibilities on the basis of assessment (ie Full Section 21 functions) Percentage of women in SMS positions. (Percentage of office based women in Senior Management Service) ST104 Percentage of women in Principalship posts 68% ST105 Percentage of women employees 66% ST106 Number of schools compensated in terms of the fee exemption policy % 21% Strategy to overcome areas of under performance Not all principals are yet submitting their school administration data as expected by the due dates. Exception reports are send from the provincial EMIS office every Monday to all down line managers of schools to take corrective action. In cases where there is habitual non-compliance consequence management is implemented. Cost containment measures are implemented in the Department. Provincial Treasury has established an intervention committee to provide support and guidance to the Department of Education and monitoring in particular the compensation budget.


50 49 Changes to planned targets: None Linking performance with budgets Sub-programme expenditure Administration

51 50

52 Programme 2: Public Ordinary School Education Program Objective: To provide public ordinary education for Grades 1 to 12 in accordance with the South African Schools Act Sub-programs: 1. Public Primary Level 2. Public Secondary Level 3. Human Resource Development 4. School sport, culture and media services 5. Conditional Grants Strategic objectives, performance indicators, planned targets and actual achievements The quality of the education system can be measured in different ways, but there is general agreement that the yearly Grade 12 results are the most prominent indicator. The implementation of the annual national assessments in Grades 3, 6 and 9 in language and mathematics brought an additional measurement of quality into the system. Although ANA was not written as expected in 2015, the 2014 results were still applicable to design intervention strategies for improving the language and mathematical skills and knowledge of learners and educators. Improved learner performance is underpinned by successfully addressing barriers to learning. This is the role of the inclusive education system which amongst other things established full service schools and school based support teams to assist learners as identified through SIAS. Further support is provided by those special schools that are resource centres. Increasingly psycho-socio support has to be provided to learners with barriers to learning as well as to the progressed learners. The details of the progress made in this regard is to be found in the section on the service delivery environment. The progress made with the provision of learning support materials (LTSM) is detailed in Sub-Outcome 2: Improved quality of Learning and Teaching through provision of adequate, quality infrastructure and learning materials. The aforementioned contributes to the achievement of the strategic goal 4: To improve learners performance in Grades 3,6,9 and 12 as demonstrated through regular assessment and tracking of progress as envisaged in the NDP, Chapter 9.
53 52 Strategic objectives: Programme: 2 Public Ordinary Schools Strategic objectives Provision of quality learning and teaching to all learners from Grade Improve teacher capacity and practices Increase access to high quality learning material Achievement 2014/2015 Planned Target 2015/2016 Achievement 2015/2016 Deviation from planned target to Achievement for 2015/2016 Comment on deviations There is a 2,6% increase in learner numbers which can be expected due to population migration This deviation of 5,8% is due to the cost containment measures resulting in fewer educators trained than planned There is a 2,6% increase in learner numbers which can be expected due to population migration.
54 53 Performance indicators Programme Name Performance Indicator Achievement 2014/2015 Planned Target 2015/2016 Achievement 2015/2016 Deviation from planned target to Achievement for 2015/2016 Comment on deviations PPM 201 Number of full service schools serving learners with learning barriers This one more full service school that could be added is not a material deviation from the target. PPM 202 Number of primary schools with overall passrate in ANA of 50% and above % ANA was not written as planned during 2015 due to a dispute within the industry, outside the managerial control of the FSDOE. Therefore the DoBE requested National Treasury, the Auditor General and the Department of Planning, Monitoring and Evaluation to exempt the Provincial Departments from reporting on ANA. PPM 203 Number of secondary schools with an overall passrate in ANA of 40% and above % ANA was not written as planned during 2015 and the DoBE requested National Treasury, the Auditor General and the Department of Planning, Monitoring and Evaluation to exempt the Provincial Department from reporting on ANA. PPM 204 Number of secondary schools with NSC passrate of 60% and above The province has the biggest percentage of progressed learners in the country which impacted on the expected passrate. The question papers of critical subjects had a demanding cognitive content.
55 54 Programme Name PPM 205 The percentage of children who turned 9 in the previous year who are currently enrolled in Grade 4 or a higher grade. New performance measure. 70% 70% N/A PPM 206 The percentage of children who turned 12 in the preceeding year and who are currently enrolled in Grade 7 or a higher grade. New performance measure. 50% 55,8% +5,8% An improved schooling system supported learners better so that more learners progressed through the system in accordance their age cohort. PPM 207 Number of schools provided with media resources % Cash flow challenges that the department experienced due to the accruals of the previous financial year that had to be settled in 2015/2016. PPM 208 Learner absenteeism rate New performance measure 2,5% 2,4% +0,1% This deviation is not material. PPM 209 Teacher absenteeism rate New performance measure 5,% 4,9% +0,1% This deviation is not material PPM 210 Number of learners in public ordinary schools benefitting from the no-fee school policy This increase is due to a number of schools that were moved from quintile 4 and quintile 5 to quintile 3 to be no fee schools. PPM 211 Number of educators trained on literacy, language content and methodology Grade 3 New PM Cost containment measures impacted on the training that could be provided. Grade 6 New PM N/A N/A
56 55 Programme Name Grade 9 New PM N/A N/A PPM 212 Number of educators trained on numeracy, mathematics content and methodology. Grade 3 New PM Cost containment measures impacted on the training that could be provided. Grade 6 New PM more teachers were trained than planned due to changes in the staff establishment of schools and subject allocations to teachers. Grade 9 New PM N/A N/A
57 56 STATISTICAL TABLES (Not Audited) ST No Programme 2 Stats as on 31 March 2016 ST201 Number of learners enrolled in public ordinary schools: Grade ST202 Number of educators employed in public ordinary schools ST203 Number of non educator staff employed in public ordinary schools ST204 Number of learners with access to the National School Nutrition Programme (NSNP) (The technical indicators indicate that the average of four quarters of the number of learners eating must be given as the annual figure) ST205 Number of learners eligible to benefit from learner transport ST206 Number of learners with special education needs identified in public ordinary schools ST207 Number of qualified teachers, aged 30 and below, entering the public service as teachers for the first time (permanently appointed from April 2015 to March 2016) ST208 Percentage learners who are in classes with no more than 45 learners 73,2% ST209 The percentage of youths who obtained a National Senior Certificate from a school. Please 83% note: in Dec 2015: 81,6% before remarking and supplementary exams by 31 May 2016: 83% after remarking and supplementary exams. 331 ST210 The percentage of learners in schools with at least one educator with specialist training on inclusion 26,3% ST211 Percentage of learners having access to workbooks per grade Not available ST212 Percentage of schools where allocated teaching posts are all filled 82% ST213 Percentage of learners having access to the required textbooks in all subjects Not available ST214 Number of secondary schools with an overall pass rate for the school of 60 and above in ANA (excluding Gr 12) N/A ST215 Number of learners screened through the Integrated School Health Programme Strategy to overcome areas of under performance Training that could not be provided during 2015/2016 due to cost containment measures will be progressively rolled out during 2016/2017. To improve the results, districts will increase parental and community involvement around issues that may disturb quality teaching and learning such as initiations, drug abuse, learners loitering in the streets during school hours. Increasing the phyco-social support provided to learners. Implementation of SIAS in the lower grades to early identification of barriers to learning. To address the underperforming schools support is provided through holiday schools, weekend classess, afternoon classess and examination preparation camps. Via the Internet Broadcasting Program of the University of the Free State, dedicated support is given to each subject and preparing learners for the examinations. Guides are provided to schools: Euclidean Geometry summaries for Maths learners, HeyMath! revision packs to all townships schools and copies of topographical maps to geography learners.


58 57 Changes to planned targets: None Linking performance with budgets Sub-programme expenditure Public Ordinary School Education

59 58
60 59 Program 3: Independent School Subsidies Program purpose: To support independent schools in accordance with the South African Schools Act. Sub-Programs: 1. Primary level 2. Secondary level Strategic objectives, performance indicators, planned targets and actual achievements During the year, 4 independent schools closed, ie Bethulie Christian Schools, Excelsior Akademie Christian School, Hope Christian Academy and Skynkaroo. There are now 74 registered independent schools of which 69 schools are operational. The other five schools are registered but have not yet started functioning. Out of the 69 schools, 11 schools are not being subsidized (either because schools have not requested a subsidy or because schools do not qualify to get a subsidy). Schools are visited regularly for purposes of monitoring and compliance. The learner numbers in independent schools can fluctuate because parents may decide to take their children to public schools. Only warm bodies are subsidized within the limits of the maximum number of learners budgeted for per school in accordance with the norms and standards for the funding of independent schools.
61 60 Programme Name: Independent Schools Subsidies Strategic objectives Achievement 2014/2015 Planned Target 2015/2016 Achievement 2015/2016 Deviation from planned target to Achievement for 2015/2016 Comment on deviations Subsidise learners and monitor independent schools Annually the planned number of learners in subsidized schools are calculated by taking the average of the May and August learner numbers in each school. A head count is then done to determine the actual learner numbers. When the department undertook the headcounts during 2015/2016 there were fewer learners than the planned figures. Parents have a choice to take their learners to independent schools. Programme Name: Independent Schools Subsidies Performance Indicators PPM 301 Number of subsidized learners in registered independent schools PPM 302 Achievement 2014/2015 perfor- mea- New mance sure Planned Target 2015/2016 Achievement 2015/2016 Deviation from planned target to Achievement for 2015/2016 Comment on deviations Schools closed and there were fewer learners than planned in the independent schools. Parents may decide to take their learners to public schools and not enrol them at independent schools. The planed target is calculated by taking the average of the May and August learners numbers of the previous year. A head count is then done to determine the actual warm bodies. Percentage of registered independent schools receiving subsidies perfor- mea- New mance sure 83,5% 84% +0,5% Out of the 69 registered and functioning independent schools, 58 are being subsidized. The other schools either did not request to be subsidized or do not meet the requirements for a subsidy.

62 61 Programme Name: Independent Schools Subsidies Performance Indicators PPM 303 Percentage of registered independent schools visited for monitoring and support Achievement 2014/2015 perfor- mea- New mance sure Planned Target 2015/2016 Achievement 2015/2016 Deviation from planned target to Achievement for 2015/2016 Comment on deviations 80% 69,4% -10,4% Cost containment measures impacted on the number of schools that were visited. Strategy to overcome areas of under-performance Visits to schools that were not visited in the period of Jan to March 2016 undertaken in the new financial year, right at the beginning of the 2 nd academic term in April Changes to planned targets: None Linking performance with budgets Sub-program expenditure Independent school subsidies

63 62 Program 4: Public Special Schools Program purpose: To provide compulsory education in special schools in accordance with the South African Schools Act and White Paper 6 on inclusive education: Building an Inclusive Education and Training System. Sub-programs: 1. Schools 2. School Sport, Culture and Media Services 3. Conditional Grants Historically, inequity in the provision of quality education and support was most evident in the Special Needs sector. In an attempt to address these past and current challenges, South Africa adopted the inclusive education policy: Education White Paper 6 on an inclusive education system. There are 21 special schools in the province to be found in four of the 5 educational districts with a total learner number of of which 4905 are 16 years and younger. Xhariep District does not as yet have a special school, but a site was identified in Trompsburg and the building of the school is at the procurement stage. Five of the special schools also serve as resource centres for nearby public schools to support their learners with barriers to learning. These schools are using their existing resources which mostly is appointed therapists and assistive devices. Teachers from the special schools are assisting mainstream teachers with more strategies to manage diversity in the classroom and assistive devises that these schools already have, thereby sharing their resources and expertise. Strategic Objectives Programme Name: Public Special Schools Education Strategic objectives To provide access to quality education to learners with special needs Achievement 2014/2015 Planned Target 2015/2016 Achievement 2015/2016 Deviation from planned target to Achievement for 2015/2016 Comment on deviations This deviation is not material.
64 63 Performance Indicators Programme Name Public Special Schools Education Performance indicators PPM 401 Achievement 2014/2015 Planned Target 2015/2016 Achievement 2015/2016 Deviation from planned target to Achievement for 2015/2016 Comment on deviations Percentage of learners with special needs in special schools retained in school until age 16 PPM 402 Percentage of special schools serving as Resource Centres New PM 5% 5% N/A N/A New PM 14% 24% +10% Two more schools could function as resource centres because these schools have human and physical resources to support nearby schools. Statistical Tables (Not Audited) ST No Programme 4 Stats as on 31 March 2016 ST401 Number of learners enrolled in public special schools ST402 Number of educators employed in public special schools 638 ST403 Number of professional support staff employed in public special schools 109 ST404 Number of non-professional and non-educator staff employed in public special schools 519 ST405 Number of special schools 21 ST406 Number of learners in special schools with assistive devices. 158 Public special school education


65 64 Program 5: Early Childhood Development Program purpose: To provide Early Childhood Education (ECD) at Grade R and Pre-Grade R in accordance with White Paper 5. Sub-programs: 1. Grade R in public schools 2. Grade R in Early Childhood development centres 3. Conditional Grant Strategic objectives, performance indicators, planned targets and actual achievements The National Development Plan acknowledges the importance of exposing young children to quality Grade R which has a direct bearing upon their achievements throughout their schooling and in fact throughout their lives. Therefore the department remains steadfast in its commitment to the expansion of Grade R and to providing quality ECD programme. The department took a multi-pronged approach to realise government s commitment to improve qual-
66 65 ity education in the first two years of formal schooling, ie. Pre-Grade R and Grade R. This multi-pronged approach includes the provision of human resources, Learning and Teaching Support Materials (LTSM), Continuing Professional Development (CPD) for practitioners from public schools and community based sites and the incremental introduction of Grade R in Public schools. The department is working closely with other sister departments, namely the Department of Health and the Department of Social Development in its attempt to provide quality education. With regard to Pre-Grade R the Department is responsible to provide National Curriculum Framework (NCF) support to Pre-Grade R practitioners who are employed by the Department of Social Development. The department of education has to 646 public schools with Grade R classes. The incremental expansion of Grade R in public schools provided access to Grade R learners during During 2015/2016 the Department also subsidized Grade R learners housed in 263 community based sites. The department is also focussed on the upskilling of the qualifications of Grade R practitioners. Currently 319 Grade R practitioners are qualified at REQV 13 and 96 have Grade 12, the other 1004 are qualified in between Grade 12 and REQV 13. This means that all of the practitioners have at least NQF 4, Grade 12. More detailed delivery reports are to be found in Sub-Outcome 4: Improve quality of Grade R and extension of early childhood development. Strategic Objectives Programme Name Strategic objectives Access to quality Early Childhood Development Achievement 2014/2015 Planned Target 2015/2016 Achievement 2015/2016 Deviation from planned target to Achievement for 2015/2016 Comment on deviations learners All the Grade R classrooms are not yet build at public ordinary schools and therefore fewer learners could be accommodated in Grade R at public schools. It should be noted that there are Grade R learners in ECD sites that the department is supporting but who have not yet migrated from the sites to public schools. practitioners As soon as there is space (new Grade R classrooms to be build) at ordinary public schools for Grade R learners, the number of practitioners will also increase.
67 66 Performance Indicators Programme Name Performance Indicator Achievement 2014/2015 Planned Target 2015/2016 Achievement 2015/2016 Deviation from planned target to Achievement for 2015/2016 Comment on deviations PM 501 Number of public schools that offer Grade R The building of Grade R classrooms are being rolled out at schools. Not all the Grade R classrooms were built during 2015/2016 as planned. As these classroom are completed, the number of public schools that offer Gr R will increase. PM 502 Percentage of Grade R learners who have received formal Grade R education PM 503 Percentage of employed ECD pracitioners with NQF level 4 and above. 69% 97% 77% -20% As Grade R classrooms are completed at ordinary public schools, learners will move from the ECD sites and centres to public schools and the percentage will then increase. New PM 55% 100% +45% After verification of qualifications it was established that all employed on PERSAL are qualified at NQF Level 4 and above. Grade 12 is equal to NQF Level 4.
 1419 ST503 Number of ECD practitioners trained 1 043 ST504 Number of learners enrolled in Pre-grade R (in ECD sites and centres registered with Social")
68 67 Statistical Tables (Not Audited) ST No Programme 5 Stats as on 31 March 2016 ST501 Number of learners enrolled in Grade R in public schools ST502 Number of Grade R practitioners employed in public ordinary schools (per quarter) 1419 ST503 Number of ECD practitioners trained ST504 Number of learners enrolled in Pre-grade R (in ECD sites and centres registered with Social Development) Information not available. Strategies to overcome areas of underperformance Speed up the building of Grade R facilities at ordinary public schools. In the meantime, support the Grade R learners where they are. Changes to planned targets: None Linking performance with budgets Sub-Program expenditure Early childhood development


69 68 Program 6: Infrastructure Development Program Purpose: To provide and maintain infrastructure facilities for schools and administration. Sub programs: 1. Administration 2. Public Ordinary schools 3. Special Schools 4. Early Childhood Development
70 69 Strategic Objectives, performance indicators, planned targets and actual achievements The South African School s Act put an obligation to the department to ensure access to education to all the learners in the province. The programme aims to ensure that the infrastructure required to improve access to basic education is increased within the Free State Province. Certain areas within the province are experiencing serious shortages of basic educational facilities leading to overcrowding and over-use of existing facilities. The targets achieved as set out below contributes to the strategic goal number 5 to provide infrastructure and learning materials to support quality education. This links to Sub-Outcome 2: Improved Quality of Learning and Teaching through provision of adequate quality infrastructure and learning materials of Outcome 1. The NDP sees infrastructure development as key to the economic and social transformation of the country and as such these programs in education contribute towards that developmental goal. It should be noted the practical and works completion certificates are considered for the project to be completed and ready for occupation and/or usage. Final completion certificates may only come at a later stage. The stage of completion for each project is indicated below: PM Public ordinary schools provided with water supply 1. Annaspan Farm School (Practical & Final Completion) 2. Bopapedi Farm School (Practical & Final Completion) 3. Daljosafat Farm School (Practical & Final Completion) 4. Duikfontein Farm School (Practical Completion) 5. Emfulaneni Farm School (Practical Completion) 6. Esihlahleni Farm School (Practical Completion) 7. Gedenk Farm School (Practical Completion) 8. Majweng Farm School (Practical Completion) 9. Modiya Farm School (Practical Completion) 10. Molekane Farm School (Practical Completion) PM Public ordinary schools supplied with sanitation facilities: 1. Fateng Sa Thuto Primary School (educator toilet block) (Practical & Works Completion) 2. Moroka H/S (Final Completion) 3. Namanyane P/S (Practical Completion) 4. Phetogane S/S (two new toilet blocks) (Practical & Works Completion) 5. Sebabatso P/S (ablution block) Final Completion 6. Sindekile P/S Parys (educator toilet block) Practical & Works Completion 7. W Thejane I/S: Final Completion PM classrooms build in total at the following schools: 1. Emang (4 classrooms) (Practical & Works Completion) 2. Ikaheng Zakheni S/S, Petrus Steyn (4 classrooms) (Practical & Works Completion) 3. Kroon P/S (3 classrooms) (Practical Completion) 4. Makgulo P/S (3 classrooms) (Final Completion) 5. Mokeng P/S, Kroonstad (4 classrooms) Final Completion 6. Mphatlalatsane Special School, Viljoenskroon (5 classrooms) (Practical, Works & Final Completion) 7. Naledi I/S (3 classrooms) (Practical & Works Completion) 8. Ntswanatsatsi P/ Cornelia (4 classrooms) (Final Completion)
71 70 9. Paul Roux I/ (4 classrooms) (Practical Completion) 10. SHS Mofube (2 classrooms) (Final Completion) 11. Tshepano P/S Fouriesburg (6 classrooms) (Practical & Works Completion) PM specialist rooms built in the following public ordinary schools 1. Albert Moroka, Thaba Nchu (2 X computer rooms) (Final Completion) 2. Boitumelo S/S Ficksburg, (2 X science labs) = 2 X rooms) and (2 X computer rooms) = 4 rooms (practical completion) 3. Goronyane S/S (physical science laboratory = 2 rooms) (Final Completion) 4. Lenyora la Thuto S/S (2 X computer rooms) (Final Completion) 5. Malakabeng, P/S Sasolburg (2 X labs = 2 rooms) (Practical & Works Completion) 6. Matla P/S, Bloemfontein Phase 6 (2 X computer rooms) (Practical Completion) 7. Ntemoseng, Botshabelo (2 X computer rooms) Final Completion 8. Ntuthuzelo, P/S (2 X computer rooms) Final Completion 9. Phetogane S/S (1 new laboratory = 2 X science labs) (Practical & Works Completion) 10. Phetogane, S/S Thaba Nchu (2 X computer rooms) (Final Completion) 11. Seemahale, S/S Botshabelo (2 X computer rooms) (Final Completion) 12. Senakangwedi S/S (media centre = 2 X computor rooms) (Final Completion) 13. Setjhaba se Maketse S/S (language laboratory = 1 X room) (Final Completion) 14. Strydom S/S Thaba Nchu (2 science = 2 rooms) (Final Completion) 15. Tlotlanang C/S Thaba Nchu (2 X computer rooms) (Final Completion) 16. Tlotlisong, S/S (2 X science laboratories = 2 rooms) (Practical & Works Completion) PM New schools completed and ready for occupation (includes replacement schools) 1. Caledon Park (Practical Completion) 2. Dorrington Matsepe I/S Mokeng (Final Completion) 3. Letlotlo Naledi P/S (new) (Practical Completion) 4. Luckhoff C/S (Practical Completion) 5. Phele Ya Pele, Viljoensdrift, Vereeniging (Practical Completion) 6. Phephetso SS/S (Maokeng) (Practical Completion) 7. Ntsu Secondary School, Bethlehem (Practical Completion) 8. Vredefort P/S (Final Completion) PM New schools under construction (includes replacement schools) 1. Amelia Pr School, Sasolburg 2. Bethlehem Comb Schoolo 3. Bohlokong Pr School, Bethlehem 4. Boshoff ntermediate School 5. Caleb Motshabi Pr School 6. Clarens Pr School 7. Diamanthoogte Combined SchoolGrassland Sec School, Bloemfontein 8. Grassland, Pr School, Bloemfontein
72 71 9. Heide Pr School 10. Itemoheng Pr School 11. Malebogo Pr School, Hertzogville 12. Nampo Sec School 13. Qalabotjha Sec SchoolTjebelopele Pr School 14. Tlholo Pr School, Botshabelo 15. Tweespruit Pr School PM Grade R classrooms built 1. Aha Setjhaba, Parys (3 classrooms)(final Completion) 2. Caledon Park (2 classrooms) (Practical Completion) 3. Dorrington Matsepe (3 classrooms) (Final Completion) 4. Inoseng P/S (3 classrooms) (Practical & Works Completion) 5. Itemeleng P/S (3 classrooms) (Practical & Works Completion) 6. Letotolo P/S Qwaqwa (3 classrooms) (Practical Completion) 7. Luckhoff (2 classrooms) (Practical Completion) 8. Meqheleng P/S (3 classrooms)(practical Completion) 9. Phano P/S Ramahutsi (3 classrooms) (Final Completion) 10. Phillippolis Pr School (3 classrooms) (Practical & Works Completion) 11. Phomello P/S (3 classrooms) (Final Completion) 12. Reaitumela P/S Kroonstad (3 classrooms)(practical Completion) 13. Schonkenville, Parys (3 classrooms) (Pactical & Works Completion) 14. Thuto Tsebo P/S Lindley (3 classrooms) (Practical Completion) 15. Trompsburg P/S (3 classrooms) (Practical & Works Completion) 16. Vredefort (3 classrooms) (Practical Completion) 17. Winburg C/S (3 classrooms) (Practical Completion) PM Hostels built 1. Bainsvlei Hostel (Practical & Works Completion) 2. Sediti Hostel (Practical Completion) 3. Ventersurg Hostel (Practical Completion)
73 72 Strategic objectives Programme Name: Infrastructure Development Strategic objectives To provide new physical infrastructure, maintain and renovate existing infrastructure in education institutions in line with the infrastructure plan. Performance indicators Achievement 2014/2015 Planned Target 2015/2016 Achievement 2015/ new schools 6 new schools 8 new schools which include replacements schools. Deviation from planned target to Achievement for 2015/2016 Comment on deviations +2 More replacement schools could be completed. Programme Name: Infrastructure Performance Indicators PM 601 Achievement 2014/2015 Planned Target 2015/2016 Achievement 2015/2016 Deviation from planned target to Achievement for 2015/2016 Comment on deviations Number of public ordinary schools provided with water supply PM 602 Number of public ordinary schools provided with electricity N/A N/A These projects are funded through the ASIDI basic services program. The procurement and appointment of service providers is managed by the DBE. The concurrence documents for 8 schools were received recently and these projects will commence in 2016/2017. The concurrence documents for the other projects are being awaited from DBE.
74 73 Programme Name: Infrastructure Performance Indicators Achievement 2014/2015 Planned Target 2015/2016 Achievement 2015/2016 Deviation from planned target to Achievement for 2015/2016 Comment on deviations PM 603 Number of public schools provided with sanitation facilities The remaining projects are funded through the ASI- DI basic services program, therefore procurement and appointment of service providers is managed by DBE. Concurrence documents recently received will start those projects in 2016/2017. PM 604 Number of classrooms build in public ordinary schools As per EXCO resolution some projects were implemented by Public Works through contractor development program. Target not yet achieved due to delays in the implementation of the program. PM 605 Number of specialist rooms build in public ordinary schools The target in the draft user asset management plans was set at 149. The achievable target of 30 was set in the final U-AMP. This was achieved.
75 74 Programme Name: Infrastructure Performance Indicators Achievement 2014/2015 Planned Target 2015/2016 Achievement 2015/2016 Deviation from planned target to Achievement for 2015/2016 Comment on deviations PM 606 Number of new schools completed and ready for occupation (including replacement schools) The one school, Hani Park is constructed using alternative technology and at some stage the contractor was faced with challenges of material availability from manufacturers. The other 9 schools ae not yet completed due to delays in the procurement process of the implementing agent. PM 607 New schools under construction (include replacement schools) PM 608 Number of Grade R classrooms built. PM 609 Number of hostels built New PM The concurrence documents for the remaining 5 schools were received recently. These projects will commence in 2016/2017. New PM As per EXCO resolution, some of the projects were implemented by public works through contractor development program. Target not yet achieved due to delays in the implementation of the contractor development program. New PM The three hostels completed are Bain s Vlei, Sediti and Ventersburg. Steynsrus is not yet fully completed.

76 75 Programme Name: Infrastructure Performance Indicators PM 610 number of schools undergoing scheduled maintenance Achievement 2014/2015 Planned Target 2015/2016 Achievement 2015/2016 Deviation from planned target to Achievement for 2015/2016 Comment on deviations New PM Schools submit requests to the department for maintenance. However there will also be emergencies. More requests were received than anticipated but all schools could be assisted within the budget allocation. Strategy to overcome areas of under-performance Implement the projects in 2016/2017 of which the concurrence documents were received late in the 2015/2016 year or after the closure of the 2015/2016 year. Changes to planned targets. None Linking performance with budgets Sub-Program Expenditure Infrastructure development


77 76

78 77 Program 7: Examination and Education Related Services Program Purpose: To provide education institutions as a whole with examination and education related services. Sub-Programs: 1. Payment to SETA 2. Professional Services 3. Special Projects 4. External Examinations 5. Conditional Grants Strategic objectives, performance indicators, planned targets and actual achievements The Department has maintained its steady improvement of the quality of the learning outcomes over the past six years. For instance, as of 2012, the department s performance in the National Senior Certificate (NSC) examinations entered the 80% pass range which is an indication of curriculum stability. The 2015 Grade 12 passrate was 81.6% and the bachelor passrate increased from in 2014 to in 2015 which increased even more after remarking and supplementary exams to 83% and bachelors passrate to learners at 29,9%. In the 2015 Academic Year, the department increased its number of registered candidates to which is the highest figure ever in its history and it further registered the highest percentage of progressed learners in the country, that is, 28 %. The details of learner performance in the NSC are captured in the chapter on the delivery environment and in the Outcomes based report of Sub-Outcome 1: Improved Quality of Learning and Teaching through development, supply and effective utilization of teachers. This outcome also gives the details on the strategies implemented for improved teacher practices which amongst other things are the training of teachers in critical areas. The improvement of learner performance in Grades 3,6,9 and 12 as demonstrated through regular assessment and tracking of progress is strategic goal number 5 and supports the NDP in the improvement of the knowledge and skills base of the country.
79 78 Strategic Objective Programme Name Strategic objectives Prepare and administer ANA for Grades 3,6 and 9 and the NSC for Grade 12 Achievement 2014/2015 Planned Target 2015/2016 Achievement 2015/2016 Deviation from planned target to Achievement for 2015/2016 Comment on deviations Zero ANA was not written as expected in 2015 due to issues within the education sector related to labour matters and outside the managerial control of the Department. Therefore the NDoBE requested the National Auditor General, National Treasury, DG of Department of Planning, Monitoring and Evaluation to exempt the provinces from reporting on ANA. Performance Indicators Programme Name: Examination and Education Related Serivices Performance indicators PPM 701 Percentage of learners who passed NSC PPM 702 Achievement 2014/2015 Planned Target 2015/2016 Achievement 2015/ % 83% -7% Deviation from planned target to Achievement for 2015/2016 Comment on deviations The province had the highest percentage of progressed learners in the country in 2015, that is 29%. Percentage of Grade 12 learners passing at Bachelor level 40% 29,9% -1,1% Demanding cognitive demand of some question papers. Limited resources to provide adequate academic and psychosocial support. PPM 703 Percentage of Grade 12 learners achieving 50% or more in Mathematics. 30% 28,3% -1,7% The standard and cognitive demands of all Maths examination papers are high. The most challenging topics are trigonometry, probability and statistics.
80 79 Programme Name: Examination and Education Related Serivices Performance indicators PM 704 Achievement 2014/2015 Planned Target 2015/2016 Achievement 2015/2016 Deviation from planned target to Achievement for 2015/2016 Comment on deviations Percentage of Grade 12 learners achieving 50% or more in Physical Science PPM 705 Percentage of Grade 3 learners achieving 50% and above in home language in ANA 30% 26,2 3,8% The standard and the cognitive demands of the papers were high. 70,% 0% -100% ANA was not written as expected in 2015 due to issues within the education sector related to labour matters and outside the managerial control of the Department. Therefore the NDoBE requested the National Auditor General, National Treasury, DG of Department of Planning, Monitoring and Evaluation to exempt the Provinces from reporting on ANA. PPM 706 Percentage of Grade 3 learners achieving 50% and above in Mathematics in ANA 70% 0% -100% ANA was not written as expected in 2015 due to issues within the education sector related to labour matters and outside the managerial control of the Department. Therefore the NDoBE requested the National Auditor General, National Treasury, DG of Department of Planning, Monitoring and Evaluation to exempt the provinces from reporting on ANA
81 80 Programme Name: Examination and Education Related Serivices Performance indicators PPM 707 Percentage of Grade 6 learners achieving 50% and above in home language in ANA Achievement 2014/2015 Planned Target 2015/2016 Achievement 2015/ % 0% -100% Deviation from planned target to Achievement for 2015/2016 Comment on deviations ANA was not written as expected in 2015 due to issues within the education sector related to labour matters and outside the managerial control of the Department. Therefore the NDoBE requested the National Auditor General, National Treasury, DG of Department of Planning, Monitoring and Evaluation to exempt the provinces from reporting on ANA PM 708 Percentage of Grade 6 learners achieving 50% above in Mathematics in ANA 60% 0% -100% ANA was not written as expected in 2015 due to issues within the education sector related to labour matters and outside the managerial control of the Department. Therefore the NDoBE requested the National Auditor General, National Treasury, DG of Department of Planning, Monitoring and Evaluation to exempt the provinces from reporting on ANA
82 81 Programme Name: Examination and Education Related Serivices Performance indicators PPM 709 Achievement 2014/2015 Planned Target 2015/2016 Achievement 2015/2016 Deviation from planned target to Achievement for 2015/2016 Comment on deviations Percentage of Grade 9 learners achieving 50% and above in home language in ANA 60% 0% -100% ANA was not written as expected in 2015 due to issues within the education sector related to labour matters and outside the managerial control of the Department. Therefore the NDoBE requested the National Auditor General, National Treasury, DG of Department of Planning, Monitoring and Evaluation to exempt the provinces from reporting on ANA PPM 710 Percentage of Grade 9 learners achieving 50% and above in Mathematics in ANA 50% 0% -100% ANA was not written as expected in 2015 due to issues within the education sector related to labour matters and outside the managerial control of the Department. Therefore the NDoBE requested the National Auditor General, National Treasury, DG of Department of Planning, Monitoring and Evaluation to exempt the provinces from reporting on ANA Statistical Tables ST No Programme 7 Link Stats for 31 Dec 2015 Stats as on 31 May 2016 after remarking and supplementary exams ST701 Number of learners in Grade 12 who wrote National Senior Certificate MTSF (NSC) examinations ST702 Number of learners who passed National Senior Certificate (NSC) MTSF ST703 Number of learners who obtained Bachelor passes in the National Senior Certificate (NSC) MTSF
83 82 ST No Programme 7 Link Stats for 31 Dec 2015 Stats as on 31 May 2016 after remarking and supplementary exams ST704 Number of learners who passed Maths in the NSC examinations MTSF ST705 Number of Grade 12 achieving 50% or more in Mathematics MTSF ST706 Number of learners who passed physical Science in the NSC examination MTSF ST707 Number of Grade 12 achieving 50% or more in Physical Science MTSF ST708 Number of Grade 3 learners achieving 50% and in Home Language in the Annual National Assessment(ANA) MTSF ST709 Number of Grade 3 learners achieving 50% and in Mathematics in MTSF the Annual National Assessment(ANA) ST710 Number of Grade 6 learners achieving 50% and in Home Language in the Annual National Assessment(ANA) MTSF ST711 Number of Grade 6 learners achieving 50% and in Mathematics in MTSF No results No results for the Annual National Assessment(ANA) for 2015 as 2015 as ANA was ST712 Number of Grade 9 learners achieving 50% and in Home Language MTSF ANA was not written. in the Annual National Assessment(ANA) not written. ST713 Number of Grade 9 learners achieving 50% and in Mathematics in the Annual National Assessment(ANA) MTSF Strategies to overcome areas of under-peformance A directive will come from DBE to indicate how to proceed with the annual national assessments in future. In preparation for the Annual National Assessments of Grades 1 to 9, the 2014 ANA diagnostic report, previous years ANA exemplars, tests and guidelines, notes on rules of language, group work activities and MUST DO activities for Languages were distributed to schools. Dictionaries, CDs for listening and speaking, CD Radio players as well as English Readers were procured and distributed to focus schools. In order to boost Maths performance at schools, Mathematics tutorial sessions for 594 learners from five clustered schools were held in August 2015 and 900 learners participated at district Mental Maths competitions with 90 learners going on to participate at the Provincial competition. 358 Grades 5-7 learners participated in the Horizon Mathematics Competition on 9 May To improve learners literacy and language skills, the Pen Pal Project (township and suburb schools), in which 480 learners in 24 schools from Xhariep, Motheo and Thabo Mofutsanyana took part, was celebrated in November Participation in Language Enrichment competitions in five districts included the following: Reading with 36 schools taking part, Debate with 35 schools taking part, Spelling Bee with 768 learners from 185 schools and Drama and Poetry Performances. To further improve performance of learners, provincial common tests for Mathematics, EFAL and EHL were written by Grades 4 to 7 learners in focus schools across the province. The department also introduced common quarterly tests for Grades 1 and 2 English as well as for Mathematics, English FAL and Home Languages. There are plans in place for Grade 7 learners to write a common examination in November 2016 in Mathematics, English FAL and Home Language, African Languages and Natural Science. This strategy is to ensure that learners are readily prepared for Grade 8. To improve the situation with the Grade 12 performance overall and in science and maths the following are the strategies: An academic support program was rolled out in the form of weekend and vacation classes as well as special camps for progressed learners. The learners were provided with the following: copies of study guides, DVD s of recorded lessons from IBP, abridged work schedule and CD with old question papers and memoranda. Special vacation support program was developed in partnerships with Kutlwanong, HeyMath! and UFS to support all learners. Additional programs to increase distinctions was conducted in the winter and spring holidays in partnership with CUT. During a curriculum Lekgotla held early in 2016, the following ten strategies were embarked on: Improving proficiency in the language of learning and teaching, building of institutional capacity, improving on the management of resources in schools, data driven interventions for under-performing schools, a stakeholder management program to increase stakeholder involvement, strengthening of accountability, monitoring of contact time, providing differentiated support to learners, including


84 83 psycho-social support and finally an adopt a school program by leadership. Changes to planned targets None. Linking performance with budget Sub-program expenditure Examination and education related services

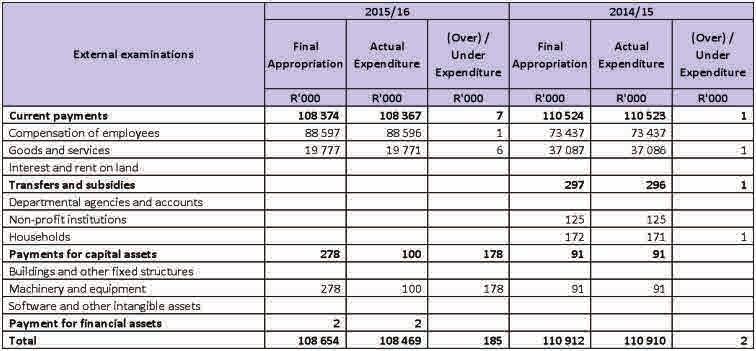
85 84
 (j) of the PFMA Amount transferred R'000 Amount")
86 85 5. TRANSFER PAYMENTS 5.1. Transfer payments to public entities Name of transferee Type of organisation Purpose for which the funds were used Did the Dept comply with S38(1) (j) of the PFMA Amount transferred R'000 Amount spent by the entity R'000 SA Broadcast Commission SABC Broadcast licences Yes 10 N/A N/A Skills Education Training Autorities SETA Skills development levy Yes N/A N/A Reasons for the funds unspent by the entity 5.2. Transfer payments to all organisations other than public entities The Free State Department of Education annually transfer subsidies to schools that are registered in terms of Section 20 and 21 of the South African Schools Act. These subsidies are appropriated through the annual Free State Act that is included in the annual appropriation of the Department. The table below reflects the transfer payments made for the period 1 April 2015 to 31 March 2016 Name of transferee Type of organisation Purpose for which the funds were used Did the Dept comply with S38(1) (j) of the PFMA Amount transferred R'000 Amount spent by the entity R'000 Reasons for the funds unspent by the entity Public Ordinary Schools - Section 21 Schools Public Ordinary Schools LTSM, recurrent, maintenance cost related to schools Yes N/A N/A National School Yes N/A N/A Nutrition Programme Hostel Subsidies Yes N/A N/A Subsidies to SGB Yes 122 N/A N/A affiliated Schools Public Ordinary Schools - Section 20 Schools Public Ordinary Schools No fee subsidies Yes N/A N/A Independent schools Independent Schools & Institutions Learner subsidies Yes N/A N/A Public Special Schools Special Schools Learner and hostel subsidies Yes N/A N/A Early Childhood Development Public Ordinary Schools LTSM, recurrent, Yes N/A N/A maintenance cost Community centres related towards Yes 572 N/A N/A Grade R
87 86 6. CONDITIONAL GRANTS 6.1. Conditional grants and earmarked funds paid The table below describes each of the conditional grants and earmarked funds paid by the department. Conditional Grant 1: Mathematics, Science and Technology Grant Conditional Grant 1 Mathematics, Science and Technology Grant Department to whom the grant has been transferred EDUCATION To provide support and resources to school teachers and learners for the improvement of MST teaching and learning at selected public schools. Purpose of the grant To improve the achievement of learner participation and success rates, teacher demand, supply, utilization, development and support, school resourcing and partnerships, consistent with targets set in the Action Plan 2019 and the NDP. ICT Resources 37 Schools to be supplied with Computers 28 Schools to be supplied with Software 23 Schools to be supplied with Broadcasting Equipment Workshop Resources 13 Schools to be supplied with Equipment 06 Schools to be supplied with machinery 17 Schools to be supplied with tools Expected outputs of the grant Laboratories and Workshop Equipment, Apparatus and consumables 76 Laboratories supplied with Maths Kits 23 Laboratories to be supplied with Science Kits 53 Laboratories to be supplied with Science Apparatus 59 Laboratories to be supplied with Maths Consumables 59 Laboratories to be supplied with Science Consumable 76 Laboratories to be supplied with Technology Consumables Learner Support 1200 Learners to be registered for Olympiads, Competitions, Fairs and Expos 300 Learners supported for Camps (Dinaletsana) Teacher Support Teachers to be supported for CAPS 11 Teacher Training Teachers to be supported for other MST Subject Training 500 Teacher to be supported for ICT Integration Training
88 87 Conditional Grant 1 Mathematics, Science and Technology Grant ICT Resources 37 Schools supplied with Computers 28 Schools supplied with Software 23 Schools supplied with Broadcasting Equipment Workshop Resources 14 Schools supplied with Equipment Machinery and Tools Laboratories and Workshop Equipment, Apparatus and consumables outputs achieved 76 Laboratories to be supplied with Maths Kits 23 Laboratories to be supplied with Science Kits 53 Laboratories to be supplied with Science Apparatus 54 Laboratories to be supplied with Technology Consumables Learner Support 1200 Learners registered for Olympiads, Competitions, Fairs and Expos 300 Learners supported for Camps (Dinaletsana) Teacher Support 110 Technical Maths Teachers, to supported for CAPS 11 Teacher Training 58 Physical Science Teachers supported for other MST Subject Training 90 Teachers supported for ICT Integration Training Amount per amended DORA (R 000) R Amount transferred (R 000) R Reasons if amount as per DORA not transferred Not applicable as all funds were recieved R Spent Amount spent by the department (R 000) R Committed R Uncommitted R Amount requested for roll-over
89 88 Conditional Grant 2: HIV and AIDS (Life Skills Education) Grant Conditional Grant 2 Department to whom the grant has been transferred Purpose of the grant HIV and AIDS (Life Skills Education) Grant EDUCATION To support South Africa s HIV prevention strategy by increasing sexual and reproductive health knowledge, skills and appropriate decision making among learners and educators. To mitigate the impact of HIV and TB by providing a caring, supportive and enabling environment for learners and educators. To ensure the provision of a safe, rights-based environment in schools that is free of discrimination, stigma and any form of sexual harassment/abuse To reduce the vulnerability of children to HIV, TB and sexually transmitted infections (STIs) with a particular focus on orphaned and vulnerable children. Expected outputs of the grant Increased HIV, STI and TB knowledge and skills amongst learners, educators and officials Decrease in higher risk sexual behaviour among learners, educators and officials outputs achieved Decreased barriers to retention in schools, in particular for vulnerable learners Key performance areas Training and development 781 teachers trained (life skills sexuality education) Peer Education 900 learners trained, 242 Soul Buddyz clubs LTSM 174 First Aid Kits distributed, 6628 RADS books, posters, study skills manual procured and distributed Care and Support Drug and substance use training 396 schools Learner pregnancy programmes 137 school Advocacy HIV and TB awareness, learners, 1631 educators, 883 school reached Monitoring and Evaluation 121 school visits Amount per amended DORA allocated (R 000) roll over Amount transferred (R 000) Reasons if amount as per DORA not transferred Amount spent by the department (R 000) Reasons for the funds unspent by the entity Not applicable as all funds were recieved Wrong allocation of compensation
90 89 Conditional Grant 2 Monitoring mechanism by the transferring department HIV and AIDS (Life Skills Education) Grant Monitoring visits Conditional Grant 3: National School Nutrition Programme Grant Conditional Grant 3 Department to whom the grant has been transferred Purpose of the grant Expected outputs of the grant National School Nutrition Program EDUCATION To provide nutritious meals to targeted schools A total of learners in Primary, secondary and selected special schools to benefit from the NSNP grant. The programme will engage volunteer food-handlers (VFH) to prepare meals for the learners. outputs achieved A total of learners in schools benefitted from this programme in 2015/16. The programme has engaged volunteer food-handlers (VFH) who are involved in the preparation of meals for the learners during this financial year. Amount per amended DORA R (R 000) Amount transferred (R 000) R Reasons if amount as per DORA not transferred Amount spent by the department/ municipality (R 000) Reasons for the funds unspent by the entity Monitoring mechanism by the transferring department Not applicable as all funds were recieved R Funds were committed for procurement of Goods & services, non-payment of sundry payments Quarterly Reports are submitted, Annual Conditional Grant Evaluation is conducted Conditional Grant 4: Education Infrastructure Grant Conditional Grant 4 Department/ Municipality to whom the grant has been transferred Education Infrastructure Grant EDUCATION To help accelerate construction, maintenance, upgrading and rehabilitation of new and existing infrastructure in education including district and circuit accommodation Purpose of the grant To enhance capacity to deliver infrastructure in education To address damage to infrastructure caused by natural disasters To address achievement of the targets set out in the minimum norms and standards for school infrastructure
91 90 Improved quality education service delivery by provincial departments as a result of an improved and increased stock of schools infrastructure Aligned and coordinated approach to infrastructure development at the Improved education infrastructure expenditure patterns Improved response to the rehabilitation of school infrastructure affected by natural disasters Expected outputs of the grant Improved rates of employment and skills development in the delivery of infrastructure provincial sphere Improved education infrastructure expenditure patterns Improved response to the rehabilitation of school infrastructure affected by natural disasters Improved rates of employment and skills development in the delivery of infrastructure outputs achieved Amount per amended DORA (R 000) Amount transferred (R 000) Reasons if amount as per DORA not transferred Amount spent by the department/ municipality (R 000) Reasons for the funds unspent by the entity Monitoring mechanism by the transferring department Facility Outcome Classrooms 33 Laboratories 10 Libraries 11 Computer Rooms 12 Halls 2 Offices & other Rooms 110 R R Not applicable as all funds were recieved R Delays due to change in procurement methodologies Delays due to non-performance by contractors Submission of the IRM Quarterly Reports Conditional Grant 5: Expanded Public Works Program Integrated Grant for Provinces Conditional Grant 5 Expanded Public Works Program Integrated Grant for Provinces Department/ Municipality to whom the grant has been transferred EDUCATION
92 91 Conditional Grant 5 Expanded Public Works Program Integrated Grant for Provinces Purpose of the grant Expected outputs of the grant outputs achieved To incentivise provincial departments to expand work creation efforts through the use of labour intensive delivery methods in the following identified focus areas, in compliance with the EPWP guidelines: o road maintenance and the maintenance of buildings o low traffic volume roads and rural roads o other economic and social infrastructure o tourism and cultural industries o sustainable land based livelihoods Waste management Number of people employed and receiving income through the EPWP Increased average duration of the work opportunities created 203 People employed Amount per amended DORA R3 108 Amount transferred (R 000) R3 108 Reasons if amount as per DORA not transferred Amount spent by the department (R 000) Reasons for the funds unspent by the entity Monitoring mechanism by the transferring department Not applicable as all funds were recieved R3 108 N/A A Programme Manager has been assigned to oversee the delivery of this Project Conditional Grant 6: Social Sector EPWP Incentive Grant Conditional Grant 6 Social Sector EPWP Incentive Grant Department/ Municipality to whom the grant has been transferred Purpose of the grant Expected outputs of the grant outputs achieved Amount per amended DORA (R 000) Amount transferred (R 000) Reasons if amount as per DORA not transferred EDUCATION To incentivise the provincial Social Sector departments identified to increase job creation by focusing on the strengthening and expansion of social service programmes that have employment potential. Increased number of Teacher Assistants employed and receiving stipend Increased number of learners receiving Teacher Assistance services Increased number of schools receiving Teacher Assistance services 141 Teacher Assistants employed and received stipends learners received Teacher Assistance services 141 schools receiving Teacher Assistance services R1 000 R1 000 Not applicable as all funds were recieved
93 92 Conditional Grant 6 Social Sector EPWP Incentive Grant Amount spent by the departmen (R 000) Reasons for the funds unspent by the entity Monitoring mechanism by the transferring department R981 N/A Conditional Grant 7: OSD for Therapists Conditional Grant 7 OSD for therapists Department/ Municipality to whom the grant has been transferred Purpose of the grant Expected outputs of the grant outputs achieved Amount per amended DORA (R 000) Amount transferred (R 000) Reasons if amount as per DORA not transferred Amount spent by the department (R 000) Reasons for the funds unspent by the entity Monitoring mechanism by the transferring department EDUCATION To ensure that qualifying educational therapists, counsellors and psychologists covered by Education Labour Relations (ELRC) Collective Agreement 1 of 2012 are adequately compensated by augmenting baseline compensation budget of the Provincial Education Departments. The sole grant output is to ensure that PEDs meet the payment obligations to comply with Education Labour Relations (ELRC) Collective Agreement 1 of Grant 100% spend R5 775 R5 775 Not applicable as all funds were recieved R5 775 N/A Monthly Reports to FS Treasury Quarterly Reports and Annual Reports submitted to FS Treasury and Department of Basic Education.

94 Conditional grants and earmarked funds received 7. DONOR FUNDS 7.1. Donor Funds Received None 8. CAPITAL INVESTMENT 8.1. Capital investment, maintenance and asset management plan Infrastructure projects Final appropriation 2015/ /2015 Expenditure (Over) /Under Expenditure Final Appropriat ion Expenditur e (Over) /Under Expenditur e R'000 R'000 R'000 R'000 R'000 R'000 New and replacement assets (239) Existing infrastructure assets Upgrading and additions (42 453) Rehabilitation, renovation and refurbishment Maintenance and Repair Total

95 94 PART C: GOVERNANCE
96 95 1. INTRODUCTION The department has created and maintained different structures to promote sound governance and management of public finances and other resources. The Central Procurement Committee deals with procurement of core items and strives to eliminate wastage. The Payments Authorization Committee deals with the payments to creditors thereby reducing accruals. The Human Resource Committee handles post provisioning; manages the filling of critical post and also aims at reducing the growing compensation budget. The interdepartmental Task Team made of the department and Provincial treasury has a task of monitoring the above committees and, and provide information on progress report on the work of the committees. 2. RISK MANAGEMENT The Department has a Risk Management Policy as well as a Risk Management Strategy which are reviewed on an annual basis. These are tabled annually before the Risk Management Committee before they are approved by the Accounting Officer. The Risk Management Unit of the Department conducts regular risk assessment through interaction with different sections / directorates and in the process identifies new and emerging risks where after controls are put in place. The Department has a Risk Management Committee in place which is chaired by an external person. Its task is to advise management on the overall system of risk management taking into cognisance the levels of the risks. The Audit Committee of the Department independently monitors the effectiveness of the risk management system. There is progress in the management of risks of the department which is evident from the evaluations by Provincial Treasury. 3. FRAUD AND CORRUPTION The Department has a Fraud Prevention plan which is reviewed annually.it is the responsibility of all Responsibility Managers to report on the progress with regard to the implementation of the Fraud Prevention plan to the Risk Management Committee. The Department has a toll free number where all cases are reported. All reported cases are then referred to the office of the Accounting Officer. Below are methods of reporting cases of Fraud and corruption: - Public - Management and officials - Anonymously The Department complies with the prescripts of the Protective Disclosure Act, (Whistle blowing). The Department also has a separate policy on the reporting of fraud and corruption. 4. MINIMISING CONFLICT OF INTEREST The department use the Standard Bid Document 4 (SBD 4) Forms as gazetted by National Treasury to minimise any conflict of interest. Cross checking of bidders Identity Numbers against the PERSAL is also done to check for employees of the Department who are doing business with government. A circular was send out to all employees to inform them about the risks of conflict of interest and how to address such issues.
97 96 5. CODE OF CONDUCT The purpose of the Code of Conduct is to give direction to employees regarding their relationships with the Legislature, Political, office bearers, and other employees and the public. Also to indicate the spirit in which the employees should perform their duties, what should be done to avoid conflict of interest and what is expected of them in terms of their personal conduct in public and private life. 6. HEALTH SAFETY AND ENVIRONMENTAL ISSUES SHERQ Management is one of the Pillars of the DPSA: Employee Health and Wellness Framework. This Pillar deals with the following: Health and hygiene, hazard control, environmental control, establishment of OHS Committees and the appointment of First Aiders, Fire Marshalls, Standard operating procedures for buildings and offices, Waste Disposals, Housekeeping, Disaster Management and identification and management of occupational risk, maintenance of machinery and equipment. 7. PORTFOLIO COMMITTEES The dates of the meeting 18 May 2015, 18 June 2015, 10 Nov 2015, 23 Nov 2015 and 18 Feb Matters raised by the Portfolio Committee and how has the department addressed these matters are as follows: Medium of Instruction in most of the schools is still a huge challenge even after the new dispensation Response: According to the South African Schools Act, the language policy of a school (which includes the medium of instruction) is determined by the School Governing Body. The department issued guidelines on the language policy for schools, discouraging any form of discrimination based on language. The South African Schools Act is in a review process, to address, amongst other things, the powers of school governing bodies. The top management of the department does not reflect or represent gender parity. Response: The Employment Equity Plan (EEP) of the department is made to address the low representation of women and people with disability in the top management (senior and executive) of the Department. The department is making a concerted effort to consider females for appointments as posts become vacant in the top management. The Department is always late with payment of educators, subsidies and scholar transport Response: The payments of educators are administered via the PERSAL system. This function was taken away from the Department of Education to the Department of Treasury. The Department of Education had to request permission, in writing, from Treasury to appoint and pay educators. This added to the timeframe in which these activities could be completed, leading to some delays in payment of salaries, especially with regard to newly employed, substitute and temporary educators. The late payment of subsidies to schools is due to the cash flow challenges of the department, resulting from the budget constraints. Subsidies to schools are prioritized when cash becomes available, especially to the non-fee paying schools.
98 97 Late payments of service providers for scholar transport were due to cash flow challenges in the department as well as administrative issues with regard to the incomplete documentation submitted by learner transport service providers for their claims and road worthiness of their vehicles. Since the new financial year of 2015/2016, the function of scholar transport moved from the Department of Education to the Department of Police, Roads and Transport, which does not have cash flow challenges and payments can be made to scholar transport service providers within 30 days as expected. Scholar transport has not received an increment from the department. Response: During 2014/2015, the Free State Department of Education experienced budget constraints. During 2014/2015 it was already agreed that the function of learner transport will move from the Department of Education to the Department of Police, Roads and Transport in 2015/2016. The Department of Police, Roads and Transport does not experience cash flow challenges and will be in a better position to negotiate contracts with the service providers based on identified routes and learner numbers. The Department of Police, Roads and Transport has already taken the function over in 2015/2016 and a memorandum of understanding between the Department of Education and the Department of Police, Roads and Transport was concluded. The department conducts workshops during examinations time Response: The policy of the department is not to conduct training in the fourth quarter of the academic year (from October to December) or disrupt examinations in any way. If details can be provided on non compliance in this regard, the Department can investigate and take appropriate action. Xhariep District does not have special schools. The explanation given by the department on the lack of special schools is not adequate. Response: The Department prioritized the building of a special school in Xhariep District for the 2015/2016 financial year. The planning stage is already completed for the building of a special school in Trompsburg. Almost R was allocated for the building of the special school in 2015/2016 and the bids are advertised. Until this special school is operational, learners with special needs are accommodated in the Special Schools in Motheo District and other districts where relevant. These schools have hostel facilities. The Department takes long to absorb temporary educators even though there are vacant funded posts. Response: At the beginning of a new academic year, new post provisioning norms come into place. The filling of post level one vacancies are prioritized by the Department. To fill these posts, permission must be obtained from treasury. The policy determines that after six months, the appointment of an educator in a temporary post level one post (substantive post) must be converted. By July/Aug of each year, temporary educators in funded vacant post level one posts are converted. This process happens alongside the matching of excess educators and state bursary holders to funded vacant (substantive) posts, which must be completed before conversions takes place. In the case of vacant funded promotional posts (post level two and upwards), appointment of a temporary educator is made until the post is advertised. Conversions is not possible for promotional posts which must be advertised and filled within the procedures for such vacant posts. Learners that are still struggling to read and write are always progressing to the next grade Response: According to the National Policy Pertaining to the Progression and Promotion Requirements of the National Curriculum Statements for Grades R 12, a learner may not be retained for more than four years in a phase. This means that a learner can only fail or repeat a year once in a phase, after which the learner has to progress to the next grade. But policies determine further that such learners must be put on a fast tracking program in the next grade to address their barriers to learning so that the learner can catch up and be on the expected level for the grade in which the learner finds him/herself. A special tool (SIAS) is used to determine the barriers to learning in individual learners and forms the basis of an individual learner development program. The Department requires schools to identify the progressed learners and develop their programs with the support of the school based support team and the district based support teams. To improve on the implementation of these policies a data base was compiled of progressed learners from Grades 1 to 12. The Province has intensified the monitoring of the support programs for progressed learners during 2015/2016 and evidence of such programs are required from schools and districts. The Department continues to overspend
99 98 Response: The overspending is due to budget constraints and cash flow challenges that the overspending. This is done, amongst other things, via cost containment measures implemented by the department as well as the establishment of structured meetings between Treasury and Education. There are weekly meetings with the budgeting and finance sections and bi-monthly meetings of a high level steering committee between Treasury and Education (chaired by the CEO of Treasury) where expenditure is monitored closely and more stringent measures implemented, especially regarding the compensation budget. Additional information requested by the Portfolio Committee Additional information requested was provided to the Portfolio Committee with regard to the farm schools that became non operational due to all the learners moving away from the farms where they were staying and the names of the 7 schools not visited by district officials during the first quarter, but visited during the second quarter. The technical indicator in the APP 2015/2016 describes educator absenteeism as follows: Absence may be authorized leave of absence due to sickness or family responsibility or it may be that teachers are present but not in the schools because she/he may be undertaking official duties. This information was provided to the Portfolio Committee and included in subsequent quarterly reports to give more meaning to the report on this performance measure.
100 99 8. SCOPA RESOLUTIONS Resolution No. Subject Details Response by the department Resolved (Yes/No) 1 of 26 Nov 2015 PROPAC resolutions from 3 Dec 2014 not yet implemented by Free State Department of Education. PROPAC resolutions on the agenda as a standing point for discussion at each management meeting until it is fully implemented. Various audit matters were discussed at Strategic Management Leadership Committee (SMLC) meetings under the heading of audit action plan. But henceforth a standing item will be included on the agenda of SMLC under the heading: PROPAC resolutions. No 1 of 26 Nov 2015 PROPAC resolutions from 3 Dec 2014 not yet implemented by Free State Department of Education. Quarterly report to the relevant Executive Authority in terms of progress with the implementation of the PROPAC resolutions. The Strategic Planning is responsible for liaising, coordination and reporting to all committees of the Legislature. All reports, submissions and presentations are verified by the HOD and signed by the MEC. The progress of the implementation of all the PROPAC resolution is submitted to the MEC on the 20 th of each month as part of the KEY Control Matrix reports submitted to Provincial Treasury. Yes CFO will continue to submit reports to the MEC as well as to the relevant units in Provincial Treasury. 1 of 26 Nov 2015 PROPAC resolutions from 3 Dec 2014 not yet implemented by Free State Department of Education. Monthly report to Provincial Treasury with regard to implementation, the report supported with relevant source documents The Department reports monthly to Treasury on the progress made with the implementation of PROPAC resolutions as part of the monthly Key Control Matrix (KCM) reports. Yes
101 100 Resolution No. 1 of 26 Nov of 26 Nov of 26 Nov 2015 Subject Details Response by the department Resolved (Yes/No) PROPAC resolutions from 3 Dec 2014 not yet implemented by Free State Department of Education. Resolution 1/2014 (7/2013): Paragraph 3 National School Nutrition Grant: Non-compliance with the Division of Revenue Grant framework, Gazette must be effectively addressed. Rules regarding the spending of the NSNP grant funds are being incorporated into the MoA entered into between the FSDoE and the schools. Place NSNP on the agenda of the SMLC at least once a quarter. Yes No PROPAC resolutions from 3 Dec 2014 not yet implemented by Free State Department of Education. Resolution 2/2014 Paragraph 2c: Unauthorised expenditure: The Accounting Officer should provide the internal control measures implemented as well as monitor mechanisms to ensure compliance with the relevant internal controls. An Intervention Steering Committee established between Provincial Treasury and Free State Department of Education assigned the responsibility to the Department of Education DDG: Corporate Services to conduct a workstudy on the establishment of an Internal Control Unit (ICU). Currently there is a moratorium on the filling of vacancies. The department is therefore unable to fill critical vacancies. In the absence of Internal Control Unit (ICU) all responsibility managers will ensure that chief user clerks adhere to all prescripts. Yes Non Compliance with laws and regulations The portfolio committee noted with concern the extent of non-compliance with laws and regulations related to Supply Chain Management and Information Technology. The Portfolio Committee resolved that the Accounting Officer must: The department established a Centralised Procurement Committee (CPC) to assist in ensuring compliance with all laws and regulations. The committee meets weekly to consider all requests to procure before issuing formal order. Department will engage with the Accounting Officer regarding the establishment of an internal control unit Yes No
102 101 Resolution No. 8 of 26 Nov 2015 Subject Details Response by the department Resolved (Yes/No) Non Compliance with laws and regulations The Portfolio Committee resolved that the Accounting Officer must: (a) Prioritise the findings of the Information System Audit and ensure that an action plan is developed and implemented to address the findings, and There is and approved IT structure. The Department and the Auditor General identified various shortcomings. IT sub-directorate have already prepared draft policies to address the shortcomings in the system. Ie: Information Security Policy Active Directory Policies Patch Management Policy ICT Risk Management Policy Corporate Governance of ICT Charter ICT Acceptable Usage Policy Information Technology Helpdesk Process Information Technology Firewall Policy, Firewall Policy Change: Implementation and Firewall Policy Change: Request for Approval. Firewall Configuration Screenshots. Information Technology User Account Password Policy Anti-Virus: Scheduled scan setting No There is available: IT Steering Committee Attendance Registers IT Steering Committee Meeting Minutes 1/2015, 2/2015 IT Steering Committee Appointment Letters A management plan will be compiled for the consultations on and approvals of the policies as indicated.
103 102 Resolution No. 8 of 26 Nov of 26 Nov 2015 Subject Details Response by the department Resolved (Yes/No) Non Compliance with laws and regulations The Portfolio Committee resolved that the Accounting Officer must (b) put stringent control measures in place within 60 days from adoption of the resolution and hold officials accountable by implementing a zero tolerance policy in all instances of non-compliance with SCM regulations to ensure the root causes are effectively addressed. Supply Chain Management Unit issued various circulars to address adequate procurement processes for procurement less than R The competitive bidding process is in place to ensure all procurement more than R is advertise nationally and placed on e-tender. Various officials serves on the bid specification, evaluation and adjudication committees. All recommended bids are signed off by the Accounting Officer before contracts are prepared by Legal Services. All non-compliances are reported to Financial Accounting and where there is any transgressions all cases are referred immediately to Security & Risk Management for further investigation. Investigation reports are tabled in the Loss Control Committee to determine liability. Where officials lost state cover, its register as debt on BAS and arrangement are made to deduct outstanding amounts from official s salary. In cases where officials were negligent such cases are referred Labour Relations and Employee wellness for corrective measures or disciplinary procedure Irregular Expenditure The portfolio committee noted with concern the huge amount of irregular expenditure incurred by the department during the 2014/2015 financial year as reported in the 2014/2015 Annual Report as well as the total of R462m alleged irregular expenditure which must still be investigated. In ensuring that all responsibility managers are guided, SCM developed detailed SCM checklist to prevent any irregularities. In the event where responsibility managers are unable to detect possible irregular expenditure all procurement request are referred to CPC for consideration. The establishment of the Internal Control Unit will further strengthen the current controls in place. Yes The Portfolio Committee resolved that the Accounting Officer must (a) indicate controls that have been put in place to eradicate or prevent irregular expenditure.
104 103 Resolution No. 8 of 26 Nov of 26 Nov of 26 Nov 2015 Subject Details Response by the department Resolved (Yes/No) Irregular Expenditure The Portfolio committee resolved that the Accounting Officer must (b) Provide a detailed report on disciplinary actions that have been taken against officials that have committed an act of financial misconduct, whether wilfully or negligently as per requirement in terms of Section 81 of the Public Finance Management Act; The Department dealt with one financial misconduct in the last quarter of 2015, disciplinary action was initiated against the official, who was found guilty and given a Final Written warring. In the first quarter of 2016, 4 cases were reported and two cases have been finalised in terms of disciplinary action and in both cases sanctions of Final Written warning and one week suspension without salary were imposed Yes The Portfolio Committee resolved that the Accounting Office must ensure that the outstanding investigations are finalised by 31 March 2016 Three officials were seconded to security and risk management to focus specifically on investigations of irregular expenditures. An advisory committee on irregular expenditure was established and at the first meeting of the committee on 5 April 2016, 32 cases were finalised. There are 3023 cases dating back from 2006/2007 financial year. A draft management plan was developed to address the outstanding cases with expected completion date of No The Portfolio Committee resolved furthermore that the Accounting Officer must finalise the investigation to determine the full extent of irregular expenditure before the end of the 2015/2016 financial year. Due to capacity challenges the department was unable to finalize cases as directed by the legislature. Three officials were allocated to the unit only in February 2016 to start with the investigations. No During the audit steering committee it was resolved that the department should outsource the investigations due to the huge number of backlog of the cases. Due to limited financial resources, the department will consider to second more officials to the unit to help with the investigations.
105 104 Resolution No. 8 of 26 Nov of 26 Nov 2015 Subject Details Response by the department Resolved (Yes/No) Unauthorised Expenditure The Portfolio Committee was concerned with the department s overspending on its appropriated budget and the lack of effective internal controls and assurance by management that the department complies with sections 38(1)(b), (c) and 39 of the PFMA. The department found itself in a difficult position to balance between non-discretionary (obligatory) funding and compensation of employees which is the main cost drive. Although the number of employees has not increased significantly, the annual improvement in conditions of service as per Provincial Treasury guidelines provided higher than the percentage growth in the equitable share. The guidelines for 2014/15 indicated that provision of 6,5% must be made for improvement in condition of services, compared to the increase of 4,88% in the equitable share. In order to maintain the activities and the programs and sustained or continued with the operations a request was send to Provincial Treasury for allocation not less than R 12 billion. The 12 billion would have funded compensation fully but also allow the departmental programs to run and maintain funding levels of post that supports learning and teaching including important initiatives that were consistent with our intervention program. No Unauthorised Expenditure The Committee resolved that the Accounting Officer must ensure compliance with Sections 38 and 39 of the PFMA and provide a report within 60 days from adoption of the resolution to indicate measures implemented to ensure: Prevention of non-compliance The relevant Treasury was informed about the implications of the incorrect allocation. It was also indicated in our budget submission to PT as indicated in annexure A. MEC: Education also send formal correspondences to both the Ministers of Finance as well as Basic Education The department also reported the anticipated over expenditure monthly to Provincial Treasury Management reviewed the expenditure trends as at end of May 2014 and concluded after the implementation of stringent measures. Financial Accounting Circular no. 4 of 2016 regarding the prevention of irregular expenditure was issued during March 2016 Intervention structures between the department and Provincial Treasury were implemented. Cost containment measures were implemented in the department Yes
106 105 Resolution No. 8 of 26 Nov of 26 Nov 2015 Subject Details Response by the department Resolved (Yes/No) Unauthorised Expenditure The Committee resolved that the Accounting Officer must ensure compliance with Sections 38 and 39 of the PFMA and provide a report within 60 days from adoption of the resolution to indicate measures implemented to ensure: Detection of non-compliance Preliminary calculations indicates unauthorised expenditure for the 2015/16 financial year. The amount will only be determined after the final virement for 2015/16 was implemented. Spending versus budget is monitored and submitted to Provincial Treasury on a monthly basis. No Unauthorised Expenditure The Committee resolved that the Accounting Officer must ensure compliance with Sections 38 and 39 of the PFMA and provide a report within 60 days from adoption of the resolution to indicate measures implemented to ensure: Effectively address any transgression A management report is also prepared and presented at Strategic Management & Leadership Committee (SMLC) on a monthly basis as well as to the Executive Authority Immediately any transgression relating to Financial Misconduct is detected, the Department will investigate and initiate disciplinary action where necessary Reports on investigations finalised are presented to the Loss Control Committee who then makes a recommendation to the Accounting Officer No Conduct a trend analysis on misuse of GG Vehicle and implement consequences management Loss Control Committee meetings will be scheduled for the whole financial year in order to deal with investigation reports in a speedy manner.
107 106 Resolution No. 8 of 26 Nov 2015 Subject Details Response by the department Resolved (Yes/No) Predetermined Objectives The Portfolio Committee noted with concern that material weaknesses were identified in the administration of the computerised information management system at schools. There are SA-SAMS and LUTIZ Standard operating Procedures and the process of preparing and verifying performance information is documents. No There were also no standard operating procedures to generate source documents, and the process of preparing and verifying performance information was not documented. SA-SAMS Standard Operations and Procedures are distributed yearly for each academic year in the form of a circular signed off by the HOD. Circular MG 2/2016 of 23 Feb Circular MG 18/2015 of 16 Nov 2015 signed off by the HOD was compiled and distributed to schools detailing the procedures for LURITS data submissions with due dates for the 2016 academic year. The aforementioned is done in support of the legislative framework of the Education Information Policy, Government Gazette no 677 of 6 Aug Every Monday exception reports are send out from the EMIS section on incomplete and incorrect submissions received from schools. Principals as well as circuit managers, district managers, Chief Director for District Management, DDG, HOD and MEC are informed about the omissions and expected corrections. Build capacity of line managers in the monitoring of compliance with regard to the information legislation, policies and procedures. Undertake monitoring visits to schools to determine the reliability of the control environment at school level.
108 107 Resolution No. 8 of 26 Nov of 26 Nov 2015 Subject Details Response by the department Resolved (Yes/No) Predetermined Objectives Yes For infrastructure development, practical completion certificates instead of final completion certificates were used as evidence of completed projects Discussions were held with the national dept of basic education and with the auditor general to agree on using practical completion certificates. Agreement was reached on this matter. The technical indicators in the APP were amended accordingly, allowing practical completion certificates, works completion certificates and snag lists to be accepted as evidence for completion of infrastructure projects. Implement the use of practical completion certificates, works certificates and snag lists as evidence for infrastructure projects per the decision reached with the auditor general and the national department of basic education. Indicate as such in the reports, also where final completion certificates are available. No Predetermined Objectives The Committee resolved that the Accounting Officer must: The continuous defaulting principals were identified and subsequently 133 principals received audi letters. Implement effective HR management which includes consequence management and ensure that all principals certify and upload valid information about their schools Capacitation workshops were held with the circuit managers on how to support and monitor school principals with regard to compliance with SASAMS and determine reasons for non compliance. The responses from the 133 defaulting principals are being awaited to determine their reasons for continuous non compliance.
109 108 Resolution No. 8 of 26 Nov of 26 Nov of 26 Nov 2015 Subject Details Response by the department Resolved (Yes/No) Yes Predetermined Objectives The Committee resolved that the Accounting Officer must: Quarterly reports are submitted to strategic management leadership on the submission of evidence based performance information. Exercise oversight over those processes in the Department through which significantly important indicators are tracked and that officials in the department formalise these processes that would ensure that information are valid, accurate and complete. Regular meetings are held between Strategic Planning Directorate and Responsibility Managers for the quality assurance of performance information. Include an item on the management of performance information on all meetings of responsibility managers. Develop information management policy and standard operating procedures on all evidenced based information generated in the department for purposes of monitoring and reporting Financial health status The Portfolio Committee raised a concern about the regression of this department s financial health status since 2013/2014. The following contribute to this regression: The function is no longer with education it resides with Treasury Yes Overriding of budget controls Financial health status The Portfolio Committee raised a concern about the regression of this department s financial health status since 2013/2014. The following contribute to this regression: CFO has undertaken that this will not happen any longer. Yes Payments against ledger accounts.
110 109 Resolution No. 8 of 26 Nov 2015 Subject Details Response by the department Resolved (Yes/No) Financial health status The Portfolio Committee raised a concern about the regression of this department s financial health status since 2013/2014. The following contribute to this regression: Non-compliance with Section 38(2) of the PFMA. The department found itself in a difficult position to balance between non-discretionary (obligatory) funding and compensation of employees which is the main cost drive. Although the number of employees has not increased significantly, the annual improvement in conditions of service as per Provincial Treasury guidelines provided higher than the percentage growth in the equitable share. The guidelines for 2014/15 indicated that provision of 6,5% must be made for improvement in condition of services, compared to the increase of 4,88% in the equitable share. In order to maintain the activities and the programs and sustained or continued with the operations a request was send to Provincial Treasury for allocation not less than R 12 billion. The 12 billion would have funded compensation fully but also allow the departmental programs to run and maintain funding levels of post that supports learning and teaching including important initiatives that were consistent with our intervention program. No The relevant Treasury was informed about the implications of the incorrect allocation. It was also indicated in our budget submission to PT as indicated in annexure A. MEC: Education also send formal correspondences to both the Ministers of Finance as well as Basic Education The department also reported the anticipated over expenditure monthly to Provincial Treasury Management reviewed the expenditure trends as at end of May 2014 and concluded after the implementation of stringent measures
111 110 Resolution No. 8 of 26 Nov 2015 Subject Details Response by the department Resolved (Yes/No) Financial health status The Committee resolved that the Accounting Officer must within 60 days from adoption of the resolution provide a copy of the strategy adopted linked to timeframes to effectively address and improve the financial health status of this department. This strategy must include but is not limited to the following: Decrease compensation of employee costs Initiatives to curb personnel expenditure, however province is mindful of service delivery imperatives: o Increased learner teacher ratio from 28:1 to 30:1 o Introduced Instruction Note on COE wherein the Provincial Treasury verifies whether the post(s) to be filled are funded or unfunded and are also forming part of the Organizational and PERSAL structures. o Further Instruction Note implemented on non-reduction of personnel budget without prior approval by the Provincial Treasury. o Centralised all school based appointments to the Director: Human Resource Administration (Corporate Office). o Management of excess educators (matching and placing within 30 km whilst beyond 30 km resettlement costs will be considered) (currently at 308 excess educators from 1191) Education and Labour Relations Council (ELRC) Chamber is hosted every quarter to discuss various issues including PPN Model, movement of excess educators. o Furthermore, all Organised Labour Unions are kept abreast on regularly basis about key decisions affecting educators, they also sit on the interviews of educators as observers. o Delay in filling of some promotional posts at schools and public servants posts at offices. No Initiatives to curb personnel expenditure implemented, however province is mindful of service delivery imperatives: o Development of database on potential vacancies (retirees (to determine need for appointment), resignations, temporary employees). o Management of incapacity leaves and ill health retirements o Head counts started in August 2015 o Other proposed initiatives: Moving towards 80:20 split of Equitable Share (COE vs. other economic classification) Retain 1:30 Learner teacher ratio. Managing ratio of educator vs. administrative staff (85:15 ratio) Cap substitute teacher at 250 (long illness /maternity) Cap adhoc/temporary educators at 250 from current 340 (sudden growth in learner numbers/ resignation) Teach SA Ambassador programme slightly low scale
112 111 Resolution No. 8 of 26 Nov 2015 Subject Details Response by the department Resolved (Yes/No) Financial health status The Committee resolved that the Accounting Officer must within 60 days from adoption of the resolution provide a copy of the strategy adopted linked to timeframes to effectively address and improve the financial health status of this department. This strategy must include but is not limited to the following: Ensure commitments comply with Section 38(2) of the PFMA The department found itself in a difficult position to balance between non-discretionary (obligatory) funding and compensation of employees which is the main cost drive. Although the number of employees has not increased significantly, the annual improvement in conditions of service as per Provincial Treasury guidelines provided higher than the percentage growth in the equitable share. The guidelines for 2014/15 indicated that provision of 6,5% must be made for improvement in condition of services, compared to the increase of 4,88% in the equitable share. In order to maintain the activities and the programs and sustained or continued with the operations a request was send to Provincial Treasury for allocation not less than R 11 billion. The 11 billion would have funded compensation fully but also allow the departmental programs to run and maintain funding levels of post that supports learning and teaching including important initiatives that were consistent with our intervention program. No The relevant Treasury was informed about the implications of the incorrect allocation. It was also indicated in our budget submission to PT as indicated in annexure A. MEC: Education also send formal correspondences to both the Ministers of Finance as well as Basic Education The department also reported the anticipated over expenditure monthly to Provincial Treasury Management reviewed the expenditure trends as at end of May 2014 and concluded after the implementation of stringent measures
113 112 Resolution No. 8 of 26 Nov 2015 Subject Details Response by the department Resolved (Yes/No) Financial health status The Committee resolved that the Accounting Officer must within 60 days from adoption of the resolution provide a copy of the strategy adopted linked to timeframes to effectively address and improve the financial health status of this department. This strategy must include but is not limited to the following: Improve cash management The 2014/15 budget implementation challenges inclusive of the cash flow problems were symptom of a bigger problem, which points to the credibility of the departmental allocation. Part of the contributing factors which in our view were not consistent with the sound principles of budgeting as indicated below: The carry through effect on compensation of employees was unfortunately not considered and recognize as of the MTEF allocation and has a major bearing on future allocations Lack of consideration of the higher salary increase than was budgeted for as directed by Treasury. Emphasis on percentage increases whereas the allocation is increasing at a decreasing rate over the last 3 financial years particularly considering the real increase and not the nominal effect The huge impact of nationally negotiated improvement in conditions of service to the department given the substantial financial implication associated with such agreements especially considering that the compensation of employees for educators is a major cost driver to the departmental expenditure. No The Department had a bank overdraft of R201 million at 31 March 2016 The Department implemented cost saving measures during 2013/14 financial year. Management reviewed after six months the effectiveness of the measures and it was agreed that other measures be implemented. In recognition of the need to contain costs, improve the monitoring and implementation of personnel budget and streamline the human resource management processes, the department introduced further measures Cash management committee was established between Provincial Treasury and the Department to manage cash position of the department and request also additional funding. Three management committees were established to minimize none core spending. The Centralized Procurement Committee (CPC) main focus area was to prevent any unnecessary committing financial the Department. The Payment Authorization Committee (PAC) managed and prioritized payments to service providers and where possible strive to pay within 30 days. The Human Resource (Post Provisioning) Committee (HRC) managed the appointment of educators. This additional measures reduced the projected over expenditure as reported in the In Year Monitoring (IYM) report.
114 113 Resolution No. 8 of 26 Nov of 26 Nov 2015 Subject Details Response by the department Resolved (Yes/No) Monthly cash requests are submitted to Provincial Treasury by the 20 th each month. Weekly discussions are held with Provincial Treasury to ensure proper cash management. Financial health status The Committee resolved that the Accounting Officer must within 60 days from adoption of the resolution provide a copy of the strategy adopted linked to timeframes to effectively address and improve the financial health status of this department. This strategy must include but is not limited to the following: Prevent the use of ledger accounts to pay for goods and services Payment against ledger accounts have been restricted during the 2015/16 financial year to only exceptional cases which has been monitored throughout the year to prevent a re-occurrence of the same situation. Avoid using ledger accounts and monitor the accounts on a monthly basis. No Financial health status The Committee further resolved that the Accounting Officer must: (a) Implement internal controls to prevent misclassification of expenditure Known misclassifications based on the prior year s audit have been verified and corrected where necessary. Yes Continue to monitor these known misclassifications from prior year to prevent re-occurrence.
115 114 Resolution No. 8 of 26 Nov 2015 Subject Details Response by the department Resolved (Yes/No) Financial health status The Committee further resolved that the Accounting Officer must: (b) Ensure that measures are implemented to improve the recovery rate of staff debt The Department acknowledges that it has some challenges with regard to debt recovery of which the biggest is the staff establishment of the Financial Accounting Directorate that is not adequate. Given the department s financial position there is no immediate solution for that. Yes Measures implemented to improve the recovery rate of staff debt include the following: Reminders, notices of debt and letters of demand are issued and posted in order to persuade debtors to settle and/or make suitable arrangements Monthly debt statements are posted informing the debtor about movement on his/her outstanding debt account In order to ensure recovery the debt is firstly deducted from any leave gratuity payable to an official upon retirement if possible and secondly the debt is recovered from the pension benefit of the official All outstanding debt is noted on the pension route form to be recovered from the pension benefits by National Treasury (Pension Administration) on behalf of the department Provincial Treasury appointed a transversal service provider for the period 1 November 2014 to 31 March 2016 to assists departments with the collection of ex-employee debt. From 1 November 2014 to 31 March ex-employee debts amounting to R were handed over to the service provider and during the period 1 April 2015 to 31 March 2016 a further 1101 ex-employee debts were handed out. Currently the department is focusing on recovery of debt relating to debtors who are still in service of the department. The Department also awaits feedback from Provincial Treasury regarding the extension of the contract with the previous service provider or the appointment of a new service provider for collection of ex-employee and supplier debt.
116 115 Resolution No. 8 of 26 Nov of 26 Nov 2015 Subject Details Response by the department Resolved (Yes/No) Financial health status The Committee further resolved that the Accounting Officer must: Proper cash management practices are exercised. The Department had a bank overdraft of R201 million at 31 March No Monthly cash requests are submitted to Provincial Treasury by the 20 th each month. International bursaries The Portfolio Committee noted with concern the deficiencies related to internal controls and communication in respect of international bursaries that resulted irregular expenditure. Weekly discussions are held with Provincial Treasury to ensure proper cash management. The assertion that there are deficiencies with regard to internal controls in the bursary section is incorrect. There are several controls to ensure compliance with the PFMA. However, it is true that payments for students in Cuba were done without invoices BUT that was beyond our control. Numerous attempts have been made to obtain the invoices but to no avail. Proof to our attempts is available. No With regard to certain students in China, contracts do not exist because of unauthorised movements. This matter has been discussed with the HOD and IGR head. Status 1. There are still no invoices for Cuba and it will never be produced according to National and Provincial Department of Health China students have moved to new institutions and we are awaiting for new contracts. With regard to Cuba, several requests have been made to Provincial Department of Health, National Department of Health and DIRCO; several meetings were held with Chief Financial Officer, Chief Director and Head of Department of Health and Head of Department of Education. With regard to China movements, a delegation went to China to address the movements. Meetings were also held with Inter-Governmental Relations and Education with regard to the contract
117 116 Resolution No. 8 of 26 Nov of 26 Nov 2015 Subject Details Response by the department Resolved (Yes/No) The provincial committee will conduct a visit to various countries to address the challenges. The audit intervention committee under the leadership of the MEC Finance, resolved that the CFO of both departments must meet on a weekly basis to resolve outstanding audit matters. The intervention committee already sat on 13 April International bursaries The Committee resolved that the Accounting Officer must review and enhance the relevant internal control system and consultation system with other stake holders within 60 days from adoption of the resolution. Furthermore, senior management must improve assurance levels to ensure compliance with the revised control and consultation system, and report quarterly to the Accounting Officer. Investigations The portfolio Committee noted that there are investigations which were not yet finalised at the 2014/2015 reporting date. The SAP is still busy with the investigation. No Yes The Portfolio Committee resolved that the Accounting Officer must report the status and progress within 90 days from adoption of this resolution in respect of: A letter will be written to SAPS to request a progress report. Investigation by the Commercial Crime unit of the South African Police Service into the alleged fraud related to the contract awarded for learner teacher support material.
118 117 Resolution No. 8 of 26 Nov 2015 Subject Details Response by the department Resolved (Yes/No) Investigations The portfolio Committee noted that there are investigations which were not yet finalised at the 2014/2015 reporting date. The Portfolio Committee resolved that the Accounting Officer must report the status and progress within 90 days from adoption of this resolution in respect of: The report is with Treasury. Treasury has not provided the report to the Department of Education. Yes The investigation by an independent consulting firm on the comprehensive review of processes employee disclosure and value for money in supply chain management practices. The investigation has been finalised but the report has not yet been made available.
119 118 : 9. PRIOR MODIFICATIONS TO AUDIT REPORTS Nature of qualification, disclaimer, adverse opinion and matters of non-compliance Misclassification of expenditureclassification between capital and goods and services. Cash and cash equivalents: Financial health. Financial year in which it first arose Progress made in clearing / resolving the matter 2014/ /16 baseline work has been done from April until October 2015 on NSNP, Bursaries, Infrastructure and Finance Leases, However not all exceptions and verifications has been internally completed, the estimated completion was 31 March Finance section was waiting for BAS closure since information could not be provided for verification. However through Payment Batches review was performed on a sample of transactions, some transactions were found to be not captured correctly as per SCOA guideline. 2014/15 Steering committee meetings are taking place as scheduled. Weekly and Monthly Cash Reconciliations are done. Financial statements not prepared in accordance with Prescribed financial reporting framework Irregular expenditure 2014/15 On-going process information submitted on a monthly and quarterly basis for the KCM and the Interim Financial Statements are monitored. Training was provided to the relevant officials during April Misclassification of goods and services and capital Commitments. Irregular Expenditure - Investigations (more than 90 days) 2014/15 Irregular Expenditure Steering Committee has been appointed and the investigations are in progress. AOPO - Performance information reported not reliable- Public ordinary schools Programmes 2014/15 The progress will be determined by the actions of the Chief Director District Management. If consequence management is applied the estimate and actual can be drastically improved but without action it will stay low. AOPO - Supporting documentation not adequate 2014/15 Delivery notes for Educational Toys from 5 districts for 200 schools were submitted to Strategic Planning Directorate for verification process. Upon verification it was discovered that the evidence of deliveries to 40 schools in Lejweleputswa did not correspond with 2014/15 financial year. The prescribed reporting template that was designed by the Provincial Office was not used. The evidence therefore was found not assisting in the process. Corrective Measures: At a meeting held on 25 November 2015 with the Director: Strategic Planning the Primary Schools Directorate committed to write a letter to the District Director to correct the evidence submitted using the correct template. This letter will be sent out by Friday, 27 November with the response date of 4 December 2015.
120 119 Nature of qualification, disclaimer, adverse opinion and matters of non-compliance Programme 8: Infrastructure development Reliability of reported performance information Financial year in which it first arose Progress made in clearing / resolving the matter 2014/15 Informal interactions between Infrastructure and Strategic Management have been undertaken. A formal meeting will be undertaken before the 15th of October 2015 to determine the contents and nature of the engagement with the office of the AG. Formal Description letter has been drawn for submission to Strategic Management. Meeting arranged by Strategic Management with AG to iron out differences. The AG has been engaged and areas of disagreements ironed out Portions of unspent conditional grant at schools not reverting back to the Revenue Fund as per DoRA 2014/15 A circular is currently being drafted to schools to ensure that all surplus funds are spent in line with DBE guidelines. The Department has reconsidered the possibility of subsidiary accounts. The NSNP unit is in the process of developing and implementing standardised monitoring procedures that will assist the improved implementation of school nutrition. A MOA has been drafted between the schools and the Accounting Officer to ensure the NSNP funds are managed as per guidelines. Conditional Grants - Non-compliance with DoRA requirements on the Education Infrastructure Grant (EIG) Contract and Procurement management: Declaration of interest not done by bidders and employees 2014/15 Clarity has not been sought and finalised on this specific matter. However a letter will be drawn to seek clarity before the end of October The letter has not been finalised but will be before the end of the 2nd week of November The letter has been drawn for clarity on this matter. 2014/15 Circulars was circulated to schools, Districts and directorates to sensitise officials on the importance of applying for approval for performing remunerative works outside the public Service Contract and Procurement management: Declaration of interest supporting documents not provided 2014/15 A meeting with Provincial Treasury was held on 30 Sept The advice received was that as from 01 April 2016 National Treasury will do all verifications of suppliers on the database and declarations are among other things that they will check. For bids above R500, Treasury advised that a list of recommended companies with details of their directors/ shareholders and their identity numbers should be sent to provincial treasury for verification before the final award is done. This should take place until further notice. Contract and Procurement: Competitive Bidding: Non-compliance with the tender documents requirements 2014/15 Standard/Special Bid Conditions will be scrutinized and rectified to be consistent. Risk Management & Internal Audit 2014/15 Due to the moratorium on the filling of vacant posts, there has been no filling of posts.
121 120 Nature of qualification, disclaimer, adverse opinion and matters of non-compliance Financial year in which it first arose Progress made in clearing / resolving the matter Audit Committee 2014/15 Advert to appoint new committee members was done. The applications and long list are in HR for the process to identify the qualifying candidates. 10. INTERNAL CONTROL UNIT Financial Controls Managers are responsible for compliance of all legislative requirements in respect of financial management. Guidelines, circulars, standard operating procedures, checklist and instruction notes were issued to further assist manager to adhere with prescript. There was significant improvement but there is still a need to ensure 100% compliance. Strong financial controls will allow for reliable financial reporting throughout the department, which will allow for more solid financial management of the operation. Strong controls also provide greater peace of mind that the accounting data is correct and the money is better protected from potential irregularities. That, in turn, allows for better service delivery. There is currently not a dedicated unit or person that monitors or enforces compliance with all prescripts before payments are processed. The establishment of a financial control will assist the department a great deal in obtaining an audit opinion with no findings. Mindful of the limited resources, the unit will have to be established through restructuring by using existing personnel in the department. 11. INTERNAL AUDIT AND AUDIT COMMITTEES Key activities and objectives of the internal audit: Internal auditing is an independent, objective assurance and consulting activity designed to add value and improve an organization s operations. It helps an organization accomplish its objectives by bringing a systematic, disciplined approach to evaluate and improve the effectiveness of risk management, governance and control processes. Make an objective assessment of your operations, and share ideas for best practices. Provide counsel for improving controls, processes and procedures, performance, and risk management. Suggest ways for reducing costs, enhancing revenues, and improving service delivery. Deliver competent consulting, assurance, and facilitation services. Summary of audit work done: The IAA must evaluate and contribute to the improvement of governance, risk management and control processes using a systematic disciplined approach: Governance- Making appropriate recommendations for improving governance process Risk Management- Evaluating risk exposures relating to the organisation s governance, operations, and information system Control- Evaluate the adequacy and effectiveness of controls in responding to risk within the organisation s governance, operations and information system.
122 121 Key activities and objectives of the audit committee: Audit committee assist the department to discharge its responsibility for adequate and effective risk management risk management, governance and control processes and for the economy, efficiency and effectiveness of the institution s activities, audit committee must review the following: Effectiveness of the internal control systems Effectiveness of the internal audit function Risk areas of the institution s operations to be covered in the scope of internal and external audits Adequacy, reliability and accuracy of the financial information provided to management and other users of such information Any accounting and auditing concerns identified as a result of internal and external audits Institution s compliance with legal and regulatory provisions The activities of the internal audit function, including its annual work programme, coordination with the external auditors, the reports of significant investigations and the responses of management to specific recommendations. Attendance of audit committee meetings by audit committee members (Tabular form): Name 22 April July October February 2016 Dr. AV Bouwer (Chairperson) Adv. NM van Heerden Mr. SA Ngwenya X X X Mr TG Motloi X The table below discloses relevant information on the audit committee members: Name Qualifications Internal or external If internal, position in the department Date appointed Date Resigned No. of Meetings attended Dr AV Bouwer Doctoral Degree(PHD) External N/A 01 August N/A 4 31 May 2016 Mr TG Motloi Management Development programme External N/A 01 August May 2016 N/A 3 Adv NM van Heerden Bachelor of Law (LLB) External N/A 01 August N/A 4 31 May 2016 Mr SA Ngwenya Qualified charted Accountant(CA) External N/A 01 August N/A 2 31 May 2016
123 AUDIT COMMITTEE REPORT We are pleased to present our report for the financial year ended 31 March Audit Committee Members and Attendance: The Audit Committee consisted of the members listed hereunder. During the current year, four (4) meetings were held. These members operated the committee from 1 April 2015 to 31 March Name of the Member Meetings Apologies Dr. AV Bouwer (Chairperson) 4 0 Adv. NM van Heerden 4 0 Mr. S Ngwenya 2 2 Mr TG Motloi 3 1 All four (4) members of the Audit Committee are independent, with no interest in the management or conduct of the business of the Department. Audit Committee Responsibility The Audit Committee reports that it has complied with its responsibilities arising from Section 38 (1) (a) (ii) of the Public Finance Management Act and Treasury Regulation The Audit Committee also reports that it has adopted appropriate formal terms of reference as its Audit Committee Charter, has regulated its affairs in compliance with this charter and has discharged all its responsibilities as contained therein, except that we have not reviewed changes in accounting policies and practices. The Effectiveness of Internal Control The system of controls is designed to provide cost effective assurance that assets are safeguarded and that liabilities and working capital are efficiently managed. In line with the PFMA and the King III Report on Corporate Governance requirements, Internal Audit provides the Audit Committee and management with assurance that the internal controls are appropriate and effective. This is achieved by evaluation of controls, risk management processes, as well as the identification of corrective action and suggested enhancements to the controls and processes. From the various reports of the Internal Auditors, it was noted that there was no significant breach of controls although the audit reviews disclosed significant risk exposures. Accordingly, we can report that the system of internal control for the period under review was, partially effective and efficient. We are of the view that management needs to urgently institute effective control measures to address control weaknesses on a sustainable basis in the following areas: Performance Information Irregular Expenditure Contingent liability Accruals Commitments Inventory Misclassification Expenditure Lastly, we encourage management to continue to fully implement the recommendations of Auditor-General, Internal Audit and Risk Management in an integrated manner.
124 123 The quality of in year management and monthly / quarterly reports submitted in terms of the PFMA and the Division of Revenue Act The Audit Committee is satisfied with the content and quality of monthly and quarterly reports issued during the year under review. Evaluation of Financial Statements The Audit Committee will: Review and discuss the audited/unaudited annual financial statement to be included in the annual report, with the auditor-general and the Accounting officer; Review the Auditor-General s management report and management s response thereto; Review any changes in accounting policies and procedures; Review the departments compliance with legal and regulatory provisions; Review the information on predetermined objectives to be included in the annual report; Review significant adjustments resulting from the audit. Review the quality and timeliness of the financial information availed to the audit committee for oversight purpose during the year such as interim financial statement. Internal Audit Activity The internal audit function evaluates the adequacy and effectiveness of controls in responding to risks within the department and making appropriate recommendations for improving governance process. Auditor-General s Report We have reviewed the department s implementation plan for audit issues raised in the previous year and we are satisfied that the matters have been adequately resolved except for the following: Conclusion Dr. AV Bouwer Chairperson of the Audit Committee Department of Education 31 July 2016


125 124 PART D: HUMAN RESOURCE MANAGEMENT
GENERAL REPORT ON THE AUDIT OUTCOMES OF THE FREE STATE LOCAL GOVERNMENT
 GENERAL REPORT ON THE AUDIT OUTCOMES OF THE FREE STATE LOCAL GOVERNMENT 2010-11 PR: 188/2012 ISBN: 978-0-621-41075-4 The information and insights presented in this flagship publication of my office are
Analysis of Local Government Revenue and Expenditure: The Case of Free State Municipalities
 Analysis of Local Government Revenue and Expenditure: The Case of Free State Municipalities August 11 Table of Contents List of Figures... iii List of Tables... iii List of Acronyms... iv 1. Introduction...
free state Kimi Makwetu Auditor-General
 free state MFMA 2013-14 The information and insights presented in this flagship publication are aimed at empowering oversight structures and local and provincial government leaders to focus on those issues
PRESENTATION TO THE STANDING COMMITTEE ON APPROPRIATIONS BRIEFING ON THE 2015 APPROPRIATION BILL 19 MAY 2015
 PRESENTATION TO THE STANDING COMMITTEE ON APPROPRIATIONS BRIEFING ON THE 2015 APPROPRIATION BILL 19 MAY 2015 Introduction The PSC is established in terms of Chapter 10 of the Constitution. It derives its
MPUMALANGA EDUCATION
 WHEN THE SUN RISES WE WORK HARD TO DELIVER MPUMALANGA EDUCATION PROVINCIAL STRATEGIC IMPERATIVES AND PERSONNEL ALLOCATION, AND ITS IMPACT ON THE NUMBER OF EDUCATOR POSTS FOR A 3 YEAR PERIOD BEGINNING 2017
REPORT OF THE SELECT COMMITTEE ON FINANCE ON THE PROVINCIAL TREASURIES EXPENDITURE REVIEW FOR THE 2014/15 FINANCIAL YEAR, DATED 14 OCTOBER 2015
 REPORT OF THE SELECT COMMITTEE ON FINANCE ON THE PROVINCIAL TREASURIES EXPENDITURE REVIEW FOR THE 2014/15 FINANCIAL YEAR, DATED 14 OCTOBER 2015 1. Introduction and Background The Select Committee on Finance
FINANCIAL MANAGEMENT OF PARLIAMENT BILL
 REPUBLIC OF SOUTH AFRICA FINANCIAL MANAGEMENT OF PARLIAMENT BILL (As amended by the Select Committee on Financial National Council of Provinces) (The English text is the offıcial text of the Bill) (SELECT
Budgetary review and recommendations report Briefing to Portfolio Committee on Basic Education Add subtitle here. XX Month XXXX
 Budgetary review and recommendations report Briefing to Portfolio Committee on Basic Education Add subtitle here XX Month XXXX 1 Reputation promise The Auditor-General of South Africa (AGSA) has a constitutional
PRESENTATION TO THE SELECT COMMITTEE ON PUBLIC SERVICES DPW STRATEGIC PLAN AND BUDGET FOR 2012/13 15 MAY 2012
 PRESENTATION TO THE SELECT COMMITTEE ON PUBLIC SERVICES DPW STRATEGIC PLAN AND BUDGET FOR 2012/13 15 MAY 2012 TABLE OF CONTENTS MINISTER S FOREWORD PART A: STRATEGIC OVERVIEW INTRODUCTION AND STRATEGIC
MFMA. Audit outcomes of municipalities
 0- Audit outcomes of municipalities 0- Reputation promise The Auditor-General of South Africa (AGSA) has a constitutional mandate and, as the Supreme Audit Institution (SAI) of South Africa, it exists
1. Key provisions of the Law on social integration of the disabled
 Social integration of the disabled in Lithuania Teodoras Medaiskis Vilnius University Eglė Čaplikienė Ministry of Social Security and Labour I. Key information 1. Key provisions of the Law on social integration
NATIONAL YOUTH DEVELOPMENT AGENCY ANNUAL REPORT PRESENTATION TO THE STANDING COMMITTEE ON APPROPRIATIONS DATE: 16 October 2013
 NATIONAL YOUTH DEVELOPMENT AGENCY ANNUAL REPORT 2012-2013 PRESENTATION TO THE STANDING COMMITTEE ON APPROPRIATIONS DATE: 16 October 2013 PRESENTATION OUTLINE A OVERVIEW OF NYDA 2012/2013 PERFORMANCE B
Labour. Labour market dynamics in South Africa, statistics STATS SA STATISTICS SOUTH AFRICA
 Labour statistics Labour market dynamics in South Africa, 2017 STATS SA STATISTICS SOUTH AFRICA Labour Market Dynamics in South Africa 2017 Report No. 02-11-02 (2017) Risenga Maluleke Statistician-General
1 July Guideline for Municipal Competency Levels: Chief Financial Officers
 1 July 2007 Guideline for Municipal Competency Levels: Chief Financial Officers issued in terms of the Local Government: Municipal Finance Management Act, 2003 Introduction This guideline is one of a series
I n t r o d u c t i o n
 T he District Health Systems (DHS) across South Africa are the decentralised building blocks of the National Health System. The aim of the DHS is to have decisions made locally about services and resources.
The Presidency Department of Performance Monitoring and Evaluation
 The Presidency Department of Performance Monitoring and Evaluation Briefing to the Standing Committee on Appropriations on the Strategic Plan and Annual Performance Plan for the 2012/13 financial year
BROAD BASED BLACK ECONOMIC EMPOWERMENT ACT SECTION 9 (1) CODES OF GOOD PRACTICE AS AMENDED SCHEDULE 2
 CODES OF GOOD PRACTICE AS AMENDED SCHEDULE 2") STAATSKOERANT, 1 DESEMBER 2017 No. 41287 323 BROAD BASED BLACK ECONOMIC EMPOWERMENT ACT SECTION 9 (1) CODES OF GOOD PRACTICE AS AMENDED SCHEDULE 2 INTERPRETATION AND DEFINITIONS Part 1: Interpretation
STAATSKOERANT, 1 DESEMBER 2017 No. 41287 323 BROAD BASED BLACK ECONOMIC EMPOWERMENT ACT SECTION 9 (1) CODES OF GOOD PRACTICE AS AMENDED SCHEDULE 2 INTERPRETATION AND DEFINITIONS Part 1: Interpretation
Eastern Cape Department of Human Settlements Strategic Plan Evaluation 2015/2016
 Eastern Cape Department of Human Settlements Strategic Plan Evaluation 2015/2016 November 2015 by Thoko Sipungu Monitoring and Advocacy Program, Public Service Accountability Monitor For more information
PFMA Introduction CPD Public Sector April 2018
 PFMA Introduction CPD Public Sector April 2018 PFMA - INTRODUCTION 2 PFMA - OBJECTIVE Reasons for the ACT: RDP: maximise service delivery Limited resources vs. 'Unlimited' demands Satisfy constitutional
Government Gazette REPUBLIC OF SOUTH AFRICA. Vol. 550 CapeTown 28 April 2011 No
 Please note that most Acts are published in English and another South African official language. Currently we only have capacity to publish the English versions. This means that this document will only
STRATEGIC PLAN AND BUDGET 2013 TO 2016 MUNICIPAL DEMARCATION BOARD
 STRATEGIC PLAN AND BUDGET 2013 TO 2016 MUNICIPAL DEMARCATION BOARD BRIEFING TO THE PORTFOLIO COMMITTEE ON COOPERATIVE GOVERNANCE AND TRADITIONAL AFFAIRS 19 MARCH 2013 DELEGATION Mr LJ Mahlangu Chairperson:
Hands-on. Learning Brief 45. Learning from our implementing partners. University of Cape Town
 EARLY CHILDHOOD DEVELOPMENT Hands-on Learning from our implementing partners University of Cape Town Are children s rights prioritised at a time of budget cuts? Assessing the adequacy of the 2013/14 social
An EMPOWERDEX Guide. The Codes of Good Practice. Codes Definitions
 An EMPOWERDEX Guide The Codes of Good Practice Codes Definitions ABET: Means Adult Basic Education and Training as determined by the National Qualifications Authority Accreditation Body: Means the South
Taking accountability to improve audit outcomes
 Taking accountability to improve audit outcomes INTEGRATED DEVELOPMENT PLAN (IDP) Plan-Do-Check-Act Cycle, also the Deming cycle, courtesy of the International Organization for Standardization 3 4 5 6
DEPARTMENT OF HIGHER EDUCATION AND TRAINING. No. 486 Date: 15 July 2013 NOTICE NO OF 2012 SKILLS DEVELOPMENT ACT, 1998 (ACT NO.
 DEPARTMENT OF HIGHER EDUCATION AND TRAINING No. 486 Date: 15 July 2013 NOTICE NO. 35940 OF 2012 SKILLS DEVELOPMENT ACT, 1998 (ACT NO. 97 OF 1998) THE SECTOR EDUCATION AND TRAINING AUTHORITIES (SETAs) GRANT
Kingdom of Swaziland. Public Finance Management Bill
 Kingdom of Swaziland Public Finance Management Bill CHAPTER ONE: INTERPRETATION, OBJECT, APPLICATION AND AMENDMENT OF THIS ACT 1 Short title This Act may be cited as the Public Finance Management Act 2010.
CURRICULUM VITAE THABO VAUGHAN SHENXANE
 CURRICULUM VITAE THABO VAUGHAN SHENXANE Cell: 084 789 9151 Email: thabo@chumisa.co.za P.O. Box 917 WINGATE PARK, Pretoria East, 0158 PERSONAL INFORMATION Identity Number : 750212 5491 08 2 Driver s Licence
4/7/2015. Group. Governance and Legislation
 Group 3 Governance and Legislation DIPLOMA IN PUBLIC ACCOUNTABILITY MINIMUM MUNICIPAL COMPETENCY PROGRAMME Karel van der Molen Module 2 Intergovernmental Fiscal Relations, Legislation and Policies affecting
South African Human Rights Commission
 South African Human Rights Commission Presentation on Strategic Plan and Annual Performance Plan to the Portfolio Committee on Justice & Constitutional Development 1 OUTLINE OF PRESENTATION PART A: OVERVIEW
Government Gazette REPUBLIC OF SOUTH AFRICA. AIDS HELPLINE: Prevention is the cure
 Please note that most Acts are published in English and another South African official language. Currently we only have capacity to publish the English versions. This means that this document will only
department of human settlements eastern cape, south africa
 department of human settlements eastern cape, south africa expenditure tracking report 2009/2010 yeukai mukorombindo Eastern Cape Department of Human Settlements Expenditure Tracking Report 2009/10 Yeukai
OR TAMBO COASTAL DISTRICT EASTERN CAPE DEPARTMENT OF EDUCATION OR TAMBO COASTAL OPERATIONAL PLAN 2017/18
 OR TAMBO COASTAL DISTRICT EASTERN CAPE DEPARTMENT OF EDUCATION OR TAMBO COASTAL OPERATIONAL PLAN 2017/18 Table of Contents 1. Foreword by Deputy Director General... 3 2. Cluster and District Maps... 4
Budgets & Bricks. Progress with School Infrastructure Following the Rivonia Primary School Case 2013(6) SA 582 (CC) June 2016.
 SA 582 (CC) June 2016.") Budgets & Bricks Budgets & Bricks Progress with School Infrastructure Following the Rivonia Primary School Case 2013(6) SA 582 (CC) June 2016 Contact person: Ann Skelton Director Centre for Child Law University
Budgets & Bricks Budgets & Bricks Progress with School Infrastructure Following the Rivonia Primary School Case 2013(6) SA 582 (CC) June 2016 Contact person: Ann Skelton Director Centre for Child Law University
Expenditure Tracking Report, December Public Service Accountability Monitor. Siyabulela Fobosi
 Department of Education Eastern Cape, South Africa Expenditure Tracking Report, December 2017 Public Service Accountability Monitor Siyabulela Fobosi Expenditure Tracking Report: Education 2016/17 December
REGISTRAR S DIVISION EMPLOYMENT EQUITY PLAN AND REPORT
 REGISTRAR S DIVISION EMPLOYMENT EQUITY PLAN AND REPORT 2010-2014 OCTOBER-SEPTEMBER SECTION A: INTRODUCTION AND INSTRUCTIONS The University of KwaZulu-Natal is a public institution with a mission of becoming
2016 FEDERAL BUDGET HIGHLIGHTS
 2016 FEDERAL BUDGET HIGHLIGHTS Helping Canadians with low incomes receive the tax benefits they deserve The government will invest an additional $4M annually to expand the Community Volunteer Income Tax
SKILLS DEVELOPMENT ACT 97 OF 1998
 SKILLS DEVELOPMENT ACT 97 OF 1998 [ASSENTED TO 20 OCTOBER 1998] [DATE OF COMMENCEMENT: 10 SEPTEMBER 1999] (Unless otherwise indicated) (English text signed by the President) as amended by Skills Development
Strategic Plan 2012/17, Annual Performance Plan and Budget 2012/13
 Strategic Plan 2012/17 and Annual Performance Plan 2012/13 Strategic Plan 2012/17, Annual Performance Plan and Budget 2012/13 INDEPENDENT POLICE INVESTIGATIVE DIRECTORATE (IPID) Monday, 16 April 2012 BRIEFING
TABLE OF CONTENTS SUBJECTS 1. INTRODUCTION 2. INSTITUTIONAL ARRANGEMENTS. Roles and responsibilities
 IDP REVIEW PROCESS PLAN DEPARTMENT OF THE OFFICE OF THE MUNICIPAL MANAGER JULY 2009-JUNE2010 TABLE OF CONTENTS SUBJECTS 1. INTRODUCTION 2. INSTITUTIONAL ARRANGEMENTS Roles and responsibilities 2.1 Council
Processes for Financing Public Basic Education in South Africa
 Processes for Financing Public Basic Education in South Africa Final January 2017 Research commissioned by the International Budget Partnership 1 Table of Contents 1 INTRODUCTION... 3 2 RELEVANT LEGISLATION...
THE WORLD BAN IBRD IDA I WORLD BANKGROUP
 Public Disclosure Authorized THE WORLD BAN IBRD IDA I WORLD BANKGROUP Ethiopia Country Office Africa Avenue, Bole Road Tel (251-11) 5176000 Addis Abeba, Ethiopia Fax: (251-11) 6627717 December 4, 2015
SECTION 2: OVERVIEW OF AUDIT OUTCOMES. Consolidated general report on national and provincial audit outcomes for
 SECTION 2: OVERVIEW OF AUDIT OUTCOMES 45 Consolidated general report on national and provincial audit outcomes for 204-5 Figure : Slight improvement in audit outcomes (all auditees) 7% (76) 28% (3) 26%
DEPARTMENT OF EDUCATION EQUALITY AND HUMAN RIGHTS POLICY SCREENING FOR INVESTING IN THE TEACHING WORKFORCE SCHEME, 2016/17 (PILOT)
") DEPARTMENT OF EDUCATION EQUALITY AND HUMAN RIGHTS POLICY SCREENING FOR INVESTING IN THE TEACHING WORKFORCE SCHEME, 2016/17 (PILOT) Teachers Negotiating Team 028 9127 9349 (Ext 59349) Further advice on
DEPARTMENT OF EDUCATION EQUALITY AND HUMAN RIGHTS POLICY SCREENING FOR INVESTING IN THE TEACHING WORKFORCE SCHEME, 2016/17 (PILOT) Teachers Negotiating Team 028 9127 9349 (Ext 59349) Further advice on
EPWP INCENTIVE GRANT MANUAL
 EPWP Incentive Grant Manual 2009/10 EPWP INCENTIVE GRANT MANUAL FROM THE NATIONAL DEPARTMENT OF PUBLIC WORKS FOR THE IMPLEMENTATION OF THE EPWP INCENTIVE GRANT BY IMPLEMENTING PUBLIC BODIES Version 1 May
NATIONAL RESEARCH FOUNDATION ACT 23 OF 1998
 Page 1 of 11 NATIONAL RESEARCH FOUNDATION ACT 23 OF 1998 [ASSENTED TO 24 JUNE 1998] [DATE OF COMMENCEMENT: 1 APRIL 1999] (English text signed by the President) as amended by Science and Technology Laws
Conditional Cash Transfer Programs in South Africa
 Third International Conference on Conditional Cash Transfers Istanbul, Turkey June 26-30, 2006 Conditional Cash Transfer Programs in South Africa Daniel Plaatjies South African Social Security Agency June
Prepared by cde Khwezi Mabasa ( FES Socio-economic Transformation Programme Manager) JANUARY 2016
 JANUARY 2016") Prepared by cde Khwezi Mabasa ( FES Socio-economic Transformation Programme Manager) JANUARY 2016 Political Context: Social Democratic Values Social policy and the access to basic public goods are the
Prepared by cde Khwezi Mabasa ( FES Socio-economic Transformation Programme Manager) JANUARY 2016 Political Context: Social Democratic Values Social policy and the access to basic public goods are the
THE SUSTAINABLE DEVELOPMENT GOALS AND SOCIAL PROTECTION
 THE SUSTAINABLE DEVELOPMENT GOALS AND SOCIAL PROTECTION Ms Nelisiwe Vilakazi Acting Director General- Ministry of Social Development REPUBLIC OF SOUTH AFRICA Global Practitioners Learning Event Oaxaca,
An analysis of training expenditure in the Public Service sector
 March 2018 An analysis of training expenditure in the Public Service sector 1. Background and Introduction The Public Service sector in South Africa, comprised of the national and provincial government
Education Budget Brief 2016
 Education Budget Brief 2016 Public Service Accountability Monitor Eastern Cape, South Africa Zukiswa Kota Budget Brief: Education 2016/17 June 2016 Zukiswa Kota Monitoring and Advocacy Programme Public
SECTION 9: AUDIT OUTCOMES OF INDIVIDUAL PORTFOLIOS. Consolidated general report on national and provincial audit outcomes for
 SECTION 9: AUDIT OUTCOMES OF INDIVIDUAL PORTFOLIOS 6 Consolidated general report on national and provincial audit outcomes for 0- Vote : The Presidency Overall improvement in audit outcomes Financial statements
Ensuring The Effective Participation Of Each Sphere Of Government In The Processes And Structures That Determine Intergovernmental Fiscal Arrangements
 Ensuring The Effective Participation Of Each Sphere Of Government In The Processes And Structures That Determine Intergovernmental Fiscal Arrangements Jackie Manche, Chief Executive Officer, Independent
South Africa. UNICEF South Africa
 South Africa UNICEF South Africa Education BUDGET SOUTH AFRICA 2017/2018 1 17% Budget for school children remains at 17% of total government expenditure Preface This budget brief is one of four that explore
SUPPLIER REGISTRATION & ACCREDITATION FORM. Registered name: Trading as name of business: Products &/ services offered:
 Tel: +27 (0) 12 366 2600 Fax: +27 (0) 12 366 2601 161 Lynnwood Road Cnr Duncan & Lynnwood Road Brooklyn 0181 PO Box 13186 Hatfield Gauteng Republic of South Africa wwwsamsaorgza SUPPLIER REGISTRATION &
FUNDING BASIC EDUCATION CHAPTER 2. Daniel McLaren
 CHAPTER 2 FUNDING BASIC EDUCATION Daniel McLaren 36 Basic Education Rights Handbook Education Rights in South Africa Chapter 2: Funding Basic Education Basic Education Rights Handbook Education Rights
NATIONAL TREASURY MFMA IMPLEMENTATION PLAN - TEMPLATE (Medium Capacity Municipality Only)
") NATIONAL TREASURY MFMA IMPLEMENTATION PLAN - TEMPLATE (Medium Capacity Municipality Only) Name of municipality: SIYANDA DISTRICT (eg: City of Johannesburg) Demarcation code:_dc8 (eg: GT001) Plan Action
NATIONAL TREASURY MFMA IMPLEMENTATION PLAN - TEMPLATE (Medium Capacity Municipality Only) Name of municipality: SIYANDA DISTRICT (eg: City of Johannesburg) Demarcation code:_dc8 (eg: GT001) Plan Action
OUR PLEDGE. Empathy Dignity Unity Confidence Access Trust Integrity Ownership Nation
 OUR PLEDGE As an official of the Department of Education and servant of the public I pledge to serve with and at all times endeavour to treat learners, my colleges and all other stakeholders with and courtesy,
COOPERATIVE GOVERNANCE AND TRADITIONAL AFFAIRS. Annual Performance Plan FREE STATE PROVINCE
 DEPARTMENT OF COOPERATIVE GOVERNANCE AND TRADITIONAL AFFAIRS Annual Performance Plan 20207 FREE STATE PROVINCE 5 MARCH 20 FOREWORD Outcome 9: A responsive, accountable, effective and efficient local government
Children and South Africa s Budget
 Children and South Africa s Budget Children and South Africa s Budget 1. Macro context 2. Health 3. Education 4. Social Development 1. MACRO CONTEXT South Africa Key message 1 The nearly 20 million children
South Africa. UNICEF/Hearfield
 South Africa UNICEF/Hearfield Social development BUDGET SOUTH AFRICA 217/218 1 .2 % Real average annual rate projected growth of DSD budgets UNICEF/Bart de Ruigh Preface This budget brief is one of four
Rwanda. UNICEF/Gonzalo Bell. Education Budget Brief
 Rwanda Education Budget Brief Investing in child education in Rwanda 217/218 Education Budget Brief: Investing in child education in Rwanda 217/218 United Nations Children s Fund (UNICEF) Rwanda November
1. INTRODUCTION 2. OVERVIEW OF POLICY PRIORITIES FOR 2016/17
 REPORT OF THE PORTFOLIO COMMITTEE ON COOPERATIVE GOVERNANCE AND TRADITIONAL AFFAIRS ON THE ANNUAL PERFORMANCE PLAN AND BUDGET VOTE 4 OF THE DEPARTMENT OF COOPERATIVE GOVERNANCE AND TRADITIONAL AFFAIRS
March Implementation of Broad Based Black Economic Empowerment (B-BBEE) Challenges faced by organs of state
 Challenges faced by organs of state") March 2018 Implementation of Broad Based Black Economic Empowerment (B-BBEE) Challenges faced by organs of state Reputation promise of AGSA The Auditor-General of South Africa has a constitutional mandate
March 2018 Implementation of Broad Based Black Economic Empowerment (B-BBEE) Challenges faced by organs of state Reputation promise of AGSA The Auditor-General of South Africa has a constitutional mandate
PART FOUR: HIGHLIGHTS OF PROVINCIAL AUDIT OUTCOMES FOREWORD
 PART FOUR: HIGHLIGHTS OF PROVINCIAL AUDIT OUTCOMES FOREWORD part 4: highlights of provincial audit outcomes 469 PART 4 Highlights of provincial audit outcomes This section of the general report is a high-level
ISBN: NUMBER
 ISBN: NUMBER 123456789 CONTENTS PART A: GENERAL INFORMATION List of Abbreviations/Acronyms...6 Foreword by the Minister...8 Report of the Accounting Officer...10 Statement of Responsibility and Confirmation
PORTFOLIO COMMITTEE ON TRADE AND INDUSTRY. Mr. Sithembele Mase. CHIEF EXECUTIVE OFFICER: samaf. CONTACT : (Marketing Manager)
") PORTFOLIO COMMITTEE ON TRADE AND INDUSTRY Mr. Sithembele Mase CHIEF EXECUTIVE OFFICER: samaf CONTACT : 012 394 1805 (Marketing Manager) 012 394 1722 (PA Line) 012 394 1116 (Direct Line) 1 CONTENT 1. Rationale
PORTFOLIO COMMITTEE ON TRADE AND INDUSTRY Mr. Sithembele Mase CHIEF EXECUTIVE OFFICER: samaf CONTACT : 012 394 1805 (Marketing Manager) 012 394 1722 (PA Line) 012 394 1116 (Direct Line) 1 CONTENT 1. Rationale
ALL MAN LABOUR SERVICES CC JUDGMENT: [1] Appellant approached the court a quo for an order to compel respondent to pay
![ALL MAN LABOUR SERVICES CC JUDGMENT: [1] Appellant approached the court a quo for an order to compel respondent to pay](/thumbs/87/96656620.jpg "ALL MAN LABOUR SERVICES CC JUDGMENT: [1] Appellant approached the court a quo for an order to compel respondent to pay") IN THE LABOUR APPEAL COURT OF SOUTH AFRICA (HELD AT JOHANNESBURG) Case No.: JA 12/2007 ALL MAN LABOUR SERVICES CC Appellant and THE SERVICES SECTOR EDUCATION & TRAINING AUTHORITY Respondent JUDGMENT: DAVIS
IN THE LABOUR APPEAL COURT OF SOUTH AFRICA (HELD AT JOHANNESBURG) Case No.: JA 12/2007 ALL MAN LABOUR SERVICES CC Appellant and THE SERVICES SECTOR EDUCATION & TRAINING AUTHORITY Respondent JUDGMENT: DAVIS
NOTICE 125 OF Internal control, as indicated by the reference to financial management in sections 4(1) and (3) of the PAA 4
 and (3) of the PAA 4") STAATSKOERANT, 11 FEBRUARIE 2015 No. 38464 3 GENERAL NOTICE NOTICE 125 OF 2015 DIRECTIVE ISSUED IN TERMS OF THE PUBLIC AUDIT ACT, 2004 Under the powers vested in me by section 2, read with section 13(3)
STAATSKOERANT, 11 FEBRUARIE 2015 No. 38464 3 GENERAL NOTICE NOTICE 125 OF 2015 DIRECTIVE ISSUED IN TERMS OF THE PUBLIC AUDIT ACT, 2004 Under the powers vested in me by section 2, read with section 13(3)
2016/17 Quarter 3 Spending Outcome
 2016/17 Quarter 3 Spending Outcome STANDING COMMITTEE ON APPROPRIATIONS Presenter: Dondo Mogajane DDG: Public Finance, National Treasury 01 March 2017 Contents Summary of 2016/17 voted expenditure Spending
TABLE OF CONTENTS ASSESSMENT OF CASP PROJECTS IN THE FREE STATE PROVINCE
 TABLE OF CONTENTS ASSESSMENT OF CASP PROJECTS IN THE FREE STATE PROVINCE EXECUTIVE SUMMARY... v A.1. INTRODUCTION... 2 A.1.1 Background to CASP... 2 A.1.2 Aim and objectives... 3 A.2 Methodological overview...
NDT Briefing to the SELECT COMMITTEE ON TRADE AND INTERNATIONAL RELATIONS
 NDT Briefing to the SELECT COMMITTEE ON TRADE AND INTERNATIONAL RELATIONS Annual Report 2010/11 November 2011 1 Unqualified Audit No matters of emphasis AUDITOR-GENERAL S REPORT Compliance with laws and
Government Gazette REPUBLIC OF SOUTH AFRICA. Vol. 478 Cape Town 1 April 2005 No
 Government Gazette REPUBLIC OF SOUTH AFRICA Vol. 478 Cape Town 1 April 2005 No. 27443 THE PRESIDENCY No. 291 1 April 2005 It is hereby notified that the President has assented to the following Act, which
DEPARTMENT OF EDUCATION PROVINCE OF THE NORTHERN CAPE VOTE 4
 DEPARTMENT OF EDUCATION PROVINCE OF THE NORTHERN CAPE VOTE 4 ANNUAL REPORT 2013/14-1- Contents PART A: GENERAL INFORMATION... 5 1. DEPARTMENT GENERAL INFORMATION... 6 2. LIST OF ABBREVIATIONS/ACRONYMS...
Provincial Budgeting and Financial Management
 Provincial Budgeting and Financial Management Presentation to Select Committee on Appropriations Presenter: Edgar Sishi National Treasury 15 July 2014 INTRODUCTION Provincial functions are assigned by
PLAN AND MANAGE THE BUDGET POLICY & PROCEDURE MANUAL
 PLAN AND MANAGE THE BUDGET POLICY & PROCEDURE MANUAL THABA CHWEU LOCAL MUNICIPALITY Approved 25 June 2012 Resolution no: A50/2012 TABLE OF CONTENTS 1 INTRODUCTION... 1 1.1 Vision and value statement...
2016 Division of Revenue Amendment Bill Select and Standing Committees on Apportions
 2016 Division of Revenue Amendment Bill Select and Standing Committees on Apportions National Treasury 10 November 2016 Overview The 2016 Division of Revenue Act (DoRA) was considered and approved by Legislatures
Briefing to the Parliamentary Portfolio
 Briefing to the Parliamentary Portfolio Committee on Communications 2016 17 FY Annual Report Contents Organisational Mandate Strategic Fit - Government s Priority Outcomes Strategic Outcome Oriented Goals:
FISCAL OVERSIGHT OPPORTUNITIES AND
 FISCAL OVERSIGHT OPPORTUNITIES AND CHALLENGES FOR 2017 AND BEYOND A STRATEGIC PLANNING REVIEW SESSION OF THE STANDING COMMITTEE ON APPROPRIATIONS 04 MAY 2017 PRESENTATION OUTLINE 1. Background 2. Impact
A total of 204 people used the tool to send an individual submission on the 2016/17 National Budget to the Secretary of the Appropriations Committee.
 2 March 2016 Dear Chairperson Submission to the National Assembly Standing Committee on Appropriations on the 2016 National Budget It is important that government knows what people think of its spending
EFFECTIVE INTEGRATED REVENUE MANAGEMENT MASTER CLASS 2017 PROJECT REPORT
 EFFECTIVE INTEGRATED REVENUE MANAGEMENT MASTER CLASS 2017 PROJECT REPORT 1. Introduction Good financial governance is built on a set of principles such as accountability and transparency and includes key
MEDIUM TERM REVENUE AND EXPENDITURE FRAMEWORK 2017/ /20
 MANGAUNG METROPOLITAN MUNICIPALITY MEDIUM TERM REVENUE AND EXPENDITURE FRAMEWORK 2017/18-2019/20 MANGAUNG METROPOLITAN MUNICIPALITY TABLE OF CONTENTS PART 1 - ANNUAL BUDGET 1. Executive Summary 4 2. Summary
Terms of Reference Individual for IMEP-Studies/Surveys/Evaluations. Public Expenditure Review (PER ) in the Education Sector in Namibia
 in the Education Sector in Namibia") Terms of Reference Individual for IMEP-Studies/Surveys/Evaluations Public Expenditure Review (PER 2011-2016) in the Education Sector in Namibia Assignment Provide Assistance to Lead Consultant in the analysis
Terms of Reference Individual for IMEP-Studies/Surveys/Evaluations Public Expenditure Review (PER 2011-2016) in the Education Sector in Namibia Assignment Provide Assistance to Lead Consultant in the analysis
Treasury Regulations for departments, trading entities, constitutional institutions and public entities
 The Minister of Finance has, in terms of Section 78 of the PFMA, published the enclosed draft Treasury Regulations for public comment in Government Gazette No. 25613 dated 28 June 2004 SCHEDULE Treasury
NATIONAL EMPOWERMENT FUND. INFORMATION MANUAL In terms of the Promotion of Access to Information Act, No 2 of 2000 (PAIA) Contents
 Contents") NATIONAL EMPOWERMENT FUND INFORMATION MANUAL In terms of the Promotion of Access to Information Act, No 2 of 2000 (PAIA) Contents 1. Introduction... 2 2. Human Rights Commission Guide on how to use the
NATIONAL EMPOWERMENT FUND INFORMATION MANUAL In terms of the Promotion of Access to Information Act, No 2 of 2000 (PAIA) Contents 1. Introduction... 2 2. Human Rights Commission Guide on how to use the
DEPARTMENT OF THE PREMIER FREE STATE PROVINCE ANNUAL REPORT 2015/16 FINANCIAL YEAR
 DEPARTMENT OF THE PREMIER FREE STATE PROVINCE ANNUAL REPORT 2015/16 FINANCIAL YEAR PART A: GENERAL INFORMATION... 3 1. DEPARTMENT GENERAL INFORMATION... 4 2. LIST OF ABBREVIATIONS/ACRONYMS... 5 3. FOREWORD
Annual Report 2016/17
 Annual Report 2016/17 Table of Contents ANNUAL REPORT 2016-2017 PART A: GENERAL INFORMATION...3 1. GIFA GENERAL INFORMATION... 4 2. LIST OF ABBREVIATIONS/ACRONYMS... 5 3. FOREWORD BY THE MEC... 6 4. REPORT
E 2 / 001 PLEASE READ THIS FIRST DEPARTMENT OF LABOUR PURPOSE OF THIS FORM
 E 2 / 001 + PAGE 1 OF 13 EEA13 PLEASE READ THIS FIRST DEPARTMENT OF LABOUR PURPOSE OF THIS FORM Section 20 requires designated employers to prepare and implement an Employment Equity Plan which will achieve
PROGRESS WITH THE NATIONAL INFRASTRUCTURE MAINTENANCE STRATEGY
 PROGRESS WITH THE NATIONAL INFRASTRUCTURE MAINTENANCE STRATEGY Kevin Wall CSIR, P.O. Box 395, Pretoria, 0001; Cell: 082-4593618, Email: kwall@csir.co.za ABSTRACT The National Infrastructure Maintenance
Expanded Public Works Programme
 Expanded Public Works Programme (EPWP) Overview of EPWP Phase 2 Second Economy Strategy 29 September 2008 Sector Analysis: Infrastructure Meeting job targets but jobs are too short Use of labour-intensive
Policy brief on the role of the private sector in Europe s development cooperation
 Action Aid International, Eurodad and Oxfam International Policy brief on the role of the private sector in Europe s development cooperation 8 th December 2014 The private sector has an important role
GOVERNANCE OF TRANSFER PAYMENTS. An active & winning province through sport & recreation.
 GOVERNANCE OF TRANSFER PAYMENTS An active & winning province through sport & recreation. 1 INTRODUCTION The Accounting Officer has delegated Stakeholder Support Management with the responsibility for sport
Supplementary Budget Motion
 Supplementary Budget 217-18 June 217 Supplementary Budget Motion 217-18 Laid Before the National Assembly for Wales by the Cabinet Secretary for Finance and Local Government June 217 1 Supplementary Budget
Presentation of the Strategic Plan and APP April 2015
 The Presidency: Department of Planning, Monitoring and Evaluation Presentation of the Strategic Plan 2015-2020 and APP 2015-2016 15 April 2015 Structure of the Presentation 1. Background to the DPME 2.
Treasury Guidelines Preparation of Expenditure Estimates for the 2010 Medium Term Expenditure Framework
 Treasury Guidelines Preparation of Expenditure Estimates for the 2010 Medium Term Expenditure Framework National Treasury May 2009 The document is available on the internet at: www.treasury.gov.za/publications/guidelines
AUDITOR-GENERAL OF SOUTH AFRICA NO MAY 2016
 Auditor-General of South Africa/ Ouditeur-Generaal van Suid-Afrika 574 Public Audit Act (25/2004): Directive issued in terms of the Public Audit Act 40021 STAATSKOERANT, 27 MEI 2016 No. 40021 33 AUDITOR-GENERAL
T H E NA I RO B I C A L L TO A C T I O N F O R C L O S I N G T H E I M P L E M E N TA T I O N G A P I N H E A LT H P RO M O T I O N
 T H E NA I RO B I C A L L TO A C T I O N F O R C L O S I N G T H E I M P L E M E N TA T I O N G A P I N H E A LT H P RO M O T I O N 1. INTRODUCTION PURPOSE The Nairobi Call to Action identifies key strategies
Government Gazette REPUBLIC OF SOUTH AFRICA
 Government Gazette REPUBLIC OF SOUTH AFRICA Vol. 526 Cape Town 3 April 2009 No. 32106 THE PRESIDENCY No. 408 3 April 2009 It is hereby notified that the President has assented to the following Act, which
Submission on the Function Shift of Further Education and Training (FET)
") Submission on the Function Shift of Further Education and Training (FET) For an Equitable Sharing of National Revenue. 3 DECEMBER 2013 Financial and Fiscal Commission Montrose Place (2 nd Floor), Bekker
Submission on the Function Shift of Further Education and Training (FET) For an Equitable Sharing of National Revenue. 3 DECEMBER 2013 Financial and Fiscal Commission Montrose Place (2 nd Floor), Bekker
Auditor-General tables three performance audit reports dealing with the pharmaceuticals, water infrastructure and urban renewal projects
 1 P a g e 30 November 2016 Auditor-General tables three performance audit reports dealing with the pharmaceuticals, water infrastructure and urban renewal projects PRETORIA Government leadership needs
MALAWI. 2016/17 Education Budget Brief. March 2017 KEY MESSAGES
 March 2017 MALAWI 2016/17 Education Budget Brief KEY MESSAGES Although the Ministry of Education, Science and Technology (MoEST) budget increased from MK109.7 Billion in 2015-16 to MK146.5 billion in 2016-17,