Report Documentation Page
|
|
|
- Stewart Wilkinson
- 5 years ago
- Views:
Transcription
1
2 Report Documentation Page Form Approved OMB No Public reporting burden for the collection of information is estimated to average 1 hour per response, including the time for reviewing instructions, searching existing data sources, gathering and maintaining the data needed, and completing and reviewing the collection of information. Send comments regarding this burden estimate or any other aspect of this collection of information, including suggestions for reducing this burden, to Washington Headquarters Services, Directorate for Information Operations and Reports, 1215 Jefferson Davis Highway, Suite 1204, Arlington VA Respondents should be aware that notwithstanding any other provision of law, no person shall be subject to a penalty for failing to comply with a collection of information if it does not display a currently valid OMB control number. 1. REPORT DATE JAN REPORT TYPE 3. DATES COVERED to TITLE AND SUBTITLE The Budget and Economic Outlook: 2015 to a. CONTRACT NUMBER 5b. GRANT NUMBER 5c. PROGRAM ELEMENT NUMBER 6. AUTHOR(S) 5d. PROJECT NUMBER 5e. TASK NUMBER 5f. WORK UNIT NUMBER 7. PERFORMING ORGANIZATION NAME(S) AND ADDRESS(ES) Congressional Budget Office,Ford House Office Building, Fourth Floor,Second and D Streets, SW,Washington,DC, PERFORMING ORGANIZATION REPORT NUMBER 9. SPONSORING/MONITORING AGENCY NAME(S) AND ADDRESS(ES) 10. SPONSOR/MONITOR S ACRONYM(S) 12. DISTRIBUTION/AVAILABILITY STATEMENT Approved for public release; distribution unlimited 13. SUPPLEMENTARY NOTES 14. ABSTRACT 11. SPONSOR/MONITOR S REPORT NUMBER(S) 15. SUBJECT TERMS 16. SECURITY CLASSIFICATION OF: 17. LIMITATION OF ABSTRACT a. REPORT unclassified b. ABSTRACT unclassified c. THIS PAGE unclassified Same as Report (SAR) 18. NUMBER OF PAGES a. NAME OF RESPONSIBLE PERSON Standard Form 298 (Rev. 8-98) Prescribed by ANSI Std Z39-18
3 Notes Unless otherwise indicated, all years referred to in describing the budget outlook are federal fiscal years (which run from October 1 to September 30), and years referred to in describing the economic outlook are calendar years. Numbers in the text and tables may not add up to totals because of rounding. Also, some values are expressed as fractions to indicate numbers rounded to amounts greater than a tenth of a percentage point. Some figures in this report have vertical bars that indicate the duration of recessions. (A recession extends from the peak of a business cycle to its trough.) The economic forecast was completed in early December 2014, and, unless otherwise indicated, estimates presented in Chapter 2 and Appendix F of this report are based on information available at that time. As referred to in this report, the Affordable Care Act comprises the Patient Protection and Affordable Care Act (Public Law ), the health care provisions of the Health Care and Education Reconciliation Act of 2010 (P.L ), and the effects of subsequent judicial decisions, statutory changes, and administrative actions. Supplemental data for this analysis are available on s website ( publication/49892), as is a glossary of common budgetary and economic terms (
4 Contents Summary 1 Rising Deficits After 2018 Are Projected to Gradually Boost Debt Relative to GDP 1 The Economy Will Grow at a Solid Pace Over the Next Few Years 3 1 The Budget Outlook 7 A Review of The Budget Outlook for s Baseline Budget Projections for 2016 to Uncertainty in Budget Projections 21 Alternative Assumptions About Fiscal Policy 23 The Long-Term Budget Outlook 26 2 The Economic Outlook 27 BOX 2-1. DATA RELEASED SINCE EARLY DECEMBER 28 The Economic Outlook for 2015 Through BOX 2-2. THE EFFECT OF THE RECENT DROP IN OIL PRICES ON U.S. OUTPUT 31 The Economic Outlook for 2020 Through Projections of Income 51 Some Uncertainties in the Economic Outlook 52 Comparison With s August 2014 Projections 52 Comparison With Other Economic Projections 56 3 The Spending Outlook 59 BOX 3-1. CATEGORIES OF FEDERAL SPENDING 61 Mandatory Spending 62 Discretionary Spending 75 BOX 3-2. FUNDING FOR OPERATIONS IN AFGHANISTAN AND IRAQ AND RELATED ACTIVITIES 80 Net Interest 85
5 II THE BUDGET AND ECONOMIC OUTLOOK: 2015 TO 2025 JANUARY The Revenue Outlook 91 The Evolving Composition of Revenues 92 Payroll Taxes 96 Corporate Income Taxes 97 Smaller Sources of Revenues 98 Tax Expenditures 101 A Changes in s Baseline Since August B Updated Estimates of the Insurance Coverage Provisions of the Affordable Care Act 115 C How Changes in Economic Projections Might Affect Budget Projections 131 D The Effects of Automatic Stabilizers on the Federal Budget as of E Trust Funds 145 F s Economic Projections for 2015 to
6 CONTENTS THE BUDGET AND ECONOMIC OUTLOOK: 2015 TO 2025 III G Historical Budget Data 157 List of Tables and Figures 169 About This Document 172
7
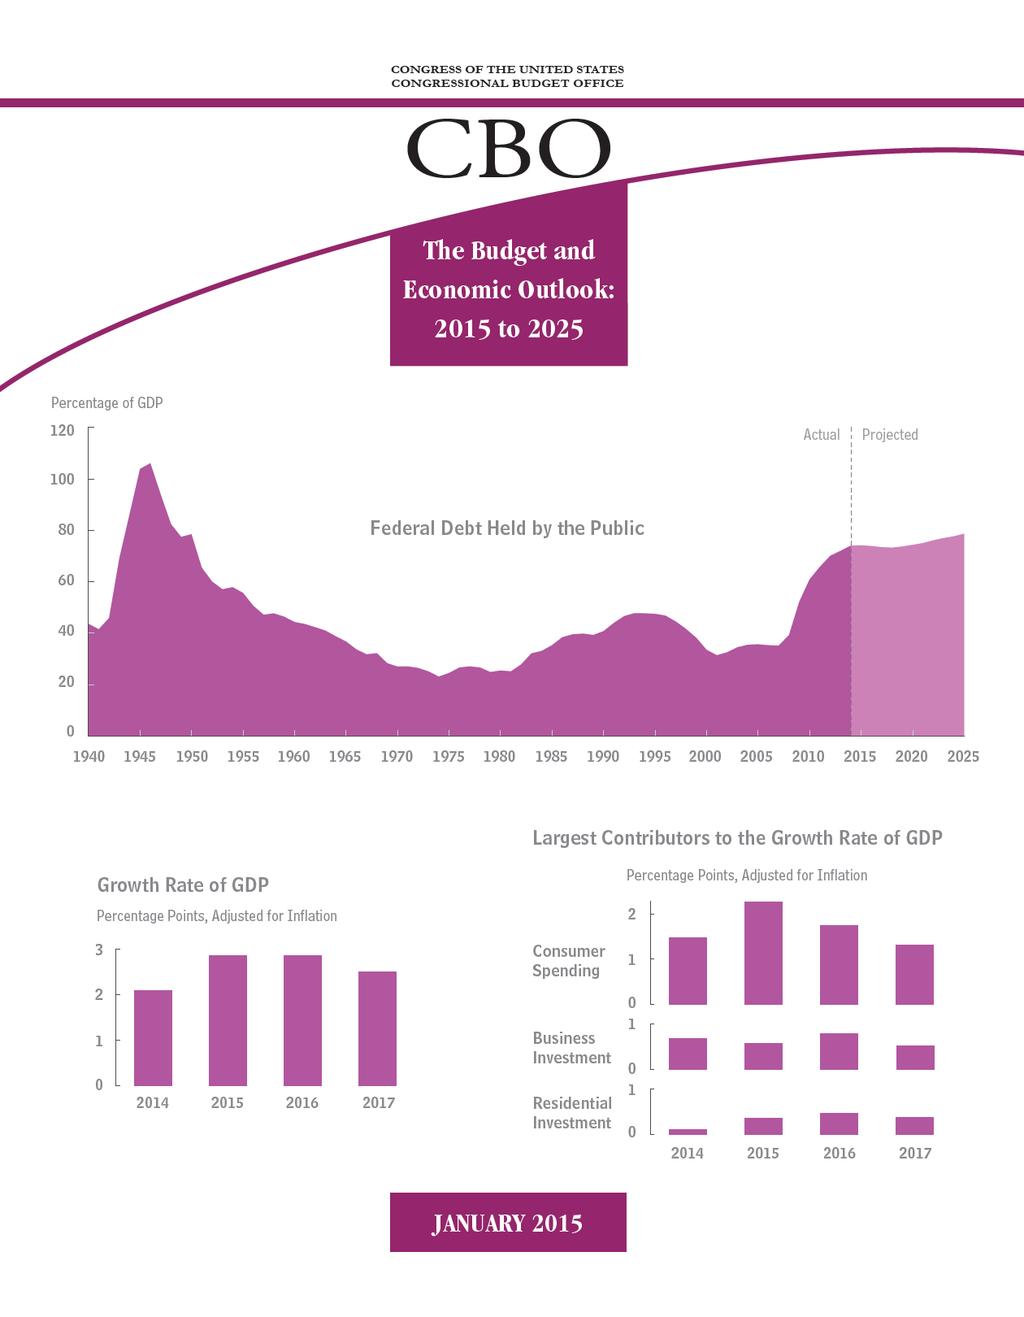
8 Summary The federal budget deficit, which has fallen sharply during the past few years, is projected to hold steady relative to the size of the economy through Beyond that point, however, the gap between spending and revenues is projected to grow, further increasing federal debt relative to the size of the economy which is already historically high. Those projections by the Congressional Budget Office, based on the assumption that current laws governing taxes and spending will generally remain unchanged, are built upon the agency s economic forecast. According to that forecast, the economy will expand at a solid pace in 2015 and for the next few years to the point that the gap between the nation s output and its potential (that is, maximum sustainable) output will be essentially eliminated by the end of As a result, the unemployment rate will fall a little further, and more people will be encouraged to enter or stay in the labor force. Beyond 2017, projects, real (inflation-adjusted) gross domestic product (GDP) will grow at a rate that is notably less than the average growth during the 1980s and 1990s. Rising Deficits After 2018 Are Projected to Gradually Boost Debt Relative to GDP estimates that the deficit for this fiscal year will amount to $468 billion, slightly less than the deficit in 2014 (see Summary Table 1). At 2.6 percent of GDP, this year s deficit is projected to be the smallest relative to the nation s output since 2007 but close to the 2.7 percent that deficits have averaged over the past 50 years. Although the deficits in s baseline projections remain roughly stable as a percentage of GDP through 2018, they rise after that. The deficit in 2025 is projected to be $1.1 trillion, or 4.0 percent of GDP, and cumulative deficits over the period are projected to total $7.6 trillion. expects that federal debt held by the public will amount to 74 percent of GDP at the end of this fiscal year more than twice what it was at the end of 2007 and higher than in any year since 1950 (see Summary Figure 1). By 2025, in s baseline projections, federal debt rises to nearly 79 percent of GDP. Outlays In s projections, outlays rise from a little more than 20 percent of GDP this year (which is about what federal spending has averaged over the past 50 years) to a little more than 22 percent in 2025 (see Summary Figure 2 on page 4). Four key factors underlie that increase: The retirement of the baby-boom generation, The expansion of federal subsidies for health insurance, Increasing health care costs per beneficiary, and Rising interest rates on federal debt. Consequently, under current law, spending will grow faster than the economy for Social Security; the major health care programs, including Medicare, Medicaid, and subsidies offered through insurance exchanges; and net interest costs. In contrast, mandatory spending other than that for Social Security and health care, as well as both defense and nondefense discretionary spending, will shrink relative to the size of the economy. By 2019, outlays in those three categories taken together will fall below the percentage of GDP they were from 1998 through 2001, when such spending was the lowest since at least 1940 (the earliest year for which comparable data have been reported).
9 2 THE BUDGET AND ECONOMIC OUTLOOK: 2015 TO 2025 JANUARY 2015 Summary Table 1. s Baseline Budget Projections Total Actual, In Billions of Dollars Revenues 3,021 3,189 3,460 3,588 3,715 3,865 4,025 4,204 4,389 4,591 4,804 5,029 18,652 41,670 Outlays 3,504 3,656 3,926 4,076 4,255 4,517 4,765 5,018 5,337 5,544 5,754 6,117 21,540 49,310 Deficit ,088-2,887-7,641 Debt Held by the Public at the End of the Year 12,779 13,359 13,905 14,466 15,068 15,782 16,580 17,451 18,453 19,458 20,463 21,605 n.a. n.a. Source: Note: Congressional Budget Office. GDP = gross domestic product; n.a. = not applicable. As a Percentage of Gross Domestic Product Revenues Outlays Deficit Debt Held by the Public at the End of the Year n.a. n.a. Revenues Revenues are projected to rise significantly by 2016, buoyed by the expiration of several provisions of law that reduced tax liabilities and by the ongoing economic expansion. In s projections, based on current law, revenues equal about 18½ percent of GDP in 2016 and remain between 18 percent and 18½ percent through Revenues at that level would represent a greater share of the economy than their 50-year average of about 17½ percent of GDP but would still be less than outlays by growing amounts over the course of the decade. Revenues from the individual income tax are expected to rise relative to GDP mostly because people s income will move into higher tax brackets as income gains outpace inflation, to which those brackets are indexed. But those increases are expected to be offset by reductions relative to GDP in revenues from the corporate income tax and other sources. Changes From s Previous Budget Projections The deficit that now estimates for 2015 is essentially the same as what the agency projected in August. 1 s estimate of outlays this year has declined by $94 billion, or about 3 percent, from the August projection because of a number of developments, including higher-than-expected receipts from auctions of licenses to use the electromagnetic spectrum for commercial purposes. But s estimate of revenues has dropped almost as much by $93 billion, also about 3 percent mostly because of the enactment of legislation that retroactively extended a host of expired tax provisions through December Over the period, deficits are now projected to total about $175 billion less than s August estimate for that period. The current projections of revenues and outlays for those years are both lower than previously estimated, outlays a little more so. The Longer-Term Outlook When last issued long-term budget projections (in July 2014), it projected that, under current law, debt would exceed 100 percent of GDP 25 years from now and would continue on an upward trajectory thereafter a trend that could not be sustained. 2 (The 10-year 1. See Congressional Budget Office, An Update to the Budget and Economic Outlook: 2014 to 2024 (August 2014), publication/ See Congressional Budget Office, The 2014 Long-Term Budget Outlook (July 2014),
10 SUMMARY THE BUDGET AND ECONOMIC OUTLOOK: 2015 TO Summary Figure 1. Federal Debt Held by the Public Percentage of Gross Domestic Product 120 Actual Projected Source: Congressional Budget Office. projections presented here do not materially change that outlook.) 3 Such large and growing federal debt would have serious negative consequences, including increasing federal spending for interest payments; restraining economic growth in the long term; giving policymakers less flexibility to respond to unexpected challenges; and eventually heightening the risk of a fiscal crisis. The Economy Will Grow at a Solid Pace Over the Next Few Years anticipates that, under current law, economic activity will expand at a solid pace in 2015 and over the next few years reducing the amount of underused resources, or slack, in the economy. Economic Growth Over the Next Few Years In s estimation, increases in consumer spending, business investment, and residential investment will drive the economic expansion this year and over the next few years. The growth in those categories of spending will derive mainly from increases in hourly compensation, rising wealth, the recent decline in crude oil prices, and a step-up in the rate of household formation (as people are more willing and able to set up new homes). As measured 3. s current projection of debt as a percentage of GDP in 2024 is quite close to that used as the starting point for the projections in The 2014 Long-Term Budget Outlook. by the change from the fourth quarter of the previous year, real GDP will grow by about 3 percent in 2015 and 2016 and by 2½ percent in 2017, expects (see Summary Figure 3). The Degree of Slack in the Economy Over the Next Few Years The difference between actual GDP and s estimate of potential GDP which is a measure of slack for the whole economy was about 2 percent of potential GDP at the end of During the next few years, expects, actual GDP will rise more rapidly than its potential, gradually eliminating that slack. For the labor market in particular, anticipates that slack will dissipate by the end of By s projections, increased hiring will reduce the unemployment rate from 5.7 percent in the fourth quarter of 2014 to 5.3 percent in the fourth quarter of 2017, which is close to the expected natural rate of unemployment (that is, the rate arising from all sources except fluctuations in the overall demand for goods and services). That increased hiring will also encourage more people to enter or stay in the labor force, boosting the labor force participation rate (which is the percentage of people who are working or actively looking for work). Economic Growth in Later Years The agency s projections beyond the next few years are not based on estimates of cyclical developments in the
11 4 THE BUDGET AND ECONOMIC OUTLOOK: 2015 TO 2025 JANUARY 2015 Summary Figure 2. Total Revenues and Outlays Percentage of Gross Domestic Product Average Outlays, 1965 to 2014 (20.1%) Outlays Actual Projected Revenues Average Revenues, 1965 to 2014 (17.4%) Source: Congressional Budget Office. economy, because the agency does not attempt to predict economic fluctuations that far into the future; instead, those projections are based on estimates of underlying factors that affect the economy s productive capacity. For 2020 through 2025, projects that real GDP will grow by an average of 2.2 percent per year a rate that matches the agency s estimate of the potential growth of the economy in those years. Potential output is expected to grow much more slowly than it did during the 1980s and 1990s primarily because the labor force is anticipated to expand more slowly than it did then. Growth in the potential labor force will be held down by the ongoing retirement of the baby boomers; by a relatively stable labor force participation rate among working-age women, after sharp increases from the 1960s to the mid-1990s; and by federal tax and spending policies set in current law. Inflation and Interest Rates The elimination of slack in the economy will eventually remove the downward pressure on the rate of inflation and on interest rates that has existed for the past several years. By s estimates, the rate of inflation as measured by the price index for personal consumption expenditures will move up gradually to the Federal Reserve s goal of 2 percent, hitting that mark in 2017 and beyond. Interest rates on Treasury securities, which have been exceptionally low since the recession, will rise considerably in the next few years, expects, but remain lower than they were, on average, in previous decades. Between 2020 and 2025, the projected interest rates on 3-month Treasury bills and 10-year Treasury notes are 3.4 percent and 4.6 percent, respectively. Changes From s Previous Economic Projections Last August, projected real GDP growth averaging 2.7 percent per year for 2014 through 2018; now anticipates that real GDP growth will average 2.5 percent annually over that period. The revision mainly reflects a reduction in s estimate of potential output and therefore of the current amount of slack in the economy. On the basis of the current projection of potential output, now forecasts that real GDP in 2024 will be roughly 1 percent lower than the level estimated in August. In addition, the sharper-than-anticipated drop in the unemployment rate in the second half of last year caused to lower its projection of that rate for the next few years.
12 SUMMARY THE BUDGET AND ECONOMIC OUTLOOK: 2015 TO Summary Figure 3. Actual Values and s Projections of Key Economic Indicators Percent 6 Real GDP Growth Actual Projected Percent 12 Unemployment Rate Actual Projected Percentage Change in Prices 5 Inflation Actual Projected Percent 7 Interest Rates Actual Projected 4 Overall Year Treasury Notes Month Treasury Bills 2 1 Core Sources: Congressional Budget Office; Bureau of Economic Analysis; Bureau of Labor Statistics; Federal Reserve. Notes: Real gross domestic product is the output of the economy adjusted to remove the effects of inflation. The unemployment rate is a measure of the number of jobless people who are available for work and are actively seeking jobs, expressed as a percentage of the labor force. The overall inflation rate is based on the price index for personal consumption expenditures; the core rate excludes prices for food and energy. Data are annual. For real GDP growth and inflation, actual data are plotted through 2013; the values for 2014 reflect s estimates for the third and fourth quarters and do not incorporate data released by the Bureau of Economic Analysis since early December For the unemployment and interest rates, actual data are plotted through For real GDP growth and inflation, percentage changes in GDP and prices are measured from the fourth quarter of one calendar year to the fourth quarter of the next. GDP = gross domestic product.
13
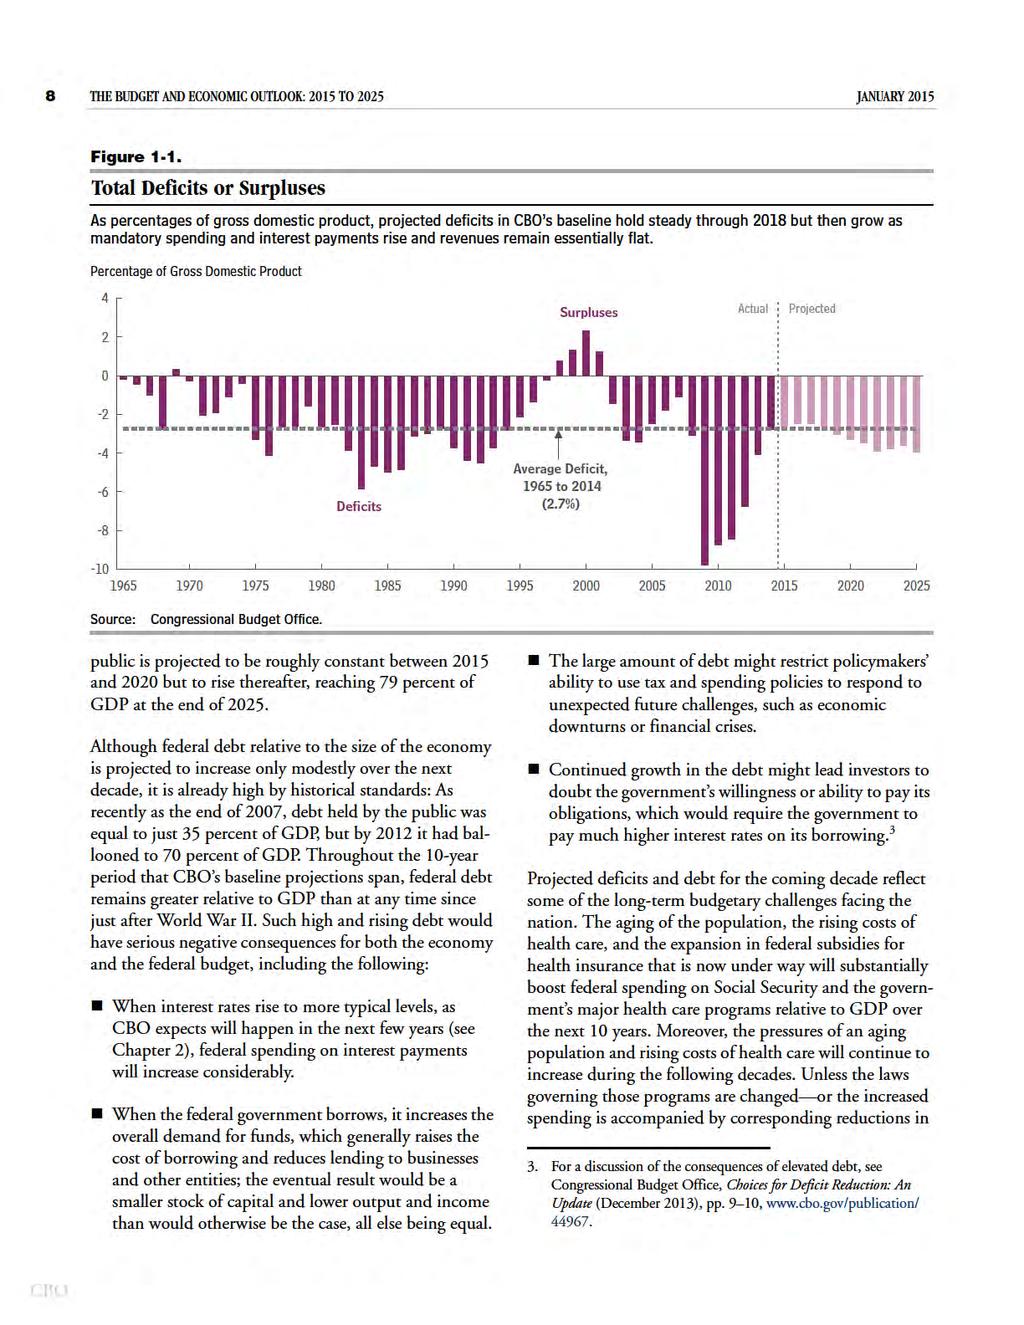
14 CHAPTER 1 The Budget Outlook If current laws remain in place, the federal budget deficit will total $468 billion in fiscal year 2015, the Congressional Budget Office estimates, slightly less than the deficit of $483 billion posted for fiscal year This will mark the sixth consecutive year in which the deficit at 2.6 percent of gross domestic product (GDP) has declined relative to the size of the economy since peaking at 9.8 percent in 2009 (see Figure 1-1). Nevertheless, debt held by the public will remain at 74 percent of GDP in 2015, estimates, about the same as last year but higher than in any year between 1951 and constructs its 10-year baseline projections of federal revenues and spending under the assumption that current laws generally remain unchanged, following rules for those projections set in law. 1 That approach reflects the fact that s baseline is not intended to be a forecast of budgetary outcomes; rather, it is meant to provide a neutral benchmark that policymakers can use to assess the potential effects of policy decisions. Under that assumption: Revenues as a share of GDP are projected to grow by two-thirds of one percentage point over the next year from 17.7 percent in 2015 to 18.4 percent in 2016 and then remain near that level through The jump next year results primarily from the expiration of certain tax provisions that reduce tax liabilities; if all of those provisions were extended, as they have regularly been in recent years, the increase in revenues from 2015 to 2016 would be much smaller, and revenues throughout the projection period would be lower as a share of GDP. 1. Section 257 of the Balanced Budget and Emergency Deficit Control Act of 1985 (the Deficit Control Act) specifies the rules for developing baseline projections. Outlays as a share of GDP are projected to rise significantly more than revenues over the coming decade by two percentage points, from 20.3 percent in 2015 to 22.3 percent in The increase in outlays reflects substantial growth in the cost of benefit programs that are targeted toward the elderly, related to health care, or both, as well as a sharp rise in payments of interest on the government s debt; those increases would more than offset a significant projected decline in discretionary spending relative to the size of the economy. The projected deficit remains roughly stable as a percentage of GDP at about 2.5 percent through 2018 and then starts on an upward trajectory, growing from 3.0 percent of GDP in 2019 to 4.0 percent in 2025 (see Table 1-1). By the end of that period, projects, annual deficits would be well above the average of 2.7 percent of GDP over the past 50 years. 2 That pattern of initially stable deficits followed by higher deficits for the remainder of the projection period would cause debt held by the public to follow a similar trajectory. Relative to the nation s output, debt held by the 2. In previous publications, has generally cited a 40-year historical average for various categories of the federal budget. has lengthened the period to cover the past 50 years in part because sufficient historical data are now available to allow for such calculations. (Data for certain categories of spending within the federal budget such as for mandatory and discretionary outlays are only available beginning in 1962.) In addition, the longer period captures years with both unusually high and unusually low values for most budget categories without giving excessive weight to any of those years. Using different historical periods would produce different averages, however. For example, the average deficit over the past 40 years was 3.2 percent of GDP, and the average for the 40 years ending in 2007 thus excluding the deficits recorded during the most recent recession and its aftermath was noticeably lower at 2.3 percent of GDP.
15
16 CHAPTER ONE THE BUDGET AND ECONOMIC OUTLOOK: 2015 TO Table 1-1. Deficits Projected in s Baseline Billions of Dollars Total Actual, Revenues 3,021 3,189 3,460 3,588 3,715 3,865 4,025 4,204 4,389 4,591 4,804 5,029 18,652 41,670 Outlays 3,504 3,656 3,926 4,076 4,255 4,517 4,765 5,018 5,337 5,544 5,754 6,117 21,540 49,310 Total Deficit ,088-2,887-7,641 Net Interest ,046 5,643 Primary Deficit a ,998 Memorandum (As a percentage of GDP): Total Deficit Primary Deficit a Debt Held by the Public at the End of the Year n.a. n.a. Source: Congressional Budget Office. Note: GDP = gross domestic product; n.a. = not applicable. a. Excludes net interest. other spending relative to GDP, by sufficiently higher tax revenues, or by a combination of those changes debt will rise sharply relative to GDP after In addition, holding discretionary spending within the limits required under current law an assumption that underlies these projections may be quite difficult. The caps on discretionary budget authority established by the Budget Control Act of 2011 (Public Law ) and subsequently amended will reduce such spending to an unusually small amount relative to the size of the economy. 5 With those caps in place, projects, discretionary spending will equal 5.1 percent of GDP in 2025; by comparison, the lowest share for discretionary spending in any year since 1962 (the earliest year for which such data have been reported) was 6.0 percent in 1999, and that share has averaged 8.8 percent over the past 50 years. (Nevertheless, total federal spending would constitute a 4. For a more detailed discussion of the long-term budget situation, see Congressional Budget Office, The 2014 Long-Term Budget Outlook (July 2014), 5. Budget authority is the authority provided by law to incur financial obligations that will result in immediate or future outlays of federal funds. larger share of GDP than its average during the past 50 years because of higher spending on Social Security, Medicare, Medicaid, other health insurance subsidies for low-income people, and interest payments on the debt.) Because the allocation of discretionary spending is determined by annual appropriation acts, lawmakers have not yet decided which specific government services and benefits would be reduced or constrained to meet the overall limits. The baseline budget outlook has changed little since August 2014, when last published its 10-year projections. 6 At that time, deficits projected under current law totaled about 3 percent of GDP over the period, or $7.2 trillion. In s latest baseline, deficits are projected to be about $175 billion smaller over those 10 years but still total about 3 percent of GDP. The agency has reduced its projection of total revenues by 1.0 percent through 2024, but projected outlays have decreased by 1.2 percent. Revisions to the economic 6. For s previous baseline budget projections, see Congressional Budget Office, An Update to the Budget and Economic Outlook: 2014 to 2024 (August 2014), publication/45653.
17 10 THE BUDGET AND ECONOMIC OUTLOOK: 2015 TO 2025 JANUARY 2015 outlook account for roughly half of the change in both categories. Although s baseline does not incorporate potential changes in law, this chapter shows how some alternative policies would affect the budget over the next 10 years. For example, has constructed a policy alternative under which funding for overseas contingency operations that is, military operations and related activities in Afghanistan and other countries would continue to decline through 2019 and then grow at the rate of inflation through Under that alternative, spending for such operations over the period would be about $450 billion less than the amount projected in the baseline (which incorporates the assumption that funding grows at the rate of inflation throughout the projection period). Other alternative policies would result in larger deficits than those in the baseline. For example, continuing certain tax policies that were recently extended through 2014 but have since expired would lower revenues by about $900 billion over the period. (For more details, see Alternative Assumptions About Fiscal Policy on page 23.) A Review of 2014 In fiscal year 2014, the budget deficit dropped once again, to $483 billion nearly 30 percent less than the $680 billion shortfall recorded in Revenues rose by $246 billion (or 9 percent) and outlays increased by $50 billion (or 1 percent). As a percentage of GDP, the deficit dropped from 4.1 percent in 2013 to 2.8 percent in Revenues Receipts from each of the major revenue sources individual income taxes, payroll taxes, and corporate income taxes and remittances from the Federal Reserve all rose relative to the size of the economy in Total revenues increased from 16.7 percent of GDP in 2013 to 17.5 percent in 2014, close to the average for the past 50 years of 17.4 percent. 7 Individual income taxes, the largest revenue source, rose by $78 billion (or 6 percent), from 7.9 percent of GDP in 2013 to 8.1 percent in That percentage of GDP 7. Looking at different historical periods, total revenues averaged 17.3 percent of GDP over the past 40 years and 17.7 percent over the 40 years ending in is the highest since 2007 and is larger than the percentage recorded in any other year since The increase in receipts largely reflected gains in both 2013 and 2014 in wages and salaries as well as in nonwage income. The gains in wages also boosted payroll taxes, the second largest revenue source, which increased by $76 billion (or 8 percent), from 5.7 percent of GDP to 5.9 percent. Part of that increase occurred because the rate for employees share of the Social Security payroll tax that was in effect during the first quarter of fiscal year 2014 that is, October 2013 through December 2013 was higher than that in effect during the same period the year before, following the expiration of the 2 percentage-point cut in that rate at the end of calendar year Revenues from corporate income taxes and remittances from the Federal Reserve also rose relative to GDP. Corporate tax receipts increased by $47 billion (or 17 percent) in 2014, from 1.6 percent of GDP to 1.9 percent, reflecting growth in taxable profits. Remittances to the Treasury from the Federal Reserve rose by $23 billion (or 31 percent), from 0.5 percent of GDP to 0.6 percent, mostly because the central bank s portfolio of securities was larger and the yield on that portfolio was higher. Those remittances are the largest ever, both in dollars and as a share of GDP. Outlays After declining over the preceding two years, federal spending rose in 2014 by $50 billion to $3.5 trillion. Nevertheless, at 20.3 percent of GDP, outlays were lower as a share of the nation s output than in any year since By comparison, outlays have averaged 20.1 percent of GDP over the past 50 years. 8 Mandatory Spending. After remaining largely unchanged over the previous three years, outlays for mandatory programs (which include spending for benefit programs and certain other payments to people, businesses, nonprofit institutions, and state and local governments) rose by $65 billion (or 3.2 percent) in By comparison, mandatory outlays grew at an average annual rate of 5.6 percent during the preceding decade (between 2003 and 2013). Major Health Care Programs. Federal spending for the major health care programs Medicare (net of receipts 8. Total outlays averaged 20.5 percent of GDP over the past 40 years and 19.9 percent over the 40 years ending in 2007.
18 CHAPTER ONE THE BUDGET AND ECONOMIC OUTLOOK: 2015 TO from premiums and certain payments from states), Medicaid, the Children s Health Insurance Program, and subsidies offered through health insurance exchanges and related spending equaled $831 billion in 2014, $63 billion (or 8.3 percent) more than the total for such spending in The largest increase was for Medicaid outlays, which grew by $36 billion (or 13.6 percent) last year, mostly because a little more than half the states expanded eligibility for Medicaid coverage under the provisions of the Affordable Care Act (ACA). 9 Similarly, subsidies for health insurance purchased through the exchanges that were established by the ACA first became available in January Outlays for those subsidies, along with related spending, totaled $15 billion last year; in 2013, related spending was only $1 billion (primarily for grants to states to establish exchanges). In contrast, Medicare outlays continued to grow at a modest rate in In total, outlays for that program rose by $14 billion (or 2.8 percent) last year, slightly higher than the rate of growth in 2013 (after adjusting for a shift in the timing of certain payments) and less than the rate of growth in the number of Medicare beneficiaries. Over the past four years, Medicare spending has grown at an average annual rate of only 3.1 percent, compared with average annual growth of 3.6 percent in the number of beneficiaries. Outlays for the Children s Health Insurance Program totaled $9 billion in both 2013 and Social Security. Outlays for Social Security totaled $845 billion in 2014, $37 billion (or 4.6 percent) more than payments in Beneficiaries received a 1.5 percent cost-of-living adjustment in January (which applied to three-quarters of the fiscal year); the increase in the previous year was 1.7 percent. In addition, the number of people receiving benefits grew by 2.0 percent. Fannie Mae and Freddie Mac. Payments to the Treasury from Fannie Mae and Freddie Mac dropped from $97 billion in 2013 to $74 billion in That reduction was primarily the result of differences in the timing and magnitude of revaluations of certain tax assets held by each entity. Those reassessments boosted the net worth of both entities and increased the size of the payments to the Treasury from Fannie Mae and 9. See Appendix B for more information about the provisions of the ACA that affect health insurance coverage. Freddie Mac. Fannie Mae s revaluation increased its fiscal 2013 payment to Treasury by about $50 billion; Freddie Mac s revaluation boosted its fiscal 2014 payment by about half that amount. Such payments are recorded as reductions in outlays. Higher Education. Mandatory outlays for higher education include the net (negative) subsidies for direct student loans issued in the current year, revisions to the subsidy costs of loans made in previous years, and mandatory spending for the Federal Pell Grant Program. Last year, the Treasury recorded outlays of $12 billion for those higher education programs, compared with outlays of -$26 billion recorded in 2013 thereby accounting for a net increase in outlays of $14 billion. Most of that net increase occurred because in 2014 there was a small upward revision to the subsidy costs of loans made in previous years while in 2013 there was a large downward revision. Outlays were negative for direct student loans because, over the life of the loans made in 2014, the expected amounts received by the government are greater than the expected payments by the government, as measured on a discounted present-value basis pursuant to the Federal Credit Reform Act. 10 In particular, the interest rates charged to borrowers of student loans are well above the interest rates the federal government pays to borrow money; therefore, even after accounting for anticipated loan defaults, the federal government is expected to receive more (on a present-value basis) in loan repayments and interest than it disburses for such loans. Federal Housing Administration s Loan Guarantee Programs. In 2013, the Department of Housing and Urban Development recorded mandatory outlays of nearly $33 billion related to the Federal Housing Administration s loan guarantee programs. That outlay total for 2013 mostly reflects the revisions to the estimated costs 10. Under that act, a program s subsidy costs are calculated by subtracting the discounted present value of the government s projected receipts from the discounted present value of its projected payments. The estimated subsidy costs can be increased or decreased in subsequent years to reflect updated assessments of the payments and receipts associated with the program. Present value is a single number that expresses a flow of current and future income (or payments) in terms of an equivalent lump sum received (or paid) today. The present value depends on the rate of interest (the discount rate) that is used to translate future cash flows into current dollars.
19 12 THE BUDGET AND ECONOMIC OUTLOOK: 2015 TO 2025 JANUARY 2015 of guarantees provided in previous years. (Such revisions in the estimated costs of prior loan guarantees are recorded each year.) In 2014, the department recorded a much smaller increase in such costs, only $0.7 billion a year-over-year reduction in mandatory outlays of $32 billion. Unemployment Compensation. Spending for unemployment compensation dropped for the fourth consecutive year in The authority to pay emergency benefits expired at the end of December 2013, and the number of people receiving first-time payments of regular unemployment benefits fell to 7.2 million from 8.1 million the year before. As a result, outlays for unemployment compensation dropped by $25 billion last year, to $44 billion, equal to the program s spending in Deposit Insurance. In 2014, the premium payments that insured financial institutions made to the Federal Deposit Insurance Corporation (FDIC) throughout the year exceeded the FDIC s spending by $14 billion (thereby reducing the government s net outlays by that amount). In contrast, net outlays for deposit insurance in 2013 totaled a positive $4 billion, in part because financial institutions prepaid in 2010 the premiums that would otherwise have been due during the first half of In addition, some excess premiums that had previously been paid by certain institutions were refunded in 2013; no such refunds were paid in As a result, net outlays for deposit insurance decreased by $18 billion in Discretionary Spending. Discretionary outlays fell by $23 billion (or 2.0 percent) in 2014 the fourth consecutive year that such outlays have declined. Defense outlays dropped by $30 billion (or 4.8 percent), marking the third consecutive year of decline after increasing at an average annual rate of 6 percent over the previous five years. Spending was down across all major categories, and about 80 percent of the overall decline was attributable to reduced spending by the Army. Measured as a share of GDP, outlays for defense were 3.5 percent in 2014, down from 3.8 percent in In contrast, nondefense discretionary outlays rose for the first time since 2010, increasing by $7 billion (or 1.1 percent) last year. A $7 billion decrease in the receipts credited to the Federal Housing Administration boosted net discretionary outlays by that amount. Spending for Pell grants and campus-based aid was also $7 billion higher than in the previous year. In the other direction, spending from funds provided in the American Recovery and Reinvestment Act of 2009 (ARRA, P.L ) dropped by $8 billion in (By the end of 2014, roughly 95 percent of the discretionary funding provided by ARRA had been spent.) Net Interest. Outlays for the budget category net interest consist of interest paid on Treasury securities and other interest that the government pays minus the interest that it collects from various sources. Such outlays rose from $221 billion in 2013 to $229 billion in 2014, an increase of nearly 4 percent. Because interest rates over the past few years have been very low by historical standards, those amounts are similar to the net interest outlays 15 to 20 years ago, when the government s debt was much smaller. The Budget Outlook for 2015 If there are no changes in laws governing taxes and spending, the budget deficit will decline by $16 billion in fiscal year 2015, to $468 billion, estimates (see Table 1-2). At 2.6 percent of GDP, this year s deficit will be close to the average recorded over the past 50 years. Revenues projects that if current laws remain unchanged, revenues will increase by $168 billion (or 5.6 percent) in 2015, reaching $3.2 trillion. As a share of GDP, revenues are projected to edge up from 17.5 percent in 2014 to 17.7 percent in 2015, a little above the average recorded over the past 50 years. The anticipated increase in revenues as a percentage of GDP in 2015 stems primarily from an expected increase in individual income tax receipts to 8.3 percent of GDP, from 8.1 percent in That rise largely reflects two factors: an increase in average tax rates (total taxes as a percentage of total income) as economic growth increases people s income faster than the inflationindexed tax brackets grow (the phenomenon called real bracket creep) and growth in distributions from taxdeferred retirement accounts, whose balances have been boosted in the past few years by strong stock market gains. A number of provisions that reduce tax liabilities expired at the end of 2014, a development that would ordinarily increase corporate and individual income tax payments starting this year. But those provisions had previously
20 CHAPTER ONE THE BUDGET AND ECONOMIC OUTLOOK: 2015 TO Table 1-2. s Baseline Budget Projections Revenues Individual income taxes Payroll taxes Corporate income taxes Other Total Total Actual, In Billions of Dollars 1,395 1,503 1,644 1,746 1,832 1,919 2,017 2,124 2,235 2,352 2,477 2,606 9,158 20,952 1,024 1,056 1,095 1,136 1,179 1,227 1,281 1,337 1,391 1,449 1,508 1,573 5,917 13, ,216 4, ,361 2,952 3,021 3,189 3,460 3,588 3,715 3,865 4,025 4,204 4,389 4,591 4,804 5,029 18,652 41,670 On-budget 2,285 2,426 2,667 2,763 2,858 2,974 3,099 3,242 3,389 3,550 3,722 3,906 14,362 32,171 Off-budget a ,001 1,040 1,081 1,124 4,291 9,499 Outlays Mandatory 2,096 2,255 2,475 2,563 2,653 2,816 2,968 3,137 3,363 3,486 3,616 3,891 13,474 30,967 Discretionary 1,179 1,175 1,176 1,182 1,193 1,221 1,248 1,276 1,310 1,336 1,361 1,400 6,019 12,701 Net interest ,046 5,643 Total 3,504 3,656 3,926 4,076 4,255 4,517 4,765 5,018 5,337 5,544 5,754 6,117 21,540 49,310 On-budget 2,798 2,914 3,143 3,244 3,366 3,570 3,752 3,938 4,185 4,314 4,441 4,715 17,075 38,667 Off-budget a ,012 1,080 1,152 1,230 1,313 1,402 4,465 10,643 Deficit (-) or Surplus On-budget Off-budget a Debt Held by the Public Memorandum: Gross Domestic Product ,088-2,887-7, ,713-6, ,144 12,779 13,359 13,905 14,466 15,068 15,782 16,580 17,451 18,453 19,458 20,463 21,605 n.a. n.a. 17,251 18,016 18,832 19,701 20,558 21,404 22,315 23,271 24,261 25,287 26,352 27, , ,438 As a Percentage of Gross Domestic Product Revenues Individual income taxes Payroll taxes Corporate income taxes Other Total On-budget Off-budget a Outlays Mandatory Discretionary Net interest Total On-budget Off-budget a Deficit (-) or Surplus On-budget Off-budget a Debt Held by the Public * * n.a. n.a. Source: Congressional Budget Office. Note: n.a. = not applicable; * = between and 0.05 percent. a. The revenues and outlays of the Social Security trust funds and the net cash flow of the Postal Service are classified as off-budget.
21 14 THE BUDGET AND ECONOMIC OUTLOOK: 2015 TO 2025 JANUARY 2015 been set to expire at the end of 2013 and were retroactively extended for a year by the Tax Increase Prevention Act of 2014 (Division A of P.L ), which was enacted in December Because that extension occurred so late in the year, some corporate and, to a much lesser extent, individual taxpayers probably made tax payments in 2014 that will be refunded this year when they file tax returns. Outlays In the absence of changes to laws governing federal spending, outlays in 2015 will total $3.7 trillion, estimates, $152 billion more than spending in That rise would represent an increase of 4.3 percent, about half a percentage point less than the average rate of growth experienced between 2003 and Outlays are projected to total 20.3 percent of GDP this year, the same percentage as in Mandatory Spending. Under current law, spending for mandatory programs will rise by $158 billion (or 7.6 percent) in 2015, estimates, amounting to 12.5 percent of GDP, up from the 12.2 percent recorded in Major Health Care Programs. Outlays for the federal government s major health care programs will increase by $82 billion (or nearly 10 percent) this year, estimates. Medicaid spending is expected to continue its recent trend of strong growth, primarily because of the optional expansion of coverage authorized by the ACA. expects that more people in states that have already expanded Medicaid eligibility under the ACA will enroll in the program and that more states will expand Medicaid eligibility. All told, projects that, under current law, enrollment in the program will increase by about 4 percent and outlays will climb by $34 billion (or about 11 percent) in 2015; the projected rate of growth in outlays is less than the 14 percent increase recorded in 2014 but well above the 6 percent rate of growth experienced in Similarly, subsidies that help people who meet income and other eligibility criteria purchase health insurance through exchanges and meet their cost-sharing requirements, along with related spending, are expected to increase by $30 billion this year, reaching a total of $45 billion (see Appendix B). That growth largely reflects a significant increase in the number of people expected to purchase coverage through exchanges in 2015 and the fact that subsidies for that coverage will be available for the entire fiscal year in (Last year the subsidies did not become available until January 2014.) estimates that Medicare s outlays will continue to grow slowly in 2015 under current law, increasing by $17 billion (or 3.4 percent). The projected growth rate is a little higher than last year s rate but about half the average annual increase of roughly 7 percent experienced between 2003 and That projection of spending for Medicare reflects the assumption that the fees that physicians receive for their services will be reduced by about 21 percent in April 2015 as required under current law. If lawmakers override those scheduled reductions as they have routinely done in the past and keep physician fees at their current levels instead, spending on Medicare in 2015 will be $6 billion more than the amount projected in s baseline. Fannie Mae and Freddie Mac. Transactions between the Treasury and Fannie Mae and Freddie Mac will again reduce federal outlays in 2015, estimates, but by nearly $50 billion less than in The payments from those entities to the Treasury are projected to total $26 billion this year, compared with $74 billion last year. That drop is partly because Freddie Mac s payments were boosted by nearly $24 billion in fiscal year 2014 as a result of a onetime revaluation of certain tax assets. In addition, financial institutions are expected to make fewer payments to Fannie Mae and Freddie Mac in 2015 to settle allegations of fraud in connection with residential mortgages as well as certain other securities. Social Security. anticipates that, under current law, Social Security outlays will increase by $38 billion (or 4.5 percent) in 2015, a rate of increase similar to last year s growth. This January s cost-of-living adjustment was slightly higher (1.7 percent) than the increase in January 2014, whereas the projected growth in the number of beneficiaries (1.9 percent) is slightly lower. Receipts From Spectrum Auctions. Under current law, the Federal Communications Commission (FCC) intermittently auctions licenses to use the electromagnetic spectrum for commercial purposes. estimates that net offsetting receipts from such auctions will total $41 billion in 2015, compared with $1 billion for licenses auctioned last year. In 2014, the FCC auctioned a set of licenses that were primarily of value to a single firm. By contrast, the licenses auctioned in fiscal year
22 CHAPTER ONE THE BUDGET AND ECONOMIC OUTLOOK: 2015 TO covered more bandwidth and had more desirable characteristics than those offered in 2014, which spurred intense competition among several large telecommunications firms, driving up receipts to the government. Discretionary Spending. Discretionary budget authority enacted for 2015 totals $1,120 billion, which is $13 billion (or 1 percent) less than such funding totaled in Although the limits set for budget authority for defense by the Bipartisan Budget Act of 2013 (P.L ) were about the same in 2015 as they were in 2014, overall funding for defense declined by $20 billion (or 3.3 percent) this year because of a reduction in appropriations for overseas contingency operations, which are not constrained by those caps. Funding for nondefense discretionary programs is $8 billion (or 1.5 percent) higher than in If no additional appropriations are enacted for this year, discretionary outlays will fall by $4 billion (or 0.3 percent) from the 2014 amounts, projects. Defense outlays will again decline in 2015, largely because spending for overseas contingency operations will drop. All told, defense spending is expected to fall by $13 billion (or 2.2 percent), about half the rate of decrease recorded in The largest reductions are for procurement, operation and maintenance, and personnel; outlays for each category are expected to decline by $4 billion. As a result, defense outlays will total $583 billion in 2015, estimates. Outlays for nondefense programs are expected to rise by $9 billion (or 1.5 percent) this year, to a total of $592 billion. That amount is the net result of a number of relatively small increases and decreases to various programs. Net Interest. Outlays for net interest will be nearly unchanged in 2015, falling by $3 billion (or 1 percent), to $227 billion, estimates, primarily because Treasury interest rates remain very low. At 1.3 percent of GDP, such outlays would be well below their 50-year average of 2.0 percent. s Baseline Budget Projections for 2016 to 2025 constructs its baseline in accordance with provisions set forth in the Balanced Budget and Emergency Deficit Control Act of 1985 and the Congressional Budget and Impoundment Control Act of For the most part, those laws require that the agency s baseline projections incorporate the assumption that current laws governing taxes and spending in future years remain in place. Under that assumption, projects that the budget deficit would remain near 2.5 percent of GDP through But beginning in 2019, the deficit is projected to increase in most years, both in dollar terms and as a share of the economy, reaching 4.0 percent of GDP by The pattern of stable deficits over the next several years followed by generally rising deficits through 2025 is the result, in part, of shifts in the timing of certain payments from one fiscal year to another because scheduled payment dates will fall on a weekend; without those shifts, the deficit would reach a low of 2.3 percent of GDP in 2016 and then increase throughout the rest of the projection period. 11 Revenues If current laws remain unchanged, revenues are estimated to increase by 8.5 percent in 2016 in part because various tax provisions that had expired at the end of 2013 were recently extended through 2014 and have subsequently expired again (see Chapter 4 for more details on those changes). As a result, revenues are anticipated to rise to 18.4 percent of GDP in 2016, an increase of 0.7 percentage points. From 2017 through 2025, revenues in s baseline remain between 18.0 and 18.3 percent of GDP, largely reflecting offsetting movements in individual and corporate income taxes and remittances from the Federal Reserve. Individual income taxes are projected to generate increasing revenues relative to the size of the economy, growing from 8.7 percent of GDP in 2016 to 9.5 percent in The increase stems mostly from real bracket creep, a phenomenon in which growth in real, or inflation-adjusted, income of individuals pushes more income into higher tax brackets. In addition, taxable distributions from tax-deferred retirement accounts are expected to grow more rapidly than GDP as the population ages in coming years. Labor income is also projected to grow 11. Because October 1 will fall on a weekend in 2016, 2017, 2022, and 2023, certain payments that are due on those days will instead be made at the end of September, thus shifting them into the previous fiscal year.
23 16 THE BUDGET AND ECONOMIC OUTLOOK: 2015 TO 2025 JANUARY 2015 Figure 1-2. Spending and Revenues Projected in s Baseline, Compared With Levels in 1965 and 1990 Percentage of Gross Domestic Product Mandatory Spending Discretionary Spending Net Interest Social Security Major Health Care Programs * 2.3 Other Defense Nondefense Total Outlays Total Revenues Deficit Source: Congressional Budget Office. Notes: Major health care programs consist of Medicare, Medicaid, the Children s Health Insurance Program, and subsidies for health insurance purchased through exchanges and related spending. (Medicare spending is net of premiums paid by beneficiaries and other offsetting receipts.) * = between zero and 0.05 percent. faster than GDP over this period, further boosting income tax collections. In contrast, corporate income tax receipts and remittances from the Federal Reserve are projected to decline relative to the size of the economy after this year or next. Corporate income tax receipts are projected to decline as a share of GDP after 2016 largely because of an anticipated drop in domestic economic profits relative to GDP, the result of growing labor costs and rising interest payments on businesses debt. Remittances from the Federal Reserve, which have been very high by historical standards since 2010 because of changes in the size and composition of the central bank s portfolio of securities, decline to more typical levels in s projections starting in Outlays Outlays in s baseline grow to nearly 21 percent of GDP in 2016, remain roughly steady as a share of GDP through 2018, and then follow an upward trend, reaching 22.3 percent of GDP by Although the 10-year baseline projections do not fully reflect the long-term budgetary pressures facing the United States, those pressures are evident in the path of federal outlays over the next decade. Because of the aging of the population, rising health care costs, and a significant expansion in eligibility for federal subsidies for health insurance, outlays for Social Security and the federal government s major health care programs are projected to rise substantially relative to the size of the economy over the next 10 years (see Figure 1-2). In addition, growing debt and rising interest rates will boost net interest payments. Specifically, in s baseline: Outlays for Social Security are projected to remain at 4.9 percent of GDP in 2016 and 2017 but then climb to 5.7 percent of GDP by Outlays for the major health care programs Medicare (net of receipts from premiums and certain payments from states), Medicaid, the Children s 12. Without the shifts in the timing of certain payments, outlays would increase relative to GDP in each year of the projection period, estimates.
24 CHAPTER ONE THE BUDGET AND ECONOMIC OUTLOOK: 2015 TO Health Insurance Program, and subsidies offered through health insurance exchanges and related spending soon exceed outlays for Social Security. Spending for those programs is estimated to total 5.3 percent of GDP in 2016 and to grow rapidly in coming years, reaching 6.2 percent of GDP in Net interest equals 1.5 percent of GDP in 2016, but rising interest rates and mounting debt cause that total to double as a percentage of GDP by Those three components of the budget account for nearly 85 percent of the total increase in outlays (in nominal terms) over the coming decade (see Figure 1-3). By the end of the projection period, they would be the largest categories of spending in the budget. In contrast, under current law, all other spending will decrease from 9.2 percent of GDP in 2016 to 7.4 percent in 2025, projects. That decline is projected to occur because spending for many of the other mandatory programs is expected to rise roughly with inflation (which is projected to be well below the rate of growth of nominal GDP) and because most discretionary funding is capped through 2021 at amounts that increase more slowly than GDP. Mandatory Spending. The Deficit Control Act requires s projections for most mandatory programs to be made in keeping with the assumption that current laws continue unchanged. 13 Thus, s baseline projections for mandatory spending reflect expected changes in the economy, demographics, and other factors, as well as the across-the-board reductions in certain mandatory programs that are required under current law. Mandatory spending (net of offsetting receipts, which reduce outlays) is projected to increase by close to 10 percent in 2016, reaching 13.1 percent of GDP. That growth is partially the result of a few unusual circumstances: 13. The Deficit Control Act specifies some exceptions. For example, spending programs whose authorizations are set to expire are assumed to continue if they have outlays of more than $50 million in the current year and were established at or before enactment of the Balanced Budget Act of Programs established after that law was enacted are not automatically assumed to continue but are considered individually by in consultation with the House and Senate Budget Committees. Figure 1-3. Components of the Total Increase in Outlays in s Baseline Between 2015 and 2025 All Other Programs (16%) Net Interest (24%) Social Security (28%) Major Health Care Programs (32%) Total Increase in Outlays: $2.5 Trillion Source: Congressional Budget Office. Note: Major health care programs consist of Medicare, Medicaid, the Children s Health Insurance Program, and subsidies for health insurance purchased through exchanges and related spending. (Medicare spending is net of premiums paid by beneficiaries and other offsetting receipts.) Receipts from the auctioning of licenses to use a portion of the electromagnetic spectrum which are recorded as offsets to mandatory outlays are anticipated to reduce such outlays by $41 billion in However, the net receipts associated with those auctions are expected to drop to near zero in 2016 because spending related to making the frequencies auctioned this year available for commercial uses will largely offset the receipts being collected. Beyond 2016, net receipts will total $18 billion over the remainder of the projection period. October 1, 2016, falls on a weekend, so certain payments that are scheduled for the first of the month will be made in September, shifting about $37 billion in mandatory outlays from fiscal year 2017 to fiscal year Cash payments from Fannie Mae and Freddie Mac to the Treasury will be recorded in the budget as reducing outlays by $26 billion in 2015, estimates. However, the transactions of those two entities are not treated on a cash basis in s baseline after the current year but are considered
25 18 THE BUDGET AND ECONOMIC OUTLOOK: 2015 TO 2025 JANUARY 2015 instead as credit programs of the government. 14 Reflecting that difference in treatment, outlays for Fannie Mae and Freddie Mac in 2016 are estimated to total $3 billion, a net increase in spending of $29 billion. (On a cash basis, outlays in 2016 would be similar to those in 2015.) If not for those factors, mandatory outlays would increase by 5 percent in In the years beyond 2016, mandatory spending is projected to grow at an average rate of about 5 percent annually, reaching 14.2 percent of GDP in 2025 (compared with 12.2 percent in 2014). Over the entire 10-year period, spending for Social Security is projected to rise at an average annual rate of 5.9 percent; for the major health care programs, 6.4 percent; and for all other programs and activities in the mandatory category, 3.2 percent. Discretionary Spending. For discretionary spending, s baseline incorporates the caps on such funding that are currently in place through 2021 and then reflects the assumption that funding keeps pace with inflation in later years; the elements of discretionary funding that are not constrained by the caps, such as appropriations for overseas contingency operations, are assumed to increase with inflation throughout the next decade. Discretionary outlays are estimated to remain virtually unchanged from 2015 through 2017 and then to grow at an average annual rate of 2.1 percent after 2017; that rate is roughly half of the projected growth rate of nominal GDP. As a result, spending for both defense and nondefense discretionary programs is projected to fall 14. Because the government placed Fannie Mae and Freddie Mac into conservatorship in 2008 and now controls their operations, considers the activities of those two entities to be governmental. Therefore, for the 10-year period that follows the current fiscal year, projects the subsidy costs of the entities new activities using procedures similar to those specified in the Federal Credit Reform Act of 1990 for determining the costs of federal credit programs but with adjustments to reflect the market risk associated with those activities. The Administration, by contrast, considers Fannie Mae and Freddie Mac to be outside of the federal government for budgetary purposes and records cash transactions between those entities and the Treasury as federal outlays or receipts. (In s view, those transactions are intragovernmental.) To provide s best estimate of what the Treasury will ultimately report as the federal deficit for 2015, s current baseline includes an estimate of the cash receipts from the two entities to the Treasury for this year (while retaining its risk-adjusted projections of subsidy costs for later years). relative to GDP under s baseline assumptions. Outlays for defense are projected to drop from 3.1 percent of GDP in 2016 to 2.6 percent in 2025, 2.4 percentage points below the average share they represented from 1965 through 2014 and the lowest share in any year since before 1962 (which is the earliest year for which such data have been reported). For nondefense discretionary spending, outlays are projected to drop from 3.1 percent of GDP in 2016 to 2.5 percent in 2025, 1.3 percentage points below the average from 1965 through 2014 and also the lowest share in any year since before Net interest. Under s baseline assumptions, net interest payments increase from $227 billion, or 1.3 percent of GDP, in 2015 to $827 billion, or 3.0 percent of GDP, in 2025 the highest ratio since Two factors drive that sharp increase rising interest rates and growing debt. The interest rate paid on 3-month Treasury bills will rise from 0.1 percent in 2015 to 3.4 percent in 2018 and subsequent years, and the rate on 10-year Treasury notes will increase from 2.6 percent in 2015 to 4.6 percent in 2020 and subsequent years. Meanwhile, debt held by the public will increase, according to s projections, from 74.2 percent of GDP at the end of 2015 to 78.7 percent at the end of Federal Debt Federal debt held by the public consists mostly of securities that the Treasury issues to raise cash to fund the federal government s activities and to pay off its maturing liabilities. 15 The Treasury borrows money from the public by selling securities in the capital markets; that debt is purchased by various buyers in the United States, by private investors overseas, and by the central banks of other countries. Of the $12.8 trillion in federal debt held by the public at the end of 2014, 52 percent ($6.7 trillion) was held by domestic investors and 48 percent ($6.1 trillion) was held by foreign investors. 16 Other measures of federal debt are sometimes used for various purposes, such as to provide a more comprehensive picture of the 15. A small amount of debt held by the public is issued by other agencies, mainly the Tennessee Valley Authority. 16. The largest U.S. holders of Treasury debt are the Federal Reserve System (18 percent), individual households (6 percent), and mutual funds (6 percent); investors in China and Japan have the largest foreign holdings of Treasury securities, accounting for nearly 20 percent of U.S. public debt. For additional information, see Congressional Budget Office, Federal Debt and Interest Costs (December 2010), Chapter 1,
26 CHAPTER ONE THE BUDGET AND ECONOMIC OUTLOOK: 2015 TO Table 1-3. Federal Debt Projected in s Baseline Billions of Dollars Debt Held by the Public at the Beginning of the Year Actual, ,983 12,779 13,359 13,905 14,466 15,068 15,782 16,580 17,451 18,453 19,458 20,463 Changes in Debt Held by the Public Deficit ,088 Other means of financing Total ,002 1,005 1,006 1,142 Debt Held by the Public at the End of the Year 12,779 13,359 13,905 14,466 15,068 15,782 16,580 17,451 18,453 19,458 20,463 21,605 Debt Held by the Public at the End of the Year (As a percentage of GDP) Memorandum: Debt Held by the Public Minus Financial Assets a In billions of dollars 11,544 12,011 12,450 12,909 13,420 14,044 14,754 15,540 16,458 17,382 18,303 19,360 As a percentage of GDP Gross Federal Debt b 17,792 18,472 19,126 19,831 20,576 21,404 22,294 23,227 24,244 25,247 26,231 27,288 Debt Subject to Limit c 17,781 18,462 19,115 19,820 20,565 21,392 22,281 23,214 24,231 25,234 26,217 27,275 Average Interest Rate on Debt Held by the Public (Percent) d Source: Congressional Budget Office. Note: GDP = gross domestic product. a. Debt held by the public minus the value of outstanding student loans and other credit transactions, cash balances, and other financial instruments. b. Federal debt held by the public plus Treasury securities held by federal trust funds and other government accounts. c. The amount of federal debt that is subject to the overall limit set in law. Debt subject to limit differs from gross federal debt mainly because most debt issued by agencies other than the Treasury and the Federal Financing Bank is excluded from the debt limit. That limit was most recently set at $17.2 trillion but has been suspended through March 15, On March 16, the debt limit will be raised to its previous level plus the amount of federal borrowing that occurred while the limit was suspended. d. The average interest rate is calculated as net interest divided by debt held by the public. government s financial condition or to account for debt held by federal trust funds. Debt Held by the Public. Debt held by the public increased by about $800 billion in 2014, reaching 74 percent of GDP, higher than the amount recorded in 2013 (72 percent) or in any other year since As recently as 2007, such debt equaled 35 percent of GDP. Under the assumptions that govern s baseline, the federal government is projected to borrow another $8.8 trillion from 2015 through 2025, pushing debt held by the public up to 79 percent of GDP by the end of the projection period (see Table 1-3). That amount of debt relative to the size of the economy would be the highest since 1950 and more than double the average of 38 percent experienced over the period or the average of 34 percent experienced over the 40 years ending in 2007, before the recent sharp increase in debt. By historical standards, debt that high and heading higher would have significant consequences for the budget and the economy:
27 20 THE BUDGET AND ECONOMIC OUTLOOK: 2015 TO 2025 JANUARY 2015 The nation s net interest costs would be very high (after interest rates move up to more typical levels) and rising. National saving would be held down, leading to more borrowing from abroad and less domestic investment, which in turn would decrease income in the United States compared with what it would be otherwise. Policymakers ability to use tax and spending policies to respond to unexpected challenges such as economic downturns, financial crises, or natural disasters would be constrained. As a result, such challenges could have worse effects on the economy and people s well-being than they would otherwise. The risk of a fiscal crisis would be higher. During such a crisis, investors would lose so much confidence in the government s ability to manage its budget that the government would be unable to borrow funds at affordable interest rates. The amount of money the Treasury borrows by selling securities (net of the maturing securities it redeems) is determined primarily by the annual budget deficit. However, several factors collectively labeled other means of financing and not directly included in budget totals also affect the government s need to borrow from the public. Those factors include changes in the government s cash balance and investments in the Thrift Savings Plan s G fund, as well as the cash flows associated with federal credit programs (such as student loans) because only the subsidy costs of those programs (calculated on a present-value basis) are reflected in the budget deficit. projects that the increase in debt held by the public will exceed the deficit in 2015 by $112 billion, mainly because the government will need cash to finance new student loans and other credit programs. The same is true for each year from 2016 to 2025: estimates that the government will need to borrow about $60 billion more per year, on average, during that period than the budget deficits would suggest. Other Measures of Federal Debt. Three other measures are sometimes used in reference to federal debt: Debt held by the public less financial assets subtracts from debt held by the public the value of the government s financial assets, such as student loans. That measure provides a more comprehensive picture of the government s financial condition and its overall impact on credit markets than does debt held by the public. Calculating the measure is not straightforward, however, because neither the financial assets to be included nor the method for evaluating them is well defined. Under s baseline assumptions, that measure is smaller than debt alone but varies roughly in line with it. Gross federal debt consists of debt held by the public and debt issued to government accounts (for example, the Social Security trust funds). The latter type of debt does not directly affect the economy and has no net effect on the budget. In s projections, debt held by the public is expected to increase by $8.8 trillion between the end of 2014 and the end of 2025, and debt held by government accounts is estimated to rise by $0.7 trillion. As a result, gross federal debt is projected to rise by $9.5 trillion over that period and to total $27.3 trillion at the end of About one-fifth of that sum would be debt held by government accounts. Debt subject to limit is the amount of debt that is subject to the statutory limit on federal borrowing; it is virtually identical to gross federal debt. The amount of outstanding debt subject to limit is now about $18.0 trillion; under current law, it is projected to reach $27.3 trillion at the end of Currently, there is no statutory limit on the issuance of new federal debt because the Temporary Debt Limit Suspension Act (P.L ) suspended the debt ceiling through March 15, Under the act, the debt limit after that date will equal the previous limit of $17.2 trillion plus the amount of borrowing accumulated during the suspension of the limit. Therefore, if the current suspension is not extended and a higher debt limit is not specified in law before March 16, 2015, the Treasury will have no room to borrow under standard borrowing procedures beginning on that date. To avoid a breach in the debt ceiling, the Treasury would begin employing its well-established toolbox of so-called extraordinary measures to allow continued borrowing for a limited time. anticipates that the Treasury would probably exhaust those measures in September or October of this year. If that occurred, the Treasury would soon run out of cash and be unable to fully pay its obligations, a development that would lead to delays of payments for government activities, a default on the government s debt obligations, or both. However,
28 CHAPTER ONE THE BUDGET AND ECONOMIC OUTLOOK: 2015 TO the government s cash flows cannot be predicted with certainty, and the actual cash flows during the coming months will affect the dates on which the Treasury would exhaust the extraordinary measures and the date on which it would run out of cash. 17 Changes in s Baseline Since August 2014 completed its previous set of baseline projections in August Since then, the agency has reduced its estimate of the deficit in 2015 by $2 billion. The agency has also lowered its baseline projection of the cumulative deficit from 2015 through 2024 by $175 billion, from $7.2 trillion to $7.0 trillion (see Appendix A). Almost all of that reduction occurs in the projections for fiscal years 2016 through 2018; baseline deficits for other years are nearly unchanged. A number of different factors led to those changes: Legislation enacted since last August caused to lower projected deficits through 2024 by $91 billion; a revised economic outlook reduced them by $38 billion; and other, technical changes decreased projected deficits by an additional $46 billion (see Table 1-4). Those relatively small changes to the overall baseline totals reflect larger, but nearly offsetting, changes to baseline revenues and outlays, as both revenues and outlays are lower than projected in August. has reduced its estimate of cumulative revenues through 2024 by $415 billion (or 1.0 percent) since last August: More than half of that change ($234 billion) stems from changes to the economic outlook, primarily slightly lower projections of economic growth. Technical changes, which reflect new information from tax returns, recent tax collections, new analysis of elements of the projections, and other factors, have reduced projected revenues by $137 billion over the period; the largest reductions were in projected receipts from corporate income taxes. Legislation enacted since August has reduced projected revenues by $81 billion in 2015 and boosted 17. For more information on the debt limit and extraordinary measures, see Congressional Budget Office, Federal Debt and the Statutory Limit (November 2013), them by $38 billion between 2016 and 2024, a net reduction of $44 billion. Those legislative changes result almost entirely from the Tax Increase Prevention Act of 2014, which retroactively extended through 2014 a host of tax provisions that reduce tax liabilities and that had expired at the end of Projected outlays through 2024 have declined by $590 billion (or 1.2 percent) since August, more than offsetting the decrease in projected revenues: The revised economic outlook accounted for $272 billion of that reduction. The largest reductions were in projected spending for Social Security (down by $110 billion) and net interest costs (reduced by $147 billion, excluding debt-service costs) because now anticipates lower inflation this year and lower interest rates over much of the projection period. A variety of technical changes, primarily to estimates for mandatory programs, further reduced outlays by $70 billion in 2015 and by $184 billion between 2015 and Finally, legislation enacted since August lowered projected outlays through 2024 by $134 billion. Much of that decrease occurs because the current projections are based on 2015 appropriations, whereas the August baseline reflected 2014 appropriations. The amount of funding for overseas contingency operations in 2015 is less than the amount provided for 2014, and the projections throughout the 10-year period are extrapolated from that lower funding. Uncertainty in Budget Projections Even if federal laws remained unchanged for the next decade, actual budgetary outcomes would differ from s baseline projections because of unanticipated changes in economic conditions and in a host of other factors that affect federal spending and revenues. The agency aims for its projections to be in the middle of the distribution of possible outcomes given the baseline assumptions about federal tax and spending policies, while recognizing that there will always be deviations from any such projections. s projections of outlays depend on the agency s economic projections for the coming decade, including forecasts for such variables as interest rates, inflation, and
29 22 THE BUDGET AND ECONOMIC OUTLOOK: 2015 TO 2025 JANUARY 2015 Table 1-4. Changes in s Baseline Projections of the Deficit Since August 2014 Billions of Dollars Total Deficit in 's August 2014 Baseline ,777-7,196 Changes Legislative Revenues * Outlays Subtotal a Economic Revenues Outlays Subtotal a Technical Revenues Outlays Subtotal a Total Effect on the Deficit a Deficit in 's January 2015 Baseline ,615-7,021 Memorandum: Total Effect on Revenues Total Effect on Outlays Source: Congressional Budget Office. Note: * = between -$500 million and zero. a. Negative numbers indicate an increase in the deficit; positive numbers indicate a decrease in the deficit. the growth of real GDP. Discrepancies between those forecasts and actual economic outcomes can result in significant differences between baseline budgetary projections and budgetary outcomes. For instance, s baseline economic forecast anticipates that interest rates on 3-month Treasury bills will increase from 0.9 percent in fiscal year 2016 to 3.4 percent in fiscal year 2018 and subsequent years and that interest rates on 10-year Treasury notes will rise from 3.2 percent to 4.6 percent in 2020 and subsequent years. If interest rates on all types of Treasury securities were 1 percentage point higher or lower each year from 2016 through 2025 and all other economic variables were unchanged, cumulative outlays projected for the 10-year period would be about $1.3 trillion higher or lower (excluding changes in the costs of servicing the federal debt) and revenues would be $0.1 trillion higher or lower. (For further discussion of how some key economic projections affect budget projections, see Appendix C.) Uncertainty also surrounds myriad technical factors that can substantially affect s baseline projections of outlays. For example, spending per enrollee for Medicare and Medicaid is very difficult to predict. If per capita costs in those programs rose 1 percentage point faster or slower per year than has projected for the next decade, total federal outlays for Medicare (net of receipts from premiums) and Medicaid would be roughly $900 billion higher or lower for that period. The effects of the Affordable Care Act are another source of significant uncertainty. To estimate the effects of the law s broad changes to the nation s health care and health insurance systems, and the staff of the Joint Committee on Taxation (JCT) have made projections concerning an array of programs and institutions, some of which such
30 CHAPTER ONE THE BUDGET AND ECONOMIC OUTLOOK: 2015 TO as the health insurance exchanges have been in place only for a year. Projections of revenues are quite sensitive to many economic and technical factors. Revenues depend on total amounts of wages and salaries, corporate profits, and other income, all of which are encompassed by s economic projections. For example, if the growth of real GDP and taxable income was 0.1 percentage point higher or lower per year than in s baseline projections, revenues would be roughly $290 billion higher or lower over the period. In addition, forecasting the amount of revenue that the government will collect from taxpayers for a given amount of total income requires technical estimates of the distribution of income and of many aspects of taxpayers behavior. For example, estimates are required of the amounts of deductions and credits that people will receive and the amount of income in the form of capital gains they will realize from selling assets. Differences between s judgments about such behavior and actual outcomes can lead to significant deviations from the agency s baseline projections of revenues. Even relatively small deviations in revenues and outlays compared to s projections could have a substantial effect on budget deficits. For example, if revenues projected for 2025 were too high by 5 percent (that is, if average annual growth in revenues during the coming decade was about 0.5 percentage points less than estimated) and outlays projected for mandatory programs were too low by 5 percent, the deficit for that year would be about $450 billion greater than the $1.1 trillion in s baseline; if GDP matched s projection, that larger deficit would be 5.6 percent of GDP rather than the 4.0 percent in the baseline. Outcomes could differ by larger amounts and in the other direction as well. Alternative Assumptions About Fiscal Policy s baseline budget projections which are constructed in accordance with provisions of law are intended to show what would happen to federal spending, revenues, and deficits if current laws generally remained unchanged. Future legislative action, however, could lead to markedly different budgetary outcomes. To assist policymakers and analysts who may hold differing views about the most useful benchmark against which to consider possible changes to laws, has estimated the effects on budgetary projections of some alternative assumptions about future policies (see Table 1-5). The discussion below focuses on how those policy actions would directly affect revenues and outlays. Such changes would also influence the costs of servicing the federal debt (shown separately in the table). Military and Diplomatic Operations in Afghanistan and Other War-Related Activities One alternative path addresses spending for operations in Afghanistan and similar activities, sometimes called overseas contingency operations. The outlays projected in the baseline come from budget authority provided for those purposes in 2014 and prior years that has not been used, the $74 billion in budget authority provided for 2015, and the $822 billion that is projected to be appropriated over the period (under the assumption that annual funding is set at $74 billion with adjustments for anticipated inflation, in accordance with the rules governing baseline projections). 18 In coming years, the funding required for overseas contingency operations in Afghanistan or other countries might be smaller than the amounts projected in the baseline if the number of deployed troops and the pace of operations diminished. For that reason, has formulated a budget scenario that anticipates a reduction in the number of U.S. military personnel deployed abroad for military actions and a concomitant reduction in diplomatic operations and foreign aid. Many other scenarios some costing more and some less are also possible. In 2014, the number of U.S. active-duty, reserve, and National Guard personnel deployed for military and diplomatic operations that have been designated as overseas contingency operations averaged about 110,000, estimates. In this alternative scenario, the average number of military personnel deployed for such purposes would decline over the next two years from roughly 90,000 in 2015 to 50,000 in 2016 and to 30,000 in 2017 and thereafter. (Those numbers could represent various allocations of forces around the world.) Under that scenario, and assuming that the extraordinary funding for diplomatic operations and foreign aid declines at a similar rate, total discretionary outlays over the Funding for overseas contingency operations in 2015 includes $64 billion for military operations and indigenous security forces and $9 billion for diplomatic operations and foreign aid.
31 24 THE BUDGET AND ECONOMIC OUTLOOK: 2015 TO 2025 JANUARY 2015 Table 1-5. Budgetary Effects of Selected Policy Alternatives Not Included in s Baseline Billions of Dollars Total Policy Alternatives That Affect Discretionary Outlays Reduce the Number of Troops Deployed for Overseas Contingency Operations to 30,000 by 2017 a Effect on the deficit b Debt service 0 * Increase Discretionary Appropriations at the Rate of Inflation After 2015 c Effect on the deficit b Debt service 0 * Freeze Most Discretionary Appropriations at the 2015 Amount d Effect on the deficit b Debt service 0 * * * Policy Alternative That Affects Mandatory Outlays Maintain Medicare's Payment Rates for Physicians at the Current Rate e Effect on the deficit b Debt service * * * Policy Alternative That Affects Both Discretionary and Mandatory Outlays Prevent the Automatic Spending Reductions Specified in the Budget Control Act f Effect on the deficit b n.a ,010 Debt service n.a Continued period would be $454 billion less than the amount in the baseline, estimates. 19 Other Discretionary Spending Policymakers could vary discretionary funding in many ways from the amounts projected in the baseline. For example, if appropriations grew each year through 2025 at the same rate as inflation after 2015 rather than being 19. The reduction in budget authority under this alternative is similar to those arising from some proposals to cap discretionary appropriations for overseas contingency operations. Such caps could result in reductions in s baseline projections of discretionary spending. However, those reductions might simply reflect policy decisions that have already been made or would be made in the absence of caps. Moreover, if future policymakers believed that national security required appropriations above the capped levels, they would almost certainly provide emergency appropriations that would not, under current law, be counted against the caps. constrained by the caps, discretionary spending would be $480 billion higher for that period than it is in the baseline. If, by contrast, lawmakers kept appropriations for 2016 through 2025 at the nominal 2015 amount, total discretionary outlays would be $929 billion lower over that period. Under that scenario (sometimes called a freeze in regular appropriations), total discretionary spending would fall from 6.5 percent of GDP in fiscal year 2015 to 4.3 percent in (Such spending is already projected to fall to 5.1 percent of GDP in 2025 under s baseline, reflecting the caps on most new discretionary funding through 2021 and adjustments for inflation after 2021.) Medicare s Payments to Physicians Spending for Medicare is constrained by a rate-setting system called the sustainable growth rate for the fees that physicians receive for their services. If the system is allowed to operate as currently structured, physicians fees
32 CHAPTER ONE THE BUDGET AND ECONOMIC OUTLOOK: 2015 TO Table 1-5. Budgetary Effects of Selected Policy Alternatives Not Included in s Baseline Billions of Dollars Extend Expiring Tax Provisions g Effect on the deficit b Debt service Continued Total Policy Alternative That Affects the Tax Code * Memorandum: Outlays for Overseas Contingency Operations in 's Baseline Deficit in 's Baseline ,088-2,887-7,641 Sources: Congressional Budget Office; staff of the Joint Committee on Taxation. Notes: Negative numbers indicate an increase in the deficit; positive numbers indicate a decrease in the deficit. n.a. = not applicable; * = between -$500 million and $500 million. a. For this alternative, does not extrapolate the $74 billion in budget authority for military operations, diplomatic activities, and aid to Afghanistan and other countries provided for Rather, the alternative incorporates the assumption that funding for overseas contingency operations declines from $50 billion in 2016 to a low of $25 billion in Thereafter, such funding would slowly increase, reaching about $30 billion per year by the end of the projection period for a total of $300 billion over the period. b. Excludes debt service. c. These estimates reflect the assumption that appropriations will not be constrained by caps set by the Budget Control Act of 2011 as amended and will instead grow at the rate of inflation from their 2015 level. Discretionary funding related to federal personnel is inflated using the employment cost index for wages and salaries; other discretionary funding is inflated using the gross domestic product price index. d. This option reflects the assumption that appropriations other than those for overseas contingency operations would generally be frozen at the 2015 level through e. Medicare s payment rates for physicians services are scheduled to drop by 21 percent on April 1, 2015, and to change by small amounts in subsequent years. In this alternative, payment rates are assumed to continue at their current levels through f. The Budget Control Act of 2011 specified that if lawmakers did not enact legislation originating from the Joint Select Committee on Deficit Reduction that would reduce projected deficits by at least $1.2 trillion, automatic procedures would go into effect to reduce both discretionary and mandatory spending during the period. Those procedures are now in effect and take the form of equal cuts (in dollar terms) in funding for defense and nondefense programs. For the period, the automatic procedures lower the caps on discretionary budget authority specified in the Budget Control Act (caps for 2014 and 2015 were revised by the Bipartisan Budget Act of 2013); for the period, has extrapolated the reductions estimated for Nonexempt mandatory programs will be reduced through sequestration; those provisions have been extended through The budgetary effects of this option cannot be combined with those of any of the other alternatives that affect discretionary spending, except for the one to reduce the number of troops deployed for overseas contingency operations. g. These estimates are mainly from the staff of the Joint Committee on Taxation and are preliminary. They reflect the impact of extending about 70 tax provisions that either expired on December 31, 2014, or are scheduled to expire by December 31, Nearly all of those provisions have been extended previously; some, such as the research and experimentation tax credit, have been extended multiple times. will be reduced by about 21 percent in April 2015 and will both increase and decrease by small amounts in subsequent years, projects. If, instead, lawmakers overrode those scheduled reductions as they have every year since 2003 spending on Medicare might be greater than the amounts projected in s baseline. For example, holding payment rates through 2025 at current levels would raise outlays for Medicare (net of premiums paid by beneficiaries) by $6 billion in 2015 and by $131 billion (or nearly 2 percent) between 2016 and The net effects of such a change in payment rates for physicians on spending for Medicare and on the deficit would
33 26 THE BUDGET AND ECONOMIC OUTLOOK: 2015 TO 2025 JANUARY 2015 depend on whether lawmakers offset the effects of the change, as they often have done in the past, with other changes to reduce deficits. Automatic Spending Reductions The Budget Control Act put in place automatic procedures to reduce discretionary and mandatory spending through Those procedures require equal reductions (in dollar terms) in defense and nondefense spending. Subsequent legislation extended the required reductions to mandatory spending (a process called sequestration) through If lawmakers chose to prevent those automatic cuts each year starting in 2016 without making other changes that reduced spending, total outlays over the period would be $1.0 trillion (or about 2 percent) higher than the amounts in s baseline. Total discretionary outlays would be $845 billion (or 6.7 percent) higher, and outlays for mandatory programs most of which are not subject to sequestration would be $164 billion (or 0.5 percent) higher. 20 Revenues A host of tax provisions many of which have been extended repeatedly have recently expired or are scheduled to expire over the next decade. If all of those provisions were permanently extended, and JCT estimate, revenues would be lower and, although a much smaller effect, outlays for refundable tax credits would be higher, by a total of $898 billion over the period. Most of those tax provisions were recently extended retroactively through 2014 and have subsequently expired. They include a provision allowing certain businesses to immediately deduct 50 percent of new investments in equipment, which JCT estimates accounts for $224 billion of the budgetary effects of extending all of the provisions over the next 10 years. The budgetary cost of extending all of the tax provisions would be higher in the latter part of the 10-year period than in the first few years because certain provisions affecting refundable tax credits are scheduled to expire at the end of Extending those provisions would boost outlays for refundable 20. Because of interactions between the effects of different policy options, the estimated budgetary effects of this option cannot be added to the estimated budgetary effects of any of the other alternatives that affect discretionary spending except for the one to reduce the number of troops deployed for overseas contingency operations. credits and reduce revenues by a total of $200 billion over the period. (Payments for refundable credits are typically made a year after the applicable tax year.) The Long-Term Budget Outlook Beyond the coming decade, the fiscal outlook is significantly more worrisome. In s most recent long-term projections which extend through 2039 budget deficits rise steadily under the extended baseline, which follows s 10-year baseline projections for the first decade and then extends the baseline concept for subsequent years. 21 Although long-term budget projections are highly uncertain, the aging of the population, the growth in per capita spending on health care, and the ongoing expansion of federal subsidies for health insurance would almost certainly push up federal spending significantly relative to GDP after 2025 if current laws remained in effect. Federal revenues also would continue to increase relative to GDP under current law, but they would not keep pace with outlays. As a result, public debt would exceed 100 percent of GDP by 2039, estimates, about equal to the percentage recorded just after World War II. Such high and rising debt relative to the size of the economy would dampen economic growth and thus reduce people s income compared with what it would be otherwise. It would also increasingly restrict policymakers ability to use tax and spending policies to respond to unexpected challenges and would boost the risk of a fiscal crisis, in which the government would lose its ability to borrow at affordable rates. Moreover, debt would still be on an upward path relative to the size of the economy in 2039, a trend that would ultimately be unsustainable. To avoid the negative consequences of high and rising federal debt and to put debt on a sustainable path, lawmakers will have to make significant changes to tax and spending policies letting revenues rise more than they would under current law, reducing spending for large benefit programs below the projected amounts, or adopting some combination of those approaches. 21. See Congressional Budget Office, The 2014 Long-Term Budget Outlook (July 2014), Federal debt in 2024 under s current baseline is a little lower than the amount the agency previously projected for that year, but the long-term outlook remains about the same.
34 CHAPTER 2 The Economic Outlook The Congressional Budget Office anticipates that, under the assumption that current laws governing federal taxes and spending generally remain in place, economic activity will expand at a solid pace in 2015 and the next few years. As measured by the change from the fourth quarter of the previous year, real (inflation-adjusted) gross domestic product (GDP) will grow by 2.9 percent this year, by another 2.9 percent in 2016, and by 2.5 percent in 2017, expects. By comparison, the agency estimates that real GDP increased by 2.1 percent in 2014 the net result of a decline in the first quarter and brisk growth later in the year (see Box 2-1). Economic expansion this year and over the next few years will be driven by increases in consumer spending, business investment, and residential investment, expects. In addition, government purchases of goods and services are expected to contribute slightly to growth in 2016 and By contrast, net exports are projected to impose a drag on growth in 2015 and 2016 but to contribute to growth thereafter. expects the pace of output growth to reduce the quantity of underused resources, or slack, in the economy over the next few years. The difference between actual GDP and s estimate of potential (that is, maximum sustainable) GDP which is a measure of slack for the whole economy was about 2 percent of potential GDP at the end of 2014, but the agency expects that gap to be essentially eliminated by the second half of also expects slack in the labor market which is indicated by such factors as the elevated unemployment rate and a relatively low rate of labor force participation to dissipate over the next few years. In particular, the agency projects that increased hiring will reduce the unemployment rate from 5.7 percent in the fourth quarter of 2014 to 5.3 percent in the fourth quarter of Also, the increased hiring will encourage some people to enter or stay in the labor force, in s estimation. That will slow the decline in labor force participation, which arises from underlying demographic trends and federal policies, but it will also slow the fall of the unemployment rate. Over the next few years, reduced slack in the economy will diminish the downward pressure on inflation and interest rates. Nevertheless, because slack is expected to dissipate only slowly and because of a strengthening dollar, broadly held expectations for low inflation, and a recent sharp decline in oil prices (which put downward pressure on energy costs) expects the rate of inflation, as measured by the price index for personal consumption expenditures (PCE), to stay below the Federal Reserve s goal of 2 percent during the next few years. anticipates that the interest rate on 3-month Treasury bills will remain near zero until the second half of 2015 and then rise to 3½ percent by The agency further expects that the rate on 10-year Treasury notes will rise from an average of 2½ percent last year to 4½ percent by s projections for the period from 2020 through 2025 exclude possible cyclical developments in the economy, because the agency does not attempt to predict the timing or magnitude of such developments so far in the future. projects that real GDP will grow by an average of 2.2 percent per year from 2020 through 2025 a rate that matches the agency s estimate of the growth of potential output in those years. anticipates that output will grow much more slowly than it did during the 1980s and 1990s, primarily because the labor force is expected to grow more slowly than it did then. The lingering effects of the recent recession and of the ensuing slow recovery are also expected to cause GDP to be lower from 2020 through 2025 than it would otherwise have
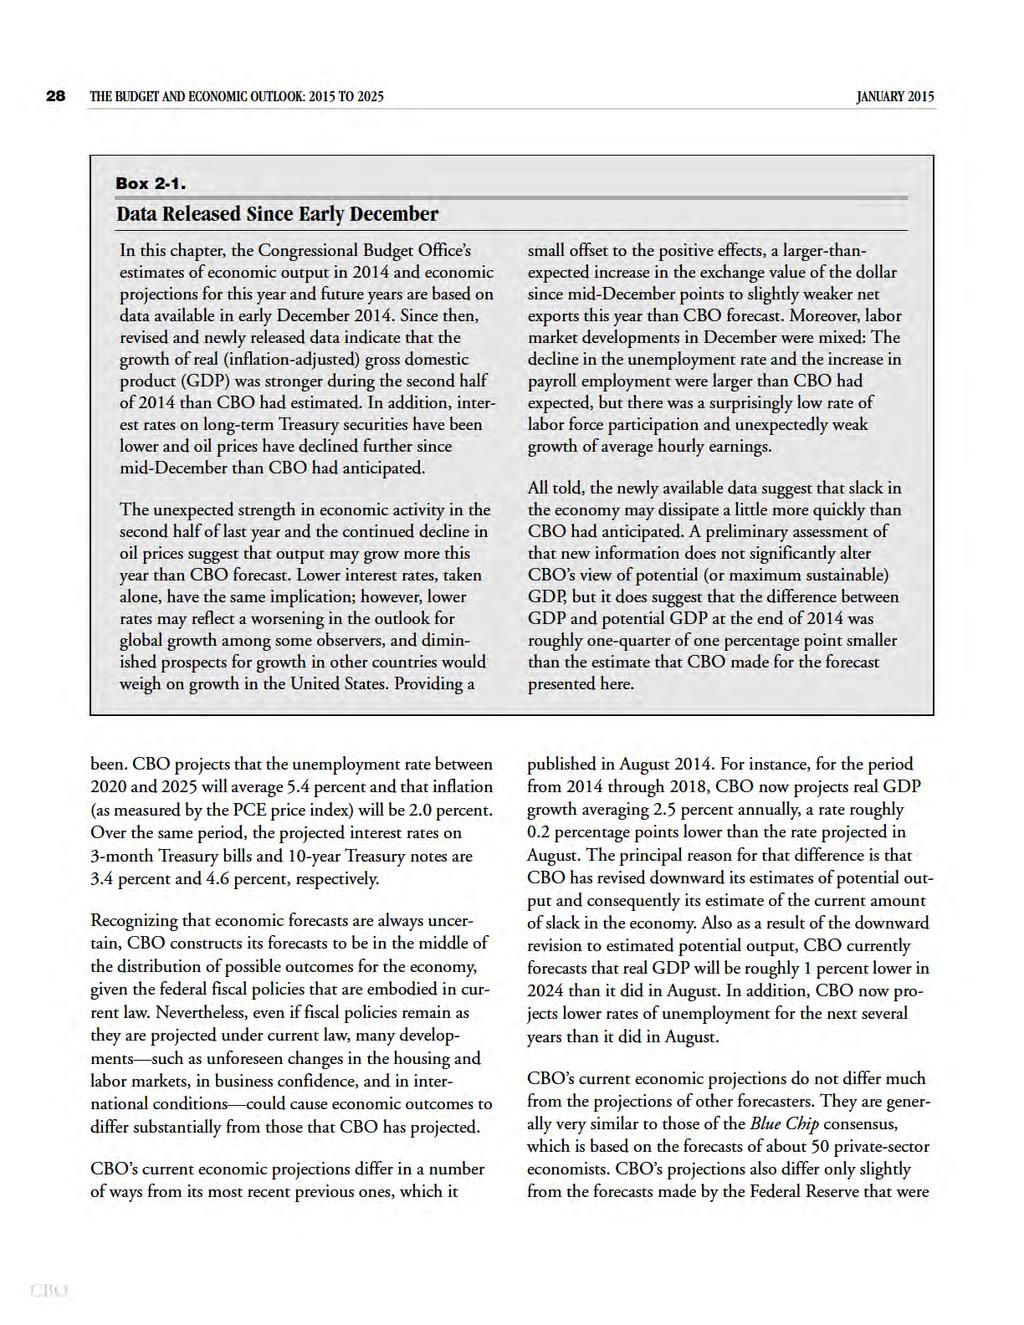
35
36 CHAPTER TWO THE BUDGET AND ECONOMIC OUTLOOK: 2015 TO Figure 2-1. Projected Growth in Real GDP Economic activity will expand at a solid pace in 2015 and over the next few years, projects. Percent Source: Congressional Budget Office. Notes: Real gross domestic product is the output of the economy adjusted to remove the effects of inflation. Data are annual. The percentage change in real GDP is measured from the fourth quarter of one calendar year to the fourth quarter of the next year. The value for 2014 does not incorporate data released by the Bureau of Economic Analysis since early December GDP = gross domestic product. presented at the December 2014 meeting of the Federal Open Market Committee. The Economic Outlook for 2015 Through 2019 expects output to grow faster in the next few years than it has in the past few years at an annual rate of 2.9 percent over the next two years and then by 2.5 percent in 2017 (see Figure 2-1 and Table 2-1). By comparison, the agency estimates that annual GDP growth averaged about 2¼ percent over the past three years. anticipates that consumer spending and investment will be the primary contributors to the growth of output over the next few years. In s projections, the changes in fiscal policy that will occur under current law have little effect on growth in the near term; monetary policy supports growth this year and over the next few years, but by smaller degrees over time. The agency also expects that output growth will be boosted this year by the steep decline in crude oil prices in the second half of 2014 (see Box 2-2). expects slack in the labor market to keep diminishing from 2015 through In the agency s projections, the greater demand for workers lowers the unemployment rate through 2017 and contributes to faster growth in hourly labor compensation; those developments are expected to encourage more people to enter, reenter, or remain in the labor force. anticipates that the rate of inflation will remain low this year but rise over the next few years as the economy strengthens and as shifts in the supply of and demand for crude oil as expected in oil futures markets begin to push oil prices up. However, expects the rate of inflation to remain below the Federal Reserve s longer-term goal of 2 percent until Those projections for 2015 through 2017 are based on s forecasts of cyclical developments in the economy. In contrast, the agency s projections for the period are based primarily on average historical relationships for example, the average historical relationship of output to potential output and of the unemployment rate to the natural rate of unemployment (the rate arising from all sources except fluctuations in the overall demand for goods and services). The projections of output and of the unemployment rate for the intervening years, 2018 and 2019, represent transition paths toward those average historical relationships. Federal Fiscal Policy Changes in federal fiscal policy (that is, the government s tax and spending policies) that result from current law will have little effect on the growth of the economy this year, because of three small and largely offsetting effects: The dollar value of federal purchases, relative to the size of the economy, will be lower this year than in 2014, slowing GDP growth slightly, estimates.
37 30 THE BUDGET AND ECONOMIC OUTLOOK: 2015 TO 2025 JANUARY 2015 Table 2-1. s Economic Projections for Calendar Years 2015 to 2025 Estimated, 2014 Forecast Projected Annual Average Percentage Change From Fourth Quarter to Fourth Quarter Gross Domestic Product Real (Inflation-adjusted) Nominal Inflation PCE price index Core PCE price index a Consumer price index b 1.2 c Core consumer price index a 1.7 c GDP price index Employment Cost Index d Unemployment Rate Fourth-Quarter Level (Percent) 5.7 c e 5.4 f Percentage Change From Year to Year Gross Domestic Product Real Nominal Inflation PCE price index Core PCE price index a Consumer price index b 1.6 c Core consumer price index a 1.7 c GDP price index Employment Cost Index d Calendar Year Average Unemployment Rate (Percent) 6.2 c Payroll Employment (Monthly change, in thousands) g 234 c Interest Rates (Percent) Three-month Treasury bills * c Ten-year Treasury notes 2.5 c Tax Bases (Percentage of GDP) Wages and salaries Domestic economic profits Sources: Congressional Budget Office; Bureau of Labor Statistics; Federal Reserve. Notes: Estimated values for 2014 do not reflect the values for GDP and related series released by the Bureau of Economic Analysis since early December Economic projections for each year from 2015 to 2025 appear in Appendix F. GDP = gross domestic product; PCE = personal consumption expenditures; * = between zero and 0.05 percent. a. Excludes prices for food and energy. b. The consumer price index for all urban consumers. c. Actual value for d. The employment cost index for wages and salaries of workers in private industries. e. Value for f. Value for g. Calculated as the monthly average of the fourth-quarter-to-fourth-quarter change in payroll employment.
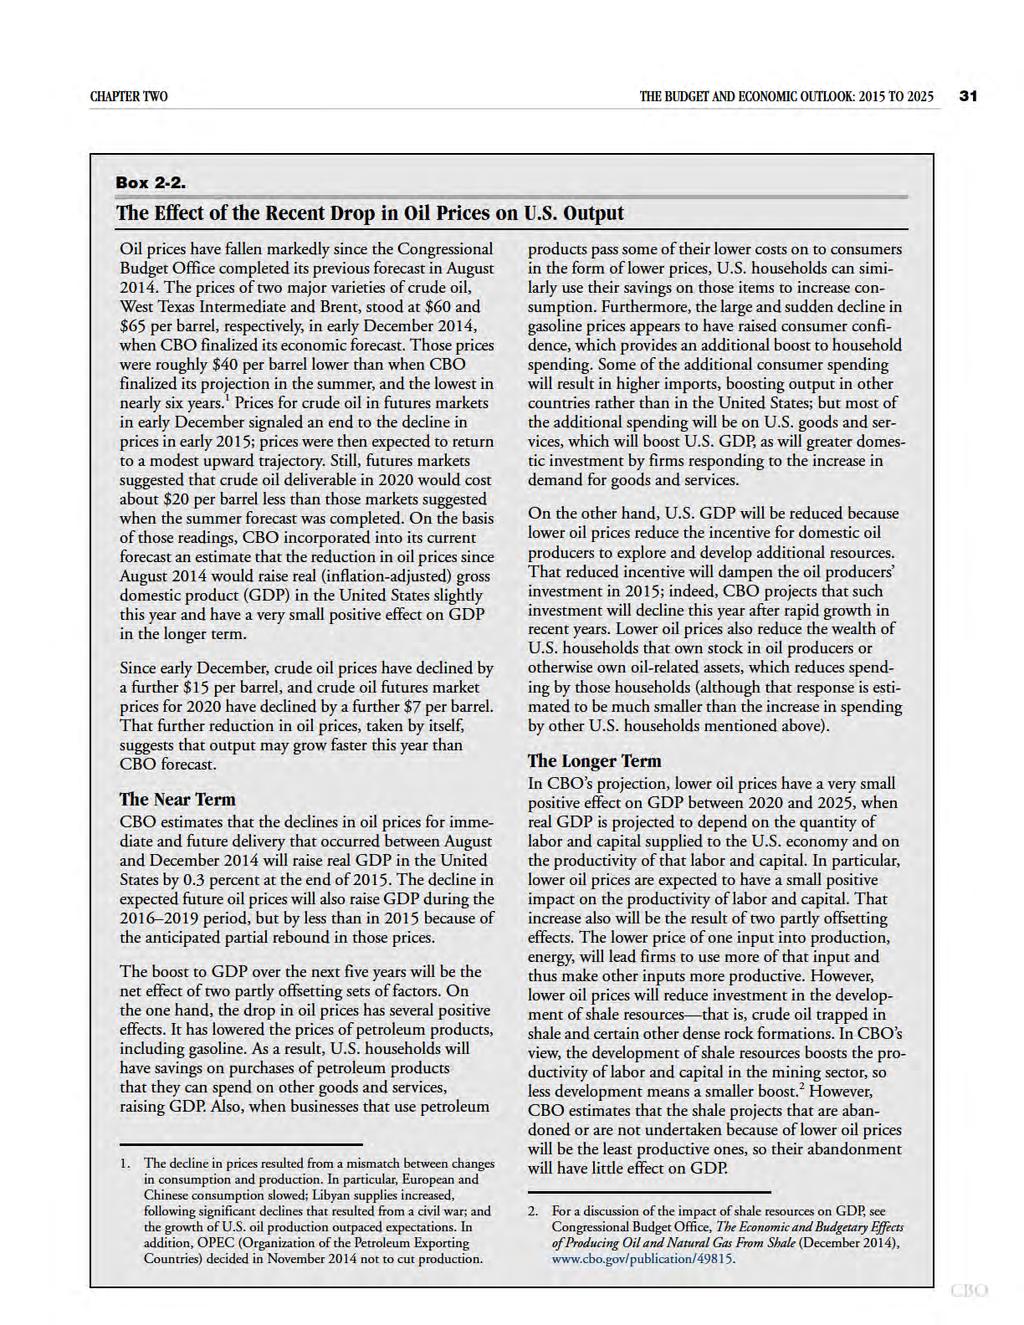
38
39 32 THE BUDGET AND ECONOMIC OUTLOOK: 2015 TO 2025 JANUARY 2015 However, the growing number of people who will receive Medicaid coverage or subsidies through health insurance exchanges because of the Affordable Care Act (ACA) along with the resulting rise in health insurance coverage will both stimulate greater demand for health care and allow lower-income households that gain subsidized coverage to increase their spending on other goods and services, slightly boosting GDP growth. 1 In addition, the recent retroactive extension through 2014 of various tax provisions that had expired at the end of 2013 is projected to make businesses tax payments in 2015 smaller than they would otherwise have been and, as a result, to provide a small boost to output growth this year. (Those provisions, which reduced the tax liabilities of individuals and corporations, include bonus depreciation allowances, which permit certain businesses to deduct the cost of new investments from taxable income more rapidly than they could otherwise.) By contrast, changes in federal fiscal policy restrained output growth in the past several years. For example, in 2013, they reduced growth by roughly 1½ percentage points, according to s estimates, primarily because tax rates on some income increased when certain tax provisions expired and because the federal government cut its purchases of goods and services (relative to the size of the economy) as sequestration under the Budget Control Act of 2011 (Public Law ) took effect. In 2014, changes in fiscal policy reduced output growth by an estimated one-quarter of one percentage point. The main reason was that extended unemployment insurance expired at the end of Also, the temporary expiration of bonus depreciation at the end of 2013 increased tax payments and may have discouraged investment by firms that did not expect bonus depreciation to be retroactively extended through In addition, continued reductions in federal purchases (relative to the size of the economy) restrained the demand for goods and services. From 2016 through 2019, changes in federal fiscal policy that result from current law will affect the economy in different ways. 2 The stimulus provided by the automatic stabilizers in the federal budget (that is, provisions of law that automatically decrease revenues or increase outlays when the economy weakens) will continue to wane as the 1. For s current estimates of how the ACA will affect health insurance coverage, see Appendix B. economy improves and will therefore provide a smaller boost to the demand for goods and services. 3 Collections of corporate and individual income taxes will rise because of the expiration at the end of 2014 of bonus depreciation and other tax provisions, reducing GDP. In addition, rising income will push some taxpayers into higher tax brackets over time, which will reduce their incentive to work and thus reduce labor supply and GDP. The ACA will also affect the labor market in coming years and therefore affect output. 4 The largest impact of the ACA on the labor market, especially as slack diminishes, will be that some provisions of the act raise effective tax rates on earnings and thus reduce the amount of labor that some workers choose to supply. That effect occurs partly because the health insurance subsidies that the act provides through the Medicaid expansion and the exchanges are phased out for people with higher income, creating an implicit tax on additional earnings by some people, and partly because the act directly imposes higher taxes on the labor income of other people. Monetary Policy and Interest Rates expects that, over the next few years, the Federal Reserve will gradually reduce the extent to which monetary policy supports economic growth. In s forecast, the federal funds rate the interest rate that financial institutions charge each other for overnight loans of their monetary reserves rises from 0.1 percent at the end of 2014 to 0.6 percent by the end of 2015 and then settles at 3.7 percent in expects the Federal Reserve to achieve that increase by raising the interest rate that it pays banks on their deposits at the Federal Reserve (the interest rate on overnight reserves) and by selling and repurchasing some securities on a temporary basis (in what are known as reverse repurchase agreements). 2. The effects described in this paragraph and the following one are incorporated into s projections; however, the agency has not separately quantified the impact that each would have. 3. All else being equal, automatic stabilizers affect the demand for goods and services by changing the amount of taxes that households and businesses pay and the transfer payments that households receive. The change in demand, in turn, affects businesses decisions to gear up production and hire workers, changing income and demand further. For s current estimates of the automatic stabilizers effects on the federal budget, see Appendix D. 4. For more information, see Congressional Budget Office, The Budget and Economic Outlook: 2014 to 2024 (February 2014), Appendix C,
40 CHAPTER TWO THE BUDGET AND ECONOMIC OUTLOOK: 2015 TO Figure 2-2. Interest Rates on Treasury Securities Percent 7 Actual Projected Year Treasury Notes 3-Month Treasury Bills Over the next several years, interest rates are projected to be pushed up by a tightening of monetary policy by the Federal Reserve and by market participants expectations of an improving economy Sources: Congressional Budget Office; Federal Reserve. Note: Data are annual. Actual data are plotted through projects the interest rate on three-month Treasury bills to remain near zero until mid-2015, to increase to 2.6 percent in 2017, and to be 3.4 percent in 2019 (see Figure 2-2). s projections for short-term interest rates were broadly consistent with the expectations of participants in the financial markets when the agency s forecast was completed in early December, although those expectations now suggest somewhat lower interest rates over the next few years. According to s projections, the interest rate on 10-year Treasury notes will rise from 2.4 percent in the second half of 2014 to 3.9 percent in 2017 and then settle at 4.6 percent by the end of That rise will reflect continued improvement in economic conditions and the expected rise in short-term interest rates. However, expects that those long-term rates will reach 4.6 percent somewhat later than the interest rate on three-month Treasury bills reaches 3.4 percent. The main reason for the difference in timing is that the long-term rates will probably be held down by the Federal Reserve s large portfolio of long-term assets. The Federal Reserve has indicated that it will begin to gradually reduce its holdings of long-term assets at some point after it starts raising the federal funds rate, depending on economic and financial conditions and the economic outlook; projects that those holdings will start to decline in 2016, but that they will take many years to fall to historical levels. Contributions to the Growth of Real GDP expects the growth of real GDP from 2015 through 2019 to be driven largely by consumer spending and investment, both business and residential. Government purchases are projected to have a small positive effect on GDP growth in 2016 and In contrast, net exports will restrain growth in 2015 and 2016, although they will contribute to growth thereafter, projects. Consumer Spending. After growing by an estimated 2.2 percent from the fourth quarter of 2013 to the fourth quarter of 2014, real spending on consumer goods and services will grow by 3.3 percent in 2015, expects. Because consumer spending accounts for about twothirds of GDP, that projection means that consumer spending will contribute 2.3 percentage points to the projected growth of GDP this year (see Figure 2-3). estimates that consumer spending will grow more slowly in later years and contribute an average of about 1½ percentage points to the growth of output from 2016 through 2019, which would be close to its average contribution over the past five years. The same factors that spurred the growth of consumer spending in 2014 solid gains in real disposable (aftertax) personal income and household wealth will continue to do so over the next few years, in s assessment. The agency expects that real disposable personal income will again grow solidly in 2015, driven
41 34 THE BUDGET AND ECONOMIC OUTLOOK: 2015 TO 2025 JANUARY 2015 Figure 2-3. Projected Contributions to the Growth of Real GDP Consumer spending and investment will drive the growth of real GDP over the next few years, expects. Percentage Points 2 Consumer Spending Business Investment 0 1 Residential Investment Purchases by Federal, State, and Local Governments Net Exports Source: Congressional Budget Office. Notes: Data are annual. The values show the percentage-point contribution of the major components of GDP to the fourth-quarter-to-fourthquarter growth rate of real GDP (output adjusted to remove the effects of inflation). Consumer spending is personal consumption expenditures. Business investment includes purchases of equipment, nonresidential structures, and intellectual property products and the change in inventories. Residential investment includes the construction of single-family and multifamily structures, manufactured homes, and dormitories; spending on home improvements; and brokers commissions and other ownership-transfer costs. The measure of purchases by federal, state, and local governments is taken from the national income and product accounts. Net exports are exports minus imports. The values for 2014 do not incorporate data released by the Bureau of Economic Analysis since early December GDP = gross domestic product.
42 CHAPTER TWO THE BUDGET AND ECONOMIC OUTLOOK: 2015 TO primarily by growth in the compensation of employees (see Figure 2-4). Moreover, energy prices are expected to keep falling in the first part of this year, boosting households purchasing power, just as they did in the second half of last year. Household wealth increased sharply in 2014, largely because of gains in stock prices, and it is projected to rise again this year though more slowly mostly because of rising house prices. In addition, significant improvements in consumer confidence last year are expected to continue to boost spending. Continued improvements in consumers creditworthiness and in the availability of credit will also support increases in consumer spending over the next few years, projects. Delinquency rates on consumer loans and home mortgage loans continued to fall last year, and banks have become more willing to make consumer loans. The ratio of household debt to disposable personal income, which had fallen markedly from 2010 through 2012, declined much more slowly in 2013 and 2014, suggesting that households are becoming more willing to borrow, that financial institutions are becoming more willing to lend, or both. Business Investment. expects investment by businesses which consists of fixed investment (investment in equipment, nonresidential structures, and intellectual property products) and investment in inventories to be a key contributor to the growth of real GDP over the next few years. anticipates that real business investment will increase by 4.3 percent between the fourth quarter of 2014 and the fourth quarter of 2015, by 5.9 percent the following year, and by smaller amounts in subsequent years. That projection means that real business investment will contribute 0.6 percentage points to the growth of real GDP in 2015, 0.8 percentage points in 2016, and somewhat less in later years (see Figure 2-3). The components of fixed investment that have historically been the most sensitive to the business cycle investment in equipment and nonmining structures will contribute the most to the growth of investment in 2015, in s estimation. 5 Growth in those 5. The term business cycle describes fluctuations in overall economic activity accompanied by fluctuations in the unemployment rate, interest rates, income, and other variables. Over the course of a business cycle, real activity rises to a peak and then falls until it reaches a trough; then it starts to rise again, beginning a new cycle. Business cycles are irregular, varying in frequency, magnitude, and duration. components will be strong enough to offset a decline in investment in mining structures, which will result from lower oil prices. The decline in mining investment is projected to abate in 2016 as oil prices stabilize, further boosting the overall growth of fixed investment. Inventory investment will be somewhat smaller in 2015 than in 2014, estimates, but have little impact on GDP growth in subsequent years. Stronger projected growth in the demand for goods and services is a major reason for s expectation of rising business investment. As the effects of very weak growth in demand during and immediately after the recession have faded, businesses have had a greater incentive to increase productive capacity and thus capital services (the flow of services available for production from the stock of capital; see Figure 2-4). As a result, business investment has expanded rapidly in recent years, growing at an average annual rate of 8 percent since Over the next few years, in response to increasing demand for their products, businesses will keep boosting investment at a pace faster than output growth, projects. Residential Investment. expects rapid growth in real residential investment over the next few years, but the small size of the sector will limit its contribution to the growth of real GDP. Real residential investment is expected to grow by 11 percent this year on a fourthquarter-to-fourth-quarter basis, and by more than 13 percent next year, before moderating in subsequent years. That projection implies a contribution to output growth of roughly one-half of one percentage point over each of the next few years (see Figure 2-3). Housing starts new, privately owned housing units on which construction begins in a given period account for a large share of residential investment, and expects them to post very strong growth, from an estimated 1.0 million units in 2014 to roughly 1.7 million units in The number of housing starts has been low in recent years because of weak household formation and a high vacancy rate (that is, the percentage of homes that are vacant). Household formation has been weaker since 2012 than one would expect, given the size of the increases in employment since then and the historical relationship between employment and household formation (see Figure 2-4). That weakness has probably resulted partly from the fact that lending standards for mortgages have remained fairly tight; household formation may also have been weak because households
43 36 THE BUDGET AND ECONOMIC OUTLOOK: 2015 TO 2025 JANUARY 2015 Figure 2-4. Factors Underlying the Projected Contributions to the Growth of Real GDP Solid growth in the inflationadjusted compensation of employees is projected to support faster growth in consumer spending in the next two years. Percent Actual Projected The growth of capital services is projected to rise over the next few years because increases in the demand for goods and services will spur business investment. Percent 7 Actual Projected Sources: Congressional Budget Office; Bureau of Economic Analysis; Bureau of the Census; Consensus Economics. Notes: Data are annual. Actual data are plotted through Values for 2014 are s estimates. In the top panel, inflation-adjusted compensation of employees is total wages, salaries, and supplements divided by the price index for personal consumption expenditures. Percentage changes are measured from the average of one calendar year to the next. In the bottom panel, capital services are a measure of the flow of services available for production from the real (inflation-adjusted) stock of capital (equipment, structures, intellectual property products, inventories, and land). Percentage changes are measured from the average of one calendar year to the next. Continued expectations for income growth have been slow to improve since the recession and because student loans have rendered some young adults unable or unwilling to obtain a mortgage. Better prospects for jobs and wages, as well as greater access to mortgage credit, will encourage more household formation and raise the demand for housing, in s view, despite the negative effects of an expected rise in interest rates for mortgage loans. The greater demand for housing will help to reduce the vacancy rate, which will further encourage home building. anticipates that the stronger growth in demand for housing will put upward pressure on house prices. That upward pressure will be offset to some degree by the projected increase in the supply of housing units. On balance, projects, house prices as measured by the Federal Housing Finance Agency s (FHFA s) price index for home purchases will increase by almost 3 percent in 2015 and by about 2½ percent per year, on average, over the period. According to s forecast, FHFA s index will surpass its prerecession peak (without being adjusted for overall inflation) in Government Purchases. projects that purchases of goods and services by governments at the federal, state, and local levels which make up the portion of government spending directly included in GDP will have little direct effect on the growth of output this year and contribute slightly in later years (see Figure 2-3 on page 34). In 2014, real government purchases increased by nearly 1 percent on a fourth-quarter-to-fourth-quarter basis, providing a mild positive contribution to real GDP growth. (During the previous four years, real government
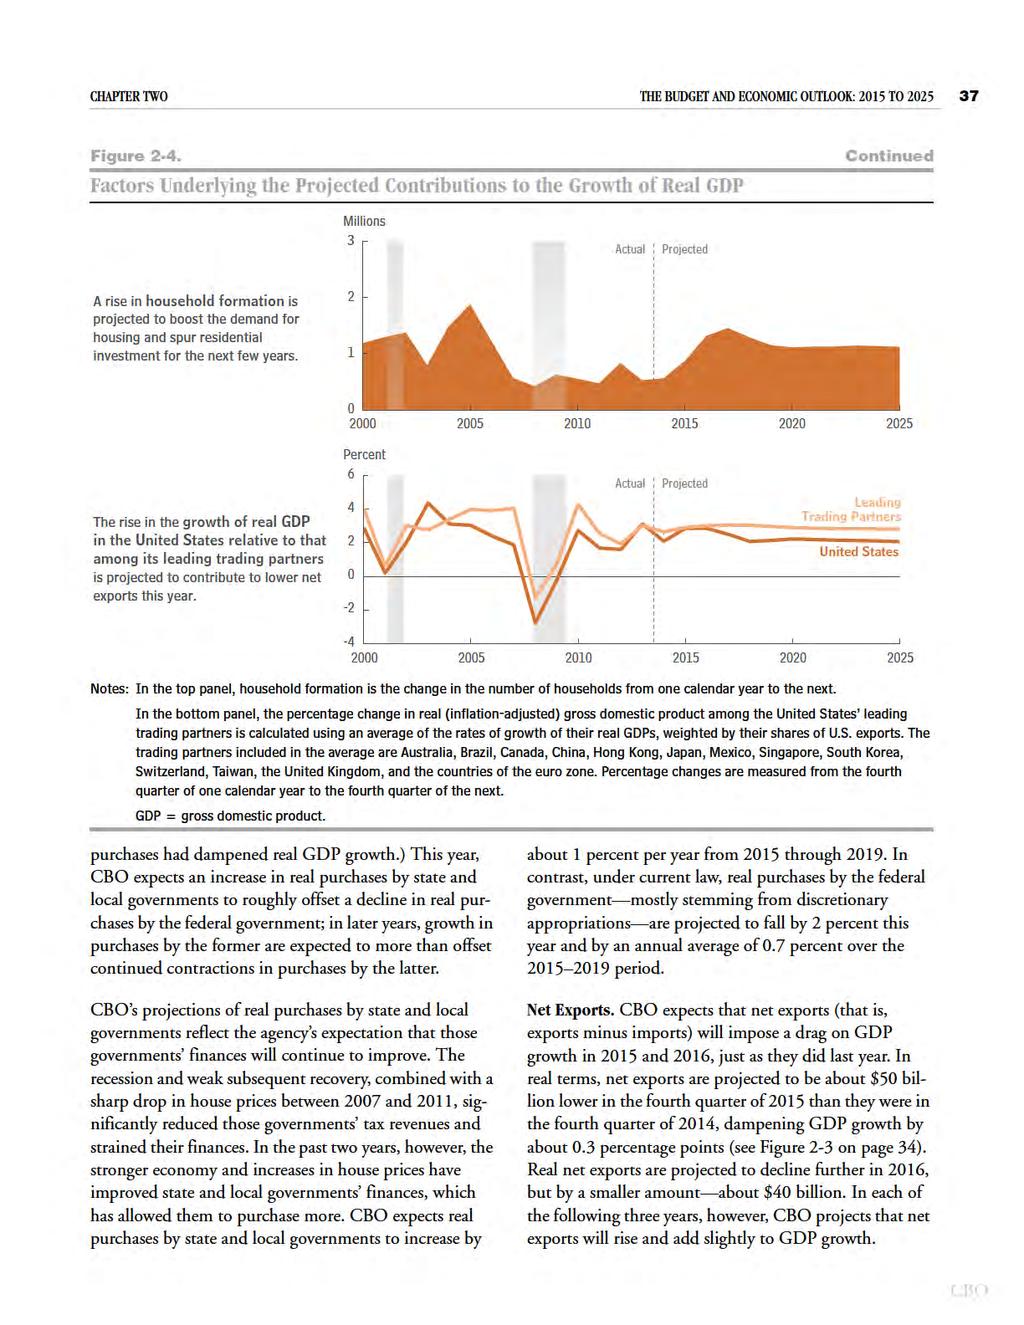
44
45 38 THE BUDGET AND ECONOMIC OUTLOOK: 2015 TO 2025 JANUARY 2015 s projection of net exports is based partly on important differences in the expected pace of economic activity in the United States and among the nation s leading trading partners (see Figure 2-4 on page 36). expects growth in the United States this year to improve relative to the growth of the leading trading partners; consequently, U.S. spending on imports will rise more than the trading partners spending on U.S. exports will, reducing net exports. 6 For example, the economies of the euro zone are expected to grow unevenly and sluggishly in 2015 and 2016, and China s economy is projected to grow more modestly over the next few years than in previous years. Over time, though, expects U.S. growth to slow slightly relative to growth among the nation s trading partners and particularly the countries in the euro zone; that will provide a small boost to net exports. Another factor affecting s forecast of net exports is growing domestic energy production, which is expected to reduce demand for imported energy products. s projection of net exports is also based on the increase in the exchange value of the dollar last year and on the agency s forecast of a slight further increase in the exchange value this year. The increase last year was partly caused by a decline in long-term interest rates among leading U.S. trading partners, particularly in Europe and Asia, and by a deterioration in the outlook for foreign growth. Those developments increased the exchange value of the dollar by boosting the relative demand for dollar-denominated assets. This year, expects the rise in economic growth in the United States relative to growth among the nation s trading partners to continue to contribute to rising interest rates in the United States relative to those abroad. That widening divergence in interest rates is projected to provide an additional boost to the relative demand for dollar-denominated assets and to further increase the exchange value of the dollar. The higher exchange value for the dollar will make imports for U.S. consumers cheaper and U.S. exports to foreign buyers more expensive, dampening net exports in the near term. As growth in foreign economies strengthens over time, however, expects foreign central banks to tighten their monetary policies gradually, which will 6. calculates the growth of leading U.S. trading partners using a weighted average of their growth rates. That measure uses shares of U.S. exports as weights. Similarly, s measure of the exchange value of the dollar is an export-weighted average of the exchange rates between the dollar and the currencies of leading U.S. trading partners. lower the exchange value of the dollar and contribute to stronger net exports later in the projection period. The Labor Market Employment climbed briskly in 2014, marking more than four years of gains. An average of 234,000 nonfarm jobs were added per month in 2014, significantly more than the monthly average of about 185,000 jobs in the previous three years. Nearly all employment growth since the end of the recession in 2009 has occurred in the private sector, where employment in 2014 surpassed its prerecession peak; employment in the public sector remains well below its prerecession peak (see Figure 2-5). Although conditions in the labor market improved notably in 2014, estimates that a significant amount of slack remains. But anticipates that the strengthening economy will lead to continued gains in employment, largely eliminating that slack by Figure 2-5. Changes in Private and Public Employment Since the End of 2007 Millions Private Public Sources: Congressional Budget Office; Bureau of Labor Statistics. Notes: Private employment consists of all employees on the payrolls of nonfarm private industries. Public employment consists of all employees on government payrolls, excluding temporary and intermittent workers hired by the federal government for the decennial census. Changes are measured from the beginning of the recession in the fourth quarter of Data are quarterly and are plotted through the fourth quarter of 2014.
46 CHAPTER TWO THE BUDGET AND ECONOMIC OUTLOOK: 2015 TO Current Slack in the Labor Market. Slack in the labor market includes the degree to which people who are not working would work if employment prospects were better, as well as the degree to which people who are employed would work longer hours if they could. Measuring slack is difficult, especially in light of the unusual developments that have taken place in the labor market since the recent recession. But in s view, the key components of slack in the labor market are the following: The number of people working or actively looking for work is smaller than would be expected if the demand for workers was stronger. Specifically, the labor force participation rate the percentage of people in the civilian noninstitutionalized population who are at least 16 years old and are either working or actively seeking work is well below s estimate of the potential labor force participation rate, which is the rate that would exist if not for the temporary effects of fluctuations in the overall demand for goods and services attributable to the business cycle. The unemployment rate is higher than s estimate of the current natural rate of unemployment. The share of part-time workers who would prefer full-time work is unusually high. Several indicators provide additional evidence that significant slack remains in the labor market. Most important is hourly labor compensation, which continues to grow more slowly than it did before the recession. Other indicators are the rate at which job seekers are hired and the rate at which workers are quitting their jobs, both of which remain lower than they were before the last recession. If the unemployment rate had returned to its level in December 2007, and if the labor force participation rate had equaled its potential rate, there would have been more people employed in 2014 about 2¾ million more in the fourth quarter, according to s estimates. The elevated unemployment rate and the depressed labor force participation rate account for that shortfall in roughly equal proportions. The equivalent shortfall in employment in the fourth quarter of 2013 was about 5¼ million people, largely reflecting the elevated unemployment rate, estimates; at its peak in 2009, the shortfall was 8½ million people. Those estimates of shortfalls in employment use a measure that does not include the number of people who have left the labor force permanently in response to the recession and slow recovery. However, the measure includes unemployed workers who would have difficulty finding jobs even if demand for workers were higher. Different measures of shortfalls in employment might be appropriate for some purposes. Labor Force Participation. The labor force participation rate fell from 65.9 percent in the fourth quarter of 2007, at the beginning of the recession, to 62.8 percent in the second quarter of 2014; it has since stabilized. About 1¾ percentage points of that roughly 3 percentage-point decline in participation, estimates, stems from long-term trends (especially the aging of the population), but the rest of the decline is attributable to the weakness of the economy during the past several years. Specifically, about three-quarters of one percentage point represents the extent to which actual participation is lower than potential participation because of the recent cyclical weakness in employment prospects and wages; that gap is one component of slack in the labor market, and it will close over time as more people enter or reenter the labor force (as this chapter discusses below in The Labor Market Outlook Through 2019 on page 42). And about one-half of one percentage point of the decline represents workers who became discouraged by the persistent weakness in the labor market and permanently dropped out of the labor force. 7 Unemployment. The unemployment rate was 5.7 percent in the fourth quarter of 2014, roughly three-quarters of one percentage point above its level at the end of estimates that roughly one-quarter of one percentage point of the difference between the rate in the fourth quarter and the rate before the recession is a temporary effect of cyclical weakness in the economy and thus is another component of slack in the labor market. (At its peak, in late 2009, the temporary effect of cyclical weakness on the unemployment rate was about 4¼ percentage points, estimates.) estimates that structural 7. Since publishing its most recent previous projections in An Update to the Budget and Economic Outlook: 2014 to 2024 (August 2014), has revised downward its estimate of the degree to which the persistent weakness in the labor market led some workers to become discouraged and permanently drop out of the labor force. See Comparison With s August 2014 Projections on page 52.
47 40 THE BUDGET AND ECONOMIC OUTLOOK: 2015 TO 2025 JANUARY 2015 Figure 2-6. Rates of Short- and Long-Term Unemployment Percent Short-Term Unemployment 2 Long-Term Unemployment The overall unemployment rate remains elevated partly because of weakness in the demand for goods and services and partly because of the stigma and erosion of skills that can stem from long-term unemployment. Sources: Congressional Budget Office; Bureau of Labor Statistics. Notes: The rate of short-term unemployment is the percentage of the labor force that has been out of work for 26 weeks or less. The rate of long-term unemployment is the percentage of the labor force that has been out of work for at least 27 consecutive weeks. Data are quarterly and are plotted through the fourth quarter of factors account for the remainder of the difference (and an equivalent increase in s estimate of the natural rate of unemployment). 8 In particular, the stigma and erosion of skills that can stem from long-term unemployment (that is, unemployment that lasts for at least 27 consecutive weeks), which have remained higher than they were before the recent recession, are continuing to push up the unemployment rate. 9 The difference between the unemployment rate in the fourth quarter and the unemployment rate before the recession can be explained entirely by an increase in longterm unemployment. Though the rate of short-term unemployment (the number of people unemployed for 26 weeks or less as a percentage of the labor force) in the fourth quarter of 2014 nearly matched the rate in the 8. has revised that estimate of the effect of the structural factors downward since publishing its most recent previous projections in August. See Comparison With s August 2014 Projections on page Another structural factor that raised the unemployment rate until recently, in s view, was a decrease in the efficiency with which employers filled vacancies. estimates that that effect dissipated by late fourth quarter of 2007, the rate of long-term unemployment was still nearly 1 percentage point above the earlier rate of 0.9 percent (see Figure 2-6). The elevated rate of long-term unemployment in part reflects an increase in the natural rate of unemployment, but in s view, that elevated rate also reflects slack in the labor market. expects that many of the long-term unemployed who are not near retirement age will be employed again in the next few years. Indeed, much of the decline in the rate of long-term unemployment last year appears to have happened because people found work, not because they left the labor force. Part-Time Employment. Another component of labor market slack is the number of people employed but not working as many hours as they would like. The incidence of part-time employment for economic reasons (that is, part-time employment among workers who would prefer full-time employment) remains significantly higher than it was before the recession (see Figure 2-7). The continued large share of part-time workers is one reason that the Bureau of Labor Statistics U-6 measure of underused labor stood at 11.4 percent in the fourth quarter of 2014, down from a peak of 17.1 percent in the fourth quarter
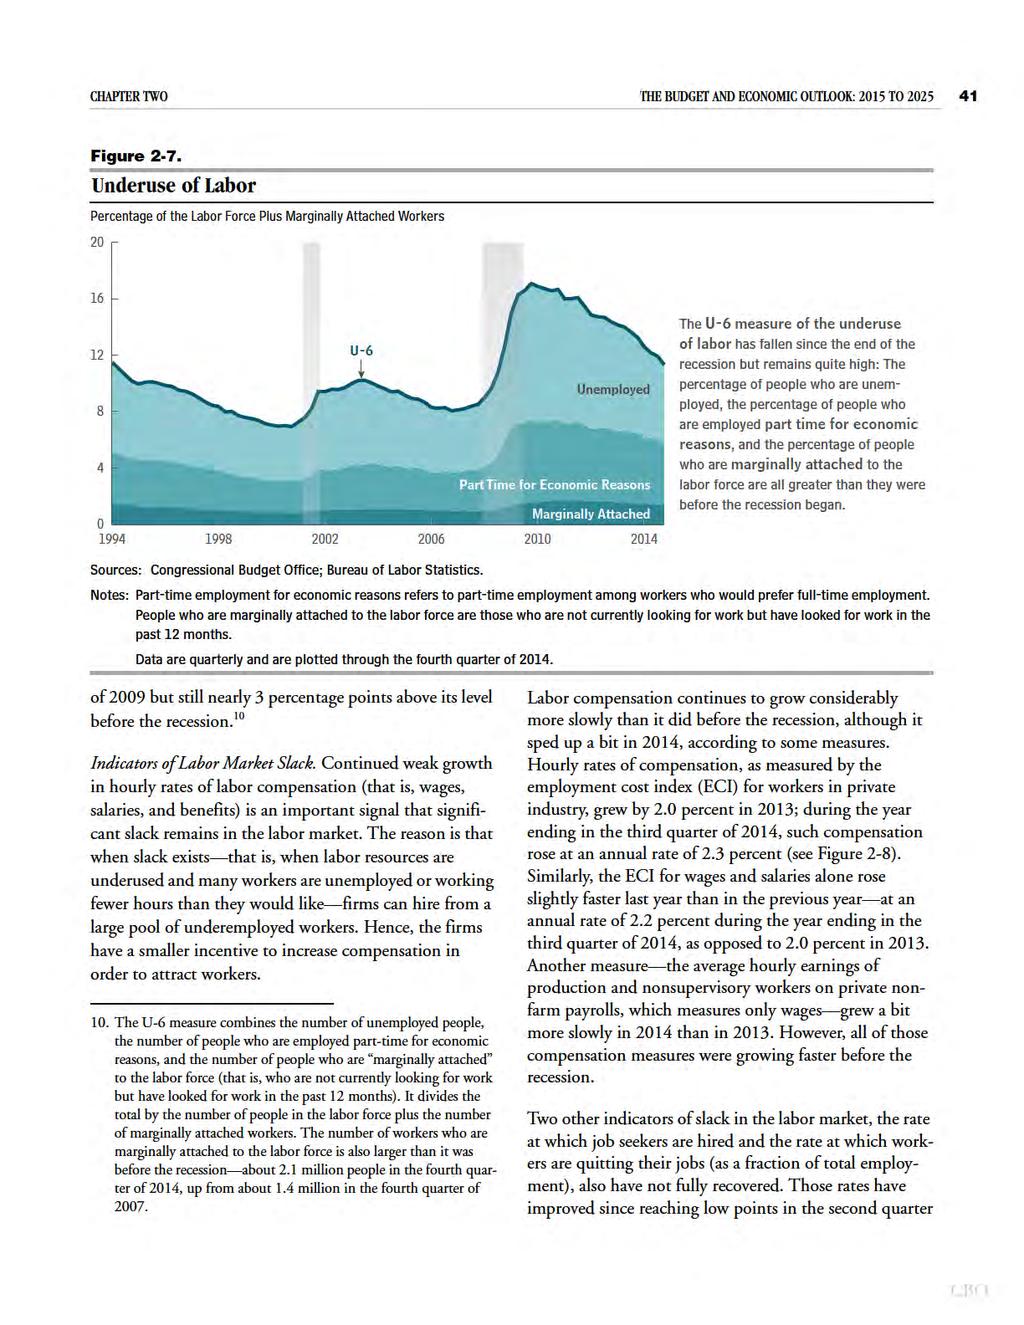
48
49 42 THE BUDGET AND ECONOMIC OUTLOOK: 2015 TO 2025 JANUARY 2015 Figure 2-8. Measures of Compensation Paid to Employees Percentage Change Average Hourly Earnings Compensation of Private Industry Workers When labor is underused as is currently the case firms can hire from a relatively large pool of underemployed workers and thus have less incentive to increase compensation to attract workers. Accordingly, compensation has been growing considerably more slowly than it did before the recession Sources: Congressional Budget Office; Bureau of Labor Statistics. Notes: Average hourly earnings are earnings of production and nonsupervisory workers on private nonfarm payrolls. Compensation is measured by the employment cost index for workers in private industry. Data are quarterly. Average hourly earnings are plotted through the fourth quarter of 2014; the employment cost index is plotted through the third quarter of Percentage changes are measured from the same quarter one year earlier. of 2009, suggesting that employers are gaining confidence in the strength of the economy and that workers are more confident about finding new jobs after quitting. However, each rate has recovered only about two-thirds of the decline from its average. Difficulties in Measuring Slack in the Labor Market. Considerable difficulties arise in measuring slack in the labor market, especially under current circumstances. For example, in assessing potential labor force participation, estimated how many people permanently dropped out of the labor force because of such factors as long-term unemployment. However, may have underestimated or overestimated that number, and therefore potential labor force participation could be lower or higher, respectively, than the agency thinks. Similarly, s estimate of the increase in the natural rate of unemployment since before the recession incorporates the agency s estimate of the decrease in the efficiency with which employers fill vacancies. That decrease in efficiency has dissipated over the past year, in s judgment, as workers have acquired new skills, shifted to fastergrowing industries and occupations, and relocated to take advantage of new opportunities. But if such adjustments in the labor market have occurred more slowly than has estimated, the natural rate of unemployment would currently be higher than has estimated. A higher natural rate would suggest more upward pressure on wages for any given unemployment rate. The Labor Market Outlook Through The growth of output this year will increase the demand for labor, leading to solid employment gains and a further reduction in labor market slack, according to s estimates. Those developments are expected to continue at a more moderate pace over the following two years. The unemployment rate is projected to fall to 5.5 percent in the fourth quarter of 2015 and to edge down to 5.3 percent by the fourth quarter of 2017 (see Table 2-1 on page 30). expects the decline in the unemployment rate to be tempered by the fact that labor force participation, because of the stronger labor market, will decline less than would be expected on the basis of demographics and certain other factors. also expects the diminished slack in the labor market to raise the growth of hourly labor compensation modestly.
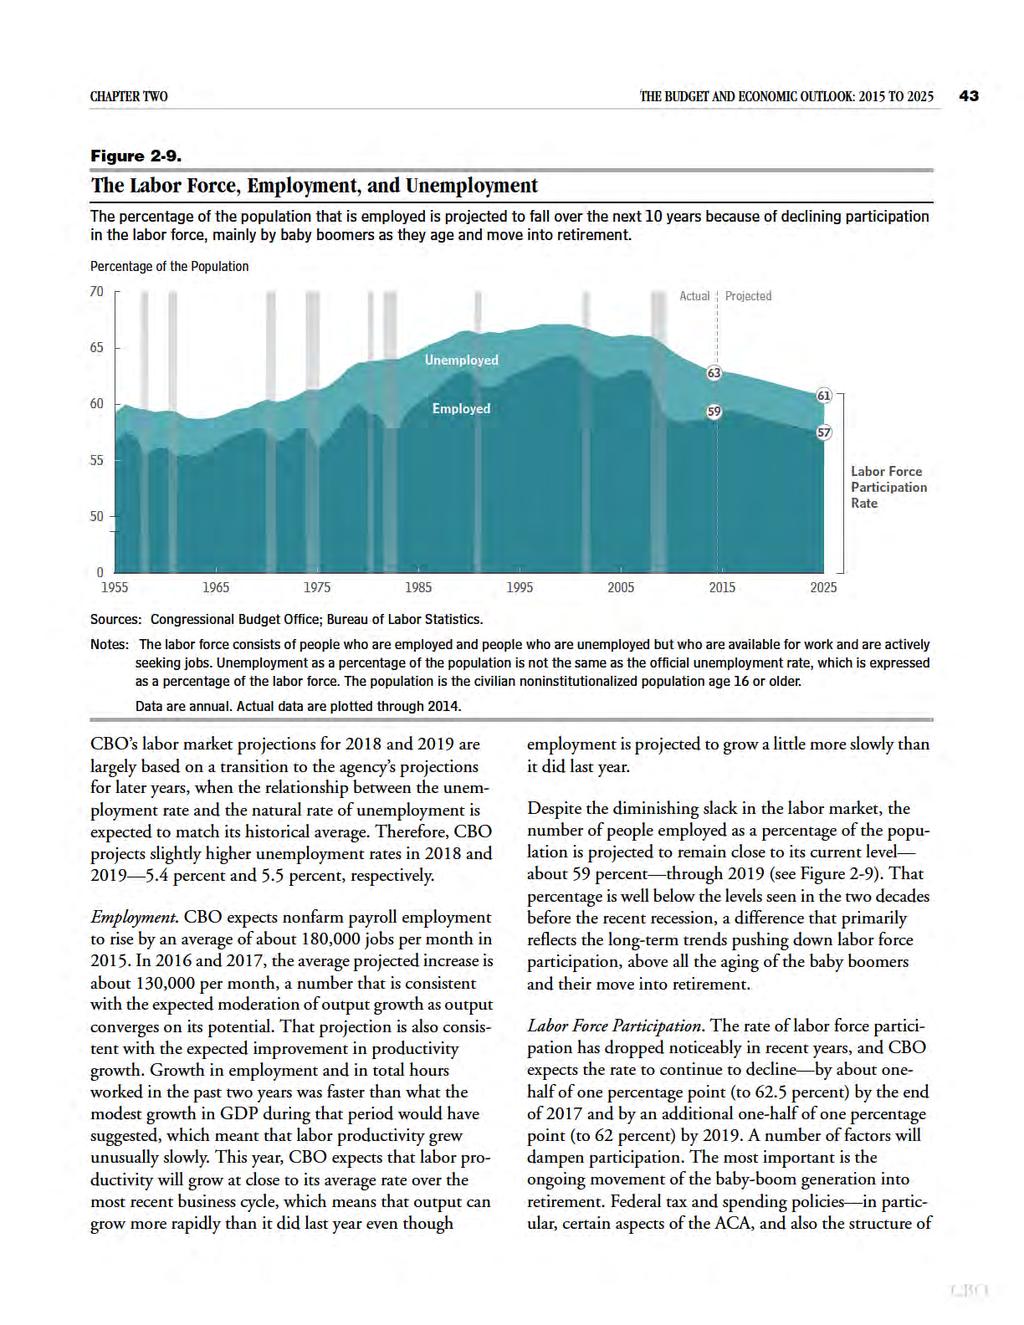
50
51 44 THE BUDGET AND ECONOMIC OUTLOOK: 2015 TO 2025 JANUARY 2015 Figure Overall and Natural Rates of Unemployment Percent Overall Natural Stronger demand for labor will close the gap between the overall rate of unemployment and 's estimate of the natural rate. also expects the natural rate to fall, as the effects of stigma and erosion of skills among the long-term unemployed fade Sources: Congressional Budget Office; Bureau of Labor Statistics. Notes: The overall unemployment rate is a measure of the number of jobless people who are available for work and are actively seeking jobs, expressed as a percentage of the labor force. The natural rate is s estimate of the rate arising from all sources except fluctuations in the overall demand for goods and services. Data are fourth-quarter values. The value for the overall rate in 2014 is actual; values in other years are projected. the tax code, whereby rising income pushes some people into higher tax brackets will also tend to lower the participation rate in the next several years. 11 But another factor is projected to offset some of those effects. Increasing demand for labor as the economy improves is expected to boost participation in the next few years: Some workers who left the labor force temporarily, or who stayed out of the labor force because of weak employment prospects, will enter the labor force, and other workers will choose to stay in the labor force rather than drop out. Those factors will push the labor force participation rate back toward its potential rate. Therefore, the projected decline in the labor force participation rate over the next few years is slower than what would result from demographic changes and the effects of fiscal policy alone. 11. For more information about the ACA s effects on labor force participation, see Congressional Budget Office, The Budget and Economic Outlook: 2014 to 2024 (February 2014), Appendix C, The Unemployment Rate. For two reasons, expects the unemployment rate to decline from an average of 6.2 percent in 2014 to 5.3 percent in 2017 (see Figure 2-10). First, stronger demand for labor will close the gap between the unemployment rate and the natural rate. Second, expects the natural rate to fall as the effects of stigma and erosion of skills among the long-term unemployed fade. However, the unemployment rate is projected to decline much less than it has in recent years, because expects growth in employment and the drop in the labor force participation rate to be slower during the next few years, on balance, than they have been in the past few years. Labor Compensation. projects stronger growth in hourly labor compensation over the next several years than in That pickup is consistent with the agency s projection of firms stronger demand for workers. To some degree, firms can attract unemployed or underemployed workers without increasing compensation growth. However, as slack in the labor market diminishes
52 CHAPTER TWO THE BUDGET AND ECONOMIC OUTLOOK: 2015 TO Figure Inflation Percentage Change in Prices 5 Actual Projected 4 Overall Core anticipates that prices will rise modestly over the next several years, reflecting the remaining slack in the economy and widely held expectations for low and stable inflation Sources: Congressional Budget Office; Bureau of Economic Analysis. Notes: The overall inflation rate is based on the price index for personal consumption expenditures; the core rate excludes prices for food and energy. Data are annual. Percentage changes are measured from the fourth quarter of one calendar year to the fourth quarter of the next. Actual data are plotted through 2013; the values for 2014 are s estimates and do not incorporate data released by the Bureau of Economic Analysis since early December and firms must increasingly compete for workers, projects that growth in hourly compensation will pick up. That increase in compensation will boost labor force participation and the number of available workers, thereby moderating the overall increase in compensation growth. expects the ECI for total compensation of workers in private industry to increase at an average annual rate of 3.6 percent from 2015 through 2019, compared with an average of about 2 percent during the past several years. The growth of other measures of hourly labor compensation, such as the average hourly earnings of production and nonsupervisory workers in private industries, is similarly expected to increase. Inflation projects that the rate of inflation in 2015 as measured by the percentage change in the PCE price index from the fourth quarter of 2014 to the fourth quarter of 2015 will remain subdued (see Table 2-1 on page 30 and Figure 2-11). expects less downward pressure on inflation this year and in the next few years because of the diminishing amount of slack in the economy. In 2015, however, expects significant downward pressure on inflation to result from two recent developments: the increase in the exchange value of the dollar, which will reduce inflation by lowering import prices, and lower prices for crude oil, which will reduce energy prices (see Box 2-2 on page 31). In s projections, inflation in the PCE price index will be 1.4 percent this year, very slightly above last year s estimated 1.3 percent. By contrast, expects the core PCE price index which excludes prices for food and energy to rise at a faster 1.8 percent rate this year after an estimated 1.5 percent increase last year. In 2016 and 2017, projects the rate of overall PCE inflation to be close to the rate of core PCE inflation because of a partial rebound consistent with prices in oil futures markets in the price of crude oil. Given expectations for inflation and the anticipated reduction in slack, the projected rate of inflation for both measures rises to 1.9 percent in 2016 and stabilizes at 2.0 percent by the end of That rate is equal to the Federal Reserve s longer-term goal, reflecting s judgment that consumers and businesses expect inflation to occur at about that rate and that the Federal Reserve will make changes in monetary policy to prevent inflation from exceeding or falling short of its goal for a prolonged period.
53 46 THE BUDGET AND ECONOMIC OUTLOOK: 2015 TO 2025 JANUARY 2015 Figure GDP and Potential GDP Trillions of 2009 Dollars 24 Historical Projected Potential GDP GDP a The gap between GDP and potential GDP a measure of underused resources, or slack will essentially be eliminated by the end of 2017, expects Sources: Congressional Budget Office; Bureau of Economic Analysis. Notes: Potential gross domestic product is s estimate of the maximum sustainable output of the economy. Data are annual. Actual data are plotted through 2013; projections are plotted through 2025 and are based on data available through early December GDP = gross domestic product. a. From 2020 to 2025, the projection for actual GDP falls short of that for potential GDP by one-half of one percent of potential GDP. The consumer price index for all urban consumers (CPI-U) and its core version are expected to increase a little more rapidly than their PCE counterparts, because of the different methods used to calculate them and also because housing rents play a larger role in the consumer price indexes. projects that the difference between inflation as measured by the CPI-U and inflation as measured by the PCE price index after this year will generally be about 0.4 percentage points per year, which is close to the average difference over the past several decades. The Economic Outlook for 2020 Through 2025 s economic projections for 2020 through 2025 are not based on forecasts of cyclical developments in the economy, as its projections for the next several years are. Rather, they are based on projections of underlying growth factors such as the growth of the labor force, of hours worked, and of productivity that exclude cyclical movements. Actual outcomes will no doubt deviate from what the underlying growth factors suggest, so s economic projections are intended to reflect average outcomes. The projections take into account several factors: historical patterns for the nonfarm business sector and for the rest of the economy; projected changes in demographics; the response of investment to those and other long-term trends; s estimates of the persistent effects of the recession and of the slow economic recovery that followed it; and federal tax and spending policies under current law. projects that real GDP will be about one-half of one percent below real potential GDP, on average, during the period (see Figure 2-12). That gap is based on s estimate that output has been roughly that much lower than potential output, on average, over the period from 1961 to 2009, a period that included seven complete business cycles (measured from trough to trough). Indeed, over the course of each of the five complete business cycles that have occurred since 1975, output has been lower than potential output, on average: estimates that over each of those cycles, the shortfall in output relative to potential output during and after that cycle s economic downturn has been larger and has
54 CHAPTER TWO THE BUDGET AND ECONOMIC OUTLOOK: 2015 TO lasted longer than the excess of output over potential output during that cycle s economic boom. 12 In s projections for the period: The growth of real GDP averages 2.2 percent per year, as does the growth of real potential GDP. The unemployment rate edges down from 5.5 percent in 2020 to 5.4 percent in 2022 and subsequent years; during that period, it slightly exceeds s estimate of the natural rate of unemployment, which is consistent with s projection that output will fall short of potential output. Both inflation and core inflation, as measured by the PCE price index, average 2.0 percent a year. Inflation as measured by the CPI-U is somewhat higher. The interest rates on 3-month Treasury bills and 10-year Treasury notes are 3.4 percent and 4.6 percent, respectively. Potential Output The growth in real potential output that projects for the period (2.2 percent per year, on average) is substantially slower than s estimate of the growth in real potential output during the business cycles, as measured from peak to peak, that occurred between 1982 and 2007 (3.1 percent per year, on average) but substantially faster than the growth in potential output during the current business cycle so far that is, between 2008 and 2014 (1.4 percent per year, on average). Those differences reflect changes in the growth of potential hours worked, the growth of capital services, and the growth of potential productivity primarily in the nonfarm business sector, which represents roughly three-quarters of total output. In addition, s projection for potential output in the period is lower than it would have been if the recession had not occurred. According to s estimates, the recession and the ensuing slow recovery have weakened the factors that determine potential output labor supply, capital services, and productivity for an extended period. 12. Further discussion will be provided in Congressional Budget Office, Why Projects Average Output Will Be Below Potential Output (forthcoming). Overall Output Growth. The main reason that potential output is projected to grow more slowly than it did in the earlier business cycles is that expects growth in the potential labor force (the labor force adjusted for variations caused by the business cycle) to be much slower than it was earlier (see Table 2-2). Growth in the potential labor force will be held down by the ongoing retirement of the baby boomers; by a relatively stable labor force participation rate among working-age women, after sharp increases from the 1960s to the mid-1990s; and by federal tax and spending policies set in current law, which will reduce some people s incentives to work (as this chapter discusses below, in The Labor Market on page 50). The main reason that expects potential output to grow more quickly than it has over the past half-dozen years is that the agency expects the potential productivity of the labor force to grow more quickly. In s projections, potential productivity grows at an annual rate of 1.6 percent from 2020 through 2025, which would be close to its average rate of growth during the business cycles between 1982 and 2007 and substantially higher than the 0.9 percent average rate that estimates for 2008 through That projected increase, in turn, mostly reflects s assessment of potential total factor productivity, or TFP which is the average real output per unit of combined labor and capital services in the nonfarm business sector. That measure has grown unusually slowly since the onset of the recession in 2007, but estimates that it will accelerate during the next few years, returning to its average rate of growth during the years before the recession. The Nonfarm Business Sector. In the nonfarm business sector, projects that potential output will grow at an average rate of 2.6 percent per year over the period. Like the projected growth rate of overall potential output, that growth rate would be lower than it was during the business cycles from 1982 through 2007 but higher than it has been since Potential hours worked in the nonfarm business sector are projected to grow at an average annual rate of 0.6 percent from 2020 through 2025 more slowly than they did in earlier periods (particularly from 1982 through 2001) but more quickly than they did from 2008 through The reason that growth in hours in that sector is expected to be faster than it was during that most recent period, despite the projected slow growth of the
55 48 THE BUDGET AND ECONOMIC OUTLOOK: 2015 TO 2025 JANUARY 2015 Table 2-2. Key Inputs in s Projections of Potential GDP Percent, by Calendar Year Projected Average Average Annual Growth Annual Growth Total, Total, Overall Economy Potential GDP Potential Labor Force Potential Labor Force Productivity a Nonfarm Business Sector Potential Output Potential Hours Worked Capital Services Potential TFP Potential TFP excluding adjustments Adjustments to TFP (Percentage points) b * 0.1 * * * Contributions to the Growth of Potential Output (Percentage points) Potential hours worked Capital input Potential TFP Total Contributions Potential Labor Productivity c Source: Congressional Budget Office. Notes: Potential GDP is 's estimate of the maximum sustainable output of the economy. GDP = gross domestic product; TFP = total factor productivity; * = between percentage points and zero. a. The ratio of potential GDP to the potential labor force. b. The adjustments reflect s estimate of the unusually rapid growth of TFP between 2001 and 2003 and changes in the average level of education and experience of the labor force. c. The ratio of potential output to potential hours worked in the nonfarm business sector. overall potential labor force, is that other sectors including owner-occupied housing, nonprofit institutions serving households, and state and local governments are expected to become a smaller share of the economy. 13 Capital services in the nonfarm business sector are also projected to grow more slowly from 2020 through 2025 than they did during the business cycles from 1982 through 2007, primarily because of the slower growth of potential hours worked. But the projected growth of capital services from 2020 through 2025 is somewhat faster than such growth has been since 2007, reflecting projected increases in investment. The growth of capital 13. The output of the state and local government sector includes only the compensation of state and local employees and the depreciation of equipment, structures, and intellectual property products owned by state and local governments. Other purchases by state and local governments such as new capital investments, goods that are not capital investments, and contracted services are part of the output of other sectors of the economy, primarily the nonfarm business sector.
56 CHAPTER TWO THE BUDGET AND ECONOMIC OUTLOOK: 2015 TO services has been restrained since 2007 because of weak investment, which itself was a response to the cyclical weakness of demand; in the long run, however, the growth of capital services depends mostly on the growth of hours worked and on the rate of increase in productivity. projects that potential TFP growth in the nonfarm business sector between 2020 and 2025 will equal its average between 2002 and 2007 (after the effects of a temporary surge in the early 2000s are excluded) of 1.3 percent. That is, projects the growth rate of potential TFP to be essentially what recent history, before the recession, would have suggested. That approach is similar to the one that uses to project trends in other factors that determine the growth of potential output. The projected growth rate is also close to the average observed during the business cycles from 1982 through 2007, a longer period that witnessed marked swings in the growth of TFP. 14 However, the projected rate is more rapid than the estimated average annual rate of growth of 0.9 percent from 2008 to 2014, as this chapter discusses below. Lingering Effects of the Recession and Slow Recovery. Incorporated into the projection of overall potential output growth is s expectation that each of the factors that determine potential output potential labor hours, capital services, and potential TFP will be lower through 2025 than it would have been if not for the recession and slow recovery. In most cases, it is difficult to quantify the effects of the recession and slow recovery on those factors. For example, there is significant uncertainty in estimating how much of the recent weakness in TFP can be traced to the effect of the recession and slow recovery on potential TFP, and how much reflects other developments in the economy. In addition, the effects of the recession and slow recovery on the labor force, capital services, and productivity are interrelated; for example, a smaller potential labor force implies a smaller need for firms to invest in capital services. 14. During that period, potential TFP grew at an average annual rate of 1.4 percent if the surge in the early 2000s is included and at a rate of 1.2 percent if it is excluded, estimates. In s assessment, the recession and weak recovery have led to a reduction in potential labor hours. Persistently weak demand for workers has led some people to leave the labor force permanently, and persistently high long-term unemployment has generated some stigma and erosion of skills for some workers, pushing the natural rate of unemployment above its prerecession level. estimates that the lasting effects of the recession and slow recovery will, in 2025, boost the unemployment rate by about 0.2 percentage points and depress the labor force participation rate by about 0.3 percentage points. projects that, by 2025, the primary effect of the recession and the weak recovery on capital services will occur through the number of workers and TFP: Fewer workers require proportionately less capital, all else being equal, and lower TFP tends to reduce investment as well. The economic weakness has also affected capital services because of the plunge in investment during the recession, although expects that effect to dissipate by In addition, the sharp increase in federal debt which resulted from changes in fiscal policies that were made in response to the weak economy, as well as from the automatic stabilizers is estimated to crowd out additional capital investment in the long term. has not quantified the effect of each of those factors in its current projection. Finally, estimates that the recession and slow recovery contributed to the significant slowdown in the growth of potential TFP from 2008 to 2014 compared with the previous business cycles since 1982 and that slowdown will result in a lower level of potential TFP throughout the next decade even if growth in potential TFP picks up, as expects it to. In s judgment, the protracted weakness in demand for goods and services and the large amount of slack in the labor market lowered potential TFP growth by reducing the speed with which resources were reallocated to their most productive uses, slowing the rate at which workers gained new skills, and restraining businesses spending on research and development. However, quantifying the role of the recession and weak recovery in the slowdown in potential TFP growth is difficult because factors unrelated to the weak economy may also have slowed such growth. For example, there appears to have been a slowdown in advances in information technology beginning in the few years prior to the
57 50 THE BUDGET AND ECONOMIC OUTLOOK: 2015 TO 2025 JANUARY 2015 recession. 15 (For more discussion, see Comparison With s August 2014 Projections on page 52.) The Labor Market projects that the unemployment rate will edge down from 5.5 percent at the beginning of 2020 to 5.4 percent in 2025, and the agency s estimate of the natural rate of unemployment falls from 5.3 percent to 5.2 percent over the same period. The labor force participation rate is expected to fall as well, from about 62 percent in 2020 to about 61 percent in The decline in the estimated natural rate of unemployment over the period reflects the diminishing effect of structural factors associated with the extraordinary increase in long-term unemployment namely, the stigma of being unemployed for a long time and the erosion of skills that can occur. After contributing 0.5 percentage points to the natural rate in 2014, those factors are projected to contribute 0.3 percentage points at the beginning of 2020 and 0.2 percentage points in The projected difference of roughly one-quarter of one percentage point between the unemployment rate and the natural rate during the period is not based on a forecast of particular cyclical movements in the economy. Rather, it is based on s estimate that the unemployment rate has been roughly that much higher than the natural rate, on average, over the 50-year period ending in The difference between the projections of the unemployment rate and the natural rate over the period corresponds to the projected gap between output and potential output that was discussed above. s projection of the labor force participation rate in 2025 approximately 61 percent is about 1 percentage point lower than the rate that it projects for 2020 and 5¼ percentage points lower than that rate at the end of 15. See John Fernald, Productivity and Potential Output Before, During, and After the Great Recession, Working Paper (National Bureau of Economic Research, June 2014), Specifically, that has been the average difference between the unemployment rate and s estimate of the natural rate between 1961 and The average difference was larger during more recent periods: about three-quarters of one percentage point between 1973 and 2009 and about 1 percentage point between 1973 and Most of the projected decline between 2007 and 2025 can be attributed to long-term trends, especially the aging of the population, estimates. The remainder stems from the reduction in some people s incentive to work resulting from the ACA and the structure of the tax code and from the permanent withdrawal of some workers from the labor force in response to the recession and slow recovery. Inflation In s projections, inflation as measured by the PCE price index and the core PCE price index averages 2.0 percent annually during the period; that rate is consistent with the Federal Reserve s longer-term goal. As measured by the CPI-U and the core CPI-U, projected inflation is higher during that period, at 2.4 percent and 2.3 percent, respectively. (Differences in the ways that the two price indexes are calculated make the CPI-U grow faster than the PCE price index, on average.) Interest Rates projects that the interest rates on 3-month Treasury bills and 10-year Treasury notes will be 3.4 percent and 4.6 percent, respectively, from 2020 through expects the federal funds rate to be 3.7 percent during that period. After being adjusted for inflation as measured by the CPI-U, the projected real interest rate on 10-year Treasury notes equals 2.2 percent between 2020 and That would be well above the current real rate, but roughly three-quarters of a percentage point below the average real rate between 1990 and 2007, a period that uses for comparison because it featured fairly stable expectations for inflation and no significant financial crises or severe economic downturns. According to s analysis, a number of factors will act to push down real interest rates on Treasury securities relative to their earlier average: slower growth of the labor force (which reduces the return on capital), slightly slower growth of productivity (which also reduces the return on capital), a greater share of total income going to high-income households (which tends to increase saving), and a higher risk premium on risky assets (which increases the relative demand for risk-free Treasury securities, boosting their prices and thereby lowering their interest rates). Other factors will act to raise real interest rates relative to their earlier average: a larger amount of federal debt as a percentage of GDP (which increases the relative supply of
58 CHAPTER TWO THE BUDGET AND ECONOMIC OUTLOOK: 2015 TO Treasury securities), smaller net inflows of capital from other countries as a percentage of GDP (which reduces the supply of funds available for borrowing), a smaller number of workers in their prime saving years relative to the number of older people drawing down their savings (which tends to decrease saving and thus also reduces the supply of funds available for borrowing), and a higher share of income going to capital (which increases the return on capital assets with which Treasury securities compete). expects that, on balance, those factors will result in real interest rates on Treasury securities that are lower than those between 1990 and Figure Labor Income Percentage of Gross Domestic Income Actual Projected Projections of Income Economic activity and federal tax revenues depend not only on the amount of total income in the economy but also on how that income is divided among its constituent parts: labor income, domestic economic profits, proprietors income, interest and dividend income, and other categories. 18 projects various categories of income by estimating their shares of gross domestic income (GDI). 19 Of the categories of income, the most important components of the tax base are labor income, especially wage and salary payments, and domestic corporate profits. In s projections, labor income grows faster than the other components of GDI over the next decade, increasing its share from an estimated 56.8 percent in 2014 to 58.3 percent in 2025 (see Figure 2-13). 20 The projected increase in labor income s share of GDI stems 17. For a more detailed discussion of the factors affecting interest rates in the future, see Congressional Budget Office, The 2014 Long- Term Budget Outlook (July 2014), pp , publication/ Domestic economic profits are corporations domestic profits adjusted to remove distortions in depreciation allowances caused by tax rules and to exclude the effects of inflation on the value of inventories. Domestic economic profits exclude certain income of U.S.-based multinational corporations that is derived from foreign sources, most of which does not generate corporate income tax receipts in the United States. 19. In principle, GDI equals GDP, because each dollar of production yields a dollar of income; in practice, they differ because of difficulties in measuring both quantities. GDP was about 1 percent smaller than GDI in 2014, but projects that GDP will grow slightly faster than GDI over the next decade, which will leave the gap between the two in 2025 equal to its long-run historical average Sources: Congressional Budget Office; Bureau of Economic Analysis. Notes: Labor income is defined as the sum of employees compensation and s estimate of the share of proprietors income that is attributable to labor. Gross domestic income is all income earned in the production of gross domestic product. For further discussion of the labor share of income, see Congressional Budget Office, How Projects Income (July 2013), publication/ Data are annual. Actual data are plotted through 2013; the value for 2014 is s estimate and does not incorporate data released by the Bureau of Economic Analysis since early December primarily from an expected pickup in the growth of real hourly labor compensation, which will result from strengthening demand for labor. However, expects some factors that have depressed labor income s share of GDI in recent years to continue during the coming decade, preventing that share from reaching its average of nearly 60 percent. In particular, globalization has tended to move the production of laborintensive goods and services to locations where labor costs 20. defines labor income as the sum of employees compensation and a percentage of proprietors income. That percentage is employees compensation as a share of the difference between GDI and proprietors income. For further discussion of labor income s share of GDI, see Congressional Budget Office, How Projects Income (July 2013),
59 52 THE BUDGET AND ECONOMIC OUTLOOK: 2015 TO 2025 JANUARY 2015 are lower, and technological change appears to have made it easier for employers to substitute capital for labor. In s projections, domestic economic profits fall from 9.8 percent of GDI in 2014 to 7.8 percent in That decline occurs largely because of two factors: the pickup in the growth of labor compensation and a projected increase in corporate interest payments, the result of rising interest rates. Some Uncertainties in the Economic Outlook Significant uncertainty surrounds s economic forecast which the agency constructed to be in the middle of the distribution of possible outcomes, given the federal fiscal policies embodied in current law. But even if no significant changes are made to those policies, economic outcomes will undoubtedly differ from s projections. Many developments such as unforeseen changes in the housing market, the labor market, business confidence, and international conditions could cause economic growth and other variables to differ substantially from what has projected. 21 The agency s current forecast of employment and output from 2015 through 2019 may be too pessimistic. For example, if firms responded to the expected increase in overall demand for goods and services with more robust hiring than anticipates, the unemployment rate could fall more sharply than projects. In addition, a greater-than-expected easing of borrowing constraints in mortgage markets could support stronger residential investment, accelerating the housing market s recovery and further boosting house prices. Households increased wealth could then buttress consumer spending, raising GDP. Alternatively, s forecast for the next five years may be too optimistic. For instance, if investment by businesses rose less than projects, production would 21. The inherent uncertainty underlying economic forecasts will be discussed in Congressional Budget Office, s Economic Forecasting Record: 2015 Update (forthcoming). regularly evaluates the quality of its economic forecasts by comparing them with the economy s actual performance and with forecasts by the Administration and the Blue Chip consensus. Such comparisons indicate the extent to which imperfect information and analysis factors that affect all forecasters might have caused to misread patterns and turning points in the economy. also rise more slowly, and hiring would probably be weaker as well. That outcome could restrain consumer spending, which would reinforce the weakness in business investment. An unexpected worsening in international political or economic conditions could likewise weaken the U.S. economy by disrupting the international financial system, interfering with international trade, and reducing business and consumer confidence. In addition, because oil prices are set in international markets, disruptions to foreign oil production could affect U.S. energy prices. A number of factors that will determine the economy s output later in the coming decade are also uncertain. For example, the economy could grow considerably faster than forecasts if the labor force grew more quickly than expected (say, because older workers chose to stay in the labor force longer than expected), business investment was stronger, or productivity grew more rapidly. Similarly, lower-than-expected growth would occur if the stigma and erosion of skills that stem from elevated longterm unemployment dissipate more slowly than projects, because then growth in the number of hours worked would be smaller (if all other factors were held equal), which would in turn lead to less business investment. Comparison With s August 2014 Projections s current economic projections differ somewhat from the projections that it issued in August 2014 (see Table 2-3). For the period from 2014 through 2018 the first period examined in that report real GDP is now expected to grow by 2.5 percent annually, on average, which is about 0.2 percentage points less than projected at the time. Because projected growth from 2019 through 2024 is almost unchanged, on average, the change in the earlier period means that real GDP is now projected to be roughly 1 percent lower in 2024 than the agency projected in August. The projected unemployment rate is also slightly lower in s current forecast than it was in its August forecast, as are interest rates after s projection of inflation in 2015 is currently lower than it was in August, but its projection of inflation in later years is roughly unchanged. Output Although real GDP grew faster than expected in 2014 and was about one-half of one percent higher at the end
60 CHAPTER TWO THE BUDGET AND ECONOMIC OUTLOOK: 2015 TO Table 2-3. Comparison of s Current and Previous Economic Projections for Calendar Years 2014 to 2024 Estimated, Forecast Projected Annual Average Percentage Change From Fourth Quarter to Fourth Quarter Real (Inflation-adjusted) GDP January August Nominal GDP January August PCE Price Index January August Core PCE Price Index a January August Consumer Price Index b January c August Core Consumer Price Index a January c August GDP Price Index January August Employment Cost Index d January August Real Potential GDP January August Calendar Year Average Unemployment Rate (Percent) January c August Interest Rates (Percent) Three-month Treasury bills January 2015 * c August Ten-year Treasury notes January c August Tax Bases (Percentage of GDP) Wages and salaries January August Domestic economic profits January August Sources: Congressional Budget Office; Bureau of Labor Statistics; Federal Reserve. Notes: Estimated values for 2014 do not reflect the values for GDP and related series released by the Bureau of Economic Analysis since early December GDP = gross domestic product; PCE = personal consumption expenditures; * = between zero and 0.05 percent. a. Excludes prices for food and energy. b. The consumer price index for all urban consumers. c. Actual value for d. The employment cost index for wages and salaries of workers in private industries.
61 54 THE BUDGET AND ECONOMIC OUTLOOK: 2015 TO 2025 JANUARY 2015 of the year than anticipated in August, has revised downward its projection of real GDP after Specifically, the agency projected in August that real GDP would increase at an average annual pace of 2.7 percent in 2014 through 2018; it now projects an average 2.5 percent rate. The primary reason for that change is that the agency has reduced its estimate of potential output. The revision to potential output mainly results from s reassessment of the growth in potential TFP in the nonfarm business sector since In s previous projection, that measure of productivity grew by 1.2 percent per year, on average, from 2007 through 2014 one-tenth of a percentage point below the pace that estimated for the trend (excluding the effects of a temporary surge in the early 2000s) because of a small estimated effect of the recession. However, now estimates that potential TFP slowed more significantly after 2007, growing by only 0.9 percent per year from 2008 to That revision to s estimate of potential TFP growth reduces the estimated growth of potential GDP between 2007 and 2014, and it lowers s estimate of the level of potential GDP in the fourth quarter of 2014 by about 1 percent. What prompted that change? In previous periods of cyclical weakness, actual TFP has generally been lower than potential TFP, and s August projection followed that pattern. But the growth of actual TFP in the past few years has persistently been lower than anticipated, so the gap between actual TFP and s previous estimate of potential TFP was widening even as other economic measures, such as the gap between the unemployment rate and the natural rate of unemployment, were improving. Consequently, now interprets more of the persistent weakness in actual TFP in the nonfarm business sector as reflecting weakness in potential TFP for the sector concluding that potential TFP grew more slowly from 2008 to 2014 than the agency had previously estimated. 22 That slowdown may have resulted from largerthan-anticipated effects of the factors that has repeatedly attributed to the economy s prolonged weakness: delayed reallocation of resources to their most productive uses, slower adoption of new skills and technologies, and curtailed spending on research and development. The slowdown may also reflect factors unrelated to the recession and weak recovery such as a reduction in the pace of innovation in industries that produce and use information technology, which may have begun before the recession. 23 Because the growth of potential TFP in the nonfarm business sector has been revised downward for the past six years and is nearly unrevised for the next decade, the estimated level of TFP in that sector is lower throughout the coming decade than it was in s August projections and therefore the estimated level of potential nonfarm business sector output is lower as well. As a result, has revised its projection of potential output in 2024 (the last year of the agency s August projection) downward by 1 percent, a revision similar to the one that the agency made for In the current projection, uses one trend in TFP for the business cycle and another for the following years through (In both cases, estimated trends after accounting for business cycle effects.) The agency s current approach yields a gap between actual TFP and estimated potential TFP that is roughly constant in recent years. views that gap as resulting largely from ongoing cyclical weakness in the economy. 23. See John Fernald, Productivity and Potential Output Before, During, and After the Great Recession, Working Paper (National Bureau of Economic Research, June 2014), Since 2007, has lowered its projection of potential output in 2017 the end of the projection period for the estimates made in 2007 by about 9 percent. (That comparison excludes the effects of changes that the Bureau of Economic Analysis made to the definition of GDP during its comprehensive revision of the national income and product accounts in 2013.) Calculating the degree to which different factors have contributed to that revision is very difficult and subject to considerable uncertainty. Nonetheless, estimates that reassessments of economic trends that had started before the recession began account for about one-half of the revision. For example, has concluded that rates of growth in potential labor hours in the 2000s were generally lower than they were in the 1990s and lower than the agency had estimated in its 2007 projection. The remainder of the revision to potential output is attributable to a number of factors that have each had a smaller effect. Those factors include the recession and weak recovery, revisions of historical data, changes in s methods for estimating potential output, revisions to estimated net flows of immigration based on analysis of recently released data, and the effect of higher federal debt in crowding out capital investment in the long term. For further discussion, see Congressional Budget Office, Revisions to s Projection of Potential Output Since 2007 (February 2014), pp. 8 11,
62 CHAPTER TWO THE BUDGET AND ECONOMIC OUTLOOK: 2015 TO has also revised downward its projection of average real GDP growth from 2014 through 2018 a revision that reflects primarily the downward revision to s estimate of potential GDP but also some recent economic developments, including the appreciation in the exchange value of the dollar. For the end of 2014, real GDP is revised upward by one-half of one percent, relative to s August projections. Coupling that upward revision with s 1 percent downward revision to potential output, estimates that the gap between actual and potential GDP at the end of 2014 currently estimated to be 2¼ percent is 1½ percentage points narrower than the agency projected in August. A narrower output gap suggests that there is less room for a strengthening economy to keep output growth above the growth rate of potential output without inducing a tightening of monetary policy to keep inflation from rising above the Federal Reserve s longer-term goal. As a result, now projects that output growth over the next few years will be modestly slower than in its previous projection (and that short-term interest rates will rise more rapidly). The Labor Market During the second half of 2014, employment rose (and the unemployment rate fell) more than anticipated, which led the agency to reduce its projection of the unemployment rate from 5.9 percent to 5.5 percent in 2015 and by smaller amounts in subsequent years. In addition, now expects the growth of nonfarm payroll employment to be about 50,000 jobs (per month, on average) greater this year, and about 30,000 jobs greater next year, than the agency projected in August. Recent evidence suggests better employment prospects for those currently outside the labor force than previously anticipated. Moreover, the stronger labor market in s current forecast suggests greater incentives for people to enter or remain in the labor force than in s previous forecast. As a result, the expected rate of labor force participation has been revised upward from 62.7 percent to 62.9 percent in 2015 and from 62.5 percent to 62.8 percent in also revised downward its projection of the natural rate of unemployment over the next decade by about one-quarter of a percentage point each year over the next few years and by about one-tenth of a percentage point in later years for two reasons. First, recent evidence about employment and wages suggests that reductions in the efficiency with which employers fill vacancies have been causing a smaller disruption to the labor market than previously estimated; thus, that effect is estimated to have dissipated by the end of 2014, more quickly than previously thought. Second, evidence about the propensity of the long-term unemployed to find jobs suggests that they experience somewhat less stigma and erosion of skills than previously estimated. 25 In particular, although the long-term unemployed tend to have considerably worse labor market outcomes than the short-term unemployed have, the difference now appears to be a little smaller than previously estimated. Further, revised upward its projection of the potential labor force participation rate over the next decade by 0.1 percentage point each year, on average. estimates that unusual aspects of the slow recovery of the labor market that have led workers to become discouraged and permanently drop out of the labor force are having a slightly smaller effect than the agency projected in August. now expects that fewer of the long-term unemployed will leave the labor force permanently, in light of the evidence that their labor market outcomes seem to differ less from those of the short-term unemployed than the agency previously estimated. In addition, evidence since 2013 shows a surprising uptick in the number of people moving directly from outside the labor force into employment, which suggests better employment prospects for those outside the labor force than anticipated. For the period from 2020 through 2025, revised its projections of the actual unemployment rate and the actual labor force participation rate to be consistent with its revisions to the natural rate of unemployment and the potential participation rate. The agency has done so because it projects (just as it did in August) that the unemployment rate and the participation rate will return to their historical relationships with the natural rate of unemployment and the potential participation rate. Interest Rates currently projects generally higher short-term interest rates and lower long-term interest rates during the 25. For examples, see Rob Dent and others, How Attached to the Labor Market Are the Long-Term Unemployed? (Federal Reserve Bank of New York, November 2014), and Rob Valletta, Long-Term Unemployment: What Do We Know? Economic Letter (Federal Reserve Bank of San Francisco, February 2013),
63 56 THE BUDGET AND ECONOMIC OUTLOOK: 2015 TO 2025 JANUARY period than it projected in August. Shortterm rates are projected to be higher, on average, because now estimates that there is less slack in the economy than the agency previously estimated, and therefore expects that the Federal Reserve will provide slightly less support for growth through its conduct of monetary policy over the next few years. The lower projection for longterm interest rates reflects s estimate that factors that have led to an unexpected decline in long-term rates (as the next paragraph explains) will persist over the next decade. s projections of short- and long-term interest rates between 2020 and 2025 are 0.1 percentage point lower than they were in August. Over the past six months, the outlook for growth among leading U.S. trading partners has unexpectedly deteriorated, which implies poorer investment opportunities in those countries and lower rates of return on assets in those countries. In addition, anticipates that foreign central banks will respond to slower-than-expected growth by maintaining slightly looser monetary policy than expected, which also lowers rates of return abroad. As a result of those factors, U.S. Treasury securities have become relatively more attractive to investors, a development that has put downward pressure on U.S. interest rates. Comparison With Other Economic Projections s projections of the growth of real GDP, the unemployment rate, inflation, and interest rates in 2015 and 2016 are generally very similar to the projections of the Blue Chip consensus published in January 2015 (see Figure 2-14). s forecast of the growth of real GDP matches that of the Blue Chip consensus for this year and is 0.1 percentage point faster for next year. s forecast of inflation, as measured by the CPI-U, is 0.1 percentage point higher than the Blue Chip consensus this year but does not differ from it next year. s projection for the unemployment rate is close to that of the Blue Chip consensus this year but is modestly higher next year. Finally, relative to the Blue Chip consensus for 2015 and 2016, s forecast for short-term interest rates is somewhat lower, while the forecast for long-term interest rates is similar. Similarly, s projections differ only slightly from the forecasts made by the Federal Reserve that were presented at the December 2014 meeting of the Federal Open Market Committee (see Figure 2-15). The Federal Reserve reports two sets of forecasts: a range (which reflects the highest and lowest forecasts of the members of the Board of Governors of the Federal Reserve System and of the presidents of the Federal Reserve Banks) and a central tendency (which excludes the range s three highest and three lowest projections). s projections of the growth of real GDP and inflation in 2015 and beyond are within the Federal Reserve s central tendencies. s projections of the unemployment rate in 2015 and beyond fall within the Federal Reserve s ranges but are at the high end of the central tendencies or slightly above them. s projections probably differ from those of the other forecasters at least partly because of varying assumptions about the government s future tax and spending policies. For example, s projections, which are based on current law, incorporate the effects of the recent retroactive extension through 2014 of certain provisions that reduce the tax liabilities of individuals and firms, but also reflect an assumption that those cuts will not be subsequently extended. Other forecasters might assume extensions of those tax cuts beyond Also, s projections might differ from those of the other forecasters because of differences in the economic news available when the forecasts were completed and differences in the economic and statistical models used.
64 CHAPTER TWO THE BUDGET AND ECONOMIC OUTLOOK: 2015 TO Figure Comparison of Economic Projections by and the Blue Chip Consensus Percent Growth of Real GDP Blue Chip Blue Chip Consumer Price Index Inflation a Blue Chip GDP Price Index Inflation Blue Chip Unemployment Rate b Blue Chip Interest Rate on Three-Month Treasury Bills b Blue Chip Interest Rate on Ten-Year Treasury Notes b Sources: Congressional Budget Office; Aspen Publishers, Blue Chip Economic Indicators (January 10, 2015). Notes: The Blue Chip consensus is the average of about 50 forecasts by private-sector economists. Real gross domestic product is the output of the economy adjusted to remove the effects of inflation. Growth of real GDP and inflation rates are measured from the fourth quarter of one calendar year to the fourth quarter of the next year. The unemployment rate is a measure of the number of jobless people who are available for work and are actively seeking jobs, expressed as a percentage of the labor force. GDP = gross domestic product. a. The consumer price index for all urban consumers. b. Rate in the fourth quarter.
65
66 CHAPTER 3 The Spending Outlook Under the provisions of current law, federal outlays in 2015 will total $3.7 trillion, the Congressional Budget Office estimates, roughly $150 billion (or 4.3 percent) more than the amount spent in They are projected to grow faster over the coming decade at an average annual rate of more than 5 percent and reach $6.1 trillion in All of the projected growth for 2015 is attributable to mandatory spending, which makes up about 60 percent of the federal budget and is projected to rise by nearly $160 billion, from $2.1 trillion last year to $2.3 trillion this year (see Table 3-1). In contrast, discretionary spending and the government s net interest payments are expected to change very little. Discretionary spending, which totaled $1.2 trillion in 2014, is projected to edge down by $4 billion in Net outlays for interest are expected to dip by $3 billion this year to $227 billion. (See Box 3-1 for descriptions of the three major types of federal spending.) All told, federal outlays in 2015 will equal 20.3 percent of gross domestic product (GDP), estimates, which is the same as last year s percentage and only slightly higher than the 20.1 percent that such spending has averaged over the past 50 years. But the mix of that spending has changed noticeably over time. Mandatory spending (net of the offsetting receipts credited against such spending) is expected to equal 12.5 percent of GDP in 2015, whereas over the period, it averaged 9.3 percent. Meanwhile, the other major components of federal spending have declined relative to GDP: Discretionary spending is anticipated to equal 6.5 percent of GDP this year, down from its 8.8 percent average over the past 50 years, and net outlays for interest are expected to be 1.3 percent of GDP, down from the 50-year average of 2.0 percent (see Figure 3-1 on page 62). In s baseline projections, outlays rise over the coming decade, reaching 22.3 percent of GDP in 2025, an increase of 2.0 percentage points. Mandatory spending is projected to contribute 1.7 percentage points to that increase a combination of rapid growth in spending for Social Security and the major health care programs and a drop, relative to GDP, in outlays for other mandatory programs. As interest rates return to more typical levels and debt continues to mount, net outlays for interest are also projected to increase significantly, contributing another 1.7 percentage points to the growth in outlays. However, discretionary spending, measured as a percentage of GDP, falls by 1.4 percentage points in s baseline projections. Specifically, s baseline for federal spending includes the following projections: Outlays for the largest federal program, Social Security, are expected to rise from 4.9 percent of GDP in 2015 to 5.7 percent in Federal outlays for major health care programs including Medicare, Medicaid, subsidies for health insurance purchased through exchanges and related spending, and the Children s Health Insurance Program (CHIP) are projected to increase more rapidly than outlays for Social Security, growing from 5.1 percent of GDP (net of premium payments and other offsetting receipts for Medicare) in 2015 to 6.2 percent in Outlays for all other mandatory programs (net of other offsetting receipts) are expected to decline from 2.5 percent of GDP in 2015 to 2.3 percent in Discretionary spending relative to the size of the economy is projected to fall by more than 20 percent over the next 10 years, from 6.5 percent of GDP in 2015 to 5.1 percent in Net interest payments are projected to more than double, rising from 1.3 percent of GDP in 2015 to 3.0 percent in 2025.
67 60 THE BUDGET AND ECONOMIC OUTLOOK: 2015 TO 2025 JANUARY 2015 Table 3-1. Outlays Projected in s Baseline Mandatory Social Security Medicare Medicaid Other spending Offsetting receipts Subtotal Discretionary Defense Nondefense Subtotal Total Actual, In Billions of Dollars ,032 1,096 1,165 1,237 1,313 1,392 1,476 1,564 5,185 12, ,021 1,052 1,175 3,645 8, ,029 4, ,855 8, ,241-2,835 2,096 2,255 2,475 2,563 2,653 2,816 2,968 3,137 3,363 3,486 3,616 3,891 13,474 30, ,025 6, ,995 6,288 1,179 1,175 1,176 1,182 1,193 1,221 1,248 1,276 1,310 1,336 1,361 1,400 6,019 12,701 Net interest Total Outlays ,046 5,643 3,504 3,656 3,926 4,076 4,255 4,517 4,765 5,018 5,337 5,544 5,754 6,117 21,540 49,310 On-budget 2,798 2,914 3,143 3,244 3,366 3,570 3,752 3,938 4,185 4,314 4,441 4,715 17,075 38,667 Off-budget a ,012 1,080 1,152 1,230 1,313 1,402 4,465 10,643 Memorandum: Gross Domestic Product 17,251 18,016 18,832 19,701 20,558 21,404 22,315 23,271 24,261 25,287 26,352 27, , ,438 Mandatory Social Security Medicare Medicaid Other spending Offsetting receipts Subtotal Discretionary Defense Nondefense Subtotal As a Percentage of Gross Domestic Product Net interest Total Outlays On-budget Off-budget a Source: Congressional Budget Office. a. Off-budget outlays stem from transactions related to the Social Security trust funds and the net cash flow of the Postal Service.
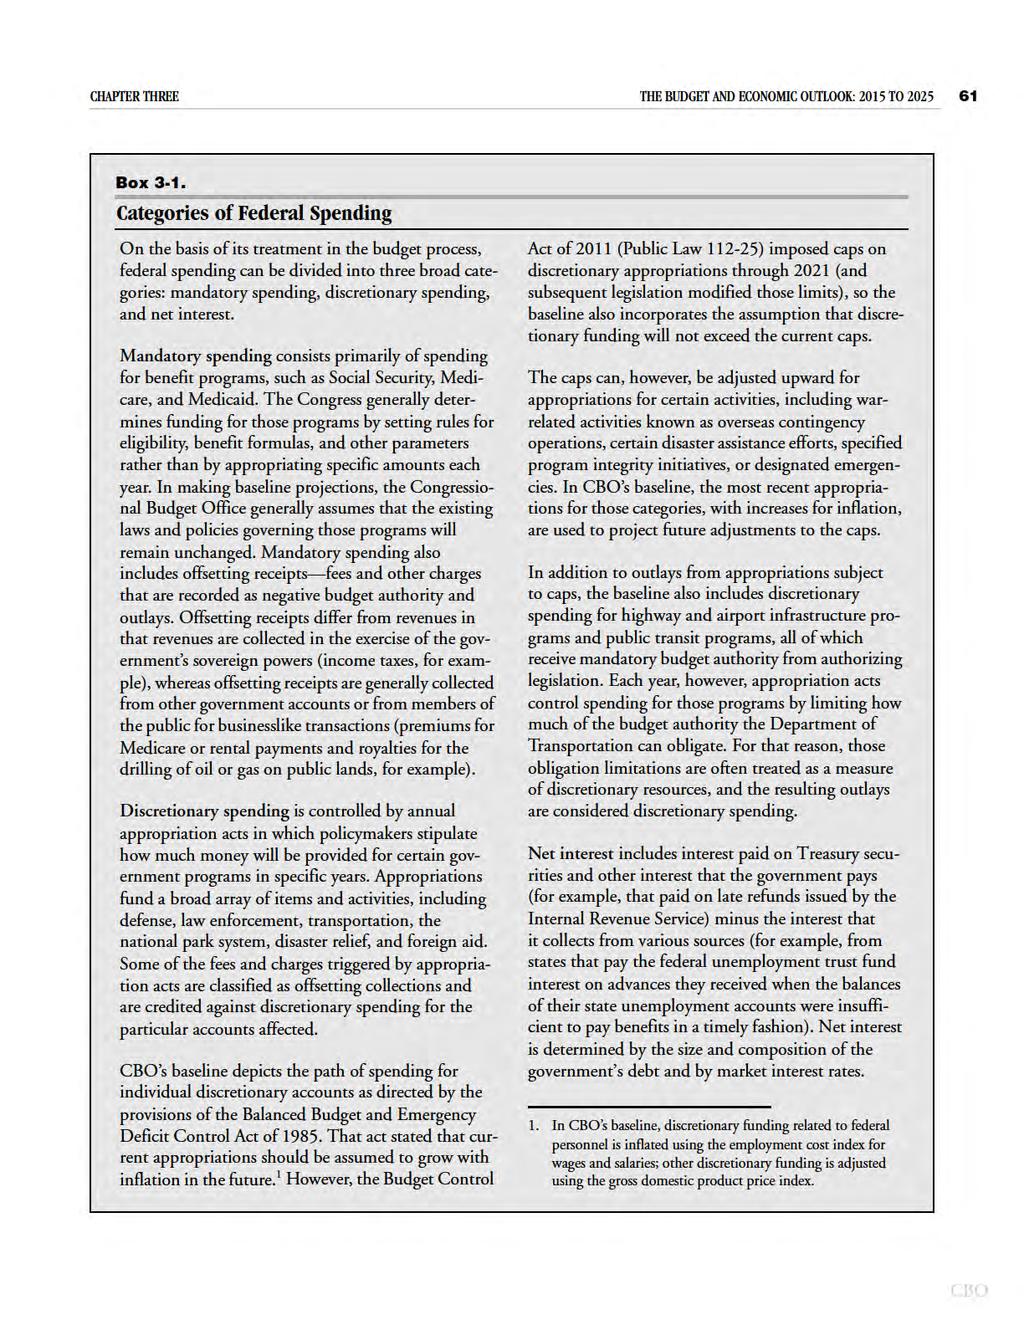
68
69 62 THE BUDGET AND ECONOMIC OUTLOOK: 2015 TO 2025 JANUARY 2015 Figure 3-1. Outlays, by Type of Spending Percentage of Gross Domestic Product Actual Projected Mandatory 14.2 Under current law, rising spending for Social Security and the major health care programs will boost mandatory outlays. 8 4 Discretionary Net Interest Total discretionary spending is projected to fall relative to GDP as funding grows modestly in nominal terms. At the same time, higher interest rates and growing debt will push up net interest payments. Source: Congressional Budget Office. In developing its baseline projections, generally assumes, in accordance with the rules established by the Balanced Budget and Emergency Deficit Control Act of 1985, that the provisions of current law governing federal taxes and spending will remain unchanged. Therefore, when projecting spending for mandatory programs, assumes that existing laws will not be altered and that future outlays will depend on changes in caseloads, benefit costs, economic variables, and other factors. When projecting spending for discretionary programs, assumes that most discretionary appropriations provided between 2016 and 2021 will be constrained by the statutory caps and other provisions of the Budget Control Act of 2011 (Public Law ) and that thereafter appropriations in a given year will equal those in the prior year with an adjustment for inflation. 1 Mandatory Spending Mandatory or direct spending includes spending for benefit programs and certain other payments to people, businesses, nonprofit institutions, and state and local governments. It is generally governed by statutory criteria and is not normally constrained by the annual appropriation process. 2 Certain types of payments that federal agencies receive from the public and from other government agencies are classified as offsetting receipts and reduce gross mandatory spending. Total mandatory spending amounted to 12.2 percent of GDP in That figure is lower than the 13.1 percent such spending averaged over the previous five years but higher than the 10.3 percent of GDP it averaged in the five years before the most recent recession. Over the next 10 years, however, the aging of the population, the expansion of health insurance subsidies, and the rising per-beneficiary cost of health care will boost spending for 1. Appropriations for certain activities overseas contingency operations, activities designated as emergency requirements, disaster relief, and initiatives designed to enhance program integrity by reducing overpayments in certain benefit programs are not constrained by the caps and are assumed to grow with inflation from the amounts provided in (Overseas contingency operations refer to military operations and related activities in Afghanistan and elsewhere.) 2. Each year, some mandatory programs are modified by provisions contained in annual appropriation acts. Such changes may decrease or increase spending for the affected programs for either a single year or multiple years. Provisions of the Deficit Control Act and the Balanced Budget Act of 1997 govern how projects spending for mandatory programs whose authorizations are scheduled to expire under current law, some of which are assumed to continue.
70 CHAPTER THREE THE BUDGET AND ECONOMIC OUTLOOK: 2015 TO federal programs that serve the elderly and subsidize health care. As a result, mandatory spending will be higher as a share of GDP throughout the coming decade than it was in 2014, projects. Mandatory spending will jump by nearly 8 percent in 2015, to $2.3 trillion (or 12.5 percent of GDP), estimates, if no additional laws are enacted that affect such spending this year. The major contributors to that growth include outlays for Medicaid, subsidies for health insurance purchased through exchanges, and the government s transactions with Fannie Mae and Freddie Mac. Some of that growth in spending will be offset by receipts from auctions of portions of the electromagnetic spectrum, which are expected to bring in more than $40 billion to the federal government this year. Over the next 10 years, mandatory spending is projected to rise at an average rate of close to 6 percent per year, reaching $3.9 trillion, or 14.2 percent of GDP, in 2025 (see Table 3-2). By comparison, mandatory spending has averaged 11.9 percent of GDP over the past 10 years and 9.3 percent over the past 50 years. At $1.8 trillion in 2015, federal outlays for Social Security combined with those for Medicare, Medicaid, and other major health care programs will make up roughly half of all federal outlays and 80 percent of mandatory spending (net of offsetting receipts). Under current law, projects, spending for those programs will increase at an average annual rate of 6 percent over the period and will total $3.3 trillion in By that year, spending for Social Security and the major health care programs will have risen from 10.0 percent of GDP in 2015 to 11.9 percent of GDP. In contrast, other mandatory spending relative to GDP is projected to decline slightly. After Social Security and the major health care programs, the next largest set of mandatory programs consists of several that are designed to provide income security. Those programs including certain refundable tax credits, the Supplemental Nutrition Assistance Program (SNAP), Supplemental Security Income (SSI), and unemployment compensation will account for $307 billion, or 1.7 percent of GDP, in 2015, by s estimate. 3 Those programs, in total, are projected to grow by an average of only 1.5 percent per year; declining outlays for refundable tax credits and for SNAP contribute to that slow rate of growth. As a result, by 2025 outlays for mandatory income security programs are projected to shrink to 1.3 percent of GDP. Other mandatory spending programs include retirement benefits for federal civilian and military employees, certain benefits for veterans, student loans, and support for agriculture. Under current law, projects, outlays for all of those other programs will grow at an average annual rate of 2.5 percent from 2015 through 2025, causing such spending to slide from 1.8 percent of GDP in 2015 to 1.5 percent of GDP in (Civilian and military retirement benefits account for roughly half of those amounts.) estimates that offsetting receipts (other than those for Medicare) will reduce mandatory outlays by 1.0 percent of GDP in 2015 and by an average of about 0.5 percent of GDP in ensuing years. Receipts from auctioning a portion of the electromagnetic spectrum have substantially boosted that total this year but are expected to have much smaller effects, on average, in later years. In addition, because of the way treats the activities of Fannie Mae and Freddie Mac in its baseline projections, offsetting receipts from those entities are not reflected beyond the current year. Social Security Social Security, which is the largest federal spending program, provides cash benefits to the elderly, to people with disabilities, and to their dependents and survivors. Social Security comprises two main parts: Old-Age and Survivors Insurance (OASI) and Disability Insurance (DI). Social Security outlays grew by about 5 percent in 2014 because of increases in caseloads and average benefits. estimates that, under current law, outlays for Social Security will total $883 billion, or 4.9 percent of GDP, in 2015 and will climb steadily (by an average of about 6 percent per year) over the next decade as the nation s elderly population grows and as average benefits rise. By 2025, estimates, Social Security outlays will total $1.6 trillion, or 5.7 percent of GDP, if current laws remain unchanged (see Figure 3-2 on page 66). 3. Tax credits reduce a taxpayer s overall income tax liability; if a refundable credit exceeds a taxpayer s other income tax liabilities, all or a portion of the excess (depending on the particular credit) is refunded to the taxpayer, and that payment is recorded as an outlay in the budget.
71 64 THE BUDGET AND ECONOMIC OUTLOOK: 2015 TO 2025 JANUARY 2015 Table 3-2. Mandatory Outlays Projected in s Baseline Billions of Dollars Total Actual, Social Security Old-Age and Survivors Insurance ,058 1,124 1,195 1,269 1,347 4,387 10,379 Disability Insurance ,788 Subtotal ,032 1,096 1,165 1,237 1,313 1,392 1,476 1,564 5,185 12,167 Major Health Care Programs Medicare a ,021 1,052 1,175 3,645 8,765 Medicaid ,029 4,686 Exchange subsidies and related spending b ,104 Children's Health Insurance Program Subtotal a 926 1,012 1,111 1,163 1,210 1,312 1,394 1,485 1,617 1,682 1,744 1,900 6,190 14,617 Income Security Programs Earned income, child, and other tax credits c Supplemental Nutrition Assistance Program Supplemental Security Income Unemployment compensation Family support and foster care d Child nutrition Subtotal ,575 3,269 Federal Civilian and Military Retirement Civilian e ,145 Military Other Subtotal ,878 Veterans' Programs f Income security Other Subtotal ,035 Other Programs Agriculture MERHCF Deposit insurance Fannie Mae and Freddie Mac g Higher education Other Subtotal Continued Old-Age and Survivors Insurance. OASI, the larger of Social Security s two components, pays full benefits to workers who start collecting them at a specified full retirement age that depends on a worker s year of birth. (Full retirement age is defined as age 66 for those born before 1955 and increases incrementally for those born in 1955 and later years, reaching age 67 for those born in 1960 or later.) Workers can, however, choose to start collecting reduced benefits as early as age 62. The program also makes payments to eligible spouses and children of deceased workers. OASI spending totaled $703 billion in 2014, accounting for more than 80 percent of Social Security s outlays.
72 CHAPTER THREE THE BUDGET AND ECONOMIC OUTLOOK: 2015 TO Table 3-2. Mandatory Outlays Projected in s Baseline Continued Billions of Dollars Actual, Offsetting Receipts Medicare h ,487 Federal share of federal employees' retirement Social Security Military retirement Civil service retirement and other Subtotal Receipts related to natural resources MERHCF Fannie Mae and Freddie Mac g Other Subtotal ,241-2,835 Total Mandatory Outlays 2,096 2,255 2,475 2,563 2,653 2,816 2,968 3,137 3,363 3,486 3,616 3,891 13,474 30,967 Memorandum: Mandatory Spending Excluding the Effects of Offsetting Receipts 2,373 2,530 2,691 2,799 2,905 3,079 3,241 3,425 3,666 3,808 3,952 4,237 14,715 33,802 Spending for Medicare Net of Offsetting Receipts ,036 7,278 Spending for Major Health Care Programs Net of Offsetting Receipts i ,005 1,051 1,089 1,182 1,255 1,336 1,454 1,504 1,555 1,701 5,581 13,130 Source: Congressional Budget Office. Notes: Data on spending for benefit programs in this table generally exclude administrative costs, which are discretionary. MERHCF = Department of Defense Medicare-Eligible Retiree Health Care Fund (including TRICARE for Life). a. Gross spending, excluding the effects of Medicare premiums and other offsetting receipts. (Net Medicare spending is included in the memorandum section of the table.) b. Subsidies for health insurance purchased through exchanges established under the Affordable Care Act. c. Includes outlays for the American Opportunity Tax Credit and other credits. d. Includes the Temporary Assistance for Needy Families program, the Child Support Enforcement program, the Child Care Entitlement program, and other programs that benefit children. e. Includes Civil Service, Foreign Service, Coast Guard, and other, smaller retirement programs as well as annuitants health care benefits. f. Income security programs include veterans compensation, pensions, and life insurance programs. Other benefits are primarily education subsidies. Most of the costs of veterans health care are classified as discretionary spending and thus are not shown in this table. g. The cash payments from Fannie Mae and Freddie Mac to the Treasury are recorded as offsetting receipts in 2014 and Beginning in 2016, s estimates reflect the net lifetime costs that is, the subsidy costs adjusted for market risk of the guarantees that those entities will issue and of the loans that they will hold, counted as federal outlays in the year of issuance. h. Includes premium payments, recoveries of overpayments made to providers, and amounts paid by states from savings on Medicaid s prescription drug costs. i. Consists of outlays for Medicare (net of offsetting receipts), Medicaid, the Children s Health Insurance Program, and subsidies for health insurance purchased through exchanges and related spending.
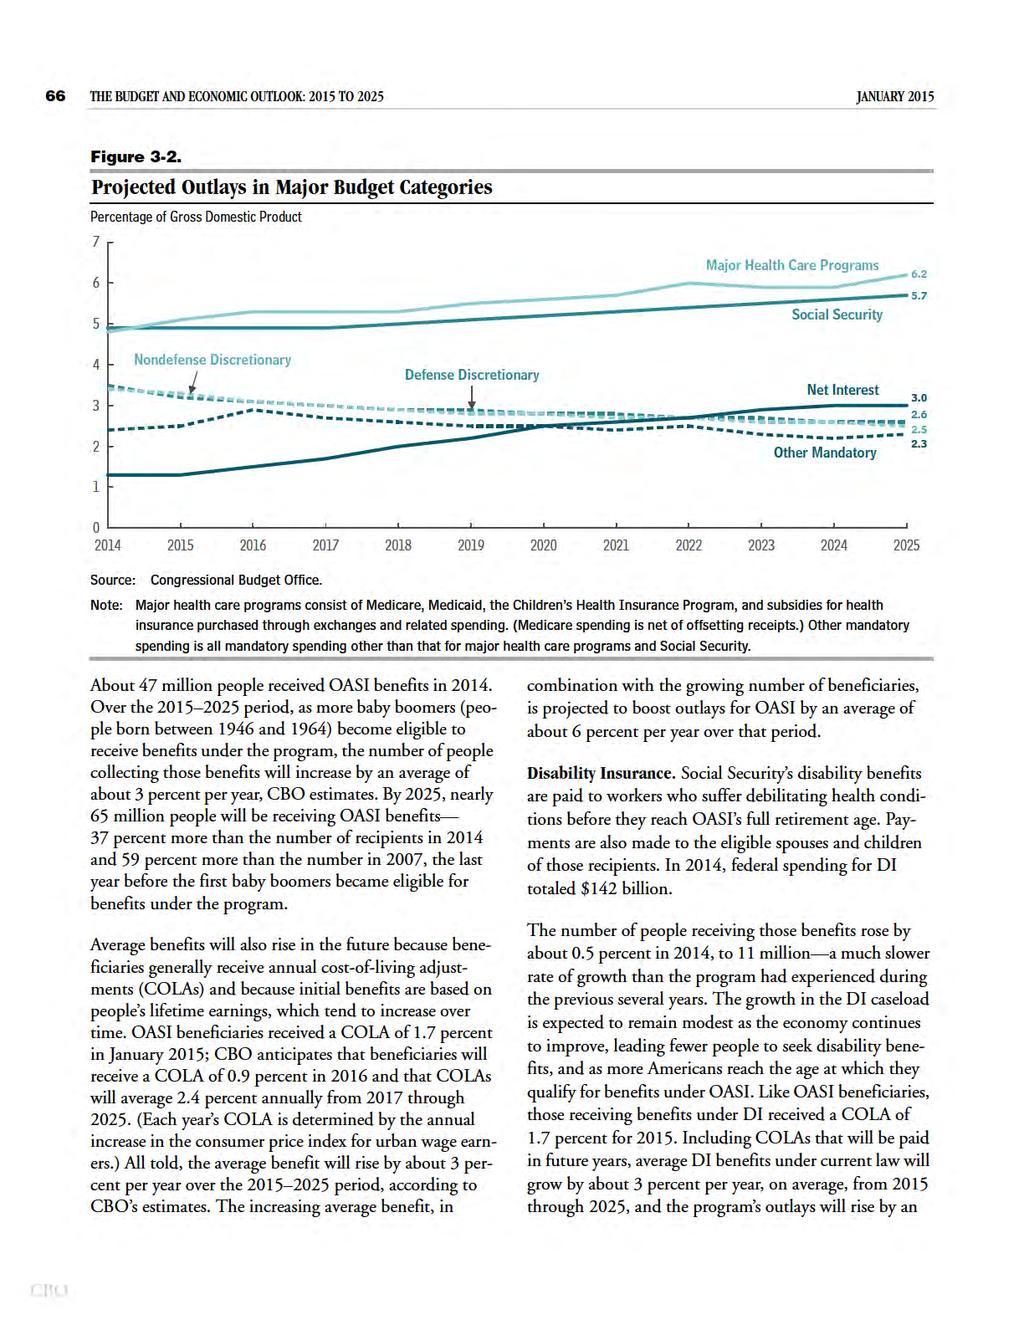
73
74 CHAPTER THREE THE BUDGET AND ECONOMIC OUTLOOK: 2015 TO average of about 4 percent annually during those years, estimates. projects that the balance of the DI trust fund will be exhausted during fiscal year After that time, additional revenues will continue to be credited to the DI trust fund, but, in s estimation, the amounts will be insufficient to pay all of the benefits due. However, in keeping with the rules in section 257 of the Deficit Control Act, s baseline incorporates the assumption that full benefits will continue to be paid after the balance of the trust fund has been exhausted, although there will be no legal authority to make such payments in the absence of legislative action. Medicare, Medicaid, and Other Major Health Care Programs At $926 billion in 2014, gross federal outlays for Medicare, Medicaid, and other major programs related to health care accounted for 39 percent of gross mandatory spending and equaled 5.4 percent of GDP. (Those amounts do not reflect the income received by the government from premiums paid by Medicare beneficiaries or from other offsetting receipts.) Under current law, estimates, gross federal outlays for those programs will jump to $1.0 trillion, or 5.6 percent of GDP, in In s baseline projections, that spending grows robustly at an average rate of nearly 7 percent per year and thus nearly doubles between 2015 and 2025, reaching $1.9 trillion, or 6.8 percent of GDP, by the end of that period. Medicare. Medicare provides subsidized medical insurance to the elderly and to some people with disabilities. The program has three principal components: Part A (Hospital Insurance), Part B (Medical Insurance, which covers doctors services, outpatient care, home health services, and other medical services), and Part D (which covers outpatient prescription drugs). 4 People generally become eligible for Medicare at age 65 or two years after they qualify for Social Security disability benefits. Gross spending for Medicare will total $622 billion in 2015, estimates, or 3.5 percent of GDP, the same 4. Medicare Part C (known as Medicare Advantage) specifies the rules under which private health care plans can assume responsibility for, and be compensated for, providing benefits covered under Parts A, B, and D. share as in By 2025, the program s spending will reach nearly $1.2 trillion, or 4.3 percent of GDP, if current laws remain in place. Medicare also collects substantial offsetting receipts mostly in the form of premiums paid by beneficiaries which, in s baseline projections, rise from $99 billion in 2015 to $199 billion in (See Offsetting Receipts on page 74.) Under current law, spending for Medicare net of those offsetting receipts will be 2.9 percent of GDP in 2015 and 3.6 percent in 2025, estimates. Spending for Medicare (not including offsetting receipts) is expected to grow by an average of nearly 7 percent per year over the next 10 years under current law. About 60 percent of that growth results from higher costs per beneficiary; the rest stems from an increasing number of beneficiaries. projects that Medicare caseloads will expand at an average rate of 3 percent per year as growing numbers of baby boomers turn 65 and become eligible for benefits. In 2014, Medicare had about 54 million beneficiaries; that number is expected to climb to 73 million in projects that, under current law, nominal spending per beneficiary will grow at an average rate of 4 percent per year over the coming decade much more slowly than it has grown historically. After adjusting for inflation (as measured by the price index for personal consumption expenditures), Medicare spending per beneficiary is expected to increase at an average annual rate of 1.2 percent between 2015 and 2025, whereas it averaged real annual growth of 4 percent between 1985 and 2007 (excluding the jump in spending that occurred in 2006 with the implementation of Part D). The comparatively slow growth in per-beneficiary spending that projects for the next decade results from a combination of factors. One of those factors is the anticipated influx of new beneficiaries, which will bring down the average age of Medicare beneficiaries and therefore, holding all else equal, reduce average health care costs per beneficiary because younger beneficiaries tend to use fewer health care services. A second factor is the slowdown in the growth of Medicare spending across all types of services, beneficiaries, and major geographic regions in recent years. Although the reasons for that slower growth are not yet
75 68 THE BUDGET AND ECONOMIC OUTLOOK: 2015 TO 2025 JANUARY 2015 entirely clear, projects that the slowdown will persist for some years to come. 5 For example, since March 2010, has reduced its projection of Medicare outlays in 2020 (the last year included in the March 2010 projection) by $122 billion, or about 14 percent, based on subsequent analysis by its staff and other analysts of data on Medicare spending. ( has also made revisions to its projections for Medicare spending in response to legislative action and revisions to the economic outlook.) A third factor that contributes to the slow projected growth in Medicare spending per beneficiary over the next decade is the constraints on service payment rates that are built into current law: Payment rates for physicians services are set according to the sustainable growth rate mechanism (SGR). 6 Under current law, payment rates for those services will be reduced by 21 percent in April 2015 and raised or lowered by small amounts in subsequent years, so incorporates those changes into its projections. If, however, future legislation overrides the scheduled reductions (as has happened in every year since 2003), spending for Medicare will be greater than the amount that is projected in s baseline. For example, if payment rates for physicians services remained at the current level from April 2015 through 2025, estimates that net Medicare outlays through 2025 would be $137 billion (or roughly 2 percent) higher than in its baseline projections. If those payment rates were increased over time, the effect on Medicare outlays would be even greater. Payments to other types of providers are limited by provisions of the Affordable Care Act (ACA) that 5. See Michael Levine and Melinda Buntin, Why Has Growth in Spending for Medicare Fee-for-Service Slowed? Working Paper (Congressional Budget Office, August 2013), That analysis reviews the observed slowdown in growth in Medicare spending between the and periods. It suggests that demand for health care by Medicare beneficiaries was not measurably diminished by the financial turmoil and recession and that, instead, much of the slowdown in spending growth was caused by other factors affecting beneficiaries demand for care and by changes in providers behavior. 6. The SGR was enacted as part of the Balanced Budget Act of 1997 as a method for controlling spending by Medicare on physicians services. hold annual increases in payment rates for Medicare services (apart from those provided by physicians) to about 1 percentage point less than inflation. Under s economic projections, those payment rates are expected to increase by about 1 percent per year on average. Payments to Medicare providers will also be affected especially later in the coming decade by a provision originally enacted in the Budget Control Act of 2011 and extended by subsequent laws that reduces payment rates for most Medicare services by 2.0 percent through March 2023 and then by varying amounts over the next year and a half: by 2.9 percent through September 2023, then by 1.1 percent through March 2024, and then by 4.0 percent through September Despite the relatively slow growth in per-beneficiary Medicare spending projected over the next 10 years, net federal spending per beneficiary for Parts A and B is projected to grow by 38 percent. Net federal spending per beneficiary for Part D, which accounts for a small share of total Medicare spending, is projected to grow much more by 77 percent largely because of rising drug costs combined with provisions in the ACA that expand the extent of coverage for some prescription drugs. Medicaid. Medicaid is a joint federal and state program that funds medical care for certain low-income, elderly, and disabled people. The federal government shares costs for approved services, as well as administrative costs, with states; the federal share varies from state to state but averaged about 57 percent in most years prior to (During some economic downturns, the federal government s share has temporarily increased.) Beginning in January 2014, the ACA gave states the option of expanding eligibility for their Medicaid programs to people with income at or below 138 percent of the federal poverty guidelines. In 2014, 27 states and the District of Columbia expanded their programs. The federal government pays a greater share of the costs incurred by enrollees who were made eligible for Medicaid in those states than it does for traditional enrollees: The federal share for those newly eligible enrollees is 100 percent from 2014 through 2016 and declines thereafter, falling
76 CHAPTER THREE THE BUDGET AND ECONOMIC OUTLOOK: 2015 TO to 90 percent in (See Appendix B for more information on the insurance coverage provisions of the ACA.) Federal outlays for Medicaid totaled $301 billion in 2014, 14 percent more than 2013 spending for the program. estimates that slightly more than half of that increase resulted from enrollment of people who were newly eligible because of the ACA and from the greater share of costs paid by the federal government for those new enrollees. Provisions of the ACA also led to increased enrollment of individuals who were previously eligible for Medicaid. cannot, however, precisely determine the total share of growth between 2013 and 2014 resulting from the ACA because there is no way to know whether new enrollees who would have been eligible in the absence of the ACA would have signed up had it not been enacted. projects that, under current law, federal spending for Medicaid will jump by an additional 11 percent this year as more people in states that have already expanded Medicaid eligibility enroll in the program and as more states expand eligibility. The number of people enrolled in Medicaid on an average monthly basis is expected to rise from 63 million in 2014 to 66 million in anticipates that, by 2020, 80 percent of the people who meet the new eligibility criteria will live in states that have extended Medicaid coverage and that enrollment in Medicaid will be 75 million. From 2016 to 2025, growth in federal spending for Medicaid is projected to increase at about the same rate of growth that such spending averaged over the past 10 years about 6 percent annually. By 2025, about 78 million people will be enrolled in Medicaid on an average monthly basis, projects. In that year, federal outlays for Medicaid are, under current law, projected to total $588 billion, or about 2.1 percent of GDP, up from 1.9 percent of GDP in Exchange Subsidies and Related Spending. Individuals and families can now purchase private health insurance coverage through marketplaces known as exchanges that are operated by the federal government, by state 7. Taking into account the enhanced federal matching rates for populations made eligible under the ACA, the average federal share of spending for Medicaid is expected to be between 60 percent and 62 percent in 2015 and later years. governments, or through a partnership between federal and state governments. (See Appendix B for more information on the insurance coverage provisions of the ACA.) Subsidies of purchases made through those exchanges fall into two categories: subsidies to cover a portion of participants health insurance premiums, and subsidies to reduce their cost-sharing amounts (out-ofpocket payments required under insurance policies). Related spending consists of grants to states for establishing health insurance exchanges and outlays for risk adjustment and reinsurance. 8 Outlays for those exchange subsidies and related spending are expected to rise from $15 billion last year to $45 billion in 2015, to $71 billion in 2016, and to $131 billion by Exchange subsidies make up the largest portion of that spending: Outlays are projected to total $28 billion in 2015 (up from $13 billion in 2014) and to reach $112 billion by (A portion of the subsidies for health insurance premiums will be provided in the form of reductions in recipients tax payments.) 9 In 2014, estimates, an average of 5 million people per month received subsidies through the exchanges. and the staff of the Joint Committee on Taxation project that about 9 million people will receive such subsidies in 2015 and that the number will grow to roughly 16 million in 2016 and to between 17 million and 19 million in each year from 2017 to (Other people who will not be eligible for subsidies are also expected to purchase health insurance coverage through the exchanges.) 8. previously anticipated that the transactions of the risk corridor program created by the ACA, which reduces risk for health insurers by partially offsetting high losses and sharing large profits, would be recorded in the budget as mandatory spending and revenues. However, the Administration plans to record the program s outflows as discretionary spending and inflows as offsetting collections to such spending, and will follow that treatment. That difference in classification reduces both mandatory spending and revenues in s baseline by the same amounts. In addition, because expects that the additional discretionary spending and offsetting collections will be of equal amounts in each year, the reclassification will have no net impact on discretionary spending. Consequently, it has no net effect on and the Joint Committee on Taxation s estimates of the effects of the ACA s insurance coverage provisions. 9. The subsidies for health insurance premiums are structured as refundable tax credits; the portions of such credits that exceed taxpayers other income tax liabilities are refunded to the taxpayer and classified as outlays, whereas the portions that reduce tax payments appear in the budget as reductions in revenues.
77 70 THE BUDGET AND ECONOMIC OUTLOOK: 2015 TO 2025 JANUARY 2015 estimates that outlays for grants to states for exchange operations will be about $1 billion in Because funds for new grants needed to be obligated by the end of 2014, spending of such grants is winding down. In s baseline, outlays associated with grants for operating state exchanges decline to zero by In accordance with the ACA, new programs requiring the federal government to make payments to health insurance plans for risk adjustment (amounts paid to plans that attract less healthy enrollees) and for reinsurance (amounts paid to plans that enroll individuals who end up with high costs) became effective in The two programs are intended to spread more widely either to other insurance plans or to the federal government some of the risk that health insurers face when selling health insurance through the new exchanges or in other individual or small group markets. Outlays for the two programs are expected to begin in 2015 and to total $16 billion in that year; over the period, projects, outlays for those programs will total $181 billion. Those payments will be offset by associated revenues. Under current law, the reinsurance program is authorized only for insurance issued through 2016 (although spending associated with the programs is expected to continue for an additional year), but the risk-adjustment program is permanent. Children s Health Insurance Program. The Children s Health Insurance Program provides health insurance coverage to children in families whose income, although modest, is too high for them to qualify for Medicaid. The program is jointly financed by the federal government and the states and is administered by the states within broad federal guidelines. Total federal spending for CHIP was approximately $9 billion in 2014 and is expected to rise to $10 billion in 2015 the last year for which funding is provided in law. Funding for CHIP in 2015 consists of two semiannual allotments of $2.85 billion much smaller amounts than were allotted in the four preceding years and $15.4 billion in onetime funding for the program, which will supplement the first allotment. Following the rules governing baseline projections, assumes in its baseline that funding for CHIP after 2015 is set at about $6 billion a year (that is, at the annualized rate of the second of the semiannual allotments for 2015). 10 Nevertheless, annual spending for CHIP is projected to reach $11 billion in 2016 because some of the funds allocated to states in previous years will be spent in that year; outlays are projected to fall to about $6 billion in 2017 and remain there in subsequent years. Nearly 6 million people will be enrolled in CHIP on an average monthly basis in 2015, estimates. Enrollment drops later in the decade in s baseline projections, mostly because funding is assumed to decline after Income-Security Programs The federal government makes various payments to people and government entities in order to assist the poor, the unemployed, and others in need. Federal spending for the refundable portions of the earned income tax credit (EITC), the child tax credit, certain other tax credits, SNAP, SSI, unemployment compensation, family support, foster care, and other services increased rapidly during the most recent recession, peaking in 2010 at $437 billion, or 3.0 percent of GDP. By 2014, such spending had dropped to $311 billion, or 1.8 percent of GDP. Under current law, spending on mandatory income-security programs is projected to decline slightly in 2015 and then to grow modestly. By 2025, outlays for those programs are anticipated to be $355 billion, or 1.3 percent of GDP. Earned Income, Child, and Other Tax Credits. Refundable tax credits reduce a filer s overall income tax liability; if the credit exceeds the rest of the filer s income tax liability, the government pays all or some portion of that excess to the taxpayer. Those payments including the ones made for the refundable portions of the EITC, the child tax credit, and the American Opportunity Tax Credit (AOTC) are categorized as outlays. The EITC is a fully refundable credit available primarily to people with earnings and income that fall below established maximums. The child tax credit is a partially refundable credit (limited to 15 percent of earnings over a predetermined threshold) available to qualifying families with dependent children. The AOTC allows certain individuals (including those who owe no taxes) to claim a credit for college expenses. Outlays for those credits totaled $86 billion in Such outlays are projected to reach $91 billion in 2018 before dropping to $75 billion in 2019, following the expiration, under current law, of the AOTC and of the temporary expansions in the child tax credit and EITC 10. Although s projections assume that $6 billion in funding will be provided for 2016 and subsequent years, if lawmakers provide no such funding, state programs will terminate in 2016.
78 CHAPTER THREE THE BUDGET AND ECONOMIC OUTLOOK: 2015 TO that were first enacted in 2009 and most recently extended in January Under current law, by 2025 outlays for refundable tax credits will total $82 billion, projects. Those tax credits also affect the budget, to a lesser extent, by reducing tax revenues. However, the portion of the refundable tax credit that reduces revenues is not reported separately in the federal budget. Supplemental Nutrition Assistance Program. Outlays for SNAP fell by 8 percent in 2014 to $76 billion after having risen each year since 2008, when the most recent recession began. estimates that the program s spending will rise modestly this year, to $78 billion, and that 46 million people will receive those benefits. expects that the number of people collecting SNAP benefits, which increased dramatically in the wake of the most recent recession, will gradually decline over the coming years. Average per-person benefits, however, will increase each year because of adjustments for inflation in prices for food. Based on the assumption that the program will be extended after it expires at the end of fiscal year 2018 (as provided in the rules governing baseline projections), projects that by 2025, 33 million people will be enrolled in SNAP and the program s outlays will total $75 billion. Supplemental Security Income. SSI provides cash benefits to people with low incomes who are elderly or disabled. Outlays for SSI rose by about 2 percent in 2014 to $54 billion. According to s estimates, spending for that program will increase at an average annual rate of close to 3 percent over the coming decade. In s projections, the number of beneficiaries for SSI edges up at an average annual rate of less than half a percent; most of the anticipated growth in spending for that program through 2025 stems from COLA increases. Under current law, spending for SSI benefits will be $72 billion in 2025, estimates. Unemployment Compensation. In 2014, outlays for unemployment compensation were $44 billion, about two-thirds of the amount spent in Such spending peaked at $159 billion in 2010, in part because of the exceptionally high unemployment rate and in part because of legislation that significantly expanded benefits for individuals who had been unemployed for long periods. The improving economy and the expiration of those temporary provisions at the end of December 2013 have reduced outlays considerably. If there are no changes to current law, outlays will drop again in 2015, estimates, to $35 billion, close to the amount spent in Over the next 10 years, outlays for unemployment compensation are projected to rise gradually, pushed up by growth in the labor force and wages (which serve as the basis for benefits). By 2025, projects, outlays for the program will, under current law, amount to $60 billion, or 0.2 percent of GDP. Family Support and Foster Care. Spending for family support programs grants to states that help fund welfare programs, foster care, child support enforcement, and the Child Care Entitlement is expected to remain close to last year s level, about $31 billion, in Spending for those programs is projected to rise only gradually through 2025, at an average annual rate of 1 percent. Funding for two major components of family support is capped: The regular Temporary Assistance to Needy Families (TANF) program is limited to roughly $17 billion annually (although some additional funding is available if states unemployment rates or SNAP caseloads exceed certain thresholds), and funding for the Child Care Entitlement is capped at just under $3 billion per year. Under current law, the regular TANF program and the Child Care Entitlement are funded only through the end of this fiscal year, but s baseline reflects the assumption (as specified in the Deficit Control Act) that such funding will continue throughout the projection period. Outlays for federal grants to states for foster care and adoption assistance and for child support enforcement are expected to remain near the 2014 amounts about $7 billion and $4 billion, respectively in estimates that, under current law, spending for the two programs will increase modestly over the coming decade and amount to $9 billion and $5 billion, respectively, in Child Nutrition. projects that federal spending for child nutrition which provides cash and commodities for meals and snacks in schools, day care settings, and summer programs will rise by 5 percent in 2015, to $21 billion. Much of that increase stems from higher permeal reimbursement rates, which are adjusted automatically each school year to account for inflation. anticipates that growth in the number of meals provided and in reimbursement rates will lead to spending
79 72 THE BUDGET AND ECONOMIC OUTLOOK: 2015 TO 2025 JANUARY 2015 increases averaging 4 percent per year from 2016 through 2025, for a total of $32 billion in Civilian and Military Retirement Retirement and survivors benefits for federal civilian employees (along with benefits provided through several smaller retirement programs for employees of various government agencies and for retired railroad workers) amounted to $108 billion in Under current law, such outlays will grow by about 3 percent annually over the next 10 years, projects, reaching $141 billion in Growth in federal civil service retirement benefits is attributable primarily to cost-of-living adjustments for retirees and to increases in federal salaries, which boost benefits for people entering retirement. ( s projections reflect the assumption that federal salaries will rise in accordance with the employment cost index for wages and salaries of workers in private industry.) One factor that is restraining growth in spending for retirement benefits is the ongoing, gradual replacement of the Civil Service Retirement System (CSRS) with the Federal Employees Retirement System (FERS). FERS covers employees hired after 1983 and provides a smaller benefit than that provided by CSRS. FERS recipients are, however, eligible for Social Security benefits on the basis of their federal employment, whereas CSRS employees are not. In addition, under FERS, employees contributions to the federal Thrift Savings Plan are matched in part by their employing agencies (but those matching funds are categorized as discretionary not mandatory costs because they come out of annual appropriations to the agencies). The federal government also provides annuities to personnel who retire from the military and their survivors. Outlays for those annuities totaled $55 billion in Most of the annual growth in those outlays results from COLAs and increases in military basic pay. Outlays for military retirement annuities are projected to grow over the next 10 years by an average of about 3 percent per year, rising to $74 billion in Spending for child nutrition includes roughly $1 billion in outlays each year related to the Funds for Strengthening Markets program (also known as Section 32), which, among other things, provides funds to purchase commodities that are distributed to schools as part of child nutrition programs. Veterans Benefits Mandatory spending for veterans benefits includes disability compensation, readjustment benefits, pensions, insurance, housing assistance, and burial benefits. Outlays for those benefits totaled $87 billion in 2014, of which roughly 75 percent represented disability compensation. That amount does not include most federal spending for veterans health care, which is funded by discretionary appropriations. Spending for mandatory veterans benefits is projected to rise by 14 percent, to $99 billion, in The growth projected for 2015 largely reflects new mandatory spending for medical services and facilities resulting from the Veterans Access, Choice, and Accountability Act of 2014 (P.L ). That law provided onetime funding of $5 billion to expand health care hiring and infrastructure of the Department of Veterans Affairs and $10 billion to temporarily cover the costs of contracted medical care for veterans. (That funding was an exception to the usual approach of funding veterans health care through discretionary appropriations.) Other growth, though less substantial, stems from an expected increase in the average benefit for veterans disability compensation. expects that, under current law, moderate growth in mandatory spending for veterans benefits (averaging about 1.4 percent a year between 2015 and 2025) will cause outlays to rise to $114 billion in Other Mandatory Spending Other mandatory spending includes outlays for agricultural support, some smaller health care programs, net outlays for deposit insurance, subsidy costs for student loans, and other payments. Outlays in some of those categories fluctuate markedly from year to year and may be either positive or negative. Agricultural Support. Mandatory spending for agricultural programs totaled $19 billion in The relatively high spending last year included significant payments for livestock disaster assistance for drought-related losses since 2012 and crop insurance payments for crop losses in Spending for agricultural support is projected to average $15 billion per year between 2015 and 2025 based on the assumption (specified in the Deficit Control Act) that the current programs that are scheduled to expire during that period will be extended.
80 CHAPTER THREE THE BUDGET AND ECONOMIC OUTLOOK: 2015 TO Deposit Insurance. Net outlays for deposit insurance were negative last year: The program s collections (premiums paid by financial institutions) exceeded its disbursements (the cost of resolving failed institutions) by $14 billion. Premium payments will continue to exceed amounts spent on failed institutions, projects, and net outlays for deposit insurance will range from $9 billion to $16 billion annually over the coming decade. Medicare-Eligible Retiree Health Care Fund. The Department of Defense s Medicare-Eligible Retiree Health Care Fund (MERHCF) provides health care benefits, mainly through the TRICARE for Life program, to retirees of the uniformed services (and to their dependents and surviving spouses) who are eligible for Medicare. Outlays for those benefits totaled $9 billion in Over the coming decade, spending from the MERHCF is projected to rise at an average annual rate of roughly 6 percent, reaching $17 billion in Fannie Mae and Freddie Mac. In September 2008, the government placed Fannie Mae and Freddie Mac, two institutions that facilitate the flow of funding for home loans nationwide, into conservatorship. 12 Because the Administration considers Fannie Mae and Freddie Mac to be nongovernmental entities for federal budgeting purposes, it recorded the Treasury s payments to those entities as outlays in the budget and reports payments by those entities to the Treasury, such as those made in 2014 and expected in 2015, as offsetting receipts. (For further details, see page 75.) In contrast to the Administration, projects the budgetary impact of the two entities operations in future years as if they were being conducted by a federal agency because of the degree of management and financial control that the government exercises over them. 13 Therefore, estimates the net lifetime costs that is, the subsidy costs adjusted for market risk of the guarantees that those entities will issue and of the loans that they will hold and shows those costs as federal outlays in the year 12. Conservatorship is the legal process in which an entity, in this case the federal government, is appointed to establish control and oversight of a company to put it in a sound and solvent condition. 13. See Congressional Budget Office, s Budgetary Treatment of Fannie Mae and Freddie Mac (January 2010), publication/ of issuance. estimates that those outlays will amount to $21 billion from 2016 through Higher Education. Mandatory outlays for higher education fall into three categories: the net costs (on a presentvalue basis) of student loans originated in a given year, which are frequently estimated to be negative; a portion of the costs of Pell grants provided in that year; and spending for some smaller programs. 14 In 2014, total mandatory outlays for higher education were $12 billion. That amount included the following: the budgetary effects of student loans originated last year, which amounted to $22 billion (on a present-value basis); a slight increase in the estimated cost of direct and guaranteed loans originated in previous years, which amounted to $1 billion (also on a present-value basis); and mandatory spending for Pell grants, which totaled $8 billion. 15 In 2015, the net costs for new student loans will be $15 billion, mandatory spending for the Federal Pell Grant Program will be $11 billion, and other spending will be $0.4 billion, resulting in net mandatory outlays for higher education of $3 billion, estimates. In later years, projected mandatory outlays for higher 14. calculates subsidy costs for student loans following the procedures specified in the Federal Credit Reform Act of 1990 (FCRA). Under FCRA accounting, the discounted present value of expected income from federal student loans made during the period is projected to exceed the discounted present value of the government s costs. (Present value is a single number that expresses a flow of current and future income or payments in terms of an equivalent lump sum received or paid today; the present value depends on the rate of interest known as the discount rate that is used to translate future cash flows into current dollars.) Credit programs that produce net income rather than net outlays are said to have negative subsidy rates, which result in negative outlays. The original subsidy calculation for a set of loans or loan guarantees may be increased or decreased in subsequent years by a credit subsidy reestimate based on an updated assessment of the present value of the cash flows associated with the outstanding loans or loan guarantees. FCRA accounting does not, however, consider all costs borne by the government. In particular, it omits market risk the risk taxpayers face because federal receipts from payments on student loans tend to be low when economic and financial conditions are poor and resources are therefore more valuable. Fair-value accounting methods account for such risk, so the program s savings are less (or its costs are greater) under fair-value accounting than they are under FCRA accounting. 15. Under current law, the Pell grant program also receives funding from discretionary appropriations. For 2014, those appropriations totaled $23 billion.
81 74 THE BUDGET AND ECONOMIC OUTLOOK: 2015 TO 2025 JANUARY 2015 education trend from modestly negative to slightly positive. That switch occurs primarily because rising interest rates will, in s estimation, increase the subsidy cost of student loans (making it less negative) to the point that the negative outlays for new student loans will no longer fully offset the cost of mandatory spending for Pell grants and other higher education programs under current law. (Those projected outlays do not include any potential revision to the estimated subsidy costs of loans or guarantees made before 2015.) Additional Mandatory Spending. Other mandatory spending includes outlays for a number of different programs; some of those outlays are associated with significant offsetting receipts or revenues collected by the federal government. For example, $138 billion in mandatory outlays over the period is related to the administration of justice, including some activities of the Department of Homeland Security. Most of that spending is offset by revenues and by fees, penalties, fines, and forfeited assets that are credited in the budget as offsetting receipts. An additional $115 billion in outlays over the period stems from the Universal Service Fund and is offset in the federal budget by revenues of similar amounts. Other mandatory spending over the period includes the following outlays: $59 billion for conservation activities on private lands; $57 billion for grants to states for social services, such as vocational rehabilitation; $40 billion in subsidy payments to state and local governments related to the Build America Bonds program for infrastructure improvements; and $32 billion in payments to states and territories, primarily from funds generated from mineral production on federal land. Offsetting Receipts Offsetting receipts are funds collected by federal agencies from other government accounts or from the public in businesslike or market-oriented transactions that are recorded as negative outlays (that is, as credits against direct spending). Such receipts include beneficiaries premiums for Medicare, intragovernmental payments made by federal agencies for their employees retirement benefits, royalties and other charges for the production of oil and natural gas on federal lands, proceeds from sales of timber harvested and minerals extracted from federal lands, payments by Fannie Mae and Freddie Mac, and various fees paid by users of public property and services. In 2014, offsetting receipts totaled $276 billion. The total for this year will be nearly unchanged at $275 billion, estimates. That amount reflects a decrease in receipts from Fannie Mae and Freddie Mac, which is mostly offset by an increase in proceeds from the Federal Communications Commission s auctions of licenses to use a portion of the electromagnetic spectrum. Over the coming decade, offsetting receipts are projected to increase by just over 2 percent per year, on average, rising to $346 billion by 2025 (see Table 3-2 on page 64). Medicare. Offsetting receipts for Medicare are composed primarily of premiums paid by Medicare beneficiaries, but they also include recoveries of overpayments made to providers and payments made by states to cover a portion of the prescription drug costs for low-income beneficiaries. In 2014, those receipts totaled $95 billion, constituting one-third of all offsetting receipts and covering about 16 percent of gross Medicare spending. Over the coming years, those receipts are projected to rise at about the same rate as spending for Medicare, totaling $199 billion in Federal Retirement. In 2014, $65 billion in offsetting receipts consisted of intragovernmental transfers from federal agencies to the federal funds from which employees retirement benefits are paid (mostly trust funds for Social Security and for military and civilian retirement). Those payments from agencies operating accounts to the funds have no net effect on federal outlays. Such payments will grow by nearly 3 percent per year, on average, estimates, reaching $90 billion in Natural Resources. Receipts stemming from the extraction of natural resources particularly oil, natural gas, and minerals from federally owned lands totaled $14 billion in By 2025, estimates, those receipts will be $19 billion. The royalty payments included in that category fluctuate depending on the price of the commodity extracted. Medicare-Eligible Retiree Health Care Fund. Intragovernmental transfers are also made to the Department of Defense s MERHCF (discussed above). Contributions
82 CHAPTER THREE THE BUDGET AND ECONOMIC OUTLOOK: 2015 TO to the fund are made on an accrual basis: Each year, the services contribute an amount sufficient to cover the increase in the estimated future costs of retirement benefits for their currently active service members. Such payments totaled $8 billion in 2014 and, because of rising health care costs, are projected to grow to $12 billion by Fannie Mae and Freddie Mac. In the first few years after they were placed into conservatorship, the Treasury made payments to Fannie Mae and Freddie Mac; however, over the past couple of years, those entities have been making payments to the government. The Administration has recorded the payments by the government as outlays and the payments to the government from those two entities as offsetting receipts. To match the reporting for the current year in the Monthly Treasury Statements, adopts the Administration s presentation for 2015, but for later years, because of the extent of government control over the two entities, considers them to be part of the government and their transactions with the Treasury to be intragovernmental. In 2014, the Treasury made no payments to those entities and received payments from them totaling $74 billion. estimates that net payments from those entities to the Treasury will amount to $26 billion in That drop occurs partly because in fiscal year 2014 Freddie Mac s payments to the Treasury were boosted by a nearly $24 billion payment following a onetime revaluation of certain tax assets. In addition, financial institutions are expected to make fewer settlement payments to Fannie Mae and Freddie Mac in 2015 for allegations of fraud in connection with residential mortgages and certain other securities. Legislation Assumed in the Baseline for Expiring Programs In keeping with the rules established by the Deficit Control Act, s baseline projections incorporate the assumption that some mandatory programs will be extended when their authorization expires, although the assumptions apply differently to programs created before and after the Balanced Budget Act of All direct spending programs that predate that act and have current-year outlays greater than $50 million are assumed to continue in s baseline projections. For programs established after 1997, continuation is assessed program by program in consultation with the House and Senate Budget Committees. s baseline projections therefore incorporate the assumption that the following programs, whose authorization expires within the current projection period, will continue: SNAP, TANF, CHIP, rehabilitation services, the Child Care Entitlement, trade adjustment assistance for workers, child nutrition, promoting safe and stable families, most farm subsidies, certain transportation programs, and some recreation fees. In addition, the Deficit Control Act directs to assume that a cost-of-living adjustment for veterans compensation will be granted each year. In s projections, the assumption that expiring programs will continue accounts for less than $1 billion in mandatory outlays for 2015 and about $940 billion between 2016 and 2025, mostly for SNAP and TANF (see Table 3-3). Discretionary Spending Roughly one-third of federal outlays stem from budget authority provided in annual appropriation acts. 16 That funding referred to as discretionary translates into outlays when the money is spent. Although some appropriations (for example, those designated for employees salaries) are spent quickly, others (such as those intended for major construction projects) are disbursed over several years. In any given year, discretionary outlays include spending from new budget authority and from budget authority provided in previous appropriations. Several transportation programs have an unusual budgetary treatment: Their budget authority is provided in authorizing legislation, rather than in appropriation acts, but their spending is constrained by obligation limitations imposed by appropriation bills. Consequently, their budget authority is considered mandatory, but their outlays are discretionary. (The largest of those programs is the Federal-Aid Highway Program, which is funded from the 16. Budget authority is the authority provided by law to incur financial obligations that will result in immediate or future outlays of federal funds. Budget authority may be provided in an appropriation act or an authorization act and may take the form of a direct appropriation of funds from the Treasury, borrowing authority, contract authority, entitlement authority, or authority to obligate and expend offsetting collections or receipts. Offsetting collections and receipts are shown as negative budget authority and outlays.
83 76 THE BUDGET AND ECONOMIC OUTLOOK: 2015 TO 2025 JANUARY 2015 Table 3-3. Costs for Mandatory Programs That Continue Beyond Their Current Expiration Date in s Baseline Billions of Dollars Total Supplemental Nutrition Assistance Program Budget authority Outlays Temporary Assistance for Needy Families Budget authority Outlays Commodity Credit Corporation a Budget authority Outlays Children's Health Insurance Program Budget authority Outlays Veterans' Compensation COLAs Budget authority Outlays Rehabilitation Services Budget authority Outlays Child Care Entitlements to States Budget authority Outlays Trade Adjustment Assistance for Workers b Budget authority Outlays 0 * Child Nutrition c Budget authority Outlays Continued Highway Trust Fund.) As a result, total discretionary outlays in the budget are greater than total discretionary budget authority. In some cases, the amounts of those obligation limitations are added to discretionary budget authority to produce a measure of the total funding provided for discretionary programs. In s baseline projections, most appropriations for the period are assumed to be constrained by the caps set by the Budget Control Act of 2011 and modified in subsequent legislation, including the automatic reductions required by that act. For the period from 2022
84 CHAPTER THREE THE BUDGET AND ECONOMIC OUTLOOK: 2015 TO Table 3-3. Costs for Mandatory Programs That Continue Beyond Their Current Expiration Date in s Baseline Billions of Dollars Continued Total Promoting Safe and Stable Families Budget authority 0 0 * * * * * * * * * 1 3 Outlays 0 0 * * * * * * * * * 1 3 Ground Transportation Programs Not Subject to Annual Obligation Limitations Budget authority * Outlays * * * Ground Transportation Programs Controlled by Obligation Limitations d Budget authority Outlays Air Transportation Programs Controlled by Obligation Limitations d Budget authority Outlays Natural Resources Budget authority Outlays 0 * * * * * * * * * * * * Total Budget authority ,491 Outlays * Source: Congressional Budget Office. Note: COLAs = cost-of-living adjustments; * = between -$500 million and $500 million. a. Agricultural commodity price and income supports and conservation programs under the Agricultural Act of 2014 generally expire after Although permanent price support authority under the Agricultural Adjustment Act of 1938 and the Agricultural Act of 1949 would then become effective, continues to adhere to the rule in section 257(b)(2)(ii) of the Deficit Control Act that indicates that the baseline should assume that the Agricultural Act s provisions remain in effect. b. Does not include the cost of extending Reemployment Trade Adjustment Assistance, which, if extended through 2025, would increase mandatory outlays by $0.4 billion, estimates. c. Includes the Summer Food Service program and states administrative expenses. d. Authorizing legislation for those programs provides contract authority, which is counted as mandatory budget authority. However, because the programs spending is subject to obligation limitations specified in annual appropriation acts, outlays are considered discretionary.
85 78 THE BUDGET AND ECONOMIC OUTLOOK: 2015 TO 2025 JANUARY 2015 Figure 3-3. Discretionary Outlays, by Category Percentage of Gross Domestic Product Actual Projected 10 Total Defense Nondefense Source: Congressional Budget Office. through 2025, assumes that those appropriations will grow at the rate of inflation from the amounts estimated for Funding for certain purposes is not constrained by the caps: Military and diplomatic operations in Afghanistan and elsewhere that have been designated as overseas contingency operations (OCO), responses to events designated as emergencies, disaster relief, and initiatives designed to enhance program integrity by reducing overpayments in some benefit programs are all exempt activities. developed projections for such funding by assuming that it would grow at the rate of inflation from the amounts appropriated for Under those assumptions, discretionary outlays in s baseline grow by an average of less than 2 percent a year from 2015 through Because that pace is less than the projected growth rate of nominal GDP, discretionary outlays in s baseline projections fall from 6.5 percent of GDP in 2015 to 5.1 percent of GDP in 2025, a 17. develops projections of discretionary spending by first inflating the appropriations provided for specific activities in 2015 and then reducing total projected defense and nondefense funding by the amounts necessary to bring them in line with the caps. In s baseline, discretionary funding related to federal personnel is inflated using the employment cost index for wages and salaries; other discretionary funding is adjusted using the gross domestic product price index. smaller share than in any year since before 1962 (the first year for which comparable data are available). Trends in Discretionary Outlays Since the 1960s, the share of federal spending that is governed by the annual appropriation process has dropped by about half from 67 percent of total spending in 1962 to 34 percent in Discretionary outlays averaged 12 percent of GDP over the period, fell to about 10 percent during much of the 1970s and 1980s, and gradually declined to 6.0 percent in 1999 (see Figure 3-3). They then began to increase relative to the size of the economy, reaching 7.7 percent of GDP in That rise occurred in part because of actions taken in response to the terrorist attacks of September 11, 2001, and the subsequent military operations in Afghanistan and Iraq. (Funding for those operations from 2001 to 2015 is examined in Box 3-2.) By 2010, discretionary outlays reached a recent peak of 9.1 percent of GDP, largely because of $281 billion in discretionary funding provided by the American Recovery and Reinvestment Act of 2009 (ARRA; P.L ). Since then, discretionary outlays have again declined as a share of GDP, falling to 6.8 percent in 2014, mostly because of the constraints put in place by the Budget Control Act and because of declines in spending for OCO and for activities funded by ARRA.
86 CHAPTER THREE THE BUDGET AND ECONOMIC OUTLOOK: 2015 TO During the 1990s, declines in discretionary outlays relative to the size of the economy largely reflected reductions in defense spending, which reached a low of 2.9 percent of GDP from 1999 through In part boosted by funding for operations in Afghanistan and Iraq, outlays for defense began to rise in 2002, reaching 4.7 percent of GDP in 2010 when funding for defense-related activities peaked. Since then, defense spending has fallen again relative to GDP, to 3.5 percent in 2014, owing mostly to a reduction in funding for OCO. As a whole, between 2010 and 2014, funding for defense declined by 15 percent in nominal terms, or nearly 21 percent in constant 2010 dollars. That change was heavily influenced by reductions in funding for OCO. Excluding those amounts, funding for defense fell by roughly 6 percent in nominal terms, or 12 percent in real terms, over that period. Nondefense discretionary programs encompass such activities as transportation, education grants, housing assistance, health-related research, veterans health care, most homeland security activities, the federal justice system, foreign aid, and environmental protection. Historically, nondefense discretionary outlays represented a fairly stable share of GDP, averaging 3.8 percent over the period and rarely exceeding 5.0 percent or falling below 3.2 percent. Funding from ARRA, enacted in 2009, helped push that share to a recent high of 4.5 percent in 2010, but by 2012 agencies had spent roughly 85 percent of that funding, and nondefense discretionary outlays fell back to the historical average of 3.8 percent of GDP. Between 2010 and 2014, funding for nondefense discretionary programs declined by 4.4 percent in nominal terms, or 10.7 percent in constant 2010 dollars. Outlays for those programs have followed the downward trend in funding and have fallen notably relative to GDP, reaching 3.4 percent in Obligation limitations for transportation programs in 2015 total an additional $53 billion, which is the same amount legislated for Discretionary Appropriations and Outlays in 2015 The Consolidated and Further Continuing Appropriations Act, 2015 (P.L ) provided discretionary budget authority totaling $1,120 billion. 18 (That amount includes, on an annualized basis, appropriations for the Department of Homeland Security that are available only through February 27, 2015.) In total, discretionary budget authority for fiscal year 2015 is roughly 1 percent less than the $1,133 billion for fiscal year 2014 (see Table 3-4 on page 82). The caps on budget authority for 2015 had been set at $521.3 billion for defense programs and at $492.4 billion for nondefense programs, for a total of $1,013.6 billion. Those limits are adjusted, however, when appropriations are provided for certain purposes. Budget authority designated as an emergency requirement or provided for OCO leads to an increase in the caps, as does budget authority provided for some types of disaster relief or for certain program integrity initiatives. 19 To date, such adjustments to the caps on discretionary budget authority for 2015 have totaled $86 billion; most of that amount, $74 billion, resulted from funding for OCO. Those adjustments raise the caps to a total of $1,100 billion. The amount of discretionary budget authority in s baseline, however, is about $20 billion more than the adjusted caps, mostly because changes to mandatory programs included in P.L resulted in reductions to budget authority for such programs in 2015 that were credited against discretionary funding levels when the legislation was enacted. In s baseline, those reductions are reflected in the relevant mandatory accounts, and the full amount of discretionary budget authority is shown in the discretionary accounts. Assuming that funding for the Department of Homeland Security remains at the annualized levels specified in P.L and that no additional appropriations are made, estimates that discretionary outlays will edge down in 2015 to $1,175 billion, slightly below the $1,179 billion of such outlays in 2014 and equal to 6.5 percent of GDP. That sum represents the lowest amount of discretionary outlays since Since their recent peak in 2010, discretionary outlays have declined by 13 percent in nominal terms and 18 percent in real terms (adjusted for inflation using the price index for personal consumption expenditures). Defense Discretionary Funding and Outlays. Budget authority provided for defense discretionary programs in 2015 totals $586 billion 3.3 percent less than the 2014 amount of $606 billion. (Almost all defense spending is 19. Such initiatives identify and reduce improper payments for benefit programs such as DI, SSI, Medicare, Medicaid, and CHIP.
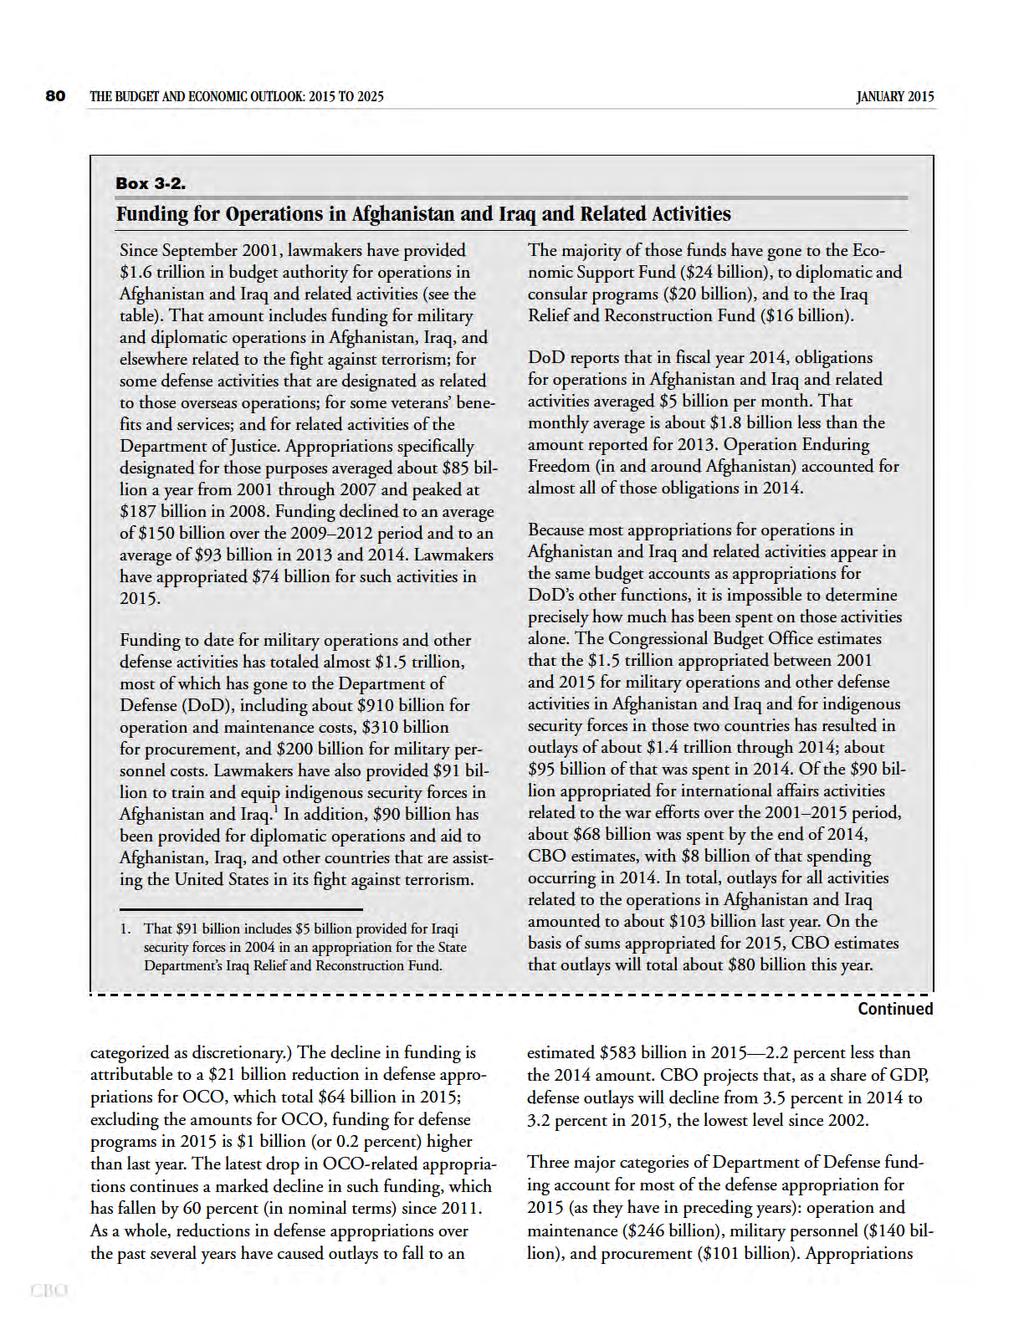
87
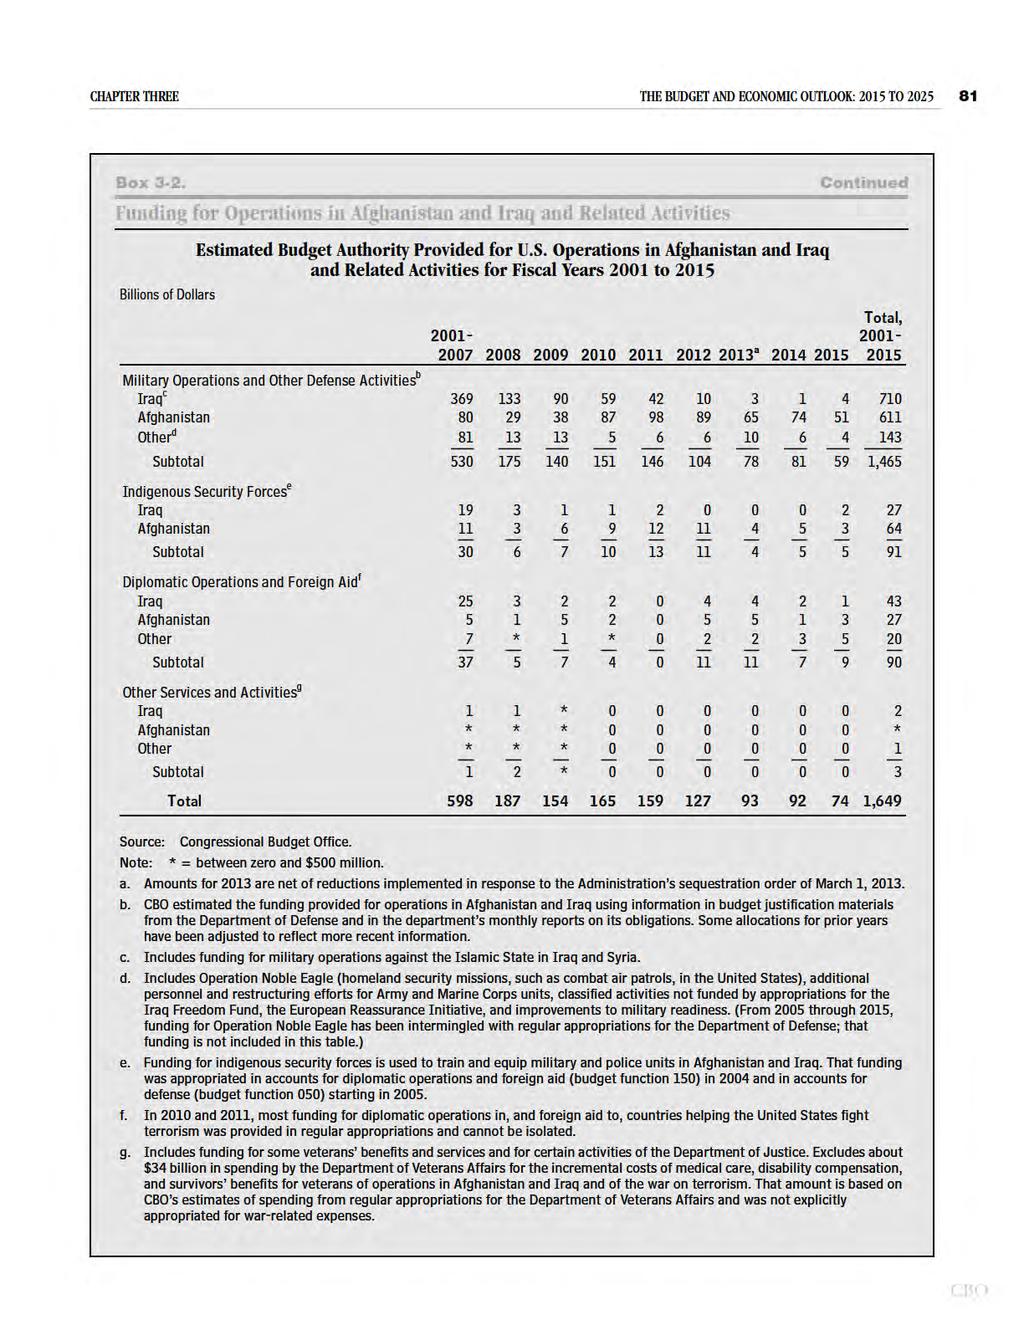
88
Notes Numbers in the text and tables may not add up to totals because of rounding. Unless otherwise indicated, years referred to in describing the bud
 CONGRESS OF THE UNITED STATES CONGRESSIONAL BUDGET OFFICE The Budget and Economic Outlook: 4 to 4 Percentage of GDP 4 Surpluses Actual Projected - -4-6 Average Deficit, 974 to Deficits -8-974 979 984 989
The Budget and Economic Outlook: 2016 to 2026
 JANUARY 2016 The Budget and Economic Outlook: 2016 to 2026 Provided as a convenience, this screen-friendly version is identical in content to the principal ( printer-friendly ) version of the report. Any
CONGRESS OF THE UNITED STATES CONGRESSIONAL BUDGET OFFICE CBO The Budget and Economic Outlook: 2016 to 2026 Percentage of GDP 100 Actual Projected 80
 CONGRESS OF THE UNITED STATES CONGRESSIONAL BUDGET OFFICE The Budget and Economic Outlook: 6 to 6 Percentage of GDP Actual Projected 8 In s projections, growing 6 deficits drive up debt over the next decade,
Report Documentation Page Form Approved OMB No Public reporting burden for the collection of information is estimated to average 1 hour per re
 Testimony The Budget and Economic Outlook: 214 to 224 Douglas W. Elmendorf Director Before the Committee on the Budget U.S. House of Representatives February 5, 214 This document is embargoed until it
CONGRESS OF THE UNITED STATES CONGRESSIONAL BUDGET OFFICE
 CONGRESS OF THE UNITED STATES CONGRESSIONAL BUDGET OFFICE The Budget and Economic Outlook: 2017 to 2027 Percentage of GDP 4 2 Surpluses Actual Current-Law Projection 0 Growth in revenues is projected -2-4
AN UPDATE TO THE BUDGET AND ECONOMIC OUTLOOK: 216 TO 226 AUGUST 216 Summary In fiscal year 216, the federal budget deficit will increase in relation t
 AUGUST 216 An Update to the Budget and Economic Outlook: 216 to 226 Provided as a convenience, this screen-friendly version is identical in content to the principal ( printer-friendly ) version of the
AUGUST 2012 An Update to the Budget and Economic Outlook: Fiscal Years 2012 to 2022 Provided as a convenience, this screen-friendly version is identic
 AUGUST 2012 An Update to the Budget and Economic Outlook: Fiscal Years 2012 to 2022 Provided as a convenience, this screen-friendly version is identical in content to the principal, printer-friendly version
In fiscal year 2016, for the first time since 2009, the
 Summary In fiscal year 216, for the first time since 29, the federal budget deficit increased in relation to the nation s economic output. The Congressional Budget Office projects that over the next decade,
CONGRESS OF THE UNITED STATES CONGRESSIONAL BUDGET OFFICE CBO. The Budget and Economic Outlook: Fiscal Years 2013 to 2023
 CONGRESS OF THE UNITED STATES CONGRESSIONAL BUDGET OFFICE The Budget and Economic Outlook: Fiscal Years 2013 to 2023 Percentage of GDP 120 100 Actual Projected 80 60 40 20 0 1940 1945 1950 1955 1960 1965
CONGRESS OF THE UNITED STATES CONGRESSIONAL BUDGET OFFICE CBO The Budget and Economic Outlook: Fiscal Years 2012 to 2022 Deficits or Surpluses (Percen
 CONGRESS OF THE UNITED STATES CONGRESSIONAL BUDGET OFFICE The Budget and Economic Outlook: Fiscal Years 22 to 222 Deficits or Surpluses (Percentage of GDP) 4 Actual 2 Projected s Baseline Projection -2
Testimony The 2014 Long-Term Budget Outlook Douglas W. Elmendorf Director Before the Committee on the Budget U.S. House of Representatives July 16, 20
 Testimony The 2014 Long-Term Budget Outlook Douglas W. Elmendorf Director Before the Committee on the Budget U.S. House of Representatives July 16, 2014 This document is embargoed until it is delivered
Form Approved OMB No. 74- Report Documentation Page Public reporting burden for the collection of information is estimated to average hour per respons
 CONGRESS OF THE UNITED STATES CONGRESSIONAL BUDGET OFFICE An Analysis of the President s 24 Budget MAY 2 Form Approved OMB No. 74- Report Documentation Page Public reporting burden for the collection of
CONGRESS OF THE UNITED STATES CONGRESSIONAL BUDGET OFFICE CBO. The Budget and Economic Outlook: Fiscal Years 2012 to 2022
 CONGRESS OF THE UNITED STATES CONGRESSIONAL BUDGET OFFICE The Budget and Economic Outlook: Fiscal Years 2012 to 2022 4 2 0-2 -4-6 -8-10 Actual Deficits or Surpluses (Percentage of GDP) s Baseline Projection
Notes Numbers in the text and tables may not add up to totals because of rounding. Unless otherwise indicated, years referred to in this report are fe
 CONGRESS OF THE UNITED STATES CONGRESSIONAL BUDGET OFFICE An Analysis of the President s 2015 Budget APRIL 2014 Notes Numbers in the text and tables may not add up to totals because of rounding. Unless
Report Documentation Page Form Approved OMB No Public reporting burden for the collection of information is estimated to average 1 hour per
 NOVEMBER 2014 Growth in DoD s Budget From The Department of Defense s (DoD s) base budget grew from $384 billion to $502 billion between fiscal years 2000 and 2014 in inflation-adjusted (real) terms an
CHOICES FOR DEFICIT REDUCTION NOVEMBER debt could itself precipitate a fiscal crisis by undermining investors confidence in the government s ab
 NOVEMBER 2012 Choices for Deficit Reduction Provided as a convenience, this screen-friendly version is identical in content to the principal ( printer-friendly ) version of the report. Summary The United
The Budget and Economic Outlook: 2018 to 2028
 CONGRESS OF THE UNITED STATES CONGRESSIONAL BUDGET OFFICE The Budget and Economic Outlook: 2018 to 2028 Percentage of GDP 30 25 20 Outlays Actual Current-Law Projection Over the next decade, the gap between
Notes Unless otherwise indicated, the years referred to in describing budget numbers are fiscal years, which run from October 1 to September 30 and ar
 Budgetary and Economic Outcomes Under Paths for Federal Revenues and Noninterest Spending Specified by Chairman Price, March 2016 March 2016 CONGRESS OF THE UNITED STATES Notes Unless otherwise indicated,
Pub. No. 3205
 A REPORT The Cyclically Adjusted and Standardized Budget Measures October 2008 CONGRESSIONAL BUDGET OFFICE SECOND AND D STREETS, S.W. WASHINGTON, D.C. 20515 Pub. No. 3205 A R REPORT The Cyclically Adjusted
unusually small at the end of 2017 and the beginning of 2018 as a result of debt-ceiling constraints.
 88 The Budget and Economic Outlook: 2018 to 2028 April 2018 unusually small at the end of 2017 and the beginning of 2018 as a result of debt-ceiling constraints. Second, the government s need for cash
Summary Between 2009 and 2012, the federal government recorded the largest budget deficits relative to the size of the economy since 1946, causing fed
 The 2013 Long-Term Budget Outlook Posted September 19, 2013; reposted on October 31, 2013 Notes Unless otherwise indicated, the years referred to in most of this report are federal fiscal years (which
Analysis of Congressional Budget Office s August 2012 Updateof the Budget and Economic Outlook
 Analysis of Congressional Budget Office s August 2012 Updateof the Budget and Economic Outlook Aug 24, 2012 The nonpartisan Congressional Budget Office (CBO) has released a mid-year update to its projections
Notes The Congressional udget Office s extended baseline shows the budget s long-term path under most of the same assumptions that the agency uses, in
 CONGRESS OF THE UNITED STATES CONGRESSIONAL UDGET OFFICE The 2016 Long-Term udget Outlook Percentage of GDP 2046 30 Net Interest 2016 20 Deficit Other Revenues Corporate Income Taxes Payroll Taxes Major
Notes Unless otherwise indicated, all years are federal fiscal years, which run from October 1 to September 30 and are designated by the calendar year
 CONGRESS OF THE UNITED STATES CONGRESSIONAL BUDGET OFFICE Budgetary and Economic Effects of Repealing the Affordable Care Act Billions of Dollars, by Fiscal Year 150 125 100 Without Macroeconomic Feedback
Mandatory Spending Since 1962
 D. Andrew Austin Analyst in Economic Policy Mindy R. Levit Analyst in Public Finance June 15, 2011 Congressional Research Service CRS Report for Congress Prepared for Members and Committees of Congress
Mandatory Spending Since 1962
 D. Andrew Austin Analyst in Economic Policy Mindy R. Levit Analyst in Public Finance March 23, 2012 CRS Report for Congress Prepared for Members and Committees of Congress Congressional Research Service
The Federal Budget: Sources of the Movement from Surplus to Deficit
 Order Code RS22550 Updated November 8, 2007 Summary The Federal Budget: Sources of the Movement from Surplus to Deficit Marc Labonte Specialist in Macroeconomics Government and Finance Division The federal
Notes and Definitions Numbers in the text, tables, and figures may not add up to totals because of rounding. Dollar amounts are generally rounded to t
 CONGRESS OF THE UNITED STATES CONGRESSIONAL BUDGET OFFICE The Distribution of Household Income and Federal Taxes, 2013 Percent 70 60 50 Shares of Before-Tax Income and Federal Taxes, by Before-Tax Income
The pace of recovery in output and employment has
 CHAPTER 2 The Economic Outlook The pace of recovery in output and employment has been slow since the recession ended in June 2009, and the economy remains in a severe slump. The Congressional Budget Office
Mandatory Spending Since 1962
 D. Andrew Austin Analyst in Economic Policy Mindy R. Levit Analyst in Public Finance February 16, 2010 Congressional Research Service CRS Report for Congress Prepared for Members and Committees of Congress
WikiLeaks Document Release
 WikiLeaks Document Release February 2, 2009 Congressional Research Service Report RS22550 The Federal Budget: Sources of the Movement from Surplus to Deficit Marc Labonte, Government and Finance Division
DEFENSE SPENDING AND THE ECONOMY. Rudolph G. Penner Director Congressional Budget Office. Before the
 DEFENSE SPENDING AND THE ECONOMY Rudolph G. Penner Director Congressional Budget Office Before the Committee on Armed Services U.S. House of Representatives February 23, 1984- Report Documentation Page
Analysis of CBO s Budget Outlook: Fiscal Years
 Analysis of CBO s Budget Outlook: Fiscal Years 2012-2022 Feb 01, 2012 INTRODUCTION The Congressional Budget Office's (CBO) latest Budget and Economic Outlook provides sobering new evidence that our nation's
Notes and Definitions Numbers in the text, tables, and figures may not add up to totals because of rounding. Dollar amounts are generally rounded to t
 CONGRESS OF THE UNITED STATES CONGRESSIONAL BUDGET OFFICE The Distribution of Household Income and Federal Taxes, 2011 Percent 70 60 Shares of Before-Tax Income and Federal Taxes, by Before-Tax Income
The Federal Government Debt: Its Size and Economic Significance
 Order Code RL31590 The Federal Government Debt: Its Size and Economic Significance Updated January 25, 2007 Brian W. Cashell Specialist in Quantitative Economics Government and Finance Division Report
Status of the Social Security and Medicare Programs
 Social Security Online Actuarial Publications Status of the Social Security and Medicare Programs A SUMMARY OF THE 2011 ANNUAL REPORTS Social Security and Medicare Boards of Trustees A MESSAGE TO THE PUBLIC:
The Feasibility of Alternative IMF-Type Stabilization Programs in Mexico,
 The Feasibility of Alternative IMF-Type Stabilization Programs in Mexico, 1983-87 Robert E. Looney and P. C. Frederiksen, Naval Postgraduate School In November 1982, Mexico announced an agreement with
Tools of Budget Analysis (Chapter 4 in Gruber s textbook) 131 Undergraduate Public Economics Emmanuel Saez UC Berkeley
 131 Undergraduate Public Economics Emmanuel Saez UC Berkeley") Tools of Budget Analysis (Chapter 4 in Gruber s textbook) 131 Undergraduate Public Economics Emmanuel Saez UC Berkeley 1 GOVERNMENT BUDGETING Debt: The amount borrowed by government through bonds to individuals,
Tools of Budget Analysis (Chapter 4 in Gruber s textbook) 131 Undergraduate Public Economics Emmanuel Saez UC Berkeley 1 GOVERNMENT BUDGETING Debt: The amount borrowed by government through bonds to individuals,
JOINT STATEMENT OF JACOB J.C.
 JOINT STATEMENT OF JACOB J. LEW, SECRETARY OF THE TREASURY, AND SHAUN DONOVAN, DIRECTOR OF THE OFFICE OF MANAGEMENT AND BUDGET, ON BUDGET RESULTS FOR FISCAL YEAR 2015 WASHINGTON, D.C. U.S. Treasury Secretary
The Congressional Budget Office s 2012 Long-Term Budget Outlook: An Analysis
 The Congressional Budget Office s 2012 Long-Term Budget Outlook: An Analysis Jun 06, 2012 The Congressional Budget Office s (CBO) new update of its long-term fiscal outlook highlights the continued long-term
Discuss Budget Importance Fiscal Cliff/State of Economy CBO Estimates/Long-Term Outlook State Outlook: Tennessee and Virginia
 June 19, 2013 1 Discuss Budget Importance Fiscal Cliff/State of Economy CBO Estimates/Long-Term Outlook State Outlook: Tennessee and Virginia 2 Where are you going??????? How can you get there?????? 3
The Budget Control Act of 2011: The Effects on Spending and the Budget Deficit
 The Budget Control Act of 2011: The Effects on Spending and the Budget Deficit Mindy R. Levit Analyst in Public Finance Marc Labonte Coordinator of Division Research and Specialist April 1, 2013 CRS Report
WHAT YOU SHOULD KNOW ABOUT THE BUDGET OUTLOOK. William Gale Urban-Brookings Tax Policy Center February 8, 2013 ABSTRACT
 WHAT YOU SHOULD KNOW ABOUT THE BUDGET OUTLOOK William Gale Urban-Brookings Tax Policy Center February 8, 2013 ABSTRACT The Congressional Budget Office released its latest Budget and Economic Outlook earlier
Saudi Arabia: Measures ojtransition from a Rentier State
 CHAPTER 9 Saudi Arabia: Measures ojtransition from a Rentier State Robert E. Looney The purpose ofthis chapter is to assess the extent to which Saudi Arabia's longterm economic development strategy is
Pub. No. 3215
 CONGRESS OF THE UNITED STATES CONGRESSIONAL BUDGET OFFICE An Analysis of the President s Budgetary Proposals for Fiscal Year 2010 JUNE 2009 Pub. No. 3215 A STUDY An Analysis of the President s Budgetary
The Economics of the Federal Budget Deficit
 Order Code RL31235 The Economics of the Federal Budget Deficit Updated January 24, 2007 Brian W. Cashell Specialist in Quantitative Economics Government and Finance Division The Economics of the Federal
Ryan Plan Gets 69 Percent of Its Budget Cuts From Programs for People With Low or Moderate Incomes By Richard Kogan and Joel Friedman
 820 First Street NE, Suite 510 Washington, DC 20002 Tel: 202-408-1080 Fax: 202-408-1056 center@cbpp.org www.cbpp.org April 8, 2014 Ryan Plan Gets 69 Percent of Its Budget Cuts From Programs for People
The Economics of the Federal Budget Deficit
 Brian W. Cashell Specialist in Macroeconomic Policy February 2, 2010 Congressional Research Service CRS Report for Congress Prepared for Members and Committees of Congress 7-5700 www.crs.gov RL31235 Summary
NON-DEFENSE DISCRETIONARY PROGRAMS WILL FACE SERIOUS PRESSURES UNDER CURRENT FUNDING CAPS
 820 First Street NE, Suite 510 Washington, DC 20002 Tel: 202-408-1080 Fax: 202-408-1056 center@cbpp.org www.cbpp.org Revised December 6, 2012 NON-DEFENSE DISCRETIONARY PROGRAMS WILL FACE SERIOUS PRESSURES
The Budget Control Act of 2011: Legislative Changes to the Law and Their Budgetary Effects
 The Budget Control Act of 2011: Legislative Changes to the Law and Their Budgetary Effects Mindy R. Levit Specialist in Public Finance March 6, 2014 Congressional Research Service 7-5700 www.crs.gov R43411
CBPP S UPDATED LONG-TERM FISCAL DEFICIT AND DEBT PROJECTIONS
 820 First Street NE, Suite 510 Washington, DC 20002 Tel: 202-408-1080 Fax: 202-408-1056 center@cbpp.org www.cbpp.org September 30, 2009 CBPP S UPDATED LONG-TERM FISCAL DEFICIT AND DEBT PROJECTIONS For
Reducing the Budget Deficit: Policy Issues
 Marc Labonte Specialist in Macroeconomic Policy February 15, 2012 CRS Report for Congress Prepared for Members and Committees of Congress Congressional Research Service 7-5700 www.crs.gov R41778 Congressional
The Budget Control Act of 2011: Effects on Spending Levels and the Budget Deficit
 The Budget Control Act of 2011: Effects on Spending Levels and the Budget Deficit Marc Labonte Specialist in Macroeconomic Policy Mindy R. Levit Analyst in Public Finance November 29, 2011 CRS Report for
Professor Bret Wells. Law Center University of Houston. Federal Income Taxation. Supplemental Reading Materials
 Professor Bret Wells Law Center University of Houston Federal Income Taxation Supplemental Reading Materials Fall Semester 2016 Supplement Page #2 MAY 26, 2009 Taxes, Happiness, and Heliocentrism by David
April 5, Honorable Paul Ryan Chairman Committee on the Budget U.S. House of Representatives Washington, DC Dear Mr.
 CONGRESSIONAL BUDGET OFFICE U.S. Congress Washington, DC 20515 Douglas W. Elmendorf, Director April 5, 2011 Honorable Paul Ryan Chairman Committee on the Budget U.S. House of Representatives Washington,
Real or Illusory Growth in an Oil-Based Economy: Government Expenditures and Private Sector Investment in Saudi Arabia
 World Development, Vol. 20, No.9, pp. 1367-1375,1992. Printed in Great Britain. 0305-750Xl92 $5.00 + 0.00 Pergamon Press Ltd Real or Illusory Growth in an Oil-Based Economy: Government Expenditures and
Senate Proposal for Balanced Budget Amendment Would Require Extreme Budget Cuts By Richard Kogan and Cecile Murray 1
 820 First Street NE, Suite 510 Washington, DC 20002 Tel: 202-408-1080 Fax: 202-408-1056 center@cbpp.org www.cbpp.org May 3, 2016 Senate Proposal for Balanced Budget Amendment Would Require Extreme Budget
COMPTROLLER LEMBO REPORTS EARLY INDICATIONS THAT STATE COULD END FISCAL YEAR 2019 IN SURPLUS
 COMPTROLLER LEMBO REPORTS EARLY INDICATIONS THAT STATE COULD END FISCAL YEAR 2019 IN SURPLUS Comptroller Kevin Lembo today said that there are reasons for cautious optimism that the state could end Fiscal
MID-SESSION REVIEW BUDGET OF THE U. S. GOVERNMENT
 F I S C A L Y E A R 2 0 0 7 MID-SESSION REVIEW BUDGET OF THE U. S. GOVERNMENT EXECUTIVE OFFICE OF THE PRESIDENT OFFICE OF MANAGEMENT AND BUDGET WASHINGTON, D.C. 20503 The Director July 11, 2006 The Honorable
TRICARE Operations and Policy Update
 2011 Military Health System Conference TRICARE Operations and Policy Update The Quadruple Aim: Working Together, Achieving Success Ms. Carol McCourt and Mr. Mark Ellis January 26, 2011 TRICARE Management
GAO. The Federal Government s Long-Term Fiscal Outlook. January 2010 Update. United States Government Accountability Office
 GAO United States Government Accountability Office The Federal Government s Long-Term Fiscal Outlook January 2010 Update GAO s Long-Term Fiscal Simulations Since 1992, GAO has published longterm fiscal
Total Revenues and Outlays
 CHAPTER 1: THE BUDGET OUTLOOK THE BUDGET AND ECONOMIC OUTLOOK: 217 TO 227 Figure 1-2. Total Revenues and Outlays Percentage of Gross Domestic Product 28 2 Outlays Average Outlays, 1967 to 216 (2.3%) Projected
CBO s January 2017 Budget and Economic Outlook January 24, 2017 MITCH DANIELS LEON PANETTA TIM PENNY
 CHAIRMEN CBO s January 2017 Budget and Economic Outlook January 24, 2017 MITCH DANIELS LEON PANETTA TIM PENNY As President Trump enters his first full week in office, new Congressional Budget Office (CBO)
The Distribution of Federal Taxes, Jeffrey Rohaly
 www.taxpolicycenter.org The Distribution of Federal Taxes, 2008 11 Jeffrey Rohaly Overall, the federal tax system is highly progressive. On average, households with higher incomes pay taxes that are a
The Outlook for the U.S. Economy March Summary View. The Current State of the Economy
 The Outlook for the U.S. Economy March 2010 Summary View The Current State of the Economy 8% 6% Quarterly Change (SAAR) Chart 1. The Economic Outlook History Forecast The December 2007-2009 recession is
THE TAX POLICY. BRIEFING BOOK A Citizens' Guide for the 2008 Election and Beyond
 BACKGROUND: THE NUMBERS I-1-1 THE TAX POLICY BRIEFING BOOK A Citizens' Guide for the 2008 Election and Beyond THE NUMBERS What are the federal government s sources of revenue?... I-1-1 How does the federal
Deficits and Debt: Economic Effects and Other Issues
 Deficits and Debt: Economic Effects and Other Issues Grant A. Driessen Analyst in Public Finance November 21, 2017 Congressional Research Service 7-5700 www.crs.gov R44383 Summary The federal government
Taxes Primer September 27, 2013
 Taxes Primer September 27, 2013 WHERE DOES THE MONEY COME FROM? Each year, some of the revenue the federal government collects comes from various taxes. In 2012, taxpayers paid almost $2.5 trillion, which
China s Currency: A Summary of the Economic Issues
 Order Code RS21625 Updated January 9, 2008 China s Currency: A Summary of the Economic Issues Summary Wayne M. Morrison Foreign Affairs, Defense, and Trade Division Marc Labonte Government and Finance
An explanation of the Financial Report of the US Government for fiscal year 2015
 An explanation of the Financial Report of the US Government for fiscal year 2015 Prepared on behalf of the Peter G. Peterson Foundation November 2016 An explanation of the Financial Report of the US Government
Current Economic Conditions and Selected Forecasts
 Order Code RL30329 Current Economic Conditions and Selected Forecasts Updated May 20, 2008 Gail E. Makinen Economic Policy Consultant Government and Finance Division Current Economic Conditions and Selected
Military Base Closures: Role and Costs of Environmental Cleanup
 Order Code RS22065 Updated August 31, 2007 Military Base Closures: Role and Costs of Environmental Cleanup Summary David M. Bearden Specialist in Environmental Policy Resources, Science, and Industry Division
How CBO Estimates Automatic Stabilizers
 Working Paper Series Congressional Budget Office Washington, DC How CBO Estimates Automatic Frank Russek Formerly of the Congressional Budget Office (Frank.Russek@rcn.com) Kim Kowalewski Congressional
CBO s January 2015 Budget and Economic Outlook January 26, 2015
 PRESIDENT MAYA MACGUINEAS DIRECTORS BARRY ANDERSON ERSKINE BOWLES CHARLES BOWSHER KENT CONRAD DAN CRIPPEN VIC FAZIO WILLIS GRADISON WILLIAM HOAGLAND JIM JONES LOU KERR JIM KOLBE DAVE MCCURDY JAMES MCINTYRE,
2015: FINALLY, A STRONG YEAR
 2015: FINALLY, A STRONG YEAR A Cushman & Wakefield Research Publication U.S. GDP GROWTH IS ACCELERATING 4% 3.5% Percent Change Annual Rate 2% 0% -2% -4% -5.4% -0.5% 1.3% 3.9% 1.7% 3.9% 2.7% 2.5% -1.5%
BUDGET ENFORCEMENT ACT PREVIEW REPORT
 280-000 0-91-1 (PART 5) XIV. BUDGET ENFORCEMENT ACT PREVIEW REPORT Part Five-1 XIV. BUDGET ENFORCEMENT ACT PREVIEW REPORT The Budget Enforcement Act of 1990 (BEA), which was enacted into law as part of
Impacting PMPM Through Strong Clinical Management AMEDD Example: Redstone Arsenal vs. Ft Anywhere
 2011 Military Health System Conference Impacting PMPM Through Strong Clinical Management AMEDD Example: Redstone Arsenal vs. Ft Anywhere The Quadruple Aim: Working Together, Achieving Success COL Rob Goodman
VIEWPOINTS. tax notes. The Federal Budget Outlook: No News Is Bad News. By Alan J. Auerbach and William G. Gale
 The Federal Budget Outlook: No News Is Bad News By Alan J. Auerbach and William G. Gale Copyright 2012 Alan J. Auerbach and William G. Gale. All rights reserved. VIEWPOINTS tax notes Alan J. Auerbach (auerbach@
January 6, Honorable John Boehner Speaker of the House U.S. House of Representatives Washington, DC Dear Mr. Speaker:
 CONGRESSIONAL BUDGET OFFICE U.S. Congress Washington, DC 20515 Douglas W. Elmendorf, Director January 6, 2011 Honorable John Boehner Speaker of the House U.S. House of Representatives Washington, DC 20515
GAO. DEFENSE CONTRACTING Progress Made in Implementing Defense Base Act Requirements, but Complete Information on Costs Is Lacking
 GAO For Release on Delivery Expected at 10:00 a.m. EDT Thursday, May 15, 2008 United States Government Accountability Office Testimony Before the Committee on Oversight and Government Reform, House of
Despite tax cuts enacted in 1997, federal revenues for fiscal
 What Made Receipts Boom What Made Receipts Boom and When Will They Go Bust? Abstract - Federal revenues surged in the past three fiscal years, with receipts growing much faster than the economy and nearly
The U.S. Economy After the Great Recession: America s Deleveraging and Recovery Experience
 The U.S. Economy After the Great Recession: America s Deleveraging and Recovery Experience Sherle R. Schwenninger and Samuel Sherraden Economic Growth Program March 2014 Introduction The bursting of the
Federal Employees Retirement System: Budget and Trust Fund Issues
 Federal Employees Retirement System: Budget and Trust Fund Issues Katelin P. Isaacs Analyst in Income Security September 27, 2012 CRS Report for Congress Prepared for Members and Committees of Congress
Economic Outlook, January 2016 Jeffrey M. Lacker President, Federal Reserve Bank of Richmond
 Economic Outlook, January 2016 Jeffrey M. Lacker President, Federal Reserve Bank of Richmond Annual Meeting of the South Carolina Business & Industry Political Education Committee Columbia, South Carolina
The Future of Social Security
 Statement of Douglas Holtz-Eakin Director The Future of Social Security before the Special Committee on Aging United States Senate February 3, 2005 This statement is embargoed until 2 p.m. (EST) on Thursday,
Chart Book: Deficit Reduction, the Economy, And the Budget Negotiations By Sharon Parrott, Richard Kogan, Krista Ruffini, and William Chen
 820 First Street NE, Suite 510 Washington, DC 20002 Tel: 202-408-1080 Fax: 202-408-1056 center@cbpp.org www.cbpp.org November 5, 2013 Chart Book: Deficit Reduction, the Economy, And the Budget Negotiations
CHARTS MAY 23, 2017 WASHINGTON, D.C.
 CHARTS MAY 23, 2017 WASHINGTON, D.C. Peterson Foundation charts are available online and are free to use without modification for educational and editorial use, with credit to the Peter G. Peterson Foundation
Deficits and Debt: Economic Effects and Other Issues
 Deficits and Debt: Economic Effects and Other Issues Grant A. Driessen Analyst in Public Finance February 17, 2016 Congressional Research Service 7-5700 www.crs.gov R44383 Summary The federal government
THE LONG-TERM BUDGET OUTLOOK IN THE UNITED STATES AND THE ROLE OF HEALTH CARE ENTITLEMENTS
 National Tax Journal, June 2010, 63 (2), 285 306 THE LONG-TERM BUDGET OUTLOOK IN THE UNITED STATES AND THE ROLE OF HEALTH CARE ENTITLEMENTS Joyce Manchester and Jonathan A. Schwabish In the absence of
War Bonds in the Second World War: A Model for a New Iraq/Afghanistan War Bond?
 War Bonds in the Second World War: A Model for a New Iraq/Afghanistan War Bond? James M. Bickley Specialist in Public Finance March 1, 2010 Congressional Research Service CRS Report for Congress Prepared
CBO. The Budget and Economic Outlook: Fiscal Years 2011 to Debt Held by the Public (Percentage of GDP) The Unemployment Rate (Percent)
 The Unemployment Rate (Percent)") The Budget and Economic Outlook: Fiscal Years 2011 to 2021 120 100 Debt Held by the Public (Percentage of GDP) Actual Projected Under Current Law 80 60 40 20 0 1940 1949 1958 1967 1976 1985 1994 2003 2012
The Budget and Economic Outlook: Fiscal Years 2011 to 2021 120 100 Debt Held by the Public (Percentage of GDP) Actual Projected Under Current Law 80 60 40 20 0 1940 1949 1958 1967 1976 1985 1994 2003 2012
THE PRESIDENT S BUDGET: A PRELIMINARY ANALYSIS
 820 First Street NE, Suite 510 Washington, DC 20002 Tel: 202-408-1080 Fax: 202-408-1056 center@cbpp.org www.cbpp.org Revised February 10, 2006 THE PRESIDENT S BUDGET: A PRELIMINARY ANALYSIS An administration
Notes Unless otherwise indicated, the years referred to in this report are calendar years. Fiscal years run from October to September 3 and are design
 CONGRESS OF THE UNITED STATES CONGRESSIONAL BUDGET OFFICE Social Security Policy Options, Percentage of Gross Domestic Product Actual Projected Outlays With Scheduled Benefits 6 Tax Revenues Outlays With
Notes Except where noted otherwise, dollar amounts are expressed in 214 dollars. Nominal (current-dollar) spending was adjusted to remove the effects
 spending was adjusted to remove the effects") CONGRESS OF THE UNITED STATES CONGRESSIONAL BUDGET OFFICE Public Spending on Transportation and Water Infrastructure, 1956 to 214 MARCH 215 Notes Except where noted otherwise, dollar amounts are expressed
CONGRESS OF THE UNITED STATES CONGRESSIONAL BUDGET OFFICE Public Spending on Transportation and Water Infrastructure, 1956 to 214 MARCH 215 Notes Except where noted otherwise, dollar amounts are expressed
continue to average 0.2 percent of GDP from 2018 through 2028, CBO projects.
 74 The Budget and Economic Outlook: 2018 to 2028 April 2018 continue to average 0.2 percent of GDP from 2018 through 2028, CBO projects. Tax Many exclusions, deductions, preferential rates, and credits
Economic Growth Expected to Slow and Housing to Stabilize in 2019
 Consumer Confidence Expectations in the Next Six Months (%) Economic Developments December 218 Economic Growth Expected to Slow and Housing to Stabilize in 219 The U.S. economy is expected to grow 2.6
Notes Unless otherwise indicated, all years referred to in this report regarding budgetary outlays and revenues are federal fiscal years, which run fr
 CONGRESS OF THE UNITED STATES CONGRESSIONAL BUDGET OFFICE Options for Reducing the Deficit: 217 to 226 DECEMBER 216 Notes Unless otherwise indicated, all years referred to in this report regarding budgetary
tbo The Budget Outlook Is Even Worse than Reported BY: DEMIAN BRADY A publication of the National Taxpayers Union Foundation FEBRUARY 8, 2019
 tbo The Budget Outlook Is Even Worse than Reported BY: DEMIAN BRADY FEBRUARY 8, 2019 A publication of the National Taxpayers Union Foundation Introduction The Congressional Budget Office (CBO) has published
Veterans Benefits: Pension Benefit Programs
 Christine Scott Specialist in Social Policy Carol D. Davis Information Research Specialist February 26, 2010 Congressional Research Service CRS Report for Congress Prepared for Members and Committees of
H.R American Health Care Act of 2017
 CONGRESSIONAL BUDGET OFFICE COST ESTIMATE May 24, 2017 H.R. 1628 American Health Care Act of 2017 As passed by the House of Representatives on May 4, 2017 SUMMARY The Congressional Budget Office and the