Do Older Americans Have More Income Than We Think?
|
|
|
- Horace Daniels
- 5 years ago
- Views:
Transcription
1 Do Older Americans Have More Income Than We Think? Josh Mitchell and Adam Bee U.S. Census Bureau December 14, 2017 The views expressed in this research, including those related to statistical, methodological, technical, or operational issues, are solely those of the author and do not necessarily reflect the official positions or policies of the Census Bureau. The author accepts responsibility for all errors. This presentation is released to inform interested parties of ongoing research and to encourage discussion of work in progress. This presentation reports the results of research and analysis undertaken by Census Bureau staff. It has undergone more limited review than official publications.
2 Motivation Broad concern about well-being of Americans as they near and enter retirement Have people saved enough? Data quality concerns as well Discrepancies between survey income aggregates and other data sources such as National Income and Product Accounts and administrative records (ADREC) By themselves, aggregate discrepancies cannot address questions about the distribution of income 2
3 Contributions Bring unique data sources together to develop new, nationally representative estimates of median household income and poverty for the population 65+ through 2012 Explore which ADREC data sources are most important for our findings Reassess Importance of DB and DC income for current retirees Relative importance of Social Security income Transition to retirement (Retirement Consumption Puzzle) 3
4 Data I: 2013 CPS ASEC Approximately 75,000 households 15,000 households with householder age 65+ Represents civilian noninstitutionalized population Source for official 2012 Income and Poverty Report Uses traditional income questions PVS Process to assign Protected Identification Key (PIK) Logit to estimate inverse probabilities and reweight PIK sample 4
5 Validating Five Types of Income in CPS ASEC Earnings (wages and self-employment) Social Security (OASDI) Supplemental Security Income (SSI) Dividends and Interest Retirement Income (excludes Social Security) Retirement Survivor Disability 5
6 Money Income and the CPS ASEC Stream of regular payments Challenge of changing retirement landscape Shift from Defined Benefit (DB) to Defined Contribution (DC) Treatment of as-needed withdrawals, lump-sums, rollovers 2014 CPS ASEC Redesign Adds specific questions about retirement account withdrawals Address underreporting of asset income Semega and Welniak (2015) Compare traditional and redesigned income questions Find 4.6% increase in median income for householders aged 65+ 6
7 2013 CPS-ASEC Retirement Income Question During 2012 did (you/ anyone in this household) receive any pension or retirement income from a previous employer or union, or any other type of retirement income (other than Social Security/ other than VA benefits/ other than Social Security or VA benefits)? What was the source? 1 Company or union pension (INCLUDE PROFIT SHARING) 2 Federal Government (CIVIL SERVICE) retirement 3 U.S. Military retirement 4 State or Local government pension 5 U.S. Railroad Retirement 6 Regular payments from annuities or paid up insurance policies 7 Regular payments from IRA, KEOGH, 401(k), 403(b), and 457(b) and (f) accounts 8 Other sources or don t know 7
8 Data II: ADREC Data from SSA Earnings Wage and salary earnings from all W-2 jobs Self-employment earnings from Schedule SE OASDI Benefits Includes deductions for Medicare premiums SSI Benefits Federal and state supplements 8
9 Data III: ADREC Data from IRS Form 1040 Total dividend income, taxable and tax-exempt interest income Complications for joint filers and non-filers Form 1099-R Gross distributions from pensions, annuities, retirement or profit-sharing plans, IRAs etc. (DB and DC income) Available even if do not file 1040 INCLUDES Early Distributions Normal Distributions Disability and Death Distributions Roth Distributions EXCLUDES Direct Rollovers Conversions and Recharacterizations Excess Contributions Section 1035 Exchanges 9
10 More on Form 1099-R Our extract has two categories IRA (Roth, traditional, SIMPLE, SEP) Reported on line 15 of Form 1040 Employer Sponsored Reported on line 16 of Form 1040 Alternative income concept When distribution permanently leaves tax-preferred accounts and is available for consumption Short and Skog (2014), Iams and Purcell (2013) May not be able to exclude indirect rollovers Under 3% of aggregate gross for age 55+ (Argento et al., 2015) 10
11 Constructing New Income Variables Merge on PIK to assign ADREC income to CPS at person-level Complication with 1040s (joint returns and non-filers) Replace CPS income amounts with corresponding ADREC amounts Those with PIKs but who do not match to a given ADREC have zero of that type of income Those without PIKs keep CPS values Outside of five sources of validated income just using CPS values Sum up to family and household levels as needed 11
12 CPS Income as Percent of ADREC 130% 120% 110% 100% 90% 80% 70% 60% 50% 40% 30% 20% 10% 0% Earnings Social Security SSI Interest Retirement and Income Dividends All Five Sources Age Age 65+ Source: 2013 CPS ASEC-ADREC 12
13 What are Distributional Implications? Median household income Householders age 65+ Explore subgroups classified by demographic characteristics of householder Poverty Persons age 65+ Compare family income to threshold which varies by family size Three samples in analysis Full CPS sample (N=23,000 persons, 15,000 households) PIK reweighted sample (N=21,000 persons, 13,500 households) ADREC sample (same as PIK sample but replaced with ADREC income) 13
14 Median Household Income (Householder Age 65+) $50,000 $45,000 $40,000 $35,000 $30,000 $25,000 $20,000 $15,000 $10,000 $5,000 $0 $33,848 FULL CPS PIK CPS ADREC Source: 2013 CPS ASEC-ADREC 14
15 Median Household Income (Householder Age 65+) $50,000 $45,000 $40,000 $35,000 $30,000 $25,000 $20,000 $15,000 $10,000 $5,000 $0 $33,848 $34,037 FULL CPS PIK CPS ADREC Source: 2013 CPS ASEC-ADREC 15
16 Median Household Income (Householder Age 65+) $50,000 $45,000 $40,000 $35,000 $30,000 $25,000 $20,000 $15,000 $10,000 $5,000 $0 $33,848 $34,037 $44,371 FULL CPS PIK CPS ADREC Source: 2013 CPS ASEC-ADREC 16
17 $60,000 $50,000 $40,000 $30,000 $20,000 $10,000 Median Household Income (Householder Age 65-74) $42,343 $42,939 $52,118 $0 FULL CPS PIK CPS ADREC Source: 2013 CPS ASEC-ADREC 17
18 Median Household Income (Householder Age 75-84) $45,000 $40,000 $35,000 $30,000 $25,000 $20,000 $15,000 $10,000 $5,000 $0 $28,517 $28,566 $38,982 FULL CPS PIK CPS ADREC Source: 2013 CPS ASEC-ADREC 18
19 Median Household Income (Householder Age 85+) $35,000 $30,000 $25,000 $20,000 $15,000 $10,000 $5,000 $0 $22,800 $22,875 $30,325 FULL CPS PIK CPS ADREC Source: 2013 CPS ASEC-ADREC 19
20 $70,000 $60,000 $50,000 $40,000 $30,000 $20,000 $10,000 Median Household Income (Family Householder Age 65+) $49,196 $49,375 $62,144 $0 FULL CPS PIK CPS ADREC Source: 2013 CPS ASEC-ADREC 20
21 Median Household Income (Non-Family Householder Age 65+) $30,000 $27,196 $25,000 $20,000 $20,856 $20,954 $15,000 $10,000 $5,000 $0 FULL CPS PIK CPS ADREC Source: 2013 CPS ASEC-ADREC 21
22 Median Household Income (College Graduate Householder Age 65+) $90,000 $80,000 $70,000 $60,000 $50,000 $40,000 $30,000 $20,000 $10,000 $0 $60,083 $60,700 $78,231 FULL CPS PIK CPS ADREC Source: 2013 CPS ASEC-ADREC 22
23 $50,000 $45,000 $40,000 $35,000 $30,000 $25,000 $20,000 $15,000 $10,000 $5,000 $0 Median Household Income (Some College Householder Age 65+) $36,452 $36,521 $47,137 FULL CPS PIK CPS ADREC Source: 2013 CPS ASEC-ADREC 23
24 $40,000 $35,000 $30,000 $25,000 $20,000 $15,000 $10,000 $5,000 $0 Median Household Income (High School Graduate Householder Age 65+) $29,362 $29,514 $37,690 FULL CPS PIK CPS ADREC Source: 2013 CPS ASEC-ADREC 24
25 $25,000 $20,000 Median Household Income (Less than High School Householder Age 65+) $19,769 $19,917 $23,381 $15,000 $10,000 $5,000 $0 FULL CPS PIK CPS ADREC Source: 2013 CPS ASEC-ADREC 25
26 $50,000 $45,000 $40,000 $35,000 $30,000 $25,000 $20,000 $15,000 $10,000 $5,000 $0 Median Household Income (White, Not Hispanic Householder Age 65+) $35,559 $35,789 $46,811 FULL CPS PIK CPS ADREC Source: 2013 CPS ASEC-ADREC 26
27 $35,000 $30,000 $25,000 $20,000 $15,000 $10,000 $5,000 Median Household Income (Black Householder Age 65+) $25,182 $25,272 $32,224 $0 FULL CPS PIK CPS ADREC Source: 2013 CPS ASEC-ADREC 27
28 $50,000 $45,000 $40,000 $35,000 $30,000 $25,000 $20,000 $15,000 $10,000 $5,000 $0 Median Household Income (Asian Householder Age 65+) $37,445 $37,855 $47,526 FULL CPS PIK CPS ADREC Source: 2013 CPS ASEC-ADREC 28
29 $35,000 $30,000 $25,000 $20,000 $15,000 $10,000 $5,000 Median Household Income (Hispanic Householder Age 65+) $24,122 $23,803 $30,016 $0 FULL CPS PIK CPS ADREC Source: 2013 CPS ASEC-ADREC 29
30 Comparison to 2013 SCF Designed to collect detailed wealth information Retirement account withdrawals Same calendar year reference period (2012) More expansive definition of income Capital gains Withdrawals Food stamps Generally shows higher incomes than CPS for population
31 Median Household Income (Householder Age 65-74) $60,000 $50,000 $40,000 $30,000 $20,000 $10,000 $42,939 $45,244 $52,118 $0 PIK CPS SCF ADREC Source: 2013 CPS ASEC-ADREC 31
32 Median Household Income (Householder Age 75+) $40,000 $35,000 $30,000 $25,000 $20,000 $15,000 $10,000 $5,000 $0 $35,908 $26,610 $28,093 PIK CPS SCF ADREC Source: 2013 CPS ASEC-ADREC 32
33 Poverty Rate (Persons Age 65+) FULL CPS PIK CPS ADREC Source: 2013 CPS ASEC-ADREC 33
34 Poverty Rate (Persons Age 65+) FULL CPS PIK CPS ADREC Source: 2013 CPS ASEC-ADREC 34
35 Poverty Rate (Persons Age 65+) FULL CPS PIK CPS ADREC Source: 2013 CPS ASEC-ADREC 35
36 Poverty Rate (Persons Age 65-74) FULL CPS PIK CPS ADREC Source: 2013 CPS ASEC-ADREC 36
37 Poverty Rate (Persons Age 75-84) FULL CPS PIK CPS ADREC Source: 2013 CPS ASEC-ADREC 37
38 Poverty Rate (Persons Age 85+) FULL CPS PIK CPS ADREC Source: 2013 CPS ASEC-ADREC 38
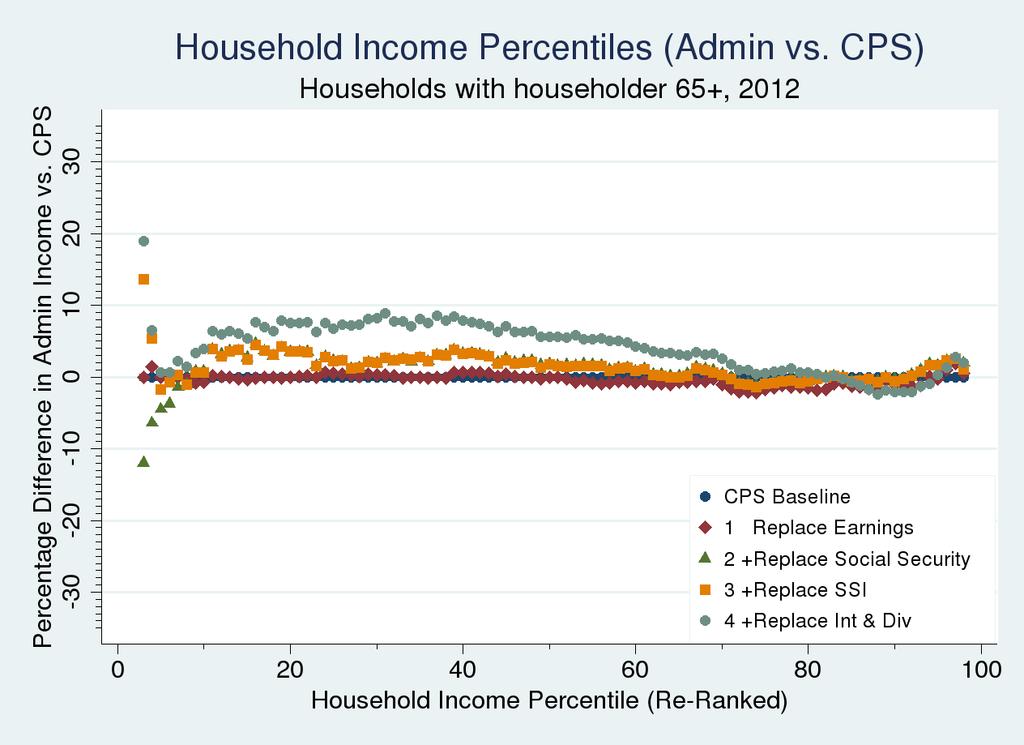
39 Which ADREC Source Is Driving our Results? Examine each percentile of the household income distribution Replace CPS income sources one at a time Rerank households based on modified income Compute percent change for each percentile relative to CPS baseline 39
40 40
41 41
42 42
43 43
44 44
45 45
46 Potential Issues Quality of ADREC Quality of data linkages Alternative income concepts Treatment of D.C. withdrawals versus D.B. Haig-Simons Taxable income, Disposable Income (NIPA) Federal Reserve Bulletin CPS Redesign 46
47 Correlation Coefficient Correlation of Log ADREC and CPS Income (Persons Age 65+, Intensive Margin) Earnings Social Security SSI Retirement Retirement (No IRA) 47
48 Percent with Any Social Security Income (Persons Age 65+) 100% 80% 84% 85% 86% 60% 40% 20% 0% FULL CPS PIK CPS ADREC Source: 2013 CPS ASEC-ADREC 48
49 Percent with Any Retirement Income (Persons Age 65+) 100% 80% 60% 40% 36% 37% 61% 20% 0% FULL CPS PIK CPS ADREC Source: 2013 CPS ASEC-ADREC 49
50 1099-R Income Receipt (Persons Age 65+) 100% 80% 60% 50% 61% 40% 29% 20% 0% ADREC-Employer ADREC-IRA ADREC-Either Source: 2013 CPS ASEC-ADREC 50
51 What Explains Retirement Income Underreporting? Demographic variables explain about 5 percent of variation Survey design features another 2 percent American Community Survey shows similar false negative rate Nature of 1099-R income matters the most 14 percent IRA versus Employer-sponsored Amounts Volatility 51
52 Concern about Single Year 1099R Distributions Are these mainly lump-sums or recurring payments? Indirect rollovers or other amounts we would want to exclude? Compare TY 2012 and TY R distributions for those receiving a TY 2012 distribution Look across age distribution Compare results for employer-sponsored and IRAs 52
53 Percent of Persons Any 1099R Employer Income in 2013 (Conditional on Employer Income in 2012) 100% 90% 80% 70% 60% 50% 40% 30% 20% 10% 0% 95% 98% 97% 85% 52% 32% 21% Age Source: 2013 CPS ASEC-ADREC 53
54 Percent of Persons Size Distribution of R Employer Change (Conditional on Employer Income in 2012) 100% 90% 80% 70% 60% 50% 40% 30% 20% 10% 0% 86% 83% 78% 58% Drop > 10% 30% Change <= 10% 3% 7% Increase > 10% Age Source: 2013 CPS ASEC-ADREC 54
55 Percent of Persons Any 1099R IRA Income in 2013 (Conditional on IRA Income in 2012) 100% 90% 80% 70% 60% 50% 40% 30% 20% 10% 0% 97% 97% 87% 61% 38% 45% 23% Age Source: 2013 CPS ASEC-ADREC 55
56 Percent of Persons Size Distribution of R IRA Change (Conditional on IRA Income in 2012) 100% 90% 80% 70% 60% 50% 40% 30% 20% 10% 0% 62% 53% Drop > 10% 35% Change <= 10% 16% 4% 4% 8% Increase > 10% Age Source: 2013 CPS ASEC-ADREC 56
57 Underreporting of Defined Benefit Income? Examine Specific Government Retirement Plans Traditional DB plans, satisfy money income concept Examine CPS responses for persons age 65+ who receive 1099-R distribution from: Civil Service Retirement System Military Retirement Fund CALPERS 57
58 Reported Receipt Among 1099-R Annuitants (Age 65+, Excludes Imputations) Any ES Fed CSRS Military CalPERS Source: 2013 CPS ASEC-ADREC 58
59 Relative Importance of Different Income Sources Income of the Aged chartbook for population 65+ Previous edition also based on 2013 CPS-ASEC Focus on aged units How does increase in ADREC retirement income affect relative importance of all income sources? 59
60 Social Security Receipt Rate (Among Aged Units) Overall ADREC Total Income Decile CPS ADREC Source: 2013 CPS ASEC-ADREC 60
61 Social Security Unconditional Mean Amounts (Among Aged Units) $25,000 $20,000 $15,000 $10,000 $5,000 CPS ADREC $ Overall ADREC Total Income Decile Source: 2013 CPS ASEC-ADREC 61
62 Retirement Income Receipt Rate (Among Aged Units) CPS ADREC Overall ADREC Total Income Decile Source: 2013 CPS ASEC-ADREC 62
63 ADREC Retirement Income Receipt Rate by Type (Among Aged Units) Total D.B IRA Employer D.C Unknown Overall ADREC Total Income Decile Source: 2013 CPS ASEC-ADREC 63
64 80,000 ADREC Retirement Income Unconditional Mean Amounts (Among Aged Units) 70,000 60,000 50,000 40,000 30,000 20,000 10,000 0 Total Retirement D.B. IRA Employer D.C. Unknown Overall ADREC Total Income Decile Source: 2013 CPS ASEC-ADREC 64
65 CPS Income Shares Across Deciles (Among Aged Units) CPS Income Decile Earnings Social Security SSI Int/Div Retirement Other Source: 2013 CPS ASEC-ADREC 65
66 ADREC Income Shares Across Deciles (Among Aged Units) ADREC Income Decile Earnings Social Security SSI Int/Div Retirement Other Source: 2013 CPS ASEC-ADREC 66
67 ADREC Retirement Income Shares Across Deciles (Among Aged Units) ADREC Income Decile D.B. IRA Non-IRA D.C. Unknown 67 Source: 2013 CPS ASEC-ADREC
68 Percent of Aged Unit Beneficiaries with Social Security at least 50 Percent of Income 100% 90% 80% 70% 60% 50% 40% 30% 20% 10% 0% 65% 64% 50% Full CPS Sample CPS PIK Sample Linked CPS-Admin Sample Source: 2013 CPS ASEC-ADREC 68
69 Percent of Aged Unit Beneficiaries with Social Security at least 90 Percent of Income 100% 90% 80% 70% 60% 50% 40% 30% 20% 10% 0% 36% 36% 18% Full CPS Sample CPS PIK Sample Linked CPS-Admin Sample Source: 2013 CPS ASEC-ADREC 69
70 Long-run Trends Use archived ADREC to construct consistent measures of income and poverty over time and compare to survey values Income quantiles (1990, 1995, ) CPI-U-RS used to put in 2012 dollars Poverty rates 1990,1995,
71 $90,000 Income Quartiles, Aged 65 and Over $80,000 $70,000 $60,000 $50,000 $40,000 $30, th percentile Median $34,400 Linked SIPP-Admin $44,400 $33,800 Linked CPS-Admin Full ASEC Sample $28,700 $20,000 $10, th percentile $
72 Poverty Rates, Aged 65 and Over 20% 15% 10% 5% Full CPS Sample Linked CPS-Admin Sample 0%
73 Aged 65 and Over 100% 91% Linked SIPP-Admin SS Linked CPS-Admin SS 80% 91% CPS Survey SS 86% 84% 60% 45% Linked SIPP-Admin Retirement 61% Linked CPS-Admin Retirement 40% 40% 36% CPS Survey Retirement 20% 0%
74 Retirement Transition Relative metric How well are pre-retirement living standards maintained? Retirement Consumption Puzzle Absolute metric Do we observe increases in poverty? Synthetic cohort approach (enhanced with ADREC) Compare two income measures Observe living arrangements 74
75 Sample Construction Pool linked CPS-ASEC samples Individual-level analysis First claimed Social Security between Aged 60 to 70 when first claimed Did not claim SSDI Survived at least 5 years after claiming Income treatment of married couples and single individuals 75
76 Median Incomes for Men (Years Surrounding Social Security Claim) $70,000 $60,000 $50,000 $40,000 $30,000 $20,000 CPS ASEC $10,000 $0 t-5 t-4 t-3 t-2 t-1 t t+1 t+2 t+3 t+4 t+5 Years from Social Security Claim Source: CPS ASEC linked to administrative records 76
77 Median Incomes for Men (Years Surrounding Social Security Claim) $70,000 $60,000 $50,000 $40,000 $30,000 $20,000 CPS ASEC ADREC $10,000 $0 t-5 t-4 t-3 t-2 t-1 t t+1 t+2 t+3 t+4 t+5 Years from Social Security Claim Source: CPS ASEC linked to administrative records 77
78 Median Incomes for Women (Years Surrounding Social Security Claim) $60,000 $50,000 $40,000 $30,000 $20,000 CPS ASEC ADREC $10,000 $0 t-5 t-4 t-3 t-2 t-1 t t+1 t+2 t+3 t+4 t+5 Years from Social Security Claim Source: CPS ASEC linked to administrative records 78
79 Proportion of Men Below 100% Poverty (Years Surrounding Social Security Claim) t-5 t-4 t-3 t-2 t-1 t t+1 t+2 t+3 t+4 t+5 Years from Social Security Claim CPS ASEC ADREC Source: CPS ASEC linked to administrative records 79
80 Proportion of Men Below 200% Poverty (Years Surrounding Social Security Claim) CPS ASEC ADREC t-5 t-4 t-3 t-2 t-1 t t+1 t+2 t+3 t+4 t+5 Years from Social Security Claim Source: CPS ASEC linked to administrative records 80
81 Proportion of Men Below 300% Poverty (Years Surrounding Social Security Claim) t-5 t-4 t-3 t-2 t-1 t t+1 t+2 t+3 t+4 t+5 Years from Social Security Claim CPS ASEC ADREC Source: CPS ASEC linked to administrative records 81
82 Proportion of Women Below 100% Poverty (Years Surrounding Social Security Claim) t-5 t-4 t-3 t-2 t-1 t t+1 t+2 t+3 t+4 t+5 Years from Social Security Claim CPS ASEC ADREC Source: CPS ASEC linked to administrative records 82
83 Proportion of Women Below 200% Poverty (Years Surrounding Social Security Claim) CPS ASEC ADREC t-5 t-4 t-3 t-2 t-1 t t+1 t+2 t+3 t+4 t+5 Years from Social Security Claim Source: CPS ASEC linked to administrative records 83
84 Proportion of Women Below 300% Poverty (Years Surrounding Social Security Claim) t-5 t-4 t-3 t-2 t-1 t t+1 t+2 t+3 t+4 t+5 Years from Social Security Claim CPS ASEC ADREC Source: CPS ASEC linked to administrative records 84
85 Summary of Retirement Transition Incomes fall much more in survey than in ADREC Income declines start several years prior to claiming, no abrupt changes at retirement No evidence that poverty rises in either series 200 and 300 percent poverty rises much more in survey than in ADREC Inconsistent with Retirement Consumption Puzzle 85
86 Caveats to Our Overall Findings Only examine incomes of the population aged 65 and over through 2012 Cannot easily extrapolate findings to future retirees Income may not capture all aspects of material wellbeing (rising debt levels) Analysis of retirement transitions cannot answer whether people run out of money many years later 86
87 Thank You and Contact Josh Mitchell C. Adam Bee 87
Do Older Americans Have More Income Than We Think?
 Do Older Americans Have More Income Than We Think? Adam Bee and Josh Mitchell U.S. Census Bureau Presented at National Tax Association Meetings Philadelphia November 9, 2017 The views expressed in this
Aging Seminar Series:
 Aging Seminar Series: Income and Wealth of Older Americans Domestic Social Policy Division Congressional Research Service November 19, 2008 Introduction Aging Seminar Series Focus on important issues regarding
How Economic Security Changes during Retirement
 How Economic Security Changes during Retirement Barbara A. Butrica March 2007 The Retirement Project Discussion Paper 07-02 How Economic Security Changes during Retirement Barbara A. Butrica March 2007
Income of the Aged Chartbook, 2004
 Cornell University ILR School DigitalCommons@ILR Federal Publications Key Workplace Documents 9-2006 Income of the Aged Chartbook, 2004 Social Security Administration Follow this and additional works at:
Income and Poverty Among Older Americans in 2008
 Income and Poverty Among Older Americans in 2008 Patrick Purcell Specialist in Income Security October 2, 2009 Congressional Research Service CRS Report for Congress Prepared for Members and Committees
Current Population Survey: Issues Continue for Retirement Plan Participation and Retiree Income Estimates
 June 12, 2018 No. 452 Current Population Survey: Issues Continue for Retirement Plan Participation and Retiree Income Estimates By Craig Copeland, Ph.D., Employee Benefit Research Institute A T A G L A
Income of the Aged Chartbook, 2002
 Cornell University ILR School DigitalCommons@ILR Federal Publications Key Workplace Documents 9-2004 Income of the Aged Chartbook, 2002 Social Security Administration Follow this and additional works at:
The Economic Well-being of the Aged Population in the Early 1990s, 2025, and 2060: An Analysis of Social Security Benefits and Retirement Income
 The Economic Well-being of the Aged Population in the Early 1990s, 2025, and 2060: An Analysis of Social Security Benefits and Retirement Income Barbara A. Butrica and Howard M. Iams March 2005 Draft:
Retirement Annuity and Employment-Based Pension Income, Among Individuals Aged 50 and Over: 2006
 Retirement Annuity and Employment-Based Pension Income, Among Individuals d 50 and Over: 2006 by Ken McDonnell, EBRI Introduction This article looks at one slice of the income pie of the older population:
PROJECTING POVERTY RATES IN 2020 FOR THE 62 AND OLDER POPULATION: WHAT CHANGES CAN WE EXPECT AND WHY?
 PROJECTING POVERTY RATES IN 2020 FOR THE 62 AND OLDER POPULATION: WHAT CHANGES CAN WE EXPECT AND WHY? Barbara A. Butrica, The Urban Institute Karen Smith, The Urban Institute Eric Toder, Internal Revenue
The Relationship Between Income and Health Insurance, p. 2 Retirement Annuity and Employment-Based Pension Income, p. 7
 E B R I Notes E M P L O Y E E B E N E F I T R E S E A R C H I N S T I T U T E February 2005, Vol. 26, No. 2 The Relationship Between Income and Health Insurance, p. 2 Retirement Annuity and Employment-Based
ICI RESEARCH PERSPECTIVE
 ICI RESEARCH PERSPECTIVE 1401 H STREET, NW, SUITE 1200 WASHINGTON, DC 20005 202-326-5800 WWW.ICI.ORG JULY 2017 VOL. 23, NO. 5 WHAT S INSIDE 2 Introduction 4 Which Workers Would Be Expected to Participate
BoomersattheBotom: HowWilLowIncomeBoomersCopewithRetirement? BarbaraA.Butrica,EricJ.Toder,andDesmondJ.Toohey TheUrbanInstitute
 BoomersattheBotom: HowWilLowBoomersCopewithRetirement? BarbaraA.Butrica,EricJ.Toder,andDesmondJ.Toohey TheUrbanInstitute Boomers at the Bottom: How Will Low Boomers Cope with Retirement? by Barbara A.
Retirement Security: What s Working and What s Not? James Poterba MIT, NBER, & TIAA-CREF. Bipartisan Policy Center 30 July 2014
 Retirement Security: What s Working and What s Not? James Poterba MIT, NBER, & TIAA-CREF Bipartisan Policy Center 30 July 2014 Retirement Support: A Three Legged Stool? Three Legs: Social Security, Private
Retirement Plan Coverage of Baby Boomers: Analysis of 1998 SIPP Data. Satyendra K. Verma
 A Data and Chart Book by Satyendra K. Verma August 2005 Retirement Plan Coverage of Baby Boomers: Analysis of 1998 SIPP Data by Satyendra K. Verma August 2005 Components Retirement Plan Coverage in 1998:
PROJECTING POVERTY RATES IN 2020 FOR THE 62 AND OLDER POPULATION: WHAT CHANGES CAN WE EXPECT AND WHY?
 PROJECTING POVERTY RATES IN 2020 FOR THE 62 AND OLDER POPULATION: WHAT CHANGES CAN WE EXPECT AND WHY? Barbara A. Butrica, The Urban Institute Karen Smith, The Urban Institute Eric Toder, Internal Revenue
CRS Report for Congress Received through the CRS Web
 Order Code RL33387 CRS Report for Congress Received through the CRS Web Topics in Aging: Income of Americans Age 65 and Older, 1969 to 2004 April 21, 2006 Patrick Purcell Specialist in Social Legislation
Sources of Income for Older Persons, 2006
 Fact Sheet Sources of for Older Persons, 2006 AARP Public Policy Institute Older persons with low income depend heavily on Social Security. Over the past 11 years, earnings have become a more important
Social Security Income Measurement in Two Surveys
 Social Security Income Measurement in Two Surveys Howard Iams and Patrick Purcell Office of Research, Evaluation, and Statistics Social Security Administration Abstract Social Security is a major source
ALL RETIREMENT PLAN COVERAGE TABLES
 ALL RETIREMENT PLAN COVERAGE TABLES 1. Employer-Sponsored Retirement Coverage, Civilian, 2008-2014 (%) 2. Employer-Sponsored Retirement Coverage, Private-Sector, 2003-2014 (%) 3. Employer-Sponsored Retirement
Income and Poverty Among Older Americans in 2006
 Cornell University ILR School DigitalCommons@ILR Federal Publications Key Workplace Documents September 2007 Income and Poverty Among Older Americans in 2006 Patrick Purcell Congressional Research Service,
Poverty Facts, million people or 12.6 percent of the U.S. population had family incomes below the federal poverty threshold in 2004.
 Poverty Facts, 2004 How Many People Are Poor? 36.6 million people or 12.6 percent of the U.S. population had family incomes below the federal poverty threshold in 2004. 1 How Much Money Do Families Need
SOURCES OF INCOME FOR OLDER PERSONS IN 2003
 SOURCES OF INCOME FOR OLDER PERSONS IN 2003 Social Security, pensions and personal savings, and earnings constitute three of the four pillars of retirement income security (the fourth being health insurance).
CHAPTER 5 PROJECTING RETIREMENT INCOME FROM PENSIONS
 CHAPTER 5 PROJECTING RETIREMENT INCOME FROM PENSIONS I. OVERVIEW The MINT 3. pension projection module estimates pension benefits and wealth from defined benefit (DB) plans, defined contribution (DC) plans,
Retirement Savings and Household Wealth in 2007
 Retirement Savings and Household Wealth in 2007 Patrick Purcell Specialist in Income Security April 8, 2009 Congressional Research Service CRS Report for Congress Prepared for Members and Committees of
Getting More from Survey Income Measures: Empirically-based Recommendations for Improving Accuracy and Efficiency
 Getting More from Survey Income Measures: Empirically-based Recommendations for Improving Accuracy and Efficiency John L. Czajka* and Gabrielle Denmead** *Mathematica Policy Research 1100 First Street,
Program on Retirement Policy Number 1, February 2011
 URBAN INSTITUTE Retirement Security Data Brief Program on Retirement Policy Number 1, February 2011 Poverty among Older Americans, 2009 Philip Issa and Sheila R. Zedlewski About one in three Americans
John L. Czajka and Randy Rosso
 F I N A L R E P O R T Redesign of the Income Questions in the Current Population Survey Annual Social and Economic Supplement: Further Analysis of the 2014 Split- Sample Test September 27, 2015 John L.
2018 Social Security Reference Guide
 2018 Social Security Reference Guide TABLE OF CONTENTS Important Ages... 1 Full Retirement Age (FRA)... 1 Milestone Ages... 1 Retirement Benefits... 2 Requirements to Qualify for Social Security Retirement
Summary Preparing for financial security in retirement continues to be a concern of working Americans and policymakers. Although most Americans partic
 Ownership of Individual Retirement Accounts (IRAs) and Policy Options for Congress John J. Topoleski Analyst in Income Security January 7, 2011 Congressional Research Service CRS Report for Congress Prepared
Aging in America: Income and Assets of People on Medicare
 Aging in America: Income and Assets of People on Medicare November 6, 2015 National Health Policy Forum Gretchen Jacobson, Ph.D. Associate Director, Program on Medicare Policy Kaiser Family Foundation
Retirement Savings: How Much Will Workers Have When They Retire?
 Order Code RL33845 Retirement Savings: How Much Will Workers Have When They Retire? January 29, 2007 Patrick Purcell Specialist in Social Legislation Domestic Social Policy Division Debra B. Whitman Specialist
A Consistent Data Series to Evaluate Growth and Inequality in the National Accounts
 A Consistent Data Series to Evaluate Growth and Inequality in the National Accounts David Johnson with D. Fixler, A. Craig, K. Furlong, Bureau of Economic Analysis Frontiers of Measuring Household Economic
Redistribution under OASDI: How Much and to Whom?
 9 Redistribution under OASDI: How Much and to Whom? Lee Cohen, Eugene Steuerle, and Adam Carasso T his chapter presents the results from a study of redistribution in the Social Security program under current
Demographic and Other Statistics for Women and Men Aged 50 and Older,
 Demographic and Other Statistics for Women and Men Aged 50 and Older, 1999-2001 Population in 2001 Proportion of Population Over Age 50 30.0 % 28.6 % 28.6 % 25.2 % Age Distribution: 50-61 41.9 49.6 45.5
Topics in Aging: Income and Poverty Among Older Americans in 2005
 Cornell University ILR School DigitalCommons@ILR Congressional Research Service (CRS) Reports and Issue Briefs Federal Publications September 2006 Topics in Aging: Income and Poverty Among Older Americans
NBER WORKING PAPER SERIES
 NBER WORKING PAPER SERIES MISMEASUREMENT OF PENSIONS BEFORE AND AFTER RETIREMENT: THE MYSTERY OF THE DISAPPEARING PENSIONS WITH IMPLICATIONS FOR THE IMPORTANCE OF SOCIAL SECURITY AS A SOURCE OF RETIREMENT
FIGURE I.1 / Per Capita Gross Domestic Product and Unemployment Rates. Year
 FIGURE I.1 / Per Capita Gross Domestic Product and Unemployment Rates 40,000 12 Real GDP per Capita (Chained 2000 Dollars) 35,000 30,000 25,000 20,000 15,000 10,000 5,000 Real GDP per Capita Unemployment
Fast Facts & Figures About Social Security, 2005
 Fast Facts & Figures About Social Security, 2005 Social Security Administration Office of Policy Office of Research, Evaluation, and Statistics 500 E Street, SW, 8th Floor Washington, DC 20254 SSA Publication
Distribution of Household Wealth in the U.S.: 2000 to 2011
 Cornell University ILR School DigitalCommons@ILR Federal Publications Key Workplace Documents 2014 Distribution of Household Wealth in the U.S.: Marina Vornovitsky U.S. Census Bureau Alfred Gottschalck
A Data and Chart Book. August by Retirement Plan Coverage of Boomers: Analysis of 2003 SIPP Data. Satyendra K. Verma. Satyendra K.
 A Data and Chart Book by Retirement Plan Coverage of Boomers: Analysis of 2003 SIPP Data Satyendra K. Verma by Satyendra K. Verma August 2006 August 2006 Components Retirement Retirement Plan Coverage
More than 62 million people receive Social Security each month, in one of three categories: Nearly 1 in 5 Americans gets Social Security benefits.
 National Academy of Social Insurance www.nasi.org August 2018 More than 62 million people receive Social Security each month, in one of three categories: Retirement insurance Survivors insurance Disability
Demographic and Economic Characteristics of Children in Families Receiving Social Security
 Each month, over 3 million children receive benefits from Social Security, accounting for one of every seven Social Security beneficiaries. This article examines the demographic characteristics and economic
Assessing Economic Resources in Retirement: The Role of Irregular Withdrawals from Tax-Advantaged Retirement Accounts
 Working Paper WP 2018-387 Assessing Economic Resources in Retirement: The Role of Irregular Withdrawals from Tax-Advantaged Retirement Accounts Michael D. Hurd and Susann Rohwedder Project #: R-UM18-Q4
Topics in Aging: Income and Poverty Among Older Americans in 2004
 Cornell University ILR School DigitalCommons@ILR Congressional Research Service (CRS) Reports and Issue Briefs Federal Publications 11-1-2005 Topics in Aging: Income and Poverty Among Older Americans in
Widening socioeconomic differences in mortality and the progressivity of public pensions and other programs
 Widening socioeconomic differences in mortality and the progressivity of public pensions and other programs Ronald Lee University of California at Berkeley Longevity 11 Conference, Lyon September 8, 2015
CRS Report for Congress
 Order Code RL33116 CRS Report for Congress Received through the CRS Web Retirement Plan Participation and Contributions: Trends from 1998 to 2003 October 12, 2005 Patrick Purcell Specialist in Social Legislation
In 2012, according to the U.S. Census Bureau, about. A Profile of the Working Poor, Highlights CONTENTS U.S. BUREAU OF LABOR STATISTICS
 U.S. BUREAU OF LABOR STATISTICS M A R C H 2 0 1 4 R E P O R T 1 0 4 7 A Profile of the Working Poor, 2012 Highlights Following are additional highlights from the 2012 data: Full-time workers were considerably
Retirement Security and Late-Life Work. James Poterba MIT, NBER, and TIAA 26 January 2019
 Retirement Security and Late-Life Work James Poterba MIT, NBER, and TIAA 26 January 2019 1 Rising Life Expectancy at Age 65 Year Men Women 1960 13.2 years 17.4 years 1990 16.1 19.4 2010 18.6 21.1 2030
The Role of Annuities in Retirement Plans
 The Role of Annuities in Retirement Plans Professor Jon Forman University of Oklahoma College of Law for the National Association of Insurance Commissioners (NAIC) Center for Insurance Policy and Research
What Replacement Rate Do Households Actually Experience in Retirement?
 What Replacement Rate Do Households Actually Experience in Retirement? Alicia H. Munnell and Mauricio Soto Boston College Prepared for the 7 th Annual Joint Conference of the Retirement Research Consortium
Health Status, Health Insurance, and Health Services Utilization: 2001
 Health Status, Health Insurance, and Health Services Utilization: 2001 Household Economic Studies Issued February 2006 P70-106 This report presents health service utilization rates by economic and demographic
Retirements At Risk: The Outlook for the United States
 Retirements At Risk: The Outlook for the United States Alicia H. Munnell Peter F. Drucker Professor, Boston College Carroll School of Management Director, Center for Retirement Research at Boston College
Exploring Your IRA Options
 Exploring Your IRA Options Traditional IRA Q & A.................. Page 2 Roth IRA Q & A...................... Page 5 Traditional vs. Roth IRAs............... Page 8 How does a Traditional IRA differ from
U.S. Household Savings for Retirement in 2010
 U.S. Household Savings for Retirement in 2010 John J. Topoleski Analyst in Income Security April 30, 2013 CRS Report for Congress Prepared for Members and Committees of Congress Congressional Research
Removing the Legal Impediments to Offering Lifetime Annuities in Pension Plans
 Removing the Legal Impediments to Offering Lifetime Annuities in Pension Plans Professor Jon Forman University of Oklahoma College of Law for Achieving Better Retirement Outcomes: Solutions for a Modern
Savings Needed for Health Expenses for People Eligible for Medicare: Some Rare Good News, p. 2 IRA Asset Allocation, 2010, p. 8
 October 2012 Vol. 33, No. 10 Savings Needed for Health Expenses for People Eligible for Medicare: Some Rare Good News, p. 2 IRA Asset Allocation, 2010, p. 8 A T A G L A N C E Savings Needed for Health
TRADITIONAL AND ROTH INDIVIDUAL RETIREMENT ANNUITY DISCLOSURE STATEMENT
 AMERICAN-AMICABLE LIFE INSURANCE COMPANY OF TEXAS Waco, Texas TRADITIONAL AND ROTH INDIVIDUAL RETIREMENT ANNUITY DISCLOSURE STATEMENT This Disclosure Statement explains the rules governing both a Traditional
Research fundamentals
 Research fundamentals 1401 H Street, NW, Suite 1200 Washington, DC 20005 202/326-5800 www.ici.org October 2010 Vol. 19, No. 3- The U.S. Retirement Market, Second Quarter 2010 Key Findings Total U.S. retirement
Individual Account Retirement Plans: An Analysis of the 2016 Survey of Consumer Finances
 March 13, 2018 No. 445 Individual Account Retirement Plans: An Analysis of the 2016 Survey of Consumer Finances By Craig Copeland, Employee Benefit Research Institute A T A G L A N C E Individual account
CHAPTER 11 CONCLUDING COMMENTS
 CHAPTER 11 CONCLUDING COMMENTS I. PROJECTIONS FOR POLICY ANALYSIS MINT3 produces a micro dataset suitable for projecting the distributional consequences of current population and economic trends and for
CRS Report for Congress
 Order Code RL30122 CRS Report for Congress Pension Sponsorship and Participation: Summary of Recent Trends Updated September 6, 2007 Patrick Purcell Specialist in Income Security Domestic Social Policy
Reg. Section 1.408A-4 Converting amounts to Roth IRAs.
 CLICK HERE to return to the home page Reg. Section 1.408A-4 Converting amounts to Roth IRAs. This section sets forth the following questions and answers that provide rules applicable to Roth IRA conversions:
Older Workers: Employment and Retirement Trends
 Cornell University ILR School DigitalCommons@ILR Federal Publications Key Workplace Documents September 2005 Older Workers: Employment and Retirement Trends Patrick Purcell Congressional Research Service
Evaluating the BLS Labor Force projections to 2000
 Evaluating the BLS Labor Force projections to 2000 Howard N Fullerton Jr. Bureau of Labor Statistics, Office of Occupational Statistics and Employment Projections Washington, DC 20212-0001 KEY WORDS: Population
A Profile of the Working Poor, 2011
 Cornell University ILR School DigitalCommons@ILR Federal Publications Key Workplace Documents 4-2013 A Profile of the Working Poor, 2011 Bureau of Labor Statistics Follow this and additional works at:
U.S. Global Investors Mutual Funds-Forms 1099R and 1099Q Guide for Tax Year 2009
 U.S. Global Investors Funds U.S. Global Investors Mutual Funds-Forms 1099R and 1099Q Guide for Tax Year 2009 U.S. Global Investors is committed to providing accuracy in reporting tax information related
Medicare Beneficiaries and Their Assets: Implications for Low-Income Programs
 The Henry J. Kaiser Family Foundation Medicare Beneficiaries and Their Assets: Implications for Low-Income Programs by Marilyn Moon The Urban Institute Robert Friedland and Lee Shirey Center on an Aging
The Retirement Crisis In America. Rose Panico-Marino, AIF, ERPA, QPA Managing Director
 The Retirement Crisis In America Presented By: Rose Panico-Marino, AIF, ERPA, QPA Managing Director Retirement Crisis in America 202 Retirement Confidence Results of the 202 Employee Benefit Research Institute
Retirement Saving, Annuity Markets, and Lifecycle Modeling. James Poterba 10 July 2008
 Retirement Saving, Annuity Markets, and Lifecycle Modeling James Poterba 10 July 2008 Outline Shifting Composition of Retirement Saving: Rise of Defined Contribution Plans Mortality Risks in Retirement
The Challenges with More Choice: Cognition and Late Life Financial Literacy
 The Challenges with More Choice: Cognition and Late Life Financial Literacy P A M E L A H E R D U N I V E R S I T Y O F W I S C O N S I N, M A D I S O N W I T H SUPPORT FROM THE NATIONAL I N S T I T U
Individual Retirement Accounts and 401(k) Plans: Early Withdrawals and Required Distributions
 Plans: Early Withdrawals and Required Distributions") Order Code RL31770 Individual Retirement Accounts and 401(k) Plans: Early Withdrawals and Required Distributions Updated October 27, 2008 Patrick Purcell Specialist in Income Security Domestic Social Policy
Order Code RL31770 Individual Retirement Accounts and 401(k) Plans: Early Withdrawals and Required Distributions Updated October 27, 2008 Patrick Purcell Specialist in Income Security Domestic Social Policy
YOUR GUIDE TO IDENTIFYING YOUR TAX RETURN OPPORTUNITIES
 YOUR GUIDE TO IDENTIFYING YOUR TAX RETURN OPPORTUNITIES 2 At Transamerica, we re committed to providing you with the tools and information you need to make the right financial decisions. IRS Form 1040
Taking the Next Step A New Approach to Addressing Key Challenges Facing Today s Retirees and Plan Sponsors
 DC INSIGHTS SERIES Taking the Next Step A New Approach to Addressing Key Challenges Facing Today s Retirees and Plan Sponsors Summary Plan sponsors invest in their employees: they spend time and resources
CHAPTER 3 POPULATION AND ECONOMIC CHARACTERISTICS
 CHAPTER 3 POPULATION AND ECONOMIC CHARACTERISTICS INTRODUCTION Population trends in La Vista and its respective planning jurisdiction serve as valuable indicators of future development needs and patterns
Social Security Reform and Benefit Adequacy
 URBAN INSTITUTE Brief Series No. 17 March 2004 Social Security Reform and Benefit Adequacy Lawrence H. Thompson Over a third of all retirees, including more than half of retired women, receive monthly
Pension Sponsorship and Participation: Summary of Recent Trends
 Cornell University ILR School DigitalCommons@ILR Federal Publications Key Workplace Documents 9-11-2009 Pension Sponsorship and Participation: Summary of Recent Trends Patrick Purcell Congressional Research
Taking the Next Step A New Approach to Addressing Key Challenges Facing Today s Retirees and Plan Sponsors
 Investment Insights Series A New Approach to Addressing Key Challenges Facing Today s Retirees and Plan Sponsors Summary Plan sponsors invest in their employees: they spend time and resources on costeffective,
GIT-1, Pensions and Annuities
 GIT-1, Pensions and Annuities Introduction This bulletin explains how to report pension and annuity income on your New Jersey gross income tax return. It also describes the income exclusions which qualified
Household wealth and the measurement of economic well-being in the United States
 J Econ Inequal (2009) 7:83 115 DOI 10.1007/s10888-007-9068-6 Household wealth and the measurement of economic well-being in the United States Edward N. Wolff & Ajit Zacharias Received: 24 May 2006 / Accepted:
When Will the Gender Gap in. Retirement Income Narrow?
 When Will the Gender Gap in Retirement Income Narrow? August 2003 Abstract Among recent retirees, women receive substantially less retirement income from Social Security and private pensions than men.
The Role of CPS Non-Response on Trends in Poverty and Inequality
 The Role of CPS Non-Response on Trends in Poverty and Inequality Charles Hokayem, U.S. Census Bureau James P. Ziliak, Department of Economics and Center for Poverty Research, University of Kentucky Christopher
Evaluating Respondents Reporting of Social Security Income In the Survey of Income and Program Participation (SIPP) Using Administrative Data
 Using Administrative Data") Evaluating Respondents Reporting of Social Security Income In the Survey of Income and Program Participation (SIPP) Using Administrative Data Lydia Scoon-Rogers 1 U.S. Bureau of the Census HHES Division,
Evaluating Respondents Reporting of Social Security Income In the Survey of Income and Program Participation (SIPP) Using Administrative Data Lydia Scoon-Rogers 1 U.S. Bureau of the Census HHES Division,
Health Insurance Coverage: Early Release of Estimates From the National Health Interview Survey, 2010
 Health Insurance Coverage: Early Release of Estimates From the National Health Interview Survey, 2010 by Robin A. Cohen, Ph.D., Brian W. Ward, Ph.D., and Jeannine S. Schiller, M.P.H. Division of Health
How Does Dipping into Your Pension Affect Your Retirement Wealth? Gary V. Engelhardt
 How Does Dipping into Your Pension Affect Your Retirement Wealth? Gary V. Engelhardt No. 22/2001 Gary V. Engelhardt is Associate Professor of Economics and Senior Research Associate, Center for Policy
Social Security, Pensions and Politics: National Directions
 Social Security, Pensions and Politics: National Directions Dallas L. Salisbury Employee Benefit Research Institute www.ebri.org EBRI Mission To contribute to, to encourage, and to enhance the development
59 million people receive Social Security each month, in one of three categories: Nearly 1 in 5 Americans gets Social Security benefits.
 National Academy of Social Insurance www.nasi.org October 2015 59 million people receive Social Security each month, in one of three categories: Retirement insurance Survivor insurance Disability insurance
Applying for Death Benefits Under the Federal Employees Retirement System
 FERS Federal Employees Retirement System Applying for Death Benefits Under the Federal Employees Retirement System This pamphlet is for use by persons applying for benefits which may be payable under the
Effective Policy for Reducing Inequality: The Earned Income Tax Credit and the Distribution of Income
 Effective Policy for Reducing Inequality: The Earned Income Tax Credit and the Distribution of Income Hilary Hoynes, UC Berkeley Ankur Patel US Treasury April 2015 Overview The U.S. social safety net for
North Carolina Agents Checklist For Submitting Fixed Annuity New Business. General Information
 North Carolina Agents Checklist For Submitting Fixed Annuity New Business General Information... 1 Non-Qualified Single Premium Tax Deferred Annuity... 2 Traditional IRA (Qualified Annuity)... 3 Roth IRA
Nest Egg for Retirement? The Realities of Asset Holdings for Older Adults
 Nest Egg for Retirement? The Realities of Asset Holdings for Older Adults Laura Sullivan, Ph.D. Candidate Heller School for Social Policy and Management Brandeis University Presentation Outline Background
California Workers Retirement Prospects
 21 CHAPTER 2 California Workers Retirement Prospects by Sylvia A. Allegretto, Nari Rhee, Joelle Saad-Lessler, and Lauren Schmitz INTRODUCTION While public debate rages about the costs of pensions and Social
Medicaid Undercount in the American Community Survey: Preliminary Results
 Medicaid Undercount in the American Community Survey: Preliminary Results Brett Fried State Health Access Data Assistance Center (SHADAC) University of Minnesota JSM, Montreal August 7, 2013 Acknowledgments
Resource Tests and Eligibility for Federal Assistance Programs: Effects of Current Rules and Options for Change. Mark Merlis Independent Consultant
 Resource Tests and Eligibility for Federal Assistance Programs: Effects of Current Rules and Options for Change Mark Merlis Independent Consultant Resource Tests and Eligibility for Federal Assistance
EARLY TO MID CAREER Presented by Stewart Kaplan
 EARLY TO MID CAREER Presented by Stewart Kaplan FEDERAL RETIREMENT THRIFT INVESTMENT BOARD 77 K Street, NE Washington, DC 20002 1-877-968-3778 TSP.GOV Agenda First Steps: Preparing for Separation Changes
2018 Tax Planning & Reference Guide
 2018 Tax Planning & Reference Guide The 2018 Tax Planning & Reference Guide is designed to be a reference only and is not intended to provide tax advice. Please consult your professional tax advisor prior
Retirement Security: Public Perceptions and Misperceptions
 Retirement Security: Public Perceptions and Misperceptions Anna M. Rappaport, MAAA, EA, FSA Chairperson, Committee on Post-Retirement Risks and Needs, Society of Actuaries Mathew Greenwald President, Mathew
Medicaid Undercount in the American Community Survey (ACS)
") Medicaid Undercount in the American Community Survey (ACS) Joanna Turner State Health Access Data Assistance Center (SHADAC) University of Minnesota FCSM, Washington, DC November 4, 2013 Acknowledgments
Medicaid Undercount in the American Community Survey (ACS) Joanna Turner State Health Access Data Assistance Center (SHADAC) University of Minnesota FCSM, Washington, DC November 4, 2013 Acknowledgments
901 East Cary Street, Suite 1100, Richmond, VA
 2017 Tax Planning & Reference Guide The 2017 Tax Planning & Reference Guide is designed as a reference and is not intended to function as tax advice. Please consult your professional accounting advisor
Selected indicators of well-being for people aged 55-64: 1984, 1994, and 2004
 Selected indicators of well-being for people aged 55-64: 1984, 1994, and 2004 Howard M. Iams, John Phillips, Lionel Deang, and Irena Dushi Howard Iams is a senior research advisor with the Office of Research,