Utilisation of medical services
|
|
|
- Joan Wade
- 5 years ago
- Views:
Transcription

1 07 March 2016 Research and Monitoring Unit 1
2 Table of Contents Table of Contents... 2 List of tables... 3 List of figures Background Introduction Summary of Data used in the analysis Results - cost and utilisation of health services Hospitalisation Hospital admissions by admission type Providers Utilisation at providers by discipline Medicines Conclusion and Recommendations References
3 List of tables Table 1: Summary of findings Table 2: Number of hospital admissions per beneficiaries by benefit option type in 2013 & Table 3: Average cost per hospital admission by benefit option type in 2013 & Table 4: Number of inpatient days per beneficiaries by benefit option type in 2013 & Table 5: Average cost per day by benefit option type in 2013 & Table 6: Number of visits per beneficiaries by benefit option type in 2013 & Table 7: Average cost per visit by benefit option type in 2013 & Table 8: Number of items dispensed per beneficiaries by benefit option type in 2013 & Table 9: Average cost per item dispensed by benefit option type in 2013 & List of figures Figure 1: Number of hospital admissions per beneficiaries by gender and age in 2013 & Figure 2: Number of days spent in-hospital by gender and age in 2013 & Figure 3: Average number of days spent in-hospital per admission by gender and age in 2013 &
4 1. Background The Council for Medical Schemes (CMS) has carried out an analysis on the utilisation data of health services during the calendar years 2013 and This analysis was based on the data provided by medical schemes through the Annual Statutory Returns in There is an interest to understand the utilisation of medical services by beneficiaries as well as the cost of such services. For purposes of this analysis, the utilisation of health services has been divided into three main components, namely, hospitalisation, providers and medicines. This report provides the utilisation of these medical services by beneficiaries for the 2013 and 2014 financial years and the average cost of such services over the same period. Furthermore, the report also aims to assess the rates of increases in both the utilisation and the cost of such services. The increase in utilisation of health services has been cited in several places as an important driver of healthcare cost inflation. This report will therefore provide useful insights on utilisation of health services as well as also help explain in part its likely impact on healthcare inflation. 2. Introduction Beneficiaries access different areas of the healthcare industry based on their needs. The claims by beneficiaries are consists mostly of hospitalisation, visits to providers and use of medicine hence this report focuses on these health services. To understand the results of this report it is important to note how the data used in the analysis has been collected. The definitions used by schemes to report the data were recently revised and standardised. The most significant definitions used in the reporting of data used in this report are as follows: Providers are health service providers which exclude hospitals. This includes healthcare professionals i.e. General Practitioners, Specialists etc. and other providers such as ambulance services. A visit to a provider refers to a valid claim by the provider which has been paid for by the scheme. A single visit is defined as all claim lines relating to a specific beneficiary, on a specific service date to a specific provider plus a unique consultation code. A day case (inpatient < 24 hours) admission is defined as an admission where the Discharge date is the same as the Admission date. These admissions are referred to as day admissions in this report. An inpatient (inpatient 24 hours) admission is defined as an admission where the Discharge date is after the Admission date. Such admissions are referred to as long stay in this report. Medicines are defined as a NAPPI coded product where the first digit of the NAPPI code is at least 7, and is paid from a medicine related benefit pool. The remainder of the NAPPI items are classified as Consumables. These and other definitions are on the CMS Technical Guide Data Spec V3.3 (which can be found on the CMS website). Using the information provided by medical schemes, an analysis was conducted to determine the costs associated with utilisation of medical services. 4
5 3. Summary of Data used in the analysis This report is based on the Annual Statutory Returns (ASR) data provided by schemes to the CMS. Membership data was submitted for each benefit option as set out in the ASR technical guide. The data used was from tables A2, B1, B2, B3 and B6. Further details on the data collected can be accessed from these documents, which are available on the CMS website on the link (The Annual Statutory Return Technical Guideline for preparation of data V3.2, 2015). The benefit option classification as set out in the Annual Report of 2015 (The Council for Medical Schemes Annual Report 2014/15, 2015: 142) was also used. Data collected in table A2 In table A2 schemes were required to provide the number of beneficiaries at the end of each month in the financial years 2013 and This membership data was collected based on the following: Financial year Financial month Principal members Adult dependents Child dependents The data was also collected for each benefit option for the financial years 2013 and This data was used to calculate the average number of beneficiaries in each financial year by benefit option. Data collected in table B1 In table B1 schemes were required to provide the number of visits to the various providers and the total cost of such visits. This data was collected based on the following: Financial year Discipline code (depending on which health personnel was seen) Place of visit (whether or not the beneficiary visited in-hospital or out-of-hospital) Amount claimed Amount paid from risk Amount paid from savings Similarly, the data was collected for each benefit option for the financial years 2013 and This data was used to calculate number of visits to providers as well as the average cost of such visits. Data collected in table B2 In table B2 schemes were required to provide the total amounts spend on medicines and consumables outside hospital and the number of items dispensed. The main data fields collected included the following: Financial year Discipline code (of health professional prescribing the medicines) Type of items dispensed (medicine or consumable) Number of items dispensed Amount claimed 5
6 Amount paid from risk Amount paid from savings Similarly, the data was collected for each benefit option for the financial years 2013 and This data was used to calculate number of items dispensed as well as the average cost of such items Data collected in table B3 In table B3 schemes were required to provide hospital admission data for beneficiaries. The major data fields collected included: Financial year Age band Gender Discipline code (type of facility) Admission type (day visit or long stay) Number of admissions Number of days in-hospital Amount claimed Amount paid from risk Amount paid from savings As with other data, this was collected for each benefit option of the financial years 2013 and This data was used to calculate the average rates of admission by gender, age and benefit option type. The average cost per admission and the average cost per day in-hospital was also calculated using this data. Data collected in table B6 In table B6 schemes were required to provide hospital admission data for beneficiaries by type of admission. The major data fields collected included: Financial year Admission type (Surgical, medical etc.) Admission type (day visit or long stay) Number of admissions Number of days in-hospital Amount claimed Amount paid from risk Amount paid from savings As with other data, this was collected for each benefit option for the financial years 2013 and This data was used to calculate the average rates of admission by admission type. Adjustments to data To ensure a more objective analysis of the data, some adjustments were made to the data. These adjustments include: Only options which existed in both 2013 and 2014 were included this was done in order to make the year on year comparison with consistent data 6
7 Data on length of stay from table B6 and B3 was largely in accurate for a number of schemes. The data errors mostly related to schemes providing length of stay that was larger than conceivable. In some extreme instance the average length of stay was more than 365 days which is impossible. Adjustments were made to this data by using the average length of stay for the more accurate data. These schemes that provided relatively inaccurate data affected about beneficiaries. The statistics on average cost per day in-hospital was not reported by type of admission. 7
8 4. Results - cost and utilisation of health services The definition of cost and utilisation used in this section are as follows: Average cost of health services: I. A visit to providers: this is the average cost of each visit paid for by the schemes. It is calculated as the total cost of all visits to providers divided by the corresponding number of visits. In the analysis, this is split by the visits in-hospital and the visits out-of-hospital. II. III. IV. Item dispensed (medicines): this is the average cost of each item dispensed and paid for by the schemes. It is calculated as the total cost of all items dispensed divided by the corresponding number of all items dispensed. Item dispensed (consumables): this is the average cost of each item dispensed paid for by the schemes. It is calculated as the total cost of all items dispensed divided by the corresponding number of all items dispensed. A hospital admission: this is the average cost of each hospital admission paid for by the scheme. It is calculated as the total cost of all hospital admissions divided by the corresponding number of all hospital admissions. In the analysis, this is split by day admissions and long stay admissions. V. Each day in-hospital: this is the average cost of each day spent in-hospital paid for by the scheme. It is calculated as the total cost of all long stay admissions divided by the corresponding total number of days spent in-hospital. Each day case hospital admission was counted as one full day the actual length of stay in hours was not collected. The average cost per day is thus the same as the average cost per admission in the case of day admissions. The definition of utilisation for the three major sections is as follows: I. Utilisation of providers: this is the number of visits paid for by the scheme per average beneficiary per month. It is calculated as the number of all visits to providers divided by the average beneficiaries per month. II. III. IV. Utilisation of medicines and consumables: this is the number of items dispensed (medicines and consumables) pabpm paid for by the scheme. It is calculated as the number of all items dispensed divided by the average beneficiaries per month. This was calculated for both medicines and consumables. Utilisation of hospitals - day hospital admissions: this is the number day hospital admissions pabpm paid for by the scheme. It is calculated as the total number of day hospital admissions divided by the average beneficiaries per month. Utilisation of hospitals - long hospital admissions: this has two components one relating to the number of admissions and the other length of stay. The former is the number of long stay admissions pabpm paid for by the scheme. It is calculated as the total number of long stay admissions divided by the average beneficiaries per month. 8
9 The latter is the average length of stay per admission. It is calculated as the total days spent in-hospital divided by the number of long stay admissions. Results from the analysis The utilisation was analysed by benefit option type. To understand the results better it is important to refer the beneficiary movement report published by the CMS. This report shows the size of the benefit option types as well as their risk profiles. The smaller benefit option types experience large variation in utilisation and costs of care. These annual variations are a mere indication of the option sizes and may not necessarily be due to underlying significant changes. The utilisation of medicines is difficult to measure accurately as data is not collected on quantities of a drug, combination drugs or not, as well as strength of drugs. Data collected is based on number of items dispensed. Despite this challenge the data may be used to make reasonable inferences on utilisation of medicines and consumables. The statistics on utilisation of medicines may also be affected by type of providers. Some providers generally do not need to dispense medicine or consumables such as Dental Specialists. Therefore the variation in the number of items dispensed and or the average cost of item dispensed would show significant variation from year to year. 9
10 Table 1: Summary of findings % change per beneficiaries Hospitalisation Number of admissions % Day case % Long stay % Average cost per admission % (R) Day case (R) % Long stay (R) % Number of inpatient days % Day case % Long stay % Average cost per day (R) % Day case (R) % Long stay (R) % Providers Number of visits % In-hospital % Out-of-hospital % Average cost per visit (R) % In-hospital (R) % Out-of-hospital (R) % Medicines Number of items dispensed % Consumables % Medicine % Average cost per item % dispensed (R) Consumables (R) % Medicine (R) % * represents the average cost per admission for the day case as the specific length of times spent are not known Table 1 shows the utilisation and cost of health services in 2013 and
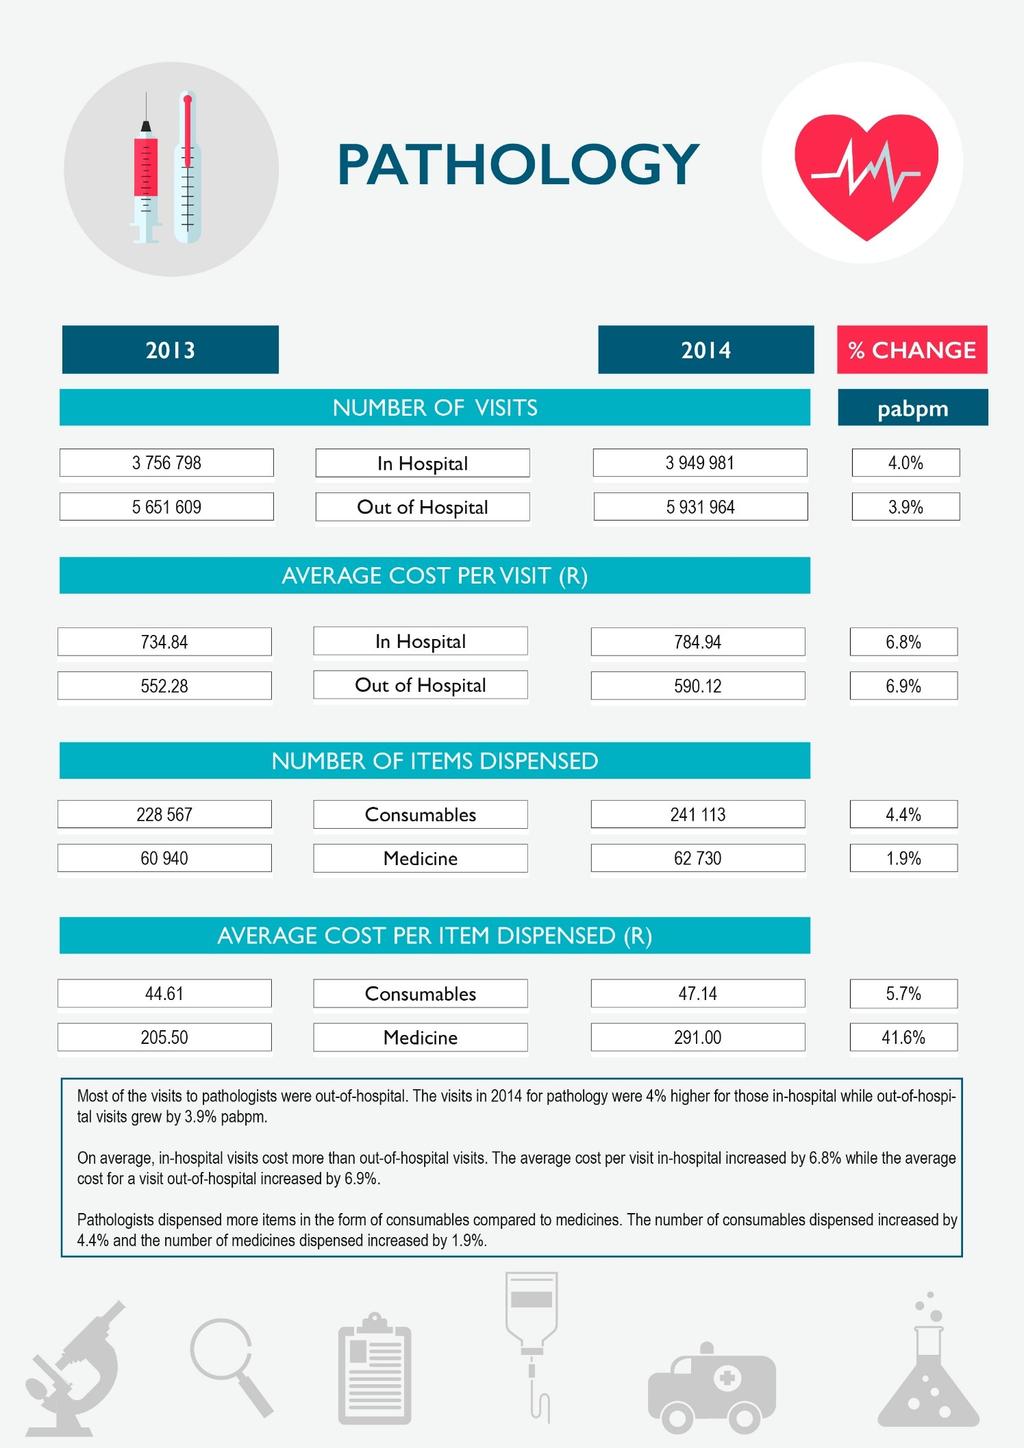
11 Hospitalisation The utilisation of hospitals increased from 2013 to 2014 in aggregate. The average length of stay in-hospital was higher in 2014 compared to 2013 increasing by 4.1%. The number of admissions pabpm grew by only 0.3% over the same period. The cost of hospitalisation increased quite significantly. The average cost per admission was 10.4% higher in 2014 compared to The average cost per day in-hospital was also 6.1% higher in 2014 compared to The day case average cost per day is higher than the long stay average cost per day. The long stay average cost includes both medical and surgical admissions whilst day case admissions are mostly surgical admissions which cost more. Furthermore, the day case accounts thus include the theatre and other fees over a single day whilst the theatre and other fees for long stays are spread over the number of days in-hospital. During 2014, medical schemes spent 37.6% of the total healthcare benefits on hospitalisation. (The Council for Medical Schemes Annual Report 2014/15, 2015: 146) Providers The utilisation of providers increased by 2.7% in 2014 compared to The increase in utilisation of providers was higher in-hospital, increasing by 5.2%. The utilisation of providers out-of-hospital providers increased by 1.9%. The average cost of each visit to providers increased by 8% in 2014 compared to The increase in the average cost of each visit was higher for out-of-hospital visits which increased at 7.6% while in-hospital visits increased by 7.3%. The average cost of visiting providers was significantly higher in-hospital compared to out-of-hospital visits. In 2014 the average cost of an in-hospital visit was R1 184 while the average cost of a visit outside hospital was R591. During 2014, medical schemes spent 43.7% of the total healthcare benefits on providers. (The Council for Medical Schemes Annual Report 2014/15, 2015: 146) Medicines and consumables Medicines and consumables dispensed in-hospital are included in the hospitalisation data, hence these are medicines and consumables dispensed out-of-hospital only. The number of items dispensed in 2014 was up 4.2% compared to The greatest increase in items dispensed was on medicines which increased by 4.2%. The consumables dispensed increased by a marginal 1% from 2013 to The average cost of each item dispensed increased by 3.9% in 2014 compared to The increase in the average cost of each item dispensed was higher for consumables which increased by 8.8% while medicines increased by 3.6%. The single exit price increased by 5.82% in During 2014, medical schemes spent 16.6% of the total healthcare benefits on medicines out-of-hospital. (The Council for Medical Schemes Annual Report 2014/15, 2015: 146) 11
12 4.1 Hospitalisation The hospital utilisation data mainly focussed on the number of admissions and length of stay. The total number of admissions was in 2013 and in The average cost per admission was R in 2013 and R in The total number of inpatient days was in 2013 and in The average cost per day in-hospital was R in 2013 and R in The following data shows the changes in the number of admissions and number of days patients spend in-hospital along with the costs associated per admission and per day. The data is shown for the 2013 and 2014 financial years. In the data that follows, the day case information for admissions and number of days spent in-hospital are the same since a day case admission means the patient only spends one day (arrives and leaves the hospital on the same day) in-hospital. The increases shown in the figures are based on the experience pabpm and not of the absolue amounts in the figures. This is a more accurate way of comparing the results. It is also important to note that the PMBs only benefit option type had a very small portion of all the beneficiaries. This option had a risk profile that was significantly worse off compared to other options. This in part, explains some of the utilisation trends observed. 12
13 13
14 14
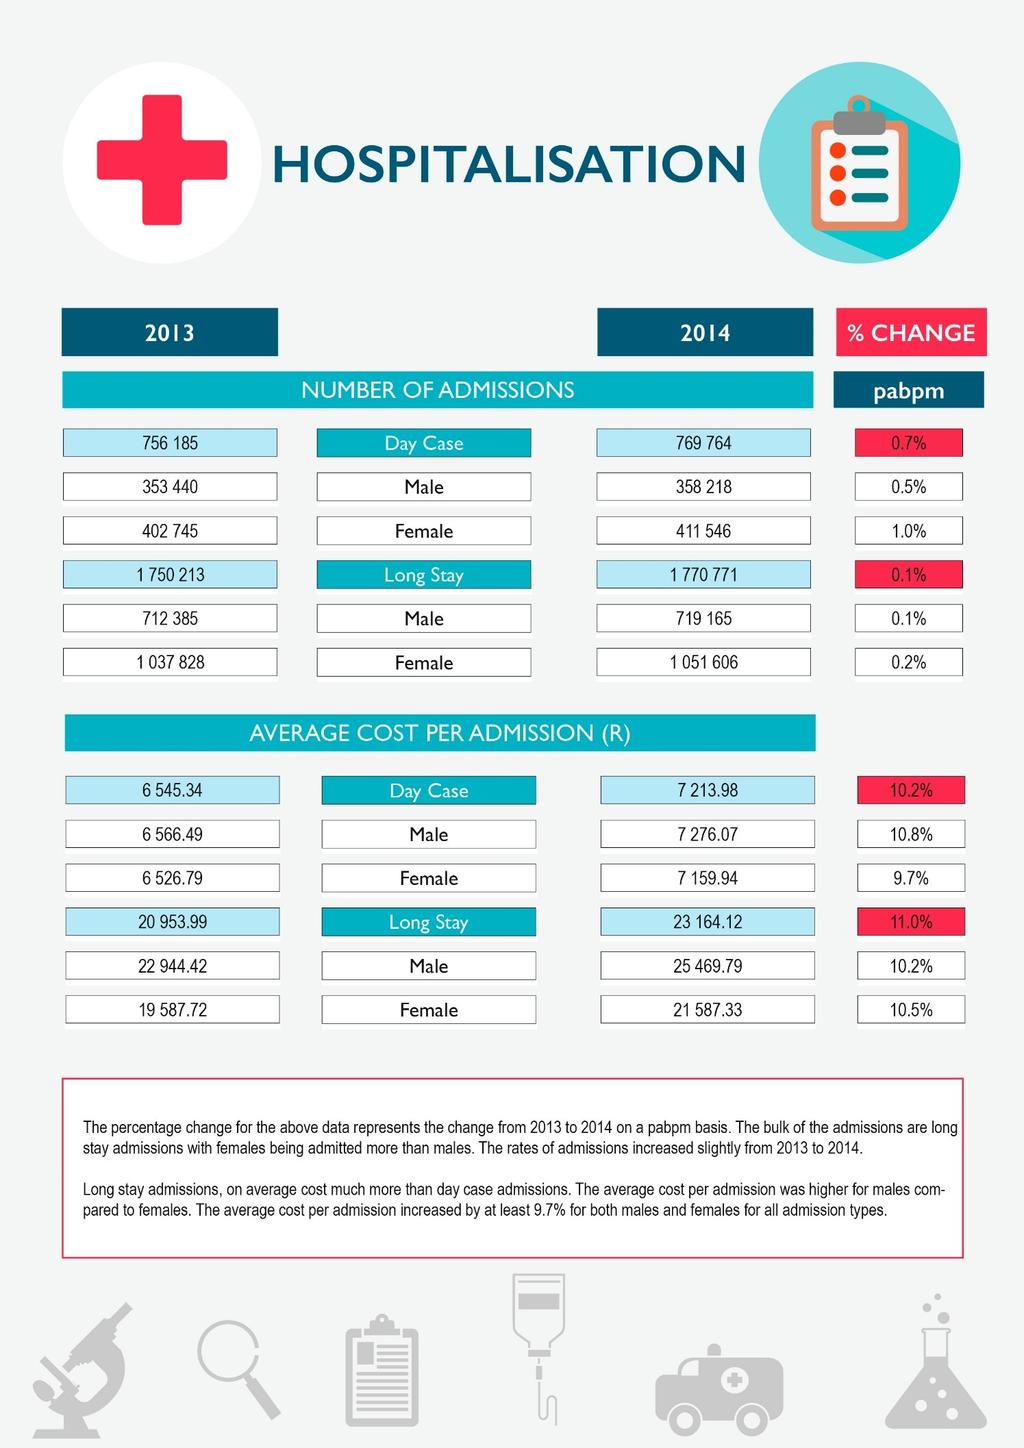
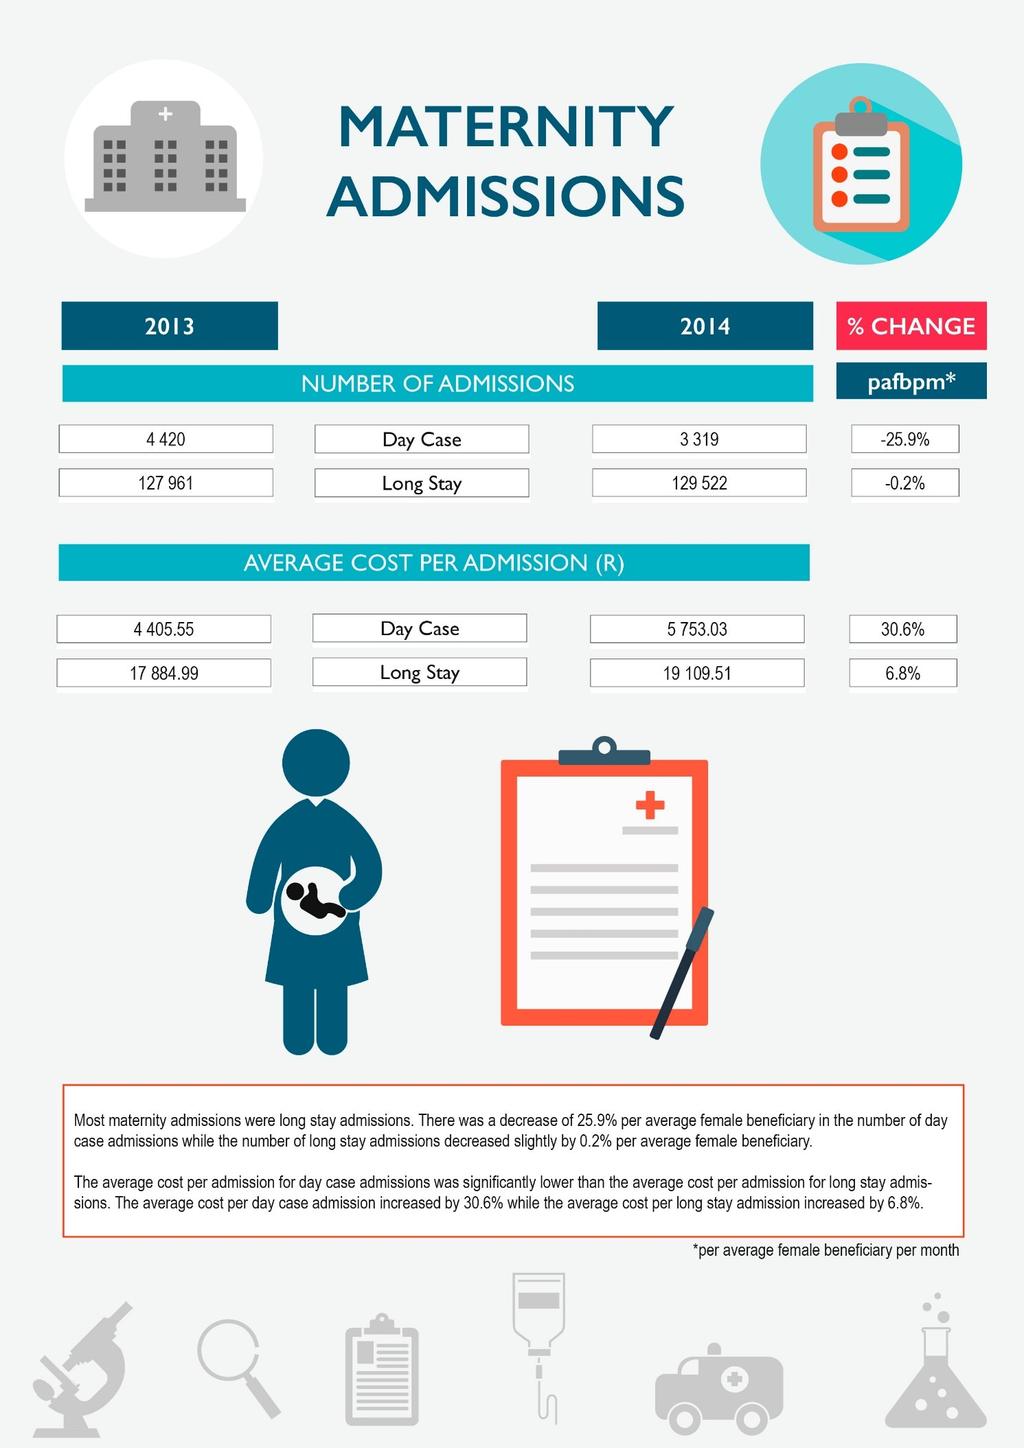
15 Table 2: Number of hospital admissions per beneficiaries by benefit option type in 2013 & 2014 Benefit Option Type Day case % change Long stay % change Traditional + PMBs & other 77,22 76,88-0,4% 209,66 210,31 0,3% DSP Savings + PMBs & other 125,51 126,54 0,8% 230,68 217,97-5,5% DSP PMBs & other Chronic 79,17 78,49-0,9% 175,60 181,58 3,4% Savings + PMBs & other 94,21 96,40 2,3% 187,46 191,75 2,3% Chronic Traditional & PMBs 39,97 41,78 4,5% 104,14 111,97 7,5% DSPs PMBs Only 92,57 95,30 3,0% 216,40 166,30-23,2% Hybrid (EDO + primary) 107,13 106,77-0,3% 229,09 232,94 1,7% PMB Exempt 16,96 19,35 14,1% 125,78 63,49-49,5% Traditional + PMBs & other Chronic 51,27 51,36 0,2% 167,08 168,46 0,8% Totals 87,40 88,04 0,7% 202,30 202,53 0,1% Table 2 shows the number of admissions per beneficiaries for the 2013 and 2014 financial years by benefit option type. Most benefit option types had small changes in the number of admissions for the day case, while, the PMB Exempt option had a large increase of 14%. Long stays also had small changes across most benefit option types, except for the PMBs Only and PMB Exempt benefit option types which decreased significantly with decreases of 23% and 50% respectively. These benefit option types are the smallest in terms of membership size hence they are subject to such changes from year to year. 15
16 Table 3: Average cost per hospital admission by benefit option type in 2013 & 2014 Benefit Option Type Day case % change Long stay % change Traditional + PMBs & other 6 309, ,81 6,3% , ,02 12,2% DSP (R) Savings + PMBs & other 6 668, ,97 22,9% , ,81 14,7% DSP (R) PMBs & other Chronic (R) 6 306, ,77 10,4% , ,80 4,2% Savings + PMBs & other 6 707, ,70 8,1% , ,23 8,3% Chronic (R) Traditional & PMBs 5 609, ,75 5,7% , ,10 11,1% DSPs (R) PMBs Only (R) 6 144, ,86 12,9% , ,11 51,6% Hybrid (EDO + primary) (R) 6 639, ,70 7,0% , ,17 6,8% PMB Exempt (R) 4 673, ,99 13,3% 6 929, ,75 123,9% Traditional + PMBs & other Chronic (R) 7 892, ,85 9,4% , ,92 7,7% Totals (R) 6 545, ,98 10,2% , ,12 10,5% Table 3 shows the average cost per admission for the 2013 and 2014 financial years by benefit option type. For the day case admissions, all options had an increase in average cost per admission. The Savings + PMBs & other DSP had the highest increase in the average cost per admission which increased by 22%. Similarly, for long stay admissions, all benefit options had increases in average cost per admission from 2013 to The largest increases were in the PMB Exempt and PMBs option types which increased by 123.9% and 51.6% respectively. 16
17 Total days spent in-hospital Hospital admissions per beneficiaries Figure 1: Number of hospital admissions per beneficiaries by gender and age in 2013 & Males 2014 Males 2013 Females 2014 Females Figure 1 shows the number of admissions per beneficiaries at different age bands for males and females in the 2013 and 2014 financial years. A noticeable feature is that the gap between females and males increases significantly between the ages of 15 and 39. This could be largely due to pregnancies since after the age of 40, the gap between males and females narrows. The highest admission rates for both males and females are in the band 85 years and older. Figure 2: Number of days spent in-hospital by gender and age in 2013 & Males 2014 Males 2013 Females 2014 Females Figure 2 shows the number of days beneficiaries (both male and female) spend in-hospital after being admitted for the 2013 and 2014 financial years. On average, females spend more days in-hospital compared to males, however between the ages of 50 and 59, males spend much longer than females in-hospital. Females spend the largest amount of time in-hospital between the ages of 25 and 39 while males spend the largest amount of time in-hospital between ages of 50 and
18 Average lenth of stay per admission Figure 3: Average number of days spent in-hospital per admission by gender and age in 2013 & Males 2014 Males 2013 Females 2014 Females Figure 3 shows the number of days an individual spends in-hospital per admission. The average length of stay across all ages and gender was 3.1 days in Both males and females spend the longest time in-hospital when they are older than 85 years. This is likely due to their increased risk of having chronic diseases. The under ones on average spend a similar time in-hospital to the 85 year olds and older. On average, across all ages, males are more likely to spend a longer time in-hospital compared to females. 18
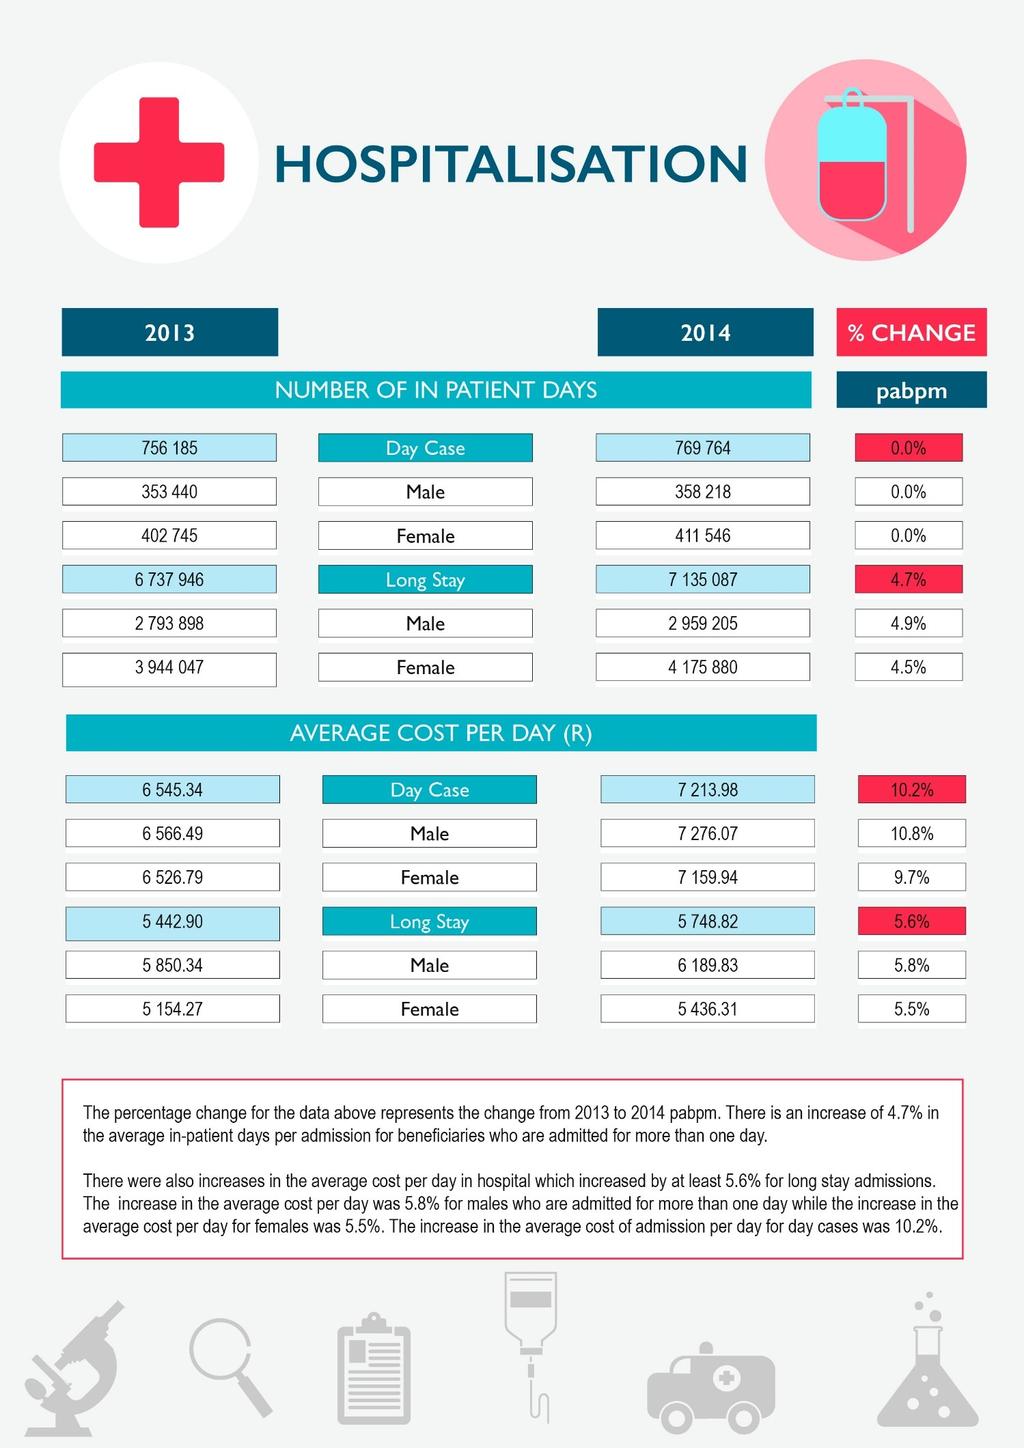
19 Table 4: Number of inpatient days per beneficiaries by benefit option type in 2013 & 2014 Benefit Option Type Day case (*) % change Long stay % change Traditional + PMBs & other 77,22 76,88-0,4% 845,61 887,40 4,9% DSP Savings + PMBs & other 125,51 126,54 0,8% 894,03 970,69 8,6% DSP PMBs & other Chronic 79,17 78,49-0,9% 599,17 632,60 5,6% Savings + PMBs & other 94,21 96,40 2,3% 781,04 813,74 4,2% Chronic Traditional & PMBs 39,97 41,78 4,5% 473,77 517,10 9,1% DSPs PMBs Only 92,57 95,30 3,0% 616,92 667,31 8,2% Hybrid (EDO + primary) 107,13 106,77-0,3% 728,71 747,74 2,6% PMB Exempt 16,96 19,35 14,1% 217,27 173,83-20,0% Traditional + PMBs & other Chronic 51,27 51,36 0,2% 831,98 850,19 2,2% Totals 87,40 88,04 0,7% 778,81 816,07 4,8% * Assumed each admission lasts a whole day for the day case as the specific length of times spent are not known Table 4 shows the number of patient days per 1000 beneficiaries spend in-hospital for the 2013 and 2014 financial years by benefit option type. For long stay admissions, the PMB Exempt benefit option type recorded a decrease in number of in patient days while the rest of the benefit option types recorded increases. The Traditional + PMBs & other DSP benefit option type had the highest increase which increased by 9.1% in number of days in-hospital per beneficiaries. 19
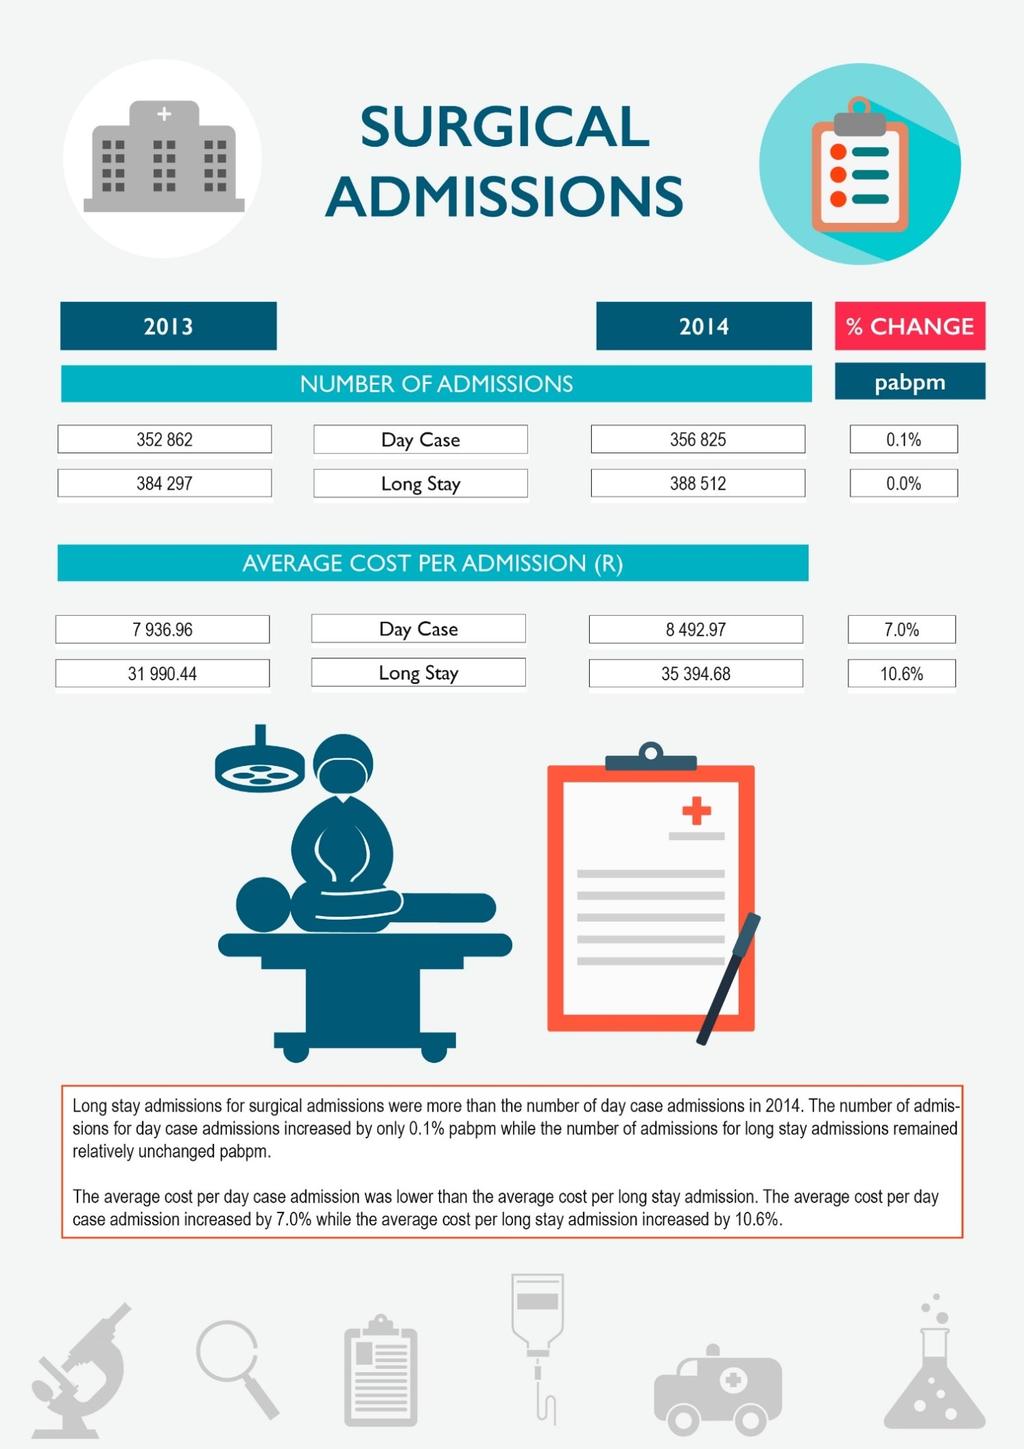
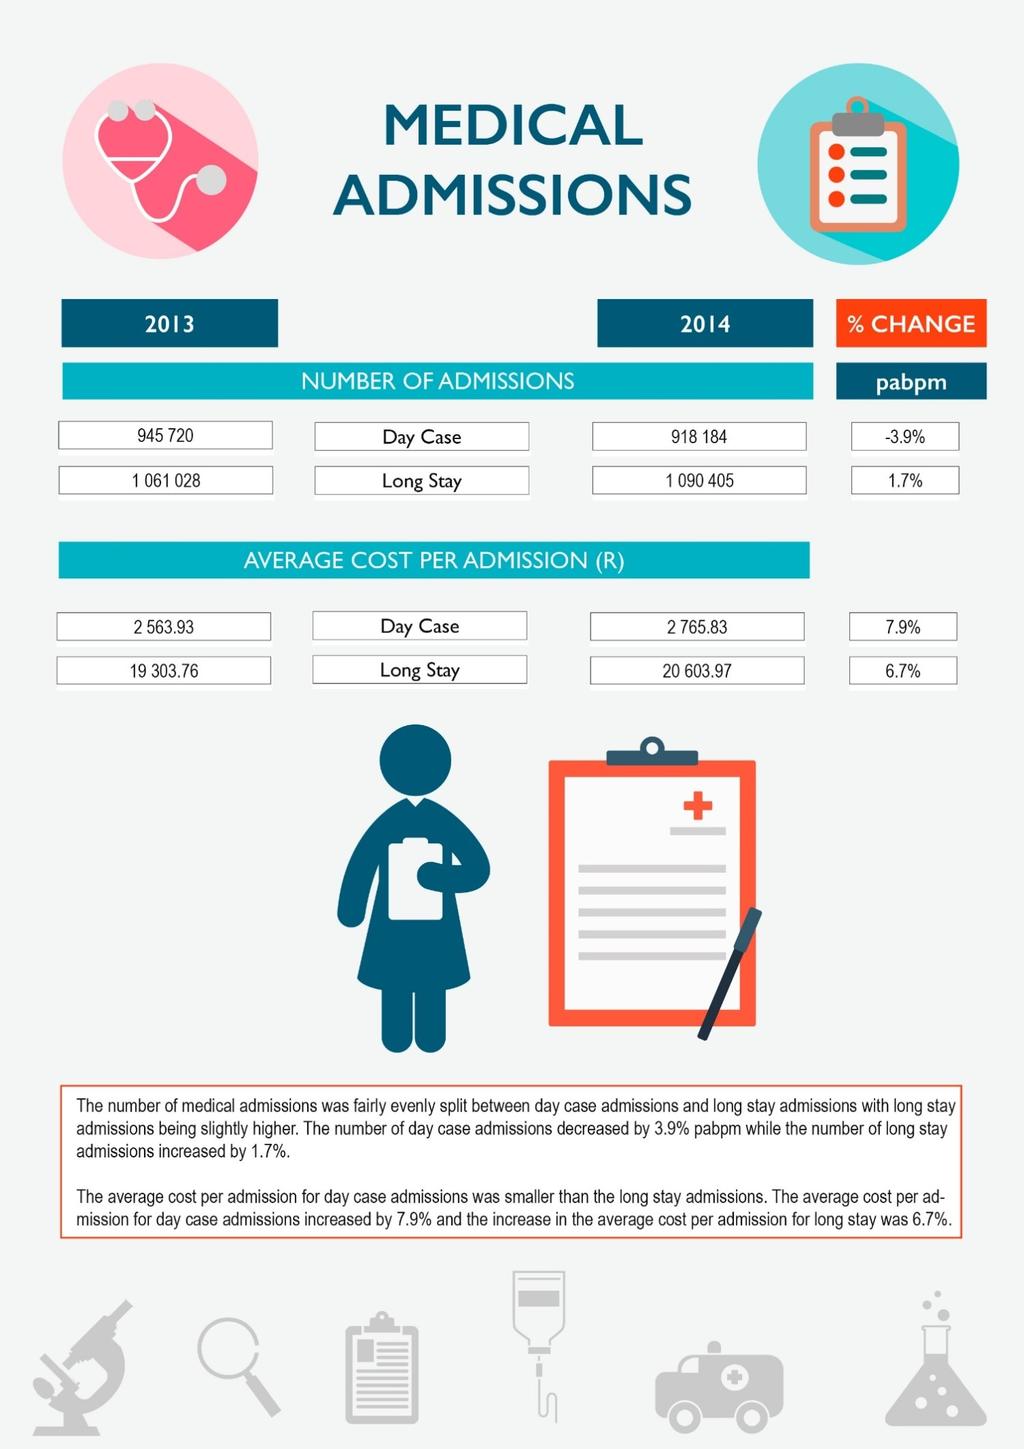
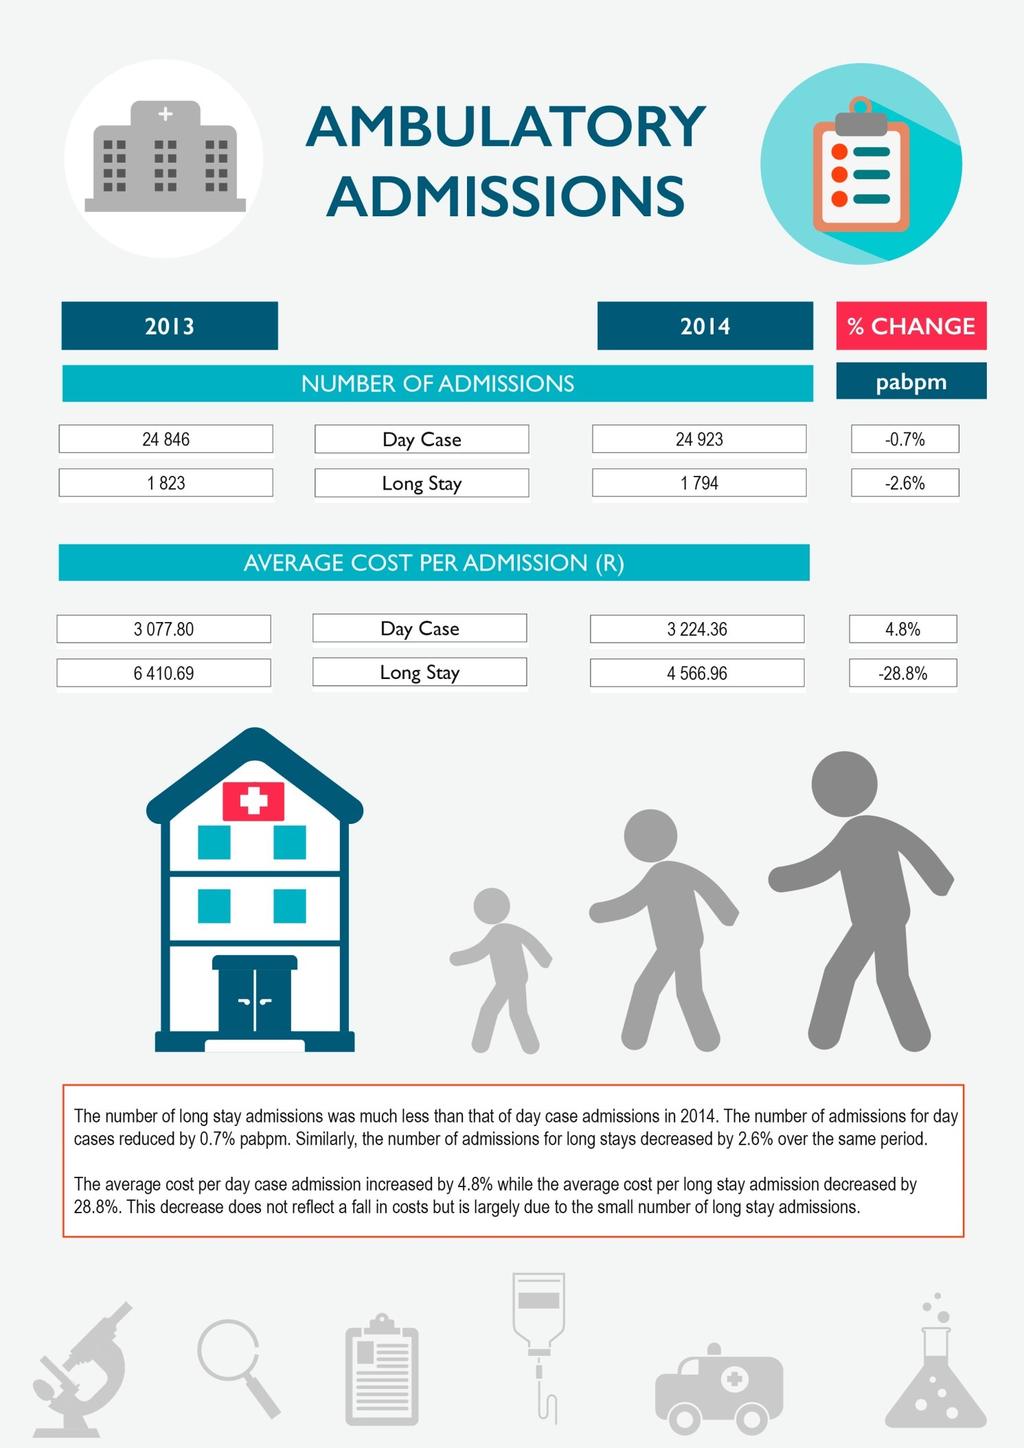
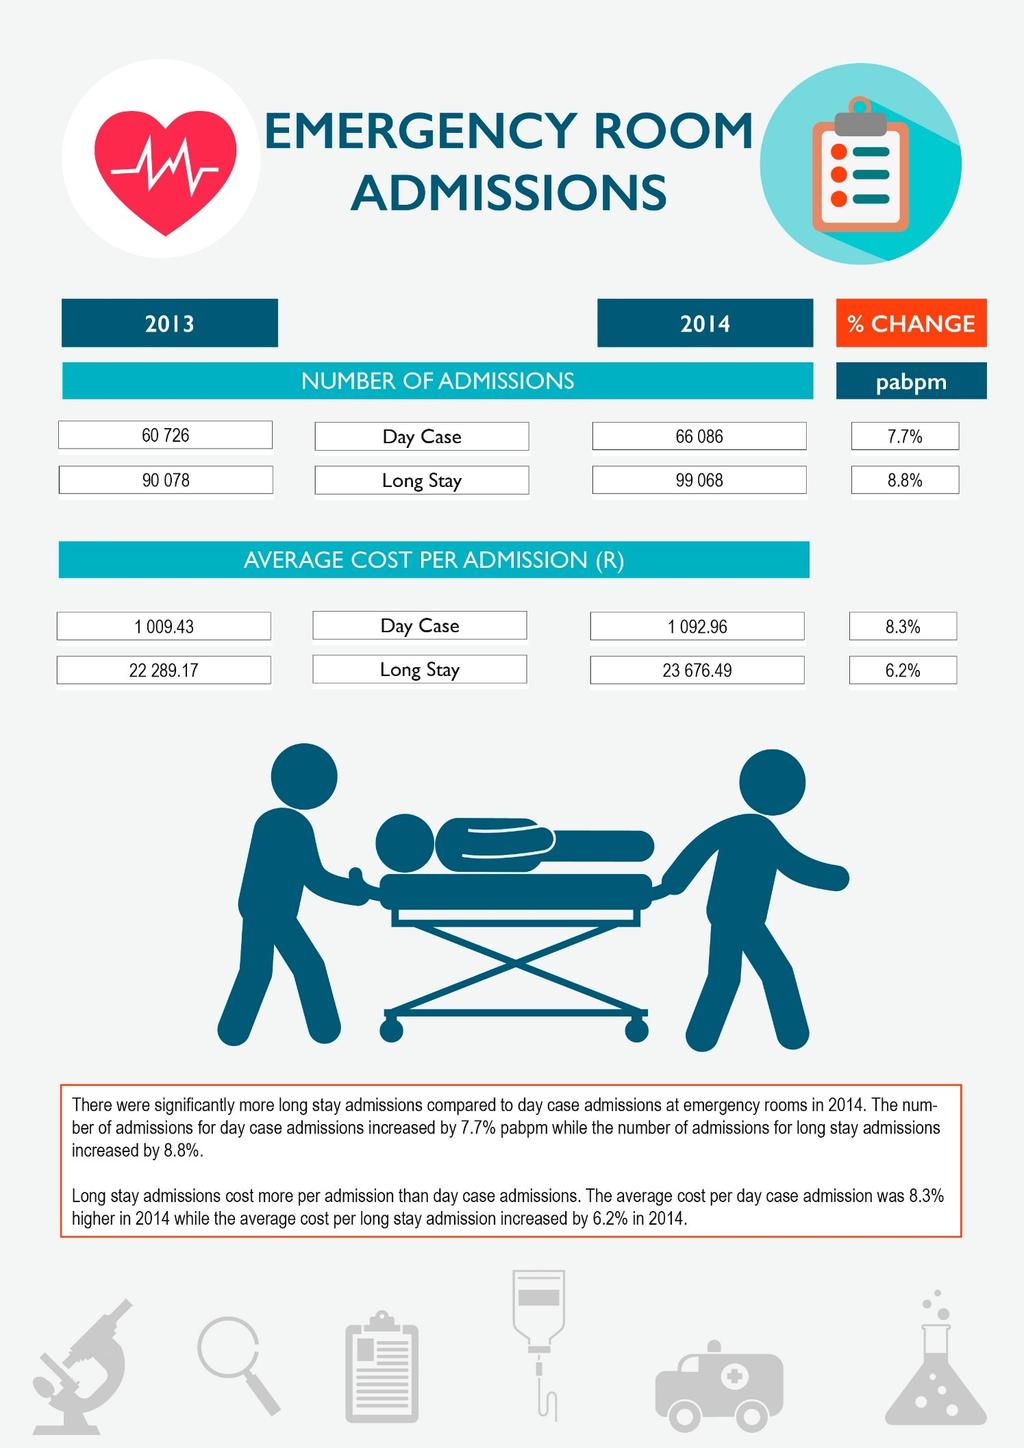
20 Table 5: Average cost per day by benefit option type in 2013 & 2014 Benefit Option Type Day case (*) % change Long stay % change Traditional + PMBs & other 6 309, ,81 6,3% 4 901, ,48 7,2% DSP (R) Savings + PMBs & other 6 668, ,97 22,9% 5 491, ,36-0,2% DSP (R) PMBs & other Chronic (R) 6 306, ,77 10,4% 6 140, ,46 2,1% Savings + PMBs & other 6 707, ,70 8,1% 5 813, ,45 6,3% Chronic (R) Traditional & PMBs 5 609, ,75 5,7% 4 928, ,34 9,5% DSPs (R) PMBs Only (R) 6 144, ,86 12,9% 6 867, ,45 7,7% Hybrid (EDO + primary) (R) 6 639, ,70 7,0% 6 455, ,62 5,9% PMB Exempt (R) 4 673, ,99 13,3% 4 011, ,44 41,3% Traditional + PMBs & other Chronic (R) 7 892, ,85 9,4% 4 754, ,99 6,2% Totals (R) 6 545, ,98 10,2% 5 442, ,82 5,6% * represents the average cost per admission for the day case as the specific length of times spent are not known Table 5 shows the average cost per day for the 2013 and 2014 financial years by benefit option type. For long stay admissions, the cost for the PMB Exempt benefit option type increased significantly, increasing by 41.3% increase from 2013 to This option has very few members and is prone to such fluctuations Hospital admissions by admission type The results that follows reports on the number of admissions and the average cost per admission by admission type. The results are shown according to the hospital admission category (Surgical, medical, ambulatory, maternity and emergency room) and contains information for the 2013 and 2014 financial years. Due to data challenges discussed earlier, the average cost per day was not calculated as some schemes failed to provide accurate length of stay. Its also unclear how schemes allocated admissions between the various types of admission categories. The total admissions for these five catergories therefore do not exactly match the total admissions discussed earlier. 20
21 21
22 22
23 23
24 24
25 25
26 4.2 Providers The data for providers mainly focussed on the number of visits (and whether or not they were in-hospital/out-ofhospital) and the number of consumables and medicines dispensed. The total number of visits to providers was in 2013 and in The average cost per visit was R689 in 2013 and R744 in The total number of items (medicines or consumables) dispensed was in 2013 and in The average cost per item dispensed was R88.69 in 2013 and R92.18 in Table 6: Number of visits per beneficiaries by benefit option type in 2013 & 2014 Benefit Option Type In-hospital % change Out-of-hospital % change Traditional + PMBs & other DSP 2 116, ,6 5,9% 6 507, ,6 3,1% Savings + PMBs & other DSP 2 010, ,6 6,4% 6 892, ,3 2,3% PMBs & other Chronic 1 287, ,5 5,6% 2 207, ,9 7,8% Savings + PMBs & other Chronic 2 141, ,7 3,9% 6 115, ,0 2,3% Traditional & PMBs DSPs 1 126, ,1 12,1% 4 039, ,2-0,1% PMBs Only 1 930, ,1 4,4% 1 227, ,6 9,9% Hybrid (EDO + primary) 2 189, ,7 3,5% 5 820, ,0-0,3% PMB Exempt 282,7 303,8 7,5% 1 631, ,4 9,3% Traditional + PMBs & other Chronic 2 088, ,8 3,5% 6 743, ,8 0,0% Totals 2 004, ,7 5,2% 5 950, ,7 1,9% Table 6 shows the number of visits to providers per beneficiaries for the 2013 and 2014 financial years by benefit option type. All benefit option types had an increase in in-hospital visits from 2013 to The increase in out-of-hospital visits was lower than in-hospital visits with some options recording marginal decreases. The largest increase for out-of-hospital visits was on the PMB Exempt and the PMBs - only benefit option types with increases of 9.3% and 9.9% respectively. It s also important to note that the PMBs only had a very small portion of the beneficiaries. This option had a risk profile that was significantly worse off compared to other options. This in part, explains some of the utilisation trends observed. 26
27 Table 7: Average cost per visit by benefit option type in 2013 & 2014 Benefit Option Type In-hospital % change Out-of-hospital % change Traditional + PMBs & other DSP (R) 953, ,04 7,9% 493,72 532,54 7,9% Savings + PMBs & other DSP (R) 1 139, ,77 7,6% 572,54 610,64 6,7% PMBs & other Chronic (R) 1 185, ,82 6,9% 583,19 603,81 3,5% Savings + PMBs & other Chronic (R) 1 169, ,38 7,6% 599,15 649,69 8,4% Traditional & PMBs DSPs (R) 979, ,87 6,3% 427,56 455,24 6,5% PMBs Only (R) 1 238, ,58 9,4% 472,79 533,42 12,8% Hybrid (EDO + primary) (R) 1 354, ,20 6,5% 654,96 699,90 6,9% PMB Exempt (R) 1 131, ,53 1,6% 514,99 525,88 2,1% Traditional + PMBs & other Chronic (R) 936,62 975,19 4,1% 485,27 527,84 8,8% Totals 1 103, ,16 7,3% 549,53 591,04 7,6% Table 7 shows the average cost per visit by benefit option type for the 2013 and 2014 financial years. The average cost per visit across all benefit options increased with the largest increase on the PMBs Only benefit option type. The PMB Exempt benefit option type recorded the lowest increases in the average cost of a visit for both in-hospital and out-of-hospital increasing by 1.6% and 2.1% respectively Utilisation at providers by discipline The data that follows shows the number of visits to providers and the number of items dispensed along with the costs associated for the visits. The data is split by discipline group for providers and shows information for the 2013 and 2014 financial years. The discipline classes used below are as per the 2015 Annual Statutory Report which were provided by the Board of Health Funders. 27
28 28
29 29
30 30
31 31
32 32
33 33
34 34
35 35
36 36
37 37
38 4.3 Medicines This section refers to medicines and consumables dispensed out-of-hospital. The total number of items dispensed was in 2013 of which were consumables and were medicines. The total number of items dispensed was in 2014 of which was consumables and were medicines. The average cost per item dispensed was R88.69 in 2013 and R92.18 in The average cost per consumable dispensed was R66.38 in 2013 and R72.25 in The average cost per medicine dispensed was R90.36 in 2013 and R93.62 in Table 8: Number of items dispensed per beneficiaries by benefit option type in 2013 & 2014 Benefit Option Type Consumables % change Medicine % change Traditional + PMBs & other DSP 2 452, ,55-0,4% , ,79 1,6% Savings + PMBs & other DSP 1 779, ,55-4,4% , ,05 5,2% PMBs & other Chronic 442,19 441,67-0,1% 5 475, ,50 6,8% Savings + PMBs & other Chronic 1 250, ,51 4,8% , ,93 5,2% Traditional & PMBs DSPs 849, ,34 52,2% , ,96 57,8% PMBs Only 348,84 405,37 16,2% 5 358, ,56 7,5% Hybrid (EDO + primary) 1 131, ,82 0,5% , ,94 2,4% PMB Exempt 918, ,38 16,9% 1 089, ,00 18,3% Traditional + PMBs & other Chronic 2 054, ,94 5,0% , ,95 1,4% Totals 1 705, ,91 1,0% , ,91 4,2% Table 8 shows the number of items dispensed per beneficiaries for the 2013 and 2014 financial years. There was a steep increase in the number of consumables dispensed in the Traditional + PMBs & other DSP benefit option type with increases of above 50%. There were decreases in the number of consumable dispensed for three benefit option types. The Savings + PMBs & other DSP benefit option type have the most significant decrease of 4.4%. 38
39 Table 9: Average cost per item dispensed by benefit option type in 2013 & 2014 Benefit Option Type Consumables % change Medicine % change Traditional + PMBs & other DSP (R) 56,09 63,02 12,3% 64,90 70,13 8,1% Savings + PMBs & other DSP (R) 76,56 84,43 10,3% 94,44 97,18 2,9% PMBs & other Chronic (R) 154,77 160,63 3,8% 139,28 133,59-4,1% Savings + PMBs & other Chronic (R) 61,67 66,22 7,4% 112,11 116,48 3,9% Traditional & PMBs DSPs (R) 59,20 45,13-23,8% 82,66 53,50-35,3% PMBs Only (R) 85,89 97,89 14,0% 83,50 88,31 5,8% Hybrid (EDO + primary) (R) 94,35 98,61 4,5% 147,75 151,56 2,6% PMB Exempt (R) 126,64 151,48 19,6% 78,65 77,09-2,0% Traditional + PMBs & other Chronic (R) 59,14 67,60 14,3% 95,32 100,91 5,9% Totals 66,38 72,25 8,9% 90,36 93,62 3,6% Table 9 shows the average cost per item dispensed for the 2013 and 2014 financial years by benefit option type. The average cost per item dispensed for consumables decreased on the PMBs & other Chronic benefit option type while it increased for the other benefit option types. The average cost of medicines dispensed was lower in 2014 for the PMB Exempt and the Traditional & PMBs DSPs and PMBs & other Chronic benefit option types. The PMBs & other DSP benefit option type had a very significant decreases of 23.8% and 35.3% in the average cost consumable and medicine respectively. The overall impact was to reduce the effect of the higher number of in items dispensed noted earlier. 39
40 5. Conclusion and Recommendations Hospitalisation recorded marginal decreases in measures of utilisation, there were lower admission rates and the shorter length of stay reduced. However the average cost of hospitalisation was significantly higher in 2014 compared to In 2014, the average cost per admission was up 10.4%. The average cost per day in-hospital was 6.1% higher in The in patient days provided by some schemes was largely in accurate. Data adjustments had to be made using the data that was more accurate. Schemes are encouraged to review their data more before submitting to the CMS. However, valuable conclusions can still be made from this data. The CMS intends to use these utilisation statics to formulate a contribution inflation index to track what affects contribution increases over time. It s important that data is collect and reported in a consistent way. It is recommended that the CMS engages with schemes so at to improve the quality of data. The number of in-patient days should be reported accurately. Schemes need to consistently report on admission by admission categories in cases where patients are transferred from one admission setting to another such as a transfer from emergency room to surgical theatre. The utilisation of providers increased at a rate of 2.7% in Higher increases were observed for in-hospital visits. The average cost of each visit to a provider increased 8% in 2014, with higher increases recorded for inhospital visits. The average cost of each visit in-hospital was significantly higher than the average cost out-ofhospital for most providers. Expenditure on medicines out-of-hospital reordered the most modest growth. The average cost per item dispensed increased 3.9% in The average number of items dispensed pabpm was up by 4%. This analysis is limited to health-services that have been paid for by schemes. It therefore does to include expenditure paid out of pocket. To get a better understanding of actual healthcare trends out of pocket payment utilisation should not be ignored. 40
41 6. References Council for Medical Schemes Annual Statutory Returns Utilisation System. Available from: Council for Medical Schemes The Council for Medical Schemes Annual Report 2014/15. Pretoria: Inhouse publication. Available from the CMS website: Council for Medical Schemes Beneficiary movement analysis. Available from the CMS website: 41
Contribution inflation in Medical Schemes
 Contribution inflation in Medical Schemes 10 August 2016 by Charlton Murove 10 August 2016 1 Overview I. Inflation & medical inflation as measure by Statistics South Africa (Stats SA) II. Contribution
REPORT ON ANALYSIS OF MEDICAL SCHEMES CLAIMS DATA- A FOCUS ON PRESCRIBED MINIMUM BENEFITS 8 DECEMBER 2017
 REPORT ON ANALYSIS OF MEDICAL SCHEMES CLAIMS DATA- A FOCUS ON PRESCRIBED MINIMUM BENEFITS 8 DECEMBER 2017 DISCLAIMER The Competition Commission Health Market Inquiry (HMI), through an open tender, appointed
REPORT ON ANALYSIS OF MEDICAL SCHEMES CLAIMS DATA- INITIAL COST ATTRIBUTION ANALYSIS VERSION 2: 8 DECEMBER 2017
 REPORT ON ANALYSIS OF MEDICAL SCHEMES CLAIMS DATA- INITIAL COST ATTRIBUTION ANALYSIS VERSION 2: 8 DECEMBER 2017 DISCLAIMER The Competition Commission Health Market Inquiry (HMI), through an open tender,
CIRCULAR 4 OF 2013: EVALUATION OF COST INCREASE ASSUMPTIONS BY MEDICAL SCHEMES FOR 2013 FINANCIAL YEAR
 CIRCULAR Reference : Evaluation of contribution increase assumptions for 2013 Contact : Nondumiso Khumalo Telephone : 012 431-0514 Facsimilee : 012 431 0612 E-mail : n.khumalo@medicalschemes.com Date :
FREQUENTLY ASKED QUESTIONS
 Web:www.gapcover.co.za / Tel: 0861 333 128 What is GapCover? GapCover provides cover for the difference in the amount charged by a Registered Medical Professional and the Medical Scheme Rate for services
REPORT ON ANALYSIS OF MEDICAL SCHEMES CLAIMS DATA: A FOCUS ON FUNDERS VERSION: 15 DECEMBER 2017
 REPORT ON ANALYSIS OF MEDICAL SCHEMES CLAIMS DATA: A FOCUS ON FUNDERS VERSION: 15 DECEMBER 2017 DISCLAIMER The Competition Commission Health Market Inquiry (HMI), through an open tender, appointed Willis
Vermont Health Care Cost and Utilization Report
 2007 2011 Vermont Health Care Cost and Utilization Report Revised December 2014 Copyright 2014 Health Care Cost Institute Inc. Unless explicitly noted, the content of this report is licensed under a Creative
Guideline for the preparation of a business plan pursuant to an application for the registration of a new/restructured benefit option(s) as per
 as per") Guideline for the preparation of a business plan pursuant to an application for the registration (s) as per Section 33 of the Medical Schemes Act 131 of 1998, as amended February 2012 Guideline for the
Guideline for the preparation of a business plan pursuant to an application for the registration (s) as per Section 33 of the Medical Schemes Act 131 of 1998, as amended February 2012 Guideline for the
CIRCULAR 23 OF 2015: EVALUATION OF COST INCREASE ASSUMPTIONS BY MEDICAL SCHEMES FOR 2015 FINANCIAL YEAR
 CIRCULAR Reference: Evaluation of contribution increase assumptions for 2015 Contact person: Kgotsofatso Phaswana Tel: 012 431 0407 Fax: 012 431 0642 E-mail: k.phaswana@medicalschemes.com Date: 25 March
Guideline for the preparation of a business plan pursuant to an application for the registration of a new/restructured benefit option(s) as per
 as per") Guideline for the preparation of a business plan pursuant to an application for the registration of a new/restructured benefit option(s) as per Section 33 of the Medical Schemes Act 131 of 1998, as amended.
Guideline for the preparation of a business plan pursuant to an application for the registration of a new/restructured benefit option(s) as per Section 33 of the Medical Schemes Act 131 of 1998, as amended.
Your Guide to Hospital Cover
 Your Guide to Hospital Cover This is an important document. Please read it carefully and retain for future reference. Effective: 1 April 2018 Getting the most from your hospital cover Hospital cover provides
2013 Milliman Medical Index
 2013 Milliman Medical Index $22,030 MILLIMAN MEDICAL INDEX 2013 $22,261 ANNUAL COST OF ATTENDING AN IN-STATE PUBLIC COLLEGE $9,144 COMBINED EMPLOYEE CONTRIBUTION $3,600 EMPLOYEE OUT-OF-POCKET $5,544 EMPLOYEE
AXIS. CompCare Wellness Medical Scheme. Information and Benefit Guide 2018
 / DYNAMIC / EVOLVING / PROGRESSIVE / CHAMPIONS / WINNING / SUCCESS / ENERGY / INSPIRATION / AXIS CompCare Wellness Medical Scheme Information and Benefit Guide 2018 VICTORY / ACTIVE / DYNAMIC / EVOLVING
Strategies for Assessing Health Plan Performance on Chronic Diseases: Selecting Performance Indicators and Applying Health-Based Risk Adjustment
 Strategies for Assessing Health Plan Performance on Chronic Diseases: Selecting Performance Indicators and Applying Health-Based Risk Adjustment Appendix I Performance Results Overview In this section,
Glossary. Adults: Individuals ages 19 through 64. Allowed amounts: See prices paid. Allowed costs: See prices paid.
 Glossary Acute inpatient: A subservice category of the inpatient facility clams that have excluded skilled nursing facilities (SNF), hospice, and ungroupable claims. This subcategory was previously known
ALLIANCE DOUBLE PLUS VITAL ESSENTIAL FIRST CHOICE NETWORK CHOICE
 HOSPITAL ACCOMMODATION INCLUDING CONFINEMENTS SUBJECT TO PRE-AUTHORISATION ATTENDING DOCTORS AND SPECIALISTS CONSULTATIONS MEDICAL AND SURGICAL PROCEDURES INCLUDING CONFINEMENTS AUXILIARY HEALTHCARE IN
Trends in Medical Schemes Contributions, Membership and Benefits
 COUNCIL FOR MEDICAL SCHEMES Number 2 of 2008 Prepared by the Office of the Registrar of Medical Schemes Trends in Medical Schemes Contributions, Membership and Benefits 2002 2006 May 2008 COUNCIL FOR MEDICAL
The Product offerings differ from each other on the basis of the following criteria:
 blueprint2009 The BESTmed product offering The BESTmed product offering is extensive with seven options that meet the unique and individualistic healthcare needs of our members. We have taken great care
Health Service System Board
 Health Service System Board Q2 2013 Dashboard Summary Report A Review of City Plan Inpatient, Outpatient, and Rx Trends November 14, 2013 Prepared by Aon Hewitt Health and Benefits Introduction This report
The summary below is as per the information provided by the scheme at their launch for 2017.
 2017 FEDHEALTH MEDICAL SCHEME UPDATE The summary below is as per the information provided by the scheme at their launch for 2017. The average weighted increase for 2017 is 12.7%. Fedhealth have kept an
EFFICIENCY DISCOUNTED OPTIONS VALUE PROPOSITION. Mondi Govuzela 06 July 2017
 EFFICIENCY DISCOUNTED OPTIONS VALUE PROPOSITION Mondi Govuzela 06 July 2017 Outline Context Section 29(1)(n) Silo-type benefit option framework What are EDOs? EDO Framework EDO construct demonstration
Important Contact Information for your Swisscare Expatriate Health Plan
 & Table of Benefits Epat Plan 2013 Epat Plan 2013 Important Contact Information for your Swisscare Epatriate Health Plan For help in understanding your benefits, questions and general plan guidance, please
The NetworX Efficiency Discounted Option 2014
 The NetworX Efficiency Discounted Option 2014 YOU CAN LOOK FORWARD TO EXCEPTIONAL VALUE AND BENEFITS FOR 2014 NetworX (Lims Option) The NetworX Efficiency Discounted (ED) Option The NetworX ED option is
Guideline for the preparation of a business plan pursuant to an application for an amalgamation of medical schemes as per Section 63 of the Medical
 as per Section 63 of the Medical Schemes Act 131 of 1998, as amended. September 2009 1. INTRODUCTION... 3 2. BUSINESS PLAN FORMAT... 4 2.1 EXECUTIVE SUMMARY... 4 2.1.1 Objective... 4 2.2 MEDICAL SCHEME
ANNEXURE B.5 BEAT1 NETWORK 5.1 GENERAL CONDITIONS OF THE BENEFIT OPTION
 P a g e 1 ANNEXURE B.5 BEAT1 NETWORK 5.1 GENERAL CONDITIONS OF THE BENEFIT OPTION 5.1.1 Members are entitled to benefits during a Financial Year, from either Beat1 or Beat1 Network, and such benefits extend
CHAPTER 2. THE UNINSURED ACCESS GAP AND THE COST OF UNIVERSAL COVERAGE
 CRS-4 CHAPTER 2. THE UNINSURED ACCESS GAP AND THE COST OF UNIVERSAL COVERAGE THE GAP IN USE BETWEEN THE UNINSURED AND INSURED Adults lacking health insurance coverage for a full year have about 60 percent
Schedule of Benefits (GR-29N OK)
") Schedule of Benefits (GR-29N 01-01 01 OK) Employer: Group Policy Number: HS-Real Estate, Inc. dba Hal Smith Restaurant Group GP-493042 Issue Date: April 28, 2017 Effective Date: March 1, 2017 Schedule:
Schedule of Benefits (GR-29N 01-01 01 OK) Employer: Group Policy Number: HS-Real Estate, Inc. dba Hal Smith Restaurant Group GP-493042 Issue Date: April 28, 2017 Effective Date: March 1, 2017 Schedule:
Health Economics Program
 Health Economics Program Issue Brief 2003-05 August 2003 Minnesota s Aging Population: Implications for Health Care Costs and System Capacity Introduction After a period of respite in the mid-1990s, health
Guide to Prescribed Minimum Benefits 2018
 Guide to Prescribed Minimum Benefits 2018 Who we are Remedi Medical Aid Scheme (referred to as 'the Scheme"), registration number 1430, is a non-profit organisation, registered with the Council for Medical
Hospital Alternative Reimbursement Models, and DRGs
 Hospital Alternative Reimbursement Models, and DRGs Topics 1 Alternative Reimbursement Models Fixed Fee options 2 Diagnosis Related Groups and Case Mix Risks, Rationale and Incentives 3 Clinical Coding
Member communication on the proposed amalgamation of Fedhealth Medical Scheme and Topmed Medical Scheme with effect from 1 May 2019.
 Member communication on the proposed amalgamation of Fedhealth Medical Scheme and Topmed Medical Scheme with effect from 1 May 2019 Contents 1. Introduction 1 1.1 Purpose of this document 1 1.2 Overview
ACA impact illustrations Individual and group medical New Jersey
 ACA impact illustrations Individual and group medical New Jersey Prepared for and at the request of: Center Forward Prepared by: Margaret A. Chance, FSA, MAAA James T. O Connor, FSA, MAAA 71 S. Wacker
Guide to Prescribed Minimum Benefits
 Guide to Prescribed Minimum Benefits 2018 Overview All registered medical schemes in South Africa need to cover Prescribed Minimum Benefits on all the plans they offer to their members. Discovery Health
Adventist Health System Schedule of Benefits for Adventist Health System Effective January 1, 2018
 Adventist Health System Schedule of Benefits for Adventist Health System Effective January 1, 2018 High Health Plan with Health Savings Account (Health Savings Plan) TIER 1 TIER 2 TIER 3 CALENDAR YEAR
Methodology to assess the cost impact of PMB benefit definitions
 Methodology to assess the cost impact of PMB benefit definitions Version 1.0.0 07 March 2012 Contents 1 Background... 1 2 Aim... 1 3 Objectives... 1 4 Methods... 2 5 Variables for data collection, data
Important Contact Information for your Swisscare Expatriate Health Plan
 & Table of Benefits Epat Plan 2013 Epat Plan 2013 Important Contact Information for your Swisscare Epatriate Health Plan For help in understanding your benefits, questions and general plan guidance, please
Policy document and members guide
 Policy document and members guide Effective August 2009 OSHC Worldcare welcomes you to Australia! We understand that maintaining your health is an important part of making your stay in Australia as safe
New Family Package Key Facts Sheet
 New Family Package Key Facts Sheet 01.04.2018 New Family Package This is an affordable hospital and extras package which contributes towards expenses in a private and public hospital including cover for
Freedom Package. Key Facts Sheet
 Freedom Package Key Facts Sheet 01.04.2018 Freedom Package This is an affordable hospital and extras package which contributes towards expenses in a private and public hospital. Public hospital benefits
Gold Hospital (No Pregnancy) GNO, GN1 & GN2- $0, $250 & $500 annual excess
 GNO, GN1 & GN2- $0, $250 & $500 annual excess") Gfgfgf fgfgfgfgffgfgfggghgh Gold Hospital (No Pregnancy) GNO, GN1 & GN2- $0, $250 & $500 annual excess This information is important, please read and retain for future reference. Gold Hospital (No Pregnancy)
Gfgfgf fgfgfgfgffgfgfggghgh Gold Hospital (No Pregnancy) GNO, GN1 & GN2- $0, $250 & $500 annual excess This information is important, please read and retain for future reference. Gold Hospital (No Pregnancy)
Part I Unified Rate Review Template Instructions
 DEPARTMENT OF HEALTH & HUMAN SERVICES Centers for Medicare & Medicaid Services Part I Unified Rate Review Template Instructions March 20, 2014 1 Part I Unified Rate Review Template v2.0.1 The Part I Unified
City of Los Angeles Periodic Utilization Report 3rd Quarter 2017 (10/1/2016 9/30/2017)
") Dr. Craig Collins, MD, MBA, FACS General and Minimally Invasive Surgery Physician Marketing Leader, Los Angeles Metro Area Associate Clinical Professor, UCLA Geffen School of Medicine City of Los Angeles
Dr. Craig Collins, MD, MBA, FACS General and Minimally Invasive Surgery Physician Marketing Leader, Los Angeles Metro Area Associate Clinical Professor, UCLA Geffen School of Medicine City of Los Angeles
HealthKeepers, Inc. Your Plan: Anthem HealthKeepers Platinum OAPOS 10/0%/3000 Your Network: HealthKeepers
 HealthKeepers, Inc. Your Plan: Anthem HealthKeepers Platinum OAPOS 10/0%/3000 Your Network: HealthKeepers This summary of benefits is a brief outline of coverage, designed to help you with the selection
Calculating Accurate Metrics for the Actuarial Cost Model. Introduction. William Bednar, FSA, FCA, MAAA
 Calculating Accurate Metrics for the Actuarial Cost Model William Bednar, FSA, FCA, MAAA Introduction Calculating metrics for an actuarial model sounds simple enough (just sum up the data!), but if proper
2014 Side-by-side comparison between the Aetna CDHP and the Aetna PPO for Medical Coverage
 2014 Side-by-side comparison between the and the for Medical Coverage Medical Coverage Carrier Aetna Aetna Aetna Aetna Deductible Individual $1,750 $3,250 $750 $2,250 Family $3,500 $6,500 $1,500 $4,500
Public Hearing Presentation Retaining Value and Quality in a changing healthcare landscape
 Public Hearing Presentation Retaining Value and Quality in a changing healthcare landscape Teddy Mosomothane 17 May 2016 Embracing the opportunity to contribute We appreciate the inquiry process as partly
LAWS OF ALASKA AN ACT
 LAWS OF ALASKA 01 Source CSHB 1(FIN) Chapter No. AN ACT Relating to workers' compensation fees for medical treatment and services; relating to workers' compensation regulations; and providing for an effective
Service Participating Providers: Non-participating Providers:
 Bend Chamber of Commerce Provider Network: SmartChoice Medical Benefit Summary SmartChoice 3000+25-50_30 S2 Annual Deductible Per Person, Per Calendar Year Per Family, Per Calendar Year All Providers $3,000
Response to OECD paper: International Comparison of South African Private Hospital Price Levels. Prepared for Mediclinic South Africa (MCSA)
") Response to OECD paper: International Comparison of South African Private Hospital Price Levels Prepared for Mediclinic South Africa (MCSA) 1 April 2016 Table of Contents Executive summary... 1 1 Main
Response to OECD paper: International Comparison of South African Private Hospital Price Levels Prepared for Mediclinic South Africa (MCSA) 1 April 2016 Table of Contents Executive summary... 1 1 Main
Complementary health insurance ILO/ITU
 Information note Edition 2014 Complementary health insurance ILO/ITU BENEFICIARIES The Provident and Insurance Group of International Officials (GPAFI) is a non-profit-making association that provides
At a Glance. Cover. Private Hospital^ Maternity & Birth. Rehabilitation^ Ambulance^ Repatriation^ Local Doctor (GP)^ Prescribed Medicines^ Pathology^
^ Prescribed Medicines^ Pathology^") Top Working Cover Overseas Visitor Health Cover (OVHC) To check if you hold an eligible visa for this product, please see our website www.allianzassistancehealth.com.au/eligible-visas-we-cover If you get
Top Working Cover Overseas Visitor Health Cover (OVHC) To check if you hold an eligible visa for this product, please see our website www.allianzassistancehealth.com.au/eligible-visas-we-cover If you get
IntegraGlobal. Health plans about you, Family health plans you can trust. PremierLife & PremierFamily Table of Benefits for the UAE
 Health plans about you, Family health plans you can trust. for the UAE Underwritten by SALAMA-Islamic Arab Insurance Co. (P.S.C.) IntegraGlobal Important Contact Information for your Integra Global Health
R O T C E E S T A IV R P 163
 163 PRIVATE SECTOR 164 PRIVATE SECTOR Analysing the structure and nature of medical scheme benefit design in South Africa 13 Authors: Josh Kaplan i Shivani Ranchod i T he large number of benefit options
California Small Group MC Aetna Life Insurance Company NETWORK CARE
 PLAN FEATURES Deductible (per calendar year) Unless otherwise indicated, the Deductible must be met prior to benefits being payable. All covered expenses accumulate toward the preferred and non-preferred
For: Choice POS II - Clerical & Technical and Service & Maintenance Employees Choice POS II (Base Rx) Plan
 Plan") Schedule of Benefits Employer: Yale University ASA: 877076 Issue Date: June 23, 2016 Effective Date: January 1, 2016 Schedule: 2A Booklet Base: 2 For: Choice POS II - Clerical & Technical and Service &
Schedule of Benefits Employer: Yale University ASA: 877076 Issue Date: June 23, 2016 Effective Date: January 1, 2016 Schedule: 2A Booklet Base: 2 For: Choice POS II - Clerical & Technical and Service &
B e n e f i t O p t i o n s
 2018 Benefit Options 2018 What determines your decision to join a medical aid? At Selfmed we cut straight to the Is it the add-on s, you know the free gym membership and movie tickets or, is it the reliable
Your Plan: Anthem Premier DirectAccess gwaa Your Network: KeyCare
 Your Plan: Anthem Premier DirectAccess gwaa Your Network: KeyCare This summary of benefits is a brief outline of coverage, designed to help you with the selection process. This summary does not reflect
SIZWE MEDICAL FUND SIZWE AFFORDABLE OPTION. ANNEXURE B BENEFITS (Effective 1 January 2007)
") SIZWE MEDICAL FUND SIZWE AFFORDABLE OPTION ANNEXURE B BENEFITS (Effective 1 January 2007) A B ENTITLEMENT TO BENEFITS Subject to the provisions of Rule 6 and Rule 12 and to the conditions stipulated in
SIZWE MEDICAL FUND SIZWE AFFORDABLE OPTION ANNEXURE B BENEFITS (Effective 1 January 2007) A B ENTITLEMENT TO BENEFITS Subject to the provisions of Rule 6 and Rule 12 and to the conditions stipulated in
i under stand better Medibank Comprehensive OSHC Membership Guide
 i under stand better Medibank Comprehensive OSHC Membership Guide Effective January 2018 What s inside Your guide to membership Welcome to membership of Medibank Comprehensive Overseas Student Health Cover
Summary of Coverage. The benefits shown in this Summary of Coverage are available for you and your eligible dependents.
 Summary of Coverage Employer: Catholic Health East RHC ASA: 863737 SOC: 1A Issue Date: November 14, 2007 Effective Date: January 1, 2008 The benefits shown in this Summary of Coverage are available for
MEDICARE SUPPLEMENT PLANS. Western Marketing Associates Corporation 318 W Huron St. Missouri Valley, IA 51555
 MEDICARE SUPPLEMENT PLANS FROM WESTERN MARKETING Western Marketing Associates Corporation 318 W Huron St. Missouri Valley, IA 51555 MEDICARE BASICS WHAT IS MEDICARE? Social insurance program established
Anthem Blue Cross of California Your Plan: Anthem Bronze PPO 6500/0%/6500 w/hsa Your Network: Prudent Buyer PPO
 Anthem Blue Cross of California Your Plan: Anthem Bronze PPO 6500/0%/6500 w/hsa Your Network: Prudent Buyer PPO This summary of benefits is a brief outline of coverage, designed to help you with the selection
California Small Group MC Aetna Life Insurance Company
 PLAN FEATURES Deductible (per calendar year) $5,000 Individual $10,000 Family Unless otherwise indicated, the Deductible must be met prior to benefits being payable. All covered expenses accumulate toward
Evaluation of cost increase assumptions by medical schemes for the 2012 financial year
 CIRCULAR 54 of 2011 Reference : Evaluation of contribution increase assumptions for 2012 Contact : Nondumiso Khumalo Telephone : (012) 431 0514 Facsimile : (012) 431 0612 E-mail : n.khumalo@medicalschemes.com
COVENTRY HEALTH CARE OF DELAWARE, INC. DIAMOND PLAN 2 (Maryland)
") COVENTRY HEALTH CARE OF DELAWARE, INC. DIAMOND PLAN 2 (Maryland) The benefits described in this Diamond Plan 2 are in addition to the benefits offered under Coventry Health Care of Delaware, Inc. Small
COVENTRY HEALTH CARE OF DELAWARE, INC. DIAMOND PLAN 2 (Maryland) The benefits described in this Diamond Plan 2 are in addition to the benefits offered under Coventry Health Care of Delaware, Inc. Small
Family Value Package. Your guide to. Questions? Need Advice? Our consultants are available to help.
 Your guide to Family Value Package Questions? Need Advice? Our consultants are available to help. Comparethemarket.com.au ACN 117 323 378 Level 2, 80 Jephson Street, Toowong Qld 4066 PO Box 301, Toowong
This is an ERISA plan, and you have certain rights under this plan. Please contact your Employer for additional information.
 Schedule of Benefits Employer: Apria Healthcare Group, Inc. ASA: 476706 Issue Date: May 7, 2013 Effective Date: January 1, 2013 Schedule: 2A Booklet Base: 2 For: Choice POS II High Deductible Health Plan-Apria
Your Plan: Anthem Silver PPO 2000/35%/6850 Your Network: Prudent Buyer PPO
 Your Plan: Anthem Silver PPO 2000/35%/6850 Your Network: Prudent Buyer PPO This summary of benefits is a brief outline of coverage, designed to help you with the selection process. This summary does not
For: Traditional Choice - Over Age 65 Corning Retirees - Comprehensive Medical Only - MAP Plus Option 1
 Schedule of Benefits Employer: ASA: Control: The Dow Chemical Company 783135 865282 Issue Date: March 15, 2017 Effective Date: March 1, 2017 Schedule: 120B Booklet Base: 120 For: Traditional Choice - Over
Your Plan: Anthem Platinum Priority Select HMO 10/10%/2500 Plus Your Network: Priority Select HMO
 Your Plan: Anthem Platinum Priority Select HMO 10/10%/2500 Plus Your Network: Priority Select HMO This summary of benefits is a brief outline of coverage, designed to help you with the selection process.
PLAN DESIGN AND BENEFITS - IN MANAGED CHOICE POS OPEN ACCESS 90/60/60 $1,000 PREFERRED CARE
 PLAN FEATURES NON- Deductible (per calendar year) $1,000 Individual $2,000 Individual $2,000 Family $4,000 Family Unless otherwise indicated, the Deductible must be met prior to benefits being payable.
Prescribed Minimum Benefit compliance and the protection of beneficiaries. Council for Medical Schemes PMB Compliance workshop 11 May 2010
 Prescribed Minimum Benefit compliance and the protection of beneficiaries Council for Medical Schemes PMB Compliance workshop 11 May 2010 1 Contents Purpose of the day Context PMB review process Industry
Anthem Blue Cross of California Your Plan: Anthem Gold PPO 500/20%/6500 Your Network: Prudent Buyer PPO
 Anthem Blue Cross of California Your Plan: Anthem Gold PPO 500/20%/6500 Your Network: Prudent Buyer PPO This summary of benefits is a brief outline of coverage, designed to help you with the selection
A regulators perspective: evidence of anti-selection and experience in addressing risk pooling failures and benefit design
 A regulators perspective: evidence of anti-selection and experience in addressing risk pooling failures and benefit design Council for Medical Schemes 1 Contents Introduction Anti-selection evidence Experience
Anthem Blue Cross of California Your Plan: Anthem Silver PPO 2000/35%/7150 Your Network: Prudent Buyer PPO
 Anthem Blue Cross of California Your Plan: Anthem Silver PPO 2000/35%/7150 Your Network: Prudent Buyer PPO This summary of benefits is a brief outline of coverage, designed to help you with the selection
Your Plan: Anthem Bronze Select PPO 5000/30%/6250 Plus Your Network: Select PPO
 Your Plan: Anthem Bronze Select PPO 5000/30%/6250 Plus Your Network: Select PPO This summary of benefits is a brief outline of coverage, designed to help you with the selection process. This summary does
THE ORIENTAL INSURANCE CO. LTD.
 GENERAL BENEFITS Entry Age Minimum Entry Age Maximum Cover Type OP Treatment at Hospitals OP Treatment at Clinics Eligibility & Combination DEPENDENT PARENTS Adult: 18 Years Child: 31 days Adult: Up to
Established Family Package
 Established Family Package Key Facts Sheet 01.04.2018 Established Family Package This is an affordable hospital and extras package which contributes towards expenses in private and public hospitals. Includes
Anthem Blue Cross of California Your Plan: Anthem Gold Select HMO 500/20%/6500 Your Network: Select HMO
 Anthem Blue Cross of California Your Plan: Anthem Gold Select HMO 500/20%/6500 Your Network: Select HMO This summary of benefits is a brief outline of coverage, designed to help you with the selection
5 easy ways to speed up the claims process
 Please return your completed claim form to: CignaTTK Health Insurance Company Limited OR Nearest Cigna TTK Branch. Corporate Office: 10th Floor, Commerz, International Business Park, Oberoi Garden City,
Your Plan: Anthem HealthKeepers Preferred DirectAccess gqqa Your Network: HealthKeepers Open Access
 Your Plan: Anthem HealthKeepers Preferred DirectAccess gqqa Your Network: HealthKeepers Open Access This summary of benefits is a brief outline of coverage, designed to help you with the selection process.
What is an HSA-qualified plan? How does it work? Features and rates
 HSA-QUALIFIED Deductible hmo PlanS What is an HSA-qualified plan? How does it work? Features and rates QUESTIONS? Call US. We Have Answers. HSA-QUALIFIED DEDUCTIBLE HMO PLANS Are you interested in balancing
Your Plan: Anthem Gold Select PPO 1000/20%/4000 Plus Your Network: Select PPO
 Your Plan: Anthem Gold Select PPO 1000/20%/4000 Plus Your Network: Select PPO This summary of benefits is a brief outline of coverage, designed to help you with the selection process. This summary does
Your Plan: Anthem Gold Select HMO 35/25%/6600 Your Network: Select HMO
 Your Plan: Anthem Gold Select HMO 35/25%/6600 Your Network: Select HMO This summary of benefits is a brief outline of coverage, designed to help you with the selection process. This summary does not reflect
Service Participating Providers: Non-participating Providers:
 Bend Chamber of Commerce Provider Network: SmartChoice Medical Benefit Summary SmartChoice HSA 3000_50+Rx S2 Annual Deductible Per Person, Per Calendar Year Per Family, Per Calendar Year Participating
Anthem Blue Cross of California Your Plan: Anthem Gold HMO 40/20%/6500 Your Network: California Care HMO
 Anthem Blue Cross of California Your Plan: Anthem Gold HMO 40/20%/6500 Your Network: California Care HMO This summary of benefits is a brief outline of coverage, designed to help you with the selection
5 easy ways to speed up the claims process
 Please return your completed claim form to: CignaTTK Health Insurance Company Limited OR Nearest Cigna TTK Branch. Corporate Office: 401/402, Raheja Titanium, Western Express Highway, Goregaon (East),
International Healthcare Comparison Plans Expat Standard, Comfort & Premium Plan 2013
 Epat Standard, Comfort & Premium Plan 2013 Epat Standard, Comfort & Premium Plan 2013 Maimum Lifetime Plan Benefit $USD $400,000,000,000,000,000 Annual Maimum Plan Benefit $USD $400,000,000,000 $2,000,000
September 2013
 September 2013 Copyright 2013 Health Care Cost Institute Inc. Unless explicitly noted, the content of this report is licensed under a Creative Commons Attribution Non-Commercial No Derivatives 3.0 License
Anthem Blue Cross and Blue Shield Your Plan: Anthem Gold PPO 2000/20%/4000 Your Network: PPO
 Anthem Blue Cross and Blue Shield Your Plan: Anthem Gold PPO 2000/20%/4000 Your Network: PPO This summary of benefits is a brief outline of coverage, designed to help you with the selection process. This
Saskatchewan Ministry of the Economy
 Saskatchewan Ministry of the Economy June 2014 SASKATCHEWAN WAGE SURVEY 2013 - HEALTH CARE AND SOCIAL ASSISTANCE INDUSTRY DETALED REPORT SASKATCHEWAN WAGE SURVEY 2013: HEALTH CARE AND SOCIAL ASSISTANCE
Paul Mueller Company Employee Health Benefit Plan
 Paul Mueller Company Employee Health Benefit Plan Group No.: 15753 Summary Plan Description for Medical, Dental, Prescription Drug and EAP Benefits Effective: January 1, 2017 P.O. Box 27267 Minneapolis,
REPORT OF THE COUNCIL ON MEDICAL SERVICE
 REPORT OF THE COUNCIL ON MEDICAL SERVICE CMS Report -A- Subject: Presented by: Referred to: Essential Health Care Benefits (Resolution 0-A-0) William E. Kobler, MD, Chair Reference Committee A (Joseph
Your Plan: Anthem Bronze PPO 6000/35%/6600 Your Network: Prudent Buyer PPO
 Your Plan: Anthem Bronze PPO 6000/35%/6600 Your Network: Prudent Buyer PPO This summary of benefits is a brief outline of coverage, designed to help you with the selection process. This summary does not
HOSPITAL BENEFIT MAJOR MEDICAL
 Spectra Cyan HOSPITAL BENEFIT MAJOR MEDICAL CHRONIC MY SAVER SPECTRA CYAN IS BEST SUITED FOR: Young starter families Healthy members who value their day-to-day healthcare cover People who require adequate
Established Family Package. Key Facts Sheet
 Established Family Package Key Facts Sheet Established Family Package This is an affordable hospital and extras package which contributes towards expenses in private and public hospitals. Includes cover
Welcome and introduction Industry Drivers Scheme strategy Benefit Changes for 2009 Product summary Managed Care Initiatives.
 Member Training Welcome and introduction Industry Drivers Scheme strategy Benefit Changes for 2009 Product summary Managed Care Initiatives Agenda Industry Drivers Legislation Medical Schemes Amendment
Building Actuarial Cost Models from Health Care Claims Data for Strategic Decision-Making. Introduction. William Bednar, FSA, FCA, MAAA
 Building Actuarial Cost Models from Health Care Claims Data for Strategic Decision-Making William Bednar, FSA, FCA, MAAA Introduction Health care spending across the country generates billions of claim
Surgery required as the result of Morbid Obesity* INDIVIDUAL CALENDAR YEAR MAXIMUMS Acupuncture $2,000 Chiropractic Care $2,000
 AMHIC, A Reciprocal Association Qualified High Deductible Health Plan Effective January 1, 2018 Important Note: Do not rely on this chart alone. It is only a summary. The contents of this summary are subject
Signature Health Plan Option: Elite
 All benefits are subject to Usual, Customary and Reasonable (UCR) fees. The benefits, coverage and exclusions listed herein are only a summary, and are subject to the specific terms and conditions of the