ACOSS Paper Australian Community Sector Survey
|
|
|
- Eleanor Simmons
- 5 years ago
- Views:
Transcription
1 ACOSS Paper Australian Community Sector Survey Report 2010 Volume 1 National
2 First published in 2010 by the Australian Council of Social Service Locked Bag 4777 Strawberry Hills, NSW, 2012 Australia Ph Fax Website: ISSN: ISBN: Australian Council of Social Service, This publication is copyright. Apart from fair dealing for the purpose of private study, research, criticism, or review, as permitted under the Copyright Act, no part may be reproduced by any process without written permission. Enquiries should be addressed to the Publications Officer, Australian Council of Social Service. Copies are available from the address above.
3 Table of Contents Executive Summary... 1 Key findings 2 Delivery 6 Methodology 7 National
4 Executive Summary The Australian Community Sector Survey 2010 Report (ACSS) presents the findings of the Australian Community Sector Survey conducted in November and December of The report provides information on service provision, income, expenditure, and operational, policy, and workforce issues for the community services and welfare sector. The ACSS is the only annual national survey collecting data about the non government, non profit community services and welfare sector. This sector is a major provider of the community services that most of us rely on at some point in our lives, but which are particularly important to people on low incomes. The ACSS 2010 was completed by 582 agencies which provided information about their activities over the financial year , and, in some questions, with reference to the financial year No comparisons are made between the current survey and previous years surveys. Any reference to the financial year is based on information provided in the survey. Respondents to the ACSS provided data on their provision of the following services: Child welfare, child services, and day care (e.g. adoption services, child development centres, foster care, infant and child care centres) Disability services (e.g. transport facilities, recreation and other specialised services, excluding residential services) Domestic violence and sexual assault (e.g. shelters and services) Emergency & disaster relief (e.g. education, prevention, and control) Employment/training services (e.g. training programs, vocational counselling and guidance) Family services (e.g. family life/parent education, single parent agencies and services) Financial and material support (e.g. cash and other forms of direct services; provision of food, clothing, transport and other assistance) Health services (e.g. mental health and crisis intervention, public health and wellness education, rehabilitation, emergency, drug and alcohol services) Housing/homelessness services (e.g. crisis, short and long term accommodation) Information, advice and personal social services (e.g. telephone advice, support groups, personal, counselling and credit counselling/money management services) Legal services & advocacy (e.g. community legal centres, advocacy organisations promoting the interests of specific groups, civil and human rights, rehabilitation of offenders, victim support, and consumer protection) 1
5 Migrant and refugee assistance (e.g. provision of food, clothing, shelter and services to refugees and immigrants) Residential aged care & nursing homes (e.g. inpatient care, primary health care; residential care for the elderly and nursing homes for the severely disabled) Services for the elderly (e.g. home services, transport facilities, recreation, meal programs and other services) Youth service and youth welfare services (e.g. youth centres, specific recreation, family planning, training and employment and counselling services for youth) Other services Individual reports detailing data at the state/territory level are also available. 2
6 Overview of July 2008 June 2009 The period between July 2008 and June 2009 saw the first impacts of the global financial crisis. In February of 2009 the Federal Labor Government's $42 billion economic stimulus package was passed in the Senate. Cash payments were made to eligible Australians, including people earning less than $100,000 per year, and the recipients of some social security payments. Unemployed people were a notable exception to these stimulus payments. In March of 2009, the Australian Bureau of Statistics released figures indicating that the economy had shrunk by 0.5%, its first quarter of negative growth in eight years 1. By June of 2009, however, many commentators were declaring that a technical recession, defined as two consecutive quarters of economic contraction, had been avoided 2. In the March quarter the economy had grown by 0.4 per cent 3. Australia's favourable trade position and household consumption were considered to be the drivers of this growth. Relative to other countries, Australia had avoided the worst impacts of the global recession. While figures did not rise as drastically as had been anticipated, by June 2009 the unemployment rate had increased to 5.8%. This was an increase of 39% in a year, and the highest rate in more than five years. Aggregate figures about economic performance and employment rates can obscure the more complex impacts of the downturn. Those people already poorly positioned in the labour market during economically prosperous times face further barriers as the pool of jobs shrinks and the number of newly unemployed people increases. In previous economic downturns long term unemployment has risen quickly, but taken many years to return to its pre downturn level. Between June 2008 and June 2009, the total number of Newstart Allowance and Youth Allowance (other) recipients increased 28.4% from 492,868 to 632, Adverse labour market conditions can also prompt an increase in claims for disability benefits as job seekers become discouraged or as long term unemployment affects their health. The total number of Disability Support Pension recipients increased by 3.4% from 732,367 June 2008 to 757,118 in June This figure was 17,118 above the estimated increase for the same period. During 2009, the Federal Government signalled its commitment to a number of important reforms and improvements to services directed at improving the lives of Australians on low incomes. These included a review of health and hospital services, with potential areas of focus including primary and oral healthcare and services for Indigenous Australians. 1 Australian Bureau of Statistics (2009) Australian National Accounts: National Income, Expenditure and Product, Dec Murdoch, S (2009) Australia avoids recession as GDP grows in first quarter The Australian 3 June Australian Bureau of Statistics (2009) Australian National Accounts: National Income, Expenditure and Product, Mar Department of Education, Employment and Workplace Relations (2009) Labour Market and Related Payments: a monthly profile, June Department of Families, Housing, Community Services and Indigenous Affairs (2009) FaHCSIA Annual Report
7 The Pension Review report conducted by Department of Families and Housing, Community Services and Indigenous Affairs Secretary Dr Jeff Harmer was completed in February The Review signaled major areas of need including affordable housing and pension increases. The Federal Budget delivered in some of these areas, with the treasurer announcing increases to the real rates of pension payments. While these were important improvements in payment rates, they were not uniform: the Parenting Payment Single pension and the Newstart Allowance were excluded from these payment increases. ABS figures suggest that Australia is experiencing a shortage of an estimated 251,000 affordable dwellings for low income Australians 6. Over the decade from 1995 to 2006, Australia experienced a decline in public housing stock of approximately 25,000 dwellings, offset only in part by some increase in community housing 7. This has led to lengthy, though tightly targeted, public housing waiting lists (at approximately 180,000 people) 8. The 2006 Census figures recorded 105,000 Australians homeless on any given night 9. Substantial additional investment has been directed to affordable housing programs under the Nation Building Stimulus Plan ($6.4 billion) and the National Affordable Housing Agreement ($400 million). The implementation of a number of new housing programs has progressed including the National Rental Affordability Scheme, the Homelessness White Paper and the Housing Affordability Fund. The Government has made some ambitious commitments to reduce homelessness and offer accommodation to all rough sleepers by 2020 in its Homelessness White Paper, The Road Home. This has been supported by funding of $800 million over 5 years. Continued investment in housing stock, as well as ongoing operational funding to provide support to tenants, will be a crucial factor in achieving the Commonwealth s goals around reducing homelessness, its efforts to alleviate the housing stress that affects more than a million low income Australians and its reform agenda to develop a more diverse social housing sector in which there is greater transparency and contestability. The Government itself has noted that the anticipated increase in public and community housing from the stimulus package is about half of what is needed in order to meet the 2020 homelessness targets. 10 Key findings Demand for services In respondent organisations provided services on 4.3 million occasions, a 4% increase on the 4.1 million instances of service provision in National Housing Supply Council (2009) State of Supply report, p vxii and Australian Institute of Health and Welfare, Australia s Welfare 2007, at Australian Institute of Health and Welfare, Public Rental Housing : Commonwealth State Housing Agreement national data report 9 Australian Bureau of Statistics, Counting the Homeless Prime Minister, House of Representatives Hansard, Tuesday 3 February, pg
8 In respondent agencies turned away people who were eligible for their services on 263,992 occasions. This is the equivalent of people being turned away on one in 16 occasions. Of people turned away, 44% were seeking youth and youth welfare services, and 35% were seeking financial and material support. When asked if their organisation was able to meet demand for services, 57% of respondents disagreed. Housing and homelessness supports and financial and material support were identified as the additional services and supports most needed by the clients of community service and welfare agencies. The survey confirms the particular importance of community and welfare services to low income and disadvantaged groups. Single parents are nearly 12 times more likely to access community services than their representation in the community would suggest. Indigenous people are 6.5 times more likely to access community and welfare services than their representation in the general community would suggest. Recipients of all kinds of social security payments are overrepresented as service users. This survey collects data from the financial year, and begins to illustrate the effects of the global financial crisis. With organisations already reporting stretched resources and increasingly unmet demand for services, increased unemployment alone is likely to see organisations capacity to meet this demand significantly compromised. 5
9 Delivery Workforce In respondent organisations employed 15,908 Full Time Equivalent (FTE) paid staff, and engaged 8,905 volunteers (FTE). There was a net increase of 1290 Full Time Equivalent (FTE) employees working in respondent organisations during This represents an increase of 8% on the total number of paid staff. Seventy one percent of respondent agencies indicated that salaries made attracting and retaining staff more difficult. Income and expenditure Matching resources to demand remains the fundamental challenge facing sector organisations. Eighty per cent of respondents disagreed with the statement that Government funding covers the true cost of delivering contracted services. Only 11% expressed the view that funding was adequate, and 9% neither agreed nor disagreed. 6
10 Methodology This survey examines changes in the operating environment of community services and welfare organisations between and , as well as gathering information about the size and type of services in the community services and welfare sector. No comparisons are made between surveys from different years. 11 Member organisations in the Council of Social Service network were ed information about the survey, and a link to a website where they could complete it. Organisations were also asked to forward the information to other eligible organisations. Reminders about the survey closing date were sent out by ACOSS and the state/territory Councils. State and Territory Councils contacted member organisations to encourage them to complete the survey. The ACSS 2010 was completed by 582 organisations that provided information about their activities over the financial years and The year on year comparisons in this report refer only to the information collected from this survey. As all questions in the survey are voluntary, not all organisations completed every question. Therefore some questions have a lower response rate than others. It should be noted that figures may not always add to totals due to rounding. Table 1.1: Survey returns by State/Territory State/Territory Number of responses Percentage of total respondents Australian Capital Territory 37 6% New South Wales % Northern Territory 33 6% Queensland % South Australia 38 7% Tasmania 28 5% Victoria % Western Australia 57 10% TOTAL 582 Where possible and relevant, data was analysed with reference to State/Territory, location, and size of the respondent organisation. Respondent organisations that completed Question 23 indicating the sources and amounts of organisational income between July 2008 and June 2009 were categorised as: very small, small, medium, large, and very 11 Respondents to the survey vary from year to year which makes direct comparisons with previous surveys of this kind misleading. 7
11 large organisations. The income ranges were selected so that approximately 20% of respondents fell into each category. Table 1.2: Organisational size Size category Income range (per year) Number of organisations Percentage Very small <$250, % Small Between $250,000 & $500, % Medium Between $500,000 & $1,000, % Large Between $1,000,000 & $3,500, % Very large >$3,500, % TOTAL 165 8
12 The survey population To place the ACSS in the context of other quantitative information which is available on parts of the sector, we compare the services and organisations covered by the ACSS with those covered by Not for profit Organisations, Australia, , 12 and Australia s Welfare The ACSS 2010 was completed by 582 agencies that provided information about their activities over the past two financial years, and Respondents to the ACSS were drawn from the membership of the State and Territory Councils of Social Service and ACOSS, and other organisations fitting the selection criteria. The 2010 ACSS uses different organisational categories from previous years surveys. These were amended to more closely align with the International Classification of Non Profit Organisations (ICNPO) recommended in the United Nations Handbook on Non Profit Institutions, and used by the Australian Bureau of Statistics. The categories of services provided are as follows: Child welfare, child services, and day care (e.g. adoption services, child development centres, foster care, infant and child care centres) Disability services (e.g. transport facilities, recreation and other specialised services, excluding residential services) Domestic violence and sexual assault (e.g. shelters and services) Emergency & disaster relief (e.g. education, prevention, and control) Employment/training services (e.g. training programs, vocational counselling and guidance) Family services (e.g. family life/parent education, single parent agencies and services) Financial and material support (e.g. cash and other forms of direct services; provision of food, clothing, transport and other assistance) Health services (e.g. mental health and crisis intervention, public health and wellness education, rehabilitation, emergency, drug and alcohol services) Housing/homelessness services (e.g. crisis, short and long term accommodation) Information, advice and personal social services (e.g. telephone advice, support groups, personal, counselling and credit counselling/money management services) Legal services & advocacy (e.g. community legal centres, advocacy organisations promoting the interests of specific groups, civil and human rights, rehabilitation of offenders, victim support, and consumer protection) Migrant and refugee assistance (e.g. provision of food, clothing, shelter and services to refugees and immigrants) 12 Australian Bureau of Statistics (ABS) (2008), Not-for-profit Organisations, Australia, , ABS Catalogue No Australian Institute of Health and Welfare, Australia s Welfare 2009, Canberra,
13 Residential aged care & nursing homes (e.g. inpatient care, primary health care; residential care for the elderly and nursing homes for the severely disabled) Services for the elderly (e.g. home services, transport facilities, recreation, meal programs and other services) Youth service and youth welfare services (e.g. youth centres, specific recreation, family planning, training and employment and counselling services for youth) Other services The respondents to the ACSS cover a wider field of services than those categorised under the Australian Institute of Health and Welfare National Classification of Community Services, as the ACSS includes employment, housing and health services, as well as the traditional community services such as aged care and child care. Size and scope of sector Although it is not possible to compare the results of the ACSS 2010 with other surveys because the surveyed populations and time frames are different, some information from Not for profit Organisations and Australia s Welfare 2007 is provided here as context for the results of the ACSS. Size of Sector At the end of June 2007, there were 5,804 not for profit social services organisations in Australia. 14 ABS data from 2001 indicates that while the number of Government organisations had remained virtually the same since June 1996, the number of for profit and not for profit organisations had increased by 32% and 10% respectively. 15 Expenditure The Australian Institute of Health and Welfare (AIHW) estimates that expenditure by Non Government Community Service Organisations (NGCSOs) in was $20 billion, with the government share of funding accounting for 62%, client sources accounting for 25% and NGCSOs own source funding accounting for 13%. 16 Workforce 14 ABS (2008) 15 Australian Bureau of Statistics (ABS) (2001), Community Services Australia, ABS Catalogue No AIHW (2007) Australia s Welfare 2007, p
14 In 2006 there were approximately 268,400 people employed (220,800 FTE) in community services industries in Australia, representing 2.6% of all employed persons across all industries. 17 This translates to 1,403 FTE community service workers per 100,000 population in Australia. 18 The number of persons employed in community services industries increased by 16% between 2001 and This compares with a 12% increase across all industries. 19 Employees in community services were predominantly female (87%). 17 Ibid at p Ibid at p Ibid at p
 in an inner metropolitan area (15%) or another metropolitan area (17%).")
15 National Survey results Demand Service coverage Organisations operating across a state or territory made up 18% of all respondents. A similar number of organisations operated in a regional centre (18%) in an inner metropolitan area (15%) or another metropolitan area (17%). Five per cent of organisations operated nationally, 11% in a rural centre, and 4% in a remote area. Figure 1.1 Service users As Table 1.3 shows, specific groups within the Australian population are over represented as users of community and welfare services. 12
16 Table 1.3: Service users by population group Population group as a percentage of the Australian population Population group as a percentage of service users Ratio of column one to column two Population group People with a disability 20% 20 29% 1.5 Indigenous 2.3% 21 15% 6.5 Jobless 34.5% 22 51% 1.5 Culturally and linguistically diverse background 21% 23 21% 1.0 Single parents 2.4% 24 28% 11.7 Women 50% 25 62% 1.2 Not Australian citizens 4.6% 26 8% 1.7 The overrepresentation of almost every population group listed in Table 1.3 is an indication of the importance of community and welfare services in the lives of low income and disadvantaged groups within the community. Single parents are 11.7 times more likely to use community and welfare services than their representation in the general community would suggest. Compared with other family types, single parent families are considered to be in greater need of support services in areas such as income, housing, employment, and social participation 27. Government pensions and allowances were the principal source of income for 61% of single parent families, the majority of which are headed by women (87%) 28. As the number of single parent households continues to increase, a greater number of children are likely to spend at least some of their childhood in a single parent household, and many parents will experience sole parenting. Indigenous people are 6.5 times more likely to use community and welfare services than their representation in the general community would suggest. The health and welfare outcomes for Indigenous Australians continue to be lower than that of non Indigenous Australians. For example, Indigenous Australians are more than twice as likely as non Indigenous Australians to need help with core daily activities because of disability 29. Aboriginal and Torres Strait Islander people are over represented in the homeless population, making up 9% of homeless people Australian Bureau of Statistics (ABS) (2003), Disability, Ageing and Carers, Australia: Summary of Findings, 2003, ABS Catalogue No Australian Bureau of Statistics (ABS) (2006),2006 Census of Population and Housing Australia, ABS Catalogue No This figure is derived from ABS, Labour Force, March Proportion of people who speak a language other than English at home, derived from the ABS Census Quick Stats Derived from Australian Bureau of Statistics (ABS) (2007) Australian Social Trends, 2007, ABS Catalogue No Australian Bureau of Statistics (ABS) (2006),2006 Census of Population and Housing Australia, ABS Catalogue No Derived from Australian Bureau of Statistics (ABS) (2006) Year Book Australia 2006, ABS Catalogue No Australian Bureau of Statistics (ABS) (2007) Australian Social Trends, 2007, ABS Catalogue No Ibid. 29 Australian Institute of Health and Welfare (AIHW) (2009) Australia s Welfare 2009, p Australian Bureau of Statistics (ABS) (2006) Counting the homeless 13
17 For many people accessing welfare and community services, social security payments are their primary source of income. Table 1.4 illustrates the average percentage of recipients of different allowances and pensions accessing services. Table 1.4: Service users income support recipients Percentage of recipients in the Australian Average percentage of Ratio of representation in population to service Payment type population 31 service users users Aged pension 10% 32 19% 2.0 Parenting payment (Single) 2% 33 26% 16.5 Carer payment (Adult & 2% 34 7% Child) 3.5 Newstart allowance 3% 35 19% 7.7 Youth allowance 2% 36 14% 8.6 Other pension 37 4% 38 29% 8.1 Other allowance % 40 11% 31.9 As in Table 1.2, single parents are significantly overrepresented as services users. The other pension category includes the Disability Support Pension. As recipients of every social security payment listed are overrepresented, the importance of welfare and community services to low income people is again emphasised. Other services and supports Survey respondents were asked to identify which services or supports (other than those delivered by their organisation) people accessing their services needed but did not have adequate access to. Housing and homelessness supports and financial and material support were identified as being a high or medium unmet need by 73% of respondents. Health services (70%) and information, advice and personal social services (68%) were also identified as being high or medium unmet need. Figure 1.2: Services or supports people accessing community and welfare services need but do not currently have adequate access to high and medium need 31 Data from June Department of Families, Housing, Community Services and Indigenous Affairs (2009) FaHCSIA Annual Report Department of Work, Education, Employment and Workplace relations (DEEWR) (2009) DEEWR Annual Report Department of Families, Housing, Community Services and Indigenous Affairs (2009) FaHCSIA Annual Report Department of Work, Education, Employment and Workplace relations (DEEWR) (2009) DEEWR Annual Report Ibid 37 (including the Disability Support Pension, Double Orphan Pension, Widow B Pension, Wife Pension (Age),and the Wife Pension (Disability Support Pension)) 38 Department of Families, Housing, Community Services and Indigenous Affairs (2009) FaHCSIA Annual Report (including the Widow, Partner, Mobility Allowance, and Sickness allowances) 40 Ibid 14
18 Demand for services In respondent organisations provided services on 4.3 million occasions, a 4% increase on the 4.1 million instances of service provision in Table 1.4: Service provision and Increase (%) Child welfare, child services, and day care 229, ,326 8% Disability services 1,597,927 1,595,931 0% Domestic violence and sexual assault 35,486 32,959 8% Emergency & disaster relief 5,676 5,527 3% Employment/training services 408, ,846 11% Family services 122, ,309 12% Financial and material support 181, ,607 4% Health services 209, ,542 11% Housing/homelessness services 102,833 91,094 13% Information, advice and personal social services 194, ,296 3% Legal services & advocacy 194, ,003 2% Migrant and refugee assistance 32,031 30,172 6% Residential aged care & nursing homes 5,599 5,967 6% Services for the elderly 456, ,270 4% Youth service and youth welfare services 520, ,827 4% 15
19 Other 77,092 61,135 26% TOTAL 4,374,912 4,193,811 4% In respondent agencies turned away people who were eligible for their services on 263,992 occasions. This is the equivalent of people being turned away on one in 16 occasions. Of people turned away, the greatest proportion were seeking youth and youth welfare services (44%), and 35% were seeking financial and material support. Financial and material support: the Hobart Benevolent Society The Hobart Benevolent Society provides services and support to low income and disadvantaged people in and around Hobart. The provision of financial and material support makes up a large percentage of their work. For example, the Hobart Benevolent Society provides food vouchers, help with bills like electricity and telephone, help with prescription payments, and some items like food, blankets, and bus tickets. In , the Hobart Benevolent Society faced increased demand, and had to turn away more people than ever before. Several factors contributed to this demand a very cold winter meant increased electricity bills, and increased demand for food. Housing costs, once relatively affordable, put further pressure on already tight budgets. The global financial crisis, responsible for increased unemployment, also impacted on housing costs as investors turned to the housing market as a safer alternative to the financial market. 16
20 Figure 1.3 Turn away rates: people turned away per hundred instances of service Aggregate turn away figures across all services declined 16% from the 313,822 times people were turned away by the same services in This decrease was driven primarily by the 40% decline in the number of people turned away from youth and youth welfare services. Many other services experienced significant increases in turn away rates. Youth Services: Boystown Boystown provides services to marginalised and disadvantaged children and young people across Australia. Their services include: an online and telephone counselling service; a range of work, vocational training and personal development programs that are integrated with jobs services to facilitate employment for young people disconnected from education and paid employment; domestic violence programs; and residential support programs for homeless families. While they were still not able to meet all the demand for their services, Boystown turned away fewer people in 2008/2009 than they did in 2007/2008 because they received additional funding to provide more services. This increased funding was timely, as Boystown saw an increase in the complexity of issues faced by young people accessing their services during this time. More young people seeking services had issues relating to mental health, self harm or suicidality. Eleven young people per day contact Boystown s Kids Helpline to discuss suicide. This increased complexity of issues impacted on service provision, and the skills required by staff. Staff required greater training, and interactions with young people accessing services in crisis needed to be more intensive. 17
21 Table 1.5 Turn away rates Number of times people were turned away Percentage as total turn away Number of times people were turned away Difference and % Child welfare, child services, and day care 4,166 3,510 19% Disability services 1, % Domestic violence and sexual assault % % Emergency & disaster relief % % Employment/training services % 679 7% Family services 2, % 2,887 23% Financial and material support 92, % 76,965 21% Health services 11, % % Housing/homelessness services 15, % 13,945 14% Information, advice and personal social services 2, % 2,333 24% Legal services & advocacy 12, % 13,386 5% Migrant and refugee assistance % % Residential aged care & nursing homes % % Services for the elderly 1, % 1,363 39% Youth service and youth welfare services 115, % 193,275 40% Other % % TOTAL 263, % 313,822 16% When asked if their organisation was able to meet demand for services, 57% of respondents disagreed (40%) or strongly disagreed (17%). 18
22 Figure 1.4 Service targeting When demand for services outstrips the capacity to supply these services, many organisations will implement tighter targeting measures as a way of limiting this demand, and utilising constrained resources in the most equitable manner. Governmental policy, through funding and other arrangements, can also require that organisations target their services more narrowly. With more tightly targeted service delivery aimed at rationing finite resources, many organisations will target according to need, and therefore experience increased complexity in service user needs. This increased complexity can have a significant impact on staff and organisational capacity if appropriate resources (for example, adequate funding, available time, appropriately skilled staff) are not made available. Any change in service targeting is, therefore, an important gauge of both demand for services, and organisational resources relative to this demand. When asked if their organisation had targeted services more tightly than in the past, 56% of respondents agreed or strongly agreed. Figure
23 Organisations will often respond to increased demand and service delivery pressures by increasing the hours that their staff work. When asked if staff and volunteers had been required to work fewer hours than in the past, 73% of organisations disagreed (48%) or strongly disagreed (25%). Figure 1.6 Delivery Character of the workforce 20
24 Paid staff In respondent organisations employed 15,908 paid staff (Full Time Equivalent), and engaged 8,905 volunteers (FTE). There were 1909 volunteer board/ management committee members, and 77 paid board members. It is noteworthy that organisations of all sizes are governed primarily by volunteer boards. Staff hiring and leaving Respondent organisations reported that there was a net increase of 1290 Full Time Equivalent (FTE) employees working in respondent organisations during This represents an increase of 8% on the total number of paid staff. Table 1.6: Staff hired and left Hired (FTE) Left (FTE) Difference (FTE) Administration Communications/ Media Finance Management Policy, research or advocacy Service delivery Other high skilled professional Other Total Staff turnover 21
25 Staff turnover is a function of the number of staff leaving over the number of staff employed. In , respondent agencies employed 5934 FTE staff and lost 4644 FTE staff. Average staff turnover across respondent agencies was therefore equivalent to 29%. Increasing workloads As noted earlier, in respondent agencies provided services to 4,374,912 people, which is an increase of 4% since Many respondent organisations reported increased service targeting (56%). The greatest percentage increase in staff across the sector was in service delivery (37%). Attracting and retaining staff Respondents were asked to indicate if a range of factors affected their organisation s ability to attract/ retain staff. Working hours and working conditions were the most frequently reported factors that helped attract or retain staff. Salaries were considered by 71% of organisations to make attracting/ retaining staff more difficult. 22

26 Figure 1.7: Factors affecting attracting and retaining staff Location While an average of 35% of respondents indicated that their organisation s location helped attract and retain staff, there was great variation in responses from organisations from different areas. None of the organisations operating in a remote area reported that their location had helped attract or retain staff, while 78% indicated that the organisation s location made attracting/retaining staff more difficult. The majority of organisations operating nationally indicated that their location was beneficial (54%) while 8% indicated that it made attracting and retaining staff more difficult. 23
27 Figure 1.8: location 24
28 Income and Expenditure Expenditure Organisations were asked to provide details of their expenditure. Salaries and wages constituted the majority of expenditure (54%) while administrative and operational costs made up nearly a quarter of expenditure (22%). Figure 1.9: Expenditure Income In total dollar amounts, all respondents received on average 29% of income from the Commonwealth government, 32% from a State or Territory government, and 19% from other sources (for example from investments or sale of assets) These are aggregate figures. The disaggregate figures contain considerable variance. 25

29 Figure 1.10: Sources of income The majority of respondent organisations reported that their primary source of funding was their State/Territory government (40%) or the Commonwealth government (23%). While most organisations reported that their funding was ongoing/recurrent, this varied by funding source, with Commonwealth funding most likely to be ongoing/recurrent, and corporate funding least likely to be ongoing/recurrent (36%). Table 1.7: Funding Sources Funding source Organisation s primary source of funding % Funding is ongoing/recurrent % Commonwealth Government 23% 72% State/Territory Government 40% 80% Local Government 6% 52% Client Fees 10% 68% Donations 10% 44% Corporate 3% 36% Other 8% 77% Indexation Organisations funding, even when ongoing or recurrent, is not always consistently or adequately indexed to meet the annually increasing costs of service provision. The Consumer Price Index (CPI) increased by 4.5% in the survey period 42. The Labour Price Index over the same period increased by 3.9% Australian Bureau of Statistics (ABS) Consumer Price Index, Australia, (ABS cat. no ) 43 Australian Bureau of Statistics (ABS) Labour Price Index, Australia, Jun 2009 (ABS cat. no ) 26
30 However, respondent organisations reported that Commonwealth government funding was indexed, on average, at 1.8%. State and territory government funding was indexed at 2.9%, and local government funding was indexed at 0.5%. Almost a quarter of organisations (24%) reported that they received no indexation on their government funding. Within these responses there was great variation, highlighting the inconsistent approach to indexing even between departments within the same government. Sector capacity issues & relationships with government A number of other factors affect the viability of community sector organisations including the adequacy of funding levels and the effect of government contractual requirements, and the tax status of organisations. These factors impact upon an organisation s ability to recruit and retain staff, to effectively deliver services and work with other organisations, and balance service delivery demands, advocacy and administrative requirements. Government funding and contractual requirements Eighty per cent of respondents disagreed with the statement that Government funding covers the true cost of delivering contracted services. Only 11% expressed the view that funding was adequate, and 9% neither agreed nor disagreed. Figure 1.11: Adequacy of government funding: proportion agree/disagree with statement: Government funding covers the true cost of delivering contracted services 27
31 As discussed above, 69% of organisations receive their primary source of funding from the Commonwealth, State/Territory, or Local Government. Twenty percent of respondents indicated that Federal funding is not ongoing or recurrent, 28% that State/Territory funding is not ongoing/recurrent, and 48% that Local government funding is not ongoing/recurrent. Many organisations are, therefore, subject to funding arrangements that do not guarantee recurrent or ongoing funding. This limits organisational capacity to plan adequately for the future, especially in terms of service provision and staffing. Sixty per cent of respondents agreed that our funding agreements did not allow us to plan adequately for our organisation s future. Figure 1.12: our funding agreements did not allow us to plan adequately for our organisation s future 28
32 Government funders have an obligation to ensure that services delivered by welfare and community organisations are of a high quality and are a cost effective use of public funds. Contractual requirements made of service providers can, however, risk stipulating a disproportionately onerous level of reporting, or undermine the innovative potential of organisations. These risks are compounded for organisations receiving funding from multiple sources. Fifty one percent of organisations agreed that contract requirements and red tape adversely affected organisations capacity to deliver services. Figure 1.13: Contract requirements and red tape adversely affected organisation s capacity to deliver services. 29
33 Medium sized organisations were the least likely to agree or strongly agree with this statement (39%) while small organisations were the most likely to agree or strongly agree (69%). Figure 1.13: Contract requirements and red tape adversely affected organisations capacity to deliver services (by organisational size). 30

34 Forty one percent of organisations disagreed that government contracts supported our organisation s capacity for innovation. Figure 1.14 government contracts supported our organisation s capacity for innovation. 31
35 While 36% of all respondents agreed or strongly agreed that Federal Government initiatives or policies affecting our organisation were mostly positive, there were notable differences in the way organisations of different sizes responded. 32
36 Figure 1.15 Federal Government initiatives or policies affecting our organisation were mostly positive While only 18% of small organisations reported that they agreed with this statement, 61% of very large organisations agreed or strongly agreed. 33
 Thirty one percent of organisations agreed or strongly agreed that State or")
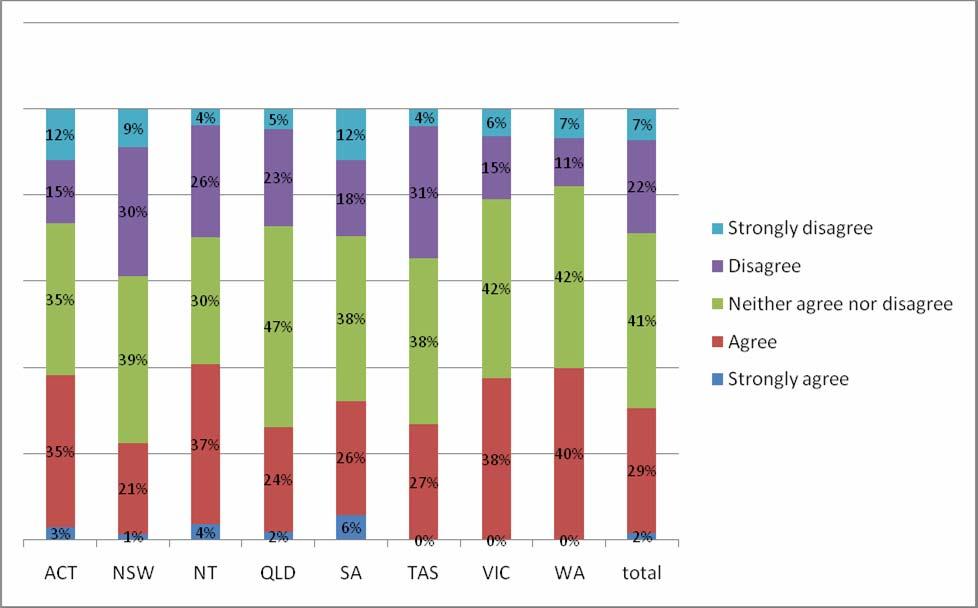
37 Figure 1.16 Federal Government initiatives or policies affecting our organisation were mostly positive (by organisational size) Thirty one percent of organisations agreed or strongly agreed that State or Territory government initiatives or policies affecting our organisation were mostly positive. Figure 1.17: State or Territory government initiatives or policies affecting our organisation were mostly positive. 34
38 Organisations from New South Wales were least likely to agree with this statement (22%), while organisations from the Northern Territory were most likely to agree or strongly agree (41%). Figure 1.18: State or Territory government initiatives or policies affecting our organisation were mostly positive (by 35
39 state/territory) 36
40 The advocacy role of community organisations A majority of respondents (73%) indicated that they were able to speak publicly about issues affecting their clients. Only 9% disagreed and another 17% neither agreed nor disagreed. Figure 1.19: Our organisation is able to speak publicly about the issues facing our clients 37
41 Tax Status The tax concessions available to community service organisations depend on the purposes and activities of specific organisations and how the Australian Taxation Office and State Government entities interpret the law governing charities and related organisations. Status as a Public Benevolent Institution (PBI) attracts particularly generous concessions, including exemptions from Fringe Benefits Tax (FBT). Status as a Deductible Gift Recipient (DGR) not only makes gifting to these organisations attractive but is a pre condition for funding by most philanthropic bodies. Survey respondents were asked to indicate if they were an Income Tax Exempt Charity (ITEC), Deductible Gift Recipient (DGR), Public Benevolent Institution (PBI) or any combination of these. The largest percentage of respondents indicated that they had ITEC, DGR and PBI status. Figure 1.20: Tax status 38
42 Proudly supported by Australian Council of Social Service (ACOSS) Level 2, 619 Elizabeth Street, Redfern NSW 2016 Locked Bag 4777, Strawberry Hills NSW 2012 Phone: Fax: info@acoss.org.au Internet: 39
43 ACOSS Paper Australian Community Sector Survey Report 2010 Volume 8 Australian Capital Territory
44 First published in 2010 by the Australian Council of Social Service Locked Bag 4777 Strawberry Hills, NSW, 2012 Australia Ph Fax Website: ISSN: ISBN: Australian Council of Social Service, This publication is copyright. Apart from fair dealing for the purpose of private study, research, criticism, or review, as permitted under the Copyright Act, no part may be reproduced by any process without written permission. Enquiries should be addressed to the Publications Officer, Australian Council of Social Service. Copies are available from the address above. 1
45 Australian Capital Territory Survey Results Demand Service coverage Organisations operating across the territory made up 56% of all respondents. Five percent of organisations operated in a regional centre, 22% in an inner metropolitan area, and 8% in another metropolitan area. Three per cent of organisations operated nationally, and 4% in a remote area. Figure 1.1 Service users As Table 1.1 shows, specific groups within the Australian population are over represented as users of community and welfare services. 1
46 Table 1.1: Service users by population group Population group as a percentage of the Australian population Population group as a percentage of service users Ratio of column one to column two Population group People with a disability 20% % 1.7 Indigenous 2.3% 2 4.3% 1.9 Jobless 34.5% % 1.4 Culturally and linguistically diverse background 21% 4 9.3% 0.4 Single parents 2.4% % 6.4 Women 50% % 1.2 Not Australian citizens 4.6% 7 2.7% 0.6 The overrepresentation of almost every population group listed in Table 1.1 is an indication of the importance of community and welfare services in the lives of low income and disadvantaged groups within the community. Single parents are 6.4 times more likely to use community and welfare services than their representation in the general community would suggest. Compared with other family types, single parent families are considered to be in greater need of support services in areas such as income, housing, employment, and social participation 8. Government pensions and allowances were the principal source of income for 61% of single parent families, the majority of which are headed by women (87%) 9. As the number of single parent households continues to increase, a greater number of children are likely to spend at least some of their childhood in a single parent household, and many parents will experience sole parenting. Indigenous people are 1.9 times more likely to use community and welfare services than their representation in the general community would suggest. The health and welfare outcomes for Indigenous Australians continue to be lower than that of non Indigenous Australians. For example, Indigenous Australians are more than twice as likely as non Indigenous Australians to need help with core daily activities because of disability 10. Aboriginal and Torres Strait Islander people are over represented in the homeless population, making up 9% of homeless people Australian Bureau of Statistics (ABS) (2003), Disability, Ageing and Carers, Australia: Summary of Findings, 2003, ABS Catalogue No Australian Bureau of Statistics (ABS) (2006),2006 Census of Population and Housing Australia, ABS Catalogue No This figure is derived from ABS, Labour Force, March Proportion of people who speak a language other than English at home, derived from the ABS Census Quick Stats Derived from Australian Bureau of Statistics (ABS) (2007) Australian Social Trends, 2007, ABS Catalogue No Australian Bureau of Statistics (ABS) (2006),2006 Census of Population and Housing Australia, ABS Catalogue No Derived from Australian Bureau of Statistics (ABS) (2006) Year Book Australia 2006, ABS Catalogue No Australian Bureau of Statistics (ABS) (2007) Australian Social Trends, 2007, ABS Catalogue No Ibid. 10 Australian Institute of Health and Welfare (AIHW) (2009) Australia s Welfare 2009, p Australian Bureau of Statistics (ABS) (2006) Counting the homeless 2
47 For many people accessing welfare and community services, social security payments are their primary source of income. Table 1.2 illustrates the average percentage of recipients of different allowances and pensions accessing services. Table 1.2: Service users income support recipients Percentage of recipients in the Australian Average percentage of Ratio of representation in population to service Payment type population 12 service users users Aged pension 10% % 1.9 Parenting payment (Single) 2% % 7.1 Carer payment (Adult & 2% 15 Child) 1.0% 0.5 Newstart allowance 3% % 4.6 Youth allowance 2% % 16.1 Other pension 18 4% % 11.1 Other allowance % % 0.0 As in Table 1.1, single parents are significantly overrepresented as services users. The other pension category includes the Disability Support Pension. As recipients of every social security payment listed are overrepresented, the importance of welfare and community services to low income people is again emphasised. Other services and supports Survey respondents were asked to identify which services or supports (other than those delivered by their organisation) people accessing their services needed but did not have adequate access to. Youth service and youth welfare services were identified as being a high or medium unmet need by 83% of respondents. Housing and homelessness services (78%) and Health services (80%) were also identified as being high or medium unmet need. Figure 1.2: Services or supports people accessing community and welfare services need but do not currently have adequate access to high and medium need 12 Data from June Department of Families, Housing, Community Services and Indigenous Affairs (2009) FaHCSIA Annual Report Department of Work, Education, Employment and Workplace relations (DEEWR) (2009) DEEWR Annual Report Department of Families, Housing, Community Services and Indigenous Affairs (2009) FaHCSIA Annual Report Department of Work, Education, Employment and Workplace relations (DEEWR) (2009) DEEWR Annual Report Ibid 18 (including the Disability Support Pension, Double Orphan Pension, Widow B Pension, Wife Pension (Age),and the Wife Pension (Disability Support Pension)) 19 Department of Families, Housing, Community Services and Indigenous Affairs (2009) FaHCSIA Annual Report (including the Widow, Partner, Mobility Allowance, and Sickness allowances) 21 Ibid 3
48 Demand for services In respondent organisations provided services on 57,334 million occasions, a 12% increase on the 51,327 instances of service provision in It should be noted that due to relatively small sample size, the figures in the two tables below are likely to underestimate service provision and turn away rates across the community and welfare services. Percentages should be interpreted with caution. Table 1.2: Service provision and Increase (%) Child welfare, child services, and day care % Disability services 25,021 24,893 1% Domestic violence and sexual assault 1, % Emergency & disaster relief % Employment/training services 1,262 1,262 0% Family services % Financial and material support 2,539 2,081 22% Health services % Housing/homelessness services 3,323 2,982 11% Information, advice and personal social services 13,529 11,634 16% Legal services & advocacy 8,027 6,007 34% Migrant and refugee assistance % Residential aged care & nursing homes 5 5 0% Services for the elderly % Youth service and youth welfare services % Other % TOTAL 57,334 51,327 12% In respondent agencies turned away people who were eligible for their services on 3,382 occasions. This is the equivalent of one in ten people being turned away. Of people turned away, 53% were seeking child welfare, child services, and day care. 4
49 Aggregate turn away figures across all services increased 8% from the 3,122 times people were turned away by the same services in Table 1.3 Turn away rates Number of times people were turned away Percentage as total turn away Number of times people were turned away Difference and % Child welfare, child services, and day care 1,800 53% 1,600 13% Disability services 50 1% 30 67% Domestic violence and sexual assault 100 3% 100 0% Emergency & disaster relief 200 6% 200 0% Employment/training services Family services 20 1% 20 0% Financial and material support 150 4% 90 67% Health services 48 1% 62 23% Housing/homelessness services 164 5% 170 4% Information, advice and personal social services Legal services & advocacy Migrant and refugee assistance Residential aged care & nursing homes Services for the elderly % 850 0% Youth service and youth welfare services Other TOTAL 3, % 3,122 8% When asked if their organisation was able to meet demand for services, 53% of respondents disagreed (35%) or strongly disagreed (18%). 5
50 Figure 1.3 Service targeting When demand for services outstrips the capacity to supply these services, many organisations will implement tighter targeting measures as a way of limiting this demand, and utilising constrained resources in the most equitable manner. Governmental policy, through funding and other arrangements, can also require that organisations target their services more narrowly. With more tightly targeted service delivery aimed at rationing finite resources, many organisations will target according to need, and therefore experience increased complexity in service user needs. This increased complexity can have a significant impact on staff and organisational capacity if appropriate resources (for example adequate funding, available time, appropriately skilled staff) are not made available. Any change in service targeting is, therefore, an important gauge of both demand for services, and organisational resources relative to this demand. When asked if their organisation had targeted services more tightly than in the past, 38% of respondents agreed (32%) or strongly agreed (6%). 6
51 Figure 1.4 Organisations will often respond to increased demand and service delivery pressures by increasing the hours that their staff work. When asked if staff and volunteers had been required to work fewer hours than in the past, 82% of organisations disagreed (50%) or strongly disagreed (32%). Figure 1.5 7
52 Delivery Character of the workforce Paid staff In respondent organisations employed 1,142 paid staff (Full Time Equivalent), and engaged 956 volunteers (FTE). There were 143 volunteer board/ management committee members, and no paid board members. It is noteworthy that organisations of all sizes are governed primarily by volunteer boards. Staff hiring and leaving Respondent organisations reported that there was a net increase of 185 Full Time Equivalent (FTE) employees working in respondent organisations during This represents an increase of 16% on the total number of paid staff. Table 1.4: Staff hired and left Hired (FTE) Left (FTE) Difference (FTE) Administration Communications/ Media Finance Management Policy, research or advocacy Service delivery Other high skilled professional Other Total

53 Staff turnover Average staff turnover across respondent agencies was equivalent to 21%. Attracting and retaining staff Respondents were asked to indicate if a range of factors affected their organisation s ability to attract/ retain staff. Working hours and working conditions were the most frequently reported factors that helped attract or retain staff. Salaries were considered by 62% of organisations to make attracting/ retaining staff more difficult. Figure 1.6: Factors affecting attracting and retaining staff 9
54 Income and Expenditure Expenditure Organisations were asked to provide details of their expenditure. Salaries and wages constituted the majority of expenditure (70%) while administration and operational costs made up nearly a fifth of expenditure (19%). Figure 1.7: Expenditure Income In total dollar amounts, all respondents received on average 26% of income from the Commonwealth government, 47% from the State government, and 12% from other sources (for example from investments or sale of assets) These are aggregate figures. The disaggregate figures contain considerable variance. 10
55 Figure 1.8: Sources of income The majority of respondent organisations reported that their primary source of funding was from the State government (44%) or the Commonwealth government (28%). Table 1.5: Funding Sources Funding source Organisation s primary source of funding % Funding is ongoing/recurrent % Commonwealth Government 28% 60% State Government 44% 88% Local Government 0% Client Fees 11% Donations 17% Corporate 0% Other 0% Indexation Organisations funding, even when ongoing or recurrent, is not always consistently or adequately indexed to meet the annually increasing costs of service provision. The Consumer Price Index (CPI) increased by 4.5% in the survey period 23. The Labour Price Index over the same period increased by 3.9% 24. However, respondent organisations reported that Commonwealth government funding was indexed, on average, at 2.1%. State government funding was indexed at 3.2%, and local government funding was indexed at 1.2%. Ten percent of respondents reported that they received no indexation on their government funding. 23 Australian Bureau of Statistics (ABS) Consumer Price Index, Australia, (ABS cat. no ) 24 Australian Bureau of Statistics (ABS) Labour Price Index, Australia, Jun 2009 (ABS cat. no ) 11
56 Within these responses there was great variation, highlighting the inconsistent approach to indexing even between departments within the same government. Sector capacity issues & relationships with government A number of other factors affect the viability of community sector organisations including the adequacy of funding levels and the effect of government contractual requirements, and the tax status of organisations. These factors impact upon an organisation s ability to recruit and retain staff, to effectively deliver services and work with other organisations, and balance service delivery demands, advocacy and administrative requirements. Government funding and contractual requirements Sixt six per cent of respondents disagreed with the statement that Government funding covers the true cost of delivering contracted services. Only 24% expressed the view that funding was adequate, and 9% neither agreed nor disagreed. Figure 1.9: Adequacy of government funding: proportion agree/disagree with statement: Government funding covers the true cost of delivering contracted services Many organisations are subject to funding arrangements that do not guarantee recurrent or ongoing funding. This limits organisational capacity to plan adequately for the future, especially in terms of service provision and staffing. Forty six per cent of respondents agreed that our funding agreements did not allow us to plan adequately for our organisation s future. Figure 1.10: our funding agreements did not allow us to plan adequately for our organisation s future 12
57 Government funders have an obligation to ensure that services delivered by welfare and community organisations are a high quality and cost effective use of public funds. Contractual requirements made of service providers can, however, risk stipulating a disproportionately onerous level of reporting, or undermine the innovative potential of organisations. These risks are compounded for organisations receiving funding from multiple sources. Fifty onepercent of organisations agreed that contract requirements and red tape adversely affected organisations capacity to deliver services. 13
58 Figure 1.11: Contract requirements and red tape adversely affected organisation s capacity to deliver services. Forty seven percent of organisations disagreed that government contracts supported our organisation s capacity for innovation. Figure 1.12 government contracts supported our organisation s capacity for innovation. Thirty eight of all respondents agreed or strongly agreed that Federal Government initiatives or policies affecting our organisation were mostly positive. 14
59 Figure 1.13 Federal Government initiatives or policies affecting our organisation were mostly positive Twenty seven percent of organisations disagreed or strongly disagreed that State or Territory government initiatives or policies affecting our organisation were mostly positive. Figure 1.14: State or Territory government initiatives or policies affecting our organisation were mostly positive. Organisations from New South Wales were least likely to agree with this statement (22%), while organisations from the Northern Territory were most likely to agree or strongly agree (41%). 15
60 Figure 1.15: State or Territory government initiatives or policies affecting our organisation were mostly positive (by state/territory) The advocacy role of community organisations A majority of respondents (82%) indicated that they were able to speak publicly about issues affecting their clients. Only 9% disagreed and another 9% neither agreed nor disagreed. Figure 1.16: Our organisation is able to speak publicly about the issues facing our clients 16
61 Tax Status The tax concessions available to community service organisations depend on the purposes and activities of specific organisations and how the Australian Taxation Office and State Government entities interpret the law governing charities and related organisations. Status as a Public Benevolent Institution (PBI) attracts particularly generous concessions, including exemptions from Fringe Benefits Tax (FBT). Status as a Deductible Gift Recipient (DGR) not only makes gifting to these organisations attractive but is a pre condition for funding by most philanthropic bodies. Nationally, survey respondents were asked to indicate if they were an Income Tax Exempt Charity (ITEC), Deductible Gift Recipient (DGR), Public Benevolent Institution (PBI) or any combination of these. The largest percentage of respondents indicated that they had ITEC, DGR and PBI status. Figure 1.17: Tax status (nationally) 17
62 Proudly supported by Australian Council of Social Service (ACOSS) Level 2, 619 Elizabeth Street, Redfern NSW 2016 Locked Bag 4777, Strawberry Hills NSW 2012 Phone: Fax: info@acoss.org.au Internet: 18
63 ACOSS Paper Australian Community Sector Survey Report 2010 Volume 2 New South Wales
64 First published in 2010 by the Australian Council of Social Service Locked Bag 4777 Strawberry Hills, NSW, 2012 Australia Ph Fax Website: ISSN: ISBN: X Australian Council of Social Service, This publication is copyright. Apart from fair dealing for the purpose of private study, research, criticism, or review, as permitted under the Copyright Act, no part may be reproduced by any process without written permission. Enquiries should be addressed to the Publications Officer, Australian Council of Social Service. Copies are available from the address above. 1
65 New South Wales Survey Results Demand Service coverage Organisations operating across the state made up 11% of all respondents. Twenty four percent of organisations operated in a regional centre, 11% in an inner metropolitan area, and 24% in another metropolitan area. Five per cent of organisations operated nationally, 11% in a rural centre, and 4% in a remote area. Figure 1.1 Service users As Table 1.1 shows, specific groups within the Australian population are over represented as users of community and welfare services. 1
66 Table 1.1: Service users by population group Population group as a percentage of the Australian population Population group as a percentage of service users Ratio of column one to column two Population group People with a disability 20% 1 23% 1.2 Indigenous 2.3% 2 8% 3.5 Jobless 34.5% 3 52% 1.5 Culturally and linguistically diverse background 21% 4 18% 0.9 Single parents 2.4% 5 29% 12.1 Women 50% 6 61% 1.2 Not Australian citizens 4.6% 7 12% 2.6 The overrepresentation of almost every population group listed in Table 1.1 is an indication of the importance of community and welfare services in the lives of low income and disadvantaged groups within the community. Single parents are 12.1 times more likely to use community and welfare services than their representation in the general community would suggest. Compared with other family types, single parent families are considered to be in greater need of support services in areas such as income, housing, employment, and social participation 8. Government pensions and allowances were the principal source of income for 61% of single parent families, the majority of which are headed by women (87%) 9. As the number of single parent households continues to increase, a greater number of children are likely to spend at least some of their childhood in a single parent household, and many parents will experience sole parenting. Indigenous people are 3.5 times more likely to use community and welfare services than their representation in the general community would suggest. The health and welfare outcomes for Indigenous Australians continue to be lower than that of non Indigenous Australians. For example, Indigenous Australians are more than twice as likely as non Indigenous Australians to need help with core daily activities because of disability 10. Aboriginal and Torres Strait Islander people are over represented in the homeless population, making up 9% of homeless people Australian Bureau of Statistics (ABS) (2003), Disability, Ageing and Carers, Australia: Summary of Findings, 2003, ABS Catalogue No Australian Bureau of Statistics (ABS) (2006),2006 Census of Population and Housing Australia, ABS Catalogue No This figure is derived from ABS, Labour Force, March Proportion of people who speak a language other than English at home, derived from the ABS Census Quick Stats Derived from Australian Bureau of Statistics (ABS) (2007) Australian Social Trends, 2007, ABS Catalogue No Australian Bureau of Statistics (ABS) (2006),2006 Census of Population and Housing Australia, ABS Catalogue No Derived from Australian Bureau of Statistics (ABS) (2006) Year Book Australia 2006, ABS Catalogue No Australian Bureau of Statistics (ABS) (2007) Australian Social Trends, 2007, ABS Catalogue No Ibid. 10 Australian Institute of Health and Welfare (AIHW) (2009) Australia s Welfare 2009, p Australian Bureau of Statistics (ABS) (2006) Counting the homeless 2
67 For many people accessing welfare and community services, social security payments are their primary source of income. Table 1.2 illustrates the average percentage of recipients of different allowances and pensions accessing services. Table 1.2: Service users income support recipients Percentage of recipients in the Australian Average percentage of Ratio of representation in population to service Payment type population 12 service users users Aged pension 10% 13 19% 1.9 Parenting payment (Single) 2% 14 26% 13.0 Carer payment (Adult & 2% 15 Child) 7% 3.5 Newstart allowance 3% 16 19% 6.3 Youth allowance 2% 17 14% 7.0 Other pension 18 4% 19 29% 7.3 Other allowance % 21 11% 36.7 As in Table 1.1, single parents are significantly overrepresented as services users. The other pension category includes the Disability Support Pension. As recipients of every social security payment listed are overrepresented, the importance of welfare and community services to low income people is again emphasised. Other services and supports Survey respondents were asked to identify which services or supports (other than those delivered by their organisation) people accessing their services needed but did not have adequate access to. Housing and homelessness supports and financial and material support were identified as being a high or medium unmet need by 76% and 78% of respondents respectively. Information, advice and personal social services (68%) and Health services (70%) were also identified as being high or medium unmet need. Figure 1.2: Services or supports people accessing community and welfare services need but do not currently have adequate access to high and medium need 12 Data from June Department of Families, Housing, Community Services and Indigenous Affairs (2009) FaHCSIA Annual Report Department of Work, Education, Employment and Workplace relations (DEEWR) (2009) DEEWR Annual Report Department of Families, Housing, Community Services and Indigenous Affairs (2009) FaHCSIA Annual Report Department of Work, Education, Employment and Workplace relations (DEEWR) (2009) DEEWR Annual Report Ibid 18 (including the Disability Support Pension, Double Orphan Pension, Widow B Pension, Wife Pension (Age),and the Wife Pension (Disability Support Pension)) 19 Department of Families, Housing, Community Services and Indigenous Affairs (2009) FaHCSIA Annual Report (including the Widow, Partner, Mobility Allowance, and Sickness allowances) 21 Ibid 3
68 Demand for services In respondent organisations provided services on 2.1 million occasions, a 5% increase on the 2 million instances of service provision in Table 1.2: Service provision and Increase (%) Child welfare, child services, and day care 91,864 86,250 7% Disability services 751, ,870 0% Domestic violence and sexual assault 2,843 1, % Emergency & disaster relief % Employment/training services 331, ,546 10% Family services 57,274 48,453 18% Financial and material support 6,446 13,011 50% Health services 32,815 26,889 22% Housing/homelessness services 9,134 8,356 9% Information, advice and personal social services 62,457 62,051 1% Legal services & advocacy 83,562 78,379 7% Migrant and refugee assistance 8,480 8,523 1% Residential aged care & nursing homes 5,184 5,184 0% Services for the elderly 264, ,233 9% Youth service and youth welfare services 387, ,948 5% Other 31,859 26,458 20% TOTAL 2,126,865 2,025,141 5% In respondent agencies turned away people who were eligible for their services on 119,357 occasions. This is the equivalent of one in ten people being turned away. Of people turned away, 75% were seeking financial and material support. 4
69 Aggregate turn away figures across all services increased 16% from the 102,858 times people were turned away by the same services in Table 1.3 Turn away rates Number of times people were turned away Percentage as total turn away Number of times people were turned away Difference and % Child welfare, child services, and day care 988 1% 1,031 4% Disability services 179 <1% % Domestic violence and sexual assault 73 <1% 72 1% Emergency & disaster relief 83 <1% 91 9% Employment/training services 171 <1% 183 7% Family services 302 <1% % Financial and material support 89,254 75% 74,177 20% Health services 10,605 9% 10, % Housing/homelessness services 11,660 10% 9,487 23% Information, advice and personal social services 174 <1% % Legal services & advocacy 5,443 5% 6,284 13% Migrant and refugee assistance 28 <1% 26 8% Residential aged care & nursing homes 33 <1% 27 22% Services for the elderly 52 <1% 54 4% Youth service and youth welfare services 231 <1% % Other 81 <1% 86 6% TOTAL 119, % 102,858 16% When asked if their organisation was able to meet demand for services, 64% of respondents disagreed (46%) or strongly disagreed (18%). 5
70 Figure 1.3 Service targeting When demand for services outstrips the capacity to supply these services, many organisations will implement tighter targeting measures as a way of limiting this demand, and utilising constrained resources in the most equitable manner. Governmental policy, through funding and other arrangements, can also require that organisations target their services more narrowly. With more tightly targeted service delivery aimed at rationing finite resources, many organisations will target according to need, and therefore experience increased complexity in service user needs. This increased complexity can have a significant impact on staff and organisational capacity if appropriate resources (for example adequate funding, available time, appropriately skilled staff) are not made available. Any change in service targeting is, therefore, an important gauge of both demand for services, and organisational resources relative to this demand. When asked if their organisation had targeted services more tightly than in the past, 61% of respondents agreed (51%) or strongly agreed (10%). 6
71 Figure 1.4 Organisations will often respond to increased demand and service delivery pressures by increasing the hours that their staff work. When asked if staff and volunteers had been required to work fewer hours than in the past, 68% of organisations disagreed (50%) or strongly disagreed (18%). Figure 1.5 7
72 Delivery Character of the workforce Paid staff In respondent organisations employed 5,044 paid staff (Full Time Equivalent), and engaged 2,318 volunteers (FTE). There were 515 volunteer board/ management committee members, and 19 paid board members. It is noteworthy that organisations of all sizes are governed primarily by volunteer boards. Staff hiring and leaving Respondent organisations reported that there was a net increase of 312 Full Time Equivalent (FTE) employees working in respondent organisations during This represents an increase of 6% on the total number of paid staff. Table 1.4: Staff hired and left Hired (FTE) Left (FTE) Difference (FTE) Administration Communications/ Media Finance Management Policy, research or advocacy Service delivery Other high skilled professional Other Total

73 Staff turnover Average staff turnover across respondent agencies was equivalent to 49%. Attracting and retaining staff Respondents were asked to indicate if a range of factors affected their organisation s ability to attract/ retain staff. Working hours and working conditions were the most frequently reported factors that helped attract or retain staff. Salaries were considered by 71% of organisations to make attracting/ retaining staff more difficult. Figure 1.6: Factors affecting attracting and retaining staff 9
74 Income and Expenditure Expenditure Organisations were asked to provide details of their expenditure. Salaries and wages constituted the majority of expenditure (54%) while service provision costs made up nearly a quarter of expenditure (22%). Figure 1.7: Expenditure Income In total dollar amounts, all respondents received on average 26% of income from the Commonwealth government, 47% from the State government, and 12% from other sources (for example from investments or sale of assets) These are aggregate figures. The disaggregate figures contain considerable variance. 10
75 Figure 1.8: Sources of income The majority of respondent organisations reported that their primary source of funding was from the State government (38%) or the Commonwealth government (20%). While most organisations reported that their funding was ongoing/recurrent, this varied by funding source, with State government funding most likely to be ongoing/recurrent (84%), and local government funding least likely to be ongoing/recurrent (14%). Table 1.5: Funding Sources Funding source Organisation s primary source of funding % Funding is ongoing/recurrent % Commonwealth Government 20% 58% State Government 38% 84% Local Government 5% 14% Client Fees 11% 50% Donations 11% 36% Corporate 3% 25% Other 12% 67% Indexation Organisations funding, even when ongoing or recurrent, is not always consistently or adequately indexed to meet the annually increasing costs of service provision. The Consumer Price Index (CPI) increased by 4.5% in the survey period 23. The Labour Price Index over the same period increased by 3.9% 24. However, respondent organisations reported that Commonwealth government funding was indexed, on average, at 2%. State government funding was indexed at 3%, and local government funding was indexed at 23 Australian Bureau of Statistics (ABS) Consumer Price Index, Australia, (ABS cat. no ) 24 Australian Bureau of Statistics (ABS) Labour Price Index, Australia, Jun 2009 (ABS cat. no ) 11
76 0.5%. Almost a quarter of organisations (24%) reported that they received no indexation on their government funding. Within these responses there was great variation, highlighting the inconsistent approach to indexing even between departments within the same government. Sector capacity issues & relationships with government A number of other factors affect the viability of community sector organisations including the adequacy of funding levels and the effect of government contractual requirements, and the tax status of organisations. These factors impact upon an organisation s ability to recruit and retain staff, to effectively deliver services and work with other organisations, and balance service delivery demands, advocacy and administrative requirements. Government funding and contractual requirements Eighty two per cent of respondents disagreed with the statement that Government funding covers the true cost of delivering contracted services. Only 10% expressed the view that funding was adequate, and 7% neither agreed nor disagreed. Figure 1.9: Adequacy of government funding: proportion agree/disagree with statement: Government funding covers the true cost of delivering contracted services As discussed above, 63% of organisations receive their primary source of funding from the Commonwealth, State, or Local Government. Forty eight percent of respondents indicated that Federal funding is not ongoing 12
77 or recurrent, 16% that State funding is not ongoing/recurrent, and 86% that Local government funding is not ongoing/recurrent. Many organisations are, therefore, subject to funding arrangements that do not guarantee recurrent or ongoing funding. This limits organisational capacity to plan adequately for the future, especially in terms of service provision and staffing. Sixty two per cent of respondents agreed that our funding agreements did not allow us to plan adequately for our organisation s future. Figure 1.10: our funding agreements did not allow us to plan adequately for our organisation s future Government funders have an obligation to ensure that services delivered by welfare and community organisations are a high quality and cost effective use of public funds. Contractual requirements made of service providers can, however, risk stipulating a disproportionately onerous level of reporting, or undermine the innovative potential of organisations. These risks are compounded for organisations receiving funding from multiple sources. Fifty five percent of organisations agreed that contract requirements and red tape adversely affected organisations capacity to deliver services. 13
78 Figure 1.11: Contract requirements and red tape adversely affected organisation s capacity to deliver services. Fifty three percent of organisations disagreed that government contracts supported our organisation s capacity for innovation. Figure 1.12 government contracts supported our organisation s capacity for innovation. Thirty four of all respondents agreed or strongly agreed that Federal Government initiatives or policies affecting our organisation were mostly positive. 14
79 Figure 1.13 Federal Government initiatives or policies affecting our organisation were mostly positive Thirty nine percent of organisations disagreed or strongly disagreed that State or Territory government initiatives or policies affecting our organisation were mostly positive. Figure 1.14: State or Territory government initiatives or policies affecting our organisation were mostly positive. Organisations from New South Wales were least likely to agree with this statement (22%), while organisations from the Northern Territory were most likely to agree or strongly agree (41%). 15
80 Figure 1.15: State or Territory government initiatives or policies affecting our organisation were mostly positive (by state/territory) The advocacy role of community organisations A majority of respondents (74%) indicated that they were able to speak publicly about issues affecting their clients. Only 11% disagreed and another 15% neither agreed nor disagreed. Figure 1.16: Our organisation is able to speak publicly about the issues facing our clients 16
81 Tax Status The tax concessions available to community service organisations depend on the purposes and activities of specific organisations and how the Australian Taxation Office and State Government entities interpret the law governing charities and related organisations. Status as a Public Benevolent Institution (PBI) attracts particularly generous concessions, including exemptions from Fringe Benefits Tax (FBT). Status as a Deductible Gift Recipient (DGR) not only makes gifting to these organisations attractive but is a pre condition for funding by most philanthropic bodies. Survey respondents were asked to indicate if they were an Income Tax Exempt Charity (ITEC), Deductible Gift Recipient (DGR), Public Benevolent Institution (PBI) or any combination of these. The largest percentage of respondents indicated that they had ITEC, DGR and PBI status. Figure 1.17: Tax status 17
82 Proudly supported by Australian Council of Social Service (ACOSS) Level 2, 619 Elizabeth Street, Redfern NSW 2016 Locked Bag 4777, Strawberry Hills NSW 2012 Phone: Fax: info@acoss.org.au Internet: 18
83 ACOSS Paper Australian Community Sector Survey Report 2010 Volume 9 Northern Territory
84 First published in 2010 by the Australian Council of Social Service Locked Bag 4777 Strawberry Hills, NSW, 2012 Australia Ph Fax Website: ISSN: ISBN: Australian Council of Social Service, This publication is copyright. Apart from fair dealing for the purpose of private study, research, criticism, or review, as permitted under the Copyright Act, no part may be reproduced by any process without written permission. Enquiries should be addressed to the Publications Officer, Australian Council of Social Service. Copies are available from the address above. 1

85 Northern Territory Survey Results Demand Service coverage Organisations operating across the territory made up 16% of all respondents. Twenty five percent of organisations operated in a regional centre, 3% in an inner metropolitan area, and 3% in another metropolitan area. No organisations operated nationally, 9% in a rural centre, and 31% in a remote area. Figure 1.1 Service users As Table 1.1 shows, specific groups within the Australian population are over represented as users of community and welfare services. 1
86 Table 1.1: Service users by population group Population group as a percentage of the Australian population Population group as a percentage of service users Ratio of column one to column two Population group People with a disability 20% % 1.5 Indigenous 2.3% % 28.3 Jobless 34.5% % 2.0 Culturally and linguistically diverse background 21% % 2.0 Single parents 2.4% % 10.5 Women 50% % 1.2 Not Australian citizens 4.6% 7 1.9% 0.4 The overrepresentation of almost every population group listed in Table 1.1 is an indication of the importance of community and welfare services in the lives of low income and disadvantaged groups within the community. Single parents are 10.5 times more likely to use community and welfare services than their representation in the general community would suggest. Compared with other family types, single parent families are considered to be in greater need of support services in areas such as income, housing, employment, and social participation 8. Government pensions and allowances were the principal source of income for 61% of single parent families, the majority of which are headed by women (87%) 9. As the number of single parent households continues to increase, a greater number of children are likely to spend at least some of their childhood in a single parent household, and many parents will experience sole parenting. Indigenous people are 28.3 times more likely to use community and welfare services than their representation in the general community would suggest. The health and welfare outcomes for Indigenous Australians continue to be lower than that of non Indigenous Australians. For example, Indigenous Australians are more than twice as likely as non Indigenous Australians to need help with core daily activities because of disability 10. Aboriginal and Torres Strait Islander people are over represented in the homeless population, making up 9% of homeless people Australian Bureau of Statistics (ABS) (2003), Disability, Ageing and Carers, Australia: Summary of Findings, 2003, ABS Catalogue No Australian Bureau of Statistics (ABS) (2006),2006 Census of Population and Housing Australia, ABS Catalogue No This figure is derived from ABS, Labour Force, March Proportion of people who speak a language other than English at home, derived from the ABS Census Quick Stats Derived from Australian Bureau of Statistics (ABS) (2007) Australian Social Trends, 2007, ABS Catalogue No Australian Bureau of Statistics (ABS) (2006),2006 Census of Population and Housing Australia, ABS Catalogue No Derived from Australian Bureau of Statistics (ABS) (2006) Year Book Australia 2006, ABS Catalogue No Australian Bureau of Statistics (ABS) (2007) Australian Social Trends, 2007, ABS Catalogue No Ibid. 10 Australian Institute of Health and Welfare (AIHW) (2009) Australia s Welfare 2009, p Australian Bureau of Statistics (ABS) (2006) Counting the homeless 2
87 For many people accessing welfare and community services, social security payments are their primary source of income. Table 1.2 illustrates the average percentage of recipients of different allowances and pensions accessing services. Table 1.2: Service users income support recipients Percentage of recipients in the Australian Average percentage of Ratio of representation in population to service Payment type population 12 service users users Aged pension 10% % 0.8 Parenting payment (Single) 2% % 6.9 Carer payment (Adult & 2% 15 Child) 2.7% 1.4 Newstart allowance 3% % 3.7 Youth allowance 2% % 8.2 Other pension 18 4% % 13.5 Other allowance % % 60.7 As in Table 1.1, single parents are significantly overrepresented as services users. The other pension category includes the Disability Support Pension. As recipients of every social security payment listed are overrepresented, the importance of welfare and community services to low income people is again emphasised. Other services and supports Survey respondents were asked to identify which services or supports (other than those delivered by their organisation) people accessing their services needed but did not have adequate access to. A large number of services were identified as being a high or medium unmet need by more than 70% of respondents (including housing/homelessness services; Child welfare, child services, and day care; information, advice and personal social services; employment/training service; legal services & advocacy ; health services; and financial and material support services). At 69%, Health services had the highest percentage of respondents indicating a high unmet need. 12 Data from June Department of Families, Housing, Community Services and Indigenous Affairs (2009) FaHCSIA Annual Report Department of Work, Education, Employment and Workplace relations (DEEWR) (2009) DEEWR Annual Report Department of Families, Housing, Community Services and Indigenous Affairs (2009) FaHCSIA Annual Report Department of Work, Education, Employment and Workplace relations (DEEWR) (2009) DEEWR Annual Report Ibid 18 (including the Disability Support Pension, Double Orphan Pension, Widow B Pension, Wife Pension (Age),and the Wife Pension (Disability Support Pension)) 19 Department of Families, Housing, Community Services and Indigenous Affairs (2009) FaHCSIA Annual Report (including the Widow, Partner, Mobility Allowance, and Sickness allowances) 21 Ibid 3
88 Figure 1.2: Services or supports people accessing community and welfare services need but do not currently have adequate access to high and medium need Demand for services In respondent organisations provided services on 224,292 occasions, an 11% increase on the 201,723 instances of service provision in It should be noted that due to relatively small sample size, the figures in the two tables below are likely to underestimate service provision and turn away rates across the community and welfare services. Percentages should be interpreted with caution. Table 1.2: Service provision and Increase (%) Child welfare, child services, and day care 6,126 5,213 18% Disability services 52,602 54,708 4% Domestic violence and sexual assault 2,490 2,303 8% Emergency & disaster relief 3,052 3,140 3% Employment/training services 2,650 2,582 3% Family services 7, % Financial and material support 67,650 53,518 26% Health services 14,191 12,742 11% Housing/homelessness services 6, % Information, advice and personal social services 1,465 1,225 20% Legal services & advocacy 3,924 3,407 15% Migrant and refugee assistance 1,919 1,913 0% Residential aged care & nursing homes % Services for the elderly 50,938 56,083 9% 4
89 Youth service and youth welfare services 2,851 2,691 6% Other 10 0 TOTAL 224, ,723 11% In respondent agencies turned away people who were eligible for their services on 1,250 occasions. Of people turned away, 77% were seeking housing and homelessness services. Aggregate turn away figures across all services increased 4% from the 1,202 times people were turned away by the same services in Table 1.3 Turn away rates Number of times people were turned away Percentage as total turn away Number of times people were turned away Difference and % Child welfare, child services, and day care Disability services 6 <1% 9 33% Domestic violence and sexual assault Emergency & disaster relief Employment/training services Family services 17 1% 13 31% Financial and material support 10 1% 33 70% Health services % % Housing/homelessness services % % Information, advice and personal social services 44 4% % Legal services & advocacy 25 2% 32 22% Migrant and refugee assistance 2 <1% 2 0% Residential aged care & nursing homes 5 <1% 3 67% Services for the elderly 9 1% 9 0% Youth service and youth welfare services 45 4% 58 22% Other TOTAL 1, % 1,202 4% When asked if their organisation was able to meet demand for services, 63% of respondents disagreed (37%) or strongly disagreed (26%). 5
90 Figure 1.3 Service targeting When demand for services outstrips the capacity to supply these services, many organisations will implement tighter targeting measures as a way of limiting this demand, and utilising constrained resources in the most equitable manner. Governmental policy, through funding and other arrangements, can also require that organisations target their services more narrowly. With more tightly targeted service delivery aimed at rationing finite resources, many organisations will target according to need, and therefore experience increased complexity in service user needs. This increased complexity can have a significant impact on staff and organisational capacity if appropriate resources (for example adequate funding, available time, appropriately skilled staff) are not made available. Any change in service targeting is, therefore, an important gauge of both demand for services, and organisational resources relative to this demand. When asked if their organisation had targeted services more tightly than in the past, 56% of respondents agreed (52%) or strongly agreed (4%). 6
91 Figure 1.4 Organisations will often respond to increased demand and service delivery pressures by increasing the hours that their staff work. When asked if staff and volunteers had been required to work fewer hours than in the past, 78% of organisations disagreed (56%) or strongly disagreed (22%). Figure 1.5 7
92 Delivery Character of the workforce Paid staff In respondent organisations employed 195 paid staff (Full Time Equivalent), and engaged 10 volunteers (FTE). There were 66 volunteer board/ management committee members, and 6 paid board members. It is noteworthy that organisations of all sizes are governed primarily by volunteer boards. Staff hiring and leaving Respondent organisations reported that there was a net increase of 39 Full Time Equivalent (FTE) employees working in respondent organisations during This represents an increase of 20% on the total number of paid staff. Table 1.4: Staff hired and left Hired (FTE) Left (FTE) Difference (FTE) Administration Communications/ Media Finance Management Policy, research or advocacy Service delivery Other high skilled professional Other Total
93 Staff turnover Average staff turnover across respondent agencies was equivalent to 52%. Attracting and retaining staff Respondents were asked to indicate if a range of factors affected their organisation s ability to attract/ retain staff. Working hours and working conditions were the most frequently reported factors that helped attract or retain staff. Salaries were considered by 79% of organisations to make attracting/ retaining staff more difficult. Figure 1.6: Factors affecting attracting and retaining staff 9
 while administration and operational costs made up nearly a quarter of expenditure (25%). Figure 1.")
94 Income and Expenditure Expenditure Organisations were asked to provide details of their expenditure. Salaries and wages constituted the majority of expenditure (74%) while administration and operational costs made up nearly a quarter of expenditure (25%). Figure 1.7: Expenditure Income In total dollar amounts, all respondents received on average 29% of income from the Commonwealth government, 32% from the territory government, and 19% from other sources (for example from investments or sale of assets) These are aggregate figures. The disaggregate figures contain considerable variance. 10

95 Figure 1.8: Sources of income The majority of respondent organisations reported that their primary source of funding was from the territory government (33%) or the Commonwealth government (67%). Table 1.5: Funding Sources Funding source Organisation s primary source of funding % Commonwealth Government 67% Territory Government 33% Local Government Client Fees Donations Corporate Other Indexation Organisations funding, even when ongoing or recurrent, is not always consistently or adequately indexed to meet the annually increasing costs of service provision. The Consumer Price Index (CPI) increased by 4.5% in the survey period 23. The Labour Price Index over the same period increased by 3.9% 24. However, respondent organisations reported that Commonwealth government funding was indexed, on average, at 1.9%. Territory government funding was indexed at 3.3%, and local government funding was indexed at 0%. A fifth of organisations (20%) reported that they received no indexation on their government funding. 23 Australian Bureau of Statistics (ABS) Consumer Price Index, Australia, (ABS cat. no ) 24 Australian Bureau of Statistics (ABS) Labour Price Index, Australia, Jun 2009 (ABS cat. no ) 11
96 Within these responses there was great variation, highlighting the inconsistent approach to indexing even between departments within the same government. Sector capacity issues & relationships with government A number of other factors affect the viability of community sector organisations including the adequacy of funding levels and the effect of government contractual requirements, and the tax status of organisations. These factors impact upon an organisation s ability to recruit and retain staff, to effectively deliver services and work with other organisations, and balance service delivery demands, advocacy and administrative requirements. Government funding and contractual requirements Sixty five per cent of respondents disagreed with the statement that Government funding covers the true cost of delivering contracted services. Only 23% expressed the view that funding was adequate, and 12% neither agreed nor disagreed. Figure 1.9: Adequacy of government funding: proportion agree/disagree with statement: Government funding covers the true cost of delivering contracted services As discussed above, the majority of organisations receive their primary source of funding from the Commonwealth or Territory Government. Many organisations are subject to funding arrangements that do not guarantee recurrent or ongoing funding. This limits organisational capacity to plan adequately for the future, especially in terms of service provision and staffing. Sixty four per cent of respondents agreed that our funding agreements did not allow us to plan adequately for our organisation s future. 12
97 Figure 1.10: our funding agreements did not allow us to plan adequately for our organisation s future Government funders have an obligation to ensure that services delivered by welfare and community organisations are a high quality and cost effective use of public funds. Contractual requirements made of service providers can, however, risk stipulating a disproportionately onerous level of reporting, or undermine the innovative potential of organisations. These risks are compounded for organisations receiving funding from multiple sources. Fifty three percent of organisations agreed that contract requirements and red tape adversely affected organisations capacity to deliver services. 13
98 Figure 1.11: Contract requirements and red tape adversely affected organisation s capacity to deliver services. Twenty three percent of organisations disagreed that government contracts supported our organisation s capacity for innovation. Figure 1.12 government contracts supported our organisation s capacity for innovation. Thirty six of all respondents agreed or strongly agreed that Federal Government initiatives or policies affecting our organisation were mostly positive. 14
99 Figure 1.13 Federal Government initiatives or policies affecting our organisation were mostly positive Thirty percent of organisations disagreed or strongly disagreed that State or Territory government initiatives or policies affecting our organisation were mostly positive. Figure 1.14: State or Territory government initiatives or policies affecting our organisation were mostly positive. Organisations from New South Wales were least likely to agree with this statement (22%), while organisations from the Northern Territory were most likely to agree or strongly agree (41%). 15
100 Figure 1.15: State or Territory government initiatives or policies affecting our organisation were mostly positive (by state/territory) The advocacy role of community organisations A majority of respondents (65%) indicated that they were able to speak publicly about issues affecting their clients. Only 11% disagreed and another 15% neither agreed nor disagreed. Figure 1.16: Our organisation is able to speak publicly about the issues facing our clients 16
101 Tax Status The tax concessions available to community service organisations depend on the purposes and activities of specific organisations and how the Australian Taxation Office and State Government entities interpret the law governing charities and related organisations. Status as a Public Benevolent Institution (PBI) attracts particularly generous concessions, including exemptions from Fringe Benefits Tax (FBT). Status as a Deductible Gift Recipient (DGR) not only makes gifting to these organisations attractive but is a pre condition for funding by most philanthropic bodies. Nationally, survey respondents were asked to indicate if they were an Income Tax Exempt Charity (ITEC), Deductible Gift Recipient (DGR), Public Benevolent Institution (PBI) or any combination of these. The largest percentage of respondents indicated that they had ITEC, DGR and PBI status. Figure 1.17: Tax status (nationally) 17
102 18
103 Proudly supported by Australian Council of Social Service (ACOSS) Level 2, 619 Elizabeth Street, Redfern NSW 2016 Locked Bag 4777, Strawberry Hills NSW 2012 Phone: Fax: info@acoss.org.au Internet: 19
104 ACOSS Paper Australian Community Sector Survey Report 2010 Volume 3 Queensland
105 First published in 2010 by the Australian Council of Social Service Locked Bag 4777 Strawberry Hills, NSW, 2012 Australia Ph Fax Website: ISSN: ISBN: Australian Council of Social Service, This publication is copyright. Apart from fair dealing for the purpose of private study, research, criticism, or review, as permitted under the Copyright Act, no part may be reproduced by any process without written permission. Enquiries should be addressed to the Publications Officer, Australian Council of Social Service. Copies are available from the address above. 1
106 Queensland Survey Results Demand Service coverage Organisations operating across the state made up 14% of all respondents. Twenty seven percent of organisations operated in a regional centre, 9% in an inner metropolitan area, and 9% in another metropolitan area. Four per cent of organisations operated nationally, 12% in a rural centre, and 4% in a remote area. Figure 1.1 Service users As Table 1.1 shows, specific groups within the Australian population are over represented as users of community and welfare services. 1
107 Table 1.1: Service users by population group Population group as a percentage of the Australian population Population group as a percentage of service users Ratio of column one to column two Population group People with a disability 20% % 1.8 Indigenous 2.3% % 7.8 Jobless 34.5% % 1.7 Culturally and linguistically diverse background 21% % 0.7 Single parents 2.4% % 15.6 Women 50% % 1.4 Not Australian citizens 4.6% 7 7.0% 1.5 The overrepresentation of almost every population group listed in Table 1.1 is an indication of the importance of community and welfare services in the lives of low income and disadvantaged groups within the community. Single parents are 15.6 times more likely to use community and welfare services than their representation in the general community would suggest. Compared with other family types, single parent families are considered to be in greater need of support services in areas such as income, housing, employment, and social participation 8. Government pensions and allowances were the principal source of income for 61% of single parent families, the majority of which are headed by women (87%) 9. As the number of single parent households continues to increase, a greater number of children are likely to spend at least some of their childhood in a single parent household, and many parents will experience sole parenting. Indigenous people are 7.8 times more likely to use community and welfare services than their representation in the general community would suggest. The health and welfare outcomes for Indigenous Australians continue to be lower than that of non Indigenous Australians. For example, Indigenous Australians are more than twice as likely as non Indigenous Australians to need help with core daily activities because of disability 10. Aboriginal and Torres Strait Islander people are over represented in the homeless population, making up 9% of homeless people Australian Bureau of Statistics (ABS) (2003), Disability, Ageing and Carers, Australia: Summary of Findings, 2003, ABS Catalogue No Australian Bureau of Statistics (ABS) (2006),2006 Census of Population and Housing Australia, ABS Catalogue No This figure is derived from ABS, Labour Force, March Proportion of people who speak a language other than English at home, derived from the ABS Census Quick Stats Derived from Australian Bureau of Statistics (ABS) (2007) Australian Social Trends, 2007, ABS Catalogue No Australian Bureau of Statistics (ABS) (2006),2006 Census of Population and Housing Australia, ABS Catalogue No Derived from Australian Bureau of Statistics (ABS) (2006) Year Book Australia 2006, ABS Catalogue No Australian Bureau of Statistics (ABS) (2007) Australian Social Trends, 2007, ABS Catalogue No Ibid. 10 Australian Institute of Health and Welfare (AIHW) (2009) Australia s Welfare 2009, p Australian Bureau of Statistics (ABS) (2006) Counting the homeless 2
108 For many people accessing welfare and community services, social security payments are their primary source of income. Table 1.2 illustrates the average percentage of recipients of different allowances and pensions accessing services. Table 1.2: Service users income support recipients Percentage of recipients in the Australian Average percentage of Ratio of representation in population to service Payment type population 12 service users users Aged pension 10% % 1.4 Parenting payment (Single) 2% % 16.3 Carer payment (Adult & 2% 15 Child) 8.0% 4.0 Newstart allowance 3% % 7.5 Youth allowance 2% % 4.3 Other pension 18 4% % 8.4 Other allowance % % 42.5 As in Table 1.2, single parents are significantly overrepresented as services users. The other pension category includes the Disability Support Pension. As recipients of every social security payment listed are overrepresented, the importance of welfare and community services to low income people is again emphasised. Other services and supports Survey respondents were asked to identify which services or supports (other than those delivered by their organisation) people accessing their services needed but did not have adequate access to. Financial and material support were identified as being a high or medium unmet need by 71% of respondents. Housing and homelessness (66%) and Health services (70%) were also identified as being high or medium unmet need. Figure 1.2: Services or supports people accessing community and welfare services need but do not currently have adequate access to high and medium need 12 Data from June Department of Families, Housing, Community Services and Indigenous Affairs (2009) FaHCSIA Annual Report Department of Work, Education, Employment and Workplace relations (DEEWR) (2009) DEEWR Annual Report Department of Families, Housing, Community Services and Indigenous Affairs (2009) FaHCSIA Annual Report Department of Work, Education, Employment and Workplace relations (DEEWR) (2009) DEEWR Annual Report Ibid 18 (including the Disability Support Pension, Double Orphan Pension, Widow B Pension, Wife Pension (Age),and the Wife Pension (Disability Support Pension)) 19 Department of Families, Housing, Community Services and Indigenous Affairs (2009) FaHCSIA Annual Report (including the Widow, Partner, Mobility Allowance, and Sickness allowances) 21 Ibid 3
109 Demand for services In respondent organisations provided services on 1,765,246 occasions, a 2% increase on the 1,733,620 instances of service provision in Table 1.3: Service provision and Increase (%) Child welfare, child services, and day care 99, ,010 0% Disability services 497, ,638 3% Domestic violence and sexual assault 30,684 30,208 2% Emergency & disaster relief 1,200 1,080 11% Employment/training services 50,168 45,494 10% Family services 73,618 71,000 4% Financial and material support 141, ,180 2% Health services 111, ,354 11% Housing/homelessness services 161, ,702 4% Information, advice and personal social services 122, ,282 1% Legal services & advocacy 175, ,584 0% Migrant and refugee assistance 21,582 21,992 2% Residential aged care & nursing homes % Services for the elderly 70,536 53,584 32% Youth service and youth welfare services 175, ,858 5% Other 33,206 22,154 50% TOTAL 1,765,246 1,733,620 2% In respondent agencies turned away people who were eligible for their services on 122,494 occasions. This is the equivalent of people being turned away on one in fourteen occasions. Of people turned away, 94% were seeking youth service and youth welfare services. Aggregate turn away figures across all services decreased 39% from the 200,775 times people were turned away by the same services in
110 Table 1.4 Turn away rates Number of times people were turned away Percentage as total turn away Number of times people were turned away Difference and % Child welfare, child services, and day care 158 <1% % Disability services 159 <1% % Domestic violence and sexual assault 182 <1% 172 6% Emergency & disaster relief Employment/training services 105 <1% 85 24% Family services 1, % 1,644 18% Financial and material support 1, % 2,250 45% Health services 30 <1% 40 25% Housing/homelessness services 1,051 <1% 965 9% Information, advice and personal social services 843 <1% 777 8% Legal services & advocacy 2, % 2,080 1% Migrant and refugee assistance 27 <1% 27 0% Residential aged care & nursing homes 10 <1% 0 Services for the elderly 10 <1% 0 Youth service and youth welfare services 115, % 192,401 40% Other 140 <1% % TOTAL 122, % 200,775 39% When asked if their organisation was able to meet demand for services, 54% of respondents disagreed (38%) or strongly disagreed (16%). 5
111 Figure 1.3 Service targeting When demand for services outstrips the capacity to supply these services, many organisations will implement tighter targeting measures as a way of limiting this demand, and utilising constrained resources in the most equitable manner. Governmental policy, through funding and other arrangements, can also require that organisations target their services more narrowly. With more tightly targeted service delivery aimed at rationing finite resources, many organisations will target according to need, and therefore experience increased complexity in service user needs. This increased complexity can have a significant impact on staff and organisational capacity if appropriate resources (for example adequate funding, available time, appropriately skilled staff) are not made available. Any change in service targeting is, therefore, an important gauge of both demand for services, and organisational resources relative to this demand. When asked if their organisation had targeted services more tightly than in the past, 61% of respondents agreed (49%) or strongly agreed (12%). 6
112 Figure 1.4 Organisations will often respond to increased demand and service delivery pressures by increasing the hours that their staff work. When asked if staff and volunteers had been required to work fewer hours than in the past, 68% of organisations disagreed (47%) or strongly disagreed (21%). Figure 1.5 7
113 Delivery Character of the workforce Paid staff In respondent organisations employed 2,843 paid staff (Full Time Equivalent), and engaged 613 volunteers (FTE). There were 469 volunteer board/ management committee members, and 12 paid board members. It is noteworthy that organisations of all sizes are governed primarily by volunteer boards. Staff hiring and leaving Respondent organisations reported that there was a net increase of 195 Full Time Equivalent (FTE) employees working in respondent organisations during This represents an increase of 22% on the total number of paid staff. Table 1.5: Staff hired and left Hired (FTE) Left (FTE) Difference (FTE) Administration Communications/ Media Finance Management Policy, research or advocacy Service delivery Other high skilled professional Other Total

114 Staff turnover Average staff turnover across respondent agencies was equivalent to 23%. Attracting and retaining staff Respondents were asked to indicate if a range of factors affected their organisation s ability to attract/ retain staff. Working hours and working conditions were the most frequently reported factors that helped attract or retain staff. Salaries were considered by 73% of organisations to make attracting/ retaining staff more difficult. Figure 1.6: Factors affecting attracting and retaining staff 9
115 Income and Expenditure Expenditure Organisations were asked to provide details of their expenditure. Salaries and wages constituted the majority of expenditure (54%) while administration and operational costs made up nearly a quarter of expenditure (22%). Figure 1.7: Expenditure Income In total dollar amounts, all respondents received on average 11% of income from the Commonwealth government, 24% from the State government, and 52% from other sources (for example from investments or sale of assets) These are aggregate figures. The disaggregate figures contain considerable variance. 10
116 Figure 1.8: Sources of income The majority of respondent organisations reported that their primary source of funding was their State government (52%) or the Commonwealth government (18%). While most organisations reported that their funding was ongoing/recurrent, this varied by funding source, with Commonwealth funding most likely to be ongoing/recurrent (100%), and other funding sources the least likely to be ongoing/recurrent (25%). Table 1.6: Funding Sources Funding source Organisation s primary source of funding % Funding is ongoing/recurrent % Commonwealth Government 18% 100% State/Territory Government 52% 75% Local Government 3% 50% Client Fees 8% 60% Donations 10% 50% Corporate 3% 50% Other 6% 25% Indexation Organisations funding, even when ongoing or recurrent, is not always consistently or adequately indexed to meet the annually increasing costs of service provision. The Consumer Price Index (CPI) increased by 4.5% in the survey period 23. The Labour Price Index over the same period increased by 3.9% 24. However, respondent organisations reported that Commonwealth government funding was indexed, on average, at 1.6%. State government funding was indexed at 2.3%, and local government funding was indexed 23 Australian Bureau of Statistics (ABS) Consumer Price Index, Australia, (ABS cat. no ) 24 Australian Bureau of Statistics (ABS) Labour Price Index, Australia, Jun 2009 (ABS cat. no ) 11
117 at 0%. Almost a third of organisations (31%) reported that they received no indexation on their government funding. Within these responses there was great variation, highlighting the inconsistent approach to indexing even between departments within the same government. Sector capacity issues & relationships with government A number of other factors affect the viability of community sector organisations including the adequacy of funding levels and the effect of government contractual requirements, and the tax status of organisations. These factors impact upon an organisation s ability to recruit and retain staff, to effectively deliver services and work with other organisations, and balance service delivery demands, advocacy and administrative requirements. Government funding and contractual requirements Seventy eight per cent of respondents disagreed with the statement that Government funding covers the true cost of delivering contracted services. Only 10% expressed the view that funding was adequate, and 11% neither agreed nor disagreed. Figure 1.9: Adequacy of government funding: proportion agree/disagree with statement: Government funding covers the true cost of delivering contracted services As discussed above, 73% of organisations receive their primary source of funding from the Commonwealth, State, or Local Government. Twenty five percent of respondents indicated that State funding is not ongoing/recurrent, and 50% that Local government funding is not ongoing/recurrent. 12
118 Many organisations are, therefore, subject to funding arrangements that do not guarantee recurrent or ongoing funding. This limits organisational capacity to plan adequately for the future, especially in terms of service provision and staffing. Fifty nine per cent of respondents agreed that our funding agreements did not allow us to plan adequately for our organisation s future. Figure 1.10: our funding agreements did not allow us to plan adequately for our organisation s future Government funders have an obligation to ensure that services delivered by welfare and community organisations are a high quality and cost effective use of public funds. Contractual requirements made of service providers can, however, risk stipulating a disproportionately onerous level of reporting, or undermine the innovative potential of organisations. These risks are compounded for organisations receiving funding from multiple sources. Fifty percent of organisations agreed that contract requirements and red tape adversely affected organisations capacity to deliver services. 13
119 Figure 1.11: Contract requirements and red tape adversely affected organisation s capacity to deliver services. Forty four percent of organisations disagreed that government contracts supported our organisation s capacity for innovation. Figure 1.12 government contracts supported our organisation s capacity for innovation. Thirty two percent of all respondents agreed or strongly agreed that Federal Government initiatives or policies affecting our organisation were mostly positive. 14
120 Figure 1.13 Federal Government initiatives or policies affecting our organisation were mostly positive Twenty eight percent of organisations disagreed or strongly disagreed that State or Territory government initiatives or policies affecting our organisation were mostly positive. Figure 1.14: State or Territory government initiatives or policies affecting our organisation were mostly positive. Organisations from New South Wales were least likely to agree with this statement (22%), while organisations from the Northern Territory were most likely to agree or strongly agree (41%). 15
121 Figure 1.15: State or Territory government initiatives or policies affecting our organisation were mostly positive (by state/territory) The advocacy role of community organisations A majority of respondents (75%) indicated that they were able to speak publicly about issues affecting their clients. Only 7% disagreed and another 17% neither agreed nor disagreed. Figure 1.16: Our organisation is able to speak publicly about the issues facing our clients 16

122 Tax Status The tax concessions available to community service organisations depend on the purposes and activities of specific organisations and how the Australian Taxation Office and State Government entities interpret the law governing charities and related organisations. Status as a Public Benevolent Institution (PBI) attracts particularly generous concessions, including exemptions from Fringe Benefits Tax (FBT). Status as a Deductible Gift Recipient (DGR) not only makes gifting to these organisations attractive but is a pre condition for funding by most philanthropic bodies. Survey respondents were asked to indicate if they were an Income Tax Exempt Charity (ITEC), Deductible Gift Recipient (DGR), Public Benevolent Institution (PBI) or any combination of these. The largest percentage of respondents indicated that they had ITEC, DGR and PBI status. Figure 1.17: Tax status 17
123 Proudly supported by Australian Council of Social Service (ACOSS) Level 2, 619 Elizabeth Street, Redfern NSW 2016 Locked Bag 4777, Strawberry Hills NSW 2012 Phone: Fax: info@acoss.org.au Internet: 18
124 ACOSS Paper Australian Community Sector Survey Report 2010 Volume 7 South Australia
125 First published in 2010 by the Australian Council of Social Service Locked Bag 4777 Strawberry Hills, NSW, 2012 Australia Ph Fax Website: ISSN: ISBN: Australian Council of Social Service, This publication is copyright. Apart from fair dealing for the purpose of private study, research, criticism, or review, as permitted under the Copyright Act, no part may be reproduced by any process without written permission. Enquiries should be addressed to the Publications Officer, Australian Council of Social Service. Copies are available from the address above. 1
126 South Australia Survey Results Demand Service coverage Organisations operating across the state made up 24% of all respondents. Eleven percent of organisations operated in a regional centre, 19% in an inner metropolitan area, and 16% in another metropolitan area. Eight per cent of organisations operated nationally, 11% in a rural centre, and 4% in a remote area. Figure 1.1 Service users As Table 1.1 shows, specific groups within the Australian population are over represented as users of community and welfare services. 1
127 Table 1.1: Service users by population group Population group as a percentage of the Australian population Population group as a percentage of service users Ratio of column one to column two Population group People with a disability 20% % 0.9 Indigenous 2.3% 2 6.4% 2.8 Jobless 34.5% % 1.0 Culturally and linguistically diverse background 21% % 0.9 Single parents 2.4% % 7.7 Women 50% % 0.9 Not Australian citizens 4.6% 7 6.7% 1.4 The overrepresentation of almost every population group listed in Table 1.1 is an indication of the importance of community and welfare services in the lives of low income and disadvantaged groups within the community. Single parents are 7.7 times more likely to use community and welfare services than their representation in the general community would suggest. Compared with other family types, single parent families are considered to be in greater need of support services in areas such as income, housing, employment, and social participation 8. Government pensions and allowances were the principal source of income for 61% of single parent families, the majority of which are headed by women (87%) 9. As the number of single parent households continues to increase, a greater number of children are likely to spend at least some of their childhood in a single parent household, and many parents will experience sole parenting. Indigenous people are 2.8 times more likely to use community and welfare services than their representation in the general community would suggest. The health and welfare outcomes for Indigenous Australians continue to be lower than that of non Indigenous Australians. For example, Indigenous Australians are more than twice as likely as non Indigenous Australians to need help with core daily activities because of disability 10. Aboriginal and Torres Strait Islander people are over represented in the homeless population, making up 9% of homeless people Australian Bureau of Statistics (ABS) (2003), Disability, Ageing and Carers, Australia: Summary of Findings, 2003, ABS Catalogue No Australian Bureau of Statistics (ABS) (2006),2006 Census of Population and Housing Australia, ABS Catalogue No This figure is derived from ABS, Labour Force, March Proportion of people who speak a language other than English at home, derived from the ABS Census Quick Stats Derived from Australian Bureau of Statistics (ABS) (2007) Australian Social Trends, 2007, ABS Catalogue No Australian Bureau of Statistics (ABS) (2006),2006 Census of Population and Housing Australia, ABS Catalogue No Derived from Australian Bureau of Statistics (ABS) (2006) Year Book Australia 2006, ABS Catalogue No Australian Bureau of Statistics (ABS) (2007) Australian Social Trends, 2007, ABS Catalogue No Ibid. 10 Australian Institute of Health and Welfare (AIHW) (2009) Australia s Welfare 2009, p Australian Bureau of Statistics (ABS) (2006) Counting the homeless 2
128 For many people accessing welfare and community services, social security payments are their primary source of income. Table 1.2 illustrates the average percentage of recipients of different allowances and pensions accessing services. Table 1.2: Service users income support recipients Percentage of recipients in the Australian Average percentage of Ratio of representation in population to service Payment type population 12 service users users Aged pension 10% % 1.4 Parenting payment (Single) 2% % 8.0 Carer payment (Adult & 2% 15 Child) 7.3% 3.7 Newstart allowance 3% % 4.6 Youth allowance 2% % 6.6 Other pension 18 4% % 8.3 Other allowance % % 56.7 As in Table 1.2, single parents are significantly overrepresented as services users. The other pension category includes the Disability Support Pension. As recipients of every social security payment listed are overrepresented, the importance of welfare and community services to low income people is again emphasised. Other services and supports Survey respondents were asked to identify which services or supports (other than those delivered by their organisation) people accessing their services needed but did not have adequate access to. Housing and homelessness and financial and material support services were identified as being a high or medium unmet need by 73% of respondents. Health services (70%) were also identified as being high or medium unmet need. Figure 1.2: Services or supports people accessing community and welfare services need but do not currently have adequate access to high and medium need 12 Data from June Department of Families, Housing, Community Services and Indigenous Affairs (2009) FaHCSIA Annual Report Department of Work, Education, Employment and Workplace relations (DEEWR) (2009) DEEWR Annual Report Department of Families, Housing, Community Services and Indigenous Affairs (2009) FaHCSIA Annual Report Department of Work, Education, Employment and Workplace relations (DEEWR) (2009) DEEWR Annual Report Ibid 18 (including the Disability Support Pension, Double Orphan Pension, Widow B Pension, Wife Pension (Age),and the Wife Pension (Disability Support Pension)) 19 Department of Families, Housing, Community Services and Indigenous Affairs (2009) FaHCSIA Annual Report (including the Widow, Partner, Mobility Allowance, and Sickness allowances) 21 Ibid 3
129 Demand for services In respondent organisations provided services on 132,222 occasions, a 6% increase on the 124,196 instances of service provision in It should be noted that due to relatively small sample size, the figures in the two tables below are likely to underestimate service provision and turn away rates across the community and welfare services. Percentages should be interpreted with caution. Table 1.3: Service provision and Increase (%) Child welfare, child services, and day care 47,635 46,185 3% Disability services 1,690 1,385 22% Domestic violence and sexual assault 2,618 3,206 18% Emergency & disaster relief Employment/training services 11,064 10,650 4% Family services 4,940 4,695 5% Financial and material support 4,856 4,148 17% Health services 2,706 2,661 2% Housing/homelessness services 1,015 1,218 17% Information, advice and personal social services 6,422 5,472 17% Legal services & advocacy 3,155 2,610 21% Migrant and refugee assistance % Residential aged care & nursing homes Services for the elderly 2,300 2,000 15% Youth service and youth welfare services 30,110 29,879 1% Other 13,701 10,077 36% TOTAL 132, ,196 6% In respondent agencies turned away people who were eligible for their services on 6,492 occasions. This is the equivalent of one in twenty people being turned away. Of people turned away, 45% were seeking financial and material support. 4
130 Aggregate turn away figures across all services increased 19% from the 5,540 times people were turned away by the same services in Table 1.4 Turn away rates Number of times people were turned away Percentage as total turn away Number of times people were turned away Difference and % Child welfare, child services, and day care 350 5% 340 3% Disability services 362 6% % Domestic violence and sexual assault 60 1% 60 0% Emergency & disaster relief 10 <1% 10 0% Employment/training services 100 2% 100 0% Family services 165 3% % Financial and material support 2,929 45% 2,419 21% Health services 165 3% % Housing/homelessness services 515 8% % Information, advice and personal social services 80 1% 0 Legal services & advocacy 551 8% 511 8% Migrant and refugee assistance Residential aged care & nursing homes 405 6% % Services for the elderly % % Youth service and youth welfare services Other TOTAL 6, % 5,450 19% When asked if their organisation was able to meet demand for services, 57% of respondents disagreed (45%) or strongly disagreed (12%). 5
131 Figure 1.3 Service targeting When demand for services outstrips the capacity to supply these services, many organisations will implement tighter targeting measures as a way of limiting this demand, and utilising constrained resources in the most equitable manner. Governmental policy, through funding and other arrangements, can also require that organisations target their services more narrowly. With more tightly targeted service delivery aimed at rationing finite resources, many organisations will target according to need, and therefore experience increased complexity in service user needs. This increased complexity can have a significant impact on staff and organisational capacity if appropriate resources (for example adequate funding, available time, appropriately skilled staff) are not made available. Any change in service targeting is, therefore, an important gauge of both demand for services, and organisational resources relative to this demand. When asked if their organisation had targeted services more tightly than in the past, 53% of respondents agreed (44%) or strongly agreed (9%). 6
132 Figure 1.4 Organisations will often respond to increased demand and service delivery pressures by increasing the hours that their staff work. When asked if staff and volunteers had been required to work fewer hours than in the past, 82% of organisations disagreed (55%) or strongly disagreed (27%). Figure 1.5 7
133 Delivery Character of the workforce Paid staff In respondent organisations employed 1,128 paid staff (Full Time Equivalent), and engaged 1,428 volunteers (FTE). There were 117 volunteer board/ management committee members, and 2 paid board members. It is noteworthy that organisations of all sizes are governed primarily by volunteer boards. Staff hiring and leaving Respondent organisations reported that there was a net increase of 201 Full Time Equivalent (FTE) employees working in respondent organisations during This represents an increase of 18% on the total number of paid staff. Table 1.5: Staff hired and left Hired (FTE) Left (FTE) Difference (FTE) Administration Communications/ Media Finance Management Policy, research or advocacy Service delivery Other high skilled professional Other Total
134 Staff turnover Average staff turnover across respondent agencies was equivalent to 19%. Attracting and retaining staff Respondents were asked to indicate if a range of factors affected their organisation s ability to attract/ retain staff. Working hours and working conditions were the most frequently reported factors that helped attract or retain staff. Salaries were considered by 67% of organisations to make attracting/ retaining staff more difficult. Figure 1.6: Factors affecting attracting and retaining staff 9
135 Income and Expenditure Expenditure Organisations were asked to provide details of their expenditure. Salaries and wages constituted the majority of expenditure (52%) while service provision costs made up nearly a third of expenditure (31%). Figure 1.7: Expenditure Income In total dollar amounts, all respondents received on average 29% of income from the Commonwealth government, 32% from the State government, and 19% from other sources (for example from investments or sale of assets) These are aggregate figures. The disaggregate figures contain considerable variance. 10
136 Figure 1.8: Sources of income The majority of respondent organisations reported that their primary source of funding was the State government (32%) or Commonwealth government (32%). While many organisations reported that their funding was ongoing/recurrent, this varied by funding source. Table 1.6: Funding Sources Funding source Organisation s primary source of funding % Funding is ongoing/recurrent % Commonwealth Government 32% 71% State/Territory Government 32% 43% Local Government 14% 33% Client Fees 9% 50% Donations 9% 100% Corporate Other 5% 100% Indexation Organisations funding, even when ongoing or recurrent, is not always consistently or adequately indexed to meet the annually increasing costs of service provision. The Consumer Price Index (CPI) increased by 4.5% in the survey period 23. The Labour Price Index over the same period increased by 3.9% 24. However, respondent organisations reported that Commonwealth government funding was indexed, on average, at 1.2%. State government funding was indexed at 2.6%, and local government funding was indexed 23 Australian Bureau of Statistics (ABS) Consumer Price Index, Australia, (ABS cat. no ) 24 Australian Bureau of Statistics (ABS) Labour Price Index, Australia, Jun 2009 (ABS cat. no ) 11
137 at 1.3%. More than a third of organisations (38%) reported that they received no indexation on their government funding. Within these responses there was great variation, highlighting the inconsistent approach to indexing even between departments within the same government. Sector capacity issues & relationships with government A number of other factors affect the viability of community sector organisations including the adequacy of funding levels and the effect of government contractual requirements, and the tax status of organisations. These factors impact upon an organisation s ability to recruit and retain staff, to effectively deliver services and work with other organisations, and balance service delivery demands, advocacy and administrative requirements. Government funding and contractual requirements Eighty seven per cent of respondents disagreed with the statement that Government funding covers the true cost of delivering contracted services. Only 7% expressed the view that funding was adequate, and 7% neither agreed nor disagreed. Figure 1.9: Adequacy of government funding: proportion agree/disagree with statement: Government funding covers the true cost of delivering contracted services As discussed above, 78% of organisations receive their primary source of funding from the Commonwealth, State, or Local Government. Many indicated that their government funding is not recurrent. 12
138 Many organisations are, therefore, subject to funding arrangements that do not guarantee recurrent or ongoing funding. This limits organisational capacity to plan adequately for the future, especially in terms of service provision and staffing. Seventy seven per cent of respondents agreed that our funding agreements did not allow us to plan adequately for our organisation s future. Figure 1.10: our funding agreements did not allow us to plan adequately for our organisation s future Government funders have an obligation to ensure that services delivered by welfare and community organisations are a high quality and cost effective use of public funds. Contractual requirements made of service providers can, however, risk stipulating a disproportionately onerous level of reporting, or undermine the innovative potential of organisations. These risks are compounded for organisations receiving funding from multiple sources. Sixty three percent of organisations agreed that contract requirements and red tape adversely affected organisations capacity to deliver services. 13
139 Figure 1.11: Contract requirements and red tape adversely affected organisation s capacity to deliver services. Forty seven percent of organisations disagreed that government contracts supported our organisation s capacity for innovation. Figure 1.12 government contracts supported our organisation s capacity for innovation. Forty two percent of all respondents agreed or strongly agreed that Federal Government initiatives or policies affecting our organisation were mostly positive. 14
140 Figure 1.13 Federal Government initiatives or policies affecting our organisation were mostly positive Thirty percent of organisations disagreed or strongly disagreed that State or Territory government initiatives or policies affecting our organisation were mostly positive. Figure 1.14: State or Territory government initiatives or policies affecting our organisation were mostly positive. Organisations from New South Wales were least likely to agree with this statement (22%), while organisations from the Northern Territory were most likely to agree or strongly agree (41%). 15
141 Figure 1.15: State or Territory government initiatives or policies affecting our organisation were mostly positive (by state/territory) The advocacy role of community organisations A majority of respondents (70%) indicated that they were able to speak publicly about issues affecting their clients. Figure 1.16: Our organisation is able to speak publicly about the issues facing our clients 16
142 Tax Status The tax concessions available to community service organisations depend on the purposes and activities of specific organisations and how the Australian Taxation Office and State Government entities interpret the law governing charities and related organisations. Status as a Public Benevolent Institution (PBI) attracts particularly generous concessions, including exemptions from Fringe Benefits Tax (FBT). Status as a Deductible Gift Recipient (DGR) not only makes gifting to these organisations attractive but is a pre condition for funding by most philanthropic bodies. Nationally, survey respondents were asked to indicate if they were an Income Tax Exempt Charity (ITEC), Deductible Gift Recipient (DGR), Public Benevolent Institution (PBI) or any combination of these. The largest percentage of respondents indicated that they had ITEC, DGR and PBI status. Figure 1.17: Tax status (nationally) 17
143 Proudly supported by Australian Council of Social Service (ACOSS) Level 2, 619 Elizabeth Street, Redfern NSW 2016 Locked Bag 4777, Strawberry Hills NSW 2012 Phone: Fax: info@acoss.org.au Internet: 18
144 ACOSS Paper Australian Community Sector Survey Report 2010 Volume 6 Tasmania
145 First published in 2010 by the Australian Council of Social Service Locked Bag 4777 Strawberry Hills, NSW, 2012 Australia Ph Fax Website: ISSN: ISBN: Australian Council of Social Service, This publication is copyright. Apart from fair dealing for the purpose of private study, research, criticism, or review, as permitted under the Copyright Act, no part may be reproduced by any process without written permission. Enquiries should be addressed to the Publications Officer, Australian Council of Social Service. Copies are available from the address above. 1

146 Tasmania Survey Results Demand Service coverage Organisations operating across the state made up 36% of all respondents. Seven percent of organisations operated in a regional centre, 14% in an inner metropolitan area, and 11% in another metropolitan area. Four per cent of organisations operated nationally, 7% in a rural centre, and 4% in a remote area. Figure 1.1 Service users As Table 1.1 shows, specific groups within the Australian population are over represented as users of community and welfare services. 1
147 Table 1.1: Service users by population group Population group as a percentage of the Australian population Population group as a percentage of service users Ratio of column one to column two Population group People with a disability 20% % 1.3 Indigenous 2.3% 2 5.4% 2.3 Jobless 34.5% % 1.5 Culturally and linguistically diverse background 21% % 0.5 Single parents 2.4% % 10.8 Women 50% % 1.3 Not Australian citizens 4.6% 7 2.7% 0.6 The overrepresentation of almost every population group listed in Table 1.1 is an indication of the importance of community and welfare services in the lives of low income and disadvantaged groups within the community. Single parents are 10.8 times more likely to use community and welfare services than their representation in the general community would suggest. Compared with other family types, single parent families are considered to be in greater need of support services in areas such as income, housing, employment, and social participation 8. Government pensions and allowances were the principal source of income for 61% of single parent families, the majority of which are headed by women (87%) 9. As the number of single parent households continues to increase, a greater number of children are likely to spend at least some of their childhood in a single parent household, and many parents will experience sole parenting. Indigenous people are 2.3 times more likely to use community and welfare services than their representation in the general community would suggest. The health and welfare outcomes for Indigenous Australians continue to be lower than that of non Indigenous Australians. For example, Indigenous Australians are more than twice as likely as non Indigenous Australians to need help with core daily activities because of disability 10. Aboriginal and Torres Strait Islander people are over represented in the homeless population, making up 9% of homeless people Australian Bureau of Statistics (ABS) (2003), Disability, Ageing and Carers, Australia: Summary of Findings, 2003, ABS Catalogue No Australian Bureau of Statistics (ABS) (2006),2006 Census of Population and Housing Australia, ABS Catalogue No This figure is derived from ABS, Labour Force, March Proportion of people who speak a language other than English at home, derived from the ABS Census Quick Stats Derived from Australian Bureau of Statistics (ABS) (2007) Australian Social Trends, 2007, ABS Catalogue No Australian Bureau of Statistics (ABS) (2006),2006 Census of Population and Housing Australia, ABS Catalogue No Derived from Australian Bureau of Statistics (ABS) (2006) Year Book Australia 2006, ABS Catalogue No Australian Bureau of Statistics (ABS) (2007) Australian Social Trends, 2007, ABS Catalogue No Ibid. 10 Australian Institute of Health and Welfare (AIHW) (2009) Australia s Welfare 2009, p Australian Bureau of Statistics (ABS) (2006) Counting the homeless 2
148 For many people accessing welfare and community services, social security payments are their primary source of income. Table 1.2 illustrates the average percentage of recipients of different allowances and pensions accessing services. Table 1.2: Service users income support recipients Percentage of recipients in the Australian Average percentage of Ratio of representation in population to service Payment type population 12 service users users Aged pension 10% % 3.0 Parenting payment (Single) 2% % 17.6 Carer payment (Adult & 2% 15 Child) 7.5% 3.8 Newstart allowance 3% % 6.6 Youth allowance 2% % 6.4 Other pension 18 4% % 5.2 Other allowance % % 22.0 As in Table 1.2, single parents are significantly overrepresented as services users. The other pension category includes the Disability Support Pension. As recipients of every social security payment listed are overrepresented, the importance of welfare and community services to low income people is again emphasised. Other services and supports Survey respondents were asked to identify which services or supports (other than those delivered by their organisation) people accessing their services needed but did not have adequate access to. Information, advice and personal social services were identified as being a high or medium unmet need by 82% of respondents. Disability services (75%) and Health services (73%) were also identified as being high or medium unmet need. Figure 1.2: Services or supports people accessing community and welfare services need but do not currently have adequate access to high and medium need 12 Data from June Department of Families, Housing, Community Services and Indigenous Affairs (2009) FaHCSIA Annual Report Department of Work, Education, Employment and Workplace relations (DEEWR) (2009) DEEWR Annual Report Department of Families, Housing, Community Services and Indigenous Affairs (2009) FaHCSIA Annual Report Department of Work, Education, Employment and Workplace relations (DEEWR) (2009) DEEWR Annual Report Ibid 18 (including the Disability Support Pension, Double Orphan Pension, Widow B Pension, Wife Pension (Age),and the Wife Pension (Disability Support Pension)) 19 Department of Families, Housing, Community Services and Indigenous Affairs (2009) FaHCSIA Annual Report (including the Widow, Partner, Mobility Allowance, and Sickness allowances) 21 Ibid 3
149 Demand for services In respondent organisations provided services on 61,487 occasions, a 7% decrease on the 66,297 instances of service provision in Table 1.3: Service provision and Increase (%) Child welfare, child services, and day care % Disability services % Domestic violence and sexual assault 2,348 2,348 0% Emergency & disaster relief Employment/training services % Family services 4,753 4,765 0% Financial and material support 8,800 10,042 12% Health services 5,313 4,733 12% Housing/homelessness services % Information, advice and personal social services 6,147 5,647 9% Legal services & advocacy 8,680 8,680 0% Migrant and refugee assistance % Residential aged care & nursing homes 0 0 0% Services for the elderly 12,877 18,657 31% Youth service and youth welfare services % Other 10,740 9,600 12% TOTAL 61,487 66,297 7% In respondent agencies turned away people who were eligible for their services on 4,266 occasions. This is the equivalent of one in ten people being turned away. Of people turned away, 39% were seeking health services, and 16% were seeking housing and homelessness services. Aggregate turn away figures across all services increased 19% from the 3,590 times people were turned away by the same services in
150 It should be noted that due to relatively small sample size, the figures in the table below are likely to underestimate turn away rates across the community and welfare services. Percentages should be interpreted with caution. Table 1.4 Turn away rates Number of times people were turned away Percentage as total turn away Number of times people were turned away Difference and % Child welfare, child services, and day care 25 <1% 20 25% Disability services 81 <1% 67 21% Domestic violence and sexual assault 10 <1% 5 100% Emergency & disaster relief 83 2% 83 0% Employment/training services 59 1% 59 0% Family services % 530 4% Financial and material support 136 3% 88 55% Health services 1,660 39% 1,652 0% Housing/homelessness services % 660 3% Information, advice and personal social services 54 1% 33 64% Legal services & advocacy 40 1% 70 43% Migrant and refugee assistance 11 <1% 10 10% Residential aged care & nursing homes Services for the elderly Youth service and youth welfare services % % Other TOTAL 4, % 3,590 19% When asked if their organisation was able to meet demand for services, 54% of respondents disagreed (42%) or strongly disagreed (12%). 5
151 Figure 1.3 Service targeting When demand for services outstrips the capacity to supply these services, many organisations will implement tighter targeting measures as a way of limiting this demand, and utilising constrained resources in the most equitable manner. Governmental policy, through funding and other arrangements, can also require that organisations target their services more narrowly. With more tightly targeted service delivery aimed at rationing finite resources, many organisations will target according to need, and therefore experience increased complexity in service user needs. This increased complexity can have a significant impact on staff and organisational capacity if appropriate resources (for example adequate funding, available time, appropriately skilled staff) are not made available. Any change in service targeting is, therefore, an important gauge of both demand for services, and organisational resources relative to this demand. When asked if their organisation had targeted services more tightly than in the past, 73% of respondents agreed (65%) or strongly agreed (8%). 6
152 Figure 1.4 Organisations will often respond to increased demand and service delivery pressures by increasing the hours that their staff work. When asked if staff and volunteers had been required to work fewer hours than in the past, 68% of organisations disagreed (46%) or strongly disagreed (31%). Figure 1.5 7
153 Delivery Character of the workforce Paid staff In respondent organisations employed 651 paid staff (Full Time Equivalent), and engaged 774 volunteers (FTE). There were 120 volunteer board/ management committee members, and no paid board members. It is noteworthy that organisations of all sizes are governed primarily by volunteer boards. Staff hiring and leaving Respondent organisations reported that there was a net decrease of 250 Full Time Equivalent (FTE) employees working in respondent organisations during This represents a decrease of 38% on the total number of paid staff. Table 1.5: Staff hired and left Hired (FTE) Left (FTE) Difference (FTE) Administration Communications/ Media Finance Management Policy, research or advocacy Service delivery Other high skilled professional Other Total
154 Attracting and retaining staff Respondents were asked to indicate if a range of factors affected their organisation s ability to attract/ retain staff. Working hours and working conditions were the most frequently reported factors that helped attract or retain staff. Salaries were considered by 73% of organisations to make attracting/ retaining staff more difficult. Figure 1.6: Factors affecting attracting and retaining staff 9
155 Income and Expenditure Expenditure Organisations were asked to provide details of their expenditure. Salaries and wages constituted the majority of expenditure (54%) while service provision costs made up a quarter of expenditure (25%). Figure 1.7: Expenditure Income In total dollar amounts, all respondents received on average 29% of income from the Commonwealth government, 32% from the State government, and 19% from other sources (for example from investments or sale of assets) These are aggregate figures. The disaggregate figures contain considerable variance. 10
156 Figure 1.8: Sources of income The majority of respondent organisations reported that their primary source of funding was their State government (40%) or the Commonwealth government (30%). While most organisations reported that their funding was ongoing/recurrent, this varied by funding source. Table 1.6: Funding Sources Funding source Organisation s primary source of funding % Funding is ongoing/recurrent % Commonwealth Government 30% 85% State/Territory Government 40% 75% Local Government 0% 0% Client Fees 5% 100% Donations 15% 67% Corporate 5% 0% Other 5% 100% Indexation Organisations funding, even when ongoing or recurrent, is not always consistently or adequately indexed to meet the annually increasing costs of service provision. The Consumer Price Index (CPI) increased by 4.5% in the survey period 23. The Labour Price Index over the same period increased by 3.9% 24. However, respondent organisations reported that Commonwealth government funding was indexed, on average, at 1.4%. State government funding was indexed at 3.2%, and local government funding was indexed 23 Australian Bureau of Statistics (ABS) Consumer Price Index, Australia, (ABS cat. no ) 24 Australian Bureau of Statistics (ABS) Labour Price Index, Australia, Jun 2009 (ABS cat. no ) 11
157 at 0%. Almost a third of organisations (29%) reported that they received no indexation on their government funding. Within these responses there was great variation, highlighting the inconsistent approach to indexing even between departments within the same government. Sector capacity issues & relationships with government A number of other factors affect the viability of community sector organisations including the adequacy of funding levels and the effect of government contractual requirements, and the tax status of organisations. These factors impact upon an organisation s ability to recruit and retain staff, to effectively deliver services and work with other organisations, and balance service delivery demands, advocacy and administrative requirements. Government funding and contractual requirements Eighty four per cent of respondents disagreed with the statement that Government funding covers the true cost of delivering contracted services. Only 4% expressed the view that funding was adequate, and 12% neither agreed nor disagreed. Figure 1.9: Adequacy of government funding: proportion agree/disagree with statement: Government funding covers the true cost of delivering contracted services As discussed above, 70% of organisations receive their primary source of funding from the Commonwealth, or State Government. Twenty five percent of respondents indicated that State funding is not ongoing/recurrent, and 15% that Commonwealth government funding is not ongoing/recurrent. 12
158 Many organisations are, therefore, subject to funding arrangements that do not guarantee recurrent or ongoing funding. This limits organisational capacity to plan adequately for the future, especially in terms of service provision and staffing. Seventy three per cent of respondents agreed that our funding agreements did not allow us to plan adequately for our organisation s future. Figure 1.10: our funding agreements did not allow us to plan adequately for our organisation s future Government funders have an obligation to ensure that services delivered by welfare and community organisations are a high quality and cost effective use of public funds. Contractual requirements made of service providers can, however, risk stipulating a disproportionately onerous level of reporting, or undermine the innovative potential of organisations. These risks are compounded for organisations receiving funding from multiple sources. Thirty eight percent of organisations agreed that contract requirements and red tape adversely affected organisations capacity to deliver services. 13
159 Figure 1.11: Contract requirements and red tape adversely affected organisation s capacity to deliver services. Twenty seven percent of organisations agreed that government contracts supported our organisation s capacity for innovation. Figure 1.12 government contracts supported our organisation s capacity for innovation. Twenty seven percent of all respondents agreed or strongly agreed that Federal Government initiatives or policies affecting our organisation were mostly positive. 14
160 Figure 1.13 Federal Government initiatives or policies affecting our organisation were mostly positive Thirty five percent of organisations disagreed or strongly disagreed that State or Territory government initiatives or policies affecting our organisation were mostly positive. Figure 1.14: State or Territory government initiatives or policies affecting our organisation were mostly positive. Organisations from New South Wales were least likely to agree with this statement (22%), while organisations from the Northern Territory were most likely to agree or strongly agree (41%). 15
161 Figure 1.15: State or Territory government initiatives or policies affecting our organisation were mostly positive (by state/territory) The advocacy role of community organisations A majority of respondents (65%) indicated that they were able to speak publicly about issues affecting their clients. Only 12% disagreed and another 23% neither agreed nor disagreed. Figure 1.16: Our organisation is able to speak publicly about the issues facing our clients 16
162 Tax Status The tax concessions available to community service organisations depend on the purposes and activities of specific organisations and how the Australian Taxation Office and State Government entities interpret the law governing charities and related organisations. Status as a Public Benevolent Institution (PBI) attracts particularly generous concessions, including exemptions from Fringe Benefits Tax (FBT). Status as a Deductible Gift Recipient (DGR) not only makes gifting to these organisations attractive but is a pre condition for funding by most philanthropic bodies. Nationally, survey respondents were asked to indicate if they were an Income Tax Exempt Charity (ITEC), Deductible Gift Recipient (DGR), Public Benevolent Institution (PBI) or any combination of these. The largest percentage of respondents indicated that they had ITEC, DGR and PBI status. Figure 1.17: Tax status (nationally) 17
163 Proudly supported by Australian Council of Social Service (ACOSS) Level 2, 619 Elizabeth Street, Redfern NSW 2016 Locked Bag 4777, Strawberry Hills NSW 2012 Phone: Fax: info@acoss.org.au Internet: 18

164 ACOSS Paper Australian Community Sector Survey Report 2010 Volume 4 Victoria
165 First published in 2010 by the Australian Council of Social Service Locked Bag 4777 Strawberry Hills, NSW, 2012 Australia Ph Fax Website: ISSN: ISBN: Australian Council of Social Service, This publication is copyright. Apart from fair dealing for the purpose of private study, research, criticism, or review, as permitted under the Copyright Act, no part may be reproduced by any process without written permission. Enquiries should be addressed to the Publications Officer, Australian Council of Social Service. Copies are available from the address above. 1
166 Victoria Survey Results Demand Service coverage Organisations operating across the state made up 13% of all respondents. Twelve percent of organisations operated in a regional centre, 21% in an inner metropolitan area, and 23% in another metropolitan area. Seven per cent of organisations operated nationally, 15% in a rural centre, and 4% in a remote area. Figure 1.1 Service users As Table 1.1 shows, specific groups within the Australian population are over represented as users of community and welfare services. 1
167 Table 1.1: Service users by population group Population group as a percentage of the Australian population Population group as a percentage of service users Ratio of column one to column two Population group People with a disability 20% % 1.8 Indigenous 2.3% 2 6.9% 3.0 Jobless 34.5% % 1.3 Culturally and linguistically diverse background 21% % 1.5 Single parents 2.4% % 10.1 Women 50% % 1.2 Not Australian citizens 4.6% 7 8.3% 1.8 The overrepresentation of almost every population group listed in Table 1.1 is an indication of the importance of community and welfare services in the lives of low income and disadvantaged groups within the community. Single parents are 10.1 times more likely to use community and welfare services than their representation in the general community would suggest. Compared with other family types, single parent families are considered to be in greater need of support services in areas such as income, housing, employment, and social participation 8. Government pensions and allowances were the principal source of income for 61% of single parent families, the majority of which are headed by women (87%) 9. As the number of single parent households continues to increase, a greater number of children are likely to spend at least some of their childhood in a single parent household, and many parents will experience sole parenting. Indigenous people are 3 times more likely to use community and welfare services than their representation in the general community would suggest. The health and welfare outcomes for Indigenous Australians continue to be lower than that of non Indigenous Australians. For example, Indigenous Australians are more than twice as likely as non Indigenous Australians to need help with core daily activities because of disability 10. Aboriginal and Torres Strait Islander people are over represented in the homeless population, making up 9% of homeless people Australian Bureau of Statistics (ABS) (2003), Disability, Ageing and Carers, Australia: Summary of Findings, 2003, ABS Catalogue No Australian Bureau of Statistics (ABS) (2006),2006 Census of Population and Housing Australia, ABS Catalogue No This figure is derived from ABS, Labour Force, March Proportion of people who speak a language other than English at home, derived from the ABS Census Quick Stats Derived from Australian Bureau of Statistics (ABS) (2007) Australian Social Trends, 2007, ABS Catalogue No Australian Bureau of Statistics (ABS) (2006),2006 Census of Population and Housing Australia, ABS Catalogue No Derived from Australian Bureau of Statistics (ABS) (2006) Year Book Australia 2006, ABS Catalogue No Australian Bureau of Statistics (ABS) (2007) Australian Social Trends, 2007, ABS Catalogue No Ibid. 10 Australian Institute of Health and Welfare (AIHW) (2009) Australia s Welfare 2009, p Australian Bureau of Statistics (ABS) (2006) Counting the homeless 2
168 For many people accessing welfare and community services, social security payments are their primary source of income. Table 1.2 illustrates the average percentage of recipients of different allowances and pensions accessing services. Table 1.2: Service users income support recipients Percentage of recipients in the Australian Average percentage of Ratio of representation in population to service Payment type population 12 service users users Aged pension 10% % 1.6 Parenting payment (Single) 2% % 10.2 Carer payment (Adult & 2% 15 Child) 5.1% 2.6 Newstart allowance 3% % 5.8 Youth allowance 2% % 7.3 Other pension 18 4% % 6.4 Other allowance % % 41.7 As in Table 1.2, single parents are significantly overrepresented as services users. The other pension category includes the Disability Support Pension. As recipients of every social security payment listed are overrepresented, the importance of welfare and community services to low income people is again emphasised. Other services and supports Survey respondents were asked to identify which services or supports (other than those delivered by their organisation) people accessing their services needed but did not have adequate access to. Family services, and Child welfare, child services, and day care services were identified as being a high or medium unmet need by 69% of respondents. At 68%, Housing and homelessness and Financial and material support were also identified as being high or medium unmet need. Figure 1.2: Services or supports people accessing community and welfare services need but do not currently have adequate access to high and medium need 12 Data from June Department of Families, Housing, Community Services and Indigenous Affairs (2009) FaHCSIA Annual Report Department of Work, Education, Employment and Workplace relations (DEEWR) (2009) DEEWR Annual Report Department of Families, Housing, Community Services and Indigenous Affairs (2009) FaHCSIA Annual Report Department of Work, Education, Employment and Workplace relations (DEEWR) (2009) DEEWR Annual Report Ibid 18 (including the Disability Support Pension, Double Orphan Pension, Widow B Pension, Wife Pension (Age),and the Wife Pension (Disability Support Pension)) 19 Department of Families, Housing, Community Services and Indigenous Affairs (2009) FaHCSIA Annual Report (including the Widow, Partner, Mobility Allowance, and Sickness allowances) 21 Ibid 3
169 Demand for services In respondent organisations provided services on 733,069 occasions, a 3% increase on the 713,914 instances of service provision in Table 1.3: Service provision and Increase (%) Child welfare, child services, and day care 2,518 2,408 5% Disability services 494, ,167 0% Domestic violence and sexual assault 7,833 6,805 15% Emergency & disaster relief % Employment/training services 36,990 31,166 19% Family services 7,570 7,487 1% Financial and material support 18,335 16,904 8% Health services 69,672 64,774 8% Housing/homelessness services % Information, advice and personal social services 24,389 20,614 18% Legal services & advocacy 4,108 3,930 5% Migrant and refugee assistance 10,380 13,430 23% Residential aged care & nursing homes 1,535 1,535 0% Services for the elderly % Youth service and youth welfare services 42,806 42,265 1% Other 11,375 9,500 20% TOTAL 733, ,941 3% In respondent agencies turned away people who were eligible for their services on 102,111 occasions. This is the equivalent of one in ten people being turned away. Of people turned away, 86% were seeking financial and material support, and 10% were seeking housing and homelessness services. Aggregate turn away figures across all services increased 21% from the 313,822 times people were turned away by the same services in
170 The disaggregate figures in Table 1.4 should be used with caution as the response rate to this question was less than 30. Table 1.4 Turn away rates Number of times people were turned away Percentage as total turn away Number of times people were turned away Difference and % Child welfare, child services, and day care 729 <1% 1,105 34% Disability services 329 <1% % Domestic violence and sexual assault 15 <1% 21 29% Emergency & disaster relief 5 <1% 10 50% Employment/training services 0 <1% 0 Family services 1 <1% 2 50% Financial and material support 88,060 86% 72,053 22% Health services 605 <1% 605 Housing/homelessness services 10,005 10% 8,000 25% Information, advice and personal social services 1,143 1% 1,049 9% Legal services & advocacy 1,170 1% 1,192 2% Migrant and refugee assistance 25 <1% 0 Residential aged care & nursing homes 0 <1% 5 100% Services for the elderly 24 <1% 39 38% Youth service and youth welfare services 0 <1% 2 100% Other 0 <1% 0 TOTAL 102, % 84,379 21% When asked if their organisation was able to meet demand for services, 56% of respondents disagreed (41%) or strongly disagreed (15%). 5
171 Figure 1.3 Service targeting When demand for services outstrips the capacity to supply these services, many organisations will implement tighter targeting measures as a way of limiting this demand, and utilising constrained resources in the most equitable manner. Governmental policy, through funding and other arrangements, can also require that organisations target their services more narrowly. With more tightly targeted service delivery aimed at rationing finite resources, many organisations will target according to need, and therefore experience increased complexity in service user needs. This increased complexity can have a significant impact on staff and organisational capacity if appropriate resources (for example adequate funding, available time, appropriately skilled staff) are not made available. Any change in service targeting is, therefore, an important gauge of both demand for services, and organisational resources relative to this demand. When asked if their organisation had targeted services more tightly than in the past, 50% of respondents agreed (41%) or strongly agreed (9%). 6
172 Figure 1.4 Organisations will often respond to increased demand and service delivery pressures by increasing the hours that their staff work. When asked if staff and volunteers had been required to work fewer hours than in the past, 76% of organisations disagreed (38%) or strongly disagreed (38%). Figure 1.5 7
173 Delivery Character of the workforce Paid staff In respondent organisations employed 4,299 paid staff (Full Time Equivalent), and engaged 2,576 volunteers (FTE). There were 323 volunteer board/ management committee members, and 18 paid board members. It is noteworthy that organisations of all sizes are governed primarily by volunteer boards. Staff hiring and leaving Respondent organisations reported that there was a net increase of 538 Full Time Equivalent (FTE) employees working in respondent organisations during This represents an increase of 9% on the total number of paid staff. Table 1.5: Staff hired and left Hired (FTE) Left (FTE) Difference (FTE) Administration Communications/ Media Finance Management Policy, research or advocacy Service delivery Other high skilled professional Other Total
174 Staff turnover Average staff turnover across respondent agencies was equivalent to 9%. Attracting and retaining staff Respondents were asked to indicate if a range of factors affected their organisation s ability to attract/ retain staff. Working hours and working conditions were the most frequently reported factors that helped attract or retain staff. Salaries were considered by 68% of organisations to make attracting/ retaining staff more difficult. Figure 1.6: Factors affecting attracting and retaining staff 9
175 Income and Expenditure Expenditure Organisations were asked to provide details of their expenditure. Salaries and wages constituted the majority of expenditure (54%) while service provision costs made up a quarter of expenditure (25%). Figure 1.7: Expenditure Income In total dollar amounts, all respondents received on average 29% of income from the Commonwealth government, 32% from the State government, and 19% from other sources (for example from investments or sale of assets) These are aggregate figures. The disaggregate figures contain considerable variance. 10
176 Figure 1.8: Sources of income The majority of respondent organisations reported that their primary source of funding was the State government (34%) or the Commonwealth government (26%). While most organisations reported that their funding was ongoing/recurrent, this varied by funding source. Table 1.6: Funding Sources Funding source Organisation s primary source of funding % Funding is ongoing/recurrent % Commonwealth Government 26% 100% State/Territory Government 34% 100% Local Government 11% 86% Client Fees 11% 100% Donations 10% 33% Corporate 2% 0% Other 6% 75% Indexation Organisations funding, even when ongoing or recurrent, is not always consistently or adequately indexed to meet the annually increasing costs of service provision. The Consumer Price Index (CPI) increased by 4.5% in the survey period 23. The Labour Price Index over the same period increased by 3.9% Australian Bureau of Statistics (ABS) Consumer Price Index, Australia, (ABS cat. no ) 24 Australian Bureau of Statistics (ABS) Labour Price Index, Australia, Jun 2009 (ABS cat. no ) 11
177 However, respondent organisations reported that Commonwealth government funding was indexed, on average, at 1.8%. State government funding was indexed at 3%, and local government funding was indexed at 0.5%. Within these responses there was great variation, highlighting the inconsistent approach to indexing even between departments within the same government. Sector capacity issues & relationships with government A number of other factors affect the viability of community sector organisations including the adequacy of funding levels and the effect of government contractual requirements, and the tax status of organisations. These factors impact upon an organisation s ability to recruit and retain staff, to effectively deliver services and work with other organisations, and balance service delivery demands, advocacy and administrative requirements. Government funding and contractual requirements Eighty three per cent of respondents disagreed with the statement that Government funding covers the true cost of delivering contracted services. Only 8% expressed the view that funding was adequate, and 10% neither agreed nor disagreed. Figure 1.9: Adequacy of government funding: proportion agree/disagree with statement: Government funding covers the true cost of delivering contracted services Many organisations are subject to funding arrangements that do not guarantee recurrent or ongoing funding. This limits organisational capacity to plan adequately for the future, especially in terms of service provision 12
178 and staffing. Fifty one per cent of respondents agreed that our funding agreements did not allow us to plan adequately for our organisation s future. Figure 1.10: our funding agreements did not allow us to plan adequately for our organisation s future Government funders have an obligation to ensure that services delivered by welfare and community organisations are a high quality and cost effective use of public funds. Contractual requirements made of service providers can, however, risk stipulating a disproportionately onerous level of reporting, or undermine the innovative potential of organisations. These risks are compounded for organisations receiving funding from multiple sources. Forty five percent of organisations agreed that contract requirements and red tape adversely affected organisations capacity to deliver services. 13
179 Figure 1.11: Contract requirements and red tape adversely affected organisation s capacity to deliver services. Twenty eight percent of organisations agreed that government contracts supported our organisation s capacity for innovation. Figure 1.12 government contracts supported our organisation s capacity for innovation. Forty one percent of all respondents agreed or strongly agreed that Federal Government initiatives or policies affecting our organisation were mostly positive. 14
180 Figure 1.13 Federal Government initiatives or policies affecting our organisation were mostly positive Thirty eight percent of organisations agreed that State or Territory government initiatives or policies affecting our organisation were mostly positive. Figure 1.14: State or Territory government initiatives or policies affecting our organisation were mostly positive. Organisations from New South Wales were least likely to agree with this statement (22%), while organisations from the Northern Territory were most likely to agree or strongly agree (41%). 15
181 Figure 1.15: State or Territory government initiatives or policies affecting our organisation were mostly positive (by state/territory) The advocacy role of community organisations A majority of respondents (69%) indicated that they were able to speak publicly about issues affecting their clients. Only 9% disagreed and another 22% neither agreed nor disagreed. Figure 1.16: Our organisation is able to speak publicly about the issues facing our clients 16
182 Tax Status The tax concessions available to community service organisations depend on the purposes and activities of specific organisations and how the Australian Taxation Office and State Government entities interpret the law governing charities and related organisations. Status as a Public Benevolent Institution (PBI) attracts particularly generous concessions, including exemptions from Fringe Benefits Tax (FBT). Status as a Deductible Gift Recipient (DGR) not only makes gifting to these organisations attractive but is a pre condition for funding by most philanthropic bodies. Survey respondents were asked to indicate if they were an Income Tax Exempt Charity (ITEC), Deductible Gift Recipient (DGR), Public Benevolent Institution (PBI) or any combination of these. The largest percentage of respondents indicated that they had ITEC, DGR and PBI status. Figure 1.17: Tax status 17
183 18

184 Proudly supported by Australian Council of Social Service (ACOSS) Level 2, 619 Elizabeth Street, Redfern NSW 2016 Locked Bag 4777, Strawberry Hills NSW 2012 Phone: Fax: info@acoss.org.au Internet: 19
185 ACOSS Paper Australian Community Sector Survey Report 2010 Volume 5 Western Australia
186 First published in 2010 by the Australian Council of Social Service Locked Bag 4777 Strawberry Hills, NSW, 2012 Australia Ph Fax Website: ISSN: ISBN: Australian Council of Social Service, This publication is copyright. Apart from fair dealing for the purpose of private study, research, criticism, or review, as permitted under the Copyright Act, no part may be reproduced by any process without written permission. Enquiries should be addressed to the Publications Officer, Australian Council of Social Service. Copies are available from the address above. 1
187 Demand Western Australia Survey Results Service coverage Organisations operating across the state made up 18% of all respondents. Nine percent of organisations operated in a regional centre, 18% in an inner metropolitan area, and 25% in another metropolitan area. Six per cent of organisations operated nationally, 9% in a rural centre, and 4% in a remote area. Figure 1.1 Service users As Table 1.1 shows, specific groups within the Australian population are over represented as users of community and welfare services. 1
188 Table 1.1: Service users by population group Population group as a percentage of the Australian population Population group as a percentage of service users Ratio of column one to column two Population group People with a disability 20% % 1.4 Indigenous 2.3% 2 8.7% 3.8 Jobless 34.5% % 1.5 Culturally and linguistically diverse background 21% % 0.9 Single parents 2.4% % 12.3 Women 50% % 1.3 Not Australian citizens 4.6% % 2.4 The overrepresentation of almost every population group listed in Table 1.1 is an indication of the importance of community and welfare services in the lives of low income and disadvantaged groups within the community. Single parents are 12.3 times more likely to use community and welfare services than their representation in the general community would suggest. Compared with other family types, single parent families are considered to be in greater need of support services in areas such as income, housing, employment, and social participation 8. Government pensions and allowances were the principal source of income for 61% of single parent families, the majority of which are headed by women (87%) 9. As the number of single parent households continues to increase, a greater number of children are likely to spend at least some of their childhood in a single parent household, and many parents will experience sole parenting. Indigenous people are 3.8 times more likely to use community and welfare services than their representation in the general community would suggest. The health and welfare outcomes for Indigenous Australians continue to be lower than that of non Indigenous Australians. For example, Indigenous Australians are more than twice as likely as non Indigenous Australians to need help with core daily activities because of disability 10. Aboriginal and Torres Strait Islander people are over represented in the homeless population, making up 9% of homeless people Australian Bureau of Statistics (ABS) (2003), Disability, Ageing and Carers, Australia: Summary of Findings, 2003, ABS Catalogue No Australian Bureau of Statistics (ABS) (2006),2006 Census of Population and Housing Australia, ABS Catalogue No This figure is derived from ABS, Labour Force, March Proportion of people who speak a language other than English at home, derived from the ABS Census Quick Stats Derived from Australian Bureau of Statistics (ABS) (2007) Australian Social Trends, 2007, ABS Catalogue No Australian Bureau of Statistics (ABS) (2006),2006 Census of Population and Housing Australia, ABS Catalogue No Derived from Australian Bureau of Statistics (ABS) (2006) Year Book Australia 2006, ABS Catalogue No Australian Bureau of Statistics (ABS) (2007) Australian Social Trends, 2007, ABS Catalogue No Ibid. 10 Australian Institute of Health and Welfare (AIHW) (2009) Australia s Welfare 2009, p Australian Bureau of Statistics (ABS) (2006) Counting the homeless 2
189 For many people accessing welfare and community services, social security payments are their primary source of income. Table 1.2 illustrates the average percentage of recipients of different allowances and pensions accessing services. Table 1.2: Service users income support recipients Percentage of recipients in the Australian Average percentage of Ratio of representation in population to service Payment type population 12 service users users Aged pension 10% % 3.7 Parenting payment (Single) 2% % 10.5 Carer payment (Adult & 2% 15 Child) 2.7% 1.3 Newstart allowance 3% % 8.9 Youth allowance 2% % 14.3 Other pension 18 4% % 7.8 Other allowance % % 16.7 As in Table 1.2, single parents are significantly overrepresented as services users. The other pension category includes the Disability Support Pension. As recipients of every social security payment listed are overrepresented, the importance of welfare and community services to low income people is again emphasised. Other services and supports Survey respondents were asked to identify which services or supports (other than those delivered by their organisation) people accessing their services needed but did not have adequate access to. Housing and homelessness services were identified as being a high or medium unmet need by 77% of respondents. Financial and material support (75%), Legal services and advocacy and Health services (72%) were also identified as being high or medium unmet need. Figure 1.2: Services or supports people accessing community and welfare services need but do not currently have adequate access to high and medium need 12 Data from June Department of Families, Housing, Community Services and Indigenous Affairs (2009) FaHCSIA Annual Report Department of Work, Education, Employment and Workplace relations (DEEWR) (2009) DEEWR Annual Report Department of Families, Housing, Community Services and Indigenous Affairs (2009) FaHCSIA Annual Report Department of Work, Education, Employment and Workplace relations (DEEWR) (2009) DEEWR Annual Report Ibid 18 (including the Disability Support Pension, Double Orphan Pension, Widow B Pension, Wife Pension (Age),and the Wife Pension (Disability Support Pension)) 19 Department of Families, Housing, Community Services and Indigenous Affairs (2009) FaHCSIA Annual Report (including the Widow, Partner, Mobility Allowance, and Sickness allowances) 21 Ibid 3
190 Demand for services In respondent organisations provided services on 173,321 occasions, a 6% increase on the 163,418 instances of service provision in Table 1.3: Service provision and Increase (%) Child welfare, child services, and day care 19,985 19,944 <1% Disability services 22,262 16,604 34% Domestic violence and sexual assault 2,580 2,633 2% Emergency & disaster relief % Employment/training services 1,955 1,955 0% Family services 6,590 6,692 2% Financial and material support 8,254 7,923 4% Health services 29,577 27,406 8% Housing/homelessness services % Information, advice and personal social services 20,093 19,743 2% Legal services & advocacy 7,360 6,297 17% Migrant and refugee assistance % Residential aged care & nursing homes % Services for the elderly 50,284 50,023 1% Youth service and youth welfare services % Other 2,644 2,908 9% TOTAL 173, ,418 6% In respondent agencies turned away people who were eligible for their services on 6,659 occasions. This is the equivalent of one in 25 people being turned away. Of people turned away, 65% were seeking legal services & advocacy. Aggregate turn away figures across all services decreased 13% from the 7,670 times people were turned away by the same services in
191 It should be noted that due to relatively small sample size, the figures in the table below are likely to underestimate turn away rates across the community and welfare services. Percentages should be interpreted with caution. Table 1.4 Turn away rates Number of times people were turned away Percentage as total turn away Number of times people were turned away Difference and % Child welfare, child services, and day care Disability services 30 <1% 30 <1% Domestic violence and sexual assault 200 3% % Emergency & disaster relief 100 2% 100 <1% Employment/training services 110 2% 120 8% Family services 50 1% 50 <1% Financial and material support 100 2% 100 <1% Health services 50 1% 50 <1% Housing/homelessness services % % Information, advice and personal social services 352 5% % Legal services & advocacy 4,316 65% 5,222 17% Migrant and refugee assistance 30 <1% 30 <1% Residential aged care & nursing homes 5 <1% 5 <1% Services for the elderly 75 1% 75 <1% Youth service and youth welfare services 225 3% 225 <1% Other 306 5% 306 <1% TOTAL 6, % 7,670 13% When asked if their organisation was able to meet demand for services, 45% of respondents disagreed (27%) or strongly disagreed (18%). 5
192 Figure 1.3 Service targeting When demand for services outstrips the capacity to supply these services, many organisations will implement tighter targeting measures as a way of limiting this demand, and utilising constrained resources in the most equitable manner. Governmental policy, through funding and other arrangements, can also require that organisations target their services more narrowly. With more tightly targeted service delivery aimed at rationing finite resources, many organisations will target according to need, and therefore experience increased complexity in service user needs. This increased complexity can have a significant impact on staff and organisational capacity if appropriate resources (for example adequate funding, available time, appropriately skilled staff) are not made available. Any change in service targeting is, therefore, an important gauge of both demand for services, and organisational resources relative to this demand. When asked if their organisation had targeted services more tightly than in the past, 56% of respondents agreed (49%) or strongly agreed (7%). 6
193 Figure 1.4 Organisations will often respond to increased demand and service delivery pressures by increasing the hours that their staff work. When asked if staff and volunteers had been required to work fewer hours than in the past, 80% of organisations disagreed (62%) or strongly disagreed (18%). Figure 1.5 7
194 Delivery Character of the workforce Paid staff In respondent organisations employed 606 paid staff (Full Time Equivalent), and engaged 230 volunteers (FTE). There were 156 volunteer board/ management committee members, and 20 paid board members. It is noteworthy that organisations of all sizes are governed primarily by volunteer boards. Staff hiring and leaving Respondent organisations reported that there was a net increase of 70 Full Time Equivalent (FTE) employees working in respondent organisations during This represents an increase of 12% on the total number of paid staff. Table 1.5: Staff hired and left Hired (FTE) Left (FTE) Difference (FTE) Administration Communications/ Media Finance Management Policy, research or advocacy Service delivery Other high skilled professional Other Total
195 Staff turnover Average staff turnover across respondent agencies was equivalent to 18%. Attracting and retaining staff Respondents were asked to indicate if a range of factors affected their organisation s ability to attract/ retain staff. Working hours and working conditions were the most frequently reported factors that helped attract or retain staff. Salaries were considered by 76% of organisations to make attracting/ retaining staff more difficult. Figure 1.6: Factors affecting attracting and retaining staff 9
196 Income and Expenditure Expenditure Organisations were asked to provide details of their expenditure. Salaries and wages constituted the majority of expenditure (54%) while service provision costs made up a quarter of expenditure (25%). Figure 1.7: Expenditure Income In total dollar amounts, all respondents received on average 29% of income from the Commonwealth government, 32% from the State government, and 19% from other sources (for example from investments or sale of assets) These are aggregate figures. The disaggregate figures contain considerable variance. 10
 or the Commonwealth government (23%).")
197 Figure 1.8: Sources of income Nationally, the majority of respondent organisations reported that their primary source of funding was their State/Territory government (40%) or the Commonwealth government (23%). While most organisations reported that their funding was ongoing/recurrent, this varied by funding source, with Commonwealth funding most likely to be ongoing/recurrent, and corporate funding least likely to be ongoing/recurrent (36%). Table 1.6: Funding Sources (nationally) Funding source Organisation s primary source of funding % Funding is ongoing/recurrent % Commonwealth Government 23% 72% State/Territory Government 40% 80% Local Government 6% 52% Client Fees 10% 68% Donations 10% 44% Corporate 3% 36% Other 8% 77% Indexation Organisations funding, even when ongoing or recurrent, is not always consistently or adequately indexed to meet the annually increasing costs of service provision. The Consumer Price Index (CPI) increased by 4.5% in the survey period 23. The Labour Price Index over the same period increased by 3.9% Australian Bureau of Statistics (ABS) Consumer Price Index, Australia, (ABS cat. no ) 24 Australian Bureau of Statistics (ABS) Labour Price Index, Australia, Jun 2009 (ABS cat. no ) 11
198 However, respondent organisations reported that Commonwealth government funding was indexed, on average, at 2.2%. State government funding was indexed at 2.9%, and local government funding was indexed at 0%. Within these responses there was great variation, highlighting the inconsistent approach to indexing even between departments within the same government. Sector capacity issues & relationships with government A number of other factors affect the viability of community sector organisations including the adequacy of funding levels and the effect of government contractual requirements, and the tax status of organisations. These factors impact upon an organisation s ability to recruit and retain staff, to effectively deliver services and work with other organisations, and balance service delivery demands, advocacy and administrative requirements. Government funding and contractual requirements Eighty three per cent of respondents disagreed with the statement that Government funding covers the true cost of delivering contracted services. Only 15% expressed the view that funding was adequate, and 3% neither agreed nor disagreed. Figure 1.9: Adequacy of government funding: proportion agree/disagree with statement: Government funding covers the true cost of delivering contracted services As discussed above, 69% of organisations receive their primary source of funding from the Commonwealth, State, or Local Government. Nationally, 28% of respondents indicated that Commonwealth Government 12
199 funding is not ongoing/recurrent, 20% that State funding is not ongoing/recurrent, and 48% that Local government funding is not ongoing/recurrent. Many organisations are, therefore, subject to funding arrangements that do not guarantee recurrent or ongoing funding. This limits organisational capacity to plan adequately for the future, especially in terms of service provision and staffing. Sixty per cent of respondents agreed that our funding agreements did not allow us to plan adequately for our organisation s future. Figure 1.10: our funding agreements did not allow us to plan adequately for our organisation s future Government funders have an obligation to ensure that services delivered by welfare and community organisations are a high quality and cost effective use of public funds. Contractual requirements made of service providers can, however, risk stipulating a disproportionately onerous level of reporting, or undermine the innovative potential of organisations. These risks are compounded for organisations receiving funding from multiple sources. Fifty percent of organisations agreed that contract requirements and red tape adversely affected organisations capacity to deliver services. 13
200 Figure 1.11: Contract requirements and red tape adversely affected organisation s capacity to deliver services. Fifty four percent of organisations neither agreed nor disagreed that government contracts supported our organisation s capacity for innovation. Figure 1.12 government contracts supported our organisation s capacity for innovation. Thirty eight percent of all respondents agreed or strongly agreed that Federal Government initiatives or policies affecting our organisation were mostly positive. 14
201 Figure 1.13 Federal Government initiatives or policies affecting our organisation were mostly positive Thirty nine percent of organisations agreed that State or Territory government initiatives or policies affecting our organisation were mostly positive. Figure 1.14: State or Territory government initiatives or policies affecting our organisation were mostly positive. Organisations from New South Wales were least likely to agree with this statement (22%), while organisations from the Northern Territory were most likely to agree or strongly agree (41%). 15
202 Figure 1.15: State or Territory government initiatives or policies affecting our organisation were mostly positive (by state/territory) The advocacy role of community organisations A majority of respondents (78%) indicated that they were able to speak publicly about issues affecting their clients. Only 5% disagreed and another 18% neither agreed nor disagreed. Figure 1.16: Our organisation is able to speak publicly about the issues facing our clients 16

203 Tax Status The tax concessions available to community service organisations depend on the purposes and activities of specific organisations and how the Australian Taxation Office and State Government entities interpret the law governing charities and related organisations. Status as a Public Benevolent Institution (PBI) attracts particularly generous concessions, including exemptions from Fringe Benefits Tax (FBT). Status as a Deductible Gift Recipient (DGR) not only makes gifting to these organisations attractive but is a pre condition for funding by most philanthropic bodies. Survey respondents were asked to indicate if they were an Income Tax Exempt Charity (ITEC), Deductible Gift Recipient (DGR), Public Benevolent Institution (PBI) or any combination of these. The largest percentage of respondents indicated that they had ITEC, DGR and PBI status. Figure 1.17: Tax status (nationally) 17

204 Proudly supported by Australian Council of Social Service (ACOSS) Level 2, 619 Elizabeth Street, Redfern NSW 2016 Locked Bag 4777, Strawberry Hills NSW 2012 Phone: Fax: info@acoss.org.au Internet: 18
Australian Community Sector Survey
 Australian Community Sector Survey ACOSS Paper 173 Volume 3 NEW SOUTH WALES 2011 CONTACT Australian Council of Social Service Locked Bag 4777, Strawberry Hills, NSW, 2012 T (02) 9310 6200 E info@acoss.org.au
Australian Community Sector Survey
 Australian Community Sector Survey ACOSS Paper 173 Volume 8 VICTORIA 2011 CONTACT Australian Council of Social Service Locked Bag 4777, Strawberry Hills, NSW, 2012 T (02) 9310 6200 E info@acoss.org.au
Beyond stereotypes. Myths and facts about people of working age who receive social security
 Beyond stereotypes Myths and facts about people of working age who receive social security ACOSS Paper 175 May 2011 CONTACT Australian Council of Social Service Locked Bag 4777, Strawberry Hills, NSW,
REPORT SERIES 2014 NATASHA CORTIS MEGAN BLAXLAND
 REPORT SERIES 2014 NATASHA CORTIS MEGAN BLAXLAND The state of the community service sector in New South Wales 2014 FINAL REPORT REPORT 4/2014 May 2014 For further information Dr Natasha Cortis +61 2 9385
Submission to the Senate Education, Employment and Workplace Relations References Committee Inquiry into the Adequacy of the Allowance Payment System
 Submission to the Senate Education, Employment and Workplace Relations References Committee Inquiry into the Adequacy of the Allowance Payment System for Jobseekers and Others AUGUST 2012 Business Council
Mission Australia Election Manifesto 2013
 Mission Australia Our vision is to see a fairer Australia by enabling people in need to find pathways to a better life. While the standard of living of many Australians has improved, the economic downturn
July Anne Hampshire Head of Research & Advocacy Level 9, 117 Clarence Street GPO Box Sydney NSW 2001
 Submission on the Exposure Draft: Tax and Superannuation Laws Amendment (2015 Measures No 4) Bill 2015: Limiting FBT concessions on salary packaged entertainment benefits July 2015 Anne Hampshire Head
Information you need to know about your
 Information you need to know about your Permanent Residential Aged Care Request for a Combined Assets and Income Assessment The Australian Government Department of Human Services or the Department of Veterans
Estimating Internet Access for Welfare Recipients in Australia
 3 Estimating Internet Access for Welfare Recipients in Australia Anne Daly School of Business and Government, University of Canberra Canberra ACT 2601, Australia E-mail: anne.daly@canberra.edu.au Rachel
Australian Council of Social Service. Partnerships for participation
 Australian Council of Social Service Partnerships for participation Submission to Minister for Employment Participation on reform of employment services ACOSS Paper 200 March, 2013 Partnerships for participation:
SOCIAL WELFARE STRATEGY
 SOCIAL WELFARE STRATEGY ACTU Congress September 1989 1. INTRODUCTION 1.1 The post 1983 Accord Process has enabled the union movement, through participation in government, to play a significant role in
FEDERAL BUDGET Initial ACOSS Analysis. ACOSS Paper 189
 FEDERAL BUDGET Initial ACOSS Analysis ACOSS Paper 189 May 2012 ACOSS gratefully acknowledges the contributions of Solange Frost, Jacqui Phillips and Sarah Toohey in the preparation of this paper. First
Re:think tax discussion paper
 Submission on the Re:think tax discussion paper Chapter 7: Not-for-profit sector About us Volunteering Australia (VA) 1 is the national peak body for volunteering working to advance volunteering in the
Snapshot: Anglicare NSW South, West & ACT - Central West NSW
 Snapshot: Anglicare NSW South, West & ACT - Central West NSW Introduction The Central West, Far West and Orana comprise a large regional and rural area of NSW. Bathurst, Orange, Dubbo and Broken Hill are
Comment on Draft Policy Outlines for New Model of Income Management
 Comment on Draft Policy Outlines for New Model of Income Management Submission to the Department of Families, Housing, Community Services and Indigenous Affairs June 2010 Contact: Jacqueline Phillips ANTaR
Re: Introducing Competition and Informed User Choice into Human Services: Reforms to Human Services Draft Report
 14 July 2017 Human Services inquiry Productivity Commission Via email Dear Commissioners, Re: Introducing Competition and Informed User Choice into Human Services: Reforms to Human Services Draft Report
2016/17 Pre-budget submission to the Queensland Government. A plan for social and economic wellbeing
 2016/17 Pre-budget submission to the Queensland Government A plan for social and economic wellbeing January 2016 About QCOSS The Queensland Council of Social Service (QCOSS) is the state-wide peak body
IMPORTANT REFERENCE CONTACT DETAILS
 IMPORTANT REFERENCE CONTACT DETAILS Australian Taxation Office (ATO) Unless otherwise specified, all phone numbers listed here are available from 8.00am to 6.00pm, days, except public holidays. When you
The State of Tasmania s Community Service Sector, 2015
 The State of Tasmania s Community Service Sector, 2015 Prepared for: Tasmanian Council of Social Service (TasCOSS) February 2016 Natasha Cortis, Megan Blaxland Acknowledgements The Research team would
Review of the early release of superannuation benefits
 Review of the early release of superannuation benefits The Treasury 12 February 2018 Telephone +61 2 6246 3788 Fax +61 2 6248 0639 Email mail@lawcouncil.asn.au GPO Box 1989, Canberra ACT 2601, DX 5719
Government can choose to reduce poverty and hardship by taking three steps:
 A roof over every head, a meal on every table. Government must raise the rate. Australia s social safety net is something most of us contribute to, and most of us benefit from, at different times in our
Employment Outlook for. Administration and Support Services
 Employment Outlook for Administration and Support Services Contents INTRODUCTION... 3 EMPLOYMENT GROWTH... 4 EMPLOYMENT PROSPECTS... 6 VACANCY TRENDS... 9 WORKFORCE AGEING... 11 EMPLOYMENT BY GENDER AND
Re: Inquiry into the Social Services Legislation Amendment (Youth Employment and Other Measures) Bill 2015 ( the Bill )
 Bill 2015 ( the Bill )") 10 June 2015 Committee Secretary Senate Standing Committee on Community Affairs PO Box 6100 Parliament House Canberra ACT 2600 Dear Committee Secretariat, Re: Inquiry into the Social Services Legislation
10 June 2015 Committee Secretary Senate Standing Committee on Community Affairs PO Box 6100 Parliament House Canberra ACT 2600 Dear Committee Secretariat, Re: Inquiry into the Social Services Legislation
INDIGENOUS DARWIN AND THE REST OF THE NORTHERN TERRITORY
 POPULATION STUDIES RESEARCH BRIEF ISSUE Number 2009026 School for Social and Policy Research 2008 Population Studies Group School for Social and Policy Research Charles Darwin University Northern Territory
2016 FEDERAL BUDGET HIGHLIGHTS
 2016 FEDERAL BUDGET HIGHLIGHTS Helping Canadians with low incomes receive the tax benefits they deserve The government will invest an additional $4M annually to expand the Community Volunteer Income Tax
Background paper for Ian Castles roundtable on tax and social security. 13/10/2011.
 Background paper for Ian Castles roundtable on tax and social security. 13/10/2011. INCOME SUPPORT TABLES Table 1: Program costs and recipient numbers, 2009 10 Sources: Annual Reports, 2009-10 for FaHCSIA,
Setting minimum wages in Australia
 Setting minimum wages in Australia Speech by Professor Ian Harper Chairman, AFPC Economic and Social Outlook 2006 Conference Thursday, 2 November 2006 at 4.15 pm Copland Theatre, Economics and Commerce
Submission to the Review of the Conditional Adjustment Payment
 28 August 2008 Submission to the Review of the Conditional Adjustment Payment "#$%&''&()$*+,,-''.,()(%&,'/0*1&%&0-23(4 Baptist Care Australia Catholic Health Australia Uniting Care Ageing NSW & ACT 5-6&-7(308-9()2&0&():;+2
ABORIGINAL LEGAL SERVICE OF WESTERN AUSTRALIA (INC.) SUBMISSION IN RESPONSE TO THE INTERIM REPORT OF THE REFERENCE GROUP ON WELFARE REFORM
 SUBMISSION IN RESPONSE TO THE INTERIM REPORT OF THE REFERENCE GROUP ON WELFARE REFORM") ABORIGINAL LEGAL SERVICE OF WESTERN AUSTRALIA (INC.) SUBMISSION IN RESPONSE TO THE INTERIM REPORT OF THE REFERENCE GROUP ON WELFARE REFORM AUGUST 2014 1 ABOUT THE ABORIGINAL LEGAL SERVICE OF WESTERN AUSTRALIA
ABORIGINAL LEGAL SERVICE OF WESTERN AUSTRALIA (INC.) SUBMISSION IN RESPONSE TO THE INTERIM REPORT OF THE REFERENCE GROUP ON WELFARE REFORM AUGUST 2014 1 ABOUT THE ABORIGINAL LEGAL SERVICE OF WESTERN AUSTRALIA
rebuilding futures State of our Community Report ACT Queanbeyan
 rebuilding futures State of our Community Report ACT Queanbeyan www.campbellpage.org.au Who are we? Who is Campbell Page? Campbell Page provides employment, rehabilitation, training, and community services
 Tenant Application Form Note: This form must be completed by each tenant wanting to reside in the property i.e. if 3 people are wanting to move in, then 3 forms must be completed. (Children not earning
The Kangaroo Island (DC) Region. Workforce Wizard Region Report
 Region. Workforce Wizard Region Report") Workforce Wizard Region Report Table of Contents Executive Summary 3 Population and Social Characteristics 4 Current Population 4 Age Groups 4 Key Populations 5 Aboriginal Australians 6 Disability and
Workforce Wizard Region Report Table of Contents Executive Summary 3 Population and Social Characteristics 4 Current Population 4 Age Groups 4 Key Populations 5 Aboriginal Australians 6 Disability and
Double Jeopardy: A Socio-demographic Profile of Homeless Jobseekers Aged 18-35
 I 200606666 Double Jeopardy: A Socio-demographic Profile of Homeless Jobseekers Aged 18-35 Many Grace, Louise Coventry and Nicole Wilson Being either homeless or unemployed jeopardises people's wellbeing.
Submission to the Senate Standing Committee on Economics Inquiry into Affordable Housing. March 2014
 Submission to the Senate Standing Committee on Economics Inquiry into Affordable Housing March 2014 Enquiries on this submission may be directed to: Executive Director: Marcia Williams ed@wchm.org.au PO
Accurium Federal Budget Report
 Accurium Federal Budget Report 2017-18 Fairness, security and opportunity On Tuesday 9 May 2017 the Treasurer, Scott Morrison, released the Government s 2017-18 Budget. After substantial changes affecting
Reference date for all information is June 30th 2008 Country chapter for OECD series Benefits and Wages (www.oecd.org/els/social/workincentives)
") AUSTRALIA 2008 Table of Contents Introduction... 1 1. Overview of the tax-benefit system... 2 2. Unemployment insurance... 3 3. Unemployment assistance... 3 4. Social assistance... 9 5. Housing benefits
AUSTRALIA 2008 Table of Contents Introduction... 1 1. Overview of the tax-benefit system... 2 2. Unemployment insurance... 3 3. Unemployment assistance... 3 4. Social assistance... 9 5. Housing benefits
Education Payment Rates
 Austudy ABSTUDY Pensioner Education Supplement Assitance for Isolated Children Crisis Payment 1 of 10 1 January 19 March 2012 Austudy To qualify for Austudy, a person must be undertaking qualifying study
!!!! " -*+''#!., #!!
 " " $ %&''( *+ &*+( + &+( -*+''. /0.%. % 1 1 2% 1$. ". Many Ways Home: a National Homelessness Strategy for Australia 2 4. ". &( 0. $ 4 5 5 5 5 4 2 6 2 7 8 5 ' 5 4+&+ ( 55 57 2 59 4: " 5; + 6 $ ' Many
Minister for Family and Community Services
 Home Newsroom Contact FaCS Search Minister for Family and Community Services Minister Assisting the Prime Minister for the Status of Women Senator the Hon Kay Patterson Home Biography Contact Details Media
Employment Outlook to November 2019
 Employment Outlook to November 2019 Based on the Department of Employment s 2015 employment projections Table of Contents Table of Contents... 1 Introduction... 2 Projected employment growth by industry...
Key strategic issues for the wider social development sector
 Key strategic issues for the wider social development sector Outline of what the Ministry considers to be the key strategic issues for the wider social development sector, at this time. 2 Overview The
The Nonprofit and Voluntary Sector in Manitoba, Saskatchewan and the Territories
 The Nonprofit and Voluntary Sector in Manitoba, Saskatchewan and the Regional Highlights of the National Survey of Nonprofit and Voluntary Organizations Author: Sid Frankel Imagine Canada, 2006 Copyright
TREASURY LAWS AMENDMENT (NATIONAL HOUSING AND HOMELESSNESS AGREEMENT) BILL 2017 SUBMISSION TO SENATE ECONOMICS LEGISLATION COMMITTEE
 BILL 2017 SUBMISSION TO SENATE ECONOMICS LEGISLATION COMMITTEE") TREASURY LAWS AMENDMENT (NATIONAL HOUSING AND HOMELESSNESS AGREEMENT) BILL 2017 SUBMISSION TO SENATE ECONOMICS LEGISLATION COMMITTEE Shelter Tasmania 18 th December, 2017 CONTACT: Pattie Chugg, Executive
TREASURY LAWS AMENDMENT (NATIONAL HOUSING AND HOMELESSNESS AGREEMENT) BILL 2017 SUBMISSION TO SENATE ECONOMICS LEGISLATION COMMITTEE Shelter Tasmania 18 th December, 2017 CONTACT: Pattie Chugg, Executive
2015 National Clubs Census
 2015 National Clubs Census Detailed Report FINAL August 2016 Contents Page Key Findings 3 Introduction 6 Approach 8 Limitations 10 Results 12 National Australian Capital Territory New South Wales Queensland
Quarterly Labour Market Report. December 2016
 Quarterly Labour Market Report December 2016 MB13809 Dec 2016 Ministry of Business, Innovation and Employment (MBIE) Hikina Whakatutuki - Lifting to make successful MBIE develops and delivers policy, services,
Supporting carers to work
 Supporting to work Qualitative research in support of employed There are 2.7 million in Australia who provide informal care to family, friends or neighbours. The care provided can improve the quality of
AUSTRALIA Overview of the system
 AUSTRALIA 2001 1. Overview of the system Australia has flat-rate, means-tested unemployment benefits. An administrative distinction is made between long-term and initial benefits, although this does not
Council of the European Union Brussels, 23 September 2015 (OR. en)
") Council of the European Union Brussels, 23 September 2015 (OR. en) 12079/15 SOC 520 EMPL 341 ECOFIN 722 POLG 139 NOTE From: To: Subject: The Social Protection Committee Permanent Representatives Committee
Council of the European Union Brussels, 23 September 2015 (OR. en) 12079/15 SOC 520 EMPL 341 ECOFIN 722 POLG 139 NOTE From: To: Subject: The Social Protection Committee Permanent Representatives Committee
Snapshot: The Samaritans Foundation Central Coast, Newcastle/Lake Macquarie, Hunter (incl. Port Stephens) and Mid-Coast
 and Mid-Coast") Snapshot: The Samaritans Foundation Central Coast, Newcastle/Lake Macquarie, Hunter (incl. Port Stephens) and Mid-Coast Introduction The Rental Affordability Snapshot is an annual national initiative of
Snapshot: The Samaritans Foundation Central Coast, Newcastle/Lake Macquarie, Hunter (incl. Port Stephens) and Mid-Coast Introduction The Rental Affordability Snapshot is an annual national initiative of
An Economic Portrait of Eastern Riverina
 An Economic Portrait of Eastern Riverina compared with NSW September 2013 The residents Working residents Economic indicators Industries The Eastern Riverina workforce The nature of local jobs The labour
The New South Wales Financial Inclusion Network state election platform
 The New South Wales Financial Inclusion Network 2019 state election platform Introduction This New South Wales election provides a real opportunity to address the state s extraordinary levels of financial
Employment Outlook for. Public Administration and Safety
 Employment Outlook for Contents INTRODUCTION... 3 EMPLOYMENT GROWTH... 4 EMPLOYMENT PROSPECTS... 5 VACANCY TRENDS... 8 WORKFORCE AGEING... 11 EMPLOYMENT BY GENDER AND FULL-TIME/PART-TIME... 13 HOURS WORKED...
Budget 2017: What it means for carers
 Budget 2017: What it means for carers Set out below is an overview of the key 2017-18 federal Budget measures that may affect carers. There may be other relevant measures that are not included in this
Submission to the Review of Energy Efficiency Programs for Low Income Households
 Submission to the Review of Energy Efficiency Programs for Low Income Households February 2014 Council of Social Service of NSW (NCOSS) 66 Albion Street, Surry Hills, 2010 Ph: 02 9211 2599, Fax: 9281 1968,
The Fleurieu & Kangaroo Island (State Govt) Region. Workforce Wizard Region Report
 Region. Workforce Wizard Region Report") The Fleurieu & Kangaroo Island (State Govt) Region Workforce Wizard Region Report Table of Contents Executive Summary 3 Population and Social Characteristics 4 Current Population 4 Age Groups 4 Key Populations
The Fleurieu & Kangaroo Island (State Govt) Region Workforce Wizard Region Report Table of Contents Executive Summary 3 Population and Social Characteristics 4 Current Population 4 Age Groups 4 Key Populations
FEDERAL BUDGET Initial ACOSS Analysis
 FEDERAL BUDGET 2011-12 Initial ACOSS Analysis May 2011 CONTACT Australian Council of Social Service Locked Bag 4777, Strawberry Hills, NSW, 2012 T (02) 9310 6200 E info@acoss.org.au www.acoss.org.au First
AUSTRALIA Overview of the tax-benefit system
 AUSTRALIA 2007 1. Overview of the tax-benefit system The Australian social security system is funded from general taxation revenue and not from employer or employee social security contributions. The system
Australian Hotels Association
 Australian Hotels Association Submission in relation to: Annual Wage Review 2013-14 Fair Work Commission GPO Box 1994 Melbourne VIC 3001 awr@fwa.gov.au 28 March 2014 Recommendation The AHA submits that
Indicators of Poverty and Disadvantage in Queensland
 Indicators of Poverty and Disadvantage in Queensland October 2013 Contents Introduction... 4 A framework to measure poverty and disadvantage... 4 How is the report structured?... 6 In summary - what do
STATEMENT FROM THE NATIONAL REFORM SUMMIT
 STATEMENT FROM THE NATIONAL REFORM SUMMIT Australia is a wealthy country that can have an even more prosperous future shared by everyone. We believe in sustainable economic growth and the creation of high-quality
Make Poverty History Manitoba 432 Ellice Avenue, Winnipeg MB, R3B 1Y4, (204) ext 1230
 ext 1230") Develop and implement a comprehensive poverty reduction plan with targets and timelines for reducing poverty (MPHM) has long called for a comprehensive provincial poverty reduction plan with targets and
Develop and implement a comprehensive poverty reduction plan with targets and timelines for reducing poverty (MPHM) has long called for a comprehensive provincial poverty reduction plan with targets and
Policy Brief. Canada s Labour Market Puts in a Strong Performance in The Canadian Chamber is committed to fostering.
 Canada s Labour Market Puts in a Strong Performance in 2012 Introduction Policy Brief Economic Policy Series February 2013 Canada s labour market ended 2012 on a high note with almost 100,000 net new jobs
Submission on the Productivity Commission s commissioned study. Economic Implications of an Ageing Australia
 Submission on the Productivity Commission s commissioned study Economic Implications of an Ageing Australia October 2004 1 About Volunteering Australia Volunteering Australia is the national peak body
Why is understanding our population forecasts important?
 % Population Growth per annum Population Why is understanding our population forecasts important? Understanding the ACT s population growth and its demographic trends, is fundamental to longterm strategic
The Limestone Coast (State Govt) Region. Workforce Wizard Region Report
 Region. Workforce Wizard Region Report") The Limestone Coast (State Govt) Region Workforce Wizard Region Report Table of Contents Executive Summary 3 Population and Social Characteristics 4 Current Population 4 Age Groups 4 Key Populations 5
The Limestone Coast (State Govt) Region Workforce Wizard Region Report Table of Contents Executive Summary 3 Population and Social Characteristics 4 Current Population 4 Age Groups 4 Key Populations 5
Perceptions of Welfare Research 2010
 Perceptions of Welfare Research 2010 - Prepared for - The Salvation Army - Prepared by - Roy Morgan Research Perceptions of Welfare Research INDEX 1. INTRODUCTION... 1 2. METHODOLOGY... 1 3. OUTLINE OF
Pre Budget Submission 2010:
 Pre Budget Submission 2010: Introduction: Respond! is Ireland's largest not for profit Housing Association. We seek to create a positive future for people by alleviating poverty and creating vibrant, socially
1. Fees, Charges and Refunds
 1. Fees, Charges and Refunds McDonald s Australia undertakes to provide course services as outlined in the Statement of Fees. 1.1. Fees and Charges Prior to enrolment, McDonald s Australia notifies employers
Quarterly Labour Market Report. February 2015
 Quarterly Labour Market Report February 2015 MB13090_1228 March 2015 Ministry of Business, Innovation and Employment (MBIE) Hikina Whakatutuki - Lifting to make successful MBIE develops and delivers policy,
Samaritans Regional Rental Affordability Snapshot. Central Coast, Newcastle/Lake Macquarie, Hunter (incl. Port Stephens) and Mid-Coast
 and Mid-Coast") Samaritans Regional Rental Affordability Snapshot Central Coast, Newcastle/Lake Macquarie, Hunter (incl. Port Stephens) and Mid-Coast 2018 Samaritans Regional Rental Affordability Snapshot Central Coast,
Samaritans Regional Rental Affordability Snapshot Central Coast, Newcastle/Lake Macquarie, Hunter (incl. Port Stephens) and Mid-Coast 2018 Samaritans Regional Rental Affordability Snapshot Central Coast,
Findings of the 2018 HILDA Statistical Report
 RESEARCH PAPER SERIES, 2018 19 31 JULY 2018 ISSN 2203-5249 Findings of the 2018 HILDA Statistical Report Geoff Gilfillan Statistics and Mapping Introduction The results of the 2018 Household, Income and
Indicators of Poverty and Disadvantage in Queensland
 Indicators of Poverty and Disadvantage in Queensland October 2013 Contents Introduction... 4 A framework to measure poverty and disadvantage... 4 How is the report structured?... 6 In summary - what do
National Rural Health Alliance. Fringe Benefits Tax and Rural Health
 NRHA National Rural Health Alliance Fringe Benefits Tax and Rural Health National Rural Health Alliance PRINT THIS DOCUMENT CATALOGUE SEARCH HELP HOME Fringe Benefits Tax and Rural Health SUMMARY The imposition
NATIONAL PROFILE OF SOLICITORS 2016 REPORT
 NATIONAL PROFILE OF SOLICITORS 2016 REPORT 24 AUGUST 2017 PREPARED FOR THE LAW SOCIETY OF NEW SOUTH WALES STAFF RESPONSIBLE FOR THIS REPORT WERE: Director Senior Consultant Graphic Designers Project Code
7 Intergovernmental financial relations
 7 Intergovernmental financial relations Features The 2016 17 Commonwealth Budget provided additional interim short term funding for health and education. However, this does not fully address funding cuts
2018 WA State Budget Analysis
 2018 WA State Budget Analysis Our Vision All people living in Western Australia have housing that enables them to thrive 17 th May 2018 Level 1, 33 Moore Street, East Perth 6000 08 9325 6660 www.shelterwa.org.au
Policy Directions to Challenge Ageism
 EveryAGE Counts Campaign Policy Directions to Challenge Ageism The EveryAGE Counts campaign is driven by a national coalition of organisations and individuals formed to shift negative social norms on ageing
Business Trends Report
 Business Trends Report June 2014 Introduction The Bankwest Business Trends Report tracks working trends for people that run a business either as an employer or as an own account worker. The report looks
3. More tax cuts now will lead to another round of harsh spending cuts
 The tax cuts In addition to last year s cuts in company tax for small and medium sized companies and personal income tax for people earning over $80,000, the Government proposes two income tax cuts: Extending
Department of Employment Overview of the
 Slide 1 Department of Employment Overview of the Ballarat region labour market June 13 2014 Department of Employment Overview of the Ballarat region Labour Market June 13 2014 (surveyed November 2013)
A longitudinal study of outcomes from the New Enterprise Incentive Scheme
 A longitudinal study of outcomes from the New Enterprise Incentive Scheme Evaluation and Program Performance Branch Research and Evaluation Group Department of Education, Employment and Workplace Relations
Complementary modernisation: Options to address the issue of affordability in the Energy White Paper
 Complementary modernisation: Options to address the issue of affordability in the Energy White Paper 16 March 2012 Oliver Derum, Policy Officer Energy + Water Consumers Advocacy Program Level 9, 299 Elizabeth
Federal Budget Summary of Impacts on Single Mother Families
 Federal Budget 2014-15 Summary of Impacts on Single Mother Families Note: This is a summary of the measures likely to be most relevant to single mothers. The table highlights the changes and what these
Environment Expenditure Local Government
 46.0 46.0 ENVIRONMENT EXPENDITURE, LOCAL GOVERNMENT, AUSTRALIA 000 0 Environment Expenditure Local Government Australia 000 0 4600007005 ISSN 444-390 Recommended retail price $4.00 Commonwealth of Australia
WACOSS Submission to the. Western Australian Industrial Relations Commission. State Wage Case
 WACOSS Submission to the Western Australian Industrial Relations Commission State Wage Case Friday 1 May 2009 For more information contact: Ms Irina Cattalini Director Social Policy WACOSS 2 Delhi Street
Department of Social Services
 Human Services Board of County Supervisors Area Agency on Aging At-Risk Youth and Family Services Board of Social Services Community Services Virginia Cooperative Extension Public Health Office of the
Poverty Lines: Australia
 MELBOURNE INSTITUTE Applied Economic & Social Research Poverty Lines: Australia June Quarter 2017 Melbourne Institute of Applied Economic and Social Research POVERTY LINES: AUSTRALIA ISSN 1448-0530 JUNE
Poverty Lines: Australia
 MELBOURNE INSTITUTE Applied Economic & Social Research Poverty Lines: Australia March Quarter 2018 Melbourne Institute: Applied Economic & Social Research POVERTY LINES: AUSTRALIA ISSN 1448-0530 MARCH
Income management and social welfare: the role of NGOs
 WACOSS Discussion Paper Income management and social welfare: the role of NGOs About WACOSS and the COSS network The Western Australian Council of Social Service (WACOSS) is the leading peak organisation
Queensland Economic Update
 Queensland Economic Update January 2017 www.cciq.com.au Chamber of Commerce & Industry Queensland A further drop in the official unemployment rate, combined with nation leading retail trade figures and
PART-TIME PURGATORY YOUNG AND UNDEREMPLOYED IN AUSTRALIA
 PART-TIME PURGATORY YOUNG AND UNDEREMPLOYED IN AUSTRALIA DECEMBER 2018 Being young, even in one of the most prosperous nations in the world, isn t what it used to be. Negotiating adulthood in the 21st
MINISTRY OF COMMUNITY, FAMILY AND CHILDREN'S SERVICES
 THE ESTIMATES, 2003-04 1 SUMMARY The mandate of the Ministry is to provide an affordable and effective system of community and social services that supports and invests in: families and communities, to
UGANDA: Uganda: SOCIAL POLICY OUTLOOK 1
 UGANDA: SOCIAL POLICY OUTLOOK Uganda: SOCIAL POLICY OUTLOOK 1 This Social Policy Outlook summarises findings published in two 2018 UNICEF publications: Uganda: Fiscal Space Analysis and Uganda: Political
rebuilding futures State of our Community Report Plenty Compared with Melbourne
 rebuilding futures State of our Community Report Plenty Compared with Melbourne www.campbellpage.org.au Who are we? Who is Campbell Page? Campbell Page provides employment, rehabilitation, training, and
TAX BASICS FOR NON-PROFIT ORGANISATIONS
 NON-PROFIT NON-PROFIT ORGANISATIONS OVERVIEW NAT 7966-06.2005 SEGMENT AUDIENCE FORMAT PRODUCT ID TAX BASICS FOR NON-PROFIT ORGANISATIONS An overview of tax issues relating to non-profit organisations including
Demographic Change in Tasmania: challenges and opportunities. Response to Discussion Paper
 Demographic Change in Tasmania: challenges and opportunities Response to Discussion Paper April 2007 1 Submission from Anglicare Tasmania GPO Box 1620 Hobart 7000 Phone: 6234 3510 2 Introduction Anglicare
Climate Change: Adaptation for Queensland. Issues Paper
 Climate Change: Adaptation for Queensland Issues Paper QCOSS Submission, October 2011 1 Climate Change: Adaptation for Queensland QCOSS response to the Issues Paper Introduction Queensland Council of Social
Department of Housing and Public Works
 Queensland Service Delivery Statements Department of Housing and Public Works Queensland Papers 1. Speech 2. Strategy and Outlook 3. Capital Statement 4. Measures 5. Service Delivery Statements Appropriation
Checklist. 1) Do some background research
 Do some background research") Checklist Matters for consideration before you start a charity: Take some time to do some planning before you go ahead and start a charity it will help in achieving your goals, as well as identifying possible
Checklist Matters for consideration before you start a charity: Take some time to do some planning before you go ahead and start a charity it will help in achieving your goals, as well as identifying possible
Industrial Relations Legislation Policy Background Paper
 Industrial Relations Legislation Policy Background Paper The primary policy for debate at Congress 2006 is the industrial relations legislation policy. As at the 2000 and 2003 Congresses, this policy will