Q4 FY17 FINANCIAL HIGHLIGHTS & SUPPLEMENTAL METRICS. March 27, 2017
|
|
|
- Lily Wilkins
- 5 years ago
- Views:
Transcription
1 Q4 FY17 FINANCIAL HIGHLIGHTS & SUPPLEMENTAL METRICS March 27, 2017
2 FORWARD-LOOKING STATEMENTS Certain statements contained in this presentation may constitute "forward-looking statements" within the meaning of the Private Securities Litigation Reform Act of Forward-looking statements provide current expectations of future events based on certain assumptions and include any statement that does not directly relate to any historical or current fact. Actual results may differ materially from those indicated by such forward-looking statements as a result of various important factors, including: risks related to the ability of the Company to compete effectively; the ability to deliver and stimulate demand for new products and technological innovations on a timely basis; delays or reductions in information technology spending; the integration of acquisitions and the ability to market successfully acquired technologies and products; fluctuations in exchange rates; the effects of industry consolidation; uncertainty and adverse results in litigation and related settlements; the inability to adequately protect Company intellectual property and the potential for infringement or breach of license claims of or relating to third party intellectual property; risks related to data and information security vulnerabilities; the ability to meet financial and operational challenges encountered in our international operations; ineffective management of, and control over, the Company's growth and international operations; and changes in and a dependence on key personnel, as well as other factors contained in our most recent Quarterly Report on Form 10-Q (copies of which may be accessed through the Securities and Exchange Commission's website at including those found therein under the captions "Risk Factors" and "Management's Discussion and Analysis of Financial Condition and Results of Operations". In addition to these factors, actual future performance, outcomes, and results may differ materially because of more general factors including (without limitation) general industry and market conditions and growth rates, economic and political conditions, governmental and public policy changes and the impact of natural disasters such as earthquakes and floods. The forwardlooking statements included in this presentation represent the Company's views as of the date of this presentation and these views could change. However, while the Company may elect to update these forward-looking statements at some point in the future, the Company specifically disclaims any obligation to do so. These forward-looking statements should not be relied upon as representing the Company's views as of any date subsequent to the date of this presentation, March 27, 2017.
3 INTRODUCTION The following presentation provides financial highlights and supplemental metrics for Red Hat s fourth quarter and fiscal year ended February 28, These financial highlights and supplemental metrics were made available on March 27, 2017 in connection with Red Hat s announcement of its financial results for the fourth quarter and fiscal year This presentation should be read in conjunction with Red Hat s press release issued on March 27, 2017 for its earnings announcement, as well as Red Hat s filings with the U.S. Securities and Exchange Commission which are available on Red Hat s investor relations website at Non-GAAP Measures In an effort to offer a means of comparing our performance to prior periods, Red Hat augments the financial highlights and supplemental metrics provided in this presentation with non-gaap financial information. Any non-gaap financial information provided in this presentation should not be used as a substitute for financial information presented in accordance with GAAP but instead should be read in conjunction with our GAAP results. The methods we use to calculate non-gaap financial information are not computed according to GAAP and may be materially different from the methods used by other companies.
4 4 FINANCIAL HIGHLIGHTS
5 STRONG 4 TH QUARTER REVENUE GROWTH % OF TOTAL REVENUE 20% App Dev & emerging tech Q417 Y/Y Growth Q417 Y/Y Growth, cc (1) 40% 40% 69% 11% Infrastructure-related tech Training & Consulting 11% 12% 8% 9% Total Revenue 16% 16% Q4 HIGHLIGHTS: 60 th consecutive quarter of revenue growth Continued strong growth in Application development-related and other emerging technologies revenue 5 (1) constant currency
6 STRONG ANNUAL REVENUE GROWTH % OF TOTAL REVENUE 18% 11% 71% App Dev & emerging tech Infrastructure-related tech Training & Consulting Total Revenue FY17 Y/Y Growth FY17 Y/Y Growth, cc (1) 36% 36% 15% 14% 11% 12% 18% 17% FY17 HIGHLIGHTS: Crossed over $2B milestone in subscription revenue Strong growth in both Infrastructure-related and App Dev & emerging App Dev & emerging tech now 18% of total revenue, up from 16% in FY16 6 (1)constant currency
7 Q417 BOOKINGS & DEAL METRICS CHANNEL 31% 69% GEOGRAPHY 12% 21% 67% Indirect Direct Americas EMEA APAC Q4 HIGHLIGHTS: Total of 110 deals >$1M; up 18% year-over year, including first ~$100M deal Top 30 deals all over $3M, with 16 over $5M, 5 over $10M and 4 over $20M Strong cross-selling with 90% of top deals including an app-dev/emerging technology offering 7
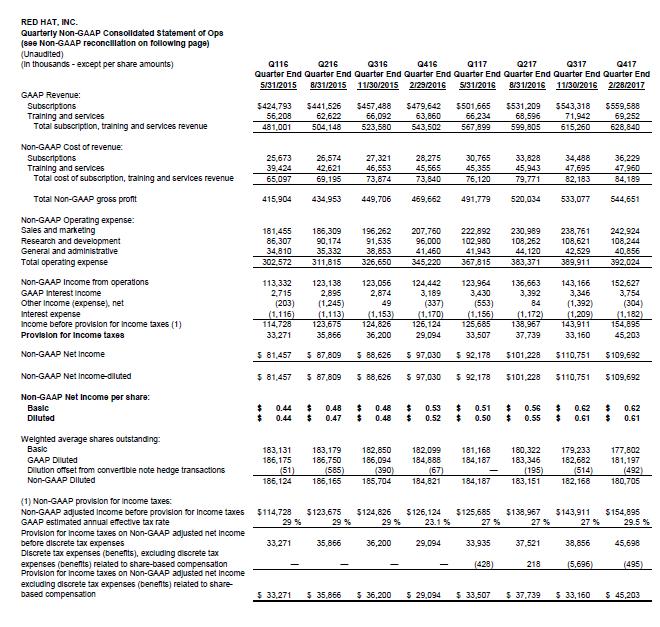
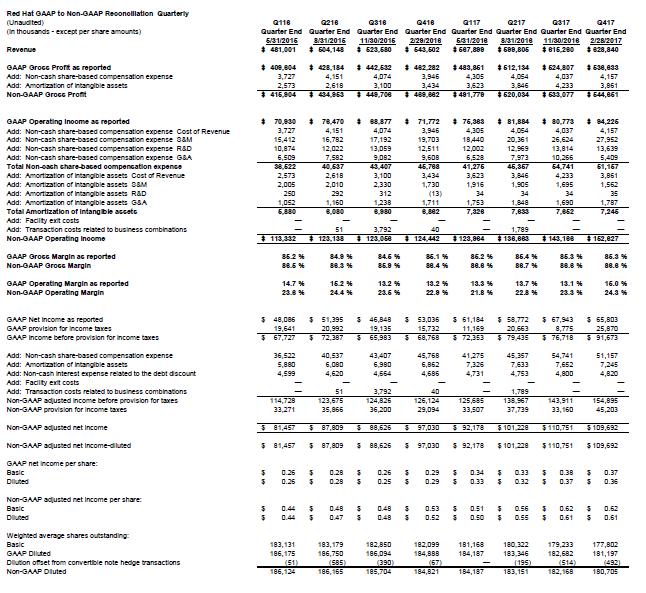
8 QUARTERLY PROFITABILITY & CASH FLOW ($ millions, y/y growth) NON-GAAP OPERATING OPERATING CASH FLOW INCOME $124 $153 $250 $318 Q416 Q417 Q416 Q417 Q4 HIGHLIGHTS: 15.0% GAAP and 24.3% Non-GAAP operating margins $0.36 GAAP and $0.61 Non-GAAP EPS 20% y/y total deferred revenue growth $2.1B cash & investments balance $139M share repurchase 8 Non-GAAP operating income and non-gaap operating margin exclude non-cash share-based compensation expense, amortization of intangible assets, and transaction costs related to business combinations of $53 million in Q416 and $58 million in Q417 from GAAP operating income of $72 million in Q416 and $94 million in Q417. Non-GAAP EPS excludes the expenses listed in previous sentence and non-cash interest expense related to the debt discount of $5 million in Q417. See reconciliation in the following GAAP to Non-GAAP Reconciliation section.
9 ANNUAL PROFITABILITY & CASH FLOW ($ millions, y/y growth) NON-GAAP OPERATING OPERATING CASH FLOW INCOME $484 $556 $736 $784 FY16 FY17 FY16* FY17 FY17 HIGHLIGHTS: 13.8% GAAP and 23.1% Non-GAAP operating margins $1.39 GAAP and $2.27 Non-GAAP EPS $459M share repurchase Free cash flow of $715M 9 *FY16 operating cash flow adjusted retrospectively for ASU See Appendix for details. Non-GAAP operating income and Non-GAAP operating margin exclude non-cash share-based compensation expense, amortization of intangible assets, and transaction costs related to business combinations of $196 million in FY16 and $224 million in FY17 from GAAP operating income of $288 million in FY16 and $332 million in FY17. Non-GAAP EPS excludes the expenses listed in previous sentence and non-cash interest expense related to the debt discount of $19 million in FY17. See reconciliation in the following GAAP to Non-GAAP Reconciliation section. Free cash flow defined as Net cash provided by operating activities less Purchase of property and equipment found on cash flow statement, $784 million and $69 million respectively in FY17.
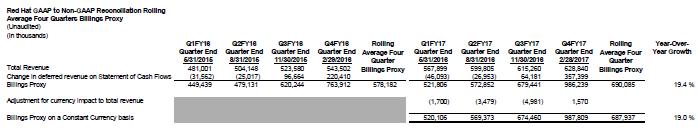
10 TOTAL BACKLOG ($ millions) ~$2,133 ~$2,719 ~$650 ~$410 $2,070 $1,723 Off Balance Sheet ("OBS") Deferred Revenue Total Backlog FY2016 FY2017 HIGHLIGHTS: Off balance sheet (OBS) up 58% y/y Deferred revenue up 20% y/y Portion of total backlog to be billed during FY18 in excess of $330M, up 20% y/y 10 Off Balance Sheet (OBS) backlog reported as a conservative approximation, often describing the amount as in excess of, primarily because the value of underlying contracts is derived from data not yet subjected to the complete application of our revenue recognition policies. Total backlog = OBS + deferred revenue
11 11 SUPPLEMENTAL FINANCIAL & BUSINESS METRICS
12 (Unaudited) ($ in thousands) Feb-16 May-16 Aug-16 Nov-16 Feb-17 Revenue Q416 FY16 Q117 Q217 Q317 Q417 FY17 Infrastructure-related subscriptions 390,706 1,480, , , , ,085 1,696,443 y/y change 15% 12% 14% 18% 16% 11% 15% constant currency y/y change 18% 18% 13% 17% 14% 12% 14% App dev & emerging subscriptions 88, ,986 98, , , , ,337 y/y change 38% 37% 39% 33% 33% 40% 36% constant currency y/y change 43% 46% 39% 32% 32% 40% 36% Subscription Revenue 479,642 1,803, , , , ,588 2,135,780 y/y change 18% 16% 18% 20% 19% 17% 18% constant currency y/y change 22% 22% 18% 19% 18% 17% 18% Training & services revenue 63, ,781 66,234 68,596 71,942 69, ,023 y/y change 8% 9% 18% 10% 9% 8% 11% constant currency y/y change 14% 17% 19% 11% 10% 9% 12% Total Revenue 543,502 2,052, , , , ,840 2,411,803 y/y change 17% 15% 18% 19% 18% 16% 18% constant currency y/y change 21% 21% 18% 18% 17% 16% 17% Percent of Total Revenue (in USD) Infrastructure-related subscriptions 72% 72% 71% 71% 70% 69% 71% App dev & emerging subscriptions 16% 16% 17% 17% 18% 20% 18% Total Subscription Revenue 88% 88% 88% 89% 88% 89% 89% Training & services revenue 12% 12% 12% 11% 12% 11% 11% Total Revenue 100% 100% 100% 100% 100% 100% 100% 12
13 (Unaudited) ($ in thousands) Feb-16 May-16 Aug-16 Nov-16 Feb-17 Revenue by Geography Q416 FY16 Q117 Q217 Q317 Q417 FY17 Americas 357,940 1,354, , , , ,449 1,555,290 y/y change 17% 18% 14% 16% 15% 15% 15% constant currency y/y change 19% 20% 15% 17% 15% 14% 15% EMEA 115, , , , , , ,642 y/y change 15% 6% 28% 18% 15% 14% 18% constant currency y/y change 24% 25% 24% 17% 16% 17% 18% APAC 70, ,581 77,877 86,809 89,103 87, ,871 y/y change 20% 11% 26% 37% 34% 24% 30% constant currency y/y change 26% 23% 25% 27% 25% 22% 25% Total Revenue 543,502 2,052, , , , ,840 2,411,803 y/y change 17% 15% 18% 19% 18% 16% 18% constant currency y/y change 21% 21% 18% 18% 17% 16% 17% Percent of Total Revenue (in USD) Americas 66% 66% 64% 64% 64% 65% 64% EMEA 21% 21% 22% 21% 22% 21% 22% APAC 13% 13% 14% 15% 14% 14% 14% Total Revenue 100% 100% 100% 100% 100% 100% 100% 13
14 (Unaudited) ($ in thousands, except per share amounts) Feb-16 May-16 Aug-16 Nov-16 Feb-17 Non-GAAP Income Statement*: Q416 FY16 Q117 Q217 Q317 Q417 FY17 Gross Profit 469,662 1,770, , , , ,651 2,089,540 Operating Income 124, , , , , , ,420 Net Income 97, ,925 92, , , , ,851 Gross Margin 86.4% 86.3% 86.6% 86.7% 86.6% 86.6% 86.6% Subscription Gross Margin 94.1% 93.9% 93.6% 93.7% 93.5% Training & Services Gross Margin 28.6% 31.5% 33.0% 33.7% 30.7% Operating Margin 22.9% 23.6% 21.8% 22.8% 23.3% 24.3% 23.1% EPS Basic EPS Diluted Tax Rate before discrete items 23.1% 27.5% 27.0% 27.0% 27.0% 29.5% 27.5% Weighted Average Shares Outstanding Basic 182, , , , , , ,642 Diluted 184, , , , , , ,669 Balance Sheet Q416 FY16 Q117 Q217 Q317 Q417 FY17 Total Cash & Investments 1,995,390 1,995,390 2,119,876 2,042,645 1,971,370 2,133,231 $ 2,133,231 Current Deferred Revenue 1,272,908 1,272,908 1,251,096 1,233,762 1,225,421 1,512,762 $ 1,512,762 Long-Term Deferred Revenue 449, , , , , ,194 $ 557,194 Prior Year Deferred Revenue Balance 1,482,328 1,436,119 1,413,440 1,487,134 1,722,544 Constant currency change in Deferred Revenue (1) 260, , , , ,892 Impact from foreign currency translation (20,631) 9,721 22,474 8,941 (1,480) Ending Deferred Revenue Balance 1,722,544 1,692,156 1,680,652 1,707,978 2,069,956 Cash Flow Statement Q416 FY16 Q117 Q217 Q317 Q417 FY17 Current Deferred Revenue Change 182, ,880 (16,287) (44,909) 16, , ,413 Long-Term Deferred Revenue Change 37,535 69,615 (29,806) 17,956 47,655 73, ,121 Total Change in Deferred Revenue 220, ,495 (46,093) (26,953) 64, , , Net Operating Cash Flow 249, , ,297 96, , , ,717 *See reconciliation in the following GAAP to Non-GAAP Reconciliation section. (1) Change in Deferred Revenue includes approximately $0.4 million acquired as part of business combinations during the twelve months ended February 28, (Quarterly FX impacts to y/y change in deferred revenue are $4.6 million in Q417, $(36.9) million in Q317, $15.1 million in Q217 and $15.7 million in Q117).
15 Feb-16 May-16 Aug-16 Nov-16 Feb-17 Bookings & Deal Metrics: Q416 FY16 Q117 Q217 Q317 Q417 FY17 # of Top 25 Renewals Top 25 Renewal Rates (of prior deal value) ~120% ~105% ~105% >120% >120% Top 30 Deal Sizes Deals $1M - $5M Deals $5M - $10M Deals >$10M Deals containing App Dev & Emerging Tech 83% 73% 83% 73% 60% 90% 77% Deals w/ only App Dev & Emerging Tech 0% 15% 13% 13% 13% 13% 13% Indirect Channel Bookings 71% 72% 78% 81% 72% 69% 72% Direct Bookings 29% 28% 22% 19% 28% 31% 28% Bookings by Geography Americas 64% 60% 60% 57% 57% 67% 62% EMEA 23% 24% 21% 24% 27% 21% 23% APAC 13% 16% 19% 19% 16% 12% 15% Average Contract Length (months) % of Single Year Bookings 73% 75% 74% 73% 67% 65% 69% % of Multi-Year Bookings 27% 25% 26% 27% 33% 35% 31% Additional Metrics Employees 8,799 9,324 9,861 10,257 10,489 Average EUR FX Rate Average JPY FX Rate
16 (Unaudited) Feb-16 May-16 Aug-16 Nov-16 Feb-17 Column1 Q416 FY16 Q117 Q217 Q317 Q417 FY17 Share Repurchases # Shares purchased (millions) Aggregate Principal Amount ($ millions) Remaining Balance on Plan at quarter-end ($ millions) Days Sales Outstanding (DSO) (in thousands, except # of days) Total Revenue 543,502 2,052, , , , ,840 2,411,803 Q/Q deferred revenue (Balance Sheet) 235,410 (30,388) (11,504) 27, ,979 Deferred revenue (Cash Flow Stmt.) 220, ,495 (46,093) (26,953) 64, , ,534 Accounts Receivable, net 509, , , , ,821 Q/Q FX impact on Accounts Receivable (1,098) (6,101) (2,980) 4,926 (1,509) Accounts Receivable in constant currency 508, , , , ,312 # calendar days in quarter DSO (1) FX adj DSO (2) (1) Days Sales Outstanding (DSO) is calculated by dividing Accounts Receivable, net by (Total Revenue + Q/Q change in deferred revenue from Balance Sheet) then multiplying by the number of calendar days in the quarter. 16 (2) FX adjusted DSO is calculated by dividing Accounts Receivable in constant currency by (Total Revenue + Deferred Revenue from Cash Flow Statement) then multiplying by the number of calendar days in the quarter.
17 17 GAAP TO NON-GAAP RECONCILIATION
18 18
19 19
20 20
21 21
22 22
23 23
24 24 APPENDIX
25 EARLY ADOPTION OF ACCOUNTING STANDARDS UPDATE ASU was issued in March 2016 to simplify accounting for sharebased compensation As described in the FY16 10-K in Recent Accounting Pronouncements, adoption was required Q118. RHT adopted early in Q117 as permitted. Excess tax benefits from share-based payments are now recognized as a discrete tax benefit or expense in the Statements of Operations Q417 GAAP net income and GAAP EPS benefited by less than $1 million and less than $0.01, respectively FY17 GAAP net income and GAAP EPS benefited by approximately $16 million and $0.09, respectively Effect of ASU is excluded from non-gaap net income and non-gaap EPS Excess tax benefits from share-based payments on the Statements of Cash Flows are now recognized as an operating cash flow rather than a financing cash flow Q417 and FY17 operating cash flow includes less than $1 million and $16 million of excess tax benefits, respectively Prior year Statements of Cash Flows are adjusted to comparable presentation on the following page 25
26 (unaudited) ($ millions) EARLY ADOPTION OF ACCOUNTING STANDARDS UPDATE Effect of ASU on FY16 and FY17 operating cash flows Q116 Q216 Q316 Q416 FY16 Q117 Q217 Q317 Q417 FY17 Operating cash flows prior to accounting update $ 209 $ 120 $ 139 $ 247 $ 716 $ 224 $ 96 $ 130 $ 317 $ 767 Excess tax benefits from sharebased payment arrangements now classified as an operating source of cash Operating cash flows adjusted for accounting update $ 215 $ 123 $ 148 $ 250 $ 736 $ 232 $ 97 $ 136 $ 318 $
Q4 FY2018 FINANCIAL HIGHLIGHTS & SUPPLEMENTAL METRICS. March 26, 2018
 Q4 FY2018 FINANCIAL HIGHLIGHTS & SUPPLEMENTAL METRICS March 26, 2018 FORWARD-LOOKING STATEMENTS Certain statements contained in this presentation may constitute "forward-looking statements" within the
Q1 FY2019 FINANCIAL HIGHLIGHTS & SUPPLEMENTAL METRICS. June 21, 2018
 Q1 FY2019 FINANCIAL HIGHLIGHTS & SUPPLEMENTAL METRICS June 21, 2018 FORWARD-LOOKING STATEMENTS Certain statements contained in this presentation may constitute "forward-looking statements" within the meaning
Q2 FY2019 FINANCIAL HIGHLIGHTS & SUPPLEMENTAL METRICS. September 19, 2018
 Q2 FY2019 FINANCIAL HIGHLIGHTS & SUPPLEMENTAL METRICS September 19, 2018 FORWARD-LOOKING STATEMENTS Certain statements contained in this presentation may constitute "forward-looking statements" within
Q3 Fiscal Year 2019 Financial Highlights
 Q3 Fiscal Year 2019 Financial Highlights For the quarter ended October 31, 2018 November 29, 2018 Forward Looking Statements Certain statements in this communication may contain forward looking statements
Q1 Fiscal Year 2019 Financial Highlights
 Fiscal Year 2019 Financial Highlights For the quarter ended April 30, 2018 May 31, 2018 Forward-Looking Statements Certain statements in this communication may contain forward-looking statements within
CADENCE REPORTS FOURTH QUARTER AND FISCAL YEAR 2017
 CADENCE REPORTS FOURTH QUARTER AND FISCAL YEAR 2017 CADENCE DESIGN SYSTEMS, INC. CFO COMMENTARY January 31, 2018 Q4 2017 Key Takeaways Strong, consistent financial results for Q4 with key metrics meeting
GAAP TO NON-GAAP RECONCILIATION
 GAAP TO NON-GAAP RECONCILIATION Red Hat GAAP to Non-GAAP Reconciliation Quarterly (Unaudited) Q218 Q318 Q418 Q119 Q219 (In thousands - except per share amounts) 8/31/2017 11/30/2017 2/28/2018 5/31/2018
GAAP TO NON-GAAP RECONCILIATION
 17 GAAP TO NON-GAAP RECONCILIATION Red Hat GAAP to Non-GAAP Reconciliation Quarterly (Unaudited) Q117 Q217 Q317 Q417 Q118 Q218 Q318 Q418 (In thousands - except per share amounts) GAAP Operating Income
Q416 Q117 Q217 Q317 Q417 Q118 Q218 Q318
 Red Hat GAAP to Non-GAAP Reconciliation Quarterly (Unaudited) Q416 Q117 Q217 Q317 Q417 Q118 Q218 Q318 (In thousands - except per share amounts) GAAP Operating Income as reported $ 71,772 $ 75,363 $ 81,884
ServiceNow, Inc. Condensed Consolidated Statements of Operations (in thousands, except share and per share data) (unaudited)
 (unaudited)") Condensed Consolidated Statements of Operations (in thousands, except share and per share data) December 31, 2017 December 31, 2016 December 31, 2017 December 31, 2016 Revenues: Subscription $ 497,232
Condensed Consolidated Statements of Operations (in thousands, except share and per share data) December 31, 2017 December 31, 2016 December 31, 2017 December 31, 2016 Revenues: Subscription $ 497,232
Q Financial Results. July 22, 2010
 Q2 2010 Financial Results July 22, 2010 Q2 2010 Non-GAAP Results Q2 10 Q2 09 Y/Y % growth Q1 10 Billings (1) $90M $69M 31% $79M Revenue $76M $61M 24% $70M Non-GAAP Gross Margin (%) (2) 74% 74% -- 73% Non-GAAP
Q Financial Results
 Q1 2018 Financial Results May 3, 2018 Copyright Fortinet Inc. All rights reserved. Safe Harbor Statement Information, statements and projections contained in these presentation slides and related conference
Q Financial Results
 Q2 2018 Financial Results August 1, 2018 Copyright Fortinet Inc. All rights reserved. Safe Harbor Statement Information, statements and projections contained in these presentation slides and related conference
Q Financial Results
 Q4 2016 Financial Results February 2, 2017 Copyright Fortinet Inc. All rights reserved. Safe Harbor Statement Information, statements and projections contained in these presentation slides and related
CFO Commentary on Second Quarter 2017 Preliminary Financial Results
 Juniper Networks, Inc. 1133 Innovation Way Sunnyvale, CA 94089 July 25, 2017 CFO Commentary on Second Quarter 2017 Preliminary Financial Results Related Information The following commentary is provided
Q3 FY18 Financial Update
 Q3 FY18 Financial Update Salesforce NYSE: CRM @Salesforce_ir Safe Harbor Safe harbor statement under the Private Securities Litigation Reform Act of 1995: This presentation contains forward-looking statements
Fourth Quarter and Fiscal 2018 Supplemental Information (1) (Dollars and shares in millions, except per share data, unaudited)
 (Dollars and shares in millions, except per share data, unaudited)") Fourth Quarter and Fiscal 2018 Supplemental Information (1) (Dollars and shares in millions, except per share data, unaudited) Q4FY18 Q4FY17 Y/Y Growth FY18 FY17 Y/Y Growth Revenues and Earnings Results
Fourth Quarter and Fiscal 2018 Supplemental Information (1) (Dollars and shares in millions, except per share data, unaudited) Q4FY18 Q4FY17 Y/Y Growth FY18 FY17 Y/Y Growth Revenues and Earnings Results
Q Financial Results
 Q3 2018 Financial Results November 1, 2018 Copyright Fortinet Inc. All rights reserved. 1 Safe Harbor Statement Information, statements and projections contained in these presentation slides and related
October 26, Earnings Summary Third Quarter FY 2016
 October 26, 2016 Earnings Summary Third Quarter FY 2016 SAFE HARBOR Certain information contained in this presentation may constitute forward-looking statements within the meaning of the Private Securities
For more information, contact: Brad Pogalz (952)
") For more information, contact: Brad Pogalz (952) 887-3753 Donaldson Reports Fourth Quarter and Full-Year 2018 Earnings Record levels for sales and adjusted EPS 1,2 in fiscal 2018; new records forecast
For more information, contact: Brad Pogalz (952) 887-3753 Donaldson Reports Fourth Quarter and Full-Year 2018 Earnings Record levels for sales and adjusted EPS 1,2 in fiscal 2018; new records forecast
CFO COMMENTARY Q3 FY 2018
 Q3 FY 2018 FINANCIAL INFORMATION AND CONFERENCE CALL Please see the accompanying earnings press release available at www.scansource.com in the Investor Relations section. The information included in this
CFO COMMENTARY Q2 FY 2018
 Q2 FY 2018 FINANCIAL INFORMATION AND CONFERENCE CALL Please see the accompanying earnings press release available at www.scansource.com in the Investor Relations section. The information included in this
Investor Presentation
 Investor Presentation Fourth Quarter 2017 Safe Harbor and Other Information This presentation contains forward looking statements that are based on our management s beliefs and assumptions and on information
AUTODESK, INC. (ADSK) THIRD QUARTER FISCAL 2019 EARNINGS ANNOUNCEMENT NOVEMBER 20, 2018 PREPARED REMARKS
 THIRD QUARTER FISCAL 2019 EARNINGS ANNOUNCEMENT NOVEMBER 20, 2018 PREPARED REMARKS") AUTODESK, INC. (ADSK) THIRD QUARTER FISCAL 2019 EARNINGS ANNOUNCEMENT NOVEMBER 20, 2018 PREPARED REMARKS Autodesk posts its prepared remarks and press release to its investor relations website to provide
AUTODESK, INC. (ADSK) THIRD QUARTER FISCAL 2019 EARNINGS ANNOUNCEMENT NOVEMBER 20, 2018 PREPARED REMARKS Autodesk posts its prepared remarks and press release to its investor relations website to provide
New revenue recognition standard - IFRS 15. July 26, 2018
 New revenue recognition standard - IFRS 15 July 26, 2018 Legal disclosure This presentation contains forward-looking statements, within the meaning of the Private Securities Litigation Reform Act of 1995,
Salesforce. NYSE:
 Salesforce NYSE: CRM @Salesforce_ir 1 Safe Harbor "Safe harbor" statement under the Private Securities Litigation Reform Act of 1995: This presentation contains forward-looking statements about our financial
AUTODESK, INC. (ADSK) SECOND QUARTER FISCAL 2019 EARNINGS ANNOUNCEMENT AUGUST 23, 2018 PREPARED REMARKS
 SECOND QUARTER FISCAL 2019 EARNINGS ANNOUNCEMENT AUGUST 23, 2018 PREPARED REMARKS") AUTODESK, INC. (ADSK) SECOND QUARTER FISCAL 2019 EARNINGS ANNOUNCEMENT AUGUST 23, 2018 PREPARED REMARKS Autodesk posts its prepared remarks and press release to its IR website to provide shareholders and
AUTODESK, INC. (ADSK) SECOND QUARTER FISCAL 2019 EARNINGS ANNOUNCEMENT AUGUST 23, 2018 PREPARED REMARKS Autodesk posts its prepared remarks and press release to its IR website to provide shareholders and
Digital River, Inc. Second Quarter Results (Unaudited, in thousands) Subject to reclassification
 Subject to reclassification") (Unaudited, in thousands) Condensed Consolidated Balance Sheets As of December 31, 2008 2007 Assets: Current assets Cash and cash equivalents $ 276,927 $ 381,788 Short-term investments 201,297 315,636
(Unaudited, in thousands) Condensed Consolidated Balance Sheets As of December 31, 2008 2007 Assets: Current assets Cash and cash equivalents $ 276,927 $ 381,788 Short-term investments 201,297 315,636
See the Accounting Considerations section for more information about the TCJA and adoption of new accounting standards. 3
 For more information, contact: Brad Pogalz (952) 887-3753 Donaldson Company Reports First Quarter 2019 Earnings Donaldson achieved record first quarter sales and EPS 1 First quarter 2019 sales and EPS
CFO COMMENTARY Q4 FY 2018
 Q4 FY 2018 FINANCIAL INFORMATION AND CONFERENCE CALL Please see the accompanying earnings press release available at www.scansource.com in the Investor Relations section. The information included in this
Q Financial Results
 Q2 2017 Financial Results July 26, 2017 Copyright Fortinet Inc. All rights reserved. Safe Harbor Statement Information, statements and projections contained in these presentation slides and related conference
Annual Reconciliation of GAAP to Adjusted Non-GAAP Financials as Disclosed in the Company s Annual Earnings Press Release
 Annual Reconciliation of GAAP to Adjusted Non-GAAP Financials as Disclosed in the Company s Annual Earnings Press Release The 2017-2015 adjusted amounts presented below contain financial measures, such
Progress Reports 2018 Fiscal Fourth Quarter and Year End Results
 Progress Reports Fiscal Fourth Quarter and Year End Results January 17, 2019 Exceeds Guidance for Revenue BEDFORD, Mass.--(BUSINESS WIRE)--Jan. 17, 2019-- Progress (NASDAQ: PRGS), the leading provider
ServiceNow, Inc. Condensed Consolidated Statements of Operations (in thousands, except share and per share data)
") Condensed Consolidated Statements of Operations (in thousands, except share and per share data) December 31, 2015 December 31, 2014 December 31, 2015 December 31, 2014 Revenues: Subscription $ 244,702
Condensed Consolidated Statements of Operations (in thousands, except share and per share data) December 31, 2015 December 31, 2014 December 31, 2015 December 31, 2014 Revenues: Subscription $ 244,702
ServiceNow, Inc. Condensed Consolidated Statements of Operations (in thousands, except share and per share data) (unaudited)
 (unaudited)") ServiceNow, Inc. Condensed Consolidated Statements of Operations (in thousands, except share and per share data) (unaudited) Revenues: Subscription $ 626,567 $ 449,506 $ 1,755,174 $ 1,239,762 Professional
ServiceNow, Inc. Condensed Consolidated Statements of Operations (in thousands, except share and per share data) (unaudited) Revenues: Subscription $ 626,567 $ 449,506 $ 1,755,174 $ 1,239,762 Professional
Alphabet Announces Fourth Quarter and Fiscal Year 2018 Results
 Alphabet Announces Fourth Quarter and Fiscal Year 2018 Results MOUNTAIN VIEW, Calif. February 4, 2019 Alphabet Inc. (NASDAQ: GOOG, GOOGL) today announced financial results for the quarter and fiscal year
Third Quarter Fiscal 2018 Supplemental Information (1)
") Third Quarter Fiscal 2018 Supplemental Information (1) (Dollars and shares in millions, except per share data, unaudited) Q3FY18 Q3FY17 (2) Y/Y Growth Revenues and Earnings Results GAAP Revenues $1,209
Third Quarter Fiscal 2018 Supplemental Information (1) (Dollars and shares in millions, except per share data, unaudited) Q3FY18 Q3FY17 (2) Y/Y Growth Revenues and Earnings Results GAAP Revenues $1,209
ServiceNow, Inc. Condensed Consolidated Statements of Operations (in thousands, except share and per share data) (Unaudited)
 (Unaudited)") Condensed Consolidated Statements of Operations (in thousands, except share and per share data) Revenues: Subscription $ 179,907 $ 117,375 Professional services and other 32,057 21,715 Total revenues 211,964
Condensed Consolidated Statements of Operations (in thousands, except share and per share data) Revenues: Subscription $ 179,907 $ 117,375 Professional services and other 32,057 21,715 Total revenues 211,964
Safe Harbor. Non-GAAP Financial Information
 1 Safe Harbor This document contains forward-looking statements within the meaning of the Private Securities Litigation Reform Act of 1995, including financial projections subject to risks, uncertainties
CFO Commentary on Fourth Quarter and Fiscal Year 2015 Preliminary Financial Results
 Juniper Networks, Inc. 1133 Innovation Way Sunnyvale, CA 94089 January 27, 2016 CFO Commentary on Fourth Quarter and Fiscal Year 2015 Preliminary Financial Results Related Information The following commentary
Q3 FY16 FINANCIAL RESULTS CONFERENCE CALL May 10, 2016 at 5:00 pm ET
 Q3 FY16 FINANCIAL RESULTS CONFERENCE CALL May 10, 2016 at 5:00 pm ET SAFE HARBOR This presentation may contain certain comments, which are forward-looking statements that involve plans, strategies, economic
McCormick & Company, Inc. 4th Quarter 2018 Financial Results and 2019 Outlook
 McCormick & Company, Inc. 4th Quarter 2018 Financial Results and 2019 Outlook January 24 th 2019 The following slides accompany a January 24 th 2019, earnings release conference call. This information
Q4 FY18 Financial Update
 Q4 FY8 Financial Update Salesforce NYSE: CRM @Salesforce_ir Safe Harbor "Safe harbor" statement under the Private Securities Litigation Reform Act of 995: This presentation contains forward-looking statements
Q Earnings Call. November 5, 2012
 Q4 2012 Earnings Call November 5, 2012 Forward-Looking Statements and Non-GAAP Measures Forward-Looking Statements -- This presentation contains certain forward-looking statements within the meaning of
ServiceNow, Inc. Condensed Consolidated Statements of Operations (in thousands, except share and per share data) (Unaudited)
 (Unaudited)") Condensed Consolidated Statements of Operations (in thousands, except share and per share data) September 30, 2016 September 30, 2015 September 30, 2016 September 30, 2015 Revenues: Subscription $ 318,934
Condensed Consolidated Statements of Operations (in thousands, except share and per share data) September 30, 2016 September 30, 2015 September 30, 2016 September 30, 2015 Revenues: Subscription $ 318,934
Fourth Quarter Fiscal 2018 Results CFO Commentary
 Non-GAAP Results for the Fourth Quarter of Fiscal Year 2018 Revenue (In millions, except for percentages) Q4FY18 Q4FY17 Adj. Growth Total revenue $1,234 $1,176 4% Enterprise Security revenue 620 689 1%
Castlight Health. Q Financial & Business Update November 6, 2018 Q3 FY
 Castlight Health Q3 2018 Financial & Business Update November 6, 2018 Q3 FY 2018 1 Safe Harbor Statement This presentation contains forward-looking statements regarding our trends, our strategies and the
Non-GAAP Financial Measures
 Non-GAAP Financial Measures To supplement our consolidated financial statements, which are prepared and presented in accordance with GAAP, Pivotal provides investors with certain non-gaap financial measures,
Q Financial Results. February 26, 2018
 Q4 2017 Financial Results February 26, 2018 Forward Looking Statements & Non-GAAP Financial Measures Forward-Looking Statements This presentation contains forward-looking statements within the meaning
McCormick & Company, Inc. 3rd Quarter 2017 Financial Results and Outlook September 28, 2017
 McCormick & Company, Inc. 3rd Quarter 2017 Financial Results and Outlook September 28, 2017 1 The following slides accompany a September 28, 2017 earnings release conference call. This information should
Itron, Inc. Comparison of Key 2015 Financial Metrics to Preliminary Results Announced February 17, Total operating expenses 486, ,839
 Itron, Inc. Comparison of Key 2015 Financial Metrics to Preliminary Results Announced February 17, 2016 (Unaudited, in thousands, except per share data) (announced Feb. 17, 2016) Preliminary FY 2015 Final
PTC SECOND QUARTER FISCAL 2017 PREPARED REMARKS APRIL 19, 2017
 PTC SECOND QUARTER FISCAL 2017 PREPARED REMARKS APRIL 19, 2017 Please refer to the Important Disclosures section of these prepared remarks for important information about our operating metrics (including
Q2 FY19 Results January 17, 2019
 Q2 FY19 Results January 17, 2019 Legal disclosure This presentation contains forward-looking statements, within the meaning of the Private Securities Litigation Reform Act of 1995, which statements involve
Salesforce Announces Record Second Quarter Fiscal 2019 Results Raises FY19 Revenue Guidance to $ Billion to $ Billion
 John Cummings Salesforce Investor Relations 415-778-4188 jcummings@salesforce.com Gina Sheibley Salesforce Public Relations 917-297-8988 gsheibley@salesforce.com Salesforce Announces Record Second Quarter
ServiceNow, Inc. Condensed Consolidated Statements of Operations (in thousands, except share and per share data) (unaudited)
 (unaudited)") Condensed Consolidated Statements of Operations (in thousands, except share and per share data) Revenues: Subscription $ 166,751 $ 104,878 $ 567,217 $ 349,804 Professional services and other 31,253 20,352
Condensed Consolidated Statements of Operations (in thousands, except share and per share data) Revenues: Subscription $ 166,751 $ 104,878 $ 567,217 $ 349,804 Professional services and other 31,253 20,352
Q1 16 Results. April 2016
 Q1 16 Results April 2016 Safe harbor Safe Harbor statement under the Private Securities Litigation Reform Act of 1995: This presentation and the accompanying conference call contain forward-looking statements
Investor Presentation. Third Quarter 2018
 Investor Presentation Third Quarter 2018 Safe Harbor and Other Information This presentation contains forward looking statements that are based on our management s beliefs and assumptions and on information
CFO COMMENTARY Q1 FY 2019
 Q1 FY 2019 FINANCIAL INFORMATION AND CONFERENCE CALL Please see the accompanying earnings press release available at www.scansource.com in the Investor Relations section. The information included in this
Castlight Health Q Financial & Business Update October 25, 2017
 Castlight Health Q3 2017 Financial & Business Update October 25, 2017 Q3 FY 2017 1 This presentation contains forward-looking statements regarding our trends, our strategies and the anticipated performance
Salesforce delivered the following results for its fiscal fourth quarter and full fiscal year 2018:
 Exhibit 99.1 John Cummings Salesforce Investor Relations 415-778-4188 jcummings@salesforce.com Gina Sheibley Salesforce Public Relations 917-297-8988 gsheibley@salesforce.com Salesforce Announces Record
Q Financial Results
 Q4 2018 Financial Results February 6, 2019 Copyright Fortinet Inc. All rights reserved. 1 Safe Harbor Statement Information, statements and projections contained in these presentation slides and related
Digital River, Inc. First Quarter Results (In thousands, except share data) Subject to reclassification
 Subject to reclassification") (In thousands, except share data) Consolidated Balance Sheets (Unaudited) December 31, Assets Current assets Cash and cash equivalents $ 500,742 $ 542,851 Short-term investments 144,615 162,794 Accounts
(In thousands, except share data) Consolidated Balance Sheets (Unaudited) December 31, Assets Current assets Cash and cash equivalents $ 500,742 $ 542,851 Short-term investments 144,615 162,794 Accounts
Reconciliation of Non-GAAP Financial Measures. Adjusted Operating Income Reconciliation
 Reconciliation of Non-GAAP Financial Measures Adjusted Operating Income Reconciliation Adjusted operating income is not a measure of financial performance under generally accepted accounting principles
Coherent, Inc. Consolidated Statement of Operations - GAAP
 Consolidated Statement of Operations - GAAP (In thousands except percentages and per share data, unaudited) March 31, December 30, September 30, July 1, April 1, December 31, October 1, July 2, April 2,
ServiceNow, Inc. Condensed Consolidated Statements of Operations (in thousands, except share and per share data) (unaudited)
 (unaudited)") ServiceNow, Inc. Condensed Consolidated Statements of Operations (in thousands, except share and per share data) (unaudited) Revenues: Three Months Ended March 31, 2018 March 31, 2017 *As Adjusted Subscription
ServiceNow, Inc. Condensed Consolidated Statements of Operations (in thousands, except share and per share data) (unaudited) Revenues: Three Months Ended March 31, 2018 March 31, 2017 *As Adjusted Subscription
PTC PREPARED REMARKS FOURTH QUARTER AND FULL YEAR FISCAL 2017 OCTOBER 25, 2017
 PTC PREPARED REMARKS FOURTH QUARTER AND FULL YEAR FISCAL 2017 OCTOBER 25, 2017 Please refer to the Important Disclosures section of these prepared remarks for important information about our operating
2Q17 EARNINGS AUGUST 2017
 2Q17 EARNINGS AUGUST 2017 FORWARD-LOOKING STATEMENTS The statements contained in this release that refer to plans and expectations for the next quarter, the full year or the future are forward-looking
News from Aon Aon Reports Fourth Quarter and Full Year 2018 Results Fourth Quarter Key Metrics as Reported Under U.S. GAAP(1)
") Investor Relations News from Aon Aon Reports Fourth Quarter and Full Year Results Fourth Quarter Key Metrics as Reported Under U.S. GAAP (1) Total revenue decreased 5 to $2.8 billion, including a decrease
Investor Relations News from Aon Aon Reports Fourth Quarter and Full Year Results Fourth Quarter Key Metrics as Reported Under U.S. GAAP (1) Total revenue decreased 5 to $2.8 billion, including a decrease
1Q18 EARNINGS MAY 2018
 1Q18 EARNINGS MAY 2018 FORWARD-LOOKING STATEMENTS The statements contained in this release that refer to plans and expectations for the next quarter, the full year or the future are forward-looking statements
Prepared Remarks 03/26/18
 Speaker: Tom McCallum, VP of Investor Relations Thank you operator, Hello everyone, and welcome to Red Hat's earnings call for the fourth quarter of FY18. Speakers for today's call will be Jim Whitehurst,
EFI Q Earnings Call. January 25, 2017
 EFI Q4 2016 Earnings Call January 25, 2017 Safe Harbor For Forward-Looking Statements Certain statements in this presentation are forward-looking statements within the meaning of Section 27A of the Securities
FOR IMMEDIATE RELEASE
 FOR IMMEDIATE RELEASE For media inquiries, contact: Eric Armstrong, Citrix Systems, Inc. (954) 267-2977 or eric.armstrong@citrix.com For investor inquiries, contact: Eduardo Fleites, Citrix Systems, Inc.
Supplementary Materials First Quarter Fiscal 2018 Earnings Call
 Supplementary Materials First Quarter Fiscal 2018 Earnings Call November 2, 2017 Safe Harbor This document contains forwardlooking statements within the meaning of the Private Securities Litigation Reform
Alphabet Inc. CONSOLIDATED BALANCE SHEETS (In millions, except share amounts which are reflected in thousands and par value)
") Assets Current assets: Alphabet Inc. CONSOLIDATED BALANCE SHEETS (In millions, except share amounts which are reflected in thousands and par value) As of December 31, 2015 As of December 31, 2016 (unaudited)
Assets Current assets: Alphabet Inc. CONSOLIDATED BALANCE SHEETS (In millions, except share amounts which are reflected in thousands and par value) As of December 31, 2015 As of December 31, 2016 (unaudited)
Symantec Reports First Quarter Fiscal Year 2017 Results
 Symantec Reports First Quarter Fiscal Year 2017 Results Revenue of $884 million, GAAP operating margin of 12% and EPS of $0.22, non GAAP operating margin of 29% and EPS of $0.29 Reiterates commitment to
For more information, contact: Brad Pogalz (952)
") For more information, contact: Brad Pogalz (952) 887-3753 Donaldson Reports Fiscal 2018 Second Quarter Earnings Second quarter sales increased 20.7 percent, driven by strong growth in both segments Tax
For more information, contact: Brad Pogalz (952) 887-3753 Donaldson Reports Fiscal 2018 Second Quarter Earnings Second quarter sales increased 20.7 percent, driven by strong growth in both segments Tax
Salesforce Announces Record First Quarter Fiscal 2019 Results Raises FY19 Revenue Guidance to $ Billion to $ Billion
 John Cummings Salesforce Investor Relations 415-778-4188 jcummings@salesforce.com Gina Sheibley Salesforce Public Relations 917-297-8988 gsheibley@salesforce.com Salesforce Announces Record First Quarter
Analog Devices, Third Quarter, Fiscal Schedule A Revenue and Earnings Summary (Unaudited) (In thousands, except per-share amounts)
 (In thousands, except per-share amounts)") Analog Devices, Third Quarter, Fiscal Schedule A Revenue and Earnings Summary (Unaudited) (In thousands, except per-share amounts) Revenue $ 1,433,902 $ 1,147,982 $ 869,591 Year-to-year change 65% 47 %
Analog Devices, Third Quarter, Fiscal Schedule A Revenue and Earnings Summary (Unaudited) (In thousands, except per-share amounts) Revenue $ 1,433,902 $ 1,147,982 $ 869,591 Year-to-year change 65% 47 %
2017 FIRST QUARTER RESULTS. Ended March 31, 2017
 2017 FIRST QUARTER RESULTS Ended March 31, 2017 Forward Looking Statements Disclaimer This presentation contains statements, including statements about future plans and expectations, which constitute forwardlooking
Supplementary Materials. For use in conjunction with the November 2, 2016 Earnings Call
 Supplementary Materials For use in conjunction with the November 2, 2016 Earnings Call 1 Safe Harbor This document contains forward-looking information and financial projections subject to risks, uncertainties
McCormick & Company, Inc. 2 nd Quarter 2018 Financial Results and Outlook
 McCormick & Company, Inc. 2 nd Quarter 2018 Financial Results and Outlook June 28, 2018 The following slides accompany a June 28, 2018, earnings release conference call. This information should be read
Itron Announces Second Quarter 2016 Financial Results
 September 1, 2016 Itron Announces Second Quarter 2016 Financial Results Updates Full-Year 2016 Guidance to Reflect Strong Business Momentum Announces New Restructuring Projects; Targeting Additional Annualized
HPE Q1 FY18 Earnings Announcement
 HPE Q1 FY18 Earnings Announcement February 22, 2018 http://www.investors.hpe.com Forward-looking statements This presentation contains forward-looking statements that involve risks, uncertainties and assumptions.
Rockwell Automation Reports Fourth Quarter and Full Year 2015 Results
 FOR IMMEDIATE RELEASE Rockwell Automation Reports Fourth Quarter and Full Year 2015 Results Fourth quarter sales down 10 per cent year over year; down 2 per cent organically Fourth quarter Adjusted EPS
News from Aon Aon Reports Fourth Quarter and Full Year 2017 Results Fourth Quarter Key Metrics From Continuing Operations and Highlights
 Investor Relations News from Aon Aon Reports Fourth Quarter and Full Year Results Fourth Quarter Key Metrics From Continuing Operations and Highlights Reported revenue increased 10 to $2.9 billion with
Alphabet Announces Fourth Quarter and Fiscal Year 2017 Results
 Alphabet Announces Fourth Quarter and Fiscal Year 2017 Results MOUNTAIN VIEW, Calif. February 1, 2018 Alphabet Inc. (NASDAQ: GOOG, GOOGL) today announced financial results for the quarter and fiscal year
Salesforce Announces Record Third Quarter Revenue, Raises Full Year Fiscal 2018 Revenue Guidance
 John Cummings Salesforce Investor Relations 415-778-4188 jcummings@salesforce.com Gina Sheibley Salesforce Public Relations 917-297-8988 gsheibley@salesforce.com Salesforce Announces Record Third Quarter
Q1 FY17 FINANCIAL RESULTS CONFERENCE CALL November 7, 2016 at 5:00 pm ET
 Q1 FY17 FINANCIAL RESULTS CONFERENCE CALL November 7, 2016 at 5:00 pm ET SAFE HARBOR AND NON-GAAP Safe Harbor Statement This presentation contains certain comments that are forward-looking statements,
Q Earnings Call. April 24, 2013
 Q2 2013 Earnings Call April 24, 2013 Forward-Looking Statements and Non-GAAP Measures Forward-Looking Statements -- This presentation contains certain forward-looking statements within the meaning of the
4Q17 EARNINGS FEBRUARY 2018
 4Q17 EARNINGS FEBRUARY 218 2 FORWARD-LOOKING STATEMENTS The statements contained in this release that refer to plans and expectations for the next quarter, the full year or the future are forward-looking
ACCELERATED ANNUALIZED RECURRING REVENUE (ARR) GROWTH HIGHLIGHTS AUTODESK'S SECOND QUARTER RESULTS
 GROWTH HIGHLIGHTS AUTODESK'S SECOND QUARTER RESULTS") Investors: Abhey Lamba, 415-547-3502 abhey.lamba@autodesk.com Press: Stacy Doyle, 971-238-5722 stacy.doyle@autodesk.com ACCELERATED ANNUALIZED RECURRING REVENUE (ARR) GROWTH HIGHLIGHTS AUTODESK'S SECOND
Investors: Abhey Lamba, 415-547-3502 abhey.lamba@autodesk.com Press: Stacy Doyle, 971-238-5722 stacy.doyle@autodesk.com ACCELERATED ANNUALIZED RECURRING REVENUE (ARR) GROWTH HIGHLIGHTS AUTODESK'S SECOND
PTC PREPARED REMARKS THIRD QUARTER FISCAL 2018 JULY 18, 2018
 PTC PREPARED REMARKS THIRD QUARTER FISCAL 2018 JULY 18, 2018 Please refer to the updated Important Disclosures section of these prepared remarks for important information about our operating metrics (including
Aon Reports First Quarter 2018 Results
 Investor Relations News from Aon Aon Reports First Quarter 2018 Results First Quarter Key Metrics as Reported under U.S. GAAP (1) Total revenue increased 30% to $3.1 billion, including an increase of $365
Q3 Fiscal Year 2016 Financial Results January 20, 2016
 Q3 Fiscal Year 2016 Financial Results January 20, 2016 FORWARD-LOOKING STATEMENTS This presentation contains forward-looking statements within the meaning of the federal securities laws, including, without
1Q15 Earnings May 2015
 1Q15 Earnings May 2015 Forward-Looking Statements The statements contained in this presentation that refer to plans and expectations for the next quarter, the full year or the future are forward-looking
Q FINANCIAL RESULTS CONFERENCE CALL. Tuesday, April 23, :00 P.M. Pacific Time
 Q1 2013 FINANCIAL RESULTS CONFERENCE CALL Tuesday, April 23, 2013 2:00 P.M. Pacific Time Forward Looking Statements Information, statements and projections contained in these presentation slides and related
HealthEquity Reports Fourth Quarter and Fiscal Year Ended January 31, 2018 Financial Results
 HealthEquity Reports Fourth Quarter and Fiscal Year Ended January 31, 2018 Financial Results Highlights of the fiscal year include: Revenue of $229.5 million, an increase of 29% compared to FY17. Net income
Aon Reports Third Quarter 2018 Results
 Investor Relations News from Aon Aon Reports Third Quarter Results Third Quarter Key Metrics as Reported under U.S. GAAP (1) Total revenue was flat at $2.3 billion, including a decrease of $117 million,
PTC Announces Fourth Quarter and Fiscal Year 2018 Results
 PTC Announces Fourth Quarter and Fiscal Year 2018 Results Bookings Near End of Guidance; Strong Recurring Software Revenue Growth NEEDHAM, MA, October 24, 2018 - PTC (NASDAQ: PTC) today reported financial
McCORMICK REPORTS DOUBLE DIGIT THIRD QUARTER SALES AND PROFIT GROWTH AND INCREASES 2018 EARNINGS PER SHARE OUTLOOK
 FOR IMMEDIATE RELEASE McCORMICK REPORTS DOUBLE DIGIT THIRD QUARTER SALES AND PROFIT GROWTH AND INCREASES 2018 EARNINGS PER SHARE OUTLOOK HUNT VALLEY, Md., September 27, 2018 - McCormick & Company, Incorporated