Value for Money Self-Assessment Approved by bpha Board 18 July 2017
|
|
|
- Annis Griffith
- 5 years ago
- Views:
Transcription


1 Self-Assessment Approved by bpha Board 18 July 2017
2 Content of Self-Assessment Report 1 Value for Money (VfM) Introduction and Regulatory Requirements Regulatory requirement Overall Value for Money (VfM) strategy Value for Money Executive Summary A Successful Year in Delivering Value for Money Return on Assets Social and Environmental Returns Resident satisfaction Efficiency gains and future improvements to VfM VfM Benchmark Regulatory Framework for VfM What the Regulatory Framework requires of the self-assessment Key stakeholders What does VfM mean to bpha? Return on assets Operating costs Return from existing properties Benchmarking Delivery of new homes Help to Buy Property Sales and other Services Social and environmental returns Resident satisfaction Complaints and compliments... 33
3 5.3 Energy efficiency Aids and adaptations Volunteers Efficiency gains delivered and planned Introduction Summary of efficiency gains delivered in 2016/ Case studies Planned efficiency gains for 2017/
4 1 Value for Money (VfM) Introduction and Regulatory Requirements 1.1 Regulatory requirement The Board is responsible for our compliance with the Homes and Communities Agency (HCA) regulatory framework including the requirement to evaluate and communicate our VfM performance This self-assessment report has been prepared with input from all areas of our business and has been reviewed by our Board. This report is published on our website and a summary of this report has formed the basis of the information included within the published audited financial statements for the year ended 31 March This self-assessment sets out how we have delivered VfM across the business during the year to 31 March Overall Value for Money (VfM) strategy We have a VfM strategy which sets out the framework by which efficiencies and savings are generated and how the delivery of Value is measured. When measuring value, we look at quality as well as cost. Other factors considered in assessing value include: Achieving the best possible outcomes with the best use of finite resources; Budgetary control, forecasting and benchmarking drives cost reduction to increase quantity, quality and appropriateness of our homes and services; Exercising discretion where appropriate to apply innovative techniques to drive value for money; Providing services that aim to improve customers financial wellbeing which enables them to sustain their tenancies In summary, value for money means: Spending less delivering services on budget and on time, procurement achieves the lowest possible cost without harming quality; Spending well delivering services efficiently; Spending wisely demonstrating that we have achieved our objectives within budgetary constraints; Spending fairly demonstrating that all services and benefits are distributed equitably. Page 1 of 39
5 2 Value for Money Executive Summary 2.1 A Successful Year in Delivering Value for Money The Board has concluded that we have been successful in delivering VfM, having continued to maintain tight control of operational costs with investment into resident service delivery and the maintenance of existing stock, delivered new homes and restructured funding at lower cost. The following paragraphs set out the basis for this conclusion and the report concludes with a summary of key VfM benchmarks. 2.2 Return on Assets Over the past five years our operating surplus has grown significantly. This has been achieved through a combination of a strong contributions from social housing lettings, first tranche shared ownership and asset sales as well as the benefits of refinancing undertaken in previous years During the year, in line with our target and consistent with previous years, we developed or acquired 508 homes at a cost of 57.3m. Each of these developments has met various financial hurdles and therefore contributes positively to our on-going performance whilst providing much needed affordable accommodation We have an experienced in-house Property Sales team who sell our own properties as well as providing services to other associations. During the year, we made 493 sales (some of which represents the sale of further equity to our shared ownership residents). These sales delivered a surplus of 19.7m Our investment of 4m into our joint venture, Gog Magog Partnership LLP has returned profits of 2.1m this year. This surplus will be reinvested in further development of affordable homes and provides us with the opportunity to work in partnership with a commercial developer During the year 22.8m ( 11.4m capital and 11.4m revenue spend) was invested to maintain or improve our existing stock. This investment equates to 1,252 per home which is low by benchmark standard. This relatively low cost for repairs and maintenance is attributed to several factors including the young age and the good average condition of our stock and efficiencies from procurement To ensure that this investment in our existing stock delivers value for money, we use live stock condition information. We record stock condition data for all our stock Page 2 of 39
6 where we have a repairing responsibility and resurvey all such stock every five years. During the year 2,520 properties were resurveyed to keep stock condition data up to date. 2.3 Social and Environmental Returns k (2016: 396k) was invested in aids and adaptations to support disabled and elderly residents with 98 (2016: 85) major and 315 (2016: 312) minor adaptions carried out. This investment contributed to the continued independence, autonomy and well-being of our residents We measure the energy efficiency of our homes using the Standard Assessment Procedure (SAP) rating. We now have SAP ratings for 13,995 properties, which is 97% of our eligible stock. Our average SAP rating is 73.52, which is an increase of 0.94 from the previous year. Whilst new properties will typically be more energy efficient this rise can largely be attributed to the collection of additional energy performance certificates (EPC) following energy efficiency works. In the coming year, we plan to reassess a further 195 properties to ensure that SAP rating information is kept up to date We now have a very good understanding of the energy efficiency of our stock and have had a budget approved to address the poorest performing properties in the coming year. Measures we will be taking include installing cavity wall insulation, improving loft insulation, fitting new, more efficient storage heaters and replacing old boilers. Carrying out this work, with a budget of 319k, will ensure we do not have any properties with a SAP rating in the lowest bands We consider that investment in energy efficiency represents VfM: o from a resident s perspective; this reduces their potential bills, improves the quality of their lives and reduces the risk of fuel poverty; and o from our perspective; more energy efficient homes are more valuable, improving return on assets, and the reduction in fuel poverty potentially improves the chances of residents being able to meet their rent commitments. Page 3 of 39
7 2.3.5 Our volunteers support our work with local communities and comprise members of the local community, members of staff and our customers. Together these volunteers contributed more than 2,200 hours during 2016/17 on activities such as garden clearance, helping with the local Food Bank, school reading programs, communal area painting, bulky waste collections, litter picks and many more. In addition in March 2017 we ran a call centre on behalf of the BBC s Comic Relief Red Nose Day with staff volunteering over 540 hours to make this possible. 2.4 Resident satisfaction We are committed to improving the quality of services offered and thus improving resident satisfaction. Results from customer contact surveys, detailed in the table below, show that targets were generally met or exceeded and therefore we anticipate that the benefits from this ongoing investment and focus will be fully realised in due course. Customer Satisfaction Ease of Contact Polite Knowledgeable Dealt with enquiry fully Overall satisfaction Target 90% 95% 93% 85% 95% Average 2016/17 95% 98% 93% 88% 95% During the year, we improved the way we collect and evaluate post-repair customer feedback. Results from these surveys show that the overall resident satisfaction rate for the whole year was 96% which is excellent and indicates a good level of customer service in this area Complaints are a great source of information in order to identify areas for improvement and we have made it easier for customers to contact and provide feedback. During the year 432 complaints were managed, which represents a reduction of 27% compared to the previous year Each year, we canvas our new shared ownership customers to ascertain their satisfaction with our Options to Buy sales service. We are pleased that for 2016/17, 89% of customers were either satisfied or very satisfied with the overall service delivered by our Options to Buy team Resident satisfaction performance over time and against benchmark: Page 4 of 39
8 2017/ / / / /15 Benchmark* Resident satisfaction with: Target Actuals Target Actuals Actuals Median General Needs Rent Provides value for money 85% 87% 85% 85% 85% 83% Overall Service Provided 87% 89% 87% 82% 82% 84% Housing for Older People Rent Provides value for money 85% 88% 85% 93% 89% 90% Overall Service Provided 95% 94% 95% 95% 93% 91% Shared Ownership Rent Provides value for money 70% 73% 70% 68% 72% 67% Overall Service Provided 70% 78% 65% 62% 59% 48% *Benchmark Data Housemark April We continue to increase our focus upon mobile working and during the year, new hardware and software has been rolled out to Home Agents to enable an increasing number of tasks to be done on-line whilst staff are face to face with our customers. Planned investment in new IT systems over the next two years will increasingly enable residents to access information, to request services and to make amendments to tenancy, payment and other data via smart phones or other devices at times which suit them best. 2.5 Efficiency gains and future improvements to VfM Our approach to recording efficiency gains is to include only the gains achieved relating to the first year, since even if they recur in later periods they are considered to be business as usual, as they will have been absorbed into budgets and business plans. Accordingly, recurring gains are not recorded in later years VfM selfassessments During the year, we have started to manage our operations through defined business units. This has been done to enable a more commercial approach to asset management. Specific assets have been aligned directly to the services that are provided from them, allowing the income and costs that are directly associated with each property and service line to be analysed in more detail. The insights from this more sophisticated approach will support further improvements in ensuring that the best VfM performance is achieved from our assets Last year we identified 1m of expected efficiency gains from re-procurement of various repairs and maintenance contracts. We estimate that we have actually Page 5 of 39
9 delivered just under 2.5m from this major piece of work which was delivered during the year by our new Procurement department Where we have strength and depth in areas such as Development and Sales, we continue to sell these services to other organisations (typically other housing associations and Local Authorities). This generates additional income to cover our costs and allows other organisations to benefit from our expertise in these areas. These strong in-house teams allow us to control the quality of service that we provide to our customers We have been actively promoting a shift in our customer service to our on-line selfservice portal and this has already had the effect of reducing call demand. We have set ambitious targets for a wider channel shift to digital via our planned investment in technology which will deliver further efficiency savings once it is achieved. However, these improvements will not be realised immediately and will build up over the next two years We have recently implemented improvements to debt collection by better use of automated work-flow and refreshed letters and a better system for early intervention. 2.6 VfM Benchmark Our group performance against the key VfM indicators we benchmark ourselves against, together with our targets for 2017/18, are set out in the table below. The benchmark used in the table below is from the 2016 HCA Global Accounts. As discussed in the preceding paragraphs, we achieved results which were better than benchmark. In most areas, we outperformed our 2016/17 target, but depreciation costs increased, causing our operating cost per home to exceed target. Page 6 of 39
10 2017/18 Target 2016/17 Actual 2016/17 Target 2015/16 Actual Benchmark Staff cost per unit ,076 Planned and routine maintenance cost per home ,015 Capital expenditure on existing properties per home Total expenditure on properties per home 1,262 1,252 1,298 1,294 1,902 Management & other operating costs ( '000) 34,356 32,099 33,165 31,184 - Depreciation ( '000) 14,179 14,439 12,781 12,522 - Total expenditure on social housing lettings ( '000) 48,535 46,538 45,946 43,706 40,283 Operating cost per home excluding first tranche shared ownership sales 2,629 2,559 2,517 2,442 4,999 Operating margin on social housing lettings 44.5% 44.5% 45.0% 46.0% 31.6% Rent void loss per home Rent arrears % 3.2% 3.3% 3.8% 3.5% 3.4% Bad debts per home Total number of homes 18,461 18,186 18,254 17,896 8,058 Units developed as % of units owned 2.6% 2.8% 2.9% 2.5% 1.6% Net debt per home 40,997 37,833 38,694 38,020 20,468 1 Higher target set for 2017/18 to reflect the impact of the roll out of Universal Credit Whilst it is useful to consider our performance against that of the sector as a whole, we recognise that the associations included in the HCA Global Accounts include many whose operations and business model are fundamentally different to that of bpha Therefore in 2017 for the first time we have also benchmarked ourselves to a group of housing associations which are comparable in terms of size and geography. This has shown that our performance is generally within or stronger than the upper quartile of our benchmarking group reflecting our tight focus on financial controls, younger stock profile and commitment to building new homes. This benchmarking reflects bpha Limited performance against the peer group, so some results vary from those shown in the table above which includes bpha group results. Page 7 of 39

11 Page 8 of 39

12 2.6.4 Our operating margin on social housing lettings is high by sector standard and we also perform better than the upper quartile of our peer group on this measure. Headline social housing cost per home is between the lower and median quartile compared to our peers. Management cost per home 1,400 1,200 1, (National Upper) (National Median) (National Lower) Peer (Upper) Peer (Median) (Peer Lower) bpha (actual 2016) bpha (actual 2017) Page 9 of 39

 300% 250% 200% 150% 100% 50% 0% (National Upper) (National Median) (National Lower) Peer (Upper) Peer (Median) (Peer Lower)")
13 2.6.5 Our repairs and maintenance costs per home are also between the lower and median quartile compared to our peers, in part reflecting our relatively young stock but also due to efficient contract procurement and management. Our management cost per home is between the upper and median quartiles compared to our peers. Interest Cover - EBITDA (MRI) 300% 250% 200% 150% 100% 50% 0% (National Upper) (National Median) (National Lower) Peer (Upper) Peer (Median) (Peer Lower) bpha (actual 2016) bpha (actual 2017) Earnings before interest, tax, depreciation and amortisation, major repairs included Page 10 of 39
14 (EBITDA MRI) is used to measure financial strength. In absolute monetary terms we perform strongly on this measure against our peers, being above the upper quartile. When we look at EBITDA MRI as a percentage of interest payable and similar charges, we perform between the lower and median quartiles of our peer group. This is a sector standard measure which is used to assess the level of headroom on meeting interest payments on outstanding debt and our performance reflects our relatively high gearing We are proud of our development track record and the graph of units developed as a percentage of units owned illustrates a strong performance relative to our peers. In 2017, our performance on this measure was above the upper quartile of our peer group. We would note that there is a wide range of performance amongst our peers on this measure. Page 11 of 39
15 3 Regulatory Framework for VfM 3.1 What the Regulatory Framework requires of the self-assessment The Homes & Communities Agency (HCA) sets out the requirement that we should articulate and deliver a comprehensive and strategic approach to achieving value for money in meeting our objectives, considering the interests of our various stakeholders. We are required to: Have a robust approach to decision making regarding the use of resources. Understand the return on our assets and have in place a strategy for optimising this in the future. Have performance management and scrutiny functions that are effective at driving and delivering improved value for money performance. Understand the costs and outcomes of delivering specific services Our Board has ultimate responsibility for the governance of the organisation. Its central role is to lead, direct, control and evaluate our work. Our Board is required to be able to demonstrate how they are meeting the HCA Value for Money Standard and this is done as follows: All decision reports to the Board include a section on value for money; Financial regulations are set and compliance is monitored; Our plans are formulated by budget holders from a zero base each year. Our budget challenge process requires that expenditure needed to deliver plans is scrutinised by Senior Managers, Executive Leadership, Finance and Treasury Committee and finally, agreed by Board. Budget holders have to consider and justify that budgets deliver VfM. The overall proposed budget is also scrutinised regarding the HCA value for money industry average indicators (obtained from the published HCA housing global accounts), against previous year s results and against comparable organisations. Our financial performance is measured against our plans; Our performance is managed by ensuring staff and teams are given targets which are monitored regularly; Our annual value for money self-assessment enables stakeholders to understand the return on assets measured against our objectives, sets out the absolute and comparative cost of delivering services and evidences the value for money gains that have been and will be made. Page 12 of 39
16 3.2 Key stakeholders We have many stakeholders including residents, potential residents, local authorities, the HCA, HMRC, suppliers, employees, banks and investors to name but a few. In some cases, the interests of these stakeholders may not align or may potentially conflict We appreciate the importance of considering stakeholders different interests to deliver VfM on a sustainable long term basis whilst meeting our objectives. We recognise the need to balance the deployment of assets and resources between the various competing claims. We have detailed strategic business planning and budget processes to ensure that assets and resources are deployed in an optimum manner over the short, medium and long term to deliver VfM whilst enhancing long term viability. 3.3 What does VfM mean to bpha? Our purpose is by being increasingly efficient and always considering those we house, we will continue to build and maintain quality homes and thriving communities Our ambition is to achieve exceptional value for money through: the adoption of a new, focused operational structure which delivers efficient services to defined standards; the pro-active pursuit of housing developments for profit to improve our overall financial performance whilst delivering on average at least 500 new homes per annum; working in partnership where doing so can utilise synergies to enhance value; fostering community cohesion which is good for our customers, their neighbours and makes business sense; making our properties more desirable and easier to let; developing new products and services that will support and encourage people to take control of their own housing needs to meet their longer-term housing aspirations We face several challenges in the next 3 to 5 years including welfare reform and other economic pressures. We plan to manage these challenges by building on our Page 13 of 39
17 experience of delivering social housing and other services and by investing in technology and people to improve the efficiency and flexibility of our services The surplus that we deliver is re-invested to both maintain our homes and to provide more affordable homes We will deliver value for money through agreed outcomes in our organisational strategies and plans. Our budgets and operation plans will set out our value for money targets and our decisions will be based on business cases which set out the value for money considerations. Our aim is to: Embed value for money across the business, for example, our six values and behaviours encourage colleagues to work innovatively and efficiently; Continue to incorporate value for money targets into our procurement and asset management strategies; Measure value for money consistently transparently and objectively, for example, joining the sector score card pilot scheme; Report our value for money challenges and achievements each year in our Value for Money Self-Assessment; Understand the cost and outcomes of delivering specific services by working through defined business units, each with a commercial manager, who will bring strong commercial focus to drive the delivery of value for money, quality assured services; Monitor our progress against our internal targets and with reference to external bench mark performance throughout the year. We will utilise HCA global accounts and other sources to provide appropriate bench mark data for these comparisons; Via regular re-forecasts we will ensure we achieve our annual targets. This will also give greater insight into our budgets to allow us to have more financial manoeuvrability during the year. This approach will enable us to make robust strategic decisions VfM is at the heart of all that we deliver and is considered at all levels in the organisation both when making resource allocation decisions and in reports on performance. This is now also routinely considered as part of Governance through various layers of management reporting and through Board and Committees In summary, value for money means: Spending less delivering services on budget and on time, procurement achieves the lowest possible cost without harming quality; Page 14 of 39

18 Spending well delivering services efficiently; Spending wisely demonstrating that we have achieved our objectives within budgetary constraints; Spending fairly demonstrating that all services and benefits are distributed equitably. 4 Return on assets 4.1 Operating costs Operating performance on social housing lettings: Over the last five years our operating surplus on social housing lettings has grown from 33m to over 37m with the margin slightly lower than last year at 45% (2016: 46%), due to the impact of the 1% general needs rent reduction year on year. Over the same five-year period, our overall operating surplus, including non-social and non-lettings activities, has grown from 36m to 55m in 2016/ In assessing if this high margin represents good Value for Money, we have considered various factors including whether: The margin is evidence of effective cost control or whether it could suggest underinvestment in operational services? and The total expenditure on properties per home, which is much lower than the sector average, was evidence of efficiency or had simply been achieved through cutting back on maintaining the stock? Page 15 of 39
19 4.1.3 Before addressing property expenditure as part of the VfM analysis we have considered the costs of staff involved in social housing activity. We have continued this year as the Help to Buy agents for the East & South East of England, and staff providing this service are not involved in either the provision of housing management services or in development of new homes, so the analysis has excluded costs and staff numbers in relation to Help to Buy employees. Details are set out below: Staff Numbers (excluding Help to Buy) A Total Staff Costs (excluding Help to Buy) B 12,492 12, Total Number of Units C 18,186 17,896 Staff Cost Per Unit B/C Units Per Member of Staff C/A This year employee costs at 687 per unit (2016: 700) were slightly lower than our target of 695 as recruitment into vacant posts took longer than planned. Our plan is to invest in capacity and capability to drive efficiencies which will be delivered during subsequent periods. This means that our target for staff cost per unit is 768 for 2017/18 reducing to 746 the following year. This target is set against a national benchmark average staff cost per unit of 1,076. Page 16 of 39
20 4.2 Return from existing properties Introduction Our existing properties can be summarised as follows: Number of units owned and managed 2016 General Housing 11,662 Low cost home ownership 2,060 Supported housing 725 Residential care homes 959 Non-social 1,009 TOTAL OWNED 16,415 Homebuy & shared equity 988 Leaseholders 597 Managed for others 186 TOTAL OTHER PROPERTIES 1,771 TOTAL OWNED & MANAGED 18, In summary, nearly two thirds of our stock is classified as general housing property. This stock is relatively young with nearly half of it being less than 20 years old. It is predominantly conventional family housing, concentrated in the Oxford to Cambridge arc and easily accessible from our Bedford base. All of these factors help to control costs; the on-going operational expenditure as well as the investments required to maintain the stock We routinely have to make decisions regarding existing stock between: Maintaining stock in its current condition; or Investing to improve or redevelop the stock; or Disposing of the stock. In each case, we consider how the decisions impact on our overall business and VfM objectives We take account of various factors in reaching such decisions, including: The need to ensure that all stock meets or exceeds the Decent Homes standard and the current or projected future cost to achieve this; The demand for the type of property and the void experience; Page 17 of 39
21 The on-going repairs and maintenance and housing management service costs; How the property fits into the wider portfolio both by location and type as this impacts upon on-going costs; If the property were to be sold what this would mean in terms of recycled grant becoming repayable, what it means to levels of security available to charge to lenders/investors, whether funds released would be sufficient to support development of a replacement property and so forth; and Whether the property could be redeveloped to provide a better solution to meet local needs. Stock condition data To help answer the above questions, we use our live stock condition information. We record stock condition data for all our stock where we have a repairing responsibility and resurvey all such stock every five years. During the year 2,520 properties were resurveyed to keep stock condition data up to date This detailed stock condition data makes future maintenance liabilities visible and enables us to plan work in cost effective packages to deliver the greatest VfM. Historically our budgeting for this type of cost has been reliable, but the increased data makes it possible to plan specific works by estate, street, block or house enabling us to place larger contracts at more competitive prices The stock condition data has led to greater proactive contact with residents during the year: firstly, there is contact to update the stock condition data which provides a useful opportunity to listen to residents even when there is no need for them to speak to us; secondly we are contacting residents to inform them well in advance as to what improvements are planned and when these will take place. We believe that both of these proactive contacts will help to improve resident satisfaction Whilst stock condition data enables efficient planning of work, components will only be scheduled for replacement at the end of their working lives. There can be considerable variance in the programme of works required between years as early replacement simply to smooth out capital spending does not represent good VfM As well as improving resident satisfaction, ongoing investment in our relatively young homes will improve the overall housing pool thereby maximising asset values and ensuring that we avoid the build-up of legacy problems. Increasing the values of our Page 18 of 39
22 Responsive repairs stock strengthens our overall financial resilience and provides assets chargeable to lenders or investors to support the ongoing development programme During the year to 31 March m ( 11.4m capital and 11.4m revenue spend) was invested to maintain or improve our existing stock. This investment equates to 1,252 per home which is low both by national benchmark standard but also compares favourably to our peer group. This relatively low cost for repairs and maintenance is attributed to several factors including the young age and the good average condition of our stock and efficiencies from procurement Details of the improvements to homes resulting from this investment included: o 27,021 responsive repairs made at the resident s request within a defined SLA; o 713 refits of void properties; and o 6,670 components repaired or replaced We have considered whether the responsive repairs service represents VfM. Our responsive repairs service is essentially provided by three teams: o o o Our in-house, award winning call centre who provide the first point of response to a resident; Property Services our in-house team of surveyors and other technical specialists who manage contractors and oversee the work undertaken; and The responsive repairs contractors who deliver the responsive repair work The in-house staff costs have already been considered as part of the cost analysis in During 2016/17 the total cost per home on planned, routine and responsive maintenance was 3.3% lower than prior year. This was in part due to savings delivered by the re-procurement of several contracts at the start of the year. Despite slightly reduced spend, investment on existing properties is carefully controlled to ensure our stock continues to meet the government s Decent Homes standard and therefore the reduction in spend represents good VfM for our residents. Net Present Value During the year we undertook analysis of Net Present value of our stock concentrating upon stock located outside of core operational areas or where we have lower stock concentration. This built upon a full review of the NPV of all stock Page 19 of 39
23 undertaken in The NPV analysis did not identify any stock with a negative net present value and accordingly there is no reason to embark upon a wider asset disposal programme to generate / preserve value During 2017/18 we intend to extend this analysis to update the NPV data to include all stock. Asset modelling & disposal decisions: case studies The conversion of our old head office, Pilgrims House in the centre of Bedford, into affordable homes is an example of the use of financial modelling to inform decisions. The business had outgrown its current accommodation and decided that the option of occupying two office sites would mean losing out on the efficiencies that being located on one site with our repairs contractor could offer. A business case was constructed using suitable analysis and scenario testing to support the office move to a new location and the application using the Permitted Development planning rights route to obtain a change of use to provide new affordable homes. We explored several options for redeveloping the site including selling the site in its existing state, and concluded that we would generate the most value by converting into apartments for sale. Modern and affordable housing in the centre of Bedford is in high demand evidenced by nearly the entire scheme selling off plan During the year, properties in the Queens Park area in Bedford were scheduled for replacement roofs. However, during the survey phase we recognised that we would achieve greater Value for Money by combining these works with other improvements to enhance the properties. In total, 194 properties have benefitted from the programme of work which has included reroofing, communal area improvements and repair of existing boundary walls and gates for a total contract value of c 900k. We worked with Councillors, highways and community development, our resident inspectors, street rangers and Fire Safety officers to ensure that the project ran smoothly. CE, a resident in Queens Park since 1999, said It has been completely refreshed. It looks like a new area now. This has given us a sense of pride and it has really brought the community together. 4.3 Benchmarking Key benchmark data (using HCA Global Accounts for 2016) relating to group cost is set out below and shows that costs are carefully controlled and compare well with Page 20 of 39


24 other associations in the sector Whilst it is useful to consider our performance against that of the sector as a whole, we recognise that the associations included in the HCA Global Accounts include many whose operations and business model is fundamentally different to that of bpha Therefore in 2017 for the first time we have also benchmarked ourselves, using the 2016 HCA Global Accounts, to a comparable group of housing associations in terms of size and geography, as well as nationally. This has shown that our performance is generally within or stronger than the upper quartile of our benchmarking group reflecting our tight focus on financial controls, younger stock profile and commitment to building new homes. This benchmarking reflects bpha Limited performance against the peer group, so some results vary from those shown in the table above which includes bpha group results To create an appropriate peer group for comparison, we have reviewed the HCA Global Accounts for year ended 31 March 2016 and applied the following criteria: Page 21 of 39
25 Included associations with 50% or more of social housing stock within the eastern and south eastern regions; From this group, we excluded associations with over 30,000 and those with less than 7,000 units to retain associations of a comparable size; This resulted in a peer group of 13 associations, which contains 7 associations with a larger number of social housing units than bpha and 6 with a smaller number of units. The peer group is made up of the following associations: A2Dominion Housing Group Limited Aldwyck Housing Group Limited AmicusHorizon Limited Cross Keys Homes Limited First Wessex Flagship Housing Group Limited Grand Union Housing Group Moat Homes Limited North Hertfordshire Homes Limited Paradigm Housing Group Limited Radian Group Limited Southern Housing Group Limited Thames Valley Housing Association Limited Page 22 of 39

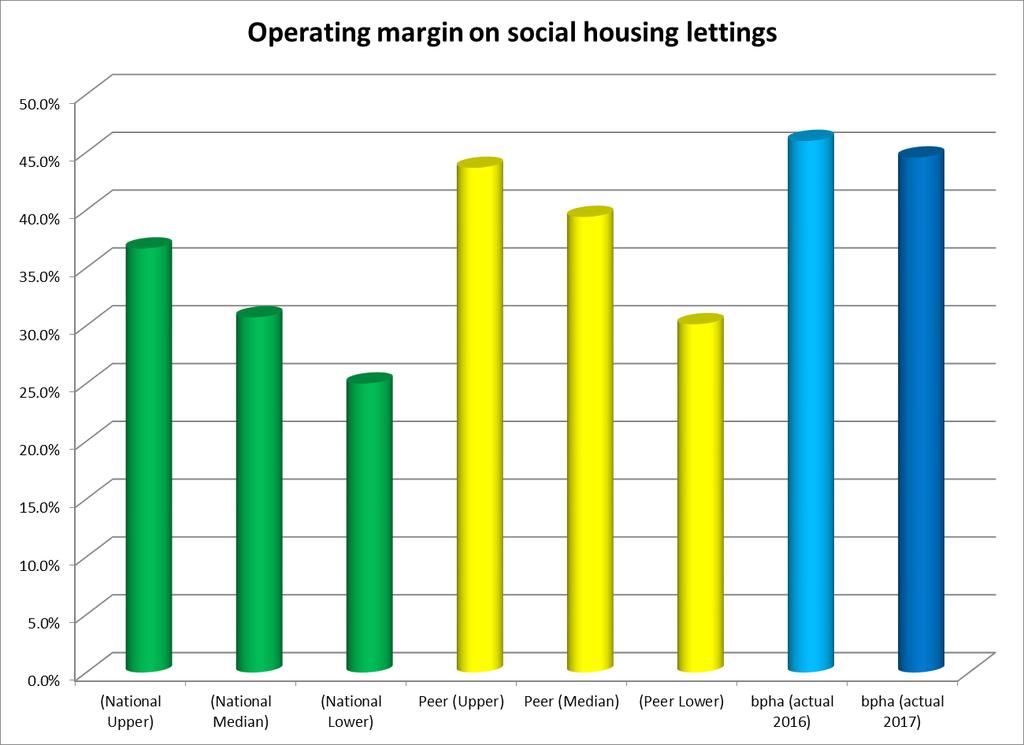
26 Operating margin on social housing lettings (National Upper) (National Median) (National Lower) Peer (Upper) Peer (Median) (Peer Lower) bpha (actual 2016) bpha (actual 2017) Our operating margin on social housing lettings is high by sector standard and we also perform better than the upper quartile of our peer group on this measure. Feeding into this performance, our headline social housing cost per home* is between the lower and median quartile compared to our peers. Page 23 of 39

27 *as defined on the sector scorecard as management and service charge costs plus routine, planned and major repairs expenditure plus other social housing expenditure divided by social housing units managed. Management cost per home 1,400 1,200 1, (National Upper) (National Median) (National Lower) Peer (Upper) Peer (Median) (Peer Lower) bpha (actual 2016) bpha (actual 2017) Our repairs and maintenance costs per home are also between the lower and median quartile compared to our peers, in part reflecting our relatively young stock but also Page 24 of 39
 300% 250% 200% 150% 100% 50% 0% (National Upper) (National Median) (National Lower) Peer (Upper) Peer (Median) (Peer Lower) bpha (actual 2016) bpha (actual 2017) 4.3.7 Earnings before interest, tax, depreciation and amortisation, major repairs included (EBITDA MRI) is used to measure financial strength.")
28 due to efficient contract procurement and management. Our management cost per home is between the upper and median quartiles compared to our peers. Interest Cover - EBITDA (MRI) 300% 250% 200% 150% 100% 50% 0% (National Upper) (National Median) (National Lower) Peer (Upper) Peer (Median) (Peer Lower) bpha (actual 2016) bpha (actual 2017) Earnings before interest, tax, depreciation and amortisation, major repairs included (EBITDA MRI) is used to measure financial strength. In absolute monetary terms we perform strongly on this measure against our peers, being above the upper quartile. Page 25 of 39

29 When we look at EBITDA MRI as a percentage of interest payable and similar charges, we perform between the lower and median quartiles of our peer group. This is a sector standard measure which is used to assess the level of headroom on meeting interest payments on outstanding debt and our performance reflects our relatively high gearing We are proud of our development track record and the graph of units developed as a percentage of units owned illustrates a strong performance relative to our peers. In 2017, our performance on this measure was above the upper quartile of our peer group. We would note that there is a wide range of performance amongst our peers on this measure In section above we posed the question whether our strong margin on social housing letting represents VfM? We want to ensure that the return on assets represents VfM considering different stakeholders interests. Our conclusion is that: The margin benefits from the stock profile which makes it efficient to service and maintain and this represents good VfM; Cost control has been good, particularly in relation to total expenditure on properties per home, and this represents good VfM; Page 26 of 39
30 Stock has been maintained to a good standard with benefits arising from good data, and this represents good VfM; There is no VfM advantage to be gained from stock rationalisation; and The year has delivered some improvements in resident satisfaction levels, however, our resident service targets were not completely met this year and we therefore plan to continue to focus on service delivery with the aim of continuing improvement over the coming years Therefore, whilst we will continue to develop new homes, there will be a continued emphasis upon investment in existing stock, improving communities and investing in technology to improve our service delivery to residents. We believe that these measures will continue to improve our delivery of VfM. 4.4 Delivery of new homes Across our core area of operations, broadly the arc between Oxford and Cambridge, the huge demand for housing and relative economic affluence has pushed up housing prices. This has created an ever-greater need for affordable housing for those who are unable to access housing for rent and sale at the prevailing market rates. We have been a provider of new affordable housing for a significant time, building or acquiring an average of 485 units per annum in the five years to 31 March Before considering how we deliver/determine VfM in relation to specific development sites, in general terms, the reason that we deliver VfM on developments is that having been a significant developer of new homes in our region for many years in relation to our size: We employ large and experienced in-house development and employers agents teams who have the broad range of skills necessary to undertake developments efficiently; and Our development on-costs are spread across a large number of homes and accordingly the cost per home is kept much lower than would otherwise be the case It should be noted that each development scheme must independently meet various financial hurdles. Scheme appraisals do not take account of any cross subsidy from the surpluses generated from the existing stock of properties. As in previous years, during 2016/17 current residents rents have not subsidised the development of new Page 27 of 39
31 homes for future residents During the year ended 31 March 2017 we developed and acquired 508 homes (2016: 450 new homes) at a gross cost of 57.3m (2016: 47.6m). This delivery was slightly ahead of our target for the year of 491 new homes. Our aim is to continue to build new homes across our operating region and in the year to 31 March 2018 we aim to deliver around 500 new homes. New Units 2016/17 Rented social housing 194 Shared Ownership 191 Care 64 Other 59 TOTAL This year, our investment of 4.0m (2016: 5.0m) into our joint venture associate, Gog Magog Partnership LLP returned profits of 2.1m (2016: 1.6m). This surplus will be reinvested in further development of affordable homes and provides us with the opportunity to work in partnership with commercial developers Many of the new homes this year have been built on the Cambridge Southern Fringe, where an active local economy and high demand have led to some of the highest price increases outside of London. This has made it impossible for many people, including those working in low paid employment, to access housing on the open market. Including Cambridge, we are currently developing homes over 27 separate development schemes across 16 locations Since demand for new housing massively exceeds our capacity to supply we have established a process to determine where scarce financial and development resources should be invested to deliver the greatest VfM. This process includes regular executive meetings which consider and approve or decline all development opportunities and which, in reaching decisions as to what represents VfM, consider many factors including: The overall financial capacity to commit to development; The Internal Rate of Return that will be achieved from the development and how this compares to cost of capital; Risks; Local demand not only need for homes, but the types of homes in shortest supply, competition, and development concentration; Page 28 of 39
32 How the development fits with other housing we own, including how efficient it will be to manage and service; How affordable the rent and service charges will be and how cheap the property will be for residents to live in, particularly utility costs; The importance of building communities not just houses; and The security value that will be achieved for the homes when the development is completed compared with cost net of grant and therefore whether this enhances or dilutes our capacity to continue to develop in the future This rigorous process means that we turn down more development opportunities than those to which we commit and ensures that those undertaken represent VfM Our conclusion is that our development activity represents good VfM. 4.5 Help to Buy At the start of 2014/15 we were awarded by HCA the Help to Buy agency for the South East and East of England. During 2016/17 this contract was extended to March 2017 and has since been extended again, to July In due course, we intend to bid for this contract post July The Help to Buy team of around 50 employees have processed around 80,500 applications and 74,500 calls under the Shared Ownership and Equity Loan Scheme. The team have exceeded the HCA performance target for the third year running with the number of completions reaching over 8,500 for 2016/ Property Sales and other Services In terms of delivery of new homes, we have provided various services to other associations to help them increase housing supply. In 2016/17 units were developed under agency agreements for another organisation generating a surplus on sale of 194k (2016: equivalent development agency fee income of 76k). In addition, first tranche shared ownership sales were made on behalf of other RP s generating a further 101k (2016: 329k) in agency fees. Such work offers VfM both through the income generated on the back of existing skills and capacity and to the partner associations through giving them access to our expertise and developments without them needing to recruit in-house development resource In addition to our sales agency work, we had a successful year with regard to sales of Page 29 of 39
33 our own properties, with 259 existing units either sold outright or sold to increase the proportion owned by the shared owner. This activity contributed 8.6m surplus for re-investment. Additionally, 169 units were sold as first tranche shared ownership which contributed 10.3m surplus for re-investment. Page 30 of 39
34 5 Social and environmental returns 5.1 Resident satisfaction We are committed to improving the quality of services offered and thus improving resident satisfaction. Results from our customer contact surveys, detailed in the table below, show that targets were generally met or exceeded and therefore we anticipate that the benefits from this ongoing investment and focus will be fully realised in due course. Customer Satisfaction Ease of Contact Polite Knowledgeable Dealt with enquiry fully Overall satisfaction Target 90% 95% 93% 85% 95% Average 2016/17 95% 98% 93% 88% 95% During the year, we have worked with our Resident Inspectors to increase the profile of the repairs and maintenance work we carry out and to increase the amount of feedback we receive from our customers. During the year, we have produced a more useful and informative post repair customer satisfaction form. Results from these surveys show that the overall resident satisfaction rate for the whole year was 96% which is excellent and indicates a good level of customer service in this area Each year, we canvas our new shared ownership customers to ascertain their satisfaction with our Options to Buy sales service. We are pleased that for 2016/17, 89% of customers were either satisfied or very satisfied with the overall service delivered by our Options to Buy team The tables below detail results of the annual STAR resident satisfaction survey for General Needs tenants, for tenants of Housing for Older People and for Shared Ownership residents For General Needs and Shared Ownership in 2016/17 overall satisfaction increased and exceeded target whereas, for Housing for Older People it worsened and did not meet target by 1%. We note that, in comparison to benchmark median, all groups of residents are satisfied with the service we provide and that their rent provides VfM We continue our commitment to improving the quality of services offered and thus to improve tenant and resident satisfaction. Tenant and resident satisfaction target levels have therefore been set at or above the benchmark median level as recorded Page 31 of 39
35 by House Mark for the coming year. Value for money indicators 2017/ / / / /15 Benchmark* General Needs Satisfaction with: Target Actuals Target Actuals Actuals Median Rent Provides value for money 87% 85% 85% 83% Service charge provides value for money 62% 61% 61% 73% Quality of home 83% 82% 86% 82% Neighbourhood as a place to live 83% 85% 84% 85% Overall Service Provided 87% 89% 87% 82% 82% 84% *Benchmark Data Housemark April 2017 Value for money indicators 2017/ / / / /15 Benchmark* Housing for Older People Satisfaction Target Actuals Target Actuals Actuals Median with: Rent Provides value for money 88% 93% 89% 90% Service charge provides value for money 81% 85% 90% 82% Quality of home 91% 94% 95% 94% Neighbourhood as a place to live 95% 90% 86% 93% Overall Service Provided 95% 94% 95% 95% 93% 91% *Benchmark Data Housemark April 2016 Value for money indicators 2017/ / / / /15 Benchmark* Shared Ownership Satisfaction with: Target Actuals Target Actuals Actuals Median Rent Provides value for money 73% 68% 72% 67% Service charge provides value for money 51% 46% 46% 39% Quality of home 87% 84% 85% 76% Neighbourhood as a place to live 91% 90% 89% 83% Overall Service Provided 70% 78% 65% 62% 59% 48% *Benchmark Data Housemark April We continue to increase our focus upon mobile working and during 2017 new hardware and software was rolled out to Home Agents to enable an increasing number of tasks to be done on-line whilst staff are face to face with our customers. Planned investment in new IT systems over the next two years will increasingly Page 32 of 39
36 enable residents to access information, to request services and to make amendments to tenancy, payment and other data via smart phones or other devices at times which suit them best. 5.2 Complaints and compliments We have continued to monitor and review complaints throughout the year. We acknowledge that there are times when we do not get things right and so fall short of the standard of service we want to deliver. In handling complaints our focus this year was to be customer and outcome focused, to make it easier for residents and other customers to let us know when they have been unhappy and for us to inform them what we are doing to resolve their issues A total of 432 complaints were logged during the year which is a 27% reduction in complaints from the previous year. We analyse the top 10 causes for complaints which enables us to identify areas where we have improved and target areas for improvement in the year ahead Each month our resident Complaints Panel carry out customer complaints satisfaction surveys on all the complaints closed in the previous month. These surveys are carried out 4 weeks after a complaint has been closed. In this reporting year, we surveyed approximately 380 customers and received a response rate of 41% as of 28 April Our response rates have been improved due a new process of contacting customers at more varied times whereas last year these calls were only carried during office hours As well as complaints we look to learn from examples of good service where compliments or other positive feedback have been received. The profile of compliments has been raised throughout the year, sharing successes on the intranet and through workshops and training sessions. Compliments logged have more than doubled compared to last year. 5.3 Energy efficiency We measure the energy efficiency of our homes using the Standard Assessment Procedure (SAP) rating. This year, we have been validating the SAP ratings of our properties to enable us to plan and budget adequately to ensure we address the deficiencies of those properties in the lowest bands We now have SAP ratings for 13,995 properties, which is 97% of our eligible stock. Page 33 of 39
 following energy efficiency")
37 Our average SAP rating is 73.52, which is an increase of 0.94 from the previous year. Whilst new properties will typically be more energy efficient this rise can largely be attributed to the collection of additional energy performance certificates (EPC) following energy efficiency works. In the coming year we plan to reassess a further 195 properties to ensure that SAP rating information is kept up to date Our current SAP profile is as follows: We now have a very good understanding of the energy efficiency of our stock and have had a budget approved to address the poorest performing properties in the coming year. Measures we will be taking include installing cavity wall insulation, improving loft insulation, fitting new, more efficient storage heaters and replacing old boilers. Carrying out this work, with a budget of 319k, will ensure we do not have any properties with a SAP rating in the lowest bands We consider that investment in energy efficiency represents VfM: o From our resident s perspective, this reduces their potential bills, improves the quality of their lives and reduces the risk of fuel poverty; and o From our perspective; more energy efficient homes are more valuable, improving return on assets and the reduction in fuel poverty potential improves the chances of residents being able to meet their rent commitments and correspondingly reducing the risk of bad debt and void losses. 5.4 Aids and adaptations k (2016: 396k) was invested in aids and adaptations to support disabled and elderly residents with 98 (2016: 85) major and 315 (2016: 312) minor adaptions Page 34 of 39
Value for Money Statement Year to 30 th September 2017
 Value for Money Statement Year to 30 th September 2017 Introduction The Hyelm Group is committed to finding ways to provide excellent services whilst at the same time seeking to reduce costs and improve
Railway Housing Association. Value for Money Strategy
 Railway Housing Association Value for Money Strategy 2016-21 1 Executive Summary 1.1 Railway Housing Association (RHA) recognises that Value for Money (VFM) is a fundamental consideration for all housing
Clarion Housing Group Value for Money Statement 2017
 Clarion Housing Group Value for Money Statement 2017 Value for Money Highlights Value for Money Highlights Clarion Housing Group is a business for social purpose. First and foremost we are a social landlord
VALUE FOR MONEY REPORT 2017
 VALUE FOR MONEY REPORT 2017 1 CONTENTS EXECUTIVE SUMMARY 1 EXECUTIVE SUMMARY INTRODUCTION 3 Our Value for Money approach 3 Our operating environment 4 OVERALL PERFORMANCE 5 Operating surplus 5 Operating
Value for money Self assessment statement 2014/15
 Value for money Self assessment statement 2014/15 for you for your community not for profit Value for money (VFM) self-assessment 2014/15 Index 1. VFM and TRH Page 3 2. VFM performance targets 2014/15
Housing Solutions Value for Money self-assessment
 Notes Housing Solutions Value for Money self-assessment For the year ended 31 March 2017 1 Our year in summary Increased our turnover by 6% from 43 million to 46 million Increased EBITDA as a % of turnover
VALUE FOR MONEY (VFM) STATEMENT SUMMARY 2015/16
 STATEMENT SUMMARY 2015/16") VALUE FOR MONEY (VFM) STATEMENT SUMMARY 2015/16 Approach Our approach to Value for Money (VFM) SUCCESS IN VFM Success in VFM and efficiency is the same as success in achieving our strategic objectives.
VALUE FOR MONEY (VFM) STATEMENT SUMMARY 2015/16 Approach Our approach to Value for Money (VFM) SUCCESS IN VFM Success in VFM and efficiency is the same as success in achieving our strategic objectives.
Strategic report (continued)
") Strategic report (continued) Value for Money (VFM) The Association annually reviews its. The Board comprehensively updated these during 2017/18 as part of the development of a new over-arching strategy
Strategic report (continued) Value for Money (VFM) The Association annually reviews its. The Board comprehensively updated these during 2017/18 as part of the development of a new over-arching strategy
Effectiveness Efficiency. Economy. Great homes and services Strong and vibrant communities. Value for Money Statement 2016/17
 Economy Effectiveness Efficiency Value for Money Statement 2016/17 Great homes and services Strong and vibrant communities Value for money statement Purpose of this statement: to articulate and demonstrate
Value for Money. Self Assessment Summary 2016
 Value for Money Self Assessment Summary 2016 Executive Summary Wythenshawe Community Housing Group Limited () was established in April 2013 when Parkway Green Housing Trust (PGHT) and Willow Park Housing
VALUE FOR MONEY. Self-assessment statement for financial year
 VALUE FOR MONEY Self-assessment statement for 2016-17 financial year WELCOME TO OUR REPORT This statement sets out how we ensure Yorkshire Housing is delivering value for money (VfM) and why it remains
Value for Money self-assessment
 Value for Money self-assessment 2016-17 1 Contents 1. Introduction 2. Our approach to VfM 3. The regulatory requirements 4. How we make the best use of our assets 5. How our operating costs compare to
VALUE FOR MONEY SELF-ASSESSMENT STATEMENT FOR 2013/14
 VALUE FOR MONEY SELF-ASSESSMENT STATEMENT FOR 2013/14 2 VALUE FOR MONEY 1.0 Why Value for Money (VFM) is important to 1.1 The Board has given priority to delivering value for money within the Association.
Value For Money Self Assessment 2014/15
 Value For Money Self Assessment 2014/15 CONTENTS SECTION PAGE 1. Last year at Viridian 3 2. Governance and Scrutiny 5 3. Progress made in 2013/14 8 4. Viridian customers 10 5. Performance and costs for
Guidance from the HCA Understanding unit costs is an increasingly important part of the HCA s assessment of VfM.
 Key points: Value for Money (VfM) reporting is still of variable quality. VfM benchmarking is now common practice. More RPs now provide a return on assets and plans of how to deal with underperforming
Strategic report. Value for Money. 17 Peabody Annual Report and Financial Statements Financial review
 Strategic report Value for Money 17 Peabody Annual Report and Financial Statements 2017 Our Group Value for Money (VfM) self-assessment This self-assessment covers the performance of the Peabody Group
1 Executive Summary 2. 2 Introduction 7. 3 How decisions are made about competing resources. 5 Performance and scrutiny 15
 VALUE FOR MONEY STATEMENT 2016-2017 CONTENT S PAGE 1 Executive Summary 2 2 Introduction 7 3 How decisions are made about competing resources 8 4 Optimising our return on assets 10 5 Performance and scrutiny
VALUE FOR MONEY Self-Assessment 2017
 VALUE FOR MONEY Self-Assessment 2017 Contents Page 1 Introduction 1 2 Our VfM strategy 2 3 Our Approach to Delivering VfM 3 4 Achievements in the Year under Review 5 5 Targets for the Future 10 6 How Do
Weaver Vale Housing Trust. Value for Money Self - Assessment 2017
 Weaver Vale Housing Trust Value for Money Self - Assessment 2017 Executive Summary This Executive Summary gives an overview of the information presented in this report. It highlights the good performance
Value For Money Statement
 Value For Money Statement 2 Overall customer satisfaction results demonstrate a significant improvement from 74% in 2007 to 88% in 2017. Contents Chairman s Statement About Us Our Approach Internal Review
HCA Self-Assessment. Self-assessment against the regulatory standards 2014/15
 HCA Self-Assessment Self-assessment against the regulatory standards 2014/15 1 Governance and Financial Viability Standard (Governance) Economic standard Governance Required Outcomes Registered providers
Connect Housing Association 2016/17 Value for Money Self-Assessment summary
 Connect Housing Association 2016/17 Value for Money Self-Assessment summary Contents 1. Introduction 2. Return on assets 3. Cost and performance comparisons to others 4. Value for Money (VFM) achievements,
Value for Money Self-Assessment 2017/18
 Value for Money Self-Assessment 2017/18 Leeds Federated - Value for Money Self-Assessment 2017/18 This is Leeds Federated s Value for Money Self-Assessment for 2017/18. A version can also be found on our
Social Housing Financial State of the Sector FY16/17
 Social Housing Financial State of the Sector FY16/17 Presenting the definitive headline financial results from the Vantage Global Accounts Plus analysis. October 2017 yourvantage.co.uk Contents Introduction
Our Commitment to Value for Money (VfM) 2017 Self-Assessment. Benchmarking Report
 2017 Self-Assessment. Benchmarking Report") Our Commitment to Value for Money (VfM) 2017 Self-Assessment Benchmarking Report 1. Who do we compare ourselves with? 2. Summary overview 3. External benchmarking 3.1 Overall performance 3.2 What do our
Our Commitment to Value for Money (VfM) 2017 Self-Assessment Benchmarking Report 1. Who do we compare ourselves with? 2. Summary overview 3. External benchmarking 3.1 Overall performance 3.2 What do our
ASSET MANAGEMENT STRATEGY
 ASSET MANAGEMENT STRATEGY 207 2020 . In our Corporate Plan we are committed To hold a distinctive position in the sector, setting Hastoe apart in the quality of homes and services that we provide and also
2015 VALUE FOR MONEY STATEMENT
 2015 VALUE FOR MONEY STATEMENT Published June 2016 This statement is published to ensure LYHA remains compliant with the Homes & Communities Agency {HCA} Value for Money {VFM] standard section 2.2. Extract
THIRTEEN GROUP VALUE FOR MONEY SELF-ASSESSMENT 2015
 1 THIRTEEN GROUP VALUE FOR MONEY SELF-ASSESSMENT 2015 Contents 1. Executive Summary...3 2. Thirteen Housing Group...5 3. Principal Activities and Geographical Focus...6 4. Business Environment, Risks and
NCHA Value for Money Self Assessment 2017 CONTENTS. 5 SECTION TWO Our approach to assessing and delivering VFM
 CONTENTS PAGE 4 SECTION ONE Introduction 5 SECTION TWO Our approach to assessing and delivering VFM 8 SECTION THREE Delivering value for money through more homes 13 SECTION FOUR Delivering value for money
Mid-Year Review
 Mid-Year Review 2014-15 Update on Strategy and Financial Projections Wheatley group Contents 02 03 04 05 05 06 07 10 12 Investing in our future Strong performance Meeting customers needs Platform for growth
Global accounts of housing associations 2007
 Global accounts of housing associations 2007 THE NATIONAL AFFORDABLE HOMES AGENCY March 2008 p1 Global accounts of housing associations 2007 Contents Introduction A B Executive summary Operating and financial
Income Management and Rent Arrears Policy
 Income Management and Rent Arrears Policy December 2017 Version Author Date Review date Comments/amendments 1.0 Income Recovery Manager December 2017 December 2019 New group wide policy developed. Page
A REGISTERED SOCIETY UNDER THE CO-OPERATIVE AND COMMUNITY BENEFIT SOCIETIES ACT 2014 NO 31208R
 A REGISTERED SOCIETY UNDER THE CO-OPERATIVE AND COMMUNITY BENEFIT SOCIETIES ACT 2014 NO 31208R ISOS HOUSING LIMITED REPORT AND FINANCIAL STATEMENTS FOR THE YEAR ENDED 31 MARCH 2017 CONTENTS Section Page
The Economic Impact of Housing Organisations on the North
 The Economic Impact of Housing Organisations on the North Draft Case Study Report Stockport Homes Ltd Author(s): Chris Dayson Paul Lawless Ian Wilson January 2013 Contents 1. Introduction: Background and
Local Lettings Policy
 Local Lettings Policy Originator: Executive Management Team Approval Date: Policy and Strategy Team May 2018 Review date: May 2019 1 Introduction 1.1 1.2 1.3 1.4 1.5 As a responsible landlord One Vision
OPERATIONAL CASE STUDY November 2018 EXAM ANSWERS
 OPERATIONAL CASE STUDY November 2018 EXAM ANSWERS Variant 1 SECTION 1 - Gym Refit Options: Relevant costs and benefits of refitting the gyms Cash flows are relevant if they arise in the future as a direct
Value for Money Self Assessment
 Value for Money Self Assessment 2015-16 1 Contents The past year 4 Progress made in 2015/16 6 Governance and Scrutiny 9 How we invested our savings 12 Where our Money came from and how we spent it 18 Our
A reduction of over 1 billion in expenditure compared to AMP5. Innovation, efficiency and use of market mechanisms are contributors to lower costs.
 1 Good morning everyone, I m Steve Mogford, Chief Executive of United Utilities, and I d like to welcome you all to today s webcast presentation. I m going to take about 20 minutes to take you through
BARNSLEY METROPOLITAN BOROUGH COUNCIL
 BARNSLEY METROPOLITAN BOROUGH COUNCIL This matter is a Key Decision within the Council s definition and has been included in the relevant Forward Plan Joint Report of the Executive Director-Core Services
EFFICIENCY PLAN
 EFFICIENCY PLAN 216 22 1 CONTENTS INTRODUCTION 3 STRATEGIC CAPITAL INVESTMENT PROGRAMME 1 EFFICIENCIES ACHIEVED BETWEEN 21/11 AND 215/16 THE FUNDING GAP 216/17 TO 219/2 4-5 USE OF RESERVES 11-12 6 DUTY
BUSINESS PLAN 2018/ /23
 Warwickshire Rural Housing Association BUSINESS PLAN 2018/19 2022/23 Tel: 0300 1234 009 Website: www.warwickshirerha.org.uk Twitter: Follow @WarksRural WARWICKSHIRE RURAL HOUSING ASSOCIATION BUSINESS PLAN
Appendix 5. Capital Strategy. 1. Strategic Context
 Capital Strategy 1. Strategic Context Barnet Council is ambitious about the impact that capital investment plans will have on the borough over the next 10 to 20 years. This capital strategy sets out how
Robert Read, Director of Housing & Neighbourhoods
 Subject: HOUSING REVENUE ACCOUNT: BUDGET ESTIMATES (2016-2017 to 2020-2021) Report to: Full Council Date: 24 th February 2016 Report by: Robert Read, Director of Housing & Neighbourhoods Housing Revenue
Complaints, Compliments & Feedback Policy
 Complaints, Compliments & Approved by: Feedback Policy Approved date: Document controls Version Changes Responsible person Issued date 1.0 New policy document Lisa Jones 21/03/2014 1. Introduction 2. Definitions
Lloyds TSB Group plc Results
 Lloyds TSB Group plc 2004 Results PRESENTATION OF RESULTS In order to provide a clearer representation of the underlying performance of the Group, the results of the Group s life and pensions and general
Report and financial statements
 Report and Year ended March 31, 2015 Contents 3 Board members, executive directors, advisors and bankers 4 Chairman s statement 5 Operating and review and strategic report 22 Report of the directors 29
Value for Money. Statement 2016/17
 Value for Money Statement 2016/17 Value for Money (VfM) Central to our business Vision 2025 In summary, by 2025 Radian will have a broad base of customers, a clear understanding of what customers want,
OCEAN HOUSING GROUP LIMITED (LIMITED BY GUARANTEE)
") OCEAN HOUSING GROUP LIMITED (LIMITED BY GUARANTEE) CONSOLIDATED AND COMPANY ACCOUNTS FOR THE YEAR TO 31 MARCH Registered Number: 5000720 Homes and Communities Agency Number: L4422 Ocean Housing Limited
OCEAN HOUSING GROUP LIMITED (LIMITED BY GUARANTEE) CONSOLIDATED AND COMPANY ACCOUNTS FOR THE YEAR TO 31 MARCH Registered Number: 5000720 Homes and Communities Agency Number: L4422 Ocean Housing Limited
Registered Company No Homes & Communities Agency No. L4460 REPORT AND FINANCIAL STATEMENTS
 Registered Company No. 05275586 Homes & Communities Agency No. L4460 REPORT AND FINANCIAL STATEMENTS YEAR ENDED 31 MARCH 2017 CONTENTS PAGE Board Members, Executive Directors, Advisors and Bankers 1 Operating
Value for Money Self Assessment
 Value for Money Self Assessment 2015-2016 www.gch.co.uk 01452 424344 VALUE FOR MONEY SELF ASSESSMENT 2015-2016 Contents Page Number 1. Introduction and Approach 2-5 2. Progress against our Corporate Plan
FINANCIAL STATEMENTS
 FINANCIAL STATEMENTS SECTION 1 Strategic Report A snapshot of our business 6 The story of our year 8 Chairman s introduction 9 Our business model 10 Our values 11 The market place 12 Our people 14 Our
Ventus 2 VCT plc. Strategy Note Executive Summary
 1 Executive Summary This note summarises the outcome of a strategy review undertaken by the Board of Ventus 2 VCT plc (the Company ) over the past year during the period when the last of the Company s
Why VFM needs great Asset Management. Karen Heaney: Director of Asset Management Home Group
 Why VFM needs great Asset Management Karen Heaney: Director of Asset Management Home Group Who is Home Group? Our Footprint Our Asset Profile: General Needs Unknown
Doing things right, Providing value for money. Value for Money Statement 2015
 Doing things right, Providing value for money Value for Money Statement 2015 We re Flagship Group, the overarching brand for Flagship Homes and RFT Services. We are well managed, financially strong and
Customer Satisfaction STAR Survey Results for 2017/18
 One Vision Housing Customer Satisfaction STAR Survey Results for Performance & Customer Insight Team Issue: 1 Date: 14th December 2017 Report by: David Barton Checked by: Peter Davies Approved by: Stephen
Appendix A HRA REVENUE ACCOUNT
 Appendix A HRA REVENUE ACCOUNT 1. The HRA annual expenditure budget is 22.389M and income budget is 28.580M, which allows a contribution of 6.191M to reserves to present a net budget of zero. A subjective
JOINT CORPORATE GOVERNANCE FRAMEWORK 2017/2018
 JOINT CORPORATE GOVERNANCE FRAMEWORK 2017/2018 CONTENTS Statement of Corporate Governance for the Police and Crime Commissioner and Chief Constable Page Introduction 3 Context 3 Principles 3 Framework
Tariff Risk Management Plan
 Tariff Risk Management Plan June 2012 Table of Contents EXECUTIVE SUMMARY... PRINCIPLES OF THE TARIFF...2 SUCCESS OF THE TARIFF...4 LEGAL REQUIREMENTS FOR DELIVERY...7 CURRENT HEADLINE TARIFF POSITION...7
1. The provisional outturn provides for a transfer to reserves of 6.590M.
 Appendix A HRA Detailed Commentary 1. The provisional outturn provides for a transfer to reserves of 6.590M. 2. Due to the changes in Right to Buy discounts, the Council achieved a higher level of capital
Mid Year Business Update. November 2016
 Mid Year Business Update November 2016 Executive Summary 2015/16 was another year of significant growth, diversification and continued strong financial performance. Two new partner organisations, both
Since 2012, the HRA has been self- financing, although there are restrictions on borrowing and income.
 Appendix A - HRA Business Plan autumn 2017 1. Introduction The Council s Housing Revenue Account (HRA) is funded through rents and service charges received from council tenants and leaseholders, and meets
The Warm Front Scheme
 The Warm Front Scheme LONDON: The Stationery Office 14.35 Ordered by the House of Commons to be printed on 2 February 2009 REPORT BY THE COMPTROLLER AND AUDITOR GENERAL HC 126 Session 2008-2009 4 February
Assets, Regeneration and Growth Committee 1 st June 2015
 Assets, Regeneration and Growth Committee 1 st June 2015 Title Community Asset Strategy Report of Chief Operating Officer Wards All Status Public Enclosures Appendix 1: Draft Community Asset Strategy Officer
Contents. Introduction. Mission, vision and values. Strategic objectives. Key Performance Indicators. Financial strategy. Five year financial forecast
 Business Plan Look Ahead Business Plan 2017 Contents Introduction 3 Mission, vision and values 4 Strategic objectives 5 Key Performance Indicators 6 Financial strategy 7 Five year financial forecast 8
State of the Market Survey 2018 Local Authority Building Maintenance Service Briefing 18/30 August 2018
 State of the Market Survey 2018 Local Authority Building Maintenance Service Briefing 18/30 August 2018 Association for Public Service Excellence 2 nd floor Washbrook House Lancastrian Office Centre Talbot
Planned and Cyclical Maintenance Policy
 M3 Planned and Cyclical Maintenance Policy Date of Approval Review Date August 2016 August 2019 Planned and Cyclical Maintenance 1. Policy Context The introduction of this new comprehensive policy on Planned
Section 4 C: Corporate and Managed Services Overview. Services to be provided
 Section 4 C: Corporate and Managed Services Overview Services to be provided Customer Service and Transformation is focused on fuelling the change that the Council is going through. We deliver some of
CIH North East Conference 20 th November 2014 Richard Medley, CIH Consultancy Geoff Prior, Thirteen Group
 CIH North East Conference 20 th November 2014 Richard Medley, CIH Consultancy Geoff Prior, Thirteen Group Learn with us. Improve with us. Influence with us www.cih.org Asset management It s a whole new
Using Evidence to improve Maintenance Decision-Making and Delivery
 CIH Repairs & Maintenance Conference 23 May 2017 Using Evidence to improve Maintenance Decision-Making and Delivery Paul Lowenberg The Problem How we currently use Data A huge amount of data on R&M, but
ANNUAL VALUE FOR MONEY STATEMENT 2016/17
 ANNUAL VALUE FOR MONEY STATEMENT Page 2 INTRODUCTION What Is BCHA? BCHA is a specialist housing and housing-related support provider, helping people who are homeless and vulnerable to access the right
SOUTH CAMBRIDGESHIRE DISTRICT COUNCIL. TO: Leader and Cabinet 14 April 2005 Development Services Director LETTINGS POLICY REVIEW
 SOUTH CAMBRIDGESHIRE DISTRICT COUNCIL TO: Leader and Cabinet 14 April 2005 AUTHOR: Development Services Director Purpose LETTINGS POLICY REVIEW 1. To consider a project framework including a Member level
Conversation. TalkBudget
 TalkBudget Conversation Salford City Council wants to have a conversation with citizens, staff, local businesses and partners about what council services will look like in the future and how we will meet
Our finances explained. October 2016
 Our finances explained. October 2016 About our finances. Steve Robertson Chief Executive Officer We are the UK s largest water and wastewater services provider, serving London and the Thames Valley, with
West Surrey Strategic Housing Market Assessment
 West Surrey Strategic Housing Market Assessment Summary Report December 2014 Prepared by GL Hearn Limited 280 High Holborn London WC1V 7EE T +44 (0)20 7851 4900 glhearn.com Contents Section Page 1 INTRODUCTION
TAKING A STAND Business Plan
 TAKING A STAND Business Plan -22 Welcome to Connect s Business Plan -22 Index 1 Taking a Stand 1 2 Our Values 2 3 Strategy -22 3 4 Financial Plan -22 4 5 Key Strategic Risks 26 6 Risk Management Strategy
HCA Value for Money Metrics - Technical Note
 Consultation Response: HCA Value for Money Metrics - Technical Note Joseph Carr - November 2017 www.dtp.uk.com 1 The Author www.dtp.uk.com 2 Contents The Author... 2 Contents... 3 Executive Summary...
Policy and Resources Committee 14 th October 2015
 Policy and Resources Committee 14 th October 2015 Report of Title The Barnet Group Creation of new legal entities Wards All Chief Operating Officer, London Borough of Barnet Interim Chief Executive Officer,
Risk Management Strategy
 Resources Risk Management Strategy Successful organisations are not afraid to take risks; Unsuccessful organisations take risks without understanding them. Issue: Version 3 - November 2011 Group: Resources
Principal risks and uncertainties
 Principal risks and uncertainties Strategic report Principal risks are a risk or a combination of risks that, given the Group s current position, could seriously affect the performance, future prospects
BRIEFING PAPER FOR OVERVIEW AND SCRUTINY COMMITTEE- IMPLICATIONS OF THE SUMMER BUDGET ON THE HOUSING REVENUE ACCOUNT
 BRIEFING PAPER FOR OVERVIEW AND SCRUTINY COMMITTEE- IMPLICATIONS OF THE SUMMER BUDGET ON THE HOUSING REVENUE ACCOUNT BACKGROUND On the 8 th July 2015 the Government in their Summer Budget announced several
CORPORATE OVERVIEW AND SCRUTINY PANEL 24 JANUARY 2019
 CORPORATE OVERVIEW AND SCRUTINY PANEL 24 JANUARY 2019 CAPITAL STRATEGY 1. INTRODUCTION 1.1. The Capital Strategy is a high level document, giving an overview of how capital expenditure, capital financing
Summary of consultation feedback:
 Summary of consultation feedback: Future funding of supported housing 20 December 2017 Summary of key points: This briefing summarises the feedback we have received from housing associations to date on
1. Introduction and Executive Summary
 CHAIR S ANNUAL REPORT: The PTL Governance Advisory Arrangement Equitable Life workplace personal pension plans March 2017 1. Introduction and Executive Summary This report on the workplace personal pension
Outline Capital Investment Strategy
 Outline Capital Investment Strategy INDEX FOREWORD 1. INTRODUCTION 2. PURPOSE 3. SUMMARY 4. INFLUENCES ON CAPITAL INVESTMENT 5. CURRENT CAPITAL EXPENDITURE 6. COMMERCIAL PROPERTY INVESTMENT STRATEGY 7.
june 07 tpp 07-3 Service Costing in General Government Sector Agencies OFFICE OF FINANCIAL MANAGEMENT Policy & Guidelines Paper
 june 07 Service Costing in General Government Sector Agencies OFFICE OF FINANCIAL MANAGEMENT Policy & Guidelines Paper Contents: Page Preface Executive Summary 1 2 1 Service Costing in the General Government
East Lothian Council budget
 East Lothian Council budget Every year the council agrees Council Tax charges and allocations of funding to council service areas for the 12 months ahead. Funding for council services is mainly provided
TAX. Good, Better, Best. South Korea. kpmg.com
 TAX Good, Better, Best South Korea kpmg.com ii / Good, Better, Best South Korea Contents Introduction 1 Focus on South Korea 2 Clarifying accountabilities rising foreign investment draws attention to tax
Chair s Annual DC Governance Statement 2017
 TPT Retirement Solutions Chair s Annual DC Governance Statement 2017 DC Governance Standards 1 October 2016-30 September 2017 Annual Governance Statement for the Scheme year ended 30 September 2017 prepared
Fuel Poverty Forum Policy Brief
 Fuel Poverty Forum Policy Brief Over the last quarter, there have been 5 main policy developments. This brief intends to simply explain these developments and articulate what this means for fuel poor and
Financial Review. Volume (case equivalents) 8.4m 8.2m 2% Core revenue 706.7m 663.1m 7% Brand investment expenditure 125.7m 120.
 8.4m 8.2m 2% Core revenue 706.7m 663.1m 7% Brand investment expenditure 125.7m 120.") Financial Review MANAGEMENT KEY PERFORMANCE INDICATORS 2018 2017 % movement Volume (case equivalents) 8.4m 8.2m 2% Presented in constant currency rates: Core revenue 706.7m 663.1m 7% Brand investment expenditure
Financial Review MANAGEMENT KEY PERFORMANCE INDICATORS 2018 2017 % movement Volume (case equivalents) 8.4m 8.2m 2% Presented in constant currency rates: Core revenue 706.7m 663.1m 7% Brand investment expenditure
Welfare Support Strategy
 Welfare Support Strategy Produced by Revenues, Welfare and Customer Services May 2018 December 2021(Draft) 1. Foreword Our corporate plan outlines four priorities for the district: A strong local economy
Adjusted earnings per share were 54.1p (2016: 58.8p). Statutory results. Underlying. growth
. Statutory results. Underlying. growth") 34 Pearson plc Annual report and accounts We expect ongoing headwinds in our US higher education courseware business to be offset by improving conditions in our other businesses. Coram Williams Chief Financial
34 Pearson plc Annual report and accounts We expect ongoing headwinds in our US higher education courseware business to be offset by improving conditions in our other businesses. Coram Williams Chief Financial
SHEFFIELD CITY COUNCIL. Cabinet Report. Executive Director, Communities Executive Director, Place Executive Director, Resources
 SHEFFIELD CITY COUNCIL Cabinet Report Agenda Item 16 Report of: Executive Director, Communities Executive Director, Place Executive Director, Resources Report to: Cabinet Date: 15 th January 2014 Subject:
The UNOPS Budget Estimates, Executive Board September 2013
 The UNOPS Budget Estimates, 2014-2015 Executive Board September 2013 1 Key results of 2012 Benchmarks and standards Content UNOPS strategic plan 2014-2017 UNOPS budget estimates 2014-2015 Review of the
Communities Committee
 Communities Committee Item No Report title: Voluntary & Community Sector Engagement Contract Date of meeting: 25 January 2017 Responsible Chief Tom McCabe Executive Director, Community Officer: and Environmental
Practice. Housing. Working in partnership with credit unions. In this issue. October 2011 Issue 17. your work is our business
 Practice October 2011 Issue 17 Housing Working in partnership with credit unions In this issue What are credit unions? See page 2 Why work in partnership with a credit union? See page 3 How housing providers
Response to Consultation document on the Future of the Energy Company Obligation
 Briefing 14/20 April 2014 Response to Consultation document on the Future of the Energy Company Obligation To: all contacts Key issues Changes to Energy Companies Obligation Changes to resources available
South West Water: focused on PR19 Analyst & Investor Presentation. 15 September 2017
 South West Water: focused on PR19 Analyst & Investor Presentation 15 September 2017 Agenda Delivering our strategy PR19 methodology reflections Our WaterFuture vision to 2050 Conclusions and Q&A Close
Redevelopment of MOD Main Building
 Ministry of Defence Redevelopment of MOD Main Building REPORT BY THE COMPTROLLER AND AUDITOR GENERAL HC 748 Session 2001-2002: 18 April 2002 LONDON: The Stationery Office 0.00 Ordered by the House of Commons
Which? Mid Year Review From 1 July to 31 December 2015
 Which? Mid Year Review From 1 July to 31 December 2015 Section one Introduction from the Chair Tim Gardam Chair This mid year review, designed to update our annual report, describes recent developments