ANALYST GUIDE FY2015. October <Contact for information on this material: Mr. Ohno, Administration Headquarters ( )>
|
|
|
- Jessie Stone
- 5 years ago
- Views:
Transcription


1 ANALYST GUIDE FY2015 October 2015 (Listed on the 1st Section of the Tokyo Stock Exchange; Code 7447) <Contact for information on this material: Mr. Ohno, Administration Headquarters ( )>
2 Agenda I About NAGAILEBEN II Financial Review FY2015 III Market Environment IV Forecast for FY2016 V Management Goals VI Rewarding shareholder-focused policies 1

3 I About NAGAILEBEN 2


4 Nagaism Time of 100 years has created our company spirit. Human Believing Concentrating Pursuing principal Started white robe business in Nagaism 1915 Started Business 1969 Founded Manufacturing Division 1971 Succeed in first polyester medical clothing in Japan 1994 Established distribution center in Akita 1995 Listed on JASDAQ Started new products for "care" 2001 Listed on 2nd TSE Profit Business model Market Contribution Creation of Social Value Management style Concentration Realization of high profitability with radical pursuit of efficiency 2003 Established distribution center in West Japan 2004 Acquired ISO9001:2000 Listed on 1st TSE 2005 Acquired ISO14001: New HQ Building Completed 3
5 Profit Reimbursement to Shareholders Continue stable dividend payment with payout ratio of 50% DPS will be 100 as 100th anniversaries Social Responsibility Job creation at Regional Community -Domestic: Akita -Overseas: China, Indonesia, and Vietnam Support for women -Products for nursing staff or a care worker -Work for women sewing staff Environmental Management -Acquired ISO14001 certification in COMPELPACK the surgical wear which enables hospital to reduce waste ( million) 3,500 3,000 2,500 2,000 1,500 1, Total dividend Share buyback Commemorative divident Regular dividend Net income To grow Steadily and Stably Nagaileben marked 100th anniversary in We will continue prizing our company spirit Nagaism, Support for Children specializing in medical / nurse / care business area, expanding Admired occupation for medical its market and developing best products for our customers. -Miffy s visits to children's hospitals -Lending hospital medical clothing for child 4
6 Outline Establish competitive position in medical clothing market -Approximately 60% market share in domestic medical clothing -Wide field, planning, manufacturing and marketing -Competitive product such as extensive products, custom-made program Highly profitability and strong balance sheet -Gross profit to sales 46.6% (as of FY2015) -Capital-to-asset ratio 89.2% -ROE 9.3% (%) Change of Gross profit to sales 20.8% (1980) 33.1% (1990) 45.3% (2010) 39.7% 30 (2000) Doctor, Dentist, Pharmacist*1 (2012) 690,000 people compare with ,000people Strong growing market Nursing Staff*2 (2013) 1,570,000 people compare with ,000people *1 Annual Report on Health,Labour and Welfere 2012, MHLW *2 Japanese Nursing Associations statistical data *3 Estimation of care workers' demand toward 2025 (June. 2015), MHLW MHLW: Ministry of Health, Labour and Welfare of Japan -Continue stable dividend payment with payout ratio of 50% -Acquisition of treasury stock (YEN) 1,100 Care workers*3 (2013) 1,710,000 people compare with ,000people Rewarding shareholder-focused policies 1, (YEN) Book Value Per Share (BPS)(left) Earnings Per Share(EPS)(right)
7 II Financial Review FY2015 6
8 Overview FY Income - Net Sales remained previous year approximately - Operating & Recurring income declined slightly from previous year 2 The Change of Business Environment - Market Condition: Being revised care service treatment fees negative, market condition was stable - Production Condition: Appreciation of the dollar against the yen Escalating material prices, rising sewing costs 3 Unusual Event in this term - Exchange-rate profit: 226m - Share purchased in January million shares, 1,500 million yen - DPS will be 100 as 100th anniversaries 7
9 Financial Highlights <Statements of Income> (millions of yen,%) FY2015 % Change To Forecast % Composition % Composition % Change Net sales 16, Gross profit 7, Sales, general, and administrative expenses 2, Operating income 4, Recurring income 5, Net income 3, [Overview] - Sales kept at the same level as the previous year. In 4Q, sales of healthcare products increased 21.2% year-on-year, catching renewal contracts which were postponed. Sales of products for patients and surgery grew steadily. There were postponed contracts and drop of sales in doctors' wear and utility wear. [Gross profit] y/y - 53 m(factor of decrease of Net sales: - 30m, Factor of decrease of profit ratio: - 23m) Gross profit to sales FY % FY % Boost of material cost and sewing cost (- 42m) Foreign Exchange rate: FY Yen/dollar FY Yen/dollar (- 94m) Overseas production ratio FY % FY % (+ 100m) [Sales, general, and administrative expenses] - The cost of 100th anniversaries: 25m. Increase of Depreciation related with New HQ 35m [Non-operating income] - FY2014 Exchange-rate profit: 87m, Profit on securities sold: 67m FY2015 Exchange-rate profit: 226m (Realized profit changing dollars to yen: 165m) [Extraordinary profit] -FY2014 Gain on sale of properties: 114m(old HQ Building), FY2015: 30m(Kameido laboratory) [Capital Expenditure] -Capital Expenditure: 161m (New HQ:83m, IT system: 40m, Buildings: 18m, Manufacturing equipment: 19m) -Depreciation: 360m 8
10 Financial Highlights <Balance Sheet> Major assets ( million %) Title Result Change Result Change % Cash on hand at banks 18, Notes and accounts receivable 4, Securities 1, Inventories 4, Current assets 29, Buildings and structures 2, Land 4, Investments and other assets 1, Fixed assets 9, Total assets 39, [Major changes from the previous fiscal year] Cash and cash equivalents down 380million -Cash flows from operating activities up 2,727million -Acquisition tangible and intangible down 225million fixed assets -Share buyback down 1,500million -Dividend payout down 1,711million Fixed assets down 263million -Buildings and structures down 119million -Machinery and equipment down 103million Major liabilities and shareholders' equity ( million %) Title Result Change Result Change% Notes and accounts payable 1, Accrued income taxes 1, Current liabilities 4, Capital reserves 35,040 +1, Treasury stock 4,902-1, Net assets 34, Total liabilities and net assets 39, Net assets -Net profit -Capital reserves -Share buyback up 113million up 3,225million down 1,712million down 1,500million 9


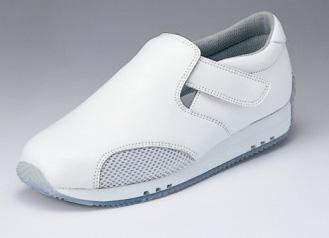
11 Segments by item Healthcare wear Patient wear Shoes Doctors' wear Utility wear Surgery wear 10
12 Sales by Item Doctors' 16.1% Utility 4.1% Patient 9.0% Surgery 9.7% Healthcare Shoes 1.3% 58.4% Others 1.4% Year-on-year change FY2014 FY2015 Overall +3.8% -0.4% Healthcare wear +4.4% -0.1% Doctors' wear +4.2% -2.6% Utility wear -6.6% -9.8% Patient wear +6.3% +7.2% Surgery wear +3.2% +2.3% Shoes -5.1% -10.9% Others +9.0% -7.0% [Healthcare wear] -In 4Q, high functional products caught renewal contracts which were postponed and sales kept the previous year. [Doctors' wear] -As sales grew steadily for several years, the demand seemed to be calming-down. [Utility wear] - Sales fell because institutions changed unit of supply from individual to section and tighten the allocation standard. [Patient wear] -As expanding of sales in standard products and contributing of new products, high-growth sales continued. [Surgery wear] -As penetrating of surgical underwear(scrub) and COMPELPACK into the market, the highest ever sales continued 11
13 Sales by Region Central Japan 11.0% East Japan 51.7% West Japan 36.2% Overseas 1.1% [East Japan] - Sales declined. In 4Q, catching renewal contracts which were postponed and focusing on promotion, however, postponed contracts occurred. [Central Japan] -Market size was not large and there was the influence by the size of contracts. In this term, focusing on promotion, sales grew further. [West Japan] -The amount of sales kept previous year. Catching new contracts smoothly, sales of healthcare wear increased steadily. However, sales of utility wear decreased. Year-on-year change FY2014 FY2015 Total sales +3.8% -0.4% East Japan +0.8% -1.2% Central Japan +9.7% +1.7% West Japan +6.0% +0.0% Overseas +24.3% +5.4% [Overseas] -Though sales was not large, our reputation expanded and firm-growth sales continued. 12
14 III Market Environment 13
15 Market Environment Topics Medical treatment fees will be revised.(effective Apr. 2016) - The previous revise rate +0.10% (Consumption tax raise+1.36%, Treatment fees -1.26%) - Revise rate is not obvious. Escalating material prices, rising sewing costs -The price of cloth and material increased. -The cost of labor charge around China and Southeast Asia raised. Effect to the cost of overseas production due to appreciation of the dollar against the yen monthly average exchange rate in NY market(as of Aug.) 2010: 85/dollar, 2011: 77/dollar, 2012: 77/dollar, 2013: 98/dollar, 2014: 102/dollar, 2015: 123/dollar
16 Market Environment '06 '07 '08 '09 '10 '11 '12 Changes and prospects for medical and care service systems Medical System Medical Service Law, Health and Medical Medical treatment fees Service Law for the Aged, Medical Insurance, etc Proposed draft of reform of medical insurance system submitted. Expansion of DPC to general hospitals. New Health Frontier Strategy announced Social medical corporations instituted by law Medical program for very elderly instituted by law Metabolic diagnosis and health guidance specified as mandatory Enforcement of Amended Pharmaceutical Affairs Law Local healthcare revival plan Release of the 7th prospect for supply and demand of nursing staff. Legal transformation of national medical highly-advanced center into independent administrative corporations Postponed time limit of abolishing nursing care type medical facilities for 6 year. The interim appraisal of the medical expenses adjustment plan. Postponed abolishing of Medical Care System for People Aged 75 and over Total market: -3.16% Service: -1.3% Drug price: -1.8% Total market: -0.83% Service: +0.38% Drug price: -1.2% Total market: +0.19% Service: +1.55% Drug price: -1.36% Total market: % Service: +1.38% Drug price: -1.38% Care Service System Care Service Law, Nursing Care Insurance, etc. Enforcement of Amended Nursing Care Insurance Law 3 rd plan of care insurance system ( ) Ban lifted on medical corporations from operating private commercial nursing homes. Nursing care type medical facilities to be abolished in 2012 Nursing care type elderly health facilities instituted 4 th plan of care insurance system ( ) Disapproval of setting up specialty nursing homes for social medical organization. Enforcement of Amended Nursing Care Insurance Law 5th plan of care insurance system ( ) Nursing care fees Total market: -2.4% Home: -1.0% Facilities: -4.0% Total market: +3.0% Home: +1.7% Facilities: +1.3% Total market: +1.2% Home: +1.0% Facilities: +0.2% 13 2nd plan of the medical expenses Plan of strategic market creation Revising of measures against reduction of incidence for nursing care 14 Medical Service Act Enforcement of Amended Pharmaceutical Affairs Law Total market: +0.10% Service: +0.73% Drug price: -0.63% The law for Medical care synthesis total promotion +0.63% Consumption tax increase '15 System for promotion of community medical corporation Expansive financial support of national health insurance System for promotion of community medical corporation 6th plan of care insurance system ( ) Total market: +2.27% Home: 1.42% Facilities: -0.85% 16 Formulation of Local medical program Enforcement of Medical treatment with patients' offer will be revised (April, 2016) Enforcement of Amended Nursing Care Insurance Law for Community day care 15
17 Market Environment Revisions to medical treatment and care Service fees (%) 5 Medical 4 3 Care Service Consumption tax increase Consumption tax increase +1.63% Service -1.26% Home-1.42%, Facilities -0.85%
18 Market Environment Supply and Demand of Nursing Staff (Source: the Ministry of Health, Labor and Welfare (December 2010)) (10,000 persons) 175 Demand Forecast Actual Change to actual number as from the 7th Outlook. 150 Decreased number of nursing staff on both supply and demand sides for technical reasons due to the shift to a fulltime-worker-based counting system as from the 6th Outlook. actual number 125 The number of nursing staff on the supply side is estimated to increase by 2.57% annually. 100 The 5th outlook for nursing staff demand and supply ( ) The 7th outlook for nursing staff demand and supply ( ) 75 The 4th outlook for nursing staff demand and supply ( ) The 6th outlook for nursing staff demand and supply ( ) '91 '92 '93 '94 '95 '96 '97 '98 '99 '00 '01 '02 '03 '04 '05 '06 '07 '08 '09 '10 '11 '12 '13 '14 '15 The 7th outlook for nursing staff demand and supply (five-year plan from 2011 through 2015) Outlook for nursing staff supply and demand for all medical and nursing fields Next outlook for nursing staff supply and demand will be announced in 2015 (Year) 17
19 Market Environment (10,000 persons) 300 Supply and estimated future need for care workers 250 Forecast Actual '00 '01 '02 '03 '04 '05 '06 '07 '08 '09 '10 '11 '12 '13 '25 Since the number of track records are subject to the influence of change of an examination method, Ministry of Health, Labor and Welfare adjusted the number after Ministry of Health, Labor and Welfare: Estimation of care workers' demand toward 2025 (June. 2015) 18
20 Market Environment 300 (10,000 persons) Nursing Staff Supply and estimated future need care workers 250 forecast(maximum) forecast(minimum) Actual Actual record: Japanese Nursing Associations statistical data Forecast:The committee about supply and estimated future need of Nursing Staff(Dec. 2014) Ministry of Health, Labor and Welfare Ministry of Health, Labor and Welfare: Estimation of care workers' demand toward 2025 (June. 2015) 19
21 IV Forecast for FY
22 Management Tasks and Status Marketing strategy to boost sales Production strategy to ensure a steady supply Strategy for decrease production cost Capture clusters of needs in the healthcare wear market Increase peripheral business in products for patients and surgery Develop new markets Strengthen ties with material makers and trade firms Develop new production overseas base Optimize overseas production ratio to reduce country risk Strengthen ability to respond small-lot multi-product Shift to overseas from domestic production Develop new overseas' materials for standard products Start of long term exchange contract Apply special tax measures for EPA and FTA 21
23 Forecast Statements of Income (millions of yen,%) FY2016E % Change (FY2015) Composition % Change Net sales 16, Gross profit 7, Sales, general, and administrative expenses 2, Operating income 4, Recurring income 4, Net income 3, [Overview] - Net sales is expected highest record. This will be achieved by putting higher quality and value-added products in healthcare wear and doctor wear, catching renewal orders steadily, gaining new contracts and expanding sales in patient/surgery wear. [Gross profit] y/y + 57m(Factor of increase of Net sales + 161m, Factor of change of profit ratio m) Gross profit to sales FY % FY2016E 46.0% Boost of material cost and sewing cost (- 25m) Foreign Exchange rate: FY yen/dollar FY2016E 102.5yen/dollar (- 156m) Overseas production ratio FY % FY2016E 47.1 % (+ 63m) [Sales, general, and administrative expenses] - The cost of 100 th anniversaries: 34m [Non-operating income] - FY2015 Exchange-rate profit: 226m (Assets in foreign currencies:$3.3m at end of FY2015) [Extraordinary Profit and loss] -FY2015: Gain on sale of properties 30m(Kameido laboratory) [Other] -Tax reform in 2015, lower the corporate tax rate. FY2015: 36.94% FY2016E: 33.54% [Capital Expenditure] -Capital Expenditure: 175m (IT system: 45m, Buildings: 71m, Manufacturing equipment: 37m) -Depreciation: 338m 22
24 Forecast of Sales by Item ( million) 18,000 16,000 14,000 12,000 10,000 8,000 6,000 4,000 2,000 Sales by Item Shoes/Others Surgery wear Patient wear Utility wear Doctors' wear Healthcare wear Year-on-year change FY2015 FY2016E Sales -0.4% +2.2% Healthcare wear -0.1% +2.2% Doctors' wear -2.6% +2.5% Utility wear -9.8% -7.5% Patient wear +7.2% +4.7% Surgery wear +2.3% +4.4% Shoes/Others -10.9% -5.3% E [Healthcare wear] Activating market by higher quality and value-added products, sales of healthcare wear is expected to increase steadily. [Utility wear]as the demand being down, the decline in sales of utility wear is expected to continue. [Patient wear] The increase in sales of patient wear is expected to continue with demand in the health check market. [Surgery wear] As COMPELPACK and surgical underwear(scrub) being steadily permeated, the increase in sales of surgery wear is expected to continue. 23
25 Forecast of Sales by Region ( million) 18,000 16,000 14,000 12,000 10,000 8,000 6,000 4,000 2,000 Sales by Region Overseas West Japan Central Japan East Japan Year-on-year change FY2015 FY2016E Total sales -0.4% +2.2% East Japan -1.2% +1.7% Central Japan +1.7% +1.4% West Japan +0.0% +2.7% Overseas +5.4% +13.6% E Each area are expected to increase of sales and continue of the highest ever sales. [East Japan] Catching renewal orders steadily with higher quality and value-added products, the sales in East Japan is expected to increase consistently. [Central and West Japan] As gaining share by sales promotion, the increase of sales is planned, [Overseas] Sales is expected to increase as the impact of depreciation yen and expanding our reputation. 24
26 Product Strategy Sales by Product ( million) 18,000 16,000 14,000 12,000 10,000 8,000 6,000 4,000 2, E DC brand products High Functional products Standard Functional products Mass products Year-on-year change FY2015 FY2016E Sales -0.4% +2.2% DC brand products -9.9% -5.5% High Functional products +3.8% +5.1% Standard Functional products DC brand products High Functional products Standard Functional products -3.2% +0.8% Mass products -5.6% -6.3% (Retail price) 10,000Yen 7,500Yen 5,000Yen Mass products Price composition (Nurse one-piece) [DC brands ] Though existing DC brand products are on the decrease, New brand "Miffy" will contribute to the sale. [High functional products ] As these products being received well from the market, the increase in sales of high functional products is expected to continue by driving the strategy of higher quality and value-added products. [Mass products] As being on downward trend, the shift from mass products, include other company products, to functional products is expected to continue. 25
27 Production Strategy Production(Non-Consolidated) ( million) (%) 10, Composition FY2015 FY2016E 7,500 5, Purchased products Overseas production Domestic production Domestic production Overseas production Purchased products , Ratio of overseas production E 30 -To prepare for escalating of material prices and sewing costs, shifting to new factory in Java, Indonesia will finish until the end of
28 V Management Goals 27
29 Business Direction Sales Strategy -Increase peripheral business in products for patients and surgery. -Gain share In West Japan. -Develop and sale of high functional products. Profit Strategy -Driving the strategy of higher quality and value-added products. -The shift to overseas production. -The minimization of exchange risk Equalization of the fluctuations in foreign exchange rates by reservation of exchange contracts 28
30 Sales Strategy Sales by Item Sales by Region Sales by Products FY2012 (3 terms ago) Healthcare Doctors' 58% 16% Utility 6% East Japan 53% functional 43% 8% Patient 9% Surgery 3% Others Central Japan 10% 7% 36% 1% Overseas Standard functional 43% 7% FY2015 (Previous term) 58% 16% 52% 50% 11% 5% 3% 1% 6% 4% 9% 10% 36% 39% FY2018E (3 terms later) net sales 15,175 million 16,150 million 17,500 million High DC brand West Japan Mass 57% 16% 48% High functional 55% 2% Patient 11% Surgery 2% 12% 11% 4% 2% 4% West Japan 39% 37% 29
31 Net Sales and Gross Profit to Sales Ratio ( million) (%) 17,500 15,000 12,500 Net sales (left) Gross profit to sales (right) 55 10, ,500 5, , E17E18E (FY) Note: Consolidated data since FY1994 are shown. Preceding years represent non-consolidated data. ( million) FY2018E Net Sales 17,500 Operating Income 5,300 30
32 ⅤI Rewarding shareholder-focused policies 31
33 Profit Reimbursement to Shareholders Shareholder-focused policies - Improvement of transparency by proactive disclosure - Interactive communication with investors - Profit reimbursement by high dividends Dividend policy - Basic policy is to continue stable dividend payment with payout ratio of 50% -DPS will be 100 as 100th anniversaries Share buyback - Acquire expeditiously when our share is undervalued - Share purchased in January FY million shares, 1,500 million yen 32
34 The History of Stock Value BPS (yen) EPS (yen) DPS (yen) 1,100 (Yen) ( 円 ) 100 FY FY ,000 FY FY FY FY FY FY FY FY FY FY FY FY2014 1, FY2015 1, FY2009: Accrued pension fund withdrawal payment loss 1.04b A dotted line is when there was not outbreak. Book Value Per Share (BPS)(left) Earnings Per Share(EPS)(right) 33
35 Actual Dividends Paid Total dividend Share buyback Payout ratio Total return ratio (Million yen) (Million yen) (non-c, %) (non-c, %) FY FY FY , FY FY2005 1, FY2006 1, FY2007 1, FY2008 1,083 1, FY2009 1,040 1, FY2010 1, FY2011 1, FY2012 1, FY2013 1, FY2014 1, E54.4 FY2015E *E3,324 1,500 E107.5 E153.8 *2015: DPS 100yen (commemorative 50yen) 34


36 Management Philosophy We will provide medical products and services of the highest quality, as the leading company to link "medical services" and "clothing." - Consistently challenging spirit to lead the industry - Achievement of contribution to society - "Respect for Harmony among People" people are our asset 35
37 Notes on this material This material includes forecasts for the future. These forecasts are based on the judgment of the Company's management concerning currently available information. These future projections include assumptions or views based on assumptions, and therefore may be different from the actual outcome, depending upon future circumstances. The expectations for future results stated by the Company or its management in this material do not represent any warranty that these expectations or particular results will be realized. The Company is not liable to update any of its forecasts, or projections, unless otherwise provided for by law or under the relevant regulations. 36
38 Data File FY2015 (Listed on the 1st Section of the Tokyo Stock Exchange;Code 7447) <Contact for information on this material: Mr. Ohno, Administration Headquarters ( )>
39 Index 1 Sales by Item 2 Sales by Product 3 Sales by Region 4 Rationalization of the Production System and Our Purchasing Strategy (Non-Consolidated) 5 Statements of Income (Consolidated) 6 Statements of Income (Non-Consolidated) 7 Indices (Consolidated) 8 Indices (Non-Consolidated) 9 10 Statements of Income (Consolidated Non-Consolidated) Balance Sheet (Consolidated Non-Consolidated)
40 1. Sales by Item FY 12/8 13/8 14/8 15/8 16/8E First-half 14/8 ( million) First-half 15/8 Sales 15,175 15,625 16,214 16,150 16,500 6,775 6,840 Healthcare wear 8,769 9,039 9,440 9,429 9,640 3,914 4,011 Doctors' wear 2,483 2,566 2,674 2,604 2,670 1,064 1,046 Utility wear Patient wear 1,223 1,273 1,353 1,451 1, Surgery wear 1,374 1,479 1,525 1,560 1, Shoes Others ( million) 18,000 16,000 14,000 12,000 Change over previous year (%) Sales Healthcare wear Doctors' wear Utility wear Patient wear Surgery wear Shoes Others Composition (%) Sales Healthcare wear Doctors' wear Utility wear Patient wear Surgery wear Shoes Others ,000 8,000 6,000 4,000 2, /8 13/8 14/8 15/8 16/8E Others Shoes (FY) Surgery wear Patient wear Utility wear Doctors' wear Healthcare wear 1
41 2. Sales by Product FY 12/8 13/8 14/8 15/8 16/8E First-half 14/8 ( million) First-half 15/8 Sales 15,175 15,625 16,214 16,150 16,500 6,775 6,840 DC brand products 1, High Functional products 6,547 7,212 7,795 8,090 8,500 3,267 3,457 Standard Functional products 6,501 6,433 6,462 6,252 6,300 2,712 2,617 Mass products 1,100 1,045 1, Change over previous year (%) Sales DC brand products High Functional products Standard Functional products Mass products ( million) 18,000 16,000 14,000 12,000 10,000 8,000 6,000 Composition (%) Sales DC brand products High Functional products Standard Functional products Mass products DC brand High Functional Standard Functional products Mass products (Retail price) 10,000Yen 7,500Yen 5,000Yen Price composition (Nurse one-piece) 4,000 2, /8 13/8 14/8 15/8 16/8E(FY) DC brand products High Functional products Standard Functional products Mass products 2
42 3. Sales by Region FY 12/8 13/8 14/8 15/8 16/8E First-half 14/8 ( million) First-half 15/8 Sales 15,175 15,625 16,214 16,150 16,500 6,775 6,840 East Japan 8,106 8,390 8,461 8,357 8,500 3,422 3,430 Central Japan 1,564 1,591 1,745 1,774 1, West Japan 5,386 5,508 5,839 5,842 6,000 2,503 2,529 Overseas ( million) 18,000 16,000 14,000 12,000 10,000 Change over previous year (%) Sales East Japan Central Japan West Japan Overseas ,000 6,000 4,000 2,000 Composition (%) Sales East Japan Central Japan West Japan Overseas /8 13/8 14/8 15/8 16/8E (FY) Overseas West Japan Central Japan East Japan 3
43 4. Rationalization of the Production System and Our Purchasing Strategy(Non-Consolidated) FY 12/8 13/8 14/8 15/8 16/8E First-half 14/8 ( million) First-half 15/8 Domestic production 5,056 4,951 5,061 4,901 4,813 2,454 2,495 Overseas production 3,441 3,550 4,017 4,215 4,401 1,880 2,112 Purchased products Total 8,737 8,725 9,320 9,252 9,344 4,405 4,673 ( million) 10,000 7,500 (%) , Change over previous year (%) Domestic production Overseas production Purchased products , Total Composition (%) Domestic production /8 13/8 14/8 15/8 16/8E 30 (FY) Overseas production Purchased products Purchased products Total Overseas production Domestic production % of purchases from overseas factories 4
44 5. Statements of Income (Consolidated) FY 12/8 13/8 14/8 15/8 16/8E First-half 14/8 ( million) First-half 15/8 Net Sales 15,175 15,625 16,214 16,150 16,500 6,775 6,840 Gross profit 7,103 7,346 7,585 7,532 7,590 3,169 3,187 Sales, general, and administrative expense 2,461 2,473 2,662 2,719 2,776 1,337 1,390 Operating income 4,642 4,873 4,923 4,813 4,814 1,831 1,797 Recurring income 4,787 5,418 5,142 5,088 4,869 1,925 2,033 Net income 2,371 3,119 3,224 3,225 3,237 1,264 1,302 Change over previous year (%) Net Sales Gross profit Sales, general, and administrative expense Operating income Recurring income Net income Composition (%) Net Sales Gross profit Sales, general, and administrative expense Operating income Recurring income Net income
45 6. Statements of Income (Non-Consolidated) FY 12/8 13/8 14/8 15/8 16/8E First-half 14/8 ( million) First-half 15/8 Net Sales 15,166 15,616 16,199 16,141 16,500 6,767 6,831 Gross profit 6,794 7,031 7,270 7,218 7,270 3,032 3,053 Sales, general, and administrative expenses 2,493 2,482 2,662 2,718 2,773 1,330 1,383 Operating income 4,301 4,549 4,608 4,500 4,497 1,701 1,669 Recurring income 4,458 5,177 4,938 4,883 4,657 1,902 2,005 Net income 2,189 3,014 3,145 3,137 3,132 1,290 1,318 Change over previous year (%) (%) Net Sales Gross profit Sales, general, and administrative expenses Operating income Recurring income Net income Composition (%) (%) Net Sales Gross profit Sales, general, and administrative expenses Operating income Recurring income Net income
46 7. Indices (Consolidated) (Unit) 11/8 12/8 13/8 14/8 15/8 First-half 14/8 Profitability ROE (%) ROA (%) Return on sales Net income (%) ROE resolution Total Assets Turnover (Times) Leverage (Times) Current Ratio (%) Fixed Assets Ratio (%) First-half 15/8 Financial stability Fixed Assets Ratio to Total of Shareholders Equity and Long-term Liabilities (%) Account Receivable Turnover (Times) Inventory Turnover (Times) BPS ( ) 1, , , Per share data EPS ( ) DPS ( ) Payout ratio (%) Free issue Stock split 2011/9/1 2-for Adjusted Adjusted BPS ( ) Per share data Adjusted EPS ( ) Adjusted DPS ( ) Capital expenditure ( million) 2, Others Depreciation ( million) Number of employees (Persons) Personnel expense ( million) 2,190 2,235 2,245 2,305 2,305 1,149 1,158 (Note1) Ratio of Fixed Assets to Total of Shareholders Equity and Long-term Liabilities = Fixed Assets (Total shareholders equity + Long-term Liabilities) (Note2) Each of the balance sheet items used in the turnover figures is the average of the balances at the beginning and the end of the financial year. 7
47 8. Indices (Non-Consolidated) (Unit) 11/8 12/8 13/8 14/8 15/8 Profitability ROE (%) First-half 14/8 ROA (%) Return on sales Net income (%) ROE resolution Total AssetsTurnover (Times) Financial stability Leverage (Times) Current Ratio (%) Fixed Assets Ratio (%) Fixed Assets Ratio to Total of Shareholders Equity and Long-term Liabilities (%) Account Receivable Turnover (Times) Inventory Turnover (Times) First-half 15/8 BPS ( ) 1, Per share data EPS ( ) DPS ( ) Payout ratio (%) Free issue Stock split 2011/9/1 2-for Adjusted Adjusted BPS ( ) Per share data Adjusted EPS ( ) Adjusted DPS ( ) Capital expenditure ( million) 2, Others Depreciation ( million) Number of employees (Persons) Personnel expense ( million) ,007 1,051 1, (Note1) Ratio of Fixed Assets to Total of Shareholders Equity and Long-term Liabilities = Fixed Assets (Total shareholders equity + Long-term Liabilities) (Note2) Each of the balance sheet items used in the turnover figures is the average of the balances at the beginning and the end of the financial year. 8
48 9. Statements of Income (Consolidated) ( million,%) ( million,%) FY 14/8 14/8 Change(the previous year) First-half 14/8 First-half 15/8 Change(the previous year) Result Composition Result Composition Result Change % Result Composition Result Composition Result Change % Net Sales 16, , , , Cost of sales 8, , , , Gross profit 7, , , , Sales, general, and administrative expens 2, , , , Packing and freight expenses Advertising expenses Personnel expenses 1,225 1, Management commission expense Depreciation expenses Operating income 4, , , , Non-operating income Interest income Rent income Others Non-operating expense Fixed assets rent expense Others Recurring income 5, , , , Extraordinary profit Extraordinary loss Income before income taxes 5, , , , Income, inhabitant and enterprise taxes 1,902 1, Tax adjustments Net income 3, , , ,
49 10. Statements of Income (Non-Consolidated) ( million,%) ( million,%) FY 14/8 15/8 Change(the previous year) First-half 14/8 First-half 15/8 Change(the previous year) Result Composition Result Composition Result Change % Result Composition Result Composition Result Change % Net Sales 16, , , , Cost of sales 8, , , , Gross profit 7, , , , Sales, general, and administrative expenses 2, , , , Packing and freight expenses Advertising expenses Personnel expenses 1,051 1, Management commission expenses Depreciation expenses Operating income 4, , , , Non-operating income Interest income Dividend income Rent income Others Non-operating expense Fixed assets rent expense Others Recurring income 4, , , , Extraordinary profit Extraordinary loss Income before income taxes 5, , , , Income, inhabitant and enterprise taxes 1,763 1, Tax adjustments Net income 3, , , ,
50 11. Balance Sheet (Consolidated) ( million,%) ( million,%) FY 14/8 15/8 Change(the previous year) First-half 14/8 First-half 15/8 Change(the previous year) Result Composition Result Composition Result Change % Result Composition Result Composition Result Change % Current assets 29, , , , , Cash on hand and at banks 19,054 18,673 16,016 15,510 Trade notes and accounts receivable 4,696 4,689 4,106 4,710 Securities 1,516 1, ,517 Inventories 3,835 4,199 4,330 4,860 Others Reserve bad debt Fixed assets 9, , , , , Tangible fixed assets 7, , , , Buildings and structures 2,570 2,450 2,647 2,502 Machinery and equipment Land 4,480 4,447 4,480 4,480 Construction in progress Others Intangible fixed asset Investments and other assets 1, , , , , Investment securities , Others 1, ,132 1,187 Reserve bad debt Total assets 39, , , , Current liabilities 3, , , , Trade notes and accounts payable 1,517 1,399 1,570 1,658 Accrued income taxes 1,333 1, Accrued bonus Others Long-term liabilities Accrued pension and severance costs Directors retirement allowances Others Total liabilities 4, , , , Total shareholders equity 34, , , , Capital stock 1,925 1,925 1,925 1,925 Capital reserves 2,358 2,358 2,358 2,358 Retained earnings 33,569 35,040 31,609 33,117 Treasury stock -3,402-4,902-3,401-4,902 Accumulated other comprehensive income Net unrealized gains on investment securitie Deferred hedging gains and losses Accumulated pension and severance costs Total net assets 34, , , , Total liabilities and total net assets 39, , , ,
51 12. Balance Sheet(Non-Consolidated) ( million,%) ( million,%) FY 14/8 15/8 Change(the previous year) First-half 14/8 First-half 15/8 Change(the previous year) Result Composition Result Composition Result Change % Result Composition Result Composition Result Change % Current assets 26, , , , , Cash on hand and at banks 16,888 16,456 14,085 13,550 Trade notes 2,984 2,713 1,836 1,928 Accounts receivable 1,710 1,975 2,268 2,781 Securities 1,516 1, ,517 Inventories 3,122 3,370 3,449 3,978 Others Reserve bad debt Fixed assets 9, , , , , Tangible fixed assets 7, , , , Buildings and structures 2,522 2,405 2,596 2,452 Machinery and equipment Land 4,480 4,447 4,480 4,480 Construction in progress Others Intangible fixed asset Investments and other assets 1, , , , , Investment securities , Others , Reserve bad debt Total assets 35, , , , Current liabilities 3, , , , Trade notes ,014 Accounts payable Accrued income taxes 1,251 1, Others Long-term liabilities Accrued pension and severance costs Directors retirement allowances Others Total liabilities 3, , , , Total shareholders equity 31, , , , Capital stock 1,925 1,925 1,925 1,925 Capital reserves 2,637 2,637 2,637 2,637 Retained earnings 30,564 31,993 28,709 30,174 Treasury stock -3,402-4,902-3,401-4,902 Valuation and translation adjustments Net unrealized gains on investment securities Deferred hedging gains and losses Total net assets 31, , , , Total liabilities and total net assets 35, , , ,
ANALYST GUIDE FY2016. October <Contact for information on this material: Mr. Ohno, Administration Headquarters ( )>
>") ANALYST GUIDE FY2016 October 2016 (Listed on the 1st Section of the Tokyo Stock Exchange; Code 7447) I About
ANALYST GUIDE FY2016 October 2016 (Listed on the 1st Section of the Tokyo Stock Exchange; Code 7447) I About
CMIC HOLDINGS Co., Ltd. Consolidated Financial Results
 (Note) This translation is prepared and provided for readers' convenience only. In the event of any discrepancy between this translated document and the original Japanese document, the original document
Summary of Consolidated Financial Results for the Fiscal Year Ended March 31, 2018 <Under Japanese GAAP>
 Summary of Consolidated Financial Results for the Fiscal Year Ended May 15, 2018 Company name: Japan Post Holdings Co., Ltd. Stock exchange listing: Tokyo Stock Exchange Code number:
Nagaileben co., Ltd.
 7447 Tokyo Stock Exchange First Section Analyst Noboru Terashima Index Summary----------------------------------------------------------------------------------------------------------------------------------------------------------------------------
Nagaileben co., Ltd.
 7447 Tokyo Stock Exchange First Section Analyst Noboru Terashima Index Summary----------------------------------------------------------------------------------------------------------------------------------------------------------------------------
million yen % (39.5) 10.2 million yen 8,855 8,654
 10.2 million yen 8,855 8,654") Fiscal Year Ended December 2007 Financial Results (Non-consolidated) February 18, 2008 Corporate Name: AIRTECH JAPAN, LTD. Stock Exchange Listing: Tokyo Stock Exchange Stock Code: 6291 URL: http://www.airtech.co.jp
Fiscal Year Ended December 2007 Financial Results (Non-consolidated) February 18, 2008 Corporate Name: AIRTECH JAPAN, LTD. Stock Exchange Listing: Tokyo Stock Exchange Stock Code: 6291 URL: http://www.airtech.co.jp
FY2011 Consolidated Financial Results (Japan GAAP)
") Consolidated Financial Results (Japan GAAP) (April 1, 2010 through March 31, 2011) English Translation of the Original Japanese-Language Document May 11, 2011 Company name : ISUZU MOTORS LIMITED Stock
Consolidated Financial Results (Japan GAAP) (April 1, 2010 through March 31, 2011) English Translation of the Original Japanese-Language Document May 11, 2011 Company name : ISUZU MOTORS LIMITED Stock
CMIC HOLDINGS Co., Ltd. Consolidated Financial Results
 (Note) This translation is prepared and provided for readers' convenience only. In the event of any discrepancy between this translated document and the original Japanese document, the original document
Consolidated Financial Results for the Fiscal Year Ended December 31, 2018 [Japanese GAAP]
![Consolidated Financial Results for the Fiscal Year Ended December 31, 2018 [Japanese GAAP]](/thumbs/95/123620498.jpg "Consolidated Financial Results for the Fiscal Year Ended December 31, 2018 [Japanese GAAP]") Consolidated Financial Results for the Fiscal Year Ended December 31, 2018 [Japanese GAAP] Company name: Nissha Co., Ltd. Stock exchange listing: Tokyo Stock Exchange Code number: 7915 URL: https://www.nissha.com/english
Consolidated Financial Results for the Fiscal Year Ended December 31, 2018 [Japanese GAAP] Company name: Nissha Co., Ltd. Stock exchange listing: Tokyo Stock Exchange Code number: 7915 URL: https://www.nissha.com/english
CMIC HOLDINGS Co., Ltd. Consolidated Financial Results
 (Note) This translation is prepared and provided for readers' convenience only. In the event of any discrepancy between this translated document and the original Japanese document, the original document
PUNCH INDUSTRY (6165)
") URL: www.walden.co.jp Written by Yoshiyuki Muroya / Yusuke Maeda E-mail: info@walden.co.jp Phone +81 3 3553 3769 PUNCH INDUSTRY (6165) Consolidated Fiscal Year Operating Recurring Profit Attributable to
URL: www.walden.co.jp Written by Yoshiyuki Muroya / Yusuke Maeda E-mail: info@walden.co.jp Phone +81 3 3553 3769 PUNCH INDUSTRY (6165) Consolidated Fiscal Year Operating Recurring Profit Attributable to
Consolidated Financial Results for the First Quarter of Fiscal 2018 [Japanese Standards]
![Consolidated Financial Results for the First Quarter of Fiscal 2018 [Japanese Standards]](/thumbs/95/123620478.jpg "Consolidated Financial Results for the First Quarter of Fiscal 2018 [Japanese Standards]") 7-7, Akasaka 2-chome, Minato-ku, Tokyo 107-8615, Japan July 11, 2018 Consolidated Financial Results for the First Quarter of Fiscal 2018 [Japanese Standards] Name: Hogy Medical Co., Ltd. Listing: First
7-7, Akasaka 2-chome, Minato-ku, Tokyo 107-8615, Japan July 11, 2018 Consolidated Financial Results for the First Quarter of Fiscal 2018 [Japanese Standards] Name: Hogy Medical Co., Ltd. Listing: First
Consolidated Financial Results for the Fiscal Year Ended March 31, 2017 [Japanese GAAP]
![Consolidated Financial Results for the Fiscal Year Ended March 31, 2017 [Japanese GAAP]](/thumbs/95/125130905.jpg "Consolidated Financial Results for the Fiscal Year Ended March 31, 2017 [Japanese GAAP]") Consolidated Financial Results for the Fiscal Year Ended March 31, 2017 [Japanese GAAP] Company name: TOA Corporation Stock exchange listing: Tokyo Stock Exchange Code number: 6809 URL: http://www.toa.co.jp/
Consolidated Financial Results for the Fiscal Year Ended March 31, 2017 [Japanese GAAP] Company name: TOA Corporation Stock exchange listing: Tokyo Stock Exchange Code number: 6809 URL: http://www.toa.co.jp/
Consolidated Financial Results for the 2nd Quarter of Fiscal Year Ending March 31, 2019 (J-GAAP)
") Consolidated Financial Results for the 2nd Quarter of Fiscal Year Ending March 31, 2019 (J-GAAP) November 5, 2018 Company name: T.RAD Co., Ltd. Listing: Tokyo Stock Exchange, First Section Code No.: 7236
Consolidated Financial Results for the 2nd Quarter of Fiscal Year Ending March 31, 2019 (J-GAAP) November 5, 2018 Company name: T.RAD Co., Ltd. Listing: Tokyo Stock Exchange, First Section Code No.: 7236
Fiscal 2017 Overview (April 1, March 31, 2018)
") Fiscal 2017 Overview (April 1, 2017 - March 31, 2018) 1 Net sales Operating income Operating margin Record-high 8.9% 9.9% 10.0% 6.2% 4.0% 5.2% 5.6% 6.2% 7.2% 460.0 0.1% 1.1% 2.1% 404.9 Net sales, operating
Fiscal 2017 Overview (April 1, 2017 - March 31, 2018) 1 Net sales Operating income Operating margin Record-high 8.9% 9.9% 10.0% 6.2% 4.0% 5.2% 5.6% 6.2% 7.2% 460.0 0.1% 1.1% 2.1% 404.9 Net sales, operating
CONSOLIDATED EARNINGS REPORT FOR FISCAL [Japanese GAAP]
![CONSOLIDATED EARNINGS REPORT FOR FISCAL [Japanese GAAP]](/thumbs/93/112714861.jpg "CONSOLIDATED EARNINGS REPORT FOR FISCAL [Japanese GAAP]") Member of the Financial Accounting Standards Foundation Disclaimer: This is a Japanese-English translation of the summary of financial statements of the Company produced for your convenience. Since no
Member of the Financial Accounting Standards Foundation Disclaimer: This is a Japanese-English translation of the summary of financial statements of the Company produced for your convenience. Since no
Brief Report of Financial Statements for the Year Ended March 31, 2012 [JGAAP] (Consolidated Basis)
![Brief Report of Financial Statements for the Year Ended March 31, 2012 [JGAAP] (Consolidated Basis)](/thumbs/94/119025550.jpg "Brief Report of Financial Statements for the Year Ended March 31, 2012 [JGAAP] (Consolidated Basis)") Brief Report of Financial Statements for the Year Ended March 31, 2012 [JGAAP] (Consolidated Basis) Listed exchanges: Tokyo, Osaka Listed company name: Kobayashi Pharmaceutical Co. Ltd. Code: 4967 URL:
Brief Report of Financial Statements for the Year Ended March 31, 2012 [JGAAP] (Consolidated Basis) Listed exchanges: Tokyo, Osaka Listed company name: Kobayashi Pharmaceutical Co. Ltd. Code: 4967 URL:
11-Year Consolidated Financial Highlights
 11-Year Consolidated Financial Highlights As of March 31, 2017 2007.3 2008.3 2009.3 2010.3 Net Sales ( million) 1,376,958 1,487,496 1,660,162 1,415,718 Operating Profit ( million) 162,315 70,048 65,204
Sumitomo Heavy Industries, Ltd.
 Sumitomo Heavy Industries, Ltd. 1Q CONSOLIDATED FINANCIAL REPORT For the ended Note: All financial information has been prepared in accordance with generally accepted accounting principles in Japan. This
SUMMARY OF CONSOLIDATED FINANCIAL STATEMENTS FOR THE SECOND QUARTER OF THE FISCAL YEAR ENDING NOVEMBER 30, 2015 [JAPAN GAAP]
![SUMMARY OF CONSOLIDATED FINANCIAL STATEMENTS FOR THE SECOND QUARTER OF THE FISCAL YEAR ENDING NOVEMBER 30, 2015 [JAPAN GAAP]](/thumbs/93/114398783.jpg "SUMMARY OF CONSOLIDATED FINANCIAL STATEMENTS FOR THE SECOND QUARTER OF THE FISCAL YEAR ENDING NOVEMBER 30, 2015 [JAPAN GAAP]") SUMMARY OF CONSOLIDATED FINANCIAL STATEMENTS FOR THE SECOND QUARTER OF THE FISCAL YEAR ENDING NOVEMBER 30, [JAPAN GAAP] July 1, Listed company name: Kewpie Corporation Listed exchange: Tokyo Stock Exchange
SUMMARY OF CONSOLIDATED FINANCIAL STATEMENTS FOR THE SECOND QUARTER OF THE FISCAL YEAR ENDING NOVEMBER 30, [JAPAN GAAP] July 1, Listed company name: Kewpie Corporation Listed exchange: Tokyo Stock Exchange
Consolidated Business Results For the Fiscal Year Ending March 31, 2012 Bando Chemical Industries, Ltd.
 Consolidated Business Results For the Fiscal Year Ending March 31, 2012 Bando Chemical Industries, Ltd. Financial Summary Fiscal Year Ending March 31, 2012 (1)Settlement of Accounts The production rates
Net sales Operating profit Ordinary profit
 Consolidated Financial Statements Summary May 8, 2018 (For the year ended March 31, 2018) English translation from the original Japanese-language document (All financial information has been prepared in
Five-year Financial Summary (Consolidated)
") Five-year Financial Summary (Consolidated) Years ended March 31 Fiscal Year Millions of yen FY212 FY213 FY214 FY215 FY216 (Ended March 213) (Ended March 214) (Ended March 215) (Ended March 216) (Ended
Five-year Financial Summary (Consolidated) Years ended March 31 Fiscal Year Millions of yen FY212 FY213 FY214 FY215 FY216 (Ended March 213) (Ended March 214) (Ended March 215) (Ended March 216) (Ended
Consolidated Financial Results First Two Quarters of the Fiscal Year ending March 2018 (April 1, 2017 to September 30, 2017)
") Consolidated Financial Results First Two Quarters of the Fiscal Year ending March 2018 (April 1, 2017 to September 30, 2017) Listed Company Name: Rinnai Corporation Listings: First sections of the Tokyo
Consolidated Financial Results First Two Quarters of the Fiscal Year ending March 2018 (April 1, 2017 to September 30, 2017) Listed Company Name: Rinnai Corporation Listings: First sections of the Tokyo
Net sales Operating profit Ordinary profit Profit
 Summary of Non-consolidated Financial Results for the Fiscal Year Ended March 31, 2018 [Japanese GAAP] May 1, 2018 Company name: CONEXIO Corporation Stock exchange listing: Tokyo Stock Exchange, First
Net sales Operating income Ordinary income
 Financial Results for the Fiscal Year Ended March 31, 2016 [Japanese GAAP] (Consolidated) English translation from the original Japanese-language document April 27, 2016 Name of Listed Company: Hino Motors,
FY2018 Consolidated Financial and Operating Results <IFRS> (Overview English translation of the Japanese original) April 26, 2018
 April 26, 2018") FY2018 Consolidated Financial and Operating Results (Overview English translation of the Japanese original) April 26, 2018 Company Name: SANYO DENKI CO., LTD. Code Number: 6516 (Listed on the First
FY2018 Consolidated Financial and Operating Results (Overview English translation of the Japanese original) April 26, 2018 Company Name: SANYO DENKI CO., LTD. Code Number: 6516 (Listed on the First
Financial Highlights for the Fiscal Year ended March 31, 2012
 (Note) This document has been translated from the Japanese original for reference purposes only. In the event of any discrepancy between this translation and the Japanese original, the original shall prevail.
Summary of Consolidated Financial Results For the Fiscal Year Ended March 2012 [Japan GAAP]
![Summary of Consolidated Financial Results For the Fiscal Year Ended March 2012 [Japan GAAP]](/thumbs/95/123620560.jpg "Summary of Consolidated Financial Results For the Fiscal Year Ended March 2012 [Japan GAAP]") Summary of Consolidated Financial Results For the Fiscal Year Ended March 2012 [Japan GAAP] April 20, 2012 Name of Company: SPK CORPORATION Stock Code: 7466 Stock Exchange Listing: Tokyo Stock Exchange,
Summary of Consolidated Financial Results For the Fiscal Year Ended March 2012 [Japan GAAP] April 20, 2012 Name of Company: SPK CORPORATION Stock Code: 7466 Stock Exchange Listing: Tokyo Stock Exchange,
Consolidated Financial Results First Two Quarters of the Fiscal Year ending March 2017 (April 1, 2016 to September 30, 2016)
") Consolidated Financial Results First Two Quarters of the Fiscal Year ending March 2017 (April 1, 2016 to September 30, 2016) Listed Company Name: Rinnai Corporation Listings: First sections of the Tokyo
Consolidated Financial Results First Two Quarters of the Fiscal Year ending March 2017 (April 1, 2016 to September 30, 2016) Listed Company Name: Rinnai Corporation Listings: First sections of the Tokyo
Financial Results for the Year Ended March 31, 2018 [Japanese GAAP] (Consolidated)
![Financial Results for the Year Ended March 31, 2018 [Japanese GAAP] (Consolidated)](/thumbs/83/87456160.jpg "Financial Results for the Year Ended March 31, 2018 [Japanese GAAP] (Consolidated)") Financial Results for the Year Ended March 31, 2018 [Japanese GAAP] (Consolidated) May 11, 2018 Company name: Tatsuta Electric Wire & Cable Co., Ltd. Stock exchange listing: Tokyo Stock Exchange Stock
Financial Results for the Year Ended March 31, 2018 [Japanese GAAP] (Consolidated) May 11, 2018 Company name: Tatsuta Electric Wire & Cable Co., Ltd. Stock exchange listing: Tokyo Stock Exchange Stock
Report of Earnings and Financial Statements for the Six Months Ended September 30, 2017 (Consolidated) (Prepared pursuant to Japanese GAAP)
 (Prepared pursuant to Japanese GAAP)") Listed company s name: Report of Earnings and Financial Statements for the Six Months Ended September 30, 2017 (Consolidated) (Prepared pursuant to Japanese GAAP) Kawasaki Heavy Industries, Ltd. Listed
Listed company s name: Report of Earnings and Financial Statements for the Six Months Ended September 30, 2017 (Consolidated) (Prepared pursuant to Japanese GAAP) Kawasaki Heavy Industries, Ltd. Listed
Consolidated Financial Results for the 1st Quarter of the Fiscal Year Ended March 31, 2019 [Japanese Standard]
![Consolidated Financial Results for the 1st Quarter of the Fiscal Year Ended March 31, 2019 [Japanese Standard]](/thumbs/90/102461211.jpg "Consolidated Financial Results for the 1st Quarter of the Fiscal Year Ended March 31, 2019 [Japanese Standard]") (For reference purposes only) 1 2 3 4 5 6 7 8 9 10 11 12 13 14 15 16 17 18 19 20 21 22 23 24 25 26 27 28 29 30 31 32 33 34 35 36 37 38 39 40 41 August 10, 2018 Stock exchange: Tokyo (First Section) Listed
(For reference purposes only) 1 2 3 4 5 6 7 8 9 10 11 12 13 14 15 16 17 18 19 20 21 22 23 24 25 26 27 28 29 30 31 32 33 34 35 36 37 38 39 40 41 August 10, 2018 Stock exchange: Tokyo (First Section) Listed
Code number : 7202 :
 Consolidated Financial Results (Japan GAAP) (April 1, 2014 through March 31, 2015) English Translation of the Original Japanese-Language Document May 12, 2015 Company name : ISUZU MOTORS LIMITED Stock
Kurita Water Industries Reports Earnings for the Nine Months ended December 31, 2010
 FOR IMMEDIATE RELEASE Kurita Water Industries Reports Earnings for the Nine Months ended December 31, 2010 Tokyo, Japan, January 31, 2011 Kurita Water Industries Ltd. (TSE Securities Code 6370) announced
Fully diluted net income per share Dividend per share (Record date) End of 1Q End of 2Q End of 3Q Year-end Annual
 End of 1Q End of 2Q End of 3Q Year-end Annual") Summary of Consolidated Financial Results For the First Half of the Fiscal Year Ending March 31, 2009 (Six Months Ended September 30, 2008) November 6, 2008 Company name: Nippon Shokubai Co., Ltd. Listing:
Summary of Consolidated Financial Results For the First Half of the Fiscal Year Ending March 31, 2009 (Six Months Ended September 30, 2008) November 6, 2008 Company name: Nippon Shokubai Co., Ltd. Listing:
Summary Report of Consolidated Financial Results For the Three Months Period ended June 30, 2018
 Summary Report of Consolidated Financial Results For the Three Months Period ended June 30, 2018 August 9, 2018 Company name: NIPRO CORPORATION TSE-1 st section Code No.8086 URL: http://www.nipro.co.jp/
Non-consolidated Financial Report for Year Ending March 31, 2006
 May 17, 2006 Non-consolidated Financial Report for Year Ending March 31, 2006 Listed company name: Ariake Japan Co., Ltd. Code No.: 2815 Listing Exchanges: Tokyo, 1st Section, Head office: 3-2-17 Ebisu-Minami,
mil. Yen % mil. Yen % mil. Yen % mil. Yen %
 FY2012 Financial Results Outline (Consolidated Base) (Based on Generally Accepted Accounting Principles in Japan) (Translated from the Original Japanese Document) May 11, 2012 Company Name: Uniden Corporation
Kurita Water Industries Reports Earnings for the Fiscal Year Ended March 2008
 FOR IMMEDIATE RELEASE Kurita Water Industries Reports Earnings for the Fiscal Year Ended March 2008 Tokyo, Japan, April 30, 2008 Kurita Water Industries Ltd. (TSE Security Code 6370) announced net sales
Consolidated Financial Results for the First Quarter Ended June 30, 2008
 For Immediate Release August 5, 2008 Consolidated Financial Results for the First Quarter Ended June 30, 2008 1. Performance for the First Quarter Ended Jun. 30, 2008 (from Apr. 1, 2008 to Jun. 30, 2008)
Consolidated Financial Results for the Fiscal Year Ended March 31, 2018 [Japanese GAAP]
![Consolidated Financial Results for the Fiscal Year Ended March 31, 2018 [Japanese GAAP]](/thumbs/87/97109926.jpg "Consolidated Financial Results for the Fiscal Year Ended March 31, 2018 [Japanese GAAP]") This is an abridged translation of the original document in Japanese and is intended for reference purposes only. In the event of any discrepancy between this translated document and the Japanese original,
This is an abridged translation of the original document in Japanese and is intended for reference purposes only. In the event of any discrepancy between this translated document and the Japanese original,
Summary of Consolidated Financial Results for the Fiscal Year Ended March 31, 2017 <Under Japanese GAAP>
 Summary of Consolidated Financial Results for the Fiscal Year Ended March 31, 2017 May 15, 2017 Company name: Japan Post Holdings Co., Ltd. Stock exchange listing: Tokyo Stock Exchange
Consolidated Financial Results for the Fiscal Year Ended March 31, 2012 (Japan GAAP)
") Consolidated Financial Results for the Fiscal Year Ended March 31, 2012 (Japan GAAP) May 14, 2012 Company name: SQUARE ENIX HOLDINGS CO., LTD. Shares traded: Tokyo Stock Exchange, First Section Company
Consolidated Financial Results for the Fiscal Year Ended March 31, 2012 (Japan GAAP) May 14, 2012 Company name: SQUARE ENIX HOLDINGS CO., LTD. Shares traded: Tokyo Stock Exchange, First Section Company
Summary of Consolidated Financial Results for the First Quarter of Fiscal Year Ending [Japan Standards] (Consolidated) March 31, 2014:
![Summary of Consolidated Financial Results for the First Quarter of Fiscal Year Ending [Japan Standards] (Consolidated) March 31, 2014:](/thumbs/81/83889943.jpg "Summary of Consolidated Financial Results for the First Quarter of Fiscal Year Ending [Japan Standards] (Consolidated) March 31, 2014:") July 26, 213 Summary of Consolidated Financial Results for the First Quarter of Fiscal Year Ending March 31, 214 [Japan Standards] (Consolidated) Company name: MAX Co.,Ltd. Stock listing: Tokyo Stock Exchange
July 26, 213 Summary of Consolidated Financial Results for the First Quarter of Fiscal Year Ending March 31, 214 [Japan Standards] (Consolidated) Company name: MAX Co.,Ltd. Stock listing: Tokyo Stock Exchange
JFE Holdings Financial Results for Fiscal Year 2017 ended March 31, 2018
 JFE Holdings Financial Results for Fiscal Year 2017 ended March 31, 2018 All financial information has been prepared in accordance with generally accepted accounting principles in Japan. (Note: The following
Financial Results for the Second Quarter of the Fiscal Year Ending March 31, 2014 [Japanese GAAP] (Consolidated)
![Financial Results for the Second Quarter of the Fiscal Year Ending March 31, 2014 [Japanese GAAP] (Consolidated)](/thumbs/93/111330278.jpg "Financial Results for the Second Quarter of the Fiscal Year Ending March 31, 2014 [Japanese GAAP] (Consolidated)") Financial Results for the Second Quarter of the Fiscal Year Ending March 31, 2014 [Japanese GAAP] (Consolidated) October 29, 2013 Name of Listed Company: Hino Motors, Ltd. Stock Listing: Tokyo and Nagoya
Financial Results for the Second Quarter of the Fiscal Year Ending March 31, 2014 [Japanese GAAP] (Consolidated) October 29, 2013 Name of Listed Company: Hino Motors, Ltd. Stock Listing: Tokyo and Nagoya
OMRON CORPORATION FINANCIAL FACT BOOK 2018
 OMRON CORPORATION FINANCIAL FACT BOOK 218 CONTENTS Page Sales Data Net Sales P.1 Foreign Exchange Rates Sales by Business Segment P.2 Sales by Region P.3 Profit Data Gross Profit, Gross Profit / Net Sales
Financial Flash Report for the Second Quarter of Fiscal Year Ending March 31, 2012 [Japanese standards] (Consolidated)
![Financial Flash Report for the Second Quarter of Fiscal Year Ending March 31, 2012 [Japanese standards] (Consolidated)](/thumbs/88/117065245.jpg "Financial Flash Report for the Second Quarter of Fiscal Year Ending March 31, 2012 [Japanese standards] (Consolidated)") October 26, 2011 Financial Flash Report for the Second Quarter of Fiscal Year Ending March 31, 2012 [Japanese standards] (Consolidated) Company name: EIKEN CHEMICAL CO., LTD. Listing: TSE, First Section
October 26, 2011 Financial Flash Report for the Second Quarter of Fiscal Year Ending March 31, 2012 [Japanese standards] (Consolidated) Company name: EIKEN CHEMICAL CO., LTD. Listing: TSE, First Section
Financial Results for FY2010 (April 1, 2009 through March 31, 2010) English Translation of the Original Japanese-Language Document May 11, 2010
 English Translation of the Original Japanese-Language Document May 11, 2010") Financial Results for (April 1, 2009 through March 31, 2010) English Translation of the Original Japanese-Language Document May 11, 2010 Company name : ISUZU MOTORS LIMITED Stock exchange on which the
Financial Results for (April 1, 2009 through March 31, 2010) English Translation of the Original Japanese-Language Document May 11, 2010 Company name : ISUZU MOTORS LIMITED Stock exchange on which the
Consolidated Financial Results for the Fiscal Year Ended March 31, 2018 [Japanese GAAP]
![Consolidated Financial Results for the Fiscal Year Ended March 31, 2018 [Japanese GAAP]](/thumbs/81/82607102.jpg "Consolidated Financial Results for the Fiscal Year Ended March 31, 2018 [Japanese GAAP]") Consolidated Financial Results for the Fiscal Year Ended March 31, 2018 [Japanese GAAP] Company name: Shibaura Electronics Co., Ltd. Stock exchange listing: Tokyo Stock Exchange Code number: 6957 URL:
Consolidated Financial Results for the Fiscal Year Ended March 31, 2018 [Japanese GAAP] Company name: Shibaura Electronics Co., Ltd. Stock exchange listing: Tokyo Stock Exchange Code number: 6957 URL:
Summary of Financial Results for the Fiscal Year Ended March 31, 2018 [Japan GAAP] (Non-Consolidated)
![Summary of Financial Results for the Fiscal Year Ended March 31, 2018 [Japan GAAP] (Non-Consolidated)](/thumbs/92/110301098.jpg "Summary of Financial Results for the Fiscal Year Ended March 31, 2018 [Japan GAAP] (Non-Consolidated)") Summary of Financial Results [Japan GAAP] (Non-Consolidated) Listed internet infinity INC. Company: Code Number 6545 URL: http://iif.jp May 15, 2018 Stock Exchange Listing: Tokyo Stock Exchange Representative:
Summary of Financial Results [Japan GAAP] (Non-Consolidated) Listed internet infinity INC. Company: Code Number 6545 URL: http://iif.jp May 15, 2018 Stock Exchange Listing: Tokyo Stock Exchange Representative:
Consolidated Financial Statements - Summary (For the fiscal year ended March 31, 2008) May 16, 2008
 May 16, 2008") Consolidated Financial Statements - Summary (For the fiscal year ended March 31, 2008) May 16, 2008 The following statements are an English-language translation of the original Japanese-language document.
Consolidated Financial Statements - Summary (For the fiscal year ended March 31, 2008) May 16, 2008 The following statements are an English-language translation of the original Japanese-language document.
Consolidated Financial Results for the First 2 Quarters of Fiscal 2015 [Japanese Standards]
![Consolidated Financial Results for the First 2 Quarters of Fiscal 2015 [Japanese Standards]](/thumbs/84/89184846.jpg "Consolidated Financial Results for the First 2 Quarters of Fiscal 2015 [Japanese Standards]") 7-7, Akasaka 2-chome, Minato-ku, Tokyo 107-8615, Japan October 13, 2015 Consolidated Financial Results for the First 2 Quarters of Fiscal 2015 [Japanese Standards] Name: Hogy Medical Co., Ltd. Listing:
7-7, Akasaka 2-chome, Minato-ku, Tokyo 107-8615, Japan October 13, 2015 Consolidated Financial Results for the First 2 Quarters of Fiscal 2015 [Japanese Standards] Name: Hogy Medical Co., Ltd. Listing:
Bando Chemical Industries, Ltd.
 Consolidated Business Results for the First Half of Fiscal 2011 November 4, 2011 Bando Chemical Industries, Ltd. 0 First Half Financial Summary for the Fiscal Year Ending March 31, 2012 1 (1)Settlement
Highlights of Consolidated Results for the First Half and the Second Quarter of Fiscal Year ending March 31, 2016
 Highlights of Consolidated Results for the First Half and the Second Quarter of Fiscal Year ending March 31, 2016 (except for per share amounts) November 2, Six months ended Six months ended September
:
 Financial Results for (April 1, 2008 through March 31, 2009) English Translation of the Original Japanese-Language Document May 11, 2009 Company name : ISUZU MOTORS LIMITED Stock exchange on which the
Stock exchange on which the shares are listed : Tokyo Stock Exchange in Japan Code number : 7202 :
 Consolidated Financial Results (Japan GAAP) (April 1, 2016 through March 31, 2017) English Translation of the Original Japanese-Language Document Company name : ISUZU MOTORS LIMITED Stock exchange on which
JFE Holdings Financial Results for Fiscal Year 2016 ended March 31, 2017
 JFE Holdings Financial Results for Fiscal Year 2016 ended March 31, 2017 All financial information has been prepared in accordance with generally accepted accounting principles in Japan. (Note: The following
Quarterly consolidated financial statements
 Quarterly consolidated financial statements (First Quarter of Fiscal Year 2011) Takasago International Corporation Accounting Period Period 1. (Changes in Principle Financial Data) 85 th Year (2011) 1
Highlights of Consolidated Results for Fiscal Year ended March 31, 2016
 May 9, 2016 Highlights of Consolidated Results for Fiscal Year ended March 31, 2016 (except for per share amounts) Year ended Year ended March 31, March 31, 2016 2015 Change Y 745,888 Y 707,237 5.5 Operating
CONSOLIDATED FINANCIAL STATEMENTS <under Japanese GAAP> For the twelve-month period ended March 31, 2018
 CONSOLIDATED FINANCIAL STATEMENTS For the twelve-month period ended March 31, 2018 May 10, 2018 Name of the company: Tsubakimoto Chain Co. Code number: 6371 Stock exchange listings:
Consolidated Financial Results for the Fiscal Year Ended February 28, 2018 [Japanese GAAP]
![Consolidated Financial Results for the Fiscal Year Ended February 28, 2018 [Japanese GAAP]](/thumbs/95/123620634.jpg "Consolidated Financial Results for the Fiscal Year Ended February 28, 2018 [Japanese GAAP]") Consolidated Financial Results for the Fiscal Year Ended February 28, 2018 [Japanese GAAP] April 6, 2018 Company name: MARUZEN CO.,LTD. Stock exchange listing: Tokyo Stock Exchange Code number: 5982 URL:
Consolidated Financial Results for the Fiscal Year Ended February 28, 2018 [Japanese GAAP] April 6, 2018 Company name: MARUZEN CO.,LTD. Stock exchange listing: Tokyo Stock Exchange Code number: 5982 URL:
CMIC HOLDINGS Co., Ltd. Consolidated Financial Results
 (Note) This translation is prepared and provided for readers' convenience only. In the event of any discrepancy between this translated document and the original Japanese document, the original document
Fiscal 2006 Economic Outlook and Basic Stance for Economic and Fiscal Management. 1. Economic and Fiscal Management and the Japanese Economy in FY2005
 Provisional Translation Fiscal 2006 Economic Outlook and Basic Stance for Economic and Fiscal Management January 20, 2006 Cabinet Decision 1. Economic and Fiscal Management and the Japanese Economy in
Consolidated Financial Report for the Fiscal Year ended March 31, 2018 <Japanese GAAP>
 NIPPON THOMPSON CO., LTD. Corporate Headquarters: Tokyo Listed Code: 6480 Listed Stock Exchange: Tokyo (URL: http://www.ikont.co.jp/eg/) May 14, Consolidated Financial Report for the Fiscal Year ended
Summary of Consolidated Financial Results for the Year Ended March 31, 2017 (Based on Japanese GAAP)
") Translation Notice: This document is an excerpt translation of the original Japanese document and is only for reference purposes. In the event of any discrepancy between this translated document and the
Translation Notice: This document is an excerpt translation of the original Japanese document and is only for reference purposes. In the event of any discrepancy between this translated document and the
Flash Report for the Fiscal Year ended December 31, 2013 [Japan GAAP] (on a consolidated basis)
![Flash Report for the Fiscal Year ended December 31, 2013 [Japan GAAP] (on a consolidated basis)](/thumbs/91/106826542.jpg "Flash Report for the Fiscal Year ended December 31, 2013 [Japan GAAP] (on a consolidated basis)") Flash Report for the Fiscal Year ended December 31, [Japan GAAP] (on a consolidated basis) January 31, 2014 Company Name: OPT, Inc. Stock exchange listing: Tokyo Stock Code: 2389 URL http://www.opt.ne.jp/
Flash Report for the Fiscal Year ended December 31, [Japan GAAP] (on a consolidated basis) January 31, 2014 Company Name: OPT, Inc. Stock exchange listing: Tokyo Stock Code: 2389 URL http://www.opt.ne.jp/
Heian Ceremony Service Reports Earnings for the First Six Months Ended September 2007
 FOR IMMEDIATE RELEASE Heian Ceremony Service Reports Earnings for the First Six Months Ended September 2007 Kanagawa, Japan November 9, 2007 Heian Ceremony Service Co., Ltd. (JASDAQ Security Code 2344)
FANCL Corporation. Non-consolidated Financial Statements for the Interim Period of the Fiscal Year Ending March 31, 2007
 FANCL Corporation Non-consolidated Financial Statements for the Interim Period of the Fiscal Year Ending March 31, 2007 This document has been translated from the original Japanese as a guide for non-japanese
Code number : 7202 :
 FY2013 First Quarter Consolidated Financial Results (Japan GAAP) (April 1, 2012 through June 30, 2012) English Translation of the Original Japanese-Language Document August 3, 2012 Company name : ISUZU
Consolidated Financial Results For the Third Quarter of the Fiscal Year Ending March 31, 2017
 Consolidated Financial Results For the Third Quarter of the Fiscal Year Ending March 31, 2017 (For the First Nine Months Ended December 31, 2016) Prepared in Conformity with Generally Accepted Accounting
Summary of Consolidated Financial Results for the Year Ended March 31, 2018 (Based on Japanese GAAP)
") Translation Notice: This document is an excerpt translation of the original Japanese document and is only for reference purposes. In the event of any discrepancy between this translated document and the
Translation Notice: This document is an excerpt translation of the original Japanese document and is only for reference purposes. In the event of any discrepancy between this translated document and the
Financial Results for the Nine Months Ended December 31, 2012
 February 14, 2013 Financial Results for the Nine Months Ended December 31, 2012 Nippon Life Insurance Company (the Company or the Parent Company ; President: Yoshinobu Tsutsui) announces financial results
May 11, 2018 Consolidated Earnings Report for Fiscal Year 2017, Ended March 31, 2018 [Japanese Standards]
![May 11, 2018 Consolidated Earnings Report for Fiscal Year 2017, Ended March 31, 2018 [Japanese Standards]](/thumbs/90/103479327.jpg "May 11, 2018 Consolidated Earnings Report for Fiscal Year 2017, Ended March 31, 2018 [Japanese Standards]") May 11, 2018 Consolidated Earnings Report for Fiscal Year 2017, Ended March 31, 2018 [Japanese Standards] Company name: Ryosan Company, Limited Stock listing: First Section, Tokyo Stock Exchange Securities
May 11, 2018 Consolidated Earnings Report for Fiscal Year 2017, Ended March 31, 2018 [Japanese Standards] Company name: Ryosan Company, Limited Stock listing: First Section, Tokyo Stock Exchange Securities
(1) Consolidated business results (% of change from same period in the previous year)
 Consolidated business results (% of change from same period in the previous year)") Date: February 13, 2018 Summary of Consolidated Financial Statements for the Fiscal Year 2017 ended December 31, 2017 (IFRS basis) (All financial information has been prepared based on the original Japanese-language
Date: February 13, 2018 Summary of Consolidated Financial Statements for the Fiscal Year 2017 ended December 31, 2017 (IFRS basis) (All financial information has been prepared based on the original Japanese-language
Condensed Consolidated Financial Information
 "Performance" Through Chemistry Condensed Consolidated Financial Information (Japanese Standard) for the Fiscal Year Ended March 31, 2018 (April 1, 2017 through March 31, 2018) Note: The English version
(2) Consolidated Financial Position Total assets Net assets Equity ratio
 Consolidated Financial Position Total assets Net assets Equity ratio") Financial Results for the Third Quarter of the Fiscal Year Ending March 31, 2018 [Japanese GAAP] (Consolidated) English translation from the original Japanese-language document January 31, 2018 Name of
Financial Results for the Third Quarter of the Fiscal Year Ending March 31, 2018 [Japanese GAAP] (Consolidated) English translation from the original Japanese-language document January 31, 2018 Name of
1. Consolidated results for the 2nd Quarter 2009 (from April 1, 2008, to September 30, 2008) Net income per share after dilution
 Net income per share after dilution") November 14, 2008 Summary of Financial Statements Company name: Sodick Co., Ltd. Stock exchange: Tokyo Stock Exchange, 2 nd Section Code number: 6143 URL: http://www.sodick.co.jp Representative: Kazuo
November 14, 2008 Summary of Financial Statements Company name: Sodick Co., Ltd. Stock exchange: Tokyo Stock Exchange, 2 nd Section Code number: 6143 URL: http://www.sodick.co.jp Representative: Kazuo
Consolidated Settlement of Accounts for the Nine Months Ended December 31, 2009
 The figures for these Financial Statements are prepared in accordance with the accounting principles based on Japanese law. Accordingly, they do not necessarily match the figures in the Annual Report issued
Flash Report Consolidated Basis (Japanese GAAP)
") YAMAHA CORPORATION Flash Report Consolidated Basis (Japanese GAAP) Results for the fiscal year ended March 31, 2018 May 1, 2018 Company name: Code number: 7951 Stock listing: Address of headquarters: Representative
YAMAHA CORPORATION Flash Report Consolidated Basis (Japanese GAAP) Results for the fiscal year ended March 31, 2018 May 1, 2018 Company name: Code number: 7951 Stock listing: Address of headquarters: Representative
Sumitomo Heavy Industries, Ltd.
 Sumitomo Heavy Industries, Ltd. CONSOLIDATED REPORT FY 2007, H1 For the Six-Month Period to September 30, 2007 Note: All financial information has been prepared in accordance with generally accepted accounting
Financial Report 2015 Japan Aviation Electronics Industry, Limited and consolidated subsidiaries Years ended March 31
 Financial Report Japan Aviation Electronics Industry, Limited and consolidated subsidiaries Financial Outlook While US economy continued its stable growth driven by improvement in employment, consumer
OMRON CORPORATION FINANCIAL FACT BOOK 2017
 OMRON CORPORATION FINANCIAL FACT BOOK 217 CONTENTS Page Sales Data Net Sales P.1 Foreign Exchange Rates Sales by Business Segment P.2 Sales by Region P.3 Profit Data Gross Profit, Gross Profit / Net Sales
Fiscal 2015 Supplementary Information May 10, 2016
 Fiscal 2015 Supplementary Information May 10, 2016 * Forward-looking statements made in this document, such as business forecasts, are based on the information available at this time and on certain premises
Summary of Consolidated Financial Results for the Year Ended March 31, 2016 (Based on Japanese GAAP)
") Translation Notice: This document is an excerpt translation of the original Japanese document and is only for reference purposes. In the event of any discrepancy between this translated document and the
Translation Notice: This document is an excerpt translation of the original Japanese document and is only for reference purposes. In the event of any discrepancy between this translated document and the
Summary of Consolidated Financial Statements for the Nine Months ended September 30,2012 (Japanese GAAP)
") Summary of Consolidated Financial Statements for the Nine Months ended September 30,2012 (Japanese GAAP) November 6, 2012 Company name HORIBA, Ltd. Listed stock exchanges: Tokyo, Osaka Listing code 6856
Summary of Consolidated Financial Statements for the Nine Months ended September 30,2012 (Japanese GAAP) November 6, 2012 Company name HORIBA, Ltd. Listed stock exchanges: Tokyo, Osaka Listing code 6856
Consolidated 11-year highlights
 2006.3 2007.3 2008.3 2009.3 1. Operating results Net sales 938,082 1,009,586 1,036,624 943,410 Gross profit 250,365 258,737 256,428 218,636 Percentage of net sales (%) 26.7 25.6 24.7 23.2 Operating income
1. Financial Highlights 1 2. Consolidated Balance Sheets 2 3. Consolidated Statements of Income and
 June 14, 2012 CONTENTS Page 1. Financial Highlights 1 2. Consolidated Balance Sheets 2 3. Consolidated Statements of Income and Consolidated Statements of Comprehensive Income 4 4. Consolidated Statements
Stock exchange on which the shares are listed : Tokyo Stock Exchange in Japan Code number : 7202 :
 Consolidated Financial Results (Japan GAAP) (April 1, 2017 through March 31, 2018) English Translation of the Original Japanese-Language Document Company name : ISUZU MOTORS LIMITED Stock exchange on which
(Amounts rounded down to the nearest million yen) (1) Operating Results (Percentage figures represent year-on-year changes)
 (1) Operating Results (Percentage figures represent year-on-year changes)") Financial Results for the Three Months Ended June 30, 2017 [Japanese Accounting Standards] (Consolidated) (Unaudited) August 2, 2017 NTN Corporation Security Code: 6472 Listings: Tokyo Stock Exchanges
Financial Results for the Three Months Ended June 30, 2017 [Japanese Accounting Standards] (Consolidated) (Unaudited) August 2, 2017 NTN Corporation Security Code: 6472 Listings: Tokyo Stock Exchanges
Consolidated Financial Results for the 1st Quarter of the Fiscal Year Ending March 31, 2009
 NIHON KOHDEN CORPORATION (6849) August 6, 2008 Consolidated Financial Results for the 1st Quarter of the Fiscal Year Ending March 31, 2009 Stock Exchange Listing: Head Office: Representative: Contact:
Summary of Consolidated Financial Statements for the Year Ended December 31, 2018 (Japanese GAAP) February 12, 2019 Company name HORIBA, Ltd. Listed s
 February 12, 2019 Company name HORIBA, Ltd. Listed s") Summary of Consolidated Financial Statements for the Year Ended December 31, 2018 (Japanese GAAP) February 12, 2019 Company name HORIBA, Ltd. Listed stock exchanges: Tokyo Listing code 6856 URL: http://www.horiba.com
Summary of Consolidated Financial Statements for the Year Ended December 31, 2018 (Japanese GAAP) February 12, 2019 Company name HORIBA, Ltd. Listed stock exchanges: Tokyo Listing code 6856 URL: http://www.horiba.com
Asahi Group Holdings, Ltd.
 Asahi Group Holdings, Ltd. FY2014 Financial Results NOTE: All information has been prepared in accordance with generally accepted accounting principles in Japan. Amounts shown in this accounting report
Summary of Consolidated Financial Results For the Fiscal Year Ended September 30, 2015 Based on Japanese GAAP
 Note: Please note that this document is a Japanese-English translation of the summary of the official announcement in Japanese Kessan Tanshin for reference purposes only. Summary of Consolidated Financial
MORITO CO., LTD. Financial Statement (Unaudited) For the Fiscal Year ended November 30, 2017 (Translated from the Japanese original)
 For the Fiscal Year ended November 30, 2017 (Translated from the Japanese original)") MORITO CO., LTD. Financial Statement (Unaudited) For the Fiscal Year ended November 30, 2017 (Translated from the Japanese original) January 12, 2018 Corporate Information Code:9837 Listings in First Section
MORITO CO., LTD. Financial Statement (Unaudited) For the Fiscal Year ended November 30, 2017 (Translated from the Japanese original) January 12, 2018 Corporate Information Code:9837 Listings in First Section
Consolidated Financial Results for the Fiscal Year Ended March 31, 2018 Japanese GAAP
 This document has been translated from the Japanese original "Kessan Tanshin" disclosed at the Tokyo Stock Exchange on May 14, 2018 and prepared for reference purpose only. In the event of any discrepancy
Oki Electric Industry / 6703
 Oki Electric Industry / 673 COVERAGE INITIATED ON: 217.4.21 LAST UPDATE: 218.2.1 Shared Research Inc. has produced this report by request from the company discussed in the report. The aim is to provide
Kobe Steel's Consolidated Financial Results for First Quarter of Fiscal 2016 (April 1 June 30, 2016)
") Kobe Steel's Consolidated Financial Results for First Quarter of Fiscal 2016 (April 1 June 30, 2016) July 29, 2016 Company name: Kobe Steel, Ltd. Code number: 5406 Stock exchanges where shares are listed:
Kobe Steel's Consolidated Financial Results for First Quarter of Fiscal 2016 (April 1 June 30, 2016) July 29, 2016 Company name: Kobe Steel, Ltd. Code number: 5406 Stock exchanges where shares are listed:
Fully diluted net income per share
 Summary of Consolidated Financial Results For the Third Quarter of the Fiscal Year Ending March 31, 2009 (Nine Months Ended December 31, 2008) February 6, 2009 Company name: Nippon Shokubai Co., Ltd. Listing: