ANALYST GUIDE FY2016. October <Contact for information on this material: Mr. Ohno, Administration Headquarters ( )>
|
|
|
- Alyson Fletcher
- 5 years ago
- Views:
Transcription

 <Contact for")

1 ANALYST GUIDE FY2016 October 2016 (Listed on the 1st Section of the Tokyo Stock Exchange; Code 7447) <Contact for information on this material: Mr. Ohno, Administration Headquarters ( )>

2 I About NAGAILEBEN 1

3 Outline 1 100th year in business Establish competitive position in medical clothing market -Approximately 60% market share in domestic medical clothing - The number of shipments is over 6 million clothing a year. -Wide field, planning, manufacturing and marketing -Competitive product such as extensive products, custom-made program 2 Strong growing market (million Yen) 18,000 Change of sales E 18.0B (2019) The number of Nursing Staff and Care workers is increasing gently. 17, B (2016) Doctor, Dentist, Pharmacist*1 (2014) 700,000 People Nursing Staff*2 (2014) 1,600,000 people Care workers*3 (2013) 1,770,000 people 16,000 15,000 14, B (2009) 15.1B (2012) compare with ,000people compare with ,000people compare with ,000people 13,000 *1 Research of doctor, dentist and pharmacist.2014, MHLW *2 Japanese Nursing Associations statistical data *3 MHLW, document secure human resources in the care field 12, E 予 18E 予 19E 予 2
4 3 4 5 Highly profitability and strong balance sheet - Realization of high profitability with radical pursuit of efficiency -Gross profit to sales 46.8% (as of FY2016) -Capital-to-asset ratio 88.8% -ROE 9.4% Rewarding shareholder-focused policies -BPS 1,037.8Yen (as of FY2016) -EPS 98.1Yen -Continue stable dividend payment with payout ratio of 50% -Acquisition of treasury stock Social Responsibility Job creation at Regional Community -Domestic: Akita -Overseas: China, Indonesia, and Vietnam Support for women -Products for nursing staff or a care worker -Work for women sewing staff (%) 50 Change of Gross profit to sales (million Yen) 5,000 Total dividend 4,000 1,117m 3,000 2,000 1, % (1980) 33.1% (1990) 45.3% (2010) 39.7% (2000) 46.8% (2016) Total dividend 1,662m Total dividend Share buyback Net income *2015: DPS 100yen (commemorative 50yen) Environmental Management -Acquired ISO14001 certification - COMPELPACK the surgical wear which enables hospital to reduce waste Support for Children Admired occupation for medical -Miffy s visits to children's hospitals -Lending hospital medical clothing for child 3
5 Agenda I About NAGAILEBEN II Financial Review FY2016 III Market Environment IV Forecast for FY2017 V Management Goals VI Rewarding shareholder-focused policies 4
6 Overview FY Sales & Income Net Sales and Operating income recorded highest. Sales: 16.5 b Operating income: 4.9 b 2 3 The Change of Business Environment - Market Condition: The impact of Medical treatment fees revision was negligible - Production Condition: Escalating material prices, rising sewing costs Unusual Event in this term - Exchange-rate profit: FY m FY m FY m 5
7 II Financial Review FY2016 6
8 Financial Highlights <Statements of Income> (millions of yen,%) FY2016 % Change To Forecast % Composition % Composition % Change Net sales 16, Gross profit 7, Sales, general, and administrative expenses 2, Operating income 4, Recurring income 4, Net income 3, [Overview] - Sales in major business for healthcare and doctors grew steadily. Sales of products for patients continued to grow greatly. Sales in West Japan expanded due to sales promotion. Sales in FY2016 surpassed forecast and became highest ever. [Gross profit] ] Gross profit to sales FY % FY % y/y + 202m (Factor of Net sales / price revision: + 233m, Factor of production - 31 m) Boost of material cost and sewing cost (- 22m) Foreign Exchange rate: FY yen/dollar FY yen/dollar (- 115m) Overseas production ratio FY % FY % (+ 97m) [Sales, general, and administrative expenses] - The cost of 100th anniversaries: 34m, Dual corporate tax system: 50m [Non-operating income] - FY2015 Exchange-rate profit: 226m, FY2016 Exchange-rate loss: 70m [Capital Expenditure] -Capital Expenditure: 190m (Manufacturing equipment: 71m, Building: 50m, Distribution equipment: 32m, IT system: 19m) -Depreciation: 331m 7
9 Financial Highlights <Balance Sheet> Major assets ( million %) Title Result Change Result Change % Cash on hand at banks 19, Notes and accounts receivable 4, Securities - -1, Inventories 4, Current assets 29, Buildings and structures 2, Land 4, Investments and other assets 2, Fixed assets 9, Total assets 38, Major liabilities and shareholders' equity ( million %) Title Result Change Result Change% Notes and accounts payable 1, Accrued income taxes 1, Current liabilities 4, Capital reserves 34, Treasury stock -4, Net assets 34, Total liabilities and net assets 38, [Major changes from the previous fiscal year] Cash and cash equivalents up 830million -Cash flows from operating activities up 3,565million -Acquisition tangible and intangible down 169million -Dividend payout down 3,324million -Redemption of securities up 1,518million - Long-term deposit down 900million Fixed assets up 477million -Buildings and structures(depreciation) down 79million - Long-term deposit up 900million -Exchange contract down 158million Net assets down 293million -Net profit up 3,262million -Dividend payout down 3,324million 8


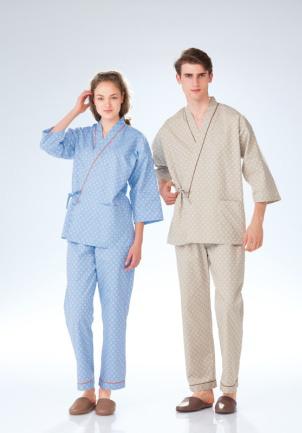


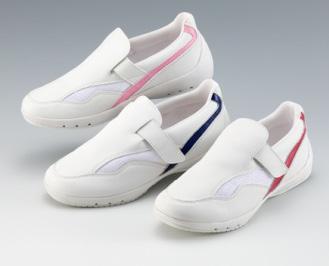

10 Segments by item Healthcare wear Patient wear Shoes Doctors' wear Utility wear Surgery wear 9
11 Sales by Item Doctors' 16.1% 3.6% Utility Patient 9.8% Surgery 9.5% Healthcare Shoes 58.5% 1.2% Others 1.3% Year-on-year change FY2015 FY2016 Overall -0.4% +2.4% Healthcare wear -0.1% +2.6% Doctors' wear -2.6% +2.0% Utility wear -9.8% -10.3% Patient wear +7.2% +11.1% Surgery wear +2.3% +0.9% Shoes -10.9% -3.1% Others -7.0% -3.9% [Healthcare wear] -Though y/y change of sales in first-half was +0.2%, that of second-half was +4.3%. New products and new contracts contributed to the sales. [Doctors' wear] -Sales of high functional products was steadily. The sales of this segment changed to increase. [Utility wear] - Sales fell because institutions changed unit of supply from individual to section and tighten the allocation standard. [Patient wear] -As the sales of new products in recent years grew, highgrowth sales was achieved. [Surgery wear] - The capacity of sterilization factory for COMPELPACK reached limit. Sales kept the previous year. 10
12 Sales by Region Central Japan 10.4% West Japan 36.8% [East Japan] - Sales reached highest record. Though sales in firsthalf FY2016 declined slightly, y/y change of sales in second-half FY2016 was +4.2%. Sales in 3Q, which is demand season, contributed to growth. Overseas East Japan 1.2% 51.6% Year-on-year change FY2015 FY2016 Total sales -0.4% +2.4% East Japan -1.2% +2.2% Central Japan +1.7% -3.2% West Japan +0.0% +4.1% Overseas +5.4% +14.1% [Central Japan] -Market size was not large and there was the influence by the size of contracts. In this term, sales declined. [West Japan] -Share of the market grew, by catching renewal and new contracts steadily. Highest ever sales continued. [Overseas] - Though sales size was not large, our reputation about product quality and functionality expanded. Renewal contracts increased. Firm-growth sales continued. 11
13 III Business Environment 12
14 Business Environment Topics Stable market condition continues -The impact of revising medical treatment fees is negligible. - The number of Nursing Staff and Care workers is increasing gently. Rising sewing costs Overseas: The cost of labor charge around China and Southeast Asia is rising. In Japan: Labor costs are Increasing due to labor shortage. Stirring exchange rate -monthly average exchange rate in NY market(as of Aug.) As of Aug /dollar 2011: 77/dollar, 2012: 77/dollar, 2013: 98/dollar, 2014: 102/dollar, 2015: 123/dollar, 2016: 103/dollar,
15 Market Environment '06 '07 '08 '09 '10 '11 '12 Changes and prospects for medical and care service systems Medical System Medical Service Law, Health and Medical Medical treatment fees Service Law for the Aged, Medical Insurance, etc Proposed draft of reform of medical insurance system submitted. Expansion of DPC to general hospitals. New Health Frontier Strategy announced Social medical corporations instituted by law Medical program for very elderly instituted by law Metabolic diagnosis and health guidance specified as mandatory Enforcement of Amended Pharmaceutical Affairs Law Local healthcare revival plan Release of the 7th prospect for supply and demand of nursing staff. Legal transformation of national medical highly-advanced center into independent administrative corporations Postponed time limit of abolishing nursing care type medical facilities for 6 year. The interim appraisal of the medical expenses adjustment plan. Postponed abolishing of Medical Care System for People Aged 75 and over Total market: -3.16% Service: -1.3% Drug price: -1.8% Total market: -0.83% Service: +0.38% Drug price: -1.2% Total market: +0.19% Service: +1.55% Drug price: -1.36% Total market: % Service: +1.38% Drug price: -1.38% Care Service System Care Service Law, Nursing Care Insurance, etc. Enforcement of Amended Nursing Care Insurance Law 3 rd plan of care insurance system ( ) Ban lifted on medical corporations from operating private commercial nursing homes. Nursing care type medical facilities to be abolished in 2012 Nursing care type elderly health facilities instituted 4 th plan of care insurance system ( ) Disapproval of setting up specialty nursing homes for social medical organization. Enforcement of Amended Nursing Care Insurance Law 5th plan of care insurance system ( ) Nursing care fees Total market: -2.4% Home: -1.0% Facilities: -4.0% Total market: +3.0% Home: +1.7% Facilities: +1.3% Total market: +1.2% Home: +1.0% Facilities: +0.2% 13 2nd plan of the medical expenses Plan of strategic market creation Revising of measures against reduction of incidence for nursing care 14 Medical Service Act Enforcement of Amended Pharmaceutical Affairs Law Total market: +0.10% Service: +0.73% Drug price: -0.63% The law for Medical care synthesis total promotion +0.63% Consumption tax increase '15 System for promotion of community medical corporation Expansive financial support of national health insurance System for promotion of community medical corporation 6th plan of care insurance system ( ) Total market: -2.27% Home: -1.42% Facilities: -0.85% 16 Formulation of Local medical program Enforcement of Medical treatment with patients' offer Total market: -0.84% Service: +0.49% Drug price: -1.33% Enforcement of Amended Nursing Care Insurance Law for Community day care 14
16 Market Environment Revisions to medical treatment and care Service fees (%) 5 Service: +0.49% Drug price: -1.33% Consumption tax increase Medical Care Service Home-1.42%, Facilities -0.85%
17 Market Environment Supply and Demand of Nursing Staff (Source: the Ministry of Health, Labor and Welfare (December 2010)) (10,000 persons) 175 Demand Forecast Actual Change to actual number as from the 7th Outlook. Actual(2014) 1.6 m persons 150 Decreased number of nursing staff on both supply and demand sides for technical reasons due to the shift to a fulltime-worker-based counting system as from the 6th Outlook. actual number 125 The number of nursing staff on the supply side is estimated to increase by 2.57% annually. 100 The 5th outlook for nursing staff demand and supply ( ) The 7th outlook for nursing staff demand and supply ( ) 75 The 4th outlook for nursing staff demand and supply ( ) The 6th outlook for nursing staff demand and supply ( ) '91 '92 '93 '94 '95 '96 '97 '98 '99 '00 '01 '02 '03 '04 '05 '06 '07 '08 '09 '10 '11 '12 '13 '14 '15 The 7th outlook for nursing staff demand and supply (five-year plan from 2011 through 2015) Outlook for nursing staff supply and demand for all medical and nursing fields Next outlook for nursing staff supply and demand will be announced in 2016 (Year) 16
18 Market Environment (10,000 persons) 300 Supply and estimated future need for care workers 250 Forecast Actual '00 '01 '02 '03 '04 '05 '06 '07 '08 '09 '10 '11 '12 '13 '25 Since the number of track records are subject to the influence of change of an examination method, Ministry of Health, Labor and Welfare adjusted the number after Actual record: Ministry of Health statistical data Forecast: Ministry of Health, Labor and Welfare: Estimation of care workers' demand toward
19 Market Environment 300 (10,000 persons) Nursing Staff Supply and estimated future need care workers forecast(maximum) forecast(minimum) Actual Actual record: Japanese Nursing Associations statistical data Forecast: The committee about supply and estimated future need of Nursing Ministry of Health, Labor and Welfare Actual record: Ministry of Health statistical data Forecast: Ministry of Health, Labor and Welfare: Estimation of care workers' demand toward
20 IV Forecast for FY
21 Management Tasks and Status Marketing strategy to boost sales Capture clusters of needs in the healthcare wear market Increase peripheral business in products for patients and surgery Develop new markets Production strategy to ensure a steady supply Strengthen domestic production (wage increase) Strengthen ties with material makers and trade firms Strengthen ability to respond Quick Response and small-lot multi-product Strategy to stabilize profitability Shift to overseas from domestic production Apply special tax measures for EPA and FTA Improvement of profitability by price revision 20
22 Forecast Statements of Income (millions of yen,%) FY2017E % Change (FY2015) Composition % Change Net sales 17, Gross profit 7, Sales, general, and administrative expenses 2, Operating income 5, Recurring income 5, Net income 3, [Overview] - Net sales and Operating income are expected highest record. Income will continue to rise steadily. Gross profit to sales will be improved. These will be achieved by putting higher quality, higher sensitivity and value-added products in markets. [Gross profit] Gross profit to sales FY % FY2017E 46.7% y/y + 210m (Factor of Net sales / price revision: + 321m, Factor of production: m) Boost of material cost and sewing cost (- 70m) Foreign Exchange rate: FY yen/dollar FY2017E 103.8yen/dollar (- 71m) Overseas production ratio FY % FY2017E 48.1 % (+ 52m) [Sales, general, and administrative expenses] - Dual corporate tax system: 83m [Non-operating income] - FY2016 Exchange-rate loss: 70m [Capital Expenditure] -Capital Expenditure: 155m (Buildings: 44m, IT system: 41m, Manufacturing equipment: 33m, Distribution equipment: 12m) -Depreciation: 318m 21
23 Forecast of Sales by Item ( million) 18,000 16,000 14,000 12,000 10,000 8,000 6,000 4,000 2,000 Sales by Item Shoes/Others Surgery wear Patient wear Utility wear Doctors' wear Healthcare wear Year-on-year change FY2016 FY2017E Sales +2.4% +2.8% Healthcare wear +2.6% +2.8% Doctors' wear +2.0% +2.1% Utility wear -10.3% -8.6% Patient wear +11.1% +7.9% Surgery wear +0.9% +4.8% Shoes/Others -3.5% -7.8% E [Healthcare wear/ Doctors wear] Activating market by higher quality and value-added products, sales of healthcare wear and doctor s wear are expected to increase steadily. [Utility wear]as the demand being down, the decline in sales of utility wear is expected to continue. [Patient wear] The increase in sales of patient wear is expected to continue with demand in the health check market. [Surgery wear] As COMPELPACK and surgical underwear(scrub) being steadily permeated, the increase in sales of surgery wear is expected to continue. 22
24 Forecast of Sales by Region ( million) 18,000 16,000 14,000 12,000 10,000 8,000 6,000 4,000 2,000 Sales by Region Overseas West Japan Central Japan East Japan Year-on-year change FY2016 FY2017E Total sales +2.4% +2.8% East Japan +2.2% +1.7% Central Japan -3.2% +4.8% West Japan +4.1% +3.6% Overseas +14.1% +9.5% E Each area are expected to increase of sales and continue of the highest ever sales. [East Japan] Catching renewal orders steadily with higher quality and value-added products, the sales in East Japan is expected to increase consistently. [Central and West Japan] As gaining share by sales promotion, the increase of sales is planned. [Overseas] Sales is expected to increase as the impact of foreign exchange rate and expanding our reputation. 23
25 Product Strategy Sales by Product ( million) 18,000 16,000 14,000 12,000 10,000 8,000 6,000 4,000 2, E DC brand products High Functional products Standard Functional products Mass products Year-on-year change FY2016 FY2017E Sales 2.4% +2.8% DC brand products -14.8% -5.7% High Functional products +7.8% +6.2% Standard Functional products DC brand products High Functional products Standard Functional products -0.9% 0.0% Mass products -6.6% -4.1% (Retail price) 10,000Yen 7,500Yen 5,000Yen Mass products Price composition (Nurse one-piece) [DC brands ] "Miffy and "Liberty" will contribute to the sale, other DC brand products are on the decrease. [High functional products ] As these products being received well from the market, the increase in sales of high functional products is expected to continue by driving the strategy of higher quality and value-added products. [Mass products] As being on downward trend, the shift from mass products, include other company products, to functional products is expected to continue. 24
26 Production Strategy Production(Non-Consolidated) ( million) (%) 10, Composition FY2016 FY2017E 7,500 5, Purchased products Overseas production Domestic production Domestic production 51.2% 50.5% Overseas production 47.4% 48.1% Purchased products 1.4% 1.4% 2, Ratio of overseas production E 30 Japan: Strengthen ability to respond Quick Response and small-lot multi-product by increasing wage and securing human resources Overseas: Strengthen productivity and quality in new factory in Java, Indonesia 25
27 V Management Goals 26
28 Business Direction Sales Strategy -Increase peripheral business in products for patients and surgery. -Gain share In West Japan. -Develop and sale of high functional products. Profit Strategy -Driving the strategy of higher quality and value-added products. -The shift to overseas production. -The minimization of exchange risk Equalization of the fluctuations in foreign exchange rates by reservation of exchange contracts 27
29 Sales Strategy Sales by Item Sales by Region Sales by Products FY2013 (3 terms ago) Healthcare Doctors' 58% 16% Utility 5% East Japan 54% functional 46% 8% Patient 10% 3% Surgery Others Central Japan 10% 6% 35% 1% Overseas 7% 41% FY2016 (Previous term) 58% 16% 52% 53% 10% 2% 4% 1% 5% 4% 10% 10% 37% 38% FY2019E (3 terms later) net sales 15,625 million 16,537 million 18,000 million High DC brand West Japan Standard functional Mass 57% 16% 2% 48% High functional 58% 11% Patient 12% Surgery 2% 11% 3% 2% 4% West Japan 39% 35% 28
30 Net Sales and Gross Profit to Sales Ratio ( million) (%) 17,500 15,000 Net sales (left) Gross profit to sales (right) 55 12,500 10, ,500 5, , E18E19E (FY) Note: Consolidated data since FY1994 are shown. Preceding years represent non-consolidated data. ( million) FY2019E Net Sales 18,000 Operating Income 5,400 29
31 ⅤI Rewarding shareholder-focused policies 30
32 Profit Reimbursement to Shareholders Shareholder-focused policies - Improvement of transparency by proactive disclosure - Interactive communication with investors - Profit reimbursement by high dividends Dividend policy - Basic policy is to continue stable dividend payment with payout ratio of 50% Share buyback - Acquire expeditiously when our share is undervalued 31
33 The History of Stock Value BPS EPS DPS (yen) (yen) (yen) FY FY FY (Yen) ( 円 ) 1, ,000 FY FY FY FY FY FY FY FY FY FY FY2014 1, FY2015 1, FY2016 1, FY2009: Accrued pension fund withdrawal payment loss 1.04b A dotted line is when there was not outbreak. *2015: DPS 100yen (commemorative 50yen) * Book Value Per Share (BPS)(left) Earnings Per Share(EPS)(right)
34 Actual Dividends Paid Total dividend Share buyback Payout ratio Total return ratio (Million yen) (Million yen) (non-c, %) (non-c, %) FY FY FY , FY FY2005 1, FY2006 1, FY2007 1, FY2008 1,083 1, FY2009 1,040 1, FY2010 1, FY2011 1, FY2012 1, FY2013 1, FY2014 1, E54.4 FY2015 *3,324 1, FY2016 E 1, *2015: DPS 100yen (commemorative 50yen) 33
35 Management Philosophy Our management philosophy are Let us help the human life and Harmony. We think that well-balanced growth with human, profit and philanthropy become the responsible corporate. Furthermore, we have our company spirit, Nagaism. We continue to specialize in medical / nurse / care business area, expanding its market and developing best products for our customers. Human Believing Concentrating Pursuing principal Nagaism Business model Market Profit Contribution Creation of Social Value 34
36 Notes on this material This material includes forecasts for the future. These forecasts are based on the judgment of the Company's management concerning currently available information. These future projections include assumptions or views based on assumptions, and therefore may be different from the actual outcome, depending upon future circumstances. The expectations for future results stated by the Company or its management in this material do not represent any warranty that these expectations or particular results will be realized. The Company is not liable to update any of its forecasts, or projections, unless otherwise provided for by law or under the relevant regulations. 35
37 Data File FY2016 (Listed on the 1st Section of the Tokyo Stock Exchange;Code 7447) <Contact for information on this material: Mr. Ohno, Administration Headquarters ( )>
38 Index 1 Sales by Item 2 Sales by Product 3 Sales by Region 4 Rationalization of the Production System and Our Purchasing Strategy (Non-Consolidated) 5 Statements of Income (Consolidated) 6 Statements of Income (Non-Consolidated) 7 Indices (Consolidated) 8 Indices (Non-Consolidated) 9 10 Statements of Income (Consolidated Non-Consolidated) Balance Sheet (Consolidated Non-Consolidated)
39 1. Sales by Item FY 13/8 14/8 15/8 16/8 17/8E First-half 15/8 ( million) First-half 16/8 Sales 15,625 16,214 16,150 16,537 17,000 6,840 6,938 Healthcare wear 9,039 9,440 9,429 9,674 9,950 4,011 4,021 Doctors' wear 2,566 2,674 2,604 2,654 2,710 1,046 1,067 Utility wear Patient wear 1,273 1,353 1,451 1,613 1, Surgery wear 1,479 1,525 1,560 1,574 1, Shoes Others ( million) 18,000 16,000 14,000 12,000 Change over previous year (%) Sales Healthcare wear Doctors' wear Utility wear Patient wear Surgery wear Shoes Others Composition (%) Sales Healthcare wear Doctors' wear Utility wear Patient wear Surgery wear Shoes Others ,000 8,000 6,000 4,000 2, /8 14/8 15/8 16/8 17/8E Others Shoes (FY) Surgery wear Patient wear Utility wear Doctors' wear Healthcare wear 1
40 2. Sales by Product FY 13/8 14/8 15/8 16/8 17/8E First-half 15/8 ( million) First-half 16/8 Sales 15,625 16,214 16,150 16,537 17,000 6,840 6,938 DC brand products High Functional products 7,212 7,795 8,090 8,720 9,260 3,457 3,716 Standard Functional products 6,433 6,462 6,252 6,199 6,200 2,617 2,545 Mass products 1,045 1, Change over previous year (%) Sales DC brand products High Functional products Standard Functional products Mass products ( million) 18,000 16,000 14,000 12,000 10,000 8,000 6,000 Composition (%) Sales DC brand products High Functional products Standard Functional products Mass products DC brand High Functional Standard Functional products Mass products (Retail price) 10,000Yen 7,500Yen 5,000Yen Price composition (Nurse one-piece) 4,000 2, /8 14/8 15/8 16/8 17/8E(FY) DC brand products High Functional products Standard Functional products Mass products 2
41 3. Sales by Region FY 13/8 14/8 15/8 16/8 17/8E First-half 15/8 ( million) First-half 16/8 Sales 15,625 16,214 16,150 16,537 17,000 6,840 6,938 East Japan 8,390 8,461 8,357 8,539 8,680 3,430 3,406 Central Japan 1,591 1,745 1,774 1,717 1, West Japan 5,508 5,839 5,842 6,080 6,300 2,529 2,694 Overseas ( million) 18,000 16,000 14,000 12,000 10,000 Change over previous year (%) Sales East Japan Central Japan West Japan Overseas ,000 6,000 4,000 2,000 Composition (%) Sales East Japan Central Japan West Japan Overseas /8 14/8 15/8 16/8 17/8E (FY) Overseas West Japan Central Japan East Japan 3
42 4. Rationalization of the Production System and Our Purchasing Strategy(Non-Consolidated) FY 13/8 14/8 15/8 16/8 17/8E First-half 15/8 ( million) First-half 16/8 Domestic production 4,951 5,061 4,901 4,771 4,770 2,495 2,430 Overseas production 3,550 4,017 4,215 4,419 4,537 2,112 2,164 Purchased products Total 8,725 9,320 9,252 9,323 9,437 4,673 4,649 ( million) 10,000 7,500 (%) , Change over previous year (%) Domestic production Overseas production Purchased products , Total Composition (%) Domestic production /8 14/8 15/8 16/8 17/8E 30 (FY) Overseas production Purchased products Purchased products Total Overseas production Domestic production % of purchases from overseas factories 4
43 5. Statements of Income (Consolidated) FY 13/8 14/8 15/8 16/8 17/8E First-half 15/8 ( million) First-half 16/8 Net Sales 15,625 16,214 16,150 16,537 17,000 6,840 6,938 Gross profit 7,346 7,585 7,532 7,735 7,945 3,187 3,174 Sales, general, and administrative expense 2,473 2,662 2,719 2,784 2,839 1,390 1,464 Operating income 4,873 4,923 4,813 4,950 5,106 1,797 1,709 Recurring income 5,418 5,142 5,088 4,937 5,150 2,033 1,702 Net income 3,119 3,224 3,225 3,262 3,528 1,302 1,123 Change over previous year (%) Net Sales Gross profit Sales, general, and administrative expense Operating income Recurring income Net income Composition (%) Net Sales Gross profit Sales, general, and administrative expense Operating income Recurring income Net income
44 6. Statements of Income (Non-Consolidated) FY 13/8 14/8 15/8 16/8 17/8E First-half 15/8 ( million) First-half 16/8 Net Sales 15,616 16,199 16,141 16,535 17,000 6,831 6,937 Gross profit 7,031 7,270 7,218 7,416 7,615 3,053 3,034 Sales, general, and administrative expenses 2,482 2,662 2,718 2,775 2,827 1,383 1,454 Operating income 4,549 4,608 4,500 4,641 4,787 1,669 1,579 Recurring income 5,177 4,938 4,883 4,734 4,944 2,005 1,674 Net income 3,014 3,145 3,137 3,167 3,427 1,318 1,139 Change over previous year (%) Net Sales Gross profit Sales, general, and administrative expenses Operating income Recurring income Net income Composition (%) Net Sales Gross profit Sales, general, and administrative expenses Operating income Recurring income Net income
45 7. Indices (Consolidated) (Unit) 12/8 13/8 14/8 15/8 16/8 First-half 15/8 Profitability ROE (%) ROA (%) Return on sales Net income (%) ROE resolution Total Assets Turnover (Times) Leverage (Times) Current Ratio (%) Fixed Assets Ratio (%) First-half 16/8 Financial stability Fixed Assets Ratio to Total of Shareholders Equity and Long-term Liabilities (%) Account Receivable Turnover (Times) Inventory Turnover (Times) BPS ( ) , , , Per share data EPS ( ) DPS ( ) Payout ratio (%) Free issue Stock split 2011/9/1 2-for Adjusted Adjusted BPS ( ) Per share data Adjusted EPS ( ) Adjusted DPS ( ) Capital expenditure ( million) Others Depreciation ( million) Number of employees (Persons) Personnel expense ( million) 2,235 2,245 2,305 2,305 2,328 1,158 1,168 (Note1) Ratio of Fixed Assets to Total of Shareholders Equity and Long-term Liabilities = Fixed Assets (Total shareholders equity + Long-term Liabilities) (Note2) Each of the balance sheet items used in the turnover figures is the average of the balances at the beginning and the end of the financial year. 7
46 8. Indices (Non-Consolidated) (Unit) 12/8 13/8 14/8 15/8 16/8 Profitability ROE (%) First-half 15/8 ROA (%) Return on sales Net income (%) ROE resolution Total AssetsTurnover (Times) Financial stability Leverage (Times) Current Ratio (%) Fixed Assets Ratio (%) Fixed Assets Ratio to Total of Shareholders Equity and Long-term Liabilities (%) Account Receivable Turnover (Times) Inventory Turnover (Times) First-half 16/8 BPS ( ) Per share data EPS ( ) DPS ( ) Payout ratio (%) Free issue Stock split 2011/9/1 2-for Adjusted Adjusted BPS ( ) Per share data Adjusted EPS ( ) Adjusted DPS ( ) Capital expenditure ( million) Others Depreciation ( million) Number of employees (Persons) Personnel expense ( million) 999 1,007 1,051 1,101 1, (Note1) Ratio of Fixed Assets to Total of Shareholders Equity and Long-term Liabilities = Fixed Assets (Total shareholders equity + Long-term Liabilities) (Note2) Each of the balance sheet items used in the turnover figures is the average of the balances at the beginning and the end of the financial year. 8
47 9. Statements of Income (Consolidated) ( million,%) ( million,%) FY 15/8 16/8 Change(the previous year) First-half 15/8 First-half 16/8 Change(the previous year) Result Composition Result Composition Result Change % Result Composition Result Composition Result Change % Net Sales 16, , , , Cost of sales 8, , , , Gross profit 7, , , , Sales, general, and administrative expens 2, , , , Packing and freight expenses Advertising expenses Personnel expenses 1,280 1, Management commission expense Depreciation expenses Operating income 4, , , , Non-operating income Interest income Rent income Others Non-operating expense Fixed assets rent expense Others Recurring income 5, , , , Extraordinary profit Extraordinary loss Income before income taxes 5, , , , Income, inhabitant and enterprise taxes 1,839 1, Tax adjustments Net income attributable to shareholders 3, , , ,
48 10. Statements of Income (Non-Consolidated) ( million,%) ( million,%) FY 15/8 16/8 Change(the previous year) First-half 15/8 First-half 16/8 Change(the previous year) Result Composition Result Composition Result Change % Result Composition Result Composition Result Change % Net Sales 16, , , , Cost of sales 8, , , , Gross profit 7, , , , Sales, general, and administrative expenses 2, , , , Packing and freight expenses Advertising expenses Personnel expenses 1,101 1, Management commission expenses Depreciation expenses Operating income 4, , , , Non-operating income Interest income Dividend income Rent income Others Non-operating expense Fixed assets rent expense Others Recurring income 4, , , , Extraordinary profit Extraordinary loss Income before income taxes 4, , , , Income, inhabitant and enterprise taxes 1,720 1, Tax adjustments Net income 3, , , ,
49 11. Balance Sheet (Consolidated) ( million,%) ( million,%) FY 15/8 16/8 Change(the previous year) First-half 15/8 First-half 16/8 Change(the previous year) Result Composition Result Composition Result Change % Result Composition Result Composition Result Change % Current assets 29, , , , Cash on hand and at banks 18,673 19,504 15,510 15,399 Trade notes and accounts receivable 4,759 4,928 4,710 4,819 (including electronically recorded claims) Securities 1,518-1,517 1,518 Inventories 4,199 4,348 4,860 4,878 Others Reserve bad debt Fixed assets 9, , , , Tangible fixed assets 7, , , , Buildings and structures 2,450 2,371 2,502 2,411 Machinery and equipment Land 4,447 4,447 4,480 4,447 Construction in progress Others Intangible fixed asset Investments and other assets 1, , , , Investment securities Others 998 1,577 1, Reserve bad debt Total assets 39, , , , Current liabilities 3, , , , Trade notes and accounts payable 1,399 1,561 1,658 1,587 Accrued income taxes 1,151 1, Accrued bonus Others Long-term liabilities Accrued pension and severance costs Directors retirement allowances Others Total liabilities 4, , , , Total shareholders equity 34, , , , Capital stock 1,925 1,925 1,925 1,925 Capital reserves 2,358 2,358 2,358 2,358 Retained earnings 35,040 34,978 33,117 32,840 Treasury stock -4,902-4,902-4,902-4,902 Accumulated other comprehensive income Net unrealized gains on investment securitie Deferred hedging gains and losses Accumulated pension and severance costs Total net assets 34, , , , Total liabilities and total net assets 39, , , ,
50 12. Balance Sheet(Non-Consolidated) ( million,%) ( million,%) FY 15/8 16/8 Change(the previous year) First-half 15/8 First-half 16/8 Change(the previous year) Result Composition Result Composition Result Change % Result Composition Result Composition Result Change % Current assets 26, , , , Cash on hand and at banks 16,456 17,165 13,550 13,229 Trade notes 2,783 2,820 1,928 1,912 (including electronically recorded claims) Accounts receivable 1,975 2,106 2,781 2,906 Securities 1,518-1,517 1,518 Inventories 3,370 3,493 3,978 4,074 Others Reserve bad debt Fixed assets 8, , , , Tangible fixed assets 7, , , , Buildings and structures 2,405 2,330 2,452 2,367 Machinery and equipment Land 4,447 4,447 4,480 4,447 Construction in progress Others Intangible fixed asset Investments and other assets 1, , , , Investment securities Others 799 1, Reserve bad debt Total assets 35, , , , Current liabilities 3, , , , Trade notes , Accounts payable Accrued income taxes 1,088 1, Others Long-term liabilities Accrued pension and severance costs Directors retirement allowances Others Total liabilities 3, , , , Total shareholders equity 31, , , , Capital stock 1,925 1,925 1,925 1,925 Capital reserves 2,637 2,637 2,637 2,637 Retained earnings 31,993 31,836 30,174 29,808 Treasury stock -4,902-4,902-4,902-4,902 Valuation and translation adjustments Net unrealized gains on investment securities Deferred hedging gains and losses Total net assets 31, , , , Total liabilities and total net assets 35, , , ,
ANALYST GUIDE FY2015. October <Contact for information on this material: Mr. Ohno, Administration Headquarters ( )>
>") ANALYST GUIDE FY2015 October 2015 (Listed on the 1st Section of the Tokyo Stock Exchange; Code 7447) Agenda
ANALYST GUIDE FY2015 October 2015 (Listed on the 1st Section of the Tokyo Stock Exchange; Code 7447) Agenda
Summary of Consolidated Financial Results for the Fiscal Year Ended March 31, 2018 <Under Japanese GAAP>
 Summary of Consolidated Financial Results for the Fiscal Year Ended May 15, 2018 Company name: Japan Post Holdings Co., Ltd. Stock exchange listing: Tokyo Stock Exchange Code number:
CMIC HOLDINGS Co., Ltd. Consolidated Financial Results
 (Note) This translation is prepared and provided for readers' convenience only. In the event of any discrepancy between this translated document and the original Japanese document, the original document
Nagaileben co., Ltd.
 7447 Tokyo Stock Exchange First Section Analyst Noboru Terashima Index Summary----------------------------------------------------------------------------------------------------------------------------------------------------------------------------
Brief Report of Financial Statements for the Year Ended March 31, 2012 [JGAAP] (Consolidated Basis)
![Brief Report of Financial Statements for the Year Ended March 31, 2012 [JGAAP] (Consolidated Basis)](/thumbs/94/119025550.jpg "Brief Report of Financial Statements for the Year Ended March 31, 2012 [JGAAP] (Consolidated Basis)") Brief Report of Financial Statements for the Year Ended March 31, 2012 [JGAAP] (Consolidated Basis) Listed exchanges: Tokyo, Osaka Listed company name: Kobayashi Pharmaceutical Co. Ltd. Code: 4967 URL:
Brief Report of Financial Statements for the Year Ended March 31, 2012 [JGAAP] (Consolidated Basis) Listed exchanges: Tokyo, Osaka Listed company name: Kobayashi Pharmaceutical Co. Ltd. Code: 4967 URL:
million yen % (39.5) 10.2 million yen 8,855 8,654
 10.2 million yen 8,855 8,654") Fiscal Year Ended December 2007 Financial Results (Non-consolidated) February 18, 2008 Corporate Name: AIRTECH JAPAN, LTD. Stock Exchange Listing: Tokyo Stock Exchange Stock Code: 6291 URL: http://www.airtech.co.jp
Fiscal Year Ended December 2007 Financial Results (Non-consolidated) February 18, 2008 Corporate Name: AIRTECH JAPAN, LTD. Stock Exchange Listing: Tokyo Stock Exchange Stock Code: 6291 URL: http://www.airtech.co.jp
Nagaileben co., Ltd.
 7447 Tokyo Stock Exchange First Section Analyst Noboru Terashima Index Summary----------------------------------------------------------------------------------------------------------------------------------------------------------------------------
FY2011 Consolidated Financial Results (Japan GAAP)
") Consolidated Financial Results (Japan GAAP) (April 1, 2010 through March 31, 2011) English Translation of the Original Japanese-Language Document May 11, 2011 Company name : ISUZU MOTORS LIMITED Stock
Consolidated Financial Results (Japan GAAP) (April 1, 2010 through March 31, 2011) English Translation of the Original Japanese-Language Document May 11, 2011 Company name : ISUZU MOTORS LIMITED Stock
SUMMARY OF CONSOLIDATED FINANCIAL STATEMENTS FOR THE SECOND QUARTER OF THE FISCAL YEAR ENDING NOVEMBER 30, 2015 [JAPAN GAAP]
![SUMMARY OF CONSOLIDATED FINANCIAL STATEMENTS FOR THE SECOND QUARTER OF THE FISCAL YEAR ENDING NOVEMBER 30, 2015 [JAPAN GAAP]](/thumbs/93/114398783.jpg "SUMMARY OF CONSOLIDATED FINANCIAL STATEMENTS FOR THE SECOND QUARTER OF THE FISCAL YEAR ENDING NOVEMBER 30, 2015 [JAPAN GAAP]") SUMMARY OF CONSOLIDATED FINANCIAL STATEMENTS FOR THE SECOND QUARTER OF THE FISCAL YEAR ENDING NOVEMBER 30, [JAPAN GAAP] July 1, Listed company name: Kewpie Corporation Listed exchange: Tokyo Stock Exchange
SUMMARY OF CONSOLIDATED FINANCIAL STATEMENTS FOR THE SECOND QUARTER OF THE FISCAL YEAR ENDING NOVEMBER 30, [JAPAN GAAP] July 1, Listed company name: Kewpie Corporation Listed exchange: Tokyo Stock Exchange
Five-year Financial Summary (Consolidated)
") Five-year Financial Summary (Consolidated) Years ended March 31 Fiscal Year Millions of yen FY212 FY213 FY214 FY215 FY216 (Ended March 213) (Ended March 214) (Ended March 215) (Ended March 216) (Ended
Five-year Financial Summary (Consolidated) Years ended March 31 Fiscal Year Millions of yen FY212 FY213 FY214 FY215 FY216 (Ended March 213) (Ended March 214) (Ended March 215) (Ended March 216) (Ended
Fiscal 2017 Overview (April 1, March 31, 2018)
") Fiscal 2017 Overview (April 1, 2017 - March 31, 2018) 1 Net sales Operating income Operating margin Record-high 8.9% 9.9% 10.0% 6.2% 4.0% 5.2% 5.6% 6.2% 7.2% 460.0 0.1% 1.1% 2.1% 404.9 Net sales, operating
Fiscal 2017 Overview (April 1, 2017 - March 31, 2018) 1 Net sales Operating income Operating margin Record-high 8.9% 9.9% 10.0% 6.2% 4.0% 5.2% 5.6% 6.2% 7.2% 460.0 0.1% 1.1% 2.1% 404.9 Net sales, operating
Consolidated Financial Results for the First Quarter of Fiscal 2018 [Japanese Standards]
![Consolidated Financial Results for the First Quarter of Fiscal 2018 [Japanese Standards]](/thumbs/95/123620478.jpg "Consolidated Financial Results for the First Quarter of Fiscal 2018 [Japanese Standards]") 7-7, Akasaka 2-chome, Minato-ku, Tokyo 107-8615, Japan July 11, 2018 Consolidated Financial Results for the First Quarter of Fiscal 2018 [Japanese Standards] Name: Hogy Medical Co., Ltd. Listing: First
7-7, Akasaka 2-chome, Minato-ku, Tokyo 107-8615, Japan July 11, 2018 Consolidated Financial Results for the First Quarter of Fiscal 2018 [Japanese Standards] Name: Hogy Medical Co., Ltd. Listing: First
Consolidated Financial Results for the First 2 Quarters of Fiscal 2015 [Japanese Standards]
![Consolidated Financial Results for the First 2 Quarters of Fiscal 2015 [Japanese Standards]](/thumbs/84/89184846.jpg "Consolidated Financial Results for the First 2 Quarters of Fiscal 2015 [Japanese Standards]") 7-7, Akasaka 2-chome, Minato-ku, Tokyo 107-8615, Japan October 13, 2015 Consolidated Financial Results for the First 2 Quarters of Fiscal 2015 [Japanese Standards] Name: Hogy Medical Co., Ltd. Listing:
7-7, Akasaka 2-chome, Minato-ku, Tokyo 107-8615, Japan October 13, 2015 Consolidated Financial Results for the First 2 Quarters of Fiscal 2015 [Japanese Standards] Name: Hogy Medical Co., Ltd. Listing:
Sumitomo Heavy Industries, Ltd.
 Sumitomo Heavy Industries, Ltd. 1Q CONSOLIDATED FINANCIAL REPORT For the ended Note: All financial information has been prepared in accordance with generally accepted accounting principles in Japan. This
Summary of Consolidated Financial Results for the First Quarter of Fiscal Year Ending [Japan Standards] (Consolidated) March 31, 2014:
![Summary of Consolidated Financial Results for the First Quarter of Fiscal Year Ending [Japan Standards] (Consolidated) March 31, 2014:](/thumbs/81/83889943.jpg "Summary of Consolidated Financial Results for the First Quarter of Fiscal Year Ending [Japan Standards] (Consolidated) March 31, 2014:") July 26, 213 Summary of Consolidated Financial Results for the First Quarter of Fiscal Year Ending March 31, 214 [Japan Standards] (Consolidated) Company name: MAX Co.,Ltd. Stock listing: Tokyo Stock Exchange
July 26, 213 Summary of Consolidated Financial Results for the First Quarter of Fiscal Year Ending March 31, 214 [Japan Standards] (Consolidated) Company name: MAX Co.,Ltd. Stock listing: Tokyo Stock Exchange
Net sales Operating profit Ordinary profit
 Consolidated Financial Statements Summary May 8, 2018 (For the year ended March 31, 2018) English translation from the original Japanese-language document (All financial information has been prepared in
Consolidated Financial Results First Two Quarters of the Fiscal Year ending March 2018 (April 1, 2017 to September 30, 2017)
") Consolidated Financial Results First Two Quarters of the Fiscal Year ending March 2018 (April 1, 2017 to September 30, 2017) Listed Company Name: Rinnai Corporation Listings: First sections of the Tokyo
Consolidated Financial Results First Two Quarters of the Fiscal Year ending March 2018 (April 1, 2017 to September 30, 2017) Listed Company Name: Rinnai Corporation Listings: First sections of the Tokyo
PUNCH INDUSTRY (6165)
") URL: www.walden.co.jp Written by Yoshiyuki Muroya / Yusuke Maeda E-mail: info@walden.co.jp Phone +81 3 3553 3769 PUNCH INDUSTRY (6165) Consolidated Fiscal Year Operating Recurring Profit Attributable to
URL: www.walden.co.jp Written by Yoshiyuki Muroya / Yusuke Maeda E-mail: info@walden.co.jp Phone +81 3 3553 3769 PUNCH INDUSTRY (6165) Consolidated Fiscal Year Operating Recurring Profit Attributable to
Flash Report for the Fiscal Year ended December 31, 2013 [Japan GAAP] (on a consolidated basis)
![Flash Report for the Fiscal Year ended December 31, 2013 [Japan GAAP] (on a consolidated basis)](/thumbs/91/106826542.jpg "Flash Report for the Fiscal Year ended December 31, 2013 [Japan GAAP] (on a consolidated basis)") Flash Report for the Fiscal Year ended December 31, [Japan GAAP] (on a consolidated basis) January 31, 2014 Company Name: OPT, Inc. Stock exchange listing: Tokyo Stock Code: 2389 URL http://www.opt.ne.jp/
Flash Report for the Fiscal Year ended December 31, [Japan GAAP] (on a consolidated basis) January 31, 2014 Company Name: OPT, Inc. Stock exchange listing: Tokyo Stock Code: 2389 URL http://www.opt.ne.jp/
Consolidated Financial Results First Two Quarters of the Fiscal Year ending March 2017 (April 1, 2016 to September 30, 2016)
") Consolidated Financial Results First Two Quarters of the Fiscal Year ending March 2017 (April 1, 2016 to September 30, 2016) Listed Company Name: Rinnai Corporation Listings: First sections of the Tokyo
Consolidated Financial Results First Two Quarters of the Fiscal Year ending March 2017 (April 1, 2016 to September 30, 2016) Listed Company Name: Rinnai Corporation Listings: First sections of the Tokyo
Non-consolidated Financial Report for Year Ending March 31, 2006
 May 17, 2006 Non-consolidated Financial Report for Year Ending March 31, 2006 Listed company name: Ariake Japan Co., Ltd. Code No.: 2815 Listing Exchanges: Tokyo, 1st Section, Head office: 3-2-17 Ebisu-Minami,
Financial Results for the Nine Months Ended December 31, 2012
 February 14, 2013 Financial Results for the Nine Months Ended December 31, 2012 Nippon Life Insurance Company (the Company or the Parent Company ; President: Yoshinobu Tsutsui) announces financial results
Consolidated Financial Results for the Fiscal Year Ended March 31, 2018 [Japanese GAAP]
![Consolidated Financial Results for the Fiscal Year Ended March 31, 2018 [Japanese GAAP]](/thumbs/87/97109926.jpg "Consolidated Financial Results for the Fiscal Year Ended March 31, 2018 [Japanese GAAP]") This is an abridged translation of the original document in Japanese and is intended for reference purposes only. In the event of any discrepancy between this translated document and the Japanese original,
This is an abridged translation of the original document in Japanese and is intended for reference purposes only. In the event of any discrepancy between this translated document and the Japanese original,
CMIC HOLDINGS Co., Ltd. Consolidated Financial Results
 (Note) This translation is prepared and provided for readers' convenience only. In the event of any discrepancy between this translated document and the original Japanese document, the original document
Kurita Water Industries Reports Earnings for the Fiscal Year Ended March 2008
 FOR IMMEDIATE RELEASE Kurita Water Industries Reports Earnings for the Fiscal Year Ended March 2008 Tokyo, Japan, April 30, 2008 Kurita Water Industries Ltd. (TSE Security Code 6370) announced net sales
Summary of Consolidated Financial Results For the Fiscal Year Ended September 30, 2015 Based on Japanese GAAP
 Note: Please note that this document is a Japanese-English translation of the summary of the official announcement in Japanese Kessan Tanshin for reference purposes only. Summary of Consolidated Financial
11-Year Consolidated Financial Highlights
 11-Year Consolidated Financial Highlights As of March 31, 2017 2007.3 2008.3 2009.3 2010.3 Net Sales ( million) 1,376,958 1,487,496 1,660,162 1,415,718 Operating Profit ( million) 162,315 70,048 65,204
CMIC HOLDINGS Co., Ltd. Consolidated Financial Results
 (Note) This translation is prepared and provided for readers' convenience only. In the event of any discrepancy between this translated document and the original Japanese document, the original document
OMRON CORPORATION FINANCIAL FACT BOOK 2018
 OMRON CORPORATION FINANCIAL FACT BOOK 218 CONTENTS Page Sales Data Net Sales P.1 Foreign Exchange Rates Sales by Business Segment P.2 Sales by Region P.3 Profit Data Gross Profit, Gross Profit / Net Sales
Consolidated Settlement of Accounts for the Nine Months Ended December 31, 2009
 The figures for these Financial Statements are prepared in accordance with the accounting principles based on Japanese law. Accordingly, they do not necessarily match the figures in the Annual Report issued
Code number : 7202 :
 Consolidated Financial Results (Japan GAAP) (April 1, 2014 through March 31, 2015) English Translation of the Original Japanese-Language Document May 12, 2015 Company name : ISUZU MOTORS LIMITED Stock
Consolidated Financial Statements - Summary (For the fiscal year ended March 31, 2008) May 16, 2008
 May 16, 2008") Consolidated Financial Statements - Summary (For the fiscal year ended March 31, 2008) May 16, 2008 The following statements are an English-language translation of the original Japanese-language document.
Consolidated Financial Statements - Summary (For the fiscal year ended March 31, 2008) May 16, 2008 The following statements are an English-language translation of the original Japanese-language document.
Financial Results for FY2010 (April 1, 2009 through March 31, 2010) English Translation of the Original Japanese-Language Document May 11, 2010
 English Translation of the Original Japanese-Language Document May 11, 2010") Financial Results for (April 1, 2009 through March 31, 2010) English Translation of the Original Japanese-Language Document May 11, 2010 Company name : ISUZU MOTORS LIMITED Stock exchange on which the
Financial Results for (April 1, 2009 through March 31, 2010) English Translation of the Original Japanese-Language Document May 11, 2010 Company name : ISUZU MOTORS LIMITED Stock exchange on which the
Consolidated Business Results For the Fiscal Year Ending March 31, 2012 Bando Chemical Industries, Ltd.
 Consolidated Business Results For the Fiscal Year Ending March 31, 2012 Bando Chemical Industries, Ltd. Financial Summary Fiscal Year Ending March 31, 2012 (1)Settlement of Accounts The production rates
Financial Results for the Fiscal Year Ended February 28, 2017
 Financial Results for the Fiscal Year Ended February 28, 2017 Ippei Nakayama, President and CEO April 12, 2017 2017 Aeon Delight All Rights Reserved Contents 2017 Aeon Delight All Rights Reserved 1 1 Financial
JFE Holdings Financial Results for Fiscal Year 2016 ended March 31, 2017
 JFE Holdings Financial Results for Fiscal Year 2016 ended March 31, 2017 All financial information has been prepared in accordance with generally accepted accounting principles in Japan. (Note: The following
Consolidated Financial Results for the Fiscal Year Ended February 28, 2018 [Japanese GAAP]
![Consolidated Financial Results for the Fiscal Year Ended February 28, 2018 [Japanese GAAP]](/thumbs/95/123620634.jpg "Consolidated Financial Results for the Fiscal Year Ended February 28, 2018 [Japanese GAAP]") Consolidated Financial Results for the Fiscal Year Ended February 28, 2018 [Japanese GAAP] April 6, 2018 Company name: MARUZEN CO.,LTD. Stock exchange listing: Tokyo Stock Exchange Code number: 5982 URL:
Consolidated Financial Results for the Fiscal Year Ended February 28, 2018 [Japanese GAAP] April 6, 2018 Company name: MARUZEN CO.,LTD. Stock exchange listing: Tokyo Stock Exchange Code number: 5982 URL:
:
 Financial Results for (April 1, 2008 through March 31, 2009) English Translation of the Original Japanese-Language Document May 11, 2009 Company name : ISUZU MOTORS LIMITED Stock exchange on which the
Consolidated Financial Results for the 2nd Quarter of Fiscal Year Ending March 31, 2019 (J-GAAP)
") Consolidated Financial Results for the 2nd Quarter of Fiscal Year Ending March 31, 2019 (J-GAAP) November 5, 2018 Company name: T.RAD Co., Ltd. Listing: Tokyo Stock Exchange, First Section Code No.: 7236
Consolidated Financial Results for the 2nd Quarter of Fiscal Year Ending March 31, 2019 (J-GAAP) November 5, 2018 Company name: T.RAD Co., Ltd. Listing: Tokyo Stock Exchange, First Section Code No.: 7236
Highlights of Consolidated Results for the First Half and the Second Quarter of Fiscal Year ending March 31, 2016
 Highlights of Consolidated Results for the First Half and the Second Quarter of Fiscal Year ending March 31, 2016 (except for per share amounts) November 2, Six months ended Six months ended September
Summary of Consolidated Financial Results for the Fiscal Year Ended March 31, 2017 <Under Japanese GAAP>
 Summary of Consolidated Financial Results for the Fiscal Year Ended March 31, 2017 May 15, 2017 Company name: Japan Post Holdings Co., Ltd. Stock exchange listing: Tokyo Stock Exchange
Consolidated Financial Results for the Fiscal Year Ended March 31, 2012 (Japan GAAP)
") Consolidated Financial Results for the Fiscal Year Ended March 31, 2012 (Japan GAAP) May 14, 2012 Company name: SQUARE ENIX HOLDINGS CO., LTD. Shares traded: Tokyo Stock Exchange, First Section Company
Consolidated Financial Results for the Fiscal Year Ended March 31, 2012 (Japan GAAP) May 14, 2012 Company name: SQUARE ENIX HOLDINGS CO., LTD. Shares traded: Tokyo Stock Exchange, First Section Company
Report of Earnings and Financial Statements for the Six Months Ended September 30, 2017 (Consolidated) (Prepared pursuant to Japanese GAAP)
 (Prepared pursuant to Japanese GAAP)") Listed company s name: Report of Earnings and Financial Statements for the Six Months Ended September 30, 2017 (Consolidated) (Prepared pursuant to Japanese GAAP) Kawasaki Heavy Industries, Ltd. Listed
Listed company s name: Report of Earnings and Financial Statements for the Six Months Ended September 30, 2017 (Consolidated) (Prepared pursuant to Japanese GAAP) Kawasaki Heavy Industries, Ltd. Listed
Consolidated Financial Results for the First Quarter Ended June 30, 2008
 For Immediate Release August 5, 2008 Consolidated Financial Results for the First Quarter Ended June 30, 2008 1. Performance for the First Quarter Ended Jun. 30, 2008 (from Apr. 1, 2008 to Jun. 30, 2008)
Net sales Operating profit Ordinary profit Profit
 Summary of Non-consolidated Financial Results for the Fiscal Year Ended March 31, 2018 [Japanese GAAP] May 1, 2018 Company name: CONEXIO Corporation Stock exchange listing: Tokyo Stock Exchange, First
Highlights of Consolidated Results for Fiscal Year ended March 31, 2016
 May 9, 2016 Highlights of Consolidated Results for Fiscal Year ended March 31, 2016 (except for per share amounts) Year ended Year ended March 31, March 31, 2016 2015 Change Y 745,888 Y 707,237 5.5 Operating
Company Name: Shimano Inc. Stock Exchange: Tokyo, First Section Code Number: 7309 URL:
 This document has been translated from the Japanese original for reference purposes only. In the event of any discrepancy between this translated document and the Japanese original, the original shall
JFE Holdings Financial Results for Fiscal Year 2017 ended March 31, 2018
 JFE Holdings Financial Results for Fiscal Year 2017 ended March 31, 2018 All financial information has been prepared in accordance with generally accepted accounting principles in Japan. (Note: The following
Consolidated Financial Results for the Fiscal Year Ended December 31, 2018 [Japanese GAAP]
![Consolidated Financial Results for the Fiscal Year Ended December 31, 2018 [Japanese GAAP]](/thumbs/95/123620498.jpg "Consolidated Financial Results for the Fiscal Year Ended December 31, 2018 [Japanese GAAP]") Consolidated Financial Results for the Fiscal Year Ended December 31, 2018 [Japanese GAAP] Company name: Nissha Co., Ltd. Stock exchange listing: Tokyo Stock Exchange Code number: 7915 URL: https://www.nissha.com/english
Consolidated Financial Results for the Fiscal Year Ended December 31, 2018 [Japanese GAAP] Company name: Nissha Co., Ltd. Stock exchange listing: Tokyo Stock Exchange Code number: 7915 URL: https://www.nissha.com/english
OMRON CORPORATION FINANCIAL FACT BOOK 2017
 OMRON CORPORATION FINANCIAL FACT BOOK 217 CONTENTS Page Sales Data Net Sales P.1 Foreign Exchange Rates Sales by Business Segment P.2 Sales by Region P.3 Profit Data Gross Profit, Gross Profit / Net Sales
Kurita Water Industries Reports Earnings for the Nine Months ended December 31, 2010
 FOR IMMEDIATE RELEASE Kurita Water Industries Reports Earnings for the Nine Months ended December 31, 2010 Tokyo, Japan, January 31, 2011 Kurita Water Industries Ltd. (TSE Securities Code 6370) announced
Presentation Materials
 Azbil Corporation RIC: 6845.T, Sedol: 6985543 Presentation Materials For the First Quarter of the Fiscal Year Ending March 31, 2018 (Based on Japanese GAAP) Human-centered Automation 1. Financial
Consolidated Financial Results for the Fiscal Year Ended March 31, 2017 [Japanese GAAP]
![Consolidated Financial Results for the Fiscal Year Ended March 31, 2017 [Japanese GAAP]](/thumbs/95/125130905.jpg "Consolidated Financial Results for the Fiscal Year Ended March 31, 2017 [Japanese GAAP]") Consolidated Financial Results for the Fiscal Year Ended March 31, 2017 [Japanese GAAP] Company name: TOA Corporation Stock exchange listing: Tokyo Stock Exchange Code number: 6809 URL: http://www.toa.co.jp/
Consolidated Financial Results for the Fiscal Year Ended March 31, 2017 [Japanese GAAP] Company name: TOA Corporation Stock exchange listing: Tokyo Stock Exchange Code number: 6809 URL: http://www.toa.co.jp/
CONSOLIDATED EARNINGS REPORT FOR FISCAL [Japanese GAAP]
![CONSOLIDATED EARNINGS REPORT FOR FISCAL [Japanese GAAP]](/thumbs/93/112714861.jpg "CONSOLIDATED EARNINGS REPORT FOR FISCAL [Japanese GAAP]") Member of the Financial Accounting Standards Foundation Disclaimer: This is a Japanese-English translation of the summary of financial statements of the Company produced for your convenience. Since no
Member of the Financial Accounting Standards Foundation Disclaimer: This is a Japanese-English translation of the summary of financial statements of the Company produced for your convenience. Since no
Consolidated Financial Results for the 1st Quarter of the Fiscal Year Ended March 31, 2019 [Japanese Standard]
![Consolidated Financial Results for the 1st Quarter of the Fiscal Year Ended March 31, 2019 [Japanese Standard]](/thumbs/90/102461211.jpg "Consolidated Financial Results for the 1st Quarter of the Fiscal Year Ended March 31, 2019 [Japanese Standard]") (For reference purposes only) 1 2 3 4 5 6 7 8 9 10 11 12 13 14 15 16 17 18 19 20 21 22 23 24 25 26 27 28 29 30 31 32 33 34 35 36 37 38 39 40 41 August 10, 2018 Stock exchange: Tokyo (First Section) Listed
(For reference purposes only) 1 2 3 4 5 6 7 8 9 10 11 12 13 14 15 16 17 18 19 20 21 22 23 24 25 26 27 28 29 30 31 32 33 34 35 36 37 38 39 40 41 August 10, 2018 Stock exchange: Tokyo (First Section) Listed
Consolidated Financial Results For the Third Quarter of the Fiscal Year Ending March 31, 2018 (For the First Nine Months Ended December 31, 2017)
") Consolidated Financial Results For the Third Quarter of the Fiscal Year Ending March 31, 2018 (For the First Nine Months Ended December 31, 2017) Prepared in Conformity with Generally Accepted Accounting
Consolidated Financial Results For the Third Quarter of the Fiscal Year Ending March 31, 2018 (For the First Nine Months Ended December 31, 2017) Prepared in Conformity with Generally Accepted Accounting
Consolidated Financial Results for the Fiscal Year Ended March 31, 2018 [Japanese GAAP]
![Consolidated Financial Results for the Fiscal Year Ended March 31, 2018 [Japanese GAAP]](/thumbs/81/82607102.jpg "Consolidated Financial Results for the Fiscal Year Ended March 31, 2018 [Japanese GAAP]") Consolidated Financial Results for the Fiscal Year Ended March 31, 2018 [Japanese GAAP] Company name: Shibaura Electronics Co., Ltd. Stock exchange listing: Tokyo Stock Exchange Code number: 6957 URL:
Consolidated Financial Results for the Fiscal Year Ended March 31, 2018 [Japanese GAAP] Company name: Shibaura Electronics Co., Ltd. Stock exchange listing: Tokyo Stock Exchange Code number: 6957 URL:
Summary of Financial Results for the Fiscal Year Ended March 31, 2018 [Japan GAAP] (Non-Consolidated)
![Summary of Financial Results for the Fiscal Year Ended March 31, 2018 [Japan GAAP] (Non-Consolidated)](/thumbs/92/110301098.jpg "Summary of Financial Results for the Fiscal Year Ended March 31, 2018 [Japan GAAP] (Non-Consolidated)") Summary of Financial Results [Japan GAAP] (Non-Consolidated) Listed internet infinity INC. Company: Code Number 6545 URL: http://iif.jp May 15, 2018 Stock Exchange Listing: Tokyo Stock Exchange Representative:
Summary of Financial Results [Japan GAAP] (Non-Consolidated) Listed internet infinity INC. Company: Code Number 6545 URL: http://iif.jp May 15, 2018 Stock Exchange Listing: Tokyo Stock Exchange Representative:
OKADA AIYON (6294) Growth by Maturity
 Growth by Maturity") URL: www.walden.co.jp Written by Yoshiyuki Muroya / Yusuke Maeda E-mail: info@walden.co.jp Phone +81 3 3553 3769 OKADA AIYON (6294) Consolidated Fiscal Year Operating Recurring Profit Attributable to EPS
URL: www.walden.co.jp Written by Yoshiyuki Muroya / Yusuke Maeda E-mail: info@walden.co.jp Phone +81 3 3553 3769 OKADA AIYON (6294) Consolidated Fiscal Year Operating Recurring Profit Attributable to EPS
Net sales Operating income Ordinary income. Diluted net income per share
 Consolidated Financial Results for the Fiscal Year Ended March 31, 2018 (Japanese GAAP) April 27, 2018 Company name Foster Electric Company, Limited Tokyo Stock Exchange Code Number 6794 URL http://www.foster-electric.com/
Summary of Consolidated Financial Results for the Year Ended March 31, 2016 (Based on Japanese GAAP)
") Translation Notice: This document is an excerpt translation of the original Japanese document and is only for reference purposes. In the event of any discrepancy between this translated document and the
Translation Notice: This document is an excerpt translation of the original Japanese document and is only for reference purposes. In the event of any discrepancy between this translated document and the
Consolidated Financial Results for the 1st Quarter of the Fiscal Year Ending March 31, 2009
 NIHON KOHDEN CORPORATION (6849) August 6, 2008 Consolidated Financial Results for the 1st Quarter of the Fiscal Year Ending March 31, 2009 Stock Exchange Listing: Head Office: Representative: Contact:
1. Financial Highlights 1 2. Consolidated Balance Sheets 2 3. Consolidated Statements of Income and
 June 14, 2012 CONTENTS Page 1. Financial Highlights 1 2. Consolidated Balance Sheets 2 3. Consolidated Statements of Income and Consolidated Statements of Comprehensive Income 4 4. Consolidated Statements
Fiscal 2015 Supplementary Information May 10, 2016
 Fiscal 2015 Supplementary Information May 10, 2016 * Forward-looking statements made in this document, such as business forecasts, are based on the information available at this time and on certain premises
Financial Results for the Second Quarter of the Fiscal Year Ending March 31, 2014 [Japanese GAAP] (Consolidated)
![Financial Results for the Second Quarter of the Fiscal Year Ending March 31, 2014 [Japanese GAAP] (Consolidated)](/thumbs/93/111330278.jpg "Financial Results for the Second Quarter of the Fiscal Year Ending March 31, 2014 [Japanese GAAP] (Consolidated)") Financial Results for the Second Quarter of the Fiscal Year Ending March 31, 2014 [Japanese GAAP] (Consolidated) October 29, 2013 Name of Listed Company: Hino Motors, Ltd. Stock Listing: Tokyo and Nagoya
Financial Results for the Second Quarter of the Fiscal Year Ending March 31, 2014 [Japanese GAAP] (Consolidated) October 29, 2013 Name of Listed Company: Hino Motors, Ltd. Stock Listing: Tokyo and Nagoya
Asahi Group Holdings, Ltd.
 Asahi Group Holdings, Ltd. FY2014 Financial Results NOTE: All information has been prepared in accordance with generally accepted accounting principles in Japan. Amounts shown in this accounting report
Summary of Financial Results for the Year Ended March 2018 [Japanese Standards] (Consolidated)
![Summary of Financial Results for the Year Ended March 2018 [Japanese Standards] (Consolidated)](/thumbs/95/126498549.jpg "Summary of Financial Results for the Year Ended March 2018 [Japanese Standards] (Consolidated)") Summary of Financial Results for the Year Ended March 2018 [Japanese Standards] (Consolidated) MAY 11, 2018 Listed Company Name: Aoyama Trading Co., Ltd. Listed Exchange: Tokyo Stock Exchange Code: 8219
Summary of Financial Results for the Year Ended March 2018 [Japanese Standards] (Consolidated) MAY 11, 2018 Listed Company Name: Aoyama Trading Co., Ltd. Listed Exchange: Tokyo Stock Exchange Code: 8219
(Amounts rounded down to the nearest million yen) (1) Operating Results (Percentage figures represent year-on-year changes)
 (1) Operating Results (Percentage figures represent year-on-year changes)") Financial Results for the Three Months Ended June 30, 2017 [Japanese Accounting Standards] (Consolidated) (Unaudited) August 2, 2017 NTN Corporation Security Code: 6472 Listings: Tokyo Stock Exchanges
Financial Results for the Three Months Ended June 30, 2017 [Japanese Accounting Standards] (Consolidated) (Unaudited) August 2, 2017 NTN Corporation Security Code: 6472 Listings: Tokyo Stock Exchanges
Asahi Group Holdings, Ltd.
 Asahi Group Holdings, Ltd. FY2015 Financial Results NOTE: All information has been prepared in accordance with generally accepted accounting principles in Japan. Amounts shown in this accounting report
Sumitomo Heavy Industries, Ltd.
 Sumitomo Heavy Industries, Ltd. CONSOLIDATED FINANCIAL REPORT For the ended March 31, 2008 All financial information has been prepared in accordance with generally accepted accounting principles in Japan.
FY2018 Consolidated Financial and Operating Results <IFRS> (Overview English translation of the Japanese original) April 26, 2018
 April 26, 2018") FY2018 Consolidated Financial and Operating Results (Overview English translation of the Japanese original) April 26, 2018 Company Name: SANYO DENKI CO., LTD. Code Number: 6516 (Listed on the First
FY2018 Consolidated Financial and Operating Results (Overview English translation of the Japanese original) April 26, 2018 Company Name: SANYO DENKI CO., LTD. Code Number: 6516 (Listed on the First
Kureha Corporation Reports Interim Results April September 2015
 Kureha Corporation Reports Interim Results April September 2015 Tokyo, Japan, November 2015 Kureha Corporation ( Kureha ), a leading global supplier of specialty chemicals and plastics, has reported earnings
Bando Chemical Industries, Ltd.
 Consolidated Business Results for the First Half of Fiscal 2011 November 4, 2011 Bando Chemical Industries, Ltd. 0 First Half Financial Summary for the Fiscal Year Ending March 31, 2012 1 (1)Settlement
Financial Results for the Year Ended March 31, 2018 [Japanese GAAP] (Consolidated)
![Financial Results for the Year Ended March 31, 2018 [Japanese GAAP] (Consolidated)](/thumbs/83/87456160.jpg "Financial Results for the Year Ended March 31, 2018 [Japanese GAAP] (Consolidated)") Financial Results for the Year Ended March 31, 2018 [Japanese GAAP] (Consolidated) May 11, 2018 Company name: Tatsuta Electric Wire & Cable Co., Ltd. Stock exchange listing: Tokyo Stock Exchange Stock
Financial Results for the Year Ended March 31, 2018 [Japanese GAAP] (Consolidated) May 11, 2018 Company name: Tatsuta Electric Wire & Cable Co., Ltd. Stock exchange listing: Tokyo Stock Exchange Stock
Summary of Consolidated Financial Results For the Fiscal Year Ended February 28, 2015 [Japan GAAP]
![Summary of Consolidated Financial Results For the Fiscal Year Ended February 28, 2015 [Japan GAAP]](/thumbs/86/94871992.jpg "Summary of Consolidated Financial Results For the Fiscal Year Ended February 28, 2015 [Japan GAAP]") April 10, 2015 Summary of Consolidated Financial Results For the Fiscal Year Ended February 28, 2015 [Japan GAAP] Name of Company: Takeuchi Mfg. Co., Ltd. Stock Code: 6432 Stock Exchange Listing: Tokyo
April 10, 2015 Summary of Consolidated Financial Results For the Fiscal Year Ended February 28, 2015 [Japan GAAP] Name of Company: Takeuchi Mfg. Co., Ltd. Stock Code: 6432 Stock Exchange Listing: Tokyo
I. Performance in the First Quarter of the Fiscal Year Ending March 31, 2017 (April 1 June 30, 2016; amounts less than one million yen are omitted)
") Consolidated Financial Results First Quarter of the Fiscal Year Ending March 2017 (April 1 June 30, 2016) August 4, 2016 Listed Company Name: Rinnai Corporation Listings: First Sections of Tokyo and Nagoya
Consolidated Financial Results First Quarter of the Fiscal Year Ending March 2017 (April 1 June 30, 2016) August 4, 2016 Listed Company Name: Rinnai Corporation Listings: First Sections of Tokyo and Nagoya
Consolidated Financial Results [Japanese GAAP] for the Fiscal Year Ended March 31, 2018 (April 1, March 31, 2018)
![Consolidated Financial Results [Japanese GAAP] for the Fiscal Year Ended March 31, 2018 (April 1, March 31, 2018)](/thumbs/85/92736043.jpg "Consolidated Financial Results [Japanese GAAP] for the Fiscal Year Ended March 31, 2018 (April 1, March 31, 2018)") Consolidated Financial Results [Japanese GAAP] for the (April 1, 2017 - March 31, 2018) May 11, 2018 Company name: Kansai Paint Co., Ltd. Stock listing: Tokyo Stock Exchange Code number: URL: 4613 http://www.kansai.co.jp/
Consolidated Financial Results [Japanese GAAP] for the (April 1, 2017 - March 31, 2018) May 11, 2018 Company name: Kansai Paint Co., Ltd. Stock listing: Tokyo Stock Exchange Code number: URL: 4613 http://www.kansai.co.jp/
Summary of Consolidated Financial Results For the Fiscal Year Ended March 2012 [Japan GAAP]
![Summary of Consolidated Financial Results For the Fiscal Year Ended March 2012 [Japan GAAP]](/thumbs/95/123620560.jpg "Summary of Consolidated Financial Results For the Fiscal Year Ended March 2012 [Japan GAAP]") Summary of Consolidated Financial Results For the Fiscal Year Ended March 2012 [Japan GAAP] April 20, 2012 Name of Company: SPK CORPORATION Stock Code: 7466 Stock Exchange Listing: Tokyo Stock Exchange,
Summary of Consolidated Financial Results For the Fiscal Year Ended March 2012 [Japan GAAP] April 20, 2012 Name of Company: SPK CORPORATION Stock Code: 7466 Stock Exchange Listing: Tokyo Stock Exchange,
NIHON KOHDEN CORPORATION (6849)
") These documents have been translated from Japanese originals for reference purposes only. In the event of any discrepancy between these translated documents and the Japanese originals, the originals shall
These documents have been translated from Japanese originals for reference purposes only. In the event of any discrepancy between these translated documents and the Japanese originals, the originals shall
Financial Announcement for 2nd Quarter of the Year Ending March 2019 [Japan standard] (Consolidated)
![Financial Announcement for 2nd Quarter of the Year Ending March 2019 [Japan standard] (Consolidated)](/thumbs/93/113036035.jpg "Financial Announcement for 2nd Quarter of the Year Ending March 2019 [Japan standard] (Consolidated)") Financial Announcement for 2nd Quarter of the Year Ending March 2019 [Japan standard] (Consolidated) November 2, 2018 Company name TOLI Corporation Stock Exchanges: Tokyo Stock Exchange Code number 7971
Financial Announcement for 2nd Quarter of the Year Ending March 2019 [Japan standard] (Consolidated) November 2, 2018 Company name TOLI Corporation Stock Exchanges: Tokyo Stock Exchange Code number 7971
Makita Corporation. Consolidated Financial Results for the nine months ended December 31, 2017 (U.S. GAAP Financial Information)
") Makita Corporation Consolidated Financial Results for the nine months ended December 31, (U.S. GAAP Financial Information) (English translation of "KESSAN TANSHIN" originally issued in Japanese) CONSOLIDATED
Makita Corporation Consolidated Financial Results for the nine months ended December 31, (U.S. GAAP Financial Information) (English translation of "KESSAN TANSHIN" originally issued in Japanese) CONSOLIDATED
Consolidated Financial Results for the Fiscal Year Ended December 31, 2015 (January 1, 2015 to December 31, 2015)
") Consolidated Financial Results for the Fiscal Year Ended December 31, 2015 (January 1, 2015 to December 31, 2015) February 12, 2016 Company name: SIIX Corporation Stock code: 7613 Stock exchange listing
Consolidated Financial Results for the Fiscal Year Ended December 31, 2015 (January 1, 2015 to December 31, 2015) February 12, 2016 Company name: SIIX Corporation Stock code: 7613 Stock exchange listing
Resona Holdings, Inc. Consolidated Financial Results for Fiscal Year 2016 (April 1, March 31, 2017/ Unaudited) <under Japanese GAAP>
 <under Japanese GAAP>") May 12, 2017 Resona Holdings, Inc. Consolidated Financial Results for Fiscal Year 2016 (April 1, 2016 - March 31, 2017/ Unaudited) Code number: 8308 Stock exchange listings: Tokyo
May 12, 2017 Resona Holdings, Inc. Consolidated Financial Results for Fiscal Year 2016 (April 1, 2016 - March 31, 2017/ Unaudited) Code number: 8308 Stock exchange listings: Tokyo
Operating Results and Financial Position (for the fiscal year ended March 31, 2011)
") SHIMADZU CORPORATION IR Group Corporate Strategy Planning Department 1 Nishinokyo-Kuwabaracho, Nakagyo-ku Kyoto 604-8511 Japan http://www.shimadzu.com/ Tel: +81 75-823-1128 May 10, 2011 Operating Results
SHIMADZU CORPORATION IR Group Corporate Strategy Planning Department 1 Nishinokyo-Kuwabaracho, Nakagyo-ku Kyoto 604-8511 Japan http://www.shimadzu.com/ Tel: +81 75-823-1128 May 10, 2011 Operating Results
Financial Report 2015 Japan Aviation Electronics Industry, Limited and consolidated subsidiaries Years ended March 31
 Financial Report Japan Aviation Electronics Industry, Limited and consolidated subsidiaries Financial Outlook While US economy continued its stable growth driven by improvement in employment, consumer
(3) Consolidated Cash flow Position Cash flows from Operating activities Cash flows from investing activities Cash flows from Financing activities Cas
 Consolidated Cash flow Position Cash flows from Operating activities Cash flows from investing activities Cash flows from Financing activities Cas") Note; This document is a partial translation of "Kessan Tanshin" for the Fiscal Year Ended December 31, 2017 and is provided solely for reference purposes. In the event of any inconsistency between the
Note; This document is a partial translation of "Kessan Tanshin" for the Fiscal Year Ended December 31, 2017 and is provided solely for reference purposes. In the event of any inconsistency between the
Financial Highlights for the Fiscal Year ended March 31, 2012
 (Note) This document has been translated from the Japanese original for reference purposes only. In the event of any discrepancy between this translation and the Japanese original, the original shall prevail.
Consolidated Quarterly Financial Results (Japanese Accounting Standards) for the First Three Quarters of the Fiscal Year Ending March 31, 2013
 for the First Three Quarters of the Fiscal Year Ending March 31, 2013") Consolidated Quarterly Financial Results (Japanese Accounting Standards) for the First Three Quarters of the Fiscal Year Ending March 31, 2013 February 12, 2013 Name of Listed Company: TOYO INK SC HOLDINGS
Consolidated Quarterly Financial Results (Japanese Accounting Standards) for the First Three Quarters of the Fiscal Year Ending March 31, 2013 February 12, 2013 Name of Listed Company: TOYO INK SC HOLDINGS
FANCL Corporation. Non-consolidated Financial Statements for the Interim Period of the Fiscal Year Ending March 31, 2007
 FANCL Corporation Non-consolidated Financial Statements for the Interim Period of the Fiscal Year Ending March 31, 2007 This document has been translated from the original Japanese as a guide for non-japanese
Code number : 7202 :
 FY2013 First Quarter Consolidated Financial Results (Japan GAAP) (April 1, 2012 through June 30, 2012) English Translation of the Original Japanese-Language Document August 3, 2012 Company name : ISUZU
SURUGA bank, Ltd. Consolidated Financial Results for Fiscal Year 2015, ended March 31, 2016 <under Japanese GAAP>
 Consolidated Financial Results for Fiscal Year 2015, ended March 31, 2016 Stock exchange listing: Tokyo (code: 8358) URL: http://www.surugabank.co.jp Representative: President Mitsuyoshi
Summary of Kobe Steel's Consolidated Financial Results For First Half of Fiscal 2007 (April 1, 2007 September 30, 2007)
") Kobe Steel, Ltd. Tokyo, Japan Tokyo Stock Exchange No. 5406 October 30, 2007 Summary of Kobe Steel's Consolidated Financial Results For of Fiscal 2007 (April 1, 2007 September 30, 2007) TOKYO, October
Kobe Steel, Ltd. Tokyo, Japan Tokyo Stock Exchange No. 5406 October 30, 2007 Summary of Kobe Steel's Consolidated Financial Results For of Fiscal 2007 (April 1, 2007 September 30, 2007) TOKYO, October
Consolidated Financial Report for the Fiscal Year ended March 31, 2018 <Japanese GAAP>
 NIPPON THOMPSON CO., LTD. Corporate Headquarters: Tokyo Listed Code: 6480 Listed Stock Exchange: Tokyo (URL: http://www.ikont.co.jp/eg/) May 14, Consolidated Financial Report for the Fiscal Year ended
Million yen 14,872 13,119. Net income E.P.S. Diluted E.P.S. Million yen. Yen. Yen 10, ,
 Consolidated Financial Statements Summary February 6, 2007 (For FY 2007 3rd Quarter ended December 31, 2006) English translation from the original Japaneselanguage document (All financial information has
Consolidated Settlement of Accounts for the First Half of the Fiscal Year Ending December 31, 2018 [Japanese Standards]
![Consolidated Settlement of Accounts for the First Half of the Fiscal Year Ending December 31, 2018 [Japanese Standards]](/thumbs/87/97238154.jpg "Consolidated Settlement of Accounts for the First Half of the Fiscal Year Ending December 31, 2018 [Japanese Standards]") Shiseido Company, Limited (4911) Consolidated Settlement of Accounts for the First Half of the Fiscal Year Ending December 31, 2018 The figures for these financial statements are prepared in accordance
Shiseido Company, Limited (4911) Consolidated Settlement of Accounts for the First Half of the Fiscal Year Ending December 31, 2018 The figures for these financial statements are prepared in accordance
Net sales Operating income Ordinary income
 Financial Results for the Fiscal Year Ended March 31, 2016 [Japanese GAAP] (Consolidated) English translation from the original Japanese-language document April 27, 2016 Name of Listed Company: Hino Motors,
(Millions of yen/%) Net Income (% change) Two-quarter total at September Operating Income (% change)
 Net Income (% change) Two-quarter total at September Operating Income (% change)") Consolidated Financial Results First Two Quarters of the Fiscal Year ending March 2015 (April 1, 2014 to September 30, 2014) November 5, 2014 Listed Company Name: Rinnai Corporation Listings: First sections
Consolidated Financial Results First Two Quarters of the Fiscal Year ending March 2015 (April 1, 2014 to September 30, 2014) November 5, 2014 Listed Company Name: Rinnai Corporation Listings: First sections
Heian Ceremony Service Reports Earnings for the First Six Months Ended September 2007
 FOR IMMEDIATE RELEASE Heian Ceremony Service Reports Earnings for the First Six Months Ended September 2007 Kanagawa, Japan November 9, 2007 Heian Ceremony Service Co., Ltd. (JASDAQ Security Code 2344)
Analyst Meeting Materials
 Azbil Corporation RIC: 6845.T, Sedol: 6985543 Analyst Meeting Materials For the First Quarter of the Fiscal Year Ending March 31, 2016 (Based on Japanese GAAP) Human-centered Automation 1. Financial
2,033.8 Billions of yen Billions of cigarettes Billions of cigarettes Billions of yen 8.7 % 20.3 % 33, yen up 32.
 Financial Highlights Japan Tobacco Inc. and Consolidated Subsidiaries / Fiscal year ended March 31, 2012 Business Scale JT Group Sales Volume Japanese Domestic Tobacco Business 108.4 Billions of cigarettes