Senate Finance Subcommittee on Rising Medical Costs. Interim Report. January, 2003
|
|
|
- Ariel Briggs
- 6 years ago
- Views:
Transcription

1 Senate Finance Subcommittee on Rising Medical Costs Interim Report January, 2003
2
3
4 Texas Senate Committee on Finance Interim Subcommittee on Rising Medical Costs Interim Report Table of Contents Introduction Medicaid Medicaid Cost Management Options Children s Health Insurance Program Children s Health Insurance Program Cost Management Options State Employee Health Care Employees Retirement System Uniform Group Insurance Program University of Texas Employees Group Insurance Plan Texas A&M Employees Group Insurance Plan State Employee Cost Management Options Teacher Retirement System - TRS-CARE Teacher Retirement System - TRS-ACTIVE CARE Teacher Retirement System Cost Management Options Texas Department of Criminal Justice Correctional Managed Health Care Texas Department of Criminal Justice Correctional Managed Health Care Cost Management Options Selected Health Care Stakeholders Testimony Attachments
5 Senate Finance Subcommittee on Rising Medical Costs, January 2003 Introduction The Senate Finance Subcommittee on Rising Medical Costs operated under the direction of the following charge issued by Lieutenant Governor Bill Ratliff: Study the issue of rising medical costs and its impact on the state budget, including health and human services, correctional managed health care, education and state employee benefits. The Subcommittee may review private pay insurance. The Subcommittee s reportshouldrecommend ways to control cost increases and identify best practices and opportunities for savings. The subcommittee held three hearings. The first two focused on state agencies whose budgets are affected significantly by rising health care costs. The final hearing sought comment from private sector stakeholders. In each of theses hearings, the subcommittee asked the agencies to provide a funding chart and lists of top medical procedures and pharmaceuticals. These documents were intended to supply a similar method of comparing expenditures and cost drivers. This information can be found as Attachments D-J. Rising health care costs are a significant issue for most states, the federal government, private industry, and individual citizens. Twenty-four states report that Medicaid and other health care expenditures are over budget through the early months of FY 2003, according to the National Conference of State Legislatures. All state agencies reviewed by this subcommittee are requesting additional funding for the upcoming biennium to address deficits and rising costs. State spending on health care programs in Texas has been increasing steadily for the past several years. Since 1998, state expenditures on health care have increased from $10.9 billion annually to $16.8 billion, a 53.2 percent increase. This represents an infusion of close to $6 billion new dollars for health care in Texas in just four years. This trend of increased funding is projected to continue for the foreseeable future. Thirty-six percent of the state s growth in spending was related to increases in medical costs and prescription drug spending, according to the Legislative Budget Board. The remaining 64 percent was attributable to increases in participation levels or people served. To control these escalating costs, all state health plans have implemented various cost management techniques. These initiatives include formulary restrictions, utilization reviews, cost sharing, and administrative adjustments. Some have worked better than others. Despite these efforts, exponential growth in rising health care expenditures has merely slowed. 1
6 Senate Finance Subcommittee on Rising Medical Costs, January 2003 As the state s population continues to grow and as new medical technologies emerge, it will be an ongoing challenge to manage the state s health care costs. However, without workable solutions the viability of many state programs is at risk. There is no question the growth in health care-related costs will be a focus during the 78 th legislative session because this growth contributes significantly to projected budget shortfalls. However, each of these health care programs enjoys the support of strong and influential constituencies. It is likely that any initiatives designed to substantially control growth or costs in these programs will be subject to stiff political opposition. Further, court challenges to prevent or delay implementation of any reductions may be expected. The key challenge for the 78 th Legislature will be to find general and political consensus. This report provides a variety of options that address each of the health care cost drivers. These options were provided to the subcommittee and are presented only as possible solutions. The committee takes no position as to the viability or feasibility of these suggestions. The 78th Legislature will face a challenging session with budget shortfalls and growing needs. It is the hope of the subcommittee that these suggestions will provide framework and guidance for the difficult choices ahead. 2
7 Senate Finance Subcommittee on Rising Medical Costs, January 2003 Medicaid Background Medicaid is a federal/state program that pays health care expenses for low income people who meet certain eligibility guidelines. Each state has a unique Medicaid program with minimum coverage levels for certain populations and income levels established by federal regulations. The states are allowed to expand their individual Medicaid programs as they are able to fund. Texas, a state considered conservative with expansion programs, spends approximately 70 percent ($22.7 billion to maintain current services for ) of its Medicaid appropriation from general revenue to meet minimum federal mandates. The Texas Medicaid program covers acute care services such as physician and medical professional services, inpatient and outpatient hospital services, lab and x-ray services, and pharmaceuticals. Approximately 62 percent of the recipients are under the age of 21. (See Exhibit 1.1) Exhibit 1.1 *Estimates for FY are based on SB 1 Medicaid Appropriations for Texas Department of Health and Health and Human Services Commission --only 11 months of premiums are appropriated for FY 2003). 3
8 State Method of Finance Senate Finance Subcommittee on Rising Medical Costs, January 2003 Funding for Medicaid has grown in recent years, from $4.5 billion in 1994 to $8.1 billion in 2003 in All Funds. Moreover, in 2001, the 77 th Legislature made an emergency appropriation of $489.9 million in General Revenue to cover Medicaid funding shortfalls due to caseload growth and increases in the cost of services and prescription drugs. The Health and Human Services Commission (HHSC) projects the 78 th Legislature will face requirements for an additional $417.3 million General Revenue in supplemental appropriations, once again to cover a funding shortfall anticipated for the biennium. Federal Method of Finance - Federal Medical Assistance Percentage (FMAP) The Medicaid program is a state/federal partnership. Almost 60 percent of the Texas Medicaid program is funded through federal Medicaid assistance. The federal share is not static, but is derived annually from a formula based on each state s average per capita income compared to the nation s average per capita income for the three most recent calendar years. This formula is called the Federal Medical Assistance Percentage (FMAP). The formula for computing the FMAP is shown in Exhibit 1.2. FMAP = 1 - (.45 * (X² / Y²)), where: X = 3 year (most recent calendar years) average of Texas per capita income, and Y = 3 year (most recent calender years) average of US per capita income, both as provided by the Bureau of Economic Analysis. Exhibit 1.2 The FMAP is designed to provide a 55 percent matching share to states with average per capita personal income. However, the minimum FMAP is 50 percent and the matching rate for U.S. territories is statutorily set at 50 percent. The maximum FMAP is 83 percent, but no state has exceeded 80 percent since the 1960s. 1 In recent years, the Texas FMAP percentage has declined from percent in 2000 to percent in 2003 because Texas average income has increased relative to the nation s average income. (See Exhibit 1.3) However, for 2004, the Texas FMAP will rise from percent to percent. Nationally, 27 states will receive an increase in the FMAP percentage in FY Federal Funds Information for States, Issues Brief Final FY 2004 FMAPs, September 24,
9 Senate Finance Subcommittee on Rising Medical Costs, January 2003 and 11 will experience declines. 2 A possible reason for the significant number of states receiving increases may be attributable to total national income growing only 3.3 percent in calendar year 2001, the slowest annual growth rate since In the current biennium, , the Texas FMAP ranked 26th and 27th, respectively, among all of the states and territories. In 2004 Texas will rank 26th. The Texas FMAP funding level ranking is notable given that Texas is ranked 10th in the percentage of people living under the federal poverty level among all the states. 3 The poverty level is a key factor since it is the primary eligibility requirement for Medicaid. However, poverty level is not a factor in determining the FMAP. As the FMAP changes, Texas experiences changes in its level of funding for Medicaid. HHSC estimates for FY a full 1 percent change in the FMAP would roughly entail a $150 to $160 million change in general revenue requirements for Texas. Over the last two biennia, the FMAP changes for the second year of the biennium have required an estimated $113.4 million in additional general revenue funds ($81.9 million for , and $31.5 million for ). Exhibit Id. 3 Based on U.S. Census Bureau Report, March Current Population Survey (2002) 5
10 Joint Medicaid Working Group Senate Finance Subcommittee on Rising Medical Costs, January 2003 Cost Containment Initiatives During the 77 th Legislative Session, Senate Finance and House Appropriations committees created a Joint Medicaid Working Group to address the rising costs of the Medicaid program. From that work, HHSC was directed to find $205 million in general revenue savings from the Texas Medicaid program. These initiatives, laid out in Senate Bill 1, Rider 33, included administrative reorganization and streamlining; competitive pricing for certain services; creating co-payments; aggressive utilization review; and a variety of federal waivers. The changes must be implemented by the end of FY Some of these initiatives were abandoned and substituted with savings located in other areas of the Medicaid budget. To date, only $5 million in savings have been realized with $136.9 million projected savings for the remainder of the biennium. However, HHSC reports that, with additional savings found outside Rider 33 initiatives, (including Medicaid administrative contract revisions, hospital cost savings and improvements in drug benefit management), the total projected savings are claimed by HHSC to be $216.6 million for (See attached summary of cost savings initiatives, Attachment A.) To address the rising cost of prescription drugs, HHSC has implemented $60.1 million worth of cost containment measures in the Vendor Drug Program. (See Exhibit 1.4) 6
11 Senate Finance Subcommittee on Rising Medical Costs, January 2003 Medicaid Pharmaceutical Savings Initiatives Initiative FY Move to Best Price Structure for Drug Pricing in Medicaid Reimbursement formula change due to statewide audit $15.9 million Establish Sliding-Scale Co-payments Increase Utilization Review Activities through PGMs or in-house Edits added to DUR 4 claim rejections for Drug Interaction, High Dosage, Therapy Duplications Maximum Daily Dose Limits Maximum Monthly Dose and Gender and Age Limits Increase early refill edit from 50% to 75% Review recipients on multiple medications Audit-related Reduction in Drug Prices effective May and July 2001 New MAC 5 related to Federal Upper Limit price changes effective Jan New MACs related to drugs going off patent protection New May 02 MACs not included above New MACs with narrow therapeutic classes Rebated for drugs dispensed in physician s offices Physician education and utilization management TOTAL MEDICAID PHARMACEUTICAL SAVINGS $2.3 million $0.6 million $2.8 million $0.7 million $1.2 million $0.0 million $5.3 million $11.0 million $1.6 million $16.4 million $0.5 million $0.5 million $0.2 million $6.4 million $36.6 million $60.1 million Exhibit DUR - Drug Utilization Review 5 MAC - Maximum Allowable Cost 7
12 Senate Finance Subcommittee on Rising Medical Costs, January 2003 Cost Drivers The most significant cost drivers in the Texas Medicaid program, as identified by HHSC, are increased cost due to caseload growth and inflation and expanded utilization of the pharmacy benefit program. Additionally, the unique challenges and costs of the dually eligible (Medicaid and Medicare eligible) population contribute to the growth of the Medicaid budget, mostly through pharmacy benefits. Entitlement Program Medicaid is an entitlement program. As a condition for receiving the federal match (FMAP), Texas is obligated to provided minimum mandated services to any individual who qualifies at the federal minimum and requests services. The Texas Medicaid program is more or less a minimum benefit program, that does not consist of numerous expansion populations and services. Therefore, the state is hindered in its flexibility to manage program costs. States with large optional populations and services are better able to address their Medicaid budget crises by managing expansion populations and services. However, Texas does not have this flexibility simply because there are few optional populations or services where budget cuts could potentially occur. Assuming the cost saving measures in Senate Bill 1 during the 77 th Legislature are implemented, options for further administrative savings in Texas will be more challenging. Texas Medicaid covers children, single parents, pregnant women and poor/low-income elderly or disabled individuals. Of those populations, only pregnant women, long term care and the medically needy are optional populations to which Texas has expanded coverage beyond the federal minimum. The federal/state funding allocation for these programs is set forth in Exhibit
13 Senate Finance Subcommittee on Rising Medical Costs, January 2003 Exhibit 1.5 Caseload Growth As of November 2002, the average monthly enrollment in the Texas Medicaid program was 2,376,193. The average monthly caseload has increased since FY 2000 and is projected to continue to increase during the biennium. During this time of recent growth, caseload numbers have surpassed the level appropriated for FY Forecast updates now project caseload growth for to surpass budgeted levels by 227,645 clients for a total cost of $417.3 million that will be requested in a supplemental appropriation. In FYs , legislative appropriations were insufficient to fund caseload growth for Medicaid. Supplemental appropriations were required in each session to cover this forecasting shortfall. The actual caseload growth for those years surpassed both the requested and appropriated levels. However, in response to projected growth, the legislative appropriation actually exceeded the agency s requested amount for caseload growth during Nevertheless, caseload has grown even larger than the appropriated level of growth. 6 The average number of Medicaid recipients for the final year of is expected to require a supplemental appropriation of $417.3 million. 6 See Selected HHS Caseloads Compared to Appropriated Caseloads, FY agency document. Attachment B. 9
14 Senate Finance Subcommittee on Rising Medical Costs, January 2003 The average monthly caseload is expected to reach 2.8 million participants in FY (See Exhibit 1.6) This is an increase of 18.4 percent from FY In the appropriations request for , HHSC is requesting $1.54 billion to address this projected caseload growth. Exhibit 1.6 According to the Kaiser Commission on Medicaid and the Uninsured, the national rate of growth for the total number of individuals enrolled in state Medicaid programs doubled from 4.9 percent in 2000 to 9.8 percent in All 50 states and the District of Columbia experienced caseload growth in Medicaid programs ranging from a low of 0.2 percent in Oregon to a high of 28.5 percent in Arizona. Texas growth was 8.2 percent. Forecasting Medicaid caseload has proven frustrating for both HHSC and the Legislature. 8 Medicaid caseloads are projected using time-series models. These forecasts for both caseload and program costs are produced for each individual population group included in the program. HHSC provides 7 Kaiser Commission on Medicaid and the Uninsured, Medicaid Enrollment in 50 States, December 2001 Data Update. 8 For a detailed examination of the forecasting methodologies for HHSC programs, please see the Senate Finance Subcommittee Report on Health and Human Services Demand, November 2002, by Senator Judith Zaffirini. 10
15 Senate Finance Subcommittee on Rising Medical Costs, January 2003 raw data for client enrollment and cost data is provided from reports of claims paid by National Heritage Insurance Company (NHIC) and paid pharmacy claims from the Medicaid Vendor Drug Program (VDP). HHSC applies various factors and time-series models to determine which model performs more accurately. Adjustments are made monthly and re-run quarterly to adjust for any changes. Texas biennial legislative schedule provides unique challenges in accurately forecasting caseload growth appropriations. The time-series models used by HHSC are more statistically reliable for 6 to 18 months. Therefore, any unpredictable factor, such as an economic downturn that may impact poverty level, can skew caseloads from the time-series forecasts. To address the reliability of Medicaid forecasting, HHSC has implemented checks and balance systems to ensure the most accurate forecasts possible. HHSC contracts with an outside consultant for additional input regarding forecasts and methodology. Also, NHIC produces independent forecasts for Medicaid. Finally, HHSC provides caseload, expenditure data and forecasts to the LBB and the Governor s Office for further review and input. Legislative Expansions Recent legislative action has also impacted actual and projected caseload growth. Senate Bill 43, enacted in the 77 th Legislature, simplified the eligibility process and guarantees a six-month continuous coverage for children, effective as of Feb. 1, Another provision of Senate Bill 43, effective June 1, 2003, provides 12 month continuous eligibility for children. The impact of Senate Bill 43 on enrollment are included in the current HHSC caseload projections for The 12-month continuous eligibility represents $400 million of the funding request for the Medicaid program. HHSC projects this would impact 194,000 clients in FY 2004 and 204,000 clients in FY 2005 Other legislative measures that have affected caseload growth include Senate Bill 532, 77th Legislature, to expand Medicaid coverage for women diagnosed with breast and cervical cancer 9 and Senate Bill 51, 77th Legislature, to offer Medicaid coverage for certain foster adolescents who have aged out of the Medicaid children eligibility categories. HHSC identified $1.1 million in state funding from administrative savings to use for implementation of Senate Bill 532. Senate Bill 51 was estimated to cost $822,000. However, that cost estimate was based on the state serving 849 clients - to date they have only served 700 which could reduce the expenditures. Other factors affecting caseload growth included an extended outreach effort by the state associated with enrollment outreach for the CHIP program and federally mandated outreach programs for Medicaid. When CHIP was implemented in 2000, an extensive outreach campaign was waged to 9 The Breast and Cervical Cancer Program is located at the Texas Department of Health and the federal portion is funded by the federal Centers for Disease Control. 11
16 Senate Finance Subcommittee on Rising Medical Costs, January 2003 enroll eligible children in the program. In fact, in FY , Texas succeeded in enrolling more children in CHIP faster than any other state in the country. Often, when parents apply for CHIP, they learn that they are ineligible because they meet the federal poverty level requirements for the Medicaid program. Pharmaceutical Benefit Cost Increases In Texas, the Medicaid pharmaceutical program is administered by the Vendor Drug Program (VDP), which was implemented in The VDP operates under federal guidelines. The Medicaid reimbursements must be sufficient to provide access to the same extent as it is available to the general public, and provider fees must be reasonable. Payments to pharmacies for ingredient costs must be the state s best price estimate of pharmacies acquisition costs for the drugs dispensed. 10 The federal Omnibus Budget Reconciliation Act of 1990 (OBRA 90) requires that states offer an open formulary in exchange for Medicaid pharmaceutical rebates. 11 The Center for Medicaid and Medicare (CMS) determines the rebate amounts; states apply the national rebate amounts to use rates and perform the rebate billing and collection function. Texas Medicaid rebate collections for this biennium are $125.4 million for FY 2002 and $140.5 million for FY Pharmaceutical price inflation and increased utilization have impacted all health care costs across the nation. The federal government estimates that prescription drug prices will increase an average of 12.6 percent per year over the next 10 years. If that projection is accurate, the Texas Medicaid Vendor Drug Program s biennial expenditures will grow from $3.36 billion in FY to roughly $7.6 billion in FY In addition to inflation, the VDP is paying for growing levels of utilization. Providers are prescribing more drugs. The Vendor Drug Program will pay for 6.4 million more prescriptions, a 18.8 percent increase, from FY 2003 to FY The projected annual total for FY 2005 is million prescriptions. (See Exhibit 1.7) As of August 2001, the VDP costs are projected to be $780 million (GR) greater than FY appropriation levels. 10 Best Price generally means the lowest price available from drug manufacturers to wholesalers or retain pharmacy providers, HMOs or other entities within a retail class of trade. 11 Open Formulary in the context of the VDP, broadly describes the availability of various prescription drugs covered by the program for Medicaid clients. In the VDP substantially every product of a drug manufacturer that signs a rebate agreement and participates in the Medicaid drug rebate program is covered, as required by federal law. 12
17 Senate Finance Subcommittee on Rising Medical Costs, January 2003 Exhibit 1.7 Much of the increase in the VDP has been attributed to increased utilization, newer and more expensive products, and price increases for existing products. (See Exhibit 1.8) Exhibit
18 Senate Finance Subcommittee on Rising Medical Costs, January 2003 Dual Eligibles To reduce the state Medicaid expenditures, the state pays Part A and Part B Medicare premiums for various eligible individuals. Beneficiaries then receive services covered by Medicare. State expenditures are impacted by caseload size (for the premium) and by the amount of the Medicare premium determined (increased) by the federal government. Approximately 63 percent of FY cost increase projected for this Medicaid strategy is due to increases in Medicare premiums. The remaining 37 percent is attributable to caseload growth. The agency estimates FY cost to be $1.1 billion, All Funds, and $417.9 million, General Revenue. A key factor impacting this program s state funding levels is the lack of a pharmaceutical benefit in the federal Medicare program. Texas pays for all the drug costs for these individuals. These costs could be alleviated if the federal government created and funded a pharmaceutical program for all Medicare patients. 14
19 Senate Finance Subcommittee on Rising Medical Costs, January 2003 Funding Needs for Biennium Summary For , the Health and Human Services Commission is requesting $2,647.2 million over levels to fund Medicaid caseload growth and increased cost. Of that total number, $417.3 million is in the agency s base bill as a supplement to the biennium shortfall and $1,538.5 million addresses caseload growth. Additionally, the program will need $691.4 million to fund the caseload growth at the current level of service. (See Exhibit 1.9) Additional General Revenue Requested to Maintain Medicaid Current Services in FY over Levels (Dollars in Millions) Base FY Supplemental Funding $ FY Caseload Growth 1,538.5 $ 1,955.8 Exceptional Items FY Program Cost Increase $ Total Requested for FY $2,647.2 (as of August 2002) Greater than Exhibit
20 Senate Finance Subcommittee on Rising Medical Costs, January 2003 Medicaid Cost Management Options Through the process of taking testimony and examining issues relating to rising medical costs, a number of cost management concepts emerged or were presented. Below, is a summary of some of the options suggested. The committee takes no position as to the viabilityor feasibilityof thesesuggestions. FMAP As the FMAP rate is set today, federal funding is skewed away from states such as Texas because the formula values average income rather than poverty levels. Like many other large states, Texas has areas of enormous wealth that offer a misleading picture that overshadows the reality of the pockets of our poor families Our average income is somewhat lower than the national average, but our ratio of poverty is significantly higher. The federal Medicaid guidelines dictate that states accept clients based on a family s federal poverty level. Therefore, the method of financing based on income doesn t give an accurate depiction of how many people will actually apply and qualify for Medicaid. Federal aid to state Medicaid programs should be based on a state s poverty level - the actual factor used for qualifying for the program - not its wealth. With such a change, Texas FMAP would increase by 10 percent. (see Attachment C) The state should consider working with its Congressional delegation to push a change in the FMAP formula. Enhanced FMAP Border Zone The most current definition of the border set by the Texas legislature includes a 43-county area. The Texas/Mexico border region has experienced a 25 percent increase in population. This dramatic population increase gave rise to a number of health concerns. Border residents along the entire U.S. border suffer from diseases such as diabetes, Tuberculosis, hepatitis and cancer at higher levels than other parts of the United States, yet this region does not have an adequate health infrastructure. Residents on both sides of the border are also exposed to a number of health hazards, including poor water quality, pesticides, contamination of fish and air pollution. A shortage of nurses, doctors and other health practitioners compound the problems faced by border communities in attempting to serve the large number of uninsured, under-insured and undocumented persons. Further, the Texas border includes some of the poorest counties in the nation. Estimates of the population living below poverty for Texas counties in 1999 include figures as high as 50.9 percent for Starr County and 41.8 percent for Zavala County. The state average for that year was 15.4 percent. In addition, medical providers along the Texas/Mexico border serve a disproportionate number of Medicaid clients while being reimbursed at the same rates as providers in the rest of the state. 16
21 Senate Finance Subcommittee on Rising Medical Costs, January 2003 Because Medicaid is such a large portion of their caseload, they are unable to offset the costs of Medicaid patients with other higher paying, non-medicaid patients. Enhancing the FMAP for Medicaid in the border areas to reflect the region s average per capita income would improve access to services by increasing the supply of services through increased reimbursements to providers in those areas. This targeted enhancement would offset the effects of the FMAP loss on a statewide level. Medicaid Simplification The final portion of Senate Bill 43 goes into effect June 2003 with 12 month continuous eligibility for children. The cost associated with this implementation is estimated to be $400 million dollars. Advocates for Medicaid simplification assert that allowing children to be continuously enrolled saves money in the Medicaid program in the end because the recipients receive continuous health care rather than sporadic, and sometimes emergent, health care. Depending on the Legislature s ability to assess where the greater savings are found, the following are options: Eliminate the 12-month continuous eligibility phase of the legislation Delay the final 12 month continuous eligibility phase of the legislation until the state is better able to fund the changes. Proceed with Senate Bill 43, as written, anticipating future savings from continuous eligibility for children. Vendor Drug Program Restricted Pharmaceutical Formulary A number of states have received approval from Health and Human Services Secretary Tommy Thompson to create a restricted formulary for their pharmaceutical program. These programs allow the states to establish a restricted formulary that sets preferences or implements prior authorization levels for pharmaceutical companies that agree to rebates or assistance programs for the state. Creating the ability to more effectively contract with pharmaceutical companies has the potential to provide some measure of controlling the escalation of prescription drug costs. Currently, Pharmaceutical Research and Manufacturers of America (PhRMA) has a lawsuit pending against the federal and state governments approval of such initiatives. Competitive Hospital Contracting in Urban Areas In urban areas where greater options may exist for hospital services, competitive bidding for a single Medicaid hospital designation would allow the state greater negotiating power with hospitals health care costs. 17
22 Senate Finance Subcommittee on Rising Medical Costs, January 2003 Limit Services to Optional Populations Adjusting the state plan s optional population and services could significantly reduce expenditures. Disease Management Encourage HHSC to investigate possible disease management programs for Medicaid. Diabetes Cardiovascular Asthma Potentially partner with pharmaceutical companies to pool information, resources and low income assistance programs. 18
23 Senate Finance Subcommittee on Rising Medical Costs, January 2003 CHIP Background The Children s Health Insurance Program (CHIP) provides health insurance for children younger than 19 whose household income does not exceed 200 percent of the poverty level and who are ineligible for Medicaid. CHIP is an insurance program in which the state contracts with various health plans to provide services in return for a premium. The program is financed by a federal grant, state appropriations and premiums paid by the policyholder families. CHIP enrollees receive health care and dental care from participating health plans, medical groups and dentists. The Federal Balanced Budget Act dedicated nearly $50 billion over 10 years to CHIP. In July 1998, Texas implemented Phase I of its CHIP program. CHIP Phase I provided Medicaid to children aged 15 to 18 in households whose income is under 100 percent of the Federal Poverty Level (FPL). The federal government had already mandated the phase-in of coverage for these children, but Texas had not yet completed its phase-in when CHIP was created. Phase I of CHIP existed from July 1998 through September Average monthly enrollment in Federal Fiscal Year (FFY) 1998 was 17,500 and in FFY 1999 was 34,800. In FFY 2000, monthly average enrollment was 25,300 and dropped to 13,900 in FFY Monthly enrollment for CHIP Phase I in FFY 2002 is expected to be less than 5,000. Implementing legislation for Phase II of CHIP 12 was passed during the 76th Legislature. However, Texas did not begin enrolling children until May Development of the Texas program was delayed because federal authorization for CHIP came in 1997 after the Texas Legislature had adjourned. Since Texas began enrolling children in May 2000, total funding (state and federal) has increased from $78.3 million to $806.5 million in As of November 2002, CHIP enrollment had reached 503,748 children. (See Exhibit 2.1) Exhibit CHIP Phase II is the program described in the first paragraph of this section. 19
24 Senate Finance Subcommittee on Rising Medical Costs, January 2003 Federal Method of Finance - Enhanced Federal Medical Assistance Percentage (FMAP) Similar to Medicaid, CHIP is a federal/state cost share program. However, the rate of the federal contribution is significantly greater for CHIP than Medicaid. The federal share of the CHIP program is based on the Enhanced FMAP formula. 13 Under the Enhanced FMAP formula, the federal share of funding is increased by reducing the state s contribution by 30 percent of its FMAP state share Enhanced FMAP Example: (39.78 *.30) = Enhanced FMAP rate for the state with percent being Texas 2004 FMAP share Enhanced FMAP levels in Texas: Federal Fiscal Year Enhanced CHIP FMAP Medicaid FMAP % 62.28% % 62.45% % 61.36% % 60.57% % 60.17% % 59.99% % 60.22% As would be the case in Medicaid, any change in the FMAP will result in increases or decreases in the level of federal funding that impact the state s CHIP contribution levels. (See Exhibit 2.2) State Method of Finance The method of finance for the state appropriation is a combination of general revenue and general revenue dedicated tobacco receipts. Texas received an initial lump payment from the tobacco settlement that was distributed to counties and the state. Since that time, the state receives annual payments pursuant to the lawsuit agreement. Those funds are deposited each December into the General Revenue Fund and given an identifying number for tracking purposes. Texas annual tobacco settlement payment is $580 million, subject to adjustments. 15 As written in the CHIP enabling legislation, CHIP has first draw on all tobacco monies, subject to the appropriations process. 13 The FMAP is figured annually based on each state s average income compared to the nation s average income for the three most recent calendar years. Refer to Medicaid portion of this report for further information. 14 Federal Funds Information for States, Issue Brief Final FY 2004, FMAPs, September 24, Adjustments are made, pursuant to the settlement agreement, based on tobacco sales, volume and inflation. 20
25
26 Senate Finance Subcommittee on Rising Medical Costs, January 2003 Federal Fund Lapse As of October 2002, Texas faced the possibility of lapsing approximately $285 million in unspent federal CHIP funds. This lapse is due primarily to Texas inability to implement and rollout the program until May Federal CHIP allocations are appropriated in 10 year cycles (FFY FFY 2007). Then any one year s allocation is available to the state for a total of three federal fiscal years. 16 The Texas CHIP program was created in 1997 and funding began in Because Texas has a biennial legislature, timing became a factor in prompt spending of federally appropriated funds. Texas received its largest allocation of federal funding in 1998, and smaller allocations in subsequent years. This funding scheme goes contrary to the reality of the program. States were given large appropriations at the outset when there was little enrollment. Then the funding decreased over time as the program matured and enrollment grew, therefore, more funding was needed. This current funding loss is reflective of Texas unspent funds from the year The front-loading of federal funds made it difficult for Texas and most other states to spend its first three years of allocations. Almost 40 states had funds left over from the 1998 and 1999 allocations, and a similar number may face the same problem as Texas with their fiscal year 2000 funding. This potential lapse does not affect current services under the CHIP program. However, it could be felt in the out years, FFY 2006 and 2007 (the end of the current ten year allocation period), if caseload growth and program costs continue to escalate. HHSC estimates the FY 2000 funds will be the final funds the state will be not able to spend during stipulated years. Historically, Texas has lapsed funds as follows: Allocation Year Federal Funds Spent Federal Funds Lapsed 1998 $310 million $170 million 1999 $234 million $324 million The law dictating the period of time states had to spend a year s allocation was amended to allow 1998 funds to be available for two more years and 1999 funds for one more year. Action from the federal government extending the time in which states can spend 2000 funds has not occurred. However, President Bush has asked Congress to allow states to keep all funding from 1998 and 1999 until Also, Senators John D. Rockefeller (D-W.Va) and Lincoln Chafee (R-RI) have proposed legislation to send lapsed funds to states that have been more successful in spending the CHIP funds. 16 Available meant that (for a state with unexpended funds) only a portion of the unexpended funds for those years was available. The rest was redistributed to states that had spent all of their allocations. 22
27 Senate Finance Subcommittee on Rising Medical Costs, January 2003 Cost Containment Initiatives Similar to Medicaid, CHIP was also the subject of the joint Senate/House Article 2 Working Group during the 77 th Legislative Session. Several cost containment features were discussed and implemented as a result of solutions developed in that process. Two initiatives were implemented: the Vendor Drug Program carve out; and increase of co-payment amounts. Vendor Drug Program Carve Out Beginning in March 2002, HHSC carved out the CHIP prescription benefit from each of the CHIP health plans. Now all pharmaceutical needs of the CHIP program are served through the Medicaid Vendor Drug Program (VDP) 17, combining the CHIP pharmaceutical program with the VDP. Combining the VDP increased purchasing power and bargaining position of the state because HHSC is in a better position than individual plans to negotiate prices with the pharmaceutical companies. Prior to the change, CHIP clients were subject to common pharmaceutical cost containment strategies, such as restricted formularies and prior authorization, that may have been implemented by the individual plans. Now, CHIP clients only pay a co-payment for pharmaceuticals purchased through the VDP. Based on data projections for 2002, it appears this change reduced per member per month drug costs from $14.49 to $ HHSC estimates a total biennial savings to the state to be approximately $4.14 million. Another benefit of combining the CHIP pharmaceutical benefit program with the VDP was the ability of HHSC to negotiate Medicaid level rebates with pharmaceutical companies for CHIP drugs purchased through the VDP. CHIP drug manufacturer rebates were negotiated with the understanding that CHIP would have the same open formulary used by Medicaid. 18 In exchange, manufacturers would provide rebates to the CHIP program at the rate of 21 percent. The estimated rebate revenue for FY 2002 is $110,000 and for FY 2003 is $4,344,079. Currently, these rebates are deposited into the General Revenue Fund. HHSC does not have authority to roll them back into the program to offset costs. HHSC would need authority from the Legislature or the Governor s Office and the Legislative Budget Board to harness the rebates. 17 HHSC adjusted the plans reimbursement rates to account for the removal of the costs associated with the drug benefit. 18 In the context of the Medicaid Vendor Drug Program, open formulary describes the availability of various prescription drugs covered by the program for Medicaid clients. In the Vendor Drug Program, substantially every product of a drug manufacturer that signs a rebate agreement and participates in the Medicaid drug rebate program is covered and available to clients, as required by federal law. 23
28 Senate Finance Subcommittee on Rising Medical Costs, January 2003 CHIP Co-Payments CHIP program has implemented a co-payment schedule to encourage appropriate utilization. In March 2002, the CHIP co-payment schedule for emergency room visits and prescription drugs was increased and deductibles were replaced with an inpatient hospital admission co-pay. (See Exhibit 2.3) CHIP co-payment schedule Federal Poverty Level Office Visit Co-pay Below 100% 101% - 150% 151% - 185% 186% - 200% $0 $2 $5 $10 Emergency Room Visit Generic Prescription Brand Name Prescription $3 $5 $50 $50 $0 $0 $5 $5 $3 $5 $20 $20 Facility Co-Pay $0 $25 per inpatient hospital admission $50 per inpatient hospital admission $100 per inpatient hospital admission Annual Enrollment Fee $0 $15 $15 (first month s premium) $18 (first month s premium) Monthly Family Premium $0 $0 $15 $18 Annual Cost Sharing Caps $100 per family $100 per family 5% of annual income 5% of annual income Exhibit
29 Senate Finance Subcommittee on Rising Medical Costs, January 2003 Cost Drivers CHIP is a relatively new program with evolving processes and adjustments, and reliable data regarding cost drivers is still developing. Similar to most health care systems in the nation, CHIP costs are typically driven by enrollment growth, increase in the cost of services, and rising prescription drugs costs due to inflation and utilization. Despite declines in the rate of enrollment growth and savings achieved in carving out the pharmaceutical benefit, premium rates have continued to increase. Premium Rates Under the CHIP program, changes in program costs due to utilization, provider rates and general inflation are reflected in the premium rate. The premium rate is based upon actuarial projections and costs for each member of the plan and is similar to the premium paid for group health insurance. The initial premium rating period covered the period beginning May 1, 2000, through September 30, Because CHIP was a new program with no historical data, premiums for the first year of operation were determined based on target rates developed largely on Medicaid fee-for-service experience, and data from the Texas Uniform Group Insurance Program and other commercial plans. According to the health plans, the premium rates developed for the first year were insufficient to cover losses experienced by the plans. During the second year, Oct. 1, 2001, through Sept. 30, 2002, rates were negotiated with each individual health plan based on actual experience of the plan. For appropriations for the biennium, HHSC is assuming a 6 percent annual increase for benefit costs, including utilization and inflation. In order to maintain current services for the level of anticipated caseload growth and projected increase in benefit costs, HHSC is requesting $62.9 million in GR over levels. (See Exhibit 2.4) Exhibit
30 Senate Finance Subcommittee on Rising Medical Costs, January 2003 Caseload Growth Texas began the biennium enrolling more children in CHIP faster than any other state in the country. As of November 2002, CHIP enrollment had reached 503,748 children. (See Exhibit 2.5) HHSC estimates it will need a supplemental appropriation of $31.4 million, two-thirds of the total CHIP deficit, to address caseload growth for However, it appears that caseload growth rates are leveling off, which should provide some relief in budget pressures for the future. In forecasting budget requests for the biennium, HHSC has assumed a 1 percent per year rate of caseload growth. At this level of growth, funding increases over the last biennium attributed to caseload growth will total $6.5 million (out of $62.9 million request). Exhibit
31 Senate Finance Subcommittee on Rising Medical Costs, January 2003 Pharmaceutical Benefit With an estimated cost increase of 17 percent per year, prescription drugs act as a crucial component in the rise of health care services costs for CHIP. While under the health plans, the increases in drug costs were a combination of increased utilization and increased cost per member. However, with the recent move of the pharmaceutical benefit to the Vendor Drug Program (VDP), data is not available to accurately identify which of those two components is the more significant cost driver. HHSC testified the costs of pharmaceuticals will continue to increase due to inflation, but the agency will have a greater ability to control many costs now that the pharmaceutical benefit is under the VDP rather than the CHIP health plans. HHSC has utilized a series of administrative interventions to control the costs of pharmaceuticals. They have implemented a pharmacy management system, enhanced surveillance of potential fraud and abuse, clinical guidelines for improved efficiency, and increased drug utilization review. It is the hope of HHSC that the benefits of carving out the pharmaceutical drugs, in addition to the CHIP rebates, will help minimize the affects of drug cost increases on the program. This program change has been in place since March 2002, and more time will be needed to see the true impact on CHIP costs. 27
32 Senate Finance Subcommittee on Rising Medical Costs, January 2003 Funding Needs for Biennium Summary The Health and Human Services Commission is requesting $94.3 million over levels to fund CHIP caseload growth and increased cost. Of that total number, $31.4 million is in the agency s base bill to supplement the biennium shortfall and $62.9 million as an exceptional item request to address cost and caseload growth for (See Exhibit 2.6) Additional General Revenue Requested to Maintain CHIP Current Services in FY over Levels Base FY Supplemental Funding $31.4 million Exceptional Items FY Program Cost & Caseload Increase $62.9 million Total Requested for FY $ 94.3 million (as of August 2002) greater than Exhibit
33 Senate Finance Subcommittee on Rising Medical Costs, January 2003 CHIP Cost Management Options Through the process of taking testimony and examining issues relating to rising medical costs, a number of cost management concepts emerged or were presented. Below, is a summary of some of the options suggested. The committee takes no position as to the viabilityor feasibilityof these suggestions. Pharmaceutical Drugs Give the HHSC the authority to spend the CHIP rebate funds on the CHIP program that are currently being placing into the General Revenue Fund. The creation of a restricted formulary or three tiered co-payment structure for prescription drugs could establish some cost containment for prescription drug use in CHIP. Premium Rate Growth The HHSC should report to Senate Finance the savings individual health plans may have experienced with implementation of cost saving measures: removal of the pharmaceutical benefit and introduction of utilization control measures. The number of patients - or at least the cost levels of services - should have been reduced with a utilization controlling co-payment system. HHSC rate setting for CHIP plans should accurately reflect cost savings the state has provided for the plans. Caseload Growth As previously discussed, the stabilized CHIP caseload growth does not appear to continue to present a budgetary challenge. CHIP is a successful state program that is attaining its goal of providing low cost insurance to the children of Texas. The cost drivers that continue to impact this program are issues experienced by the entire system of health care. Therefore, the following options may not be best considered as first options, as caseload growth impact on the budget has lessened. However, the approaching legislative session may present itself with budgetary shortfalls and the following are possible options to curtail further growth in the program. Delayed Enrollment Health care services begin as soon as a child is approved for the program. Delaying enrollment one to two months from eligibility determination could aid in slowing caseload growth for the program. Limited Open Enrollment Periods At the present time, children can apply for CHIP at any time during the year. Similar to the state employee system, CHIP could move to an annual or semi-annual enrollment period. Certain qualifying events, such as losing Medicaid coverage, could serve as an exemptions. Cap Enrollment If funds are not available for the new growth in CHIP, the HHSC could cap enrollment with currently enrolled children and begin a waiting list. Reduce 12 months Continuous Eligibility Many children s family income status changes throughout the year. Increasing the number of opportunities for the state to assess income levels could slow caseload growth. 29
34 Senate Finance Subcommittee on Rising Medical Costs, January 2003 Benefit Reduction Elimination of the CHIP Dental Benefit CHIP provides a limited dental benefit with a $300 annual cap on therapeutic services. Eliminating or reducing this benefit could provide some cost savings. Reduce CHIP Benefit Package Under federal law, the CHIP benefit package must be the same as or the equivalent of one of three benefit packages: the federal employees standard Blue Cross/Blue Shield PPO plan; coverage offered and generally available to state employees in Texas; or coverage offered by the HMO in the state with the largest insured commercial, non-medicaid enrollment. Alternatively, the CHIP package can be one that is approved by the Secretary of Health and Human Services. Theoretically, the greatest room for adjustment in the current CHIP benefit package would be through an amendment to the state plan under this last option. The current CHIP package was determined to be actuarially equivalent to both the state employee plan and the largest insured commercial HMO in the state. To what extent the benefits in CHIP could be reduced without the state being out of compliance with the actuarial equivalency requirement in federal law is unclear. There are no standards for this option and it is unclear how much less comprehensive the package could be and still garner Secretarial approval. However, the Health and Human Services Commission could investigate the possible limits of benefit reduction that would not compromise our status as actuarially equivalent. 30
35 Senate Finance Subcommittee on Rising Medical Costs, January 2003 State Employee Health Care Employees Retirement System of Texas (ERS) Background The Texas Employees Uniform Group Insurance Program (UGIP) was established by the 64 th Legislature in 1975 to provide high quality health insurance and other optional coverage for state employees, retirees, and eligible dependents. Today, the program offers three major options of health coverage. Two self-funded programs are administered by Blue Cross/Blue Shield of Texas: HealthSelect, a self-funded, point-of-service, managed care health plan offers both in-network and out-of-network benefits; and HealthSelect Plus, a self-funded health maintenance organization. The third health care option is provided through contract with private health maintenance organizations who provide a variety of health-care alternatives. Levels of benefits and premiums for the two self-funded plans are set by the ERS board. Private HMOs must submit bids and/or applications meeting certain benefit and premium specifications set forth by the ERS board as well. HMOs are admitted to the program only if they bring a cost savings to the program. Premium costs for active state employees enrolled in any UGIP health plan are covered 100 percent from date of employment to the date of termination. In addition, fully vested retirees may enroll in UGIP health plans. For these participants, the state covers 100 percent of premium costs. Dependents of active employees and retirees are also eligible for enrollment in UGIP health plans. For these dependent participants, the state covers 50 percent of the premium costs. During the past 23 years, enrollment in the program has naturally increased as employees have retired and the state s population has grown. Along with that growth is the 1993 decision to include employees and staff at Texas colleges and universities. In addition, members of executive boards have also been added. Today, UGIP enrollment includes about 530,000 employees, retirees, and dependents. More than 57 percent of those participants are enrolled in HealthSelect; 31 percent use HealthSelect Plus; and 12 percent are enrolled in one of the participating private HMOs (see Exhibit 3.1). The UGIP health plans are primarily funded through a combination of state and employee contributions. For FY 2002, these two elements provided $1.38 billion in revenue with the state funding $1.1 billion (81 percent) of the total. While the state s proportional share of funding has remained relatively constant since 1998, the total dollars appropriated have increased dramatically. Since 1998, the state s contribution has jumped 60 percent, requiring an additional $419 million. Over that same time period, employee contributions have risen almost 50 percent, generating an additional $86.3 million. 31
36 Senate Finance Subcommittee on Rising Medical Costs, January 2003 Despite these dramatic increases in funding, expenditures have consistently outdistanced contributions. Since 1998, UGIP has had an average annual shortfall of $71.6 million. To offset this difference, the program has typically utilized investment income, hospital/formulary refunds, and subsidized from its reserve fund. Prior to 1998, funding sources were sufficient to cover funding requirements and accumulate a reserve. The UGIP reserve fund peaked at $249 million at the end of FY Since that time, general sources of revenue have been insufficient to cover costs and the reserve fund balance has dwindled. Requiring $50 million per year on average to balance expenditures, the reserve fund was expected to be depleted by the end of FY State law does require ERS to request the funding necessary to maintain a reserve adequate to pay 60 days of claims. As a result, ERS' current LAR requests $221.5 million for that purpose (see Exhibits 3.2, 3.3 and 3.4). To help control the costs driving much of this demand for addition revenue, ERS has implemented many cost containment initiatives, including prior authorization requirements; financial incentives for using network benefits; and utilization of a pharmacy benefit manager (see Exhibit 3.5). Even with these and other changes to benefits, UGIP health plans continue to be comparable with group insurance programs offered by cities, counties, and private industry around the state (see Exhibit 3.6). In addition to the cost containment initiatives, ERS (in conjunction with BlueCross/BlueShield) has instituted an aggressive claims payment review process. In FY 2002, $2.7 billion in payments were reviewed for ineligible charges, such as: duplicate claims non-covered services charges for which there was incomplete documentation charges incurred when coverage was not in effect charges incurred in facilities not under contract charges for services not medically necessary; and amounts in excess of benefit maximums Of the payments reviewed, 21 percent were identified as ineligible, which saved the program $582.5 million. All cost-saving initiatives employed by ERS, however have served only to slow the exponential growth in rising health care expenditures. Since 1998, UGIP health plan expenditures have increased 54 percent or $494 million even though enrollment has increased only six percent. 32
37 Senate Finance Subcommittee on Rising Medical Costs, January 2003 Cost Drivers There are several factors driving this increase in spending. Increased utilization has played a role. However, with enrollment in UGIP health plans growing only slightly each year (around 1 percent annually), many of the increases in this area relate to participants accessing their benefits more frequently. Since 1998, the number of non-prescription, health claims for each participant in HealthSelect has increased from 11.4 claims per participant to claims. This is an increase of 11 percent. By the end of FY 2005, the numbers are expected to increase by 12 percent, pushing claims up to annually for each participant (see Exhibit 3.7). Growth in pharmaceutical utilization has been a factor as well. The number of HealthSelect prescriptions for each participant has risen almost 21 percent since 1998; each participant's annual prescription needs have jumped from 12.8 prescriptions to 15.5 prescriptions in just four years. By the end of FY 2005, this number is expected to grow another 20 percent, taking pharmaceutical claims up to prescriptions for each participant annually (See Exhibit 3.8). Some of these trends may be attributed to higher consumer awareness and education. Radio, television, print publications and the Internet are all utilized extensively today by individuals to educate themselves about the latest in health care technologies. In addition, health care marketers use these media to reach out to potential consumers. With a health care consuming public more savvy about the latest trends in medical care and prescription drug efficacy, doctors are facing more specific requests for courses of diagnosis and treatment. Dramatic increases in some of the underlying costs of the services being accessed is likely a main culprit behind the escalation in health care spending. Since 1998, UGIP claims costs per participant (excluding prescriptions drugs) have increased more than 40 percent for HealthSelect and almost 43 percent for HealthSelect Plus. This has brought the average monthly claims costs per participant from $ to $ for HealthSelect, and from $ to $ for HealthSelect Plus. These dollar figures are expected to grow an additional 34 percent and 31.6 percent, respectively by the end of FY 2005 (see Exhibits 3.9 and 3.10). Similar to changes in general medical benefit costs, prescription drug benefit costs have also grown significantly. In 1998, average monthly pharmaceutical claims cost per HealthSelect participant were $ For FY 2002, that number was up 35.2 percent to $ By the end of FY 2005, it is expected to increase another 72.8 percent, taking the cost to $ annually for each participant's pharmaceutical needs. The total increase comes to 134 percent since The numbers are equally as dramatic for HealthSelect Plus. From 1998 to 2002, pharmaceutical claims cost per member increased 44 percent. And similar to HealthSelect, they too are expected to increase another 72.8 percent by the end of the coming biennium (See Exhibits 3.9 and 3.10). One of the factors driving these increases has been growth in the rates charged for pharmaceuticals. For example, in 1998, the average payment per HealthSelect prescription was $ For 2002 the price had increased 11 percent, up to $ By FY 2005, it is projected that the average plan payment per prescription will be $59.58, an increase of another 42 percent (see Exhibit 3.11). 33
38 Senate Finance Subcommittee on Rising Medical Costs, January 2003 In addition, general health care reimbursement rates - including those of hospitals and physicians - have recently begun to increase. Requests for increases in reimbursement rates have been met to avoid the threatened exodus of large groups of providers. This was required for UGIP to maintain its broad network. However, the result has been growth, such as a 40 percent increase to the Baylor Hospital System; a 12 percent increase to the Presbyterian System, and double digit increases to the HCA hospitals. In addition, general health providers have seen 4 percent to 5 percent reimbursement rate increases each year (see Exhibit 3.12). 34
39
40
41
42
43 Senate Finance Subcommittee on Rising Medical Costs, January 2003 EXHIBIT 3.5 ERS Cost Containment Initiatives 1993 Required primary care physicians to manage medical care Negotiated discounted payments to network providers Implemented out of pocket cost incentives to use network providers 1996 Restructured the retail pharmacy network 1997 Introduced mail order prescription drug program Negotiated reduced reimbursement rates to certain physicians 1998 Increased generic and name brand prescription drug copayments Implemented reduction in hospital reimbursement rates Eliminated early refills of prescription drugs 1999 Negotiated 2-year contract for competitively bid HMOs Standardized HMO physician copayment 2000 Converted to independent pharmacy benefit manager for HealthSelect Increased HealthSelect and HealthSelect Plus brand drug copayments Increased HealthSelect out of network deductibles 2001 Implemented 3-tier prescription drug program Increased prescription drug copayments Eliminated retail maintenance drug benefit Implemented specific drug quantity limits 2002 Required prior authorization on certain prescription drugs Expanded use of quantity limits on prescription drugs 2003 Continued HealthSelect Plus only in major metropolitan areas Froze enrollment in HealthSelect Plus 39
44
45
46
47
48
49
50 Senate Finance Subcommittee on Rising Medical Costs, January 2003 EXHIBIT 3.12 Discussion of Increased Reimbursement Rates for Health Care Services There are two general categories of forces that drive the cost of the ERS health plans higher. The first is the increased utilization of health care services, e.g., more hospital admissions, more visits to the physician s office, more surgeries, etc. The second includes those factors which result in increases in the payments that the plan makes for a unit of health care services, e.g., payments for a hospital admission, payments for a visit to the physician s office, etc. The second category is the subject of this discussion. For this purpose, the discussion will focus on the rising cost of hospital services and the services that are included in the category referred to as other medical expenses (OME), which is comprised of professional provider services, lab, x-ray and pathology, durable medical equipment and supplies, etc. This discussion does not include an analysis of the inflationary forces driving increases in the cost of pharmacy benefits. Generally, the average payment for a hospital admission actually decreased during most of the 1990 s as a result of changes in the way that hospitals were reimbursed and the highly competitive environment that existed at the height of the managed care era. This situation began to reverse itself during FY 2000 when a number of hospitals across the state began to demand higher reimbursement rates and, in some cases, significant revisions in the manner in which they were compensated. The hospitals backed up their demands with threats to leave the network. This aggressive behavior coincided with the decline of managed care, the consolidation of hospitals and a new emphasis on maximizing consumer choice. Although the HealthSelect/HealthSelect Plus administrator was generally able to renegotiate hospital contracts that included rates below the initial demands of the hospitals, they had little choice but to ultimately agree to increases, a number of which were quite significant, in order to maintain the networks. In some cases they also found it necessary to agree to changes in methodology which made it more difficult to control hospital charges. This has resulted in significant increases in plan payments for both inpatient and outpatient hospital services under both HealthSelect and HealthSelect Plus. Examples of increases include a 40% increase to the Baylor System, a 12% increase to the Presbyterian System, double digit increases to the HCA hospitals and increases to dozens of others. In most cases the renegotiated increases include automatic annual inflationary adjustments. While demands for hospital rate increases are not currently as numerous or as high as they have been over the last few years, requests for more moderate increases continue to be common. Over the last two years, increases in unit costs, primarily driven by reimbursement rate changes, have been the primary factor contributing to the increase in plan payments for hospital services. Unit cost increases have not been as volatile for the OME component of the plan. They have been more stable over the last five years, averaging in the range of 4-5% per year, without any major disruptions in the networks. This is the result of relatively stable contracts with professional providers and, in some cases, the extensive work of the administrator in rebuilding networks in areas in which physician groups have terminated contracts over rate disputes. Although there have been some high profile demands for higher reimbursement from physician groups in various parts of the state, these have generally been resolved with more moderate increases than those that have been required to maintain the hospital networks. It is important to note that in the case of both hospital and OME costs, changes in the mix of services that are provided also contribute to unit cost inflation. The providers control changes in the mix of services and such changes generally result in an increase in unit costs. For example, the average hospital admission increases in cost from year to year both due to changes in reimbursement rates and as a result of the provision of more and/or different services, each of which carries its own separate charge. Changes in the mix of services are difficult to manage in an environment in which health care management has been discouraged. 46 December 27, 2002
51 Senate Finance Subcommittee on Rising Medical Costs, January 2003 Other State Employee Health Coverage Background Under pressure of rapidly rising health care costs, all academic institutions of higher education were given the opportunity to join ERS Uniform Group Insurance Plan (UGIP) in At that time, only the University of Texas and Texas A&M University opted not to join UGIP. The two primary reasons given for not opting in were that the two programs had a long history of selfinsurance, and they both had their own health related institutions to help provide health care for their employees. Independence of the UT & A&M group insurance programs was predicated on the idea that the two systems would be able to provide comparable or superior health care benefits to their employees at costs roughly equivalent to UGIP for similar benefits. Funding for the two programs is based on dollar figures ERS-UGIP anticipates will be needed to cover costs for participants. This methodology results in an appropriation that has the potential for yielding more dollars than might otherwise be needed to provide comparable coverage to UGIP. For example, all three programs cover 100 percent of premiums for the employee/retiree only. UT and A&M, however, have typically received enough state funding to allow premium coverage for spouses and dependents well in excess of the 50 percent UGIP covers. Until last session, both UT and A&M had rider language in the General Appropriations Act (GAA) indicating legislative intent that the state cover 80 percent of spouse and dependent premiums. This was based on the level of benefit the state appropriation yielded several biennia ago when UT & A&M health plans were less expensive than UGIP. As costs rose, however the legislature failed to meet the threshold. The rider was dropped from the GAA. Today the state funds 57 percent of spouse and dependent premiums for UT and 67 percent for A&M. In addition to these differences, UGIP, UT and A&M also differ on general benefit coverage as well. UGIP premiums are generally higher, however, UT & A&M have higher deductibles, copayments, and out-of pocket maximums which allow them to keep their premiums down (see Exhibit 3.13). The University of Texas Employee Group Insurance Plan (UT-EGIP) The UT System health care program covers approximately 141,000 participants throughout 15 component institutions and System Administration Office. Of those, approximately 78,000 are employee or retirees, and 63,000 are spouses or dependents. Similar to UGIP, growth in 47
52 Senate Finance Subcommittee on Rising Medical Costs, January 2003 participation in UT-EGIP has remained relatively modest having only increased around 5 percent since As mentioned above, funding for UT-EGIP is based on projected cost estimates for ERS-UGIP and the estimated number of participants the program will have in the coming biennium. For FY 2002, UT-EGIP received $138.3 million in general revenue. This represents an increase of 82.7 percent since FY State appropriated funds, however, comprise only around 35.7 percent of total program revenues. Employee premiums, system and component institution contributions, and investment income are used to balance the ledger. An additional $248.9 million was generated from these sources in FY This amount was up 53.5 percent over FY All totaled, program revenues have increased nearly 63 percent in five years. To meet these growing demands, UT-EGIP has also utilized reserve fund balances to offset expenditures. Since 1998, a reserve fund balance that was $36.2 million has been depleted. Having utilized over $48 million since that time, at the end of FY 2001 UT-EGIP reported a reserve fund deficit of nearly $12 million. To control some of these escalating costs, UT-EGIP has implemented many of the same cost containment initiatives used by UGIP. This has included increased co-payments, deductibles, and out-of-pocket limits, as well as implementation of a 3-tier formulary and disease management programs. In addition, UT-EGIP has recently enacted a Mandatory Generic Substitution program in which participants are required to pay the full difference in price for a brand drug when an appropriate generic is available. This new feature is expected to save the program more than $1 million in the current biennium. UT-EGIP also recently selected a new administrator for its self-funded PPO. This resulted in a savings of $1.7 million in administrative fees, greater efficiency in plan administration, and more favorable provider contracts. Texas A&M Employee Group Insurance Plan (A&M-EGIP) The Texas A&M health care program covers approximately 57,000 throughout its component institutions. Of those, approximately 29,000 are active employees or retirees, with nearly 28,000 being spouses or dependents. Similar to both UGIP and UT-EGIP, growth in participation in the A&M program has remained relatively modest, having only grown around 7 percent since Similar to UT-EGIP, funding for A&M-EGIP is based on projected cost estimates for ERS-UGIP and the estimated number of participants the program will have in the coming biennium. For FY 2002, A&M-EGIP received $71.9 million in general revenue. This represents an increase of 62 percent since FY
53 Senate Finance Subcommittee on Rising Medical Costs, January 2003 State appropriated funds, however, comprised only around 55 percent of total program revenues. Employee premiums, system and components institution contributions, and investment income are used to balance the ledger. An additional $57.6 million was generated from these sources in FY This amount was up 42.5 percent over FY All totaled, program revenues have increased nearly 52.9 percent in five years. To help control these escalating costs, A&M-EGIP has implemented many of the same cost containment initiatives used by UGIP & UT-EGIP. This has included increased co-payments, deductibles, and out-of-pocket limits. This reflects one of the central tenets of A&M-EGIP: those who utilize the benefits should pay more of the costs than those who do not use the benefits. As a result, A&M-EGIP has looked to hold down out-of-pocket premium costs and asked those who utilize the plan s benefits to pay more of the costs at the time of service. In addition, A&M-EGIP has implemented a 3-tier formulary, mandatory generic substitution, and aggressive prior authorization programs on their prescription drug program. Similar to UGIP, both UT-EGIP and A&M-EGIP attribute most of the increases in spending within their programs to two major factors: generally higher utilization of benefits driven largely by an aging population and a more savvy health care consuming populace; and higher costs of services driven by such things as advances in technology, higher operating expenses, and rapidly increasing prescription drug costs. 49
54 Senate Finance Subcommittee on Rising Medical Costs, January 2003 EXHIBIT 3.13 COMPARISON OF (SELF-FUNDED) HEALTH PLAN PROVISIONS (REFLECTS MARCH 1, 2003 A&M CARE CHANGES) Out of Service Area Restrictions UT SELECT Network, In-Area Urgent Care: BCBS network (nationwide) - $250 deductible + 15% of allowed Non-network - $500 deductible + 35% of allowed A&M CARE 350 Network, In-Area Urgent Care: BCBS network (nationwide) - $350 deductible + 20% of allowed Non-network - $700 deductible + 50% of allowed HEALTHSELECT (HS) Network, In-Area Urgent Care: BCBS network (nationwide) - 10% of allowed Non-network - $500 deductible + 30% of allowed Emergency Care: $75 copay Emergency Care: $350 deductible + 20% of allowed Emergency Care: $50 copay + 10% of allowed Deductibles $250/person $350/person None $750/family $1,050/family Out of Pocket $1,750/person $3000/person $500/person Maximum $5,250/family In-Hospital Care $250 deductible + 15% of allowed $350 deductible + 20% of allowed 10% of allowed Emergency Room $75 copay $350 deductible + 20% of allowed $50 copay + 10% of allowed Surgery $250 deductible + 15% of allowed $350 deductible + 20% of allowed 10% of allowed Office Visits/ $20 copay/family care doctor $20 copay; certain expensive $15 copay Outpatient Surgery $25 copay/specialist surgeries $350 deductible + 20% of allowed Prescription Drugs Vision Dental Mental Health Premium Cost (Employee/State) Retail: up to 30-day supply Generic $10 Preferred $25 Non-Preferred $40 Mail: up to 90-day supply Generic $20 Preferred $50 Non-Preferred $80 Illness-related eye exams only, same as office visit copay. Routine vision care is an optional coverage. Accidental injuries to normal, healthy teeth covered; $250 deductible + 15% of allowed All other dental services are covered by an optional dental plan. Inpatient: Maximum 30 days $250 deductible + 15% of allowed Outpatient: Maximum 20 visits $20 copay/family care doctor $25 specialist Serious Mental Illness covered the same as any other illness Employee Only $0/$ Employee & Spouse $124.14/$ Employee & Children $129.84/$ Employee & Family $244.48/$ $50 deductible then Retail: up to 30-day supply Generic $10 Preferred $25 Non-Preferred $50 Mail: up to 90-day supply Generic $20 Preferred $50 Non-Preferred $100 Retail: up to 30-day supply Generic $5 Preferred $20 Non-Preferred $35 Mail: up to 90-day supply Generic $10 Preferred $40 Non-Preferred $70 $20 copay; one exam per year $15 copay; one exam per year Accidental injuries to normal, healthy teeth covered; $350 deductible + 20% of allowed All other dental services are covered by an optional dental plan. Inpatient: Maximum 30 days $350 deductible + 20% of allowed Outpatient: Maximum 40 visits $20 copay Serious Mental Illness covered the same as any other illness Employee $0/$ Employee & Spouse $63.37/$ Employee & Children $31.45/$ Employee & Family $96.26/$ Accidental injuries to normal, healthy teeth covered; 10% of allowed All other dental services are covered by an optional dental plan. Inpatient: Maximum 30 days First 15 days 10% Second 15 days 30% Outpatient: Maximum 30 visits 10% of allowed (out of pocket max does not apply) Serious Mental Illness covered the same as any other illness Employee Only $0/$ Employee & Spouse $176.30/$ Employee & Children $118.04/$ Employee & Family $294.34/$
55 Senate Finance Subcommittee on Rising Medical Costs, January 2003 State Employee Health Care - Cost Management Options Through the process of taking testimony and examining issues relating to rising medical costs, a number of cost management concepts emerged or were presented. Below, is a summary of some of the options suggested. The committee takes no position as to the viability or feasibility of these suggestions. Consider requiring newly hired state employees to wait 30, 60 or possibly 90 days from date of employment before they are eligible for coverage under one of the state s health care plans. Waiting periods are not uncommon in either the public or private arenas. Consider reducing the state s premium contributions for newly hired part-time employees working between 20 and 39 hours per week and their dependents. The state currently pays 100 percent of these employee premiums and 50% of their dependent premiums without regard to number of hours worked. Consider reducing or eliminating the state s premium contributions for executive board members and their dependents. The state currently pays 100 percent of executive board member premiums and 50% of their dependent premiums. For most of these individuals, their state service is not a full-time job. Consider requiring all state prescription drug plans to include a mandatory generic substitution program where participants are required to pay the full difference in price for a brand drug when an appropriate generic is available. UT-EGIP recently implemented this provision and is expected to save more than $1 million in the current biennium. Consider indexing the state s level of premium contribution for future retirees and their dependents to the employee s number of years of service. For retirees with at least 10 years of service, the state currently pays 100 percent of the retiree s premiums and 50% of their dependent s premiums regardless of the number of years of service beyond the 10 year mark. Savings for this proposal would vary widely depending on how it was structured and to whom it was applied. In addition, this option would provide added longevity incentive for state employees. Consider changing the methodology by which funding for UT-EGIP and A&M-EGIP is determined. Currently, these programs receive funding based on ERS-UGIP cost projections. The legislature may want to consider requiring these two programs to justify their own appropriations. By doing so, the state could better ensure that each program is funded appropriately. 51
56 Senate Finance Subcommittee on Rising Medical Costs, January 2003 Consider requiring all state employee health programs to institute an aggressive claims payment review process like ERS. In FY 2001, ERS-UGIP reviewed $2.3 billion in payments for ineligible charges. This resulted in $440.9 million in savings. This process could be replicated in the state s other programs as well. Consider changing state employee health care program to a defined contribution plan, where the state would pay a specific amount to employees for the purpose of purchasing health coverage. Employees would be given a choice of state health plans with different levels of benefits. Any differences in the amount the state provided and actual premium costs would be born by the employee. Under this type of plan the state s cost would be more easily controlled and employees would be empowered with more control over their health care dollars. 52
57 Senate Finance Subcommittee on Rising Medical Costs, January 2003 Teacher Retirement System of Texas Background The Teacher Retirement System of Texas was established by a constitutional amendment passed in 1936 to provide retirement programs for public education employees. Today, one of the most significant benefits administered by TRS is its health care program. Composed of two major programs, TRS-Care offers comprehensive group health benefits for eligible retired Texas public school employees and their eligible dependents. TRS-Active Care provides health coverage to public school employees in eligible school districts and their dependents. TRS-CARE Created in 1985, TRS-Care currently provides health care benefits to more than 150,000 retirees and dependents and includes retirees of public schools, charter schools and education service centers. TRS-Care offers three levels of coverage. TRS-Care 1 & 2 provide catastrophic coverage with relatively high deductibles and payment limits. TRS-Care 1 is designed for those retirees not covered by Medicare, while TRS-Care 2 covers those who do receive Medicare benefits. Both plans are offered at no cost to the retiree. However, a contribution is required for coverage of dependents. Today, almost 40,000 retirees and dependents participate in both TRS- Care 1 and 2. TRS-Care 3 is the largest retiree health care program offered by TRS. This program offers more than 100,000 enrollees a comprehensive health care program and a pharmacy benefit to all retirees. Both retirees and dependents pay premiums to participate in the program, which offers lower deductibles and out-of-pocket limits than TRS-Care 1 or 2 (see Exhibit 4.1). Premiums for participants in TRS-Care 3 were last increased in FY For those participants covered under Medicare, TRS-Care acts as a coordinated benefit. Once the participant reaches age 65, Medicare becomes the primary coverage and typically pays 80 percent of claims. TRS-Care then pays 80 percent of the remainder, and the difference goes to the participant. However, for participants younger than 65, TRS-Care is the usually the only source of coverage. In addition, because no Medicare prescription drug plan yet exists, TRS-Care is the lone source of prescription drug coverage. While participation in TRS-Care 1 & 2 has remained relatively constant during the past several years, enrollment in TRS-Care 3 has grown steadily. This trend is expected to continue as many teachers approach retirement eligibility. By 2005, it is projected that more than 30,000 additional retirees and dependents could be enrolled in TRS-Care 3. This would represent an increase of nearly 30 percent in just 3 years (see Exhibit 4.2). 53
58 Senate Finance Subcommittee on Rising Medical Costs, January 2003 TRS-Care 1, 2 and 3 have historically been funded through a combination of state, member, and retiree contributions, as well as investment income. Since the inception of the program, active TRS members have contributed one quarter of one percent of their salaries to support the program. For 2002, this generated $47.5 million (8 percent of total revenue) which accounted for 10 percent of expenditures. However, just 10 years ago, this funding mechanism generated almost 17 percent of total program revenue and accounted for 21.5 percent of program expenses. The trend is expected to worsen over the next biennium, with member contributions projected to only cover around five percent of program expenses in FY 2005 (see Exhibit 4.3). The other legislatively established funding mechanism is the state s contribution. Originally set at 0.35 percent of public education covered payroll, this percentage moved to one half of one percent (0.5 percent) by where it remains today. During the past 10 years this component has generated an average of about 35 percent of revenue and covered almost 30 percent of the cost. However, it is projected by the end of the biennium the state s regular contribution will only cover 11 percent of projected costs (see Exhibit 4.3). The third and most substantial program funding element is retiree premiums. Although not statutorily set, retiree premiums have composed about 41 percent of program revenue for the past 10 years. This has historically covered around 40 percent of the costs. However, similar to the other two funding elements, retiree premiums will only cover about 22 percent of program costs by the end of the Retiree premiums have not increased since FY 2000, and the TRS LAR request is based on no anticipated increases to retiree premiums (see Exhibit 4.3). Until 1993, these three funding components generated enough annual revenue to cover expenditures associated with the program and allow the TRS Health Care Trust Fund to develop a surplus. Those funds were invested over the years to generate additional revenue for the program. Investment income held solid in the 1990's, averaging about $15.5 million each year (see Exhibit 4.3). However, in 1993 the three major funding elements failed to generate sufficient revenue to cover costs. For the first time, investment income was used to balance the ledger. In spite of this initial funding imbalance, the Trust Fund balance continued to grow, peaking in 1995 at almost $235 million. Three years later, even using all investment income available, the TRS-Care programs did not have sufficient revenue to cover costs. This funding deficit has existed since 1996, and the Trust Fund balance has dwindled. Any remaining balances in the fund are projected to be gone by the end of FY 2003 (see Exhibit 4.4 & 4.5). In 2001, all available revenue, including investment income and fund balances, were insufficient to cover costs. TRS-Care required a supplemental appropriation outside the designed funding elements for the first time since its creation. To cover expenses, the 76th Legislature appropriated an additional $76 million. Last session, the Legislature was again asked to 54
59 Senate Finance Subcommittee on Rising Medical Costs, January 2003 appropriate additional funds to meet costs. As a result, the current budget contains an additional $410 million in General Revenue. For the coming biennium, it is expected that TRS-Care will need an additional $1.15 billion to meet projected expenditures (see Exhibit 4.3, 4.4 and 4.5). In an ongoing effort to control the expenditures side of the ledger, TRS has implemented a number of cost containment efforts over the years. Increasing deductibles and coinsurance, precertification requirements, implementation of a statewide hospital and physician network, and a mandatory generic differential payment for brands are some of the measures employed by TRS (see Exhibit 4.6). Cost Drivers Recent trends in escalating health care costs can be attributed to a number of factors. One major cause has been a dramatic increases in enrollment. Growth in participation in TRS-Care 1 & 2 has been flat for the past 5 years with enrollment hovering at around 40,000. TRS-Care 3, however, has seen large increases and is projected to experience more of the same. As of June 2002, TRS-Care 3 enrollment was over 100,000. This is an increased of 8.7 percent over June 2001 numbers, and an increase of more than 20 percent since June TRS is expecting enrollment to increase at 7.5 percent each year of the next biennium. This will add about 30,000 new enrollees to the program by the end of Perhaps the more significant factor, however, has been the growth in TRS-Care 3 among enrollees not covered by Medicare. Participation by those carrying Medicare coverage has grown steadily during the past four years at around 4 percent each year. During that same period, enrollment of those not covered by Medicare has grown almost 40 percent with the largest surge in FY 2002 when participation grew by 16.4 percent. This trend may be attributed to a number of factors, including a surge in the number of new, younger retirees. TRS members may begin accessing benefits once their age plus years of experience equals 80. Therefore, teachers who are 55 years old with 25 years teaching experience may retire and begin accessing benefits. Overall growth in TRS-Care participation has been a major driver, but it is the cost of care associated with these programs pushing the expenditures. Since 1998, TRS-Care medical claims cost (excluding prescription drugs) have grown 85 percent, rising from $156.5 million to $290.4 million each year. However, projections show medical claims cost may increase $324 million (112 percent) between now and the end of FY While less in total dollars, the percentage increases associated with prescription drug costs are also dramatic. Already having increased 115 percent since 1998, projections have pharmaceutical costs rising another 122 percent by the end of FY 2005 (see Exhibits 4.2 and 4.3). While some of this growth can be attributed to expansion in participation, most has been caused by general increases in medical and prescription drug costs. In 1998, an average participant cost 55
60 Senate Finance Subcommittee on Rising Medical Costs, January 2003 TRS-Care $1,293 for medical claims and $630 for pharmaceuticals. By the end of 2002, those number had increased 57 percent and 82 percent, respectively. Projections show that during the next three years, we can anticipate medical costs to jump 73 percent and pharmaceutical costs to rise another 82 percent. This would bring average costs per participant up to $3,518 for medical and $2,084 for prescription drugs (see Exhibits 4.2 and 4.3). One of the most significant factors driving medical and pharmaceutical cost seems to be the growth among TRS-Care 3 participants not covered by Medicare. These participants have costs associated with them far exceeding those receiving Medicare benefits. In FY 2001, members receiving Medicare benefits cost TRS-Care $2,353 each year, while non-medicare participants cost $5,922 each. This represents a difference of more than 151 percent. Although the trend is projected to improve slightly, by FY 2004 the difference will be near 94 percent with Medicare participants costing $3,736 each year and non-medicare participants costing $7,242. Finally, increased utilization has also had an impact on cost. In addition to increases driven by enrollment trends, participant use has grown exponentially. In 1998, TRS enrollees averaged prescriptions; 2.16 days of inpatient care; and outpatient visits; three years later, these figures had increased 13.2 percent; 7.9 percent; and 27 percent, respectively. Patient awareness, direct to consumer marketing, and advances in new technologies have each helped perpetuated this trend. 56
61
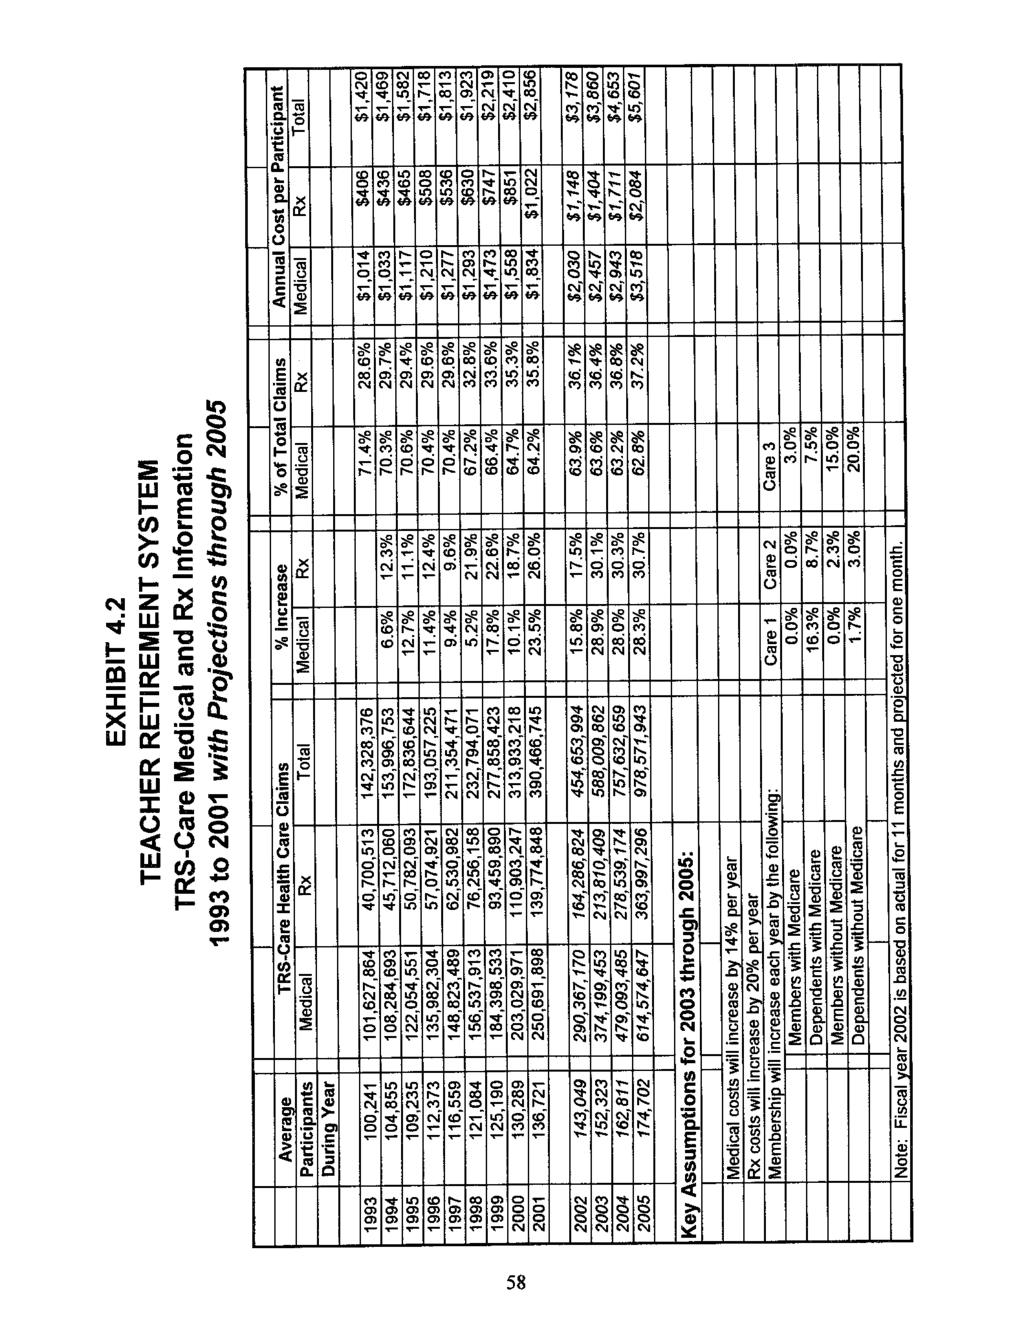
62

63
64
65
66 Senate Finance Subcommittee on Rising Medical Costs, January 2003 EXHIBIT 4.6 TRS-Care Cost Containment Initiatives Implemented mandatory pre-certification for certain outpatient services Expanded outpatient pre-certification Increased deductibles Increased maximum coinsurance limit Increased deductibles Increased maximum coinsurance limit Established retail pharmacy network Increased deductibles Increased maximum coinsurance limit Implemented a statewide hospital network Increased deductibles Increased maximum coinsurance limit Implemented a statewide physician network Increased discounts in hospital and physician networks Increased discounts in hospital and physician networks Implemented drug card program with mandatory generic differential payment for brands Increased discounts in hospital and physician networks Increased mail order drug co-payments Increased mail order drug co-payments Limited Chiropractic visits to 20 per year Negotiated more favorable prescription drug discounts in conjunction with TRS- Active Care program 62
67 Senate Finance Subcommittee on Rising Medical Costs, January 2003 TRS-ACTIVE CARE Created by the 77th Legislature, TRS-Active Care was established to provide a statewide health care benefits program for employees of school districts, charter schools, regional education service centers, and other educational districts. The program went into effect Sept.1, School districts with 500 or fewer employees (more than 80 percent of the state s districts) were required to participate in the program, while those having between 501 and 1,000 employees were presented the option of joining. In its first year of operation, some 930 entities opted to participate in TRS-Active Care. More than 150,000 district employees are covered. Those participating in TRS-Active Care are provided three choices of coverage. Plan 1 provides basic coverage. It uses deductibles and coinsurance as its primary benefit, and is offered at no expense to the employee. Plan 2 provides greater benefits offering lower deductibles and coinsurance. In addition, certain services such as office visits and prescription drugs are covered through co-payment. Plan 2 is provided at virtually no cost to the employee. Plan 3 offers the most comprehensive coverage. It provides both network and non-network benefits with most network benefits provided through low co-payment. For this plan, the employee pays $91 a month with the state and school district paying the difference. Funding for the teacher health care program is provided by a variety of sources. Through TRS, $1,000 per year ($83.33 a month) is allocated to each active school employee, whether or not the employee participates in either the state program or a local district insurance program. These funds may be used to pay for additional employee coverage, dependent coverage, or taken as compensation, depending on the employee s choice. In addition, all districts, whether participating in the state insurance program or not, receive a monthly contribution via the Texas Education Agency of $75 per employee covered by either the state program or a local district program. Finally, every district must contribute at least an additional $150 monthly toward participating employees healthcare cost. Any difference in cost beyond the $308 provided by the state and school district may be covered by the district. Otherwise it is the employee s responsibility. Because the program has been up and running for less than a year, hard data to support trends in rising costs are limited. With program design very similar to others administered by TRS and ERS, it is safe to assume trends affecting those plans will also drive similar increases in expenditures in TRS-Active Care. However, because funding for the program is strictly defined, the state s exposure to any increases in health care costs have been limited. Only the number of active teachers and staff employed by school districts in the state of Texas will affect the amount of money needed to fund the state s portion of the plan. TRS projections anticipate a 3 percent annual employee growth during the biennium. This will equate to around $18 million per year more needed to fund TRS portion of Active Care. 63
68 Senate Finance Subcommittee on Rising Medical Costs, January 2003 TRS - Cost Management Options Through the process of taking testimony and examining issues relating to rising medical costs, a number of cost management concepts emerged or were presented. Below, is a summary of some of the options suggested. The committee takes no position as to the viability or feasibility of these suggestions. Consider limiting participation in TRS-Care 3 of new retirees until they reach the age of 65. Participants between retirement age and 65 are on average the most expensive to the program. This approach would seek to limit that cost by offering them access to only TRS-Care 1 and 2 until age 65. An alternate approach to this option would be to require TRS-Care 3 participants under 65 to pay 100% of the premium difference between TRS- Care 1 or 2 and that of TRS-Care 3. Consider indexing premium contributions for all TRS-Care 3 participants on their years of service. Currently, the state pays all but $67 of a retiree s monthly premium for those who have Medicare, and all but $162 for those who do not. This is done without regard to the retiree s number of years of service. Savings for this proposal would vary widely depending on how it was structured and to whom it was applied. In addition, this option would provide added longevity incentive for teachers. Consider adjusting TRS-Care s method of finance by increasing the contribution levels for active employees, retirees and the state. The contribution levels of retirees and active teachers have changed relatively little (if at all) over the life of the program. This proposal would look to update the funding elements so as to provide a sufficient funding from all sources. The Legislature may also want to consider creating a contribution requirement for school districts, who currently provide no financial support to the program. An additional approach would be to establish a cap or limit on the state s supplemental appropriation for this program and require any necessary increases in funding to be generated by active teachers, retirees, and school districts. Consider changing TRS-Care to a defined contribution plan, where retirees would receive a specific amount of money for the purpose of purchasing health coverage. Retirees would be given a choice of state health plans with different levels of benefits. Any differences in the amount the state provided and actual premium costs would be born by the retiree. Under this type of plan the state s cost would be more easily controlled and retirees would be empowered with more control over their health care dollars. Consider requiring the implementation of a 3-tiered prescription drug co-payment program. TRS-Care currently has a 2-tiered prescription drug co-payment program. 64
69 Senate Finance Subcommittee on Rising Medical Costs, January 2003 Consider requiring both TRS-Care and TRS-Active Care to institute an aggressive claims payment review process. In FY 2002, ERS-UGIP reviewed $2.7 billion in payments for ineligible charges. This resulted in $582.5 million in savings. This process could be replicated in the TRS programs as well. 65
70 Senate Finance Subcommittee on Rising Medical Costs, January 2003 Texas Department of Criminal Justice Correctional Managed Health Care Background The Texas Correctional Managed Health Care (CMHC) partnership represents a unique collaboration between the Texas Department of Criminal Justice (TDCJ) and two of the state s leading health science centers, the University of Texas Medical Branch at Galveston (UTMB) and the Texas Tech Health Center (TTUHSC). The three entities joined forces in 1993 to form the Correctional Managed Health Care Committee, a group charged with increasing access, improving quality and containing the costs of treating inmate medical needs. The committee is composed of two representatives appointed by each partners respective president or executive director. One representative of each partner must be a physician. Effective in FY 2000, the committee expanded to include three members appointed by the governor (two of whom must be physicians). The nine-member body contracts on behalf of TDCJ with the health science centers to provide a full range of health care services. Both universities have established a correctional health care organization, which includes a medical director and a chief administrative officer. The committee oversees and coordinates all inmate health care services, and it provides a representative forum for decision-making in terms of overall health care policy, allocation of resources and assignment of responsibilities. Committee representatives are empowered by their respective organizations to represent them on health care matters and make decisions that are binding on their organizations. 66
71 Senate Finance Subcommittee on Rising Medical Costs, January 2003 Cost Drivers Appropriations for TDCJ Correctional Managed Health Care have slowly increased from $296.6 million in 1996 to $343.4 million in (See Exhibit 5.1) An incarcerated population continually presents unique funding challenges and health care is not an exception. Most concepts of rising medical costs in the free world are quite different than those factors affecting the cost of health care for the prison population. The rising cost of medication is common, but the diseases and needed drugs are dramatically different. Major cost drivers for TDCJ Correctional Managed Health Care include the aging population of the inmates; altered standards of care for Hepatitis C, HIV and psychiatric medications; pharmacy costs; and expansion/service capacity issues. Exhibit
72 Senate Finance Subcommittee on Rising Medical Costs, January 2003 Aging of Inmate Population In just two years, the number of offenders 55 and older has increased by 13.6 percent. Elderly offenders access health care services more often than young inmates and the services they require are more expensive. For example, while comprising 4.7 percent of the service population, offenders 55 and older account for 18 percent of billed charges for hospitalization. Elderly offenders average more than $4,000 average in billed hospital charges each year compared to about $500 per year for younger offenders. In addition, elderly offenders average more than 10 outpatient encounters with medical staff per month compared to less than two such encounters for younger offenders It is a common debate as to whether the state should continue to incarcerate inmates who are frail and elderly. These aged and unwell inmates are considered by many to be of no threat to the public; keeping them in the prison system only increases costs to the state for their expensive health care. The Legislature has created a special parole option for elderly and infirm inmates. Texas allows for the release of an inmate on medically recommended intensive supervision (previously referred to as special needs parole) if: the Texas Council on Offenders with Mental Impairments (TCOMI), in cooperation with the Correctional Managed Health Care Committee, identifies the inmate as being elderly, physically handicapped, mentally ill, terminally ill, mentally retarded, or having a condition requiring long-term care; a parole panel determines that, based on the inmate s condition and a medical evaluation, the inmate does not constitute a threat to public safety; and TCOMI, in cooperation with TDCJs parole division, has prepared for the inmate a medically recommended intensive supervision plan that requires the inmate to submit to electronic monitoring, places the inmate on super-intensive supervision, or otherwise ensures appropriate supervision of the inmate. Individuals convicted of an aggravated offense are not eligible for medically recommended supervision. As a condition of release, these former inmates must remain under the care of a physician and in a medically suitable placement. The 77th Legislature expanded the list of conditions eligible for medically recommended intensive supervision to include conditions requiring long-term care. The amended statute took effect Sept. 1, During FY 2000, 115 referrals were presented to the Board of Pardons and Paroles (BPP) for release under these provisions. Of these referrals, 49 were approved (42.6 percent). During FY 2001, 186 referrals were presented to BPP and 47 were approved (25.3 percent). Under the expanded list of conditions authorized by the 77th Legislature, 178 referrals have been presented 68
73 Senate Finance Subcommittee on Rising Medical Costs, January 2003 to the BPP and 42 (23.6 percent) have been approved during the first six months of fiscal year A key component of this program is, once released under this provision, these inmates are able to access a health care, third-party-payer, such as Medicaid or Medicare. Changing Standards of Care Hepatitis C and HIV As medical research and technologies identify new medications, new treatment therapies and new diagnostic techniques, costs to the program increase. When treatment protocol is adjusted for diseases prevalent in the prison population, the costs to the state increase dramatically. On average, 2,397 inmates, or 1.8 percent of the prison population are HIV positive. HIV antiretroviral drugs alone accounted for $14.7 million, or 40 percent, of CMHC total drug costs. In 1997 there was an alteration in HIV drug therapies which has increased the overall cost of treating inmates that are HIV+. FY 1996: $1.23 million for 1876 patients FY 1997: $3.93 million for 2101 patients FY 1998: $7.54 million for 2393 patients FY 1999: $12.29 million for 2520 patients FY 2000: $15.24 million for 2574 patients FY 2001: $15.75 million for 2481 patients FY 2002: $14.7 million for 2397 patients TDCJ estimates that about 18,000 inmates, about 13.7 percent, have been identified as testing positive for the Hepatitis C virus. However, studies show that 28.8 percent of incoming offenders test positive for Hepatitis C indicating there is a likelihood of a much larger number of offenders needing treatment in the future. These inmates are monitored in a chronic clinic program. From this program, specialists examine and evaluate the inmates eligibility for drug therapy. At current funding levels, about 300 patients are receiving Interferon and Ribavarin drug therapy. The costs of providing this care have increased in the last two biennia. FY 1999: $250,000 FY 2000: $560,827 FY 2001: $955,959 FY 2002: $1,416, Report provided by the Legislative Budget Board in response to a request from Subcommittee members during the February 26, 2002 hearing. 69
74 Senate Finance Subcommittee on Rising Medical Costs, January 2003 The National Institutes of Health (NIH) June 2002 Draft Consensus Development Conference Statement for Hepatitis C treatment indicates a significant change in Hepatitis C disease management. 20 The NIH statement recommends: initiation of therapy earlier in the disease s progression; use of newer pegylated Interferon in combination with Ribavirin; increased use of genotyping and liver biopsy for therapeutic decision-making; and emphasizes the need for additional research into special Hepatitis C populations such as those in institutional settings. CMHC has requested $5.967 million and $ million for FY respectively to address the anticipated needs for the newly adopted consensus standard for Hepatitis C. Psychiatric Medications Passed by the 77th Legislature, Senate Bill 636 called for a study on implementing Texas Medication Algorithm Project (TMAP) within the TDCJ patient population. TMAP is a public and academic collaborative effort within the Texas Department of Mental Health and Mental Retardation (MHMR) designed to develop, implement and evaluate an algorithm-driven treatment philosophy for major adult psychiatric disorders treated in the Texas public mental health sector. TMAP is a treatment philosophy for the medication management portion of care. A result of this project has been the development of medication treatment guidelines for three major psychiatric disorders: schizophrenia; major depressive disorder; and bipolar disorder. Preliminary estimates on implementing such a level of care to the prison population indicate costs would increase by about 220 percent ($16 million) each year. TDCJ has included a costs study pilot project study as an exceptional item appropriations request at $2.25 million for Additionally, the move toward new generation medications as the recommended treatment for prison inmates increases CMHC program costs. Pharmacy Costs Pharmacy costs for CMHC are expected to increase by double digit percentages. Cost increases are being driven primarily by changes in utilization due to newer therapies and changes in standards of care rather than by inflation of prices. HIV related drugs account for about NIH Consensus Statements are prepared by a non-advocate, non-federal panel of experts, based on presentations, questions and statements, and deliberations. 70
75 Senate Finance Subcommittee on Rising Medical Costs, January 2003 percent of those total drug costs. CHMC drug costs in FY 2001 were $39.9 million and represented about 12.5 percent of total health care costs. The 77th Legislature s Senate Bill 347 required a good faith effort by CMHC parties 21 to participate in the federal 340B drug pricing program, which provides for pharmaceutical drugs to be purchased for a lower cost. CMHC sought and gained approval in April 2002 from the federal government for the UTMB sector that constitutes 78 percent of the prison population. If access to the federal 340B drug pricing program continues, it should help to minimize expected pharmacy cost increases independent of increases associated with changes in standard of care. Due to the cost offset from using 340B drug prices, CMHC is not requesting an increase in funding for drug costs in FY over the estimated amounts other than their anticipated funding need to address the Hepatitis C treatment change. Facility Expansion/Service Capacity The 77th Legislature authorized expansion of the Rural Medical Facility at the Montford Unit. The expansion will provide 44 beds to accommodate hospitalization and specialty care needs for prisoners in West Texas on site rather than in local hospitals. This facility expansion in FY 2005 will require $1.748 million for operational funding once the facility construction is completed. This cost is listed in the agency s exceptional item request. CMHC plans to increase dialysis capacity and move female, dialysis patients to the Carole Young Medical Complex. This complex was constructed with dialysis space and plumbing, but they need to build the dialysis stations and employ appropriate staff to operate as a dialysis center. The costs associated with this project are $1.06 million in FY 2004 and $842,000 in FY These costs are listed in the agency s exceptional item request. 21 CMHC parties include University of Texas Medical Branch (UTMB), the Texas Department of Criminal Justice (TDCJ), and the Texas Tech University Health Sciences Center. 71
76 Senate Finance Subcommittee on Rising Medical Costs, January 2003 Correctional Managed Health Care Cost Management Options Through the process of taking testimony and examining issues relating to rising medical costs, a number of cost management concepts emerged or were presented. Below, is a summary of some of the options suggested. The committee takes no position as to the viability or feasibility of these suggestions. consider more regional providers for delivering constitutionally adequate health care services to reduce associated costs When discussing the costs of providing health care to the prison population it is important to recognize there is value to providing adequate medical services to this population. In terms of the larger public health issue, it is key to remember that the overwhelming majority of prisoners will eventually be released back to the communities. If we as a state do not maintain adequate health care for inmates, those health problems will eventually become a free population problem - for example, to local hospitals or jails. Additionally, curbing the spread of prisoners diseases into the community should be of utmost concern. Addressing the medical needs of offenders while they are incarcerated represents an important public health and risk management opportunity that should not be overlooked. A second consideration for funding the correctional health care program adequately is that states are required constitutionally to provide health care services to offenders. We also know from the Ruiz litigation that the costs involved in not providing the constitutionally required level of care and the consequences of the lack of care, subsequent litigation, and intrusion of the courts to enforce the required care will far exceed the costs of having provided the care in the first place and will likely be more intrusive into the state's operation of its prison system. As a state we must remember to frame any cost management for CMHC in terms of these issues. 72
77 Senate Finance Subcommittee on Rising Medical Costs, January 2003 Selected Health Care Stakeholders Testimony At the final hearing on September 5, 2002, the subcommittee invited health care stakeholders to testify and share information, concerns and suggestions regarding rising health care costs. The subcommittee heard from: Texas Department of Insurance, Texas Association of Business, Texas Hospital Association, Texas Medical Association Texas Association of Health Plans, Pharmaceutical Research and Manufacturers of America (PhRMA) Genentech Each of these industry groups spoke of the trends and factors that are impacting their abilities to be effective participants in the health care realm. The subcommittee also heard from the Texas Department of Insurance. Texas Department of Insurance At the request of the subcommittee, Texas Insurance Commissioner Jose Montemayor testified regarding the status of medical malpractice insurance and health maintenance organizations (HMOs). Regarding medical malpractice insurance in Texas, the Commissioner provided the following information: Medical malpractice reforms of 1993 and 1995 resulted in rate rollbacks of 17.2 percent. The number of companies actively writing medical malpractice coverage in Texas has declined in the last year from 17 to five companies. Around 6,500 physicians will have to find new coverage in the coming year because of companies withdrawing of otherwise non-renewing policies. To help with decreases in availability, JUA has modernized policies to offer broader coverage. Rates have increased on average around 63 percent since 1999 with one company increasing rates as much as 117 percent and JUA increasing rates only around 3 percent. Losses increased approximately 15 percent between enough to cause rates to double. Frequency of claims in Lower Rio Grande Valley (primarily Hidalgo County) increased at a rate of 60 percent per year. As a result, claims severity has declined 25 percent for the area. Claims severity in other parts of the state, such as San Antonio and Dallas, has increased significantly. 73
78 Senate Finance Subcommittee on Rising Medical Costs, January 2003 The number of claims per 100 insured physicians is up slightly in most areas of the state yet still well below 50 claims. In the Rio Grande Valley, the numbers of claims exceeds 350. Cost per reported claim is up significantly. In San Antonio and Dallas, costs are almost double the state average. On average, medical malpractice rates in Texas are highest in Hidalgo, Cameron, and El Paso counties, and lowest in Lubbock, Travis and Webb counties. Medical malpractice insurance in Texas is the least profitable for insurance companies, compared with the other top 15 states. Regarding the health maintenance organization industry in Texas, the Commissioner provided the following information: Since the 4th quarter of 1995, the Texas HMO industry has incurred losses. In the first two quarters of 2002, Texas HMOs posted profits once again. Single service HMOs continue to be profitable. Statutory requirements relating to minimum net worth, risk-based capital, and premium deficiency reserves have all helped the HMO industry bounce back in Texas by prohibiting financially questionable business practices as a method of gathering market share. Although we now compare favorably to other states in profitability, we still lag four to six quarters behind most other states. TDI practices aggressive monitoring of financial condition, and intervenes early when problems are detected to get companies on get well plan. Texas had a net gain of HMOs last year. TDI is monitoring companies for promptness in claims processing and takes appropriate action when necessary. Texas Association of Business Texas health care crisis is characterized by premium increases, unaffordable coverage, reduced availability, and the largest percentage of uninsured working citizens in the United States, according to Texas Association of Business (TAB) testimony and Texas Health Insurance Crisis, 2002 Report. In 2002, Texas employers are faced insurance premium increases averaging 25 percent compared to the national average of 15 percent. TAB said the rise in health care is driven by state coverage mandates, health care fraud, medical liability insurance rates, and pharmaceutical costs. In a national survey, of 300 surveyed companies, initial results indicate that business officials claim the cost of health care coverage has reached the point where it threatens the survival of their businesses. TAB fears if businesses are forced to choose between the livelihood of their 74
79 Senate Finance Subcommittee on Rising Medical Costs, January 2003 company and health coverage, the employees health care needs will be sacrificed. The number of small employers in Texas offering health insurance has dropped by 18 percent since TAB indicated that excessive legislative mandates and bureaucratic regulations contribute to the current crisis. Texas is one of only eight states with 40 or more health care mandates in statute. The majority of states have between 20 and 40 health care mandates. 23 TAB said these mandates restrict consumers ability to purchase affordable insurance customized to their needs, and health insurers shoulder the additional cost of providing mandated coverage that may or may not be needed by the entire insured population. TAB published a report outlining legislative solutions to address rising health care costs in Texas. That report can be found at Texas Hospital Association The Texas Hospital Association testimony centered on a survey conducted by the association in August This survey was sent to more than 400 of their member hospitals. They received 108 responses representing 125 hospitals, which account for approximately 50 percent of all the acute care hospital expenditures in Texas. The survey looked at two aspects of rising health care costs for hospitals - factors that caused a decline in revenue and factors that increase hospitals expenses. Declining Revenue The rising cost of the uninsured/charity care and changes in governmental reimbursement methodology (Medicare and Medicaid) have considerable impact on hospital revenue decline. Lack of prompt reimbursement from managed care prayers, changes in managed care requirements, declining investment earnings, and competition from other providers were identified as having a moderate impact on hospital revenue. Increasing Expenses Workforce shortage and professional liability coverage were identified as issues that increase hospital expenses. Issues that have a moderate impact on hospital expenses included changes in government reimbursement methodology (Medicare and Medicaid); increased capital requirements; administrative/regulatory compliance; increased supply costs due to newer technology; increased patient volume; and increased patient acuity. 22 TAB Texas Health Insurance Crisis, 2002 Report 23 Id. 75
80 Senate Finance Subcommittee on Rising Medical Costs, January 2003 Other Findings During the past three years, hospital expenses have increased approximately 26 percent. Some expense items grew dramatically. For example, contract labor for direct patient care increased 126 percent and professional liability insurance premiums increased 101 percent. Finally, almost 60 percent of responding hospitals believe financial conditions for their hospital will deteriorate this year. Some 25 percent believe their total margin will be significantly less this year than last year. Along with the association, the subcommittee invited a rural and an urban hospital to provide insight to the unique challenges they face. Mr. John Simms, CEO of Trinity Medical Center in Brenham, listed the following as cost drivers for his hospital: manpower shortage - this factor is specifically challenging for a rural provider where the labor pool is smaller than in an urban setting; professional liability insurance premiums; trauma and emergency medical services; administrative and regulatory compliance; and revenue factors, such as reduced governmental reimbursements. Ms. Sally Jeffcoat, President and CEO of CHRISTUS Health Gulf Coast, testified on behalf of urban hospitals. Ms. Jeffcoat listed the following cost drivers for her hospital: workforce shortage; contract staffing cost increases; supply costs; pharmaceutical costs professional liability premiums; employee health insurance; increase in voluntary free care; and revenue reductions due to governmental reimbursement changes. Texas Medical Association The Texas Medical Association testimony focused on an article, Why Are Health Care Costs Rising, prepared for the association by Laura Stevens and Teresa M. Waters, PhD. This article attributes the rising medical costs to: aging population - as the population ages, medical costs also rise because the aging population uses more services; advancements in medical technology - while valuable for increasing quality and length of life, technological advances come at a very high cost; rising pharmaceutical costs; 76
81 Senate Finance Subcommittee on Rising Medical Costs, January 2003 increasing consumerism - today s consumers are much more knowledgeable regarding health care, which can impact the amount of health care individuals require and expect; one-time savings of managed care companies - many cost reductions that occurred in the 1990's were only immediate savings, which did not address the systemic problems that may have existed; and cyclical nature of hospital and physician pricing. Texas Association of Health Plans Gary Goldstein, MD, CEO Humana Central Texas, testified on behalf of the Texas Association of Health Plans. Dr. Goldstein identified cost drivers as legislative mandates, medical liability insurance premiums and fraud. Further, he testified that medical costs are increasing faster than inflation due to expanded coverage; technological advances; pharmacy costs; HMOs are not managing costs; and a lack of true market based competition. In order to remain competitive, insurance companies need to cover administrative costs and other overhead and profit. These cost drivers combined create a cost growth greater than inflation, and limits insurance companies ability to offer an affordable product. Pharmaceutical Research and Manufacturers of America (PhRMA) At the request of the subcommittee, PhRMA provided testimony regarding the role of pharmaceuticals in rising medical costs. Testifying on behalf of PhRMA was Eugene Kolassa, Associate Professor, Department of Pharmacy, University of Mississippi, Merrill Mathews, Visiting Scholar, Institute for Policy Innovation, and Thomas Hardaway, Director of State Affairs, Pharmaceutical Research and Manufacturers of America (PhRMA) PhRMA provided the following testimony: The 2001 and 2002 reports by Families USA entitled Off the Chart: Pay, Profits and Spending by Drug Companies and Profiting from Pain: Where Prescription Drug Dollars Go are factually challenged and predicated on the belief that for-profit businesses should not be involved in the development or sale of pharmaceutical products. Pharmaceuticals are priced based on value brought to the market place. Today, new pharmaceuticals typically are replacing older drugs and therapies, and usually result in overall healthcare cost savings. Generally, medical costs have increased because people are living longer and dying of more costly ailments. Had pharmaceuticals been less available, overall costs would have risen faster. The state can look to save money by limiting pharmaceutical spending, but it will end up spending it elsewhere like on hospitals and nursing homes. 77
82 Senate Finance Subcommittee on Rising Medical Costs, January 2003 For low income populations, the state should look to encourage the most cost effective and least invasive treatments. Open access to all pharmaceuticals (including both generics and brands) is best way to accomplish this. Restricted formularies typically don t save money, but end up costing more. Of the 14.7 percent increase in spending on pharmaceuticals nationwide, 8.7 percent was the result of higher utilization. In 2000, pharmaceutical companies spent on average $964 million on research and development for every newly approved drug. For most companies, research and development spending exceeds combined expenditures on marketing and providing free samples. PhRMA lawsuit against Florida, Michigan, and Maine is based on claim that states formularies violate federal law requiring access to all company products for those who agree to provide a 15 percent rebate on prescription drug prices or offer their best price. Although not opposed to all preferred drug lists, utilization review, disease management, and case management are better ways to control costs. State should consider tapping institutions of higher education to engage in academic detailing wherein graduate level pharmacy students identify and consult with doctors whose prescribing patterns deviate from clinical pathways. Differences in drug prices between the USA, Canada and Mexico are largely attributable to variances in the value the US dollar relative to local currencies. In addition, both the Mexican and Canadian governments are more involved in negotiating prices. Publication of best prices is difficult because that amount is not typically calculated until after rebates have been applied. In addition, best prices change from quarter to quarter. Genentech, Inc. At the request of the committee, Genentech, Inc., provided testimony regarding ideas on how that state could control some of its rising pharmaceutical costs. Testifying on behalf of Genentech was Todd Kaufman, Director of State Government Affairs. Genentech provided the following testimony: Most appropriate way to control prescription drug costs within the state s budget is through a single preferred drug list. Restrictive formularies can be enhanced through the use of supplemental rebates charged to manufacturers who want to have one or more of their products included on the formulary. Value added programs, where companies agree to provide disease management programs that generate guaranteed savings (ie. if the level of savings promised is not generated, the company pays the difference), have also proven successful in helping control cost. 78
83 Senate Finance Subcommittee on Rising Medical Costs, January 2003 Prior authorization can also be a valuable tool, but should adhere to four main principals: 1.) decision making process must be prompt; 2.) decisions must be driven by medical need; 3.) there must be a fair and open appeals process; and 4.) there should be a minimum burden to providers Florida is probably the state to look to for direction on how best to structure some of these concepts. 79
84
85

86
87
88
89
90
91

92

93
94
95
96
97
98
99

100
101
102
103
104
105
106
107
108
109
110

111
112
113
114
115
116
117
118
119
120
121
122
123

124
DEFICIT REDUCTION ACT OF 2005: IMPLICATIONS FOR MEDICAID PREMIUMS AND COST SHARING CHANGES
 February 2006 DEFICIT REDUCTION ACT OF 2005: IMPLICATIONS FOR MEDICAID On February 8, 2006 the President signed the Deficit Reduction Act of 2005 (DRA). The Act is expected to generate $39 billion in federal
MEDICAID AND BUDGET RECONCILIATION: IMPLICATIONS OF THE CONFERENCE REPORT
 Updated January 2006 MEDICAID AND BUDGET RECONCILIATION: IMPLICATIONS OF THE CONFERENCE REPORT In compliance with the budget resolution that passed in April 2005, the House and Senate both passed budget
Nevada Department of Health and Human Services and the Division of Health Care Financing and Policy Medicaid Opt Out White Paper January 22, 2010
 Nevada Department of Health and Human Services and the Division of Health Care Financing and Policy Medicaid Opt Out White Paper January 22, 2010 Page 1 of 23 1/27/2010 OPTING OUT OF MEDICAID The national
Medicaid Benefits for Children and Adults: Issues Raised by the National Governors Association s Preliminary Recommendations
 Medicaid Benefits for Children and Adults: Issues Raised by the National Governors Association s Preliminary Recommendations July 12, 2005 Cindy Mann Overview The Medicaid benefit package determines which
Texas Medicaid Program
 Texas Medicaid Program Overview and Funding Legislative Budget Board Presented to the House Committee on Appropriations Medicaid Overview and History Joint State/Federal program that provides insurance
Medicaid Managed Care in Texas
 Medicaid Managed Care in Texas PRESENTED TO HOUSE COMMITTEES ON GENERAL INVESTIGATIONS AND ETHICS AND APPROPRIATIONS SUBCOMMITTEE ON ARTICLE II LEGISLATIVE BUDGET BOARD STAFF JUNE 2018 Statement of Interim
Florida Medicaid Prescribed Drug Service Spending Control Initiatives. For the Quarter April 1, 2016 through June 30, 2016
 Florida Medicaid Prescribed Drug Service Spending Control Initiatives For the Quarter April 1, through June 30, Report to the Florida Legislature December 2017 [This page intentionally left blank.] Table
Chapter 4 Medicaid Clients
 Chapter 4 Medicaid Clients Medicaid covers diverse client groups. The Medicaid caseload is always changing because of economic and other factors discussed in this chapter. Who Is Covered in Texas Medicaid
State Responses to Budget Crises in 2004: Michigan John Holahan
 THE URBAN INSTITUTE State Responses to Budget Crises in 2004: Michigan John Holahan February 2004 Background Michigan is a large, industrial, heavily unionized state that has historically provided a generous
uninsured Moving Ahead Amid Fiscal Challenges: A Look at Medicaid Spending, Coverage and Policy Trends
 kaiser commission on medicaid and the uninsured Moving Ahead Amid Fiscal Challenges: A Look at Medicaid Spending, Coverage and Policy Trends Results from a 50-State Medicaid Budget Survey for State Fiscal
Florida Medicaid Prescribed Drug Service Spending Control Initiatives. For the Quarter October 1, 2017 through December 31, 2017
 Florida Medicaid Prescribed Drug Service Spending Control Initiatives For the Quarter October 1, through December 31, Report to the Florida Legislature September 2018 [This page intentionally left blank.]
Florida Medicaid Prescribed Drug Service Spending Control Initiatives. For the Quarter July 1, 2016 through September 30, 2016
 Florida Medicaid Prescribed Drug Service Spending Control Initiatives For the Quarter July 1, through September 30, Report to the Florida Legislature March 2018 [This page intentionally left blank.] Table
Florida Medicaid Prescribed Drug Service Spending Control Initiatives
 Florida Medicaid Prescribed Drug Service Spending Control Initiatives For the Quarters January 1, through March 31, and April 1, through June 30, Report to the Florida Legislature April 2018 [This page
Comparison of House & Senate Health Reform Bills
 AFL CIO Backgrounder 1.06.10 Comparison of House & Senate Health Reform Bills Senate passage of a badly flawed version of health reform legislation on Christmas Eve completed an historic year in Congress
Health Insurance Flexibility and Accountability Initiative: Opportunities and Issues for States
 Issue Brief A National Initiative of The Robert Wood Johnson Foundation August 2002 Volume III, No.2 Health Insurance Flexibility and Accountability Initiative: Opportunities and Issues for States By Gretchen
uninsured Medicaid Today; Preparing for Tomorrow A Look at State Medicaid Program Spending, Enrollment and Policy Trends
 kaiser commission on medicaid and the uninsured Medicaid Today; Preparing for Tomorrow A Look at State Medicaid Program Spending, Enrollment and Policy Trends Results from a 50-State Medicaid Budget Survey
kaiser medicaid and the uninsured Short Term Options For Medicaid in a Recession commission on O L I C Y December 2008
 P O L I C Y B R I E F kaiser commission on medicaid and the uninsured Short Term Options For Medicaid in a Recession December 2008 Reports recently confirmed that the country is in the midst of a recession.
Here are some highlights of the revised Senate language released July 13:
 The Better Care Reconciliation Act of 2017, Version 2.0 July 17, 2017 On July 13, Senate Republican leaders released a second working draft of the Senate version of H.R. 1628, the American Health Care
CRS Report for Congress Received through the CRS Web
 Order Code RL30718 CRS Report for Congress Received through the CRS Web Medicaid, SCHIP, and Other Health Provisions in H.R. 5661: Medicare, Medicaid, and SCHIP Benefits Improvement and Protection Act
Affordable Care Act Repeal and Replacement Legislation
 Affordable Care Act Repeal and Replacement Legislation Timeline/ Actions to Date In February 2017, draft legislation aimed at repealing and replacing the Affordable Care Act (ACA), or Obamacare, was informally
U.S. Senate Finance Committee Coverage Policy Options Detailed Section by Section Summary May 18, 2009
 U.S. Senate Finance Committee Coverage Policy Options Detailed Section by Section Summary May 18, 2009 This document outlines the 61-page report, Expanding Health Care Coverage: Proposals to Provide Affordable
kaiser medicaid uninsured commission on State Responses to Budget Crisis in 2004: An Overview of Ten States Case Study - Michigan
 kaiser commission on medicaid and the uninsured State Responses to Budget Crisis in 2004: An Overview of Ten States Case Study - Michigan Prepared by John Holahan, Randall R. Bovbjerg, Terri Coughlin,
Medicaid Spending: A Brief History
 Medicaid Spending: A Brief History John D. Klemm, Ph.D. Medicaid spending growth has varied greatly over time. This article uses financial and statistical data to trace the history of Medicaid spending
Republican Senators Unveil New ACA Repeal and Replace Legislation
 September 14, 2017 Republican Senators Unveil New ACA Repeal and Replace Legislation Sens. Lindsey Graham (R-SC), Bill Cassidy (R-LA), Dean Heller (R-NV) and Ron Johnson (R-WI) Sept. 13 unveiled a health
State HIFA Waiver Plans
 Waiver Plans State Arizona Yes Approved 12/12/01 Effective dates: 11/1/01 and 10/1/02 California Yes Approved 1/29/02 Expansion: Extend coverage to parents with incomes between 100% and 200% FPL; non-parents
AN ANALYSIS OF TITLE II ROLE OF PUBLIC PROGRAMS
 AN ANALYSIS OF TITLE II ROLE OF PUBLIC PROGRAMS Summaries of Key Provisions in the Patient Protection and Affordable Care Act (HR 3590) as amended by the Health Care and Education Reconciliation Act of
Containing State Health Care Spending While Improving Outcomes
 Containing State Health Care Spending While Improving Outcomes THE THRIVE WASHINGTON PROJECT The Great Recession dramatically changed fiscal conditions in Washington state, possibly forever. The impact
Medicaid Prescribed Drug Program Spending Control Initiatives. For the Quarter April 1, 2014 through June 30, 2014
 Medicaid Prescribed Drug Program Spending Control Initiatives For the Quarter April 1, 2014 through June 30, 2014 Report to the Florida Legislature January 2015 Table of Contents Purpose of Report... 1
Appendix B. Medicaid and the State Children s Health Insurance Program in Texas: History, Current Arrangements, and Options
 Appendix B Medicaid and the State Children s Health Insurance Program in Texas: History, Current Arrangements, and Options David C. Warner, Lauren R. Jahnke, and Kristie Kimbell Appendix B Medicaid and
CRS Report for Congress
 Order Code RS21054 Updated March 5, 2004 CRS Report for Congress Received through the CRS Web Summary Medicaid and SCHIP Section 1115 Research and Demonstration Waivers Evelyne P. Baumrucker Analyst in
Medicaid Prescribed Drug Program. Spending Control Initiatives
 Medicaid Prescribed Drug Program Spending Control Initiatives For Quarters Ended March 31, 2011 and June 30, 2011 Table of Contents Purpose of Report... 1 Executive Summary... 2 Pharmacy Appropriations
Texas Vendor Drug Program. Drug Addition Process. Effective Date. December 2017
 Texas Vendor Drug Program Drug Addition Process Effective Date December 2017 This is a working document to provide a resource to interested internal and external stakeholders. Questions or comments regarding
Health Savings Account Pilot Report: Cost-Effectiveness and Feasibility Analysis
 Health Savings Account Pilot Report: Cost-Effectiveness and Feasibility Analysis Prepared by the Texas Health and Human Services Commission May 2008 TABLE OF CONTENTS Executive Summary... 1 State and Federal
Medicaid Prescribed Drug Program. Spending Control Initiatives
 Medicaid Prescribed Drug Program Spending Control Initiatives For Quarters Ended September 30, December 31, Table of Contents Purpose of Report... 1 Executive Summary... 2 Pharmacy Appropriations and Spending
HEALTH COVERAGE FOR LOW-INCOME POPULATIONS: A COMPARISON OF MEDICAID AND SCHIP
 April 2006 HEALTH COVERAGE FOR LOW-INCOME POPULATIONS: A COMPARISON OF MEDICAID AND SCHIP is often compared to the State Children s Health Insurance Program (SCHIP) because both programs provide health
Figure 1. Medicaid Status of Medicare Beneficiaries, Partial Dual Eligibles (1.0 Million) 3% 15% 83% Medicare Beneficiaries = 38.
 3% 15% 83% Medicare Beneficiaries = 38.") I S S U E P A P E R kaiser commission on medicaid and the uninsured September 2003 A Prescription Drug Benefit in Medicare: Implications for Medicaid and Low- Income Medicare Beneficiaries A prescription
I S S U E P A P E R kaiser commission on medicaid and the uninsured September 2003 A Prescription Drug Benefit in Medicare: Implications for Medicaid and Low- Income Medicare Beneficiaries A prescription
SENATE COMMITTEE ON FINANCE AND ASSEMBLY COMMITTEE ON WAYS AND MEANS JOINT SUBCOMMITTEE ON HUMAN SERVICES CLOSING REPORT
 SENATE COMMITTEE ON FINANCE AND ASSEMBLY COMMITTEE ON WAYS AND MEANS JOINT SUBCOMMITTEE ON HUMAN SERVICES CLOSING REPORT DEPARTMENT OF HEALTH AND HUMAN SERVICES DIRECTOR S OFFICE AND DIVISION OF HEALTH
Proposed Changes to Medicare in the Path to Prosperity Overview and Key Questions
 Proposed Changes to Medicare in the Path to Prosperity Overview and Key Questions APRIL 2011 On April 5, 2011, Representative Paul Ryan (R-WI), chairman of the House Budget Committee, released a budget
Medicaid s Future. National PACE Association Spring Policy Forum. MaryBeth Musumeci
 Medicaid s Future National PACE Association Spring Policy Forum MaryBeth Musumeci March 20, 2017 Figure 2 The basic foundations of Medicaid are related to the entitlement and the federal-state partnership.
Medicaid Spending Growth in the Great Recession and Its Aftermath, FY
 Medicaid Spending Growth in the Great Recession and Its Aftermath, FY 2007-2012 Katherine Young, Lisa Clemans-Cope, Emily Lawton, and John Holahan The 2007 to 2012 period encompasses one of the worst economic
Health Insurance Glossary of Terms
 1 Health Insurance Glossary of Terms On March 23, 2010, President Obama signed the Patient Protection and Affordable Care Act (PPACA) into law. When making decisions about health coverage, consumers should
The Fiscal Year 2012 Budget: General Appropriations Act (GAA) After the Governor s Vetoes
 After the Governor s Vetoes") Budget Brief August 2011 The Fiscal Year 2012 Budget: General Appropriations Act (GAA) After the Governor s Vetoes On July 1, 2011, the legislative Conference Committee released its Fiscal Year 2012 ()
Budget Brief August 2011 The Fiscal Year 2012 Budget: General Appropriations Act (GAA) After the Governor s Vetoes On July 1, 2011, the legislative Conference Committee released its Fiscal Year 2012 ()
Many states entered FY 2005 faced with a mix of good and bad. A National Challenge: How States Try to Control Medicaid Costs and Why It Is So Hard*
 A National Challenge: How States Try to Control Medicaid Costs and Why It Is So Hard* Vernon K. Smith, Jr. Principal, Health Management Associates Abstract: The challenge of controlling Medicaid costs
Summary of Healthy Indiana Plan: Key Facts and Issues
 Summary of Healthy Indiana Plan: Key Facts and Issues June 2008 Why it is of Interest: On January 1, 2008, Indiana began enrolling adults in its new Healthy Indiana Plan. The plan is the first that allows
Arizona Health Care Cost Containment System (AHCCCS) Summary
 Summary") AHCCCS Update 1 Arizona Health Care Cost Containment System (AHCCCS) Summary AHCCCS model has been documented to provide higher quality coverage at lower cost AHCCCS has had to administer significant reductions
AHCCCS Update 1 Arizona Health Care Cost Containment System (AHCCCS) Summary AHCCCS model has been documented to provide higher quality coverage at lower cost AHCCCS has had to administer significant reductions
Part D: The New Medicare Prescription Drug Law Implications for Medicaid
 Part D: The New Medicare Prescription Drug Law Implications for Medicaid Vernon K. Smith, Ph.D. HEALTH MANAGEMENT ASSOCIATES For State Coverage Initiatives National Meeting Washington, D.C. February 4,
STATE OF NEVADA DEPARTMENT OF HEALTH AND HUMAN SERVICES DIVISION OF HEALTH CARE FINANCING AND POLICY
 STATE OF NEVADA DEPARTMENT OF HEALTH AND HUMAN SERVICES DIVISION OF HEALTH CARE FINANCING AND POLICY AUDIT REPORT Table of Contents Page Executive Summary... 1 Introduction... 7 Background... 7 Scope and
Health Reform HEALTH REFORM IMPLEMENTATION TIMELINE
 on Health Reform HEALTH REFORM IMPLEMENTATION TIMELINE On March 23, 2010, President Obama signed comprehensive health reform, the Patient Protection and Affordable Care Act, into law. The following timeline
KEEPING PRESCRIPTION DRUGS AFFORDABLE: The Value of Pharmacy Benefit Managers (PBMs)
") The Texas Association of Health Plans Representing health insurers, health maintenance organizations, and other related health care entities operating in Texas. KEEPING PRESCRIPTION DRUGS AFFORDABLE: The
The Texas Association of Health Plans Representing health insurers, health maintenance organizations, and other related health care entities operating in Texas. KEEPING PRESCRIPTION DRUGS AFFORDABLE: The
REPORT OF THE COUNCIL ON MEDICAL SERVICE. (J. Leonard Lichtenfeld, MD, Chair)
") REPORT OF THE COUNCIL ON MEDICAL SERVICE CMS Report -A-0 Subject: Presented by: Referred to: Appropriate Hospital Charges David O. Barbe, MD, Chair Reference Committee G (J. Leonard Lichtenfeld, MD, Chair)
REPORT OF THE COUNCIL ON MEDICAL SERVICE CMS Report -A-0 Subject: Presented by: Referred to: Appropriate Hospital Charges David O. Barbe, MD, Chair Reference Committee G (J. Leonard Lichtenfeld, MD, Chair)
State Health Care Reform in 2006
 January 2007 Issue Brief State Health Care Reform in 2006 Fast Facts Since the mid-1970 s state governments have experimented with a wide variety of initiatives to expand access to health care for the
Key Medicaid, CHIP, and Low-Income Provisions in the Senate Bill Patient Protection and Affordable Care Act (Released November 18, 2009)
") Key Medicaid, CHIP, and Low-Income Provisions in the Senate Bill Patient Protection and Affordable Care Act (Released November 18, 2009) On November 18, 2009, the Senate released its health care reform
Key Medicaid, CHIP, and Low-Income Provisions in the Senate Bill Patient Protection and Affordable Care Act (Released November 18, 2009) On November 18, 2009, the Senate released its health care reform
Update on the Affordable Care Act. Kevin Shah, MD MBA. Review major elements of the affordable care act
 Update on the Affordable Care Act Kevin Shah, MD MBA 1 Goals Review major elements of the affordable care act Review implementation of the Individual Exchange Review the Medicaid expansion Discuss current
Presentation to the Actuaries Club of the Southwest
 Presentation to the Actuaries Club of the Southwest Texas Medicaid Overview and Reform David Palmer, Chief Actuary June 8, 2007 1 HHS Organization Governor Health & Human Services Council Health and Human
Medicaid Spending Growth over the Last Decade and the Great Recession, by John Holahan, Lisa Clemans-Cope, Emily Lawton, and David Rousseau
 I S S U E kaiser commission on medicaid and the uninsured February 2011 P A P E R Medicaid Spending Growth over the Last Decade and the Great Recession, 2000-2009 by John Holahan, Lisa Clemans-Cope, Emily
FAMILY COVERAGE MATTERS
 Georgetown University Health Policy Institute FAMILY COVERAGE MATTERS Policy Brief Revised February 2005 The President s Proposals for Medicaid and SCHIP: How Would They Affect Children s Health Care Coverage?
COLORADO DEPARTMENT OF HEALTH CARE POLICY AND FINANCING - FY BUDGET REQUEST. Page G.12-1
 Page G.12-1 SELECT ONE (click on box): Decision Item Base Reduction Item Supplemental Request Criterion: Budget Request Amendment Criterion: CHANGE REQUEST for FY 06-07 EFFICIENCY AND EFFECTIVENESS ANALYSIS
ACA in Brief 2/18/2014. It Takes Three Branches... Overview of the Affordable Care Act. Health Insurance Coverage, USA, % 16% 55% 15% 10%
 Health Insurance Coverage, USA, 2011 16% Uninsured Overview of the Affordable Care Act 55% 16% Medicaid Medicare Private Non-Group Philip R. Lee Institute for Health Policy Studies Janet Coffman, MPP,
Health Insurance Terms You Need To Know
 From [C_Officialname] Health Insurance Terms You Need To Know The health care system in the United States can be confusing. In order to get the most out of your health care benefits, you need to understand
JBC staffer, Eric Kurtz, provided an overview of the HCPF budget, noting a few key points and tables/charts:
 Joint Budget Committee Briefing for Department of Health Care Policy and Financing December 8, 2015 Prepared by Jennifer Miles, Miles Consulting: jennifer@milesgovtrelations.com The JBC staff for HCPF
An Overview of the Kentucky Medicaid Program and Discussion of the Federal Medicaid Landscape
 An Overview of the Kentucky Medicaid Program and Discussion of the Federal Medicaid Landscape Prepared For: The Foundation for a Healthy Kentucky By: HEALTH MANAGEMENT ASSOCIATES September 2005 180 North
We applied the following methodology and assumptions changes to our original estimates:
 333 Clay Street Suite 4330 Houston, TX 77002 USA Tel +1 713 658 8451 Fax +1 713 658 9656 April 1, 2013 milliman.com Ms. Barbara Maxwell Deputy Director Texas Association of Health Plans 1001 Congress Avenue,
kaiser medicaid a n d t h e uninsured commission o n Premiums and Cost-Sharing in Medicaid February 2013
 P O L I C Y B R I E F kaiser commission o n medicaid a n d t h e uninsured Premiums and Cost-Sharing in Medicaid February 2013 Executive Summary Medicaid, the nation s public health insurance program for
The Center for Children and Families
 The Center for Children and Families March 2006 by Jocelyn Guyer, Cindy Mann and Joan Alker THE DEFICIT REDUCTION ACT: A Review of Key Medicaid Provisions Affecting Children and Families The Deficit Reduction
820 First Street, NE, Suite 510, Washington, DC Tel: Fax:
 820 First Street, NE, Suite 510, Washington, DC 20002 Tel: 202-408-1080 Fax: 202-408-1056 center@cbpp.org www.cbpp.org November 10, 2003 FUNDING HEALTH COVERAGE FOR LOW-INCOME CHILDREN IN WASHINGTON Summary
In This Issue (click to jump):
:") May 7, 2014 In This Issue (click to jump): Analysis of Trends in Health Spending 2013 2014 Spotlight on Medicare Advantage Enrollment Oncology Drug Trend Report S&P Predicts Shift from Job-Based Coverage
May 7, 2014 In This Issue (click to jump): Analysis of Trends in Health Spending 2013 2014 Spotlight on Medicare Advantage Enrollment Oncology Drug Trend Report S&P Predicts Shift from Job-Based Coverage
Medicare Payment Advisory Commission (MedPAC) January Meeting Summary
 January Meeting Summary") Medicare Payment Advisory Commission (MedPAC) January Meeting Summary The Medicare Payment Advisory Commission (MedPAC) is an independent Congressional agency established by the Balanced Budget Act of
Medicare Payment Advisory Commission (MedPAC) January Meeting Summary The Medicare Payment Advisory Commission (MedPAC) is an independent Congressional agency established by the Balanced Budget Act of
ABC s of The State Children s Health Insurance Program (SCHIP) Joy Johnson Wilson NCSL Health Policy Director
 Joy Johnson Wilson NCSL Health Policy Director") ABC s of The State Children s Health Insurance Program (SCHIP) Joy Johnson Wilson NCSL Health Policy Director The A,B,C s --- What is SCHIP? The State Children s Health Insurance Program (SCHIP), designed
ABC s of The State Children s Health Insurance Program (SCHIP) Joy Johnson Wilson NCSL Health Policy Director The A,B,C s --- What is SCHIP? The State Children s Health Insurance Program (SCHIP), designed
REPORT OF THE COUNCIL ON MEDICAL SERVICE. Effects of the Massachusetts Reform Effort and the Individual Mandate
 REPORT OF THE COUNCIL ON MEDICAL SERVICE CMS Report -A-0 Subject: Presented by: Effects of the Massachusetts Reform Effort and the Individual Mandate David O. Barbe, MD, Chair 0 0 0 At the 00 Interim Meeting,
CRS Report for Congress
 Order Code RS22447 May 26, 2006 CRS Report for Congress Received through the CRS Web The Massachusetts Health Reform Plan: A Brief Overview Summary April Grady Analyst in Social Legislation Domestic Social
Kansas Legislator Briefing Book 2017
 K a n s a s L e g i s l a t i v e R e s e a r c h D e p a r t m e n t Kansas Legislator Briefing Book 2017 E-1 Kansas Health Insurance Mandates E-2 Payday Loan Regulation Financial Institutions and Insurance
Health Reform Implementation Timeline
 July 3, 2010 To All NRLN Grassroots Network Members: The volume of information we read and hear and the various ways in which political parties, individual politicians and self-interest groups characterize
Teaching Medicaid: A Tool for Health Law Teachers (2004 Update)
") Teaching Medicaid: A Tool for Health Law Teachers (2004 Update) Prepared for the 2004 Health Law Teachers Conference (available electronically at http://www.gwhealthpolicy.org/news.htm) Sara Rosenbaum
Teaching Medicaid: A Tool for Health Law Teachers (2004 Update) Prepared for the 2004 Health Law Teachers Conference (available electronically at http://www.gwhealthpolicy.org/news.htm) Sara Rosenbaum
Health and Human Services Subcommittee Fiscal Year Budget Highlights
 Fiscal Research Division Health and Human Services Health and Human Services Subcommittee 2014-15 Fiscal Year Budget Highlights Fiscal Brief October 9, 2014 The North Carolina General Assembly House and
Summary of Legislative Budget Estimates Biennium HOUSE SUBMITTED TO THE 84TH TEXAS LEGISLATURE
 LEGISLATIVE BUDGET BOARD Summary of Legislative Budget Estimates 2016 17 Biennium HOUSE SUBMITTED TO THE 84TH TEXAS LEGISLATURE JANUARY 2015 Summary of Legislative Budget Estimates 2016 17 Biennium House
HUSKY: Importance to the State
 33 Whitney Avenue New Haven, CT 06510 Voice: 203-498-4240 Fax: 203-498-4242 53 Oak Street, Suite 15 Hartford, CT 06106 Voice: 860-548-1661 Fax: 860-548-1783 www.ctkidslink.org Remarks by Sharon D. Langer,
Section 5. Trends in Public Health Insurance Programs
 Section 5 Trends in Public Health Insurance Programs Medicaid Enrollment Medicaid is the nation s major public health insurance program for low-income Americans. The program is administered by each state
IS MISSOURI S MEDICAID PROGRAM OUT-OF-STEP AND INEFFICIENT? by Leighton Ku and Judith Solomon
 820 First Street, NE, Suite 510, Washington, DC 20002 Tel: 202-408-1080 Fax: 202-408-1056 center@cbpp.org www.cbpp.org Revised April 5, 2005 IS MISSOURI S MEDICAID PROGRAM OUT-OF-STEP AND INEFFICIENT?
Public Employees Benefits Program Legislative Session Bill Tracking Updated: 3/27/2017
 Public Employees Benefits Program Legislative Session Bill Tracking Updated: 3/27/2017 Bill Number & Description Impact to PEBP & Bill Status AB249 (BDR 38-858) Requires the State Plan for Medicaid and
State Responses to Budget Crises in 2004: New York Teresa A. Coughlin
 THE URBAN INSTITUTE State Responses to Budget Crises in 2004: New York Teresa A. Coughlin February 2004 Background Prior to the September 11, 2001 terrorist attacks, New York s financial situation was
Statewide Medicaid Managed Care
 Statewide Medicaid Managed Care Justin M. Senior Deputy Secretary for Medicaid Agency for Health Care Administration Senate Health Policy Committee March 4, 2015 As requested by the Committee, this presentation
National Healthcare Reform Patient Protection and Affordable Care Act (HR 3590) & The Health Care and Education Reconciliation Act (HR 4872)
 & The Health Care and Education Reconciliation Act (HR 4872)") National Healthcare Reform Patient Protection and Affordable Care Act (HR 3590) & The Health Care and Education Reconciliation Act (HR 4872) Medicaid/ CHIP Expanded to all individuals (under 65) with incomes
National Healthcare Reform Patient Protection and Affordable Care Act (HR 3590) & The Health Care and Education Reconciliation Act (HR 4872) Medicaid/ CHIP Expanded to all individuals (under 65) with incomes
Health Reform Summary March 23, 2010
 Health Reform Summary March 23, 2010 On Sunday March 21, 2010 the U.S. House of Representatives passed H.R. 3590, The Patient Protection and Affordable Care Act, by a vote of 219 to 212. The Senate passed
Medicaid s High Cost Enrollees: How Much Do They Drive Program Spending?
 Medicaid s High Cost Enrollees: How Much Do They Drive Program? By Anna Sommers and Mindy Cohen March 2006 Overview Achieving cost savings in the Medicaid program has become increasingly important to federal
Health Care Reform: Chapter Three. The U.S. Senate and America s Healthy Future Act
 Health Care Reform: Chapter Three The U.S. Senate and America s Healthy Future Act SECA Policy Brief Initial Publication September 2009 Updated October 2009 2 The Senate Finance Committee Chairman Introduces
Provision Description Implementation Date Establishing a Patient Centered Outcomes Research Institute Excluding from Income Health Benefits Provided
 Establishing a Patient Centered Outcomes Research Institute Excluding from Income Health Benefits Provided by Indian Tribal Governments Non Profit Hospitals Cracking Down on Health Care Fraud Ensuring
Table of Contents. Texas Vendor Drug Program Overview Requirements Envolve Communication Notices...
 Superior HealthPlan Table of Contents Texas Vendor Drug Program Overview 5 Requirements 6 Envolve Communication Notices.... 7-11 Superior HealthPlan Overview..14-23 Benefit Design.. 24 Envolve Pharmacy
Summary of the California Enacted Budget: Impact on Older Adults and People with Disabilities
 Summary of the California 2011-12 Enacted Budget: Impact on Older Adults and People with Disabilities On June 30, 2011, California Governor Jerry Brown signed the 2011-12 budget. The enacted budget includes
Graham-Cassidy Section by Section
 1 Graham-Cassidy Section by Section Title I Section 101: Recapture of Excess Advance Premiums Tax Credits Would not apply IRC Section 36B(f)(2)(B), relating to limits on the excess amounts to be repaid
TWELVE-MONTH CHILDREN S MEDICAID: THE RIGHT STEP FOR TEXAS NEEDIEST CHILDREN
 March 18, 2009 Contact: Name, dunkelberg@cppp.org No. 09-376 TWELVE-MONTH CHILDREN S MEDICAID: THE RIGHT STEP FOR TEXAS NEEDIEST CHILDREN Long-Term Costs Due to Leaving Kids Uninsured Outweigh Short-Term
An Evaluation of the Impact of Medicaid Expansion in New Hampshire
 An Evaluation of the Impact of Medicaid Expansion in New Hampshire Phase I Report Prepared by: The Lewin Group November 2012 This report is funded by Health Strategies of New Hampshire, an operating foundation
What about My Health Insurance If I Leave Work and Go Onto Disability?
 What about My Health Insurance If I Leave Work and Go Onto Disability? You are contemplating leaving work to apply for long-term disability benefits because your health has been worsening. You are worried,
WikiLeaks Document Release
 WikiLeaks Document Release February 2, 2009 Congressional Research Service Report RS21071 Medicaid Expenditures, FY2003 and FY2004 Karen Tritz, Domestic Social Policy Division January 17, 2006 Abstract.
THE FACTS ON MEDICAID COPAYMENTS Considerations for Arkansas
 THE FACTS ON MEDICAID COPAYMENTS Considerations for Arkansas 35 years February 2013 THE FACTS ON MEDICAID COPAYMENTS Considerations for Arkansas EXECUTIVE SUMMARY If Arkansas extends Medicaid to 250,000
OVERVIEW OF THE MEDICAID DISPROPORTIONATE SHARE HOSPITAL (DSH) PROGRAM
 PROGRAM") OVERVIEW OF THE MEDICAID DISPROPORTIONATE SHARE HOSPITAL (DSH) PROGRAM Prepared by the Legislative Budget Board Staff for the House Select Committee on State Health Care Expenditures February 11, 2004
OVERVIEW OF THE MEDICAID DISPROPORTIONATE SHARE HOSPITAL (DSH) PROGRAM Prepared by the Legislative Budget Board Staff for the House Select Committee on State Health Care Expenditures February 11, 2004
Budget Brief August 2012
 Budget Brief August 2012 and Health Reform Funding in the General Appropriations Act On June 28, 2012, the legislative Conference Committee charged with reconciling the House and Senate budget proposals
TRS UPDATE /13/12
 TRS UPDATE 2012 12/13/12 Topics for Discussion Status of the TRS Fund Legislation from 82 nd Session Interim studies TRS-Care Sustainability Pension Plan Design What s Next? Upcoming Legislative Session
The Florida Legislature
 The Florida Legislature OFFICE OF PROGRAM POLICY ANALYSIS AND GOVERNMENT ACCOUNTABILITY RESEARCH MEMORANDUM Feasibility of Consolidating Statewide Pharmaceutical Services Summary As directed by Ch. 2009-15,
HOW THE BIPARTISAN CHIP REAUTHORIZATION ACT OF 2007 HELPS TEXAS AND HOW THE MCCONNELL-LOTT-CORNYN ALTERNATIVE HURTS TEXAS
 HOW THE BIPARTISAN CHIP REAUTHORIZATION ACT OF 2007 HELPS TEXAS AND HOW THE MCCONNELL-LOTT-CORNYN ALTERNATIVE HURTS TEXAS On October 18, Congress will vote on whether to override the President s veto of
ATTACHMENT I SCOPE OF SERVICES FEE-FOR-SERVICE PROVIDER SERVICE NETWORKS
 ATTACHMENT I SCOPE OF SERVICES FEE-FOR-SERVICE PROVIDER SERVICE NETWORKS A. Plan Type The Vendor (Health Plan) is approved to provide contracted services as the following health plan type as denoted by