Comprehensive Annual Financial Report
|
|
|
- Shawn Floyd
- 6 years ago
- Views:
Transcription

1


2 Green Roofs


3 2014 Comprehensive Annual Financial Report For the Years Ended December 31, 2014 and 2013 Date of Incorporation Reorganized April 26, 1982 pursuant to Chapter 282, Laws of Wisconsin 1981 Finance Staff Mark T. Kaminski, Director of Finance/Treasurer, CPA 01
4 Table of Contents I. Introductory Section Reference Exhibit Page Commission Organization Chart 4 Commissioners of the MMSD Letter from the MMSD Chair 6 District Map 7 Letter of Transmittal 8-11 GFOA Certificate of Achievement 12 II. Financial Section Independent Auditors' Report Management s Discussion and Analysis Basic Financial Statements Statements of Net Position, December 31, 2014 and 2013 A Statements of Revenues, Expenses, and Changes in Net Position, years ended December 31, 2014 and 2013 A-2 22 Statements of Cash Flows, years ended December 31, 2014 and 2013 A-3 23 Notes to Financial Statements December 31, 2014 and Required Supplementary Information 30 III. Statistical Section Net Position by Components, for the fiscal years ended December 31, 2005 through 2014 B Change in Net Position, for the fiscal years ended December 31, 2005 through 2014 B-2 34 Operating Revenue by Source, for the fiscal years ended December 31, 2005 through 2014 B-3 35 Operating Expenses, for the fiscal years ended December 31, 2005 through 2014 B-4 36 Nonoperating Revenue and Expenses, for the fiscal years ended December 31, 2005 through 2014 B-5 37 Reference Exhibit Page User Charge Revenue by Municipality Within the District, for the fiscal years ended December 31, 2005 through 2014 B User Charge Revenue by Municipality Outside the District, for the fiscal years ended December 31, 2005 through 2014 B User Charge Rates, for the fiscal years ended December 31, 2005 through 2014 B Wastewater Loadings by Customer Class, for the fiscal years ended December 31, 2005 through 2014 B Ten Largest Sewer Users, for the fiscal years ended December 31, 2005 and 2014 B Property Tax Information, for the fiscal years ended December 31, 2005 through 2014 B Bonded Debt Limit and Ratio of Bonded Debt to Equalized Value, for the fiscal years ended December 31, 2005 through 2014 B Per Capita Debt, Personal Income and Unemployment Rate for the fiscal years ended December 31, 2005 through 2014 B Computation of Overlapping Debt, for the fiscal year ended December 31, 2014 B Ten Largest Taxpayers for Milwaukee County, for the fiscal years ended December 31, 2005 and 2014 B Population by Municipality, for the fiscal years ended December 31, 2005 through 2014 B Principal Private Sector Employers, for the fiscal years ended December 31, 2005 and 2014 B Number of Employees by Identifiable Activity, for the fiscal years ended December 31, 2005 through 2014 B Operating and Capital Indicators, for the fiscal years ended December 31, 2005 through 2014 B MMSD s Mission 60 02


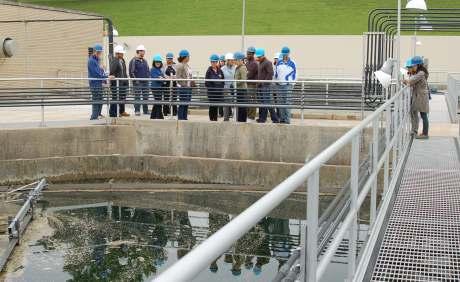
5 Tour Groups Introductory Section 03
6 Commission Organization Chart MMSD Commissioners Ben Gramling, Chair Michael A. West, Vice Chair Lyle A. Balistreri James A. Bohl* Milele A. Coggs Nikiya Harris Dodd* John R. Hermes Carl Krueger Eugene Manzanet Kris Martinsek Leon A. Saryan, Ph.D. Policy, Finance and Personnel Committee Lyle A. Balistreri, Chair Carl Krueger, Vice Chair Eugene Manzanet Kris Martinsek Ben Gramling, Ex-Officio Operations Committee John R. Hermes, Chair Milele A. Coggs Leon A. Saryan, Ph.D. Michael A. West Ben Gramling, Ex-Officio Executive Director Kevin L. Shafer, P.E. Director of Legal Services Susan B. Anthony *Commissioners Bohl and Harris Dodd were seated on the Commission as of December 22, 2014, but were not appointed to a committee assignment until January 1, Commission Secretary Anna Kettlewell 04

7 Commissioners of the Milwaukee Metropolitan Sewerage District Michael A. West Commission Vice Chair, President, Village of Fox Point District Staff Kevin L. Shafer, P.E. Executive Director Anna Kettlewell Commission Secretary Susan B. Anthony Director of Legal Services Michael Martin Director of Technical Services Principal Advisors Baker Tilly Virchow Krause, LLP Independent Auditors Foley & Lardner Bond Counsel Robert W. Baird & Co. Financial Advisor Ben Gramling Commission Chair, Director of Environmental Health Programs, Sixteenth Street Community Health Center Lyle A. Balistreri President, Milwaukee Building & Construction Trades Council, AFL-CIO James A. Bohl Alderman, City of Milwaukee Milele A. Coggs Alderwoman, City of Milwaukee Nikiya Harris Dodd Wisconsin State Senator John R. Hermes President, Village of Greendale Carl Krueger President, Village of Brown Deer Eugene Manzanet V.P. Community Development, PNC Bank Kris Martinsek Owner of Martinsek & Associates Leon A. Saryan, Ph.D. Retired, Aurora Health Care Technical Director of ACL Industrial Toxicology 05
8 2014 Letter From The MMSD Chair Ben Gramling Commission Chair, Director of Environmental Health Programs, Sixteenth Street Community Health Center Strong environmental and financial stewardship are not exclusive of one another, and in fact they go hand in hand at MMSD. These concepts become clear looking at the progress made in 2014 with continued strong financial management of the Milwaukee Metropolitan Sewerage District (MMSD) and visionary projects that improve our rivers and Lake Michigan. By removing just 1,100 feet of concrete from the Menomonee River in Milwaukee, fish from Lake Michigan can now migrate an additional 37 miles north, opening up new fishing spots and recreational opportunities. The project leveraged $1.1 million in grant funding from the Great Lakes Restoration Initiative (GLRI) and additional funding and resources from the U.S. Fish and Wildlife Service, the Wisconsin Department of Natural Resources (DNR) and MMSD. The District made huge strides managing water where it falls through the Fresh Coast 740 program, an initiative that aims to create enough green infrastructure in the region, by 2035, to capture, store or slowly drain into the ground 740 million gallons of water every time it rains. However, with 18 million gallons of green infrastructure in place, it's easy to see how much more work is needed to meet our goals. Through solid planning, asset management and solid financial management, MMSD's regional infrastructure captured and cleaned 99.5% of all the stormwater and wastewater that entered the District's system in I take great pride knowing that we are far ahead of the national target for cities with sewers like ours, capturing and cleaning 85% of all water that enters the system. Our watersheds, rivers and Lake Michigan are better off thanks to our regional investments in clean water. At the same time, tourism and quality of life are always improving in the Milwaukee area because of our dedication to the environment and we're not done yet. Sincerely, Ben Gramling Commission Chair 06
9 Milwaukee Metropolitan Sewerage District Germantown Mequon Thiensville The District's 337 square-mile service area includes all or part of those communities shown in the map excluding South Milwaukee The District's planning area boundary is 411 square miles Menomonee Falls Brown Deer River Hills Bayside Fox Point Glendale Brookfield Butler Whitefish Bay Shorewood Milwaukee Elm Grove Wauwatosa West Allis West Milwaukee Jones Island Water Reclamation Facility New Berlin St. Francis Hales Corners Greenfield Greendale Cudahy South Milwaukee Muskego Franklin Oak Creek South Shore Water Reclamation Facility Caledonia 07
10 June 5, 2015 The Commissioners Milwaukee Metropolitan Sewerage District Dear Commissioners: State law requires that the Milwaukee Metropolitan Sewerage District (District) publish a complete set of financial statements presented in conformance with generally accepted accounting principles (GAAP) and audited in accordance with generally accepted auditing standards by a firm of independent licensed certified public accountants. Pursuant to that requirement, we hereby issue the comprehensive annual financial report of the District for the fiscal year ended December 31, This report consists of management's representations concerning the finances of the District. Accordingly, management assumes full responsibility for the completeness and reliability of all of the information presented in the report. To provide a reasonable basis for making these representations, management of the District has established a comprehensive internal control framework that is designed both to protect the government's assets from loss, theft, or misuse and to compile sufficient reliable information for the preparation of the District's financial statements in conformity with GAAP. Because the cost of internal controls should not outweigh their benefits, the District's framework of internal controls has been designed to provide reasonable rather than absolute assurance that the financial statements will be free from material misstatement. As management, we assert that, to the best of our knowledge and belief, this financial report is complete and reliable in all material respects. Baker Tilly Virchow Krause, LLP, a firm of licensed certified public accountants, has audited the District's financial statements. The goal of the independent audit was to provide reasonable assurance that the financial statements of the District for the fiscal years ended December 31, 2014 and 2013, are free of material misstatement. The independent audit involved examining, on a test basis, evidence supporting the amounts and disclosures in the financial statements; assessing the accounting principles used and significant estimates made by management; and evaluating the overall financial statement presentation. An audit includes consideration of internal control over financial reporting as a basis for designing audit procedures that are appropriate in the circumstances, but not for the purpose of expressing an opinion on the effectiveness of the District's internal control over financial reporting. Accordingly, Baker Tilly Virchow Krause, LLP expresses no such opinion. The independent auditor concluded, based upon the audit, that there was a reasonable basis for rendering an unmodified opinion that the District's financial statements for the fiscal years ended December 31, 2014 and 2013, are fairly presented in conformity with GAAP. The independent auditor's report is presented as the first component of the financial section of this report. The independent audit of the financial statements of the District was part of a broader, federally mandated Single Audit designed to meet the special needs of federal and state agencies. The standards governing Single Audit engagements require the independent auditor to report not only on the fair presentation of the financial statements, but also on the audited government's internal controls and compliance with legal requirements, with special emphasis on internal controls and legal requirements involving the administration of federal and state awards. These reports are available in the District's separately issued Single Audit Report. GAAP require that management provide a narrative introduction, overview, and analysis to accompany the basic financial statements in the form of Management's Discussion and Analysis (MD&A). This letter of transmittal is designed to complement MD&A and should be read in conjunction with it. The District's MD&A can be found immediately following the report of the independent auditors. PROFILE OF THE DISTRICT General The District is a special purpose municipal corporation organized under the laws of the Sate of Wisconsin. The District was created in 1982 by the reorganization of the sewerage function previously financed by the Milwaukee County government. Legal Boundary The District's legal boundary presently includes all of Milwaukee County with the exclusion of the City of South Milwaukee. The legal boundary also includes the portion of the Village of Bayside that is in Ozaukee County, and those portions of the City of Milwaukee that are in Waukesha and Washington Counties. The District may levy ad valorem property taxes from time to time on all taxable property within its legal boundary. Milwaukee Metropolitan Sewerage District 260 W. Seeboth Street, Milwaukee, WI
11 Service Area The District presently provides sewage treatment services for the 18 cities and villages within the District's legal boundary. In addition, the District is authorized under state statutes to provide sewage treatment service to areas beyond its legal boundary but within the portion of the multi-county drainage basin delineated as part of the Water Quality Management Plan developed by the Southeastern Wisconsin Regional Planning Commission pursuant to section 208 of the Federal Water Pollution Control Act Amendments of This area includes all or parts of 10 municipalities outside Milwaukee County. District sewage treatment service is presently provided to all or parts of these 10 municipalities. Service Responsibilities and Powers The District is statutorily responsible for construction, operation and maintenance of its sewers, watercourse improvements and treatment plant facilities within its service area. The District possesses the right of eminent domain throughout Wisconsin. It has the authority to promulgate rules and regulations necessary and proper to promote the best operation of the system, protect its works, prevent damage to the sewerage system, prevent surcharging of sewers or interference with the treatment process, and to attain state and federal pretreatment requirements. These rules and regulations apply throughout the territory served and have precedence over any conflicting ordinance, code or regulation. The District may issue special orders to attain compliance with its rules and regulations and it may issue special use permits. Governance The District's governing body is the Milwaukee Metropolitan Sewerage Commission, which is composed of eleven members. Seven of the eleven members are appointees of the Mayor of the City of Milwaukee. Three of the appointees of the Mayor of the City of Milwaukee must be elected officials. Four of the eleven members are appointees of a body comprised of the elected executive officer of each city or village other than the City of Milwaukee within the District's boundary. Of these four appointees, three must be elected officials. All appointees have terms of three years, except the elected official appointees of the Mayor of the City of Milwaukee, who serve for one year. The Commission elects a Chairperson and Vice Chairperson from its membership. Most major financing decisions of the District require an approving vote of two-thirds of all Commissioners. authorized or to be considered by the District's Commission. Approval of the budgets by the District's Commission does not in itself authorize any specific expenditures or projects. Requests for capital project expenditures must be approved by either the Commission or the Executive Director, as appropriate, within established limits of authority prior to the commitment of funds. Operation and Maintenance budgets are structured so that expenses can be approved and costs can be accumulated by: a) cost center, b) expense category, c) user charge parameter/activity in accordance with the cost recovery manual, as updated annually by the Commission, and d) special program costs as requested and approved by the Commission. FACTORS AFFECTING FINANCIAL CONDITION The information presented in the financial statements is perhaps best understood when it is considered from the broader perspective of the specific environment within which the District operates. Local Economy The Milwaukee metropolitan area continues to reflect a solid economic base and diversification despite the most significant national economic recession since the 1920's. After five years of declining property values, taxable valuation in 2014 increased 1.9% within the District and 2.7% in the District's service area. Over the last ten years taxable valuation within the District has increased 12.3%, an average of 1.2% annually over the last ten years. The District's ten largest taxpayers make up only 3.8% of the total tax base. Six of these taxpayers are commercial real estate developers whose projects include shopping malls, office buildings, and hotels. The Milwaukee metropolitan area continues to have a sizable manufacturing base, one of the largest in the Midwest. However, continued expansion of the service sector provides diverse employment opportunities to metropolitan area residents in the financial, governmental, and health care areas and has reduced the relative importance of manufacturing. Another indicator of the improvement in the Milwaukee area economy has been the decrease in the unemployment rate. The unemployment rate in Milwaukee County was 7.0% in 2014 compared to 8.3% in The unemployment rate has now decreased each of the last four years since 2010 when the unemployment rate was 9.9%. Budgets The District's annual Operation and Maintenance, and Capital budgets are financial plans outlining the established expenditures for programs or projects already 09
12 Long-range Financial Planning The District maintains long-range financing plans for its Operation and Maintenance (O&M) and Capital budgets. The District's operating budget utilizes a user charge stabilization fund and an equipment replacement fund to help stabilize user charge rates while improving customer service and the efficiency of operations. Items of note in the 2015 operating budget include: $71.5 million in budgeted sewer user charge billings for 2015, a 3.25% increase from The annual average District household charge of $ in 2015 represents an increase of $4.49 or 3.7% from the 2014 amount of $ Total O&M expenditures were budgeted at $88.9 million, 1.6% higher than in Although O&M expenditures increased only $1.4 million when compared to 2014's amount, 2015's O&M budget returned a surplus of $3.9 million, a 49.5% decrease, or $3.8 million less than when compared to 2014's amount. To partially offset the decrease in surplus returned, the District budgeted a 2015 withdrawal of $1 million of excess funding from the District's equipment replacement fund and $1 million from the user charge stabilization fund. The District's six-year financing plan for the capital budget seeks to accomplish the District's capital program needs within the following financing objectives: 25% cash financing for capital projects, and Maintaining outstanding debt at no more than 2.5% of total equalized property value (i.e., 50% of the statutory limit of 5%). The six-year plan provides for $533 million in capital project and program expenditures from 2015 through 2020, primarily for rehabilitation, upgrade or replacement of assets at the District's two water reclamation facilities, structural and hydraulic upgrades to the Metropolitan Interceptor Sewer system, watercourse and flood management projects, private property infiltration and inflow reduction, and development of green infrastructure solutions. The 2015 Capital Budget continues the Private Property Infiltration and Inflow (PPI/I) Reduction program which began in 2010 and creates a program to fund municipal green infrastructure. One of the primary causes of system capacity problems is the amount of clear water entering the system through infiltration and inflow from private property, such as aging or deteriorating laterals, or foundation drains. The District's PPI/I Reduction program provides funding to municipalities to remedy I/I from private property sources within their municipalities. The Green Solutions program provides funding to municipalities to implement green infrastructure, assisting the District in meeting its permit requirement to capture an additional one million gallons of stormwater each year through green infrastructure. The long-range financing plan includes $60 million in planned funding for the PPI/I Reduction program and $10.5 million for the Green Solutions program. In order to fund projected capital expenditures within the District's financing objectives, the tax levy increased 2.65% for 2015 and is projected to increase 4% annually thereafter through Operating Contract On December 3, 2007 the Milwaukee Metropolitan Sewerage District Commission approved a 10-year contract effective March 1, 2008 with Veolia Water Milwaukee, LLC (Veolia) to replace United Water Services (UWS) as the operator of the District's two water reclamation facilities, biosolids management and field operations. Veolia's proposal was determined to be the most cost-effective (saving over an estimated $35 million over ten years) and was selected based on a competitive bid process which included UWS and after evaluating the cost-effectiveness of returning the operations to the public sector. The District continues to operate its industrial waste pretreatment program; capital planning and engineering services; environmental laboratory, water quality monitoring and research; Milorganite sales, marketing and distribution. The District has an extensive contract compliance and oversight program related to the 10-year agreement. LANDFILL GAS PIPELINE The District has designed and built a low-pressure pipeline approximately 19 miles long to transport landfill gas from Advance Disposal Services Emerald Park Landfill in Muskego, to fuel the District's Jones Island Water Reclamation Facility, providing 20 years of green energy and reducing greenhouse gas emissions. The pipeline began full operations in The pipeline is estimated to result in significant savings to District customers over a 20-year period, depending on natural gas prices. 10
 for the fiscal year ended December 31, 2013. This was the 36th consecutive year that the District has received this prestigious award.")

13 AWARDS AND ACKNOWLEDGEMENTS The Government Finance Officers Association (GFOA) awarded a Certificate of Achievement for Excellence in Financial Reporting to the District for its comprehensive annual financial report (CAFR) for the fiscal year ended December 31, This was the 36th consecutive year that the District has received this prestigious award. In order to be awarded a Certificate of Achievement, the District published an easily readable and efficiently organized CAFR. This report satisfied both GAAP and applicable legal requirements. preparation of this report. Their professional expertise, experience and judgment have been invaluable to us and to the overall efficiency of the District. We would like to thank the members of the Communications and Graphics staffs, for without their efficient and dedicated services, the preparation of this report could not have been accomplished on a timely basis. We would also like to thank the Commission for providing the policy direction that allows us to pursue sound financial management practices. A Certificate of Achievement is valid for a period of one year only. We believe that our current CAFR continues to meet the Certificate of Achievement Program's requirements and we are submitting it to the GFOA to determine its eligibility for another certificate. The District received the GFOA's Distinguished Budget Presentation Award for its 2013 annual budget document. In order to qualify for the distinguished Budget Presentation Award, the District's budget document was judged to be proficient in several categories. These categories include presentation as a policy document, financial plan, operations guide, and a communications device. The preparation of this report would not have been possible without the efficient and dedicated services of the entire staff of the Accounting Department. Staff diligently and faithfully contributed to the continued improvement of the District's accounting function and Kevin L. Shafer, P.E. Executive Director Mark T. Kaminski, Director of Finance/Treasurer, CPA 11
14 The GFOA Certificate of Achievement The Government Finance Officers Association of the United States and Canada (GFOA) awarded a Certificate of Achievement for Excellence in Financial Reporting to the Milwaukee Metropolitan Sewerage District for its comprehensive annual financial report for the fiscal year ended December 31, This is the 36th consecutive year that the government has achieved this prestigious award. In order to be awarded a Certificate of Achievement, a government must publish an easily readable and efficiently organized comprehensive annual financial report. This report must satisfy both generally accepted accounting principles and applicable legal requirements. A Certificate of Achievement is valid for a period of one year only. We believe that our current comprehensive annual financial report continues to meet the Certificate of Achievement Program s requirements and we are submitting it to the GFOA to determine its eligibility for another certificate. 12
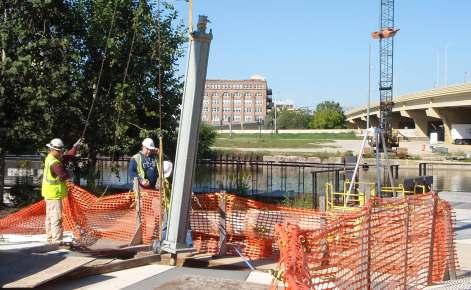


15 Monitoring and Construction Projects Financial Section 13
16 14
17 15
18 Management s Discussion and Analysis As management of the Milwaukee Metropolitan Sewerage District (District), we offer readers of the District's financial statements this narrative overview and analysis of the financial activities of the District for the fiscal years ended December 31, 2014 and December 31, We encourage readers to consider the information presented here in conjunction with the additional information that we have furnished in our letter of transmittal, which can be found on pages 8-11 of this report. FINANCIAL HIGHLIGHTS The District's net position of $2.6 billion remained unchanged over the course of this year's operation. The District has a deficit balance of $4.4 million for its unrestricted net position. This represents a decrease of $8.5 million from the surplus balance of $4.1 million at December 31, In accordance with GASB Statement 45, Accounting and Financial Reporting by Employers for Postemployment Benefits Other Than Pensions, at December 31, 2014, the District has recorded a liability of $41.9 million related to these benefits. At December 31, 2014, the actuarial accrued liability of $178.6 million remained unchanged and is being amortized as a level dollar amount and the amortization period is open and is 30 years. See note 11 to the financial statements for further details. At December 31, 2014 the District had recorded an intergovernmental loan for $24.6 million. This loan is with City of Franklin for costs related to constructing the Ryan Creek Interceptor in accordance with District standards and which the District will purchase from Franklin. The District will make payments to Franklin, beginning in 2015, equal to Franklin's annual payments toward repaying its loan with the Clean Water Fund Loan Program used to finance the construction of the interceptor. On January 3, 2017, the District is to make a payment to reimburse Franklin for the sums Franklin has paid toward the Clean Water Fund Program loan through During 2014, the District received $37.2 million in loan proceeds from the State of Wisconsin Clean Water Fund Loan Program. The issuance of this new debt, along with the other general obligation debt, brings the District's outstanding debt at December 31, 2014 to $923.7 million. This is a decrease of $46.6 million over the balance at December 31, The District's debt limit rate decreased from 1.73% to 1.62%, as compared to the statutory limit rate of 5%. OVERVIEW OF THE FINANCIAL STATEMENTS This discussion and analysis is intended to serve as an introduction to the District's basic financial statements. The District's basic financial statements are comprised of two components: 1) the financial statements and 2) notes to the financial statements that explain in more detail some of the information in the financial statements. REQUIRED FINANCIAL STATEMENTS The financial statements of the District report information about the District using accounting methods similar to those used by private-sector companies. These statements provide both long-term and short-term information about the District's overall financial status. The statement of net position presents information on all of the District's assets, liabilities, and deferred inflows of resources with the difference reported as net position. This statement provides information about the nature and the amounts of investments in resources (assets) and the obligations to District creditors (liabilities). It provides one way to measure the financial health of the District by providing the basis for evaluating the capital structure of the District and assessing the liquidity and financial flexibility of the District. However, one will need to consider other nonfinancial factors such as changes in economic conditions, population and industrial/commercial customer growth, and new or changed government legislation. All of the current year's revenues and expenses are accounted for in the Statement of Revenues, Expenses, and Changes in Net Position. This statement measures the success of the District's operations over the past year and can be used to determine whether the District has successfully recovered all its costs through its user fees, Milorganite, other charges and credit worthiness. The final required financial statement is the Statement of Cash Flows. The statement reports cash receipts, cash payments, and net changes in cash resulting from operations, investing, and financing activities. This statement provides answers to such questions as where did cash come from, what was cash used for, and what was the change in the cash balance during the reporting period. FINANCIAL ANALYSIS OF THE DISTRICT Net Position As previously noted, net position may serve over time as a useful indicator of an entity's financial position. In the case of the District, assets exceeded liabilities and deferred inflows of resources by $2.6 billion at the close of the most recent fiscal year. As can be seen in Table A-1 on page 17, the largest portion of the District's net position (97.3 % at December 31, 2014) reflects its investment in capital assets (e.g., sewers, buildings, machinery and equipment), less any related debt used to acquire those assets that is still outstanding. The District uses these capital assets to provide sewerage treatment services, provide flood management and to maintain and improve watercourses for the entire District service area; consequently, these assets are not available for future spending. Although the District's investment in its capital assets is reported net of related debt, it should be noted that the resources to repay this debt must be provided from other sources, since the capital assets themselves are not intended to be used to liquidate these liabilities. As shown in Table A-1, current, other assets and noncurrent assets decreased $6.7 million or 2.5% from 2013 to The primary reason for the decrease is a $4.6 million decrease in surplus funds on hand from 2013 to The 2013 balances included $13.2 million in surpluses from current and prior year operations. The 2014 balances included only $8.6 million of surplus funds from 2014 and In compliance with federal user charge regulations the District must return a surplus back to its customers within two years from the year incurred and is a main reason for the decrease in unrestricted cash and investments. Another reason for the decrease is the $3.1 million planned final disbursement of funds remaining from its 2010 general obligation bond issue. In addition, because of low interest rates for investments during the past few years, the District continues to delay requesting loan funds from the State of Wisconsin Clean Water Fund program in order to avoid paying interest costs ranging from 2.20% to 2.751%. Although this action continues to reduce working capital on hand, the District avoided interest costs ($305,000 in 2014) on these loans. As can be seen from Table A-1, total liabilities decreased approximately $36.4 million or 3.4% from 2013 to The decrease is primarily attributable to the planned pay down of District general obligation issued debt and Clean Water Fund Program loans. The decrease in restricted net position from 2013 to 2014 is due primarily to the increase in outstanding restricted accounts payable at year end. The increase is the result of the resolution of the Bostco litigation (see note 9 to the financial statements for additional detail) and increased payables related to increased construction activity in the last quarter of In addition, the District delayed a planned bond issue for 2014 until 2015, further reducing restricted funds on hand. See accompanying independent auditors report. 16
19 Table A-1 Condensed Summary of Net Position (000 s) Percentage Increase (Decrease) Versus 2013 Current and Other Assets $221,030 $208,492 $215, % Noncurrent Assets 38,500 57,750 61,883 (33.3) Capital Assets 3,448,177 3,472,298 3,498,089 (0.7) Total Assets 3,707,707 3,738,540 3,775,802 (0.8) Current Liabilities 119, , , Noncurrent Liabilities 909, , ,828 (5.1) Total Liabilities 1,028,586 1,064,962 1,105,509 (3.4) Deferred Inflows of Resources 122, , , Investment in Capital Assets 2,486,416 2,464,531 2,466, Restricted 74,479 87,139 76,873 (14.5) -Unrestricted (4,382) 4,131 10,905 (206.1) Total Net Position $2,556,513 $2,555,801 $2,554, With respect to $8.5 million decrease in unrestricted net position, $5 million of the decrease is the result of the District electing to fund its long-term liability related to postretirement health and life insurance as it comes due rather than when it is incurred. The total long-term liability related to this benefit was $41.9 million at December 31, 2014 with an unfunded actuarial accrued liability of $178.6 million, amortized as a level dollar amount and the amortization period is open and is 30 years. The amortization of the unfunded actuarial accrued liability is the primary reason for the annual decrease in unrestricted net position. Also, as mentioned earlier, federal user charge regulations require the District to return a surplus to customers within two years from when it is incurred, resulting in less funds on hand at the end of As shown in Table A-1, current, other assets and noncurrent assets decreased $11.5 million or 4.1% from 2012 to The primary reason for the decrease is a $15.2 million decrease in funds remaining from its 2010 general obligation bond issue. This decrease was related to planned expenditures for these funds, and was partially offset with increases in the District's debt service fund and general funds on hand. As mentioned above, the District has delayed requesting loan funds from the State of Wisconsin Clean Water Fund program, to avoid paying interest costs ranging from 2.20% to 2.751%. Although this action continues to reduce working capital on hand, the District avoided interest costs ($575,000 in 2013) on these loans. As can be seen from Table A-1, total liabilities decreased approximately $40.5 million or 3.7% from 2012 to As in 2014, the decrease is primarily attributable to the planned pay down of District general obligation issued debt and Clean Water Fund Program loans. The increase in restricted net position from 2012 to 2013 is due primarily to the decrease in outstanding accounts payable at year as the District proceeded in its planned decrease in project spending related to its capital improvements program. With respect to unrestricted net position, the District has elected to fund its long-term liability related to postretirement health and life insurance as it comes due rather than when it is incurred. The total long-term liability related to this benefit was $36.9 million at December 31, 2013 with an unfunded actuarial accrued liability of $178.6 million. While the Summary of Net Position (Table A-1) shows the change in our financial position the Statements of Revenues, Expenses, and Changes in Net Position provides answers as to the nature and source of these changes. As can be seen in Table A-2 on page 18, for the fiscal year ended 2014, total revenues slightly increased by $4.8 million or 2.5% and expenses increased by $8.7 million or 4.4%. The major factors, which drove these results, include: Total user charges remained essentially the same from Although the District a budgeted 1.75% or $1.2 million increase for 2014 sewer user charge billings, less than expected wasteloads for noncertified commercial users reduced the actual amount of user charge revenue earned. The District's Milorganite revenue increased $326,000 or 4.3% in 2014 after revenue decreased 2.0% or $160,000 in Although competitive pressures continue and combined with a struggling See accompanying independent auditors report. 17 economy resulted in approximately 2,174 less tons being sold in 2014, offsetting the decrease in tonnage sold was an increase in the average net selling price of $14.42 per ton from 2013 to Excluding depreciation, operating expenses in 2014 increased $2.8 million or 3.3% over the amount for The three main reasons for the increase are, $901,000 in increased energy costs related to higher natural gas prices in the first half of 2014; a $765,000 increase in costs related to the contract terms of the 10 year operating contract with Veolia Water Milwaukee, LLC and a $757,000 increase in planned machinery and equipment repairs. Nonoperating revenues increased $4.4 million or 3.8%. The primary reason for the increase is a 2.85% increase in the tax levy to District member communities which also impacted the level of billings for capital charges to communities outside the District. The remainder of the increase is due to a one-time payment of $1.1 million from the Wisconsin Department of Transportation (DOT) for costs incurred by the District related to the impact of the DOT's Zoo Interchange project on the District's infrastructure in the area of the interchange. The slight increase in nonoperating expenses in 2014 is the result of an increase in expenditures related to the District's Infiltration/Inflow Reduction on Private Property Capital Program (PPI/I program). As can be seen in Table A-2, for the fiscal year ended 2013, total revenues slightly increased by $5.8 million or 3.1% and expenses decreased by $4.6 million or 2.3%. The major factors, which drove these results, include: Total user charges remained essentially the same from 2012, despite a budgeted 2.0% increase for sewer user charge billings. Less than expected wasteloads for noncertified commercial users resulted in the District earning less than budgeted revenue. The District's Milorganite revenue decreased $160,000 or 2.0% in 2013 after revenue increased 7.9% or $575,000 in Although competitive pressures continue, combined with a struggling economy, staff's short-term improvement measures resulted in approximately 6,294 more tons being sold in 2013, but offsetting the increase in tonnage sold was a decrease in the average net selling price of $21.74 per ton from 2012 to Excluding depreciation, operating expenses in 2013 increased $2.2 million or 2.6% over the amount for This was consistent with the budgeted increase of 2.4%. Nonoperating revenues increased $6.1 million or 5.4%. The primary reason for the increase is because in 2013 the loss from disposal of capital assets was reduced from $5 million in 2012 to $1.6 million. In 2012 and 2013 these losses were related to the capital costs for the acquisition and removal of structures as part of the Kinnickinnic River flood management. The purpose of this project is to reduce the risk of structures being in the 1% probability floodplain and improve public safety along the Kinnickinnic River. The project includes the acquisition and removal of 84 structures. In addition to the reduction of the loss in disposal of capital assets in 2013 the District's tax levy increased by 2.5%. The decrease in nonoperating expenses in 2013 is the result of two items. In 2012, $8.8 million of land was contributed to municipalities as compared to only $0.2 million in The District's Greenseams Program is a land acquisition effort to assist in the prevention of
20 Table A-2 Condensed Summary of Revenues, Expenses, and Changes in Net Position (000 s) Percentage Increase (Decrease) Versus 2013 Operating Revenues: User Charges $70,029 $69,572 $69, % Fertilizer 7,993 7,667 7, Other 784 1,158 1,229 (32.3) Total Operating Revenues 78,806 78,397 78, Nonoperating Revenues: Property Tax 90,919 88,626 $86, Capital Charges - Communities Outside the District 29,396 28,424 27, Other 1, (2,609) Total Nonoperating Revenues 121, , , Total Revenues 200, , , Operating Expenses: Systems - Operation and Maintenance 58,754 57,130 55, Laboratory and Research Services 2,449 2,448 2, Industrial Waste and Conveyance Monitoring 3,444 3,227 3, Finance, Engineering and Administration 23,311 22,331 21, Depreciation 87,647 82,785 79, Total Operating Expenses 175, , , Nonoperating Expenses 29,705 29,192 30, Land Contributed to Municipalities , Total Nonoperating Expenses 30,427 29,368 38, Total Expenses 206, , , Income (Loss) Before Capital Contributions (5,292) (1,399) (11,850) Capital Contributions 6,004 3,016 4, Changes in Net Position 712 1,617 (7,609) Beginning Net Assets 2,555,801 2,554,184 2,561,793 Ending Net Position $2,556,513 $2,555,801 $2,554,184 long-term flooding issues and reduce polluted stormwater runoff in environmental corridors. Purchasing natural wetlands to retain stormwater is significantly less expensive than the cost to provide engineered solutions to stormwater and flood management problems. After acquisition, these properties are donated to the municipality and provide multiple benefits in the form of open space, wildlife habitat and passive recreation. The second reason is a decrease in expenditures of $2.7 million for the District's PPI/I program. CAPITAL ASSETS AND DEBT ADMINISTRATION Capital Assets As of December 31, 2014, the District's investment in capital assets amounted to $3.4 billion (net of accumulated depreciation) as shown in Table A-3 below. The decrease of $24.1 million in net capital assets for 2014 reflects an $86.6 million increase in accumulated depreciation which exceeds the $62.5 million in net additions to the asset base during In 2013 the increase in capital assets was $55.3 million. During 2014 and 2013 the District incurred capital expenditures to rehabilitate, upgrade or replace assets at its two water reclamation facilities and conveyance system; continued to work on flood management projects, as well as work on sustainability projects and 2050 Facilities Planning. In 2015, the District's current six-year capital expenditure forecast projects $533.1 million in project and program expenditures over the six-year period from 2015 through During this period the capital improvement program continues its focus on asset management and sustainability rather than expansion of capacity. More detailed information about the District's capital assets is presented in Note 6 to the financial statements. Debt Administration General obligation indebtedness outstanding at December 31, 2014 amounted to $923.7 million. Included in this amount are $233.8 million of general obligation bonds issued by the District. Table A-3 Capital Assets (000 s) Percentage Increase (Decrease) Versus 2013 Land, Land Easements & Land Improvements $111,227 $110,674 $110, % Buildings 803, , , Machinery & Equipment 884, , , Aeration and Clarifier Tanks 86,242 85,249 83, Watercourse Improvements 349, , , Intercepting Sewer System & Rights 2,478,845 2,463,150 2,333, Construction in Progress 220, , ,840 (21.3) Subtotal 4,933,229 4,870,748 4,815, Less: Accumulated Depreciation (1,485,052) (1,398,450) (1,317,362) 6.2 Net Capital Assets $3,448,177 $3,472,298 $3,498,089 (0.7)% See accompanying independent auditors report. 18
21 The remaining balance of $689.9 million represents funds received by the District through the State of Wisconsin Clean Water Fund Loan Program, which provides low interest loans for use in the construction of wastewater treatment facilities. Interest on these loans is payable semiannually with interest rates ranging from 2.20% to 4.95%. On May 11, 2015, the District issued $100 million of General Obligation Promissory Notes, Series 2015A. The net proceeds from this issue will provide funding for a portion of the District's capital improvements program in 2015 and The Series 2015A issue, competitively sold by the District, is the first issue since December of Fitch Ratings affirmed the District's current bond rating on March 31, Moody's Investor's Services affirmed the District's rating on March 31, The bond rating from Standard & Poor's was affirmed on March 25, 2015.The current ratings are as follows: Moody's Fitch Ratings Investors Service Standard & Poor's AAA Aa1 AA+ At December 31, 2014 the District has recorded an intergovernmental loan for $24.6 million. This loan is with City of Franklin for costs related to constructing the Ryan Creek Interceptor in accordance with District standards and which the District will purchase from Franklin. The District will make payments to Franklin, beginning in 2015, equal to Franklin's annual payments toward repaying its loan with the Clean Water Fund Loan Program used to finance the construction of the interceptor. On January 3, 2017, the District is to make a payment to reimburse Franklin for the sums Franklin has paid toward the Clean Water Fund Program loan through During 2010 the Wisconsin Department of Commerce agreed to lend the District up to $5 million for the purpose of economic development pursuant to the American Recovery and Reinvestment Act of The loan was amended on March 1, 2012 for an additional $945,000 of principal. The loan provides partial funding for the District's landfill gas turbine project. The loan is interest free for 5 years and is secured by the equipment purchased with the loan funds rather than a tax levy pledge. The outstanding loan balance at December 31, 2014 was $3.5 million. Although it is the District's intent to pay off the loan on May 1, 2016, in the event the District decides not to pay off the loan on that date, interest then accrues at the rate of 6% until final payment. The District will avoid $751,000 in interest costs during the interest free period ending May 1, 2016, when compared to the District's next lowest cost financing option. Additional information on the District's long-term debt can be in found in Note 7 to the financial statements and Exhibits B-12 to B-14 in the statistical section of this report. ECONOMIC FACTORS AND NEXT YEAR'S BUDGETS AND RATES The average unemployment rate for Milwaukee County was 7.0 percent for 2014, a decrease from the 8.3 percent rate for This compares to the state's unemployment rate of 5.5 percent and the national rate of 6.2 percent. Inflation in the metropolitan area was similar to the national consumer price index. - Milwaukee's inflation rate was 1.2% for The average U.S. city rate was 1.6% for The equalized valuation for the District's service area (including communities outside the District) increased by 2.7 percent in 2014, while 2014 user charge wasteloads changed as follows: - Billable flows down 0.3%. - Pounds of Biochemical Oxygen Demand (BOD) down 3.1%. - Pounds of Total Suspended Solids (TSS) up 0.6%. All these factors were taken into consideration when preparing the District's budgets. The District approved an $88.9 million 2015 Operation and Maintenance Budget, an increase of $1.4 million or 1.6% from The District's sewer user charge billings for 2015 are budgeted to increase 3.25% to $71.5 million. The average District residential charge for 2015 is increasing $4.49 to $ or 3.7% from the 2014 amount $ Items of note in the 2015 Operations and Maintenance (O&M) Budget include: A $1 million withdrawal of excess funding from the District's equipment replacement fund and a $1 million withdrawal from the user charge stabilization fund. These withdrawals were used to partially offset the decrease in surplus returned. In 2014's O&M budget a surplus of $7.8 million was returned to the rate payers while in 2015's O&M budget the surplus returned decreased to $3.9 million, or a $3.8 million decrease when compared to 2014's amount. Contractual fee increases of $1.6 million for the Veolia Water operating contract in the 2015 budget. A $345,000 increase in energy costs related to estimated price increases for both natural gas and electricity. The Green Infrastructure program continues to evolve and the District reduced the current budget by $225,000 when compared to 2014's budgeted amount. Increase employee contributions, along with recent favorable claim experience, resulted in a $320,000 reduction in health insurance. The District's Commission approved a 2015 Capital Budget that included a tax levy of $93.6 million, an increase of 2.65% from the levy of the prior year. The tax rate increased 0.7% from $1.70 to $1.71 per $1,000 of equalized value. Included in the 2015 Capital Budget is the current sixyear financing plan that projects tax levy increases of 4% per year through 2020, while increasing the estimated tax rate from $1.71 to $1.82 per $1,000 of equalized value. In the summer of 2010, the District's service area and local systems experienced extreme wet weather events that exceeded system capacity. To address the great magnitude of the problem, the 2011 Capital Budget included a Private Property Infiltration and Inflow (PPI/I) Reduction program for $151 million in anticipated funding from 2010 through The 2012 Capital Budget reduced the anticipated program funding in the extended long-range financing plan through 2020 to $60 million. The 2015 Capital Budget maintains funding at $5 million for 2015 through The funding for this program will be used to reimburse each of the 28 municipalities within the District service area as they incur expenditures addressing I/I issues on private property within their own municipality. In addition to the PPI/I Reduction program, the 2015 Capital Budget sets aside $1.5 million in 2015 for reimbursements to municipalities for green infrastructure improvements. The Green Solutions program will assist the District in meeting its permit requirement to capture an additional million gallons of stormwater each year through green infrastructure. The 2015 Capital Budget also provides for the continuation of efforts to rehabilitate, upgrade or replace assets at the District's two water reclamation facilities and conveyance system, provide for flood management and develop additional green infrastructure solutions. The long-range financing plan provides for an average level of expenditures for capital projects and programs of $88 million per year from 2015 through 2020 as the District maintains its 25% cash financing objective over the six-year period. REQUESTS FOR INFORMATION This financial report is designed to provide a general overview of the District's finances for all those with an interest in the District's finances and to demonstrate the District's accountability for the money it receives. Questions concerning any of the information provided in this report or requests for additional financial information should be addressed to the Milwaukee Metropolitan Sewerage District, 260 W. Seeboth St., Milwaukee, WI or See accompanying independent auditors report. 19
22 Exhibit A-1 Statements of Net Position DECEMBER 31, 2014 AND 2013 Assets Current unrestricted assets: (In Thousands) Cash and cash equivalents $ 8,490 $ 17,542 Investments 10,111 7,833 Receivables: Billed user charges 6,299 5,853 Unbilled user charges 11,585 11,191 Fertilizer sales 1,371 1,074 Other 3,584 2,231 Inventories: Operating and maintenance supplies 2,745 2,872 Fertilizer 1,809 1,940 Total current unrestricted assets 45,994 50,536 Current restricted assets: Cash and investments 46,882 36,175 Receivables: Tax levy 93,639 91,222 Capital charges municipalities outside the District 33,225 28,403 Grant funds 602 1,360 Other Prepaid expenses and other Total current restricted assets 175, ,956 Total current assets 221, ,492 Noncurrent restricted assets: Investments 38,500 57,750 Capital assets, at cost: Land 73,102 72,591 Land easements 18,576 18,545 Land improvements 19,549 19,538 Buildings 803, ,701 Aeration and clarifier tanks 86,242 85,249 Machinery and equipment 884, ,344 Intercepting sewer system 2,454,256 2,438,585 Interceptor rights 24,589 24,565 Watercourse improvement 349, ,415 Construction in progress 220, ,215 4,933,229 4,870,748 Less accumulated depreciation (1,485,052) (1,398,450) Net capital assets 3,448,177 3,472,298 Total assets $ 3,707,707 $ 3,738,540 See accompanying notes to financial statements. 20
23 Liabilities Current liabilities (payable from current assets): (In Thousands) Accounts payable $ 6,402 $ 6,929 Accrued salaries and wages 400 1,013 Accrued vacation pay 1,053 1,097 Other Total current liabilities (payable from current assets) 8,295 9,449 Current liabilities (payable from restricted assets): Accounts payable 13,611 4,986 Retainers payable 872 1,128 Accrued interest 7,209 7,073 Long-term obligations due within one year 89,520 84,381 Total current liabilities (payable from restricted assets) 111,212 97,568 Total current liabilities payable 119, ,017 Noncurrent liabilities: Retainers payable Long-term obligations: General obligation bonds 204, ,208 Clean Water Fund Program loans 635, ,818 Intergovernmental loan 23,459 24,565 Postretirement benefits 41,906 36,910 Accrued vested sick pay State loans payable - long term 2,706 3,483 Total long-term obligations 909, ,945 Total liabilities 1,028,586 1,064,962 Deferred Inflows of Resources Tax levies 93,639 91,222 Capital charges municipalities outside the District 28,871 26,351 Unamortized gain on refundings Total deferred inflows of resources 122, ,777 Total liabilities and deferred inflows of resources 1,151,194 1,182,739 Net Position Net Position: Investment in capital assets 2,486,416 2,464,531 Restricted capital projects and programs 34,527 46,210 Restricted equipment replacement 14,411 14,411 Restricted debt service 25,541 26,518 Unrestricted (4,382) 4,131 Total net position $ 2,556,513 $ 2,555,801 See accompanying notes to financial statements. 21
24 Exhibit A-2 Statements of Revenues, Expenses and Changes in Net Position DECEMBER 31, 2014 AND Operating revenues: (In Thousands) User charges $ 70,029 $ 69,572 Fertilizer 7,993 7,667 Other 784 1,158 Total operating revenues 78,806 78,397 Operating expenses: Systems operation and maintenance 58,754 57,130 Laboratory and research services 2,449 2,448 Industrial waste and conveyance monitoring 3,444 3,227 Finance, engineering, and administration 23,311 22,331 Depreciation and amortization 87,647 82,785 Total operating expenses 175, ,921 Operating loss (96,799) (89,524) Nonoperating revenues (expenses): Property taxes - capital 90,919 88,626 Investment income Net increase (decrease) in fair value of investments (42) (644) Interest expense (24,260) (24,293) Capital charges municipalities outside the District 29,396 28,424 Gain (loss) on disposal of capital assets (2,110) (1,582) Capital program expenditures (5,445) (4,899) Land contributed to municipalities (722) (176) Other 3,292 2,078 Total nonoperating revenues, net 91,507 88,125 Income (loss) before capital contributions (5,292) (1,399) Capital contributions 6,004 3,016 Change in net position 712 1,617 Net position at beginning of year 2,555,801 2,554,184 Net position at end of year $ 2,556,513 $ 2,555,801 See accompanying notes to financial statements. 22
25 Exhibit A-3 Statements of Cash Flows DECEMBER 31, 2014 AND Cash flow from operating activities: (In Thousands) Receipts from customers and users $ 79,607 $ 81,227 Payments for capital programs (5,445) (4,899) Payments to suppliers (71,829) (69,687) Payments to employees (12,080) (12,008) Net cash provided (used) by operating activities (9,747) (5,367) Cash flow from capital and related financing activities: Acquisition and construction of capital assets (57,488) (63,310) Proceeds from long-term debt issued 37,216 43,192 Principal payments on long-term obligations (84,498) (80,227) Interest paid on long-term obligations (net of capitalized interest) (25,482) (25,767) Government grant receipts and other contributions 6,232 2,900 Tax levy receipts 90,919 88,626 Capital charges municipalities outside the District 27,094 26,868 Net cash provided (used) by capital and related financing activities (6,007) (7,718) Cash flow from investing activities: Investment income Purchase of investments (14,416) (15,140) Proceeds from sale and maturity of investments 20,639 24,853 Net cash provided (used) by investing activities 6,702 10,304 Net (decrease) increase in cash and cash equivalents (9,052) (2,781) Cash and cash equivalents at beginning of year 17,542 20,323 Cash and cash equivalents at end of year $ 8,490 $ 17,542 Cash and cash equivalents as presented in the accompanying statements of net position: Current cash and equuvalents $ 8,490 $ 17,542 Current investments 10,111 7,833 Current restricted cash and investments 46,882 36,175 Noncurrent investments 38,500 57,750 Non-cash equivalents (95,493) (101,758) Cash and cash equivalents $ 8,490 $ 17,542 Reconciliation of operating loss to net cash provided (used) by operating activities: Operating loss $ (96,799) $ (89,524) Adjustments to reconcile operating loss to net cash provided (used) by operating activities: Depreciation 87,647 82,785 Postretirement benefits 4,996 4,352 Other nonoperating revenue 3,292 2,078 Capital program expenditures (5,445) (4,899) Changes in current assets and liabilities: Current receivables and other assets (2,491) 752 Prepaid expenses and other Inventories Accounts payable and other liabilities (1,314) (1,409) Net cash (used in) provided by operating activities $ (9,747) $ (5,367) Noncash investing, capital and related financing activities: Increase (decrease) in fair value of investments $ (42) $ (644) Increase (decrease) in capital grants accrued (758) (401) Increase (decrease) in receivables and unearned revenue for capital charges municipalities outside the District (net impact) 2,302 1,556 Capital assets contributed by others Capitalized interest 5,017 6,587 Loss on disposal of capital assets 2,074 1,607 Land contributed to municipalities See accompanying notes to financial statements. 23
26 (1) Basis of Presentation The Milwaukee Metropolitan Sewerage District (the District) is a special purpose municipal corporation established by the laws of the State of Wisconsin. The District's legal boundary includes all of Milwaukee County with the exclusion of the City of South Milwaukee. The legal boundary also includes the portion of the Village of Bayside which is in Ozaukee County and those portions of the City of Milwaukee that are in Waukesha County and Washington County. The District determines and collects sewer user charges from municipalities within this area in order to apportion all operation and maintenance costs associated with treatment operations. The District also provides service to certain municipalities outside the District for collection and treatment of their sewage. Construction and maintenance of all intercepting sewers, watercourse improvements, and water reclamation facilities within its territorial area are also the responsibilities of the District. The District also produces organic nitrogen fertilizer (Milorganite ) as a by-product of its wastewater treatment process for residential and commercial use. The District has the authority to finance its capital project costs through the use of a property tax levy, user charge, or the sale of revenue or general obligation bonds. Additionally, the District may contract with users outside the District's boundaries for payment toward its capital costs. The accompanying financial statements include all transactions of the District for which the District is financially accountable. Financial accountability is defined as an appointment of a majority of a component unit's board and either the ability to impose the will of the District or the possibility that the component unit will provide a financial benefit to or impose a financial burden on the District. Based on these criteria, the District has determined that there are no component units that come under the criteria for inclusion. The District is not a component unit of any other government entity. (2) Summary of Significant Accounting Policies The financial statements of the District have been prepared in conformity with accounting principles generally accepted in the United States of America as applied to enterprise funds of governmental units. The Governmental Accounting Standards Board (GASB) is the accepted standard-setting body for establishing governmental accounting and financial reporting principles. The following is a summary of the more significant policies. (a) Financial Statement Presentation and Basis of Accounting The District prepares its financial statements on an enterprise fund basis. Enterprise funds are used to account for operations that are financed and operated in a manner similar to private businesses, where the intent is that all costs of providing certain goods and services to the general public be financed or recovered primarily through user charges, or where it has been deemed that periodic determination of net income is appropriate for capital maintenance, public policy, management control, accountability, or other purposes. Accordingly, the District's financial statements are presented using the economic resources measurement focus and the accrual basis of accounting. Revenues from operations, investments, and other sources are recorded when earned, and expenses are recorded when liabilities are incurred. (b) Cash Equivalents The District generally considers deposits and all unrestricted highly liquid investments purchased with an initial maturity of three months or less to be cash equivalents. (c) Investments Investment of the District's funds is restricted by state statutes. Investments are limited to: Time deposits in any credit union, bank, savings bank or trust company maturing in three years or less. Bonds or securities of any county, city, drainage district, technical college district, village, town, or school district of the state. Also, bonds issued by a local exposition district, local professional baseball park district, local professional football stadium district, local cultural arts district the University of Wisconsin Hospitals and Clinics Authority, or the Wisconsin Aerospace Authority. Bonds or securities issued or guaranteed by the federal government. The local government investment pool. Any security maturing in seven years or less and having the highest or second highest rating category of a nationally recognized rating agency. Securities of an open end management investment company or investment trust, subject to various conditions and investment options. Repurchase agreements with public depositories, with certain conditions. Investments are reported at fair value based on quoted market prices. Commercial paper, which is short-term (less than 180 days) and highly liquid, is carried at amortized cost. Investment income, including changes in the fair value of investments and realized gains and losses, is recognized as revenue in the statements of revenues, expenses, and changes in net position. The District invests in the Wisconsin Local Government Investment Pool (the Pool), which is part of the State Investment Fund (SIF) and is managed by the State of Wisconsin Investment Board. The SIF is not registered with the Securities and Exchange Commission (SEC), but operates under the statutory authority of Wisconsin Chapter 25. The District's investment in the Pool is reported at fair value in the statements of net position. The fair value of the District's investment in the Pool equals the net realizable value of the District's share of the Pool (see Note 3). The Pool is authorized by Wisconsin statutes to enter into investments on behalf of government entities within Wisconsin and, in certain circumstances, to enter into derivative transactions to maximize the yield on its investments. However, specific information about the Pool's derivative transactions is not available to the District. Notes to Financial Statements December 31, 2014 and (d) User Charges User charges are recorded on the accrual basis. User charges billed to municipalities within the service area are designed to cover only operation and maintenance expenditures and are not intended to recover capital costs. User charge rates are set by District resolution on an annual basis to recover net estimated operating expenses, excluding depreciation, after giving effect to prior year surpluses or deficits. These charges are billed to municipalities in proportion to each user's contribution to total wastewater loading into the treatment system. Each municipality's bill reflects the amount due from each user class residential, commercial, and industrial. Due to the delay in user charge billing caused by the monthly or quarterly billing cycle, the District accrues unbilled service charges with respect to services provided during the current year. (e) Inventories Inventories are valued at the lower of cost (weighted average cost) or market. (f) Prepayments Prepayments represent costs of insurance paid during the current audit year for coverage in subsequent years. (g) Restricted Assets The District maintains specific investments held by the bank for safekeeping for funds intended for equipment replacement. The equipment replacement funds are classified as restricted assets and were approximately $14,411,000 in 2014 and Also included in restricted assets are investments, receivables, and other assets available for restricted liabilities related to the District's capital improvement program of $173,584,000 and $174,777,000 in the same periods. Investments restricted for debt service were $25,541,000 and $26,518,000, respectively. (h) Property Taxes and Capital Charges Property taxes levied have been designated by the District's Commission to be legally available for capital expenditures, capital programs, and debt service requirements in the ensuing year. Taxes levied in 2014, to be collected in 2015, of $93,639,000, have been included in deferred inflows of resources in the statements of net position at December 31, 2014, and are available for expenditure in Taxes levied in 2013, to be collected in 2014, of $91,222,000, have been included in deferred inflows of resources in the statements of net position at December 31, 2013, and were available for expenditure in The various municipalities within the District's legal boundary initially collect District taxes. As collections are made, the local or county treasurer makes pro rata settlements with the District beginning on or before January 15 each year and monthly thereafter. All municipalities are required to remit delinquent District taxes to the treasurer of the county in which such municipality is located by August 15 each year. The county treasurer, in turn, must settle the taxes in full with the District by August 20 regardless of actual collections. Communities outside the District's legal boundary, but within the service area are assessed a capital charge in place of levying a property tax. (i) Capital Contributions Capital contributions consist of federal and state grants and funds from the State of Wisconsin used to finance capital expenditures. Federal and state grant receivables are recognized as the related capital project expenditures are incurred. Revenue from grants and contributions is recognized in the year in which all eligibility requirements have been satisfied. Eligibility requirements include timing requirements, which specify the year when the resources are required to be used or the fiscal year when use is first permitted, matching requirements, in which the District must provide local resources to be used for a specified purpose, and expenditure requirements, in which the resources are provided to the District on a reimbursement basis. (j) Capital Assets Capital assets, which include land, land easements, land improvements, buildings, aeration and clarifier tanks, machinery and equipment, intercepting sewer system, interceptor rights, and watercourse improvements, are stated at cost. The District defines capital assets as assets with an initial individual cost of more than $5,000 and an estimated useful life of three or more years. Public domain property (i.e., sewers) and other capital assets are recorded at cost. Donated capital assets are recorded at their estimated fair value at the date of donation. The cost of normal maintenance and repairs that do not add to the value of the asset or materially extend the assets' lives are not capitalized. Interest is capitalized on constructed assets acquired with tax-exempt debt. The amount of interest to be capitalized is calculated by offsetting interest expense incurred from the date of the borrowing until completion of the project with interest earned on invested proceeds over the same period. Capitalized interest cost is amortized on the same basis as the related asset is depreciated. The amount of interest capitalized was $5,017,000 and $6,587,000 in 2014 and 2013, respectively. Depreciation/amortization are provided using the straight-line method over the following estimated useful lives: Years Land easements 50 Land improvements Buildings Aeration and clarifier tanks Machinery and equipment 3-50 Intercepting sewer system Interceptor rights 50 Watercourse improvements Depreciation is not provided on construction in progress until the project is completed and placed in service.
27 Notes to Financial Statements Continued December 31, 2014 And 2013 (k) Vacation Pay Vacation pay is accrued as earned and is to be used within one year. The accrued vacation pay of $1,053,000 and $1,097,000 at December 31, 2014 and 2013, respectively, is classified as a current liability. (l) Retainers Payable The District withholds payment for a portion of construction work completed. Upon completion of construction projects, the District remits payment for the amount withheld. Retainers expected to be paid during the next year are classified as current. (m) Deferred Inflows of Resources A deferred inflow of resources represents an acquisition of net position that applies to a future period and therefore will not be recognized as an inflow of resources (revenue) until that future time. On an accrual basis, revenue from property taxes and capital charges for communities outside the District are recognized in the period they are intended to finance, which is the year after the taxes are levied and the capital charges are incurred. A deferred inflow of resources arises when assets are recognized before the period for revenue recognition has occurred. Gains or losses on refunding are deferred and amortized over the life of related bonds on a straight line basis and are reported as deferred inflows or outflows. (n) Bond Premiums and Discounts Bond premiums and discounts are deferred and amortized over the life of the bonds using the effective interest method. Bonds payable are reported net of the applicable bond premium or discount. (o) Vested Sick Pay Prior to 1984, it was the District's practice that employees could accumulate unused sick pay to a maximum of 240 days, and upon retirement could receive payment for one-half of their accumulated days. In 1984, the accumulated unused sick pay for management employees was frozen at the balance earned as of December 31, The Union employees continued to accumulate unused sick pay until The accumulated sick pay for Union employees was frozen at the balance earned as of April 30, The frozen sick pay of the management employees is $43,000 and $51,000 at December 31, 2014 and 2013, respectively, and the frozen sick pay of the Union employees is $912,000 and $1,064,000 at December 31, 2014 and 2013, respectively. Of the total, $555,000 and $715,000 at December 31, 2014 and 2013, respectively, are classified as a long-term liability. The current portion is included with accrued salaries and wages. (p) Net Position Net position is displayed in three components as follows: Investment in Capital Assets consists of all capital assets, net of accumulated depreciation and reduced by outstanding debt that is attributable to the acquisition, construction, and improvement of those assets; debt related to unspent proceeds or other restricted cash and investments is excluded from the determination. Restricted consists of constraints placed on net position that are legally restricted by outside parties or by law through constitutional provisions or enabling legislation. When both restricted and unrestricted resources are available for use, generally it is the District's policy to use restricted resources first, then unrestricted resources when they are needed. Unrestricted consists of net position that does not meet the definition of restricted or net investment in capital assets. (q) Classification of Revenues and Expenses The District has classified its revenues as either operating or nonoperating. Operating revenue includes activities that have the characteristics of exchange transactions, including sewer user charges and fertilizer (Milorganite ) sales. Nonoperating revenue includes interest income on investments and activities that have characteristics of nonexchange transactions including federal, state, and local grants and contributions. Operating expenses are related to the operating, managing, and maintaining of the District's sewerage system. These expenses are primarily funded by sewer user charges and sales of Milorganite. Nonoperating expenses are related to the cost of acquiring, purchasing, adding to, leasing, planning, designing, constructing, extending, and improving all or any part of the District's sewerage system; capital programs designed to finance improvements outside the system that minimize the need for future system expansion; and paying principal, interest, or premiums on any indebtedness for these purposes. These expenses are primarily funded by property taxes levied on member communities and capital billings to communities outside the District. (r) Gain (Loss) on Disposal of Capital Assets Gains and losses on disposal of capital assets includes assets retired as well as projects that were terminated and disposed of during the year. In addition, the cost demolition associated with certain water course properties is included here. (s) Capital Program Expenditures The District offers funding to municipalities for planning, design, investigation, and construction of projects intended to reduce inflow and infiltration on private property. Actual costs reimbursed by the District to municipalities are shown as a nonoperating expense on the statements of revenues, expenses, and changes in net position. (t) Land Contributed to Municipalities As part of its watercourse and flood abatement program, the District purchases natural wetlands to reduce the risk of future flooding problems. These properties are subsequently donated to local municipalities because they provide multiple benefits to the local community in the form of open space, wildlife habitat and passive recreation, while the District retain a conservation easement. (u) Use of Estimates The preparation of financial statements in conformity with U.S. generally accepted accounting principles requires management to make estimates and assumptions that affect the reported amounts of assets and liabilities and disclosure of contingent assets and liabilities at the date of the financial statements and the reported amounts of revenues, expenses, and capital contributions during the reporting period. Actual results could differ from those estimates. (v) New Accounting Pronouncements In June 2012, GASB issued Statement No. 67 Financial Reporting for Pension Plans an amendment of GASB Statement No. 25. The objective of this Statement is to improve financial reporting by state and local governmental pension plans. This Statement results from a comprehensive review of the effectiveness of existing standards of accounting and financial reporting for pensions with regard to providing decision-useful information, supporting assessments of accountability and interperiod equity, and creating additional transparency. This Statement replaces the requirements of Statements No. 25, Financial Reporting for Defined Benefit Pension Plans and Note Disclosures for Defined Contribution Plans, and No. 50, Pension Disclosures, as they relate to pension plans that are administered through trusts or equivalent arrangements (hereafter jointly referred to as trusts) that meet certain criteria. The requirements of Statements 25 and 50 remain applicable to pension plans that are not administered through trusts covered by the scope of this Statement and to define contribution plans that provide postemployment benefits other than pensions. The provisions of this statement are effective for calendar year The implementation of this statement is not anticipated to have an impact on the District's financial statements. In June 2012, GASB issued Statement No. 68 Accounting and Financial Reporting for Pensions an amendment of GASB Statement No. 27. The primary objective of this Statement is to improve accounting and financial reporting by state and local governments for pensions. It also improves information provided by state and local governmental employers about financial support for pensions that is provided by other entities. This Statement results from a comprehensive review of the effectiveness of existing standards of accounting and financial reporting for pensions with regard to providing decision-useful information, supporting assessments of accountability and interperiod equity, and creating additional transparency. The provisions of this statement are effective for calendar year The implementation of this statement may restate portions of the financial statements. In January 2013, GASB issued Statement No. 69 Government Combinations and Disposals of Government Operations. This Statement establishes accounting and financial reporting standards related to government combinations and disposals of government operations. The provisions of this statement are effective for calendar year The implementation of this standard is not anticipated to have an impact on the District's financial statements. In April 2013, GASB issued Statement No. 70 Accounting and Financial Reporting for Nonexchange Financial Guarantees. The objective of this statement is to improve accounting and financial reporting by state and local governments that extend and receive nonexchange financial guarantees. The provisions of this statement are effective for calendar year The implementation of this standard is not anticipated to have an impact on the District's financial statements. In November 2013, GASB issued Statement No. 71 Pension Transition for Contributions Made Subsequent to the Measurement Date an amendment of GASB Statement No. 68. The objective of this Statement is to address an issue regarding application of the transition provisions of Statement No. 68, Accounting and Financial Reporting for Pensions. The issue relates to amounts associated with contributions, if any, made by a state or local government employer or nonemployer contributing entity to a defined benefit pension plan after the measurement date of the government's beginning net pension liability. The provisions of this Statement are required to be applied simultaneously with the provision of Statement No. 68 (calendar year 2015). (w) Reclassification Certain amounts in the 2013 financial statements may have been reclassified to conform with the classification used in (3) Deposits and Investments As of December 31, 2014, the District had the following investments and cash and cash equivalents and maturities: Carrying Investment Maturities (in years) Value Less Than (In Thousands) Checking $(1,217) $(1,217) $ $ U.S. Instrumentalities 24,406 2,247 22,159 U.S. Treasuries 7,660 2,533 2,629 2,498 Local Government Investment Pool 64,559 64,559 Corporate Bonds 7,773 3,262 1,821 2,690 Certificates of Deposit Total Cash and Investments $103,983 $69,939 $6,697 $27,347 25
28 Notes to Financial Statements Continued December 31, 2014 And 2013 As of December 31, 2013, the District had the following investments and cash and cash equivalents and maturities: Carrying Investment Maturities (in years) Value Less Than (In Thousands) Checking $(1,505) $(1,505) $ $ U.S. Instrumentalities 21,925 1,929 19,996 U.S. Treasuries 10,486 4,781 2,560 3,145 Local Government Investment Pool 78,747 78,747 Corporate Bonds 8,345 3,185 3,335 1,825 Certificates of Deposit 1,302 1,302 Total Cash and Investments $119,300 $88,439 $5,895 $24,966 The checking account bank balance was $30,271 and $45,817 at December 31, 2014 and 2013, respectively. Deposits in each local and area bank are insured by the FDIC in the amounts of $250,000 for time and savings accounts (including NOW accounts) and $250,000 for demand deposit accounts (interest and noninterest bearing). Bank accounts are also insured by the State Deposit Guarantee Fund (SDGF) in the amount of $400,000. Interest rate risk is the risk changes in interest rates will adversely affect the fair value of an investment. During 2014 and 2013, the District was in compliance with its investment policy that all investments shall be limited to maturities not exceeding five years, and the District shall maintain at least $10,000,000 of its total investment portfolio in instruments maturing in 60 days or less. During 2014 and 2013, investments with maturities of less than 180 days, based on par value, comprised on average, 76.29% and 77.14%, respectively, of the District's month-end investment portfolio balance. Credit risk is risk that an issuer of an investment will not fulfill its obligations to the District. State law limits investments in commercial paper and corporate bonds to the top two ratings issued by a nationally recognized rating service at the time of purchase. The District investment policy further limits the purchase of commercial paper to issuers with a commercial paper program size of at least $500,000,000, except for banks and companies located within the District's boundaries. The District did not hold any investments in commercial paper as of December 31, 2014 and The District's investment in corporate bonds at December 31, 2014, ranged from AA+ to AA by Standard & Poor's, or Aaa to A2 by Moody's Investors Service. The District's investment in corporate bonds at December 31, 2013, ranged from AA+ to AA by Standard & Poor's, or Aaa to A2 by Moody's Investors Service. As to the credit risk related to the District's investment in the Local Government Investment Pool (LGIP), the investments are not insured. The Federal Deposit Insurance Corporation (FDIC) insures the pro rata share of certificates of deposit held by the LGIP. At December 31, 2014 and 2013, all of the District's investment in U.S. Instrumentalities are rated either AA+ by Standard & Poor's or Aaa by Moody's Investors Service. Concentration of credit risk is the risk of loss attributed to the magnitude of the District's investment in a single issuer. The District places no limit on the amount invested in any one issuer. As of December 31, 2014, the District had more than 5% of the District's investments in the following issuer: Issuer Percentage Federal National Mortgage Association 8.86 U.S. Treasury Note 7.28 Federal Farm Credit Banks 5.32 As of December 31, 2013, the District had more than 5% of the District's investments in the following issuer: Issuer Percentage Federal National Mortgage Association 9.05 In the case of deposits, in which the related risk is the event of a bank failure, the District's deposits may not be returned to it. The District maintained certificates of deposit of $800,000 and $1,300,000 at December 31, 2014 and These deposits, excluding $1,900 of accrued interest at December 31, 2014 and $2,200 of accrued interest at December 31, 2013, are fully insured through a combination of federal and state deposit insurance. (4) Operating Contract and Expenses On December 3, 2007, the Milwaukee Metropolitan Sewerage District Commission approved a 10-year contract effective March 1, 2008 with Veolia Water Milwaukee, LLC (Veolia) to replace UWS as the operator of the District's two wastewater treatment plants, biosolids management and field operations, while retaining ownership of the assets. Veolia's proposal was determined to be the most cost-effective and was selected based on a competitive bid process which included UWS and after evaluating the cost-effectiveness of returning the operations to the public sector. The District continued to operate its industrial waste pretreatment program; capital planning and engineering services; environmental laboratory, water quality monitoring and research; Milorganite sales, marketing and distribution while maintaining ownership of the assets. As part of the new contract with Veolia, the District transferred custody of the operating and maintenance supplies inventory to Veolia on March 1, 2008 while the District retained ownership. At the termination of the contract, custody of the inventory reverts back to the District, and any change in the value of inventory is paid by the District or to the District. Any changes in inventory levels throughout the term of the agreement are recorded as inventory. The operation and maintenance and utility fees are subject to adjustments based on various indices. The total net expenditures related to the contract for the year ended December 31, 2014 were $44,628,000 and for the year ended December 31, 2013 were $43,900,000. The District continues to operate its industrial waste pretreatment program, engineering, central lab monitoring and research, Milorganite sales, marketing, and distribution. Under the terms of the new contract with Veolia the District is liable for 75% of actual energy costs and Veolia is responsible for the remainder. (5) Federal and State Grants The District has been awarded federal grant funds for planning, design, and construction, and state grant funds for construction. Available and outstanding federal and state grants are presented as follows: Available Outstanding Grants Receivable Grant Funds Billed Unbilled Total (In Thousands) December 31, 2014: Federal $10,798 $462 $ $462 State and other 1, $12,004 $602 $ $602 December 31, 2013: Federal $12,461 $567 $ $567 State 1, $13,515 $1,360 $ $1,360 The District accrues for unbilled grant amounts based on eligible project expenditures incurred. Actual billings are made in accordance with respective grant provisions. Grants and amounts received may be subject to compliance audits. In the District's opinion, adjustments, if any, resulting from the disallowance of expenditures would not have a material adverse effect on the District's financial position. (6) Capital Assets Capital assets activity for the year ended December 31, 2014 was as follows: Balance, Balance, Beginning End of of Year Additions Deductions Adjustments Year (In Thousands) Capital assets not being depreciated: Land $72,519 $511 $ $ $73,102 Construction in progress 280,215 73, ,442 (1,350) 220,532 Total capital assets not being depreciated 352,806 73, ,442 (1,350) 293,634 Capital assets being depreciated: Land easements 18, ,576 Land improvements 19, ,549 Buildings 802, ,028 Aeration and clarifier tanks 85, ,242 Machinery and equipment 786,344 99,813 1, ,280 Intercepting sewer system 2,438,585 15,671 2,454,256 Interceptor rights 24, ,589 Watercourse improvements 342,415 6, ,075 Total capital assets being depreciated 4,517, ,530 1,877 4,639,595 Less accumulated depreciation: Land easements 3, ,524 Land improvements 11, ,262 Buildings 346,864 15, ,198 Aeration and clarifier tanks 38,253 1,121 39,374 Machinery and equipment 398,133 30,318 1, ,406 Intercepting sewer system 554,621 34, ,265 Interceptor rights Watercourse improvements 45,430 4,855 50,285 Total accumulated depreciation 1,398,450 87,647 1,045 1,485,052 Total capital assets being depreciated, net 3,119,492 35, ,154,543 Total capital assets, net $3,472,298 $(109,503) $132,274 $(1,350) $3,448,177 26
29 Notes to Financial Statements Continued December 31, 2014 And 2013 Capital assets activity for the year ended December 31, 2013 was as follows: Balance, Balance, Beginning End of of Year Additions Deductions Year (In Thousands) Capital assets not being depreciated: Land $72,519 $72 $ $72,591 Construction in progress 413,840 62, , ,215 Total capital assets not being depreciated 486,359 63, , ,806 Capital assets being depreciated: Land easements 18,545 18,545 Land improvements 19,538 19,538 Buildings 799,949 2, ,701 Aeration and clarifier tanks 83,235 2,014 85,249 Machinery and equipment 734,147 53,909 1, ,344 Intercepting sewer system 2,333, ,276 2,438,585 Interceptor rights 24,565 24,565 Watercourse improvements 340,369 2, ,415 Total capital assets being depreciated 4,329, ,562 1,712 4,517,942 Less accumulated depreciation: Land easements 2, ,152 Land improvements 11, ,748 Buildings 331,562 15, ,863 Aeration and clarifier tanks 37,167 1,086 38,253 Machinery and equipment 372,341 27,490 1, ,135 Intercepting sewer system 521,636 32, ,623 Interceptor rights Watercourse improvements 40,638 4,792 45,430 Total accumulated depreciation 1,317,362 82,784 1,696 1,398,450 Total capital assets being depreciated, net 3,011, , ,119,492 Total capital assets, net $3,498,089 $170,830 $196,621 $3,472,298 The District had construction contract commitments of approximately $10,715,000 and $21,668,000 as of December 31, 2014 and 2013, respectively. (7) Long-Term Obligations Changes in long-term obligations for the year ended December 31, 2014 were as follows: Due Within Beginning Ending One Balance Additions Reductions Balance Year (In Thousands) General obligation bonds $265,665 $ $(31,830) $233,835 $33,265 Plus unamortized premium 5,373 (1,252) 4,121 Total bonds payable 271,038 (33,082) 237,956 33,265 State of Wisconsin Clean Water Fund 704,591 37,193 (51,891) 689,893 54,349 Subtotal 975,629 37,193 (84,973) 927,849 87,614 Intergovernmental loan 24, ,589 1,129 Other long term debt 4,261 (777) 3, Other postretirement benefits 36,910 9,561 (4,565) 41,906 Vested sick pay 1,115 (160) Total $1,042,480 $46,778 $(90,475) $998,783 $89,920 Changes in long-term obligations for the year ended December 31, 2013 were as follows: Due Within Beginning Ending One Balance Additions Reductions Balance Year (In Thousands) General obligation bonds $296,380 $ $(30,714) $265,666 $31,831 Plus unamortized premium 6,942 (1,569) 5,373 Total bonds payable 303,322 (32,283) 271,039 31,831 State of Wisconsin Clean Water Fund 712,634 40,692 (48,735) 704,591 51,773 Subtotal 1,015,956 40,692 (81,018) 975,630 83,604 Intergovernmental loan 22,065 2,500 24,565 Other long term debt 5,038 (778) 4, Other postretirement benefits 32,558 9,380 (5,028) 36,910 Vested sick pay 1,205 (90) 1, Total $1,076,822 $52,572 $(86,914) $1,042,480 $84,781 The District has issued general obligations bonds to provide funds for the acquisition and construction of major capital assets. All general obligation bonds are backed by the full faith and credit of the District. Interest on these bonds is payable semiannually at varying interest rates ranging from 3.10% to 4.45% (effective interest rate of 4.07%). Debt service requirements are as follows: Year Principal Interest Subsidy* Total (In Thousands) 2015 $33,265 $11,597 $(670) $44, ,840 9,927 (646) 44, ,435 8,247 (620) 44, ,725 6,461 (590) 21, ,315 5,682 (557) 21, ,025 16,921 (2,238) 74, ,035 5,744 (1,131) 38, , (62) 3,310 Total $233,835 $64,756 $(6,514) $292,077 *The subsidy is based on the original 35% federal interest subsidy provided by the federal government. During fiscal year 2014 interest subsidies received were reduced by 7.2% and during federal fiscal year 2015, the subsidy payments have been reduced by 7.3%. This amount may continue to change based on sequestration. The District has received funds through the State of Wisconsin Clean Water Fund Loan Program. Interest on these loans is payable semiannually at varying interest rates ranging from 2.20% to 4.95% (effective interest rate of 2.56%). Principal is payable annually in varying amounts. Debt service requirements are as follows: Year Principal Interest Total (In Thousands) 2015 $54,349 $16,699 $71, ,521 15,278 70, ,259 13,839 69, ,766 12,402 68, ,753 10,945 67, ,405 34, , ,520 10, , , ,034 Total $689,893 $115,173 $805,066 The District has outstanding loan commitments available of $113,359,000 and $126,151,000 at December 31, 2014 and 2013, respectively, from the State of Wisconsin Clean Water Fund Loan Program. These commitments will be utilized for future construction of wastewater treatment facilities. In 2010, the District entered into an intergovernmental loan agreement with the City of Franklin to finance the Ryan Interceptor (project). The City of Franklin is constructing the project which will ultimately become an asset of the District. The City of Franklin has obtained Clean Water Fund Loan financing for this project at 2.46%. The District's obligation will equal the total principal and interest payments on that loan. The District has agreed to make payments to the City of Franklin beginning in 2015 and the debt is anticipated to be paid off in On January 3, 2017, the District will make a payment to the City of Franklin to reimburse the City for the sums paid toward the loan through The outstanding amount at December 31, 2014 is $24,588,634. Debt service requirements are as follows: Year Principal Interest Total (In Thousands) 2015 $1,129 $564 $1, , , ,288 1,878 4, , , , , ,698 1,757 8, , , , ,375 Total $24,589 $6,623 $31,212 On December 15, 2003, the District issued $38,105,000 General Obligation Capital Purpose Refunding Bonds, Series 2003I. The proceeds were used to purchase state and local government securities which, together with an initial cash deposit and debt service funds released, were placed in an irrevocable trust with an escrow agent to provide for future debt service payments on a portion of the General Obligation Capital Purpose Bonds, Series 2001A. and Series 2003D. Neither the defeased debt nor the funds held in trust are recorded on the District's statement of net assets. The difference between the reacquisition price and the net carrying amount of the old debt was a loss of $1,981,000, which is reported in the accompanying financial statements as a reduction to long-term obligations and is being amortized as a component of interest expense through The unamortized refunding loss was $502,000 as of December 31, The remaining balance on the Series 2003I Bonds at December 31, 2014 and 2013, included in general obligation bonds, is $22,980,000 and $28,080,000 respectively. 27
30 Notes to Financial Statements Continued December 31, 2014 And 2013 On April 21, 2005, the District issued $57,115,000 of General Sewerage System Refunding Bonds, Series 2005A. The proceeds were used to purchase state and local government securities which, together with an initial cash deposit and debt service funds released, were placed in an irrevocable trust with an escrow agent to provide for future debt service payments on a portion of the General Obligation Sewerage System Bonds, Series 2001A. Neither the defeased debt nor the funds held in trust are recorded on the District's statement of net assets. The difference between the acquisition price and the net carrying amount of the old debt was a loss of $217,000, which is reported in the accompanying financial statements as a reduction to long-term obligations and is being amortized as a component of interest expense through The unamortized refunding loss was $96,000 as of December 31, The remaining balance on the Series 2005A Bonds at December 31, 2014 and 2013, included in general obligation bonds, is $53,675,000 and $57,115,000 respectively. As of December 31, 2014 and 2013, $38,660,000 of the 2003D bonds remain defeased from this transaction. On July 3, 2007, the District issued $97,095,000 of General Sewerage System Refunding Bonds, Series 2007A, to refund $103,715,000 of outstanding bonds, Series 1997A. The 1997A bonds have been paid in full. The difference between the acquisition price and the net carrying amount of the old debt was a gain of $2,594,000, which is reported in the accompanying financial statements as a gain to long-term obligations and is being amortized as a component of interest expense through The unamortized refunding gain was $696,000 as of December 31, The remaining balance on the Series 2007A Bonds at December 31, 2014 and 2013, included in general obligation bonds, is $61,105,000 and $79,505,000, respectively. On August 4, 2008, the District issued $70,000,000 of General Sewerage System Bonds, Series 2008F, with an average interest rate of 4.9 percent. The proceeds are being used to fund district capital improvements. The remaining balance on the Series 2007F Bonds at December 31, 2014 and 2013, included in general obligation bonds, is $54,845,000 and $57,585,000, respectively. On December 23, 2010, the District issued $50,000,000 of General Obligation Sewerage System Bonds, Series 2010L with an average interest rate of 3.9 percent. Included in the proceeds is a subsidy from the Build America Bonds program of $9,186,000 which will reduce the payment over the life of the bonds until This amount may change based on sequestration. The proceeds are being used to fund district capital improvements. The remaining balance on the series 2010L Bonds at December 31, 2014 and 2013 included in general obligation bonds is $41,230,000 and $43,380,000, respectively. The District issued a promissory note to the Department of Commerce for $5,000,000 on October 1, 2010, which was amended on March 1, 2012 for an additional $945,000 of principal. The loan is secured by the equipment purchased with the loan proceeds. This is a zero interest loan for the first five years from the original due date of first payment and accrues interest on the unpaid balance at 6%, thereafter, starting on the payment due June 1, A standard payment of $64,790 is due every month until the last payment occurs on October 1, Payments began on May 1, 2012, with a six-month deferral of payment following the addition of principal with a deferral period from May 1, 2011 to November 1, The remaining balance at December 31, 2014 and 2013, included in the other long term debt is $3,483,000 and $4,260,000, respectively. Interest incurred to finance the construction of capital projects were capitalized as additional costs of capital projects. Such costs capitalized, net of related interest income, amounted to $5,017,000 and $6,587,000 in 2014 and 2013, respectively. A computation of the legal debt margin, as defined by Wisconsin Statute, as of December 31 follows: equalized valuation as determined by (In Thousands) the Supervisor of Assessments of the Wisconsin Department of Revenue $57,151,739 $56,031,758 Statutory debt limit rate - Wisconsin Statutes Section % 5% Statutory debt limit 2,857,587 2,801,588 General obligation indebtedness: Outstanding bonds issued by the District (233,835) (265,666) Clean Water Fund Program loans (689,893) (704,591) Legal debt margin $1,933,859 $1,831,331 (8) Risk Management The District is exposed to various risks of loss related to torts; theft of, damage to, or destruction of assets; errors and omissions; workers' compensation; and health care of its employees. The District carries policies of insurance with respect to its property, vessels, equipment, and passenger and commercial vehicles (including comprehensive liability), environmental site liability, contractor's pollution liability, owner's professional liability, excess workers' compensation and health benefits. The District carries no insurance coverage for general liability. Settled claims have not exceeded the commercial coverage in any of the past three years. There has been no reduction in insurance coverage from that of prior years. The District is self-insured for workers' compensation and employer liability claims subject to certain limits of coverage. In addition, the District retains the risk for all comprehensive general liability claims. A liability for a claim is established if information indicates that it is probable that a liability has been incurred at the date of the financial 28 statements and the amount of the loss is reasonably estimable. The liability for claims payable included with accounts payable in the statements of net assets includes claims incurred but not reported (IBNR) totaling approximately $6,176,000 and $1,425,000 as of December 31, 2014 and 2013, respectively (In Thousands) Unpaid claims, beginning of year $1,425 $265 $170 Claim payments (461) (570) (212) Current year claims and changes in estimates 5,212 1, Unpaid claims, end of year $6,176 $1,425 $265 In addition, the District retains a certain level of risk related to employee health insurance, and uses commercial insurance for stop-loss purposes. A liability for claims incurred but not reported (IBNR) is estimated at year end based on a review of the historical data. As of December 31, 2014 and 2013, the IBNR is $440,000 and $410,000, respectively (In Thousands) Unpaid claims, beginning of year $410 $460 $510 Claims and premiums paid (8,289) (7,451) (8,113) Current year claims and changes in estimates 8,319 7,401 8,063 Unpaid claims, end of year $440 $410 $460 The District does not allocate overhead costs or other nonincremental costs to the claims liabilities. (9) Contingencies and Commitments (a) Litigation The District is involved in various legal proceedings, claims, and administrative actions arising in the normal course of business. In the opinion of management, the District's liability, if any, will not materially affect its financial condition. Provision has been reflected in the accompanying financial statements if deemed appropriate by the District, for the following major lawsuits and administrative actions: BOSTCO, LLC and Parisian, Inc. v. MMSD Milwaukee County Circuit Court, Case No. 03-CV Suit was filed in 2003 for damages to the foundation of the Boston Store property allegedly caused by groundwater draw down from a construction project of the District. Trial to a jury resulted in a verdict for Plaintiff of $6.3 million. This verdict amount was reduced to $100,000 by court order. In addition, Plaintiff obtained an injunction requiring the District to abate the continuing nuisance by lining with concrete one mile of the deep tunnel at an estimated cost of approximately $20 million. In a 2013 decision, the Wisconsin Supreme Court upheld both the $100,000 damage award and the injunction order but found that the trial court did not make sufficient findings to support the tunnel lining order. It therefore remanded the matter to the Circuit Court to determine the appropriate remedy for abating the nuisance. This matter was resolved in January 2015 by agreement of the parties and the case was dismissed. MMSD agreed to a total payment of $6 million to plaintiffs, with the first $3 million paid in January 2015, and a second payment of $3 million due to plaintiffs by 2015 year end, provided that the siting of the anticipated new Milwaukee Bucks arena does not impact the Boston Store site. Under the terms of the settlement, if the Bucks' arena siting decision affects the Boston Store site, the second $3 million payment will not be due to plaintiffs. The $6 million due to plaintiffs in 2015 was accrued as a liability as of December 31, G&D Development Corporation, et al. v. MMSD and City of Milwaukee Milwaukee County Case No. 13-CV-0850 This case was filed in early 2013 and is based on an allegation of water damage from the July 22, 2010 rain event. Plaintiffs are owners or tenants of property and allege that MMSD and the City of Milwaukee caused recurring flooding to property located at 4044 North 31st Street in Milwaukee. Plaintiffs allege combined losses of $2,333,438. The District has assessed the likelihood of a negative outcome as less than probable. Metropolitan Interceptor Sewer Contamination with PCB's Polychlorinated biphenyl (PCB) contamination has been identified in the District's Basin H sewer near Capitol Drive. The sewer is directly downstream of an abandoned die casting facility with heavy PCB contamination. PCBs are present in the sewer at levels greater than 50 parts per million, triggering regulation by the United States Environmental Protection Agency ( U.S. EPA ) under the Toxic Substances Control Act ( TSCA ). The area for proposed remediation extends from Capitol Drive to downtown. The District has submitted a Risk Based Work Plan to the U.S. EPA for the remediation of Basin H. If approved by U.S. EPA, the estimated cost to implement the Work Plan is as much as $5 million. The District has notified its insurance carriers of this liability. PCB contamination has also been identified in a sewer running under Mitchell Park at levels exceeding 50 parts per million. The PCB contamination at this site is limited to a length of sewer less than 1000 feet in length. The District is waiting for an approved Work Plan for the Basin H sewer before it proceeds with additional work on the Mitchell Park site. The District does not have an estimated cost for remediation, but anticipates that it will be less than the cost to remediate the Basin H site. The District has notified its insurance carrier of this liability. Ronald Fratrick, et al. v. MMSD and City of Franklin Milwaukee County Case No. 14-CV-1083 In 2010, the District reached an agreement with the City of Franklin whereby the City would obtain a Clean Water Fund Loan for the construction of a regional interceptor in the southwest portion of Franklin and the District would expand the service area boundary within the City, subjecting additional properties to District taxes. The District agreed, upon completion of the interceptor project, to assume control of the interceptor and repay the loan on behalf of Franklin (approximately $41 million). Franklin resident Ronald Fratrick, on behalf of himself and unnamed John and Jane Does (potentially more than 100 residents of the newly added service area), filed suit on February 6, 2014, alleging the District failed to obtain legally adequate consent from the City of
31 Notes to Financial Statements Continued December 31, 2014 And 2013 Franklin before adding the additional properties to the District's service area. The City of Franklin is asking the case be dismissed or, in the alternative, that the District be required to repay the loan even if the plaintiffs prevail and the District's right to asses property taxes on the new sewer service area is held to be legally unenforceable. On March 6, 2015, the Circuit Court granted the District's motion for summary judgment and dismissed the case. Claim by MMSD against Advanced Disposal Services Emerald Park Landfill, LLC under a Landfill Gas Purchase Agreement The District has asserted a $1.2 million claim against Advanced Disposal Services Emerald Park Landfill, LLC for the breach of the Agreement by the Landfill due to the Landfill's failure to supply during 2014 the guaranteed volume of landfill gas to the District. In addition, the District has asserted a claim for the same $1.2 million against the Landfill's guarantor, Advanced Disposal Services Midwest, LLC. Claim by MMSD against J.F. Ahem and CNA Surety for coating failures at South Shore and Jones Island Treatment Plants A portion of paint application to Jones Island and South Shore clarifiers and equipment applied in 2010 through 2012 is failing (Contract Nos. J01008C01 and S02005C01). The extent of damages due to defective work is currently unknown, since some of the coated surfaces are not visible until the clarifiers are drained. A preliminary estimate of damages is $500,000. (b) Natural Gas Purchasing Commitment On March 1, 2008 the District entered into an operating contract with Veolia Water for operations of the wastewater treatment facilities. As part of the contract the District became directly responsible for 75% of the natural gas costs at the plants. During 2008 management and the Commission determined it to be prudent to enter into forward transactions with a supplier to purchase natural gas for future periods. At December 31, 2014 the District had commitments to purchase $4,304,045 in natural gas during the future year, of which 75% will be paid for by the District and 25% will be paid for by Veolia. At December 31, 2013, the District had commitments to purchase $1,708,150 in natural gas during the future year, of which 75% will be paid for by the District and 25% will be paid for by Veolia. These purchases will be recorded as expenses and liabilities in the period in which the gas is delivered. (10) Retirement System All full-time and other eligible employees of the District are members of the Employees' Retirement System of the City of Milwaukee (the System), a cost-sharing multiple employer defined benefit pension plan. The System provides retirement, disability, and death benefits to plan members and beneficiaries. The City Charter assigns the authority to establish and amend benefit provisions. The System issues a publicly available financial report that includes financial statements and required supplementary information for the City of Milwaukee. That report may be obtained by writing to the Employees' Retirement System of the City of Milwaukee, 200 East Wells Street, Room 603, Milwaukee, WI Plan members are required by charter ordinance of the City of Milwaukee to contribute, or have contributed on their behalf, 5.5% of their salary or wages to the System. The District is required to contribute the remaining amounts necessary to fund the System. In 1970, the District began contributing the 5.5% on behalf of the employees. However, as a result of Wisconsin Act 10, the management/nonrepresented employees were required to begin making the 5.5% employee contribution in Effective, October, 2011, the management/non-represented employees began to make the 5.5% employee contribution. The represented employees were not required to begin the contribution at that time since they were covered by a labor agreement that expired on April 30, Beginning the first pay period in May, 2012, the represented employees began making the 5.5% employee contribution. During 2014, the District was required to contribute an additional $1,401,000 to fully fund the plan as the value of the Plan assets decreased during the year. The District's additional contribution was determined based on the actuarial valuation performed in Contribution for the District and its employees (which equals both required and actual contributions) are as follows: Contribution rate: Employee requirement 5.5% 5.5% 5.5% Employer s contribution 5.5% 5.5% 5.5% Contribution amount (in thousands): Employee requirement (employees) $916 $870 $740 Employee requirement (District) 122 Employers requirement (District) 1,401 1,414 1,432 $2,317 $2,284 $2,294 (11) Other Postretirement Benefits The District provides postretirement health and life insurance in accordance with union contracts and Commission policy. Represented employees hired prior to December 1, 2004, who retired from the District on or after attaining age 55 with at least 10 years of creditable service, or who left employment prior to age 55 with at least 20 years of creditable service, are eligible for postretirement health insurance at age 55 and a pension benefit. For represented employees hired on or after December 1, 2004, the employee must have at least 20 years of service and reach age 55 in order to be eligible for the postretirement health insurance. Management/nonrepresented employees hired prior to August 1, 2002, covered by Commission policy, who retire from the District on or after attaining age 60 with at least 10 years of creditable service, or with at least 15 years of creditable service who are under the age of 60, are eligible for postretirement health insurance. Management/nonrepresented employees hired after August 1, 2002, covered by Commission policy, with at least 15 years of creditable service, will be entitled to the following pre-medicare health insurance benefits: Years of Service Premium Paid by District % % 25 or more 50% The District no longer pays for supplemental health insurance upon becoming Medicare eligible for management/nonrepresented employees hired after August 1, Currently, 487 retirees meet those eligibility requirements. The District provides the same health coverage as offered active employees. This insurance provides approximately 100% coverage; certain health coverage options involving deductibles; and co-pays. The Commission has the authority to establish and revise the funding policy for the plan. Currently the plan is funded on a pay-as-you-go basis. Effective March 1, 1998 the District curtailed the plans as a result of the transfer of 290 employees to a private contractor in conjunction with the privatization of the District's operations (see note 4). As of January 1, 2014 and 2013 the District's annual OPEB cost (expense) is calculated based on the annual required contribution of the employer (ARC), an amount actuarially determined in accordance with parameters of GASB Statement No. 45. The ARC represents a level of funding that, if paid on an ongoing basis, is projected to cover normal cost each year and amortize any unfunded actuarial liabilities (or funding excess) over a period not to exceed thirty years. The following table shows the components of the District's annual OPEB cost for the year, the amount actually contributed to plan, and changes in the District's net OPEB obligation to the plan: (In Thousands) Annual required contribution $10,489 $10,185 Interest on net OPEB obligation Adjustment to annual required contribution (1,584) (1,417) Annual OPEB cost 9,562 9,380 Contributions made (4,566) (5,028) Increase in net OPEB obligation 4,996 4,352 Net OPEB Obligation - Beginning of Year 36,910 32,558 Net OPEB Obligation - End of Year $41,906 $36,910 The District's annual OPEB cost, the percentage of annual OPEB cost contributed to the plan, and the net OPEB obligation for 2014, 2013 and 2012 was as follows: Percentage of Annual Annual OPEB OPEB Cost Net OPEB Fiscal Year Ended Cost Contributed Obligation (In Thousands) (In Thousands) 2014 $9, % $41, $9, % $36, $9, % $32,558 The funded status of the plan as of December 31, 2014 and 2013, the most recent actuarial valuation dates, was as follows: (In Thousands) Actuarial accrued liability (AAL) $178,564 $178,605 Actuarial value of plan assets Unfunded Actuarial Accrued Liability (UAAL) $178,564 $178,605 Funded ratio (actuarial value of plan assets/aal) Covered payroll (active plan members) $20,043 $20,864 UAAL as a percentage of covered payroll 891% 856% Actuarial valuations of an ongoing plan involve estimates for the value of reported amounts and assumptions about the probability of occurrence of events far into the future. Examples include assumptions about future employment, mortality, and the healthcare cost trend. Amounts determined regarding the funded status of the plan and annual required contributions of the employer are subject to continual revision as actual results are compared with past expectations and new estimates are made about the future. The schedule of funding progress, presented as required supplementary information following the notes to the financial statements, will present multiyear trend information that shows whether the actuarial value of plan assets is increasing or decreasing over time relative to the actuarial accrued liabilities for benefits. Projections of benefits for financial reporting purposes are based on the substantive plan (the plan as understood by the employer and plan members) and include the types of benefits provided at the time of each valuation and the historical pattern of sharing benefit costs between the employer and plan members to that point. The methods and assumptions used include techniques that are designed to reduce short-term volatility in actuarial accrued liabilities and the actuarial value of assets, consistent with the longterm perspective of the calculations. In the actuarial valuation, the entry age actuarial cost method was used. The 2014 Annual OPEB Cost was calculated using the actuarial assumptions of 1.78% investment rate of return and an annual healthcare cost trend rate of 9% initially, reduced by decrements to an ultimate rate of 5% after five years. The 2013 Annual OPEB Cost was calculated using the actuarial assumptions of 1.88% investment rate of return and an annual healthcare cost trend rate of 9% initially, reduced by 29
32 Notes to Financial Statements Continued December 31, 2014 And 2013 decrements to an ultimate rate of 4% after five years. Both rates include a 2.5% inflation assumption. The plan has not accumulated assets and does not hold assets in a segregated trust. The plan's unfunded actuarial accrued liability is being amortized as a level dollar amount. The amortization period is open and is 30 years. (12) Leases The District's primary source of lease revenue was derived from the City of Milwaukee for use of the District's 25th and Canal location and from Alterra Coffee for space within the District's Milwaukee River Flushing Station. The City of Milwaukee lease terminated in The Alterra Coffee lease terminates in 2017, with a five year option to extend. The District has one long term, through 2058, lease with Pt. Loomis Associates Limited Partnership related to an enclosed channel. The remaining leases involve seasonal crop land agreements on land from the District's Conservation Easement Program. Future minimum lease receipts under noncancelable operating leases (with initial or remaining lease terms in excess of one year) as of December 31, 2014 are as follows: Year ending December 31: 2015 $167, , , , , through , through , through , through , through , through , through , through ,964 Total minimum lease receipts $976,627 (13) Subsequent Events On May 11, 2015 the District issued $100,000,000 of general obligation debt to finance infrastructure improvements. The debt is payable over twenty years and bears interest at an average rate of percent. REQUIRED SUPPLEMENTARY INFORMATION Schedule of Funding Progress For Other Post Employment Benefits Plan UAAL as a Actuarial Percentage Actuarial Actuarial Accrued Unfunded of Valuation Value of Liability AAL Funded Covered Covered Date Assets (AAL) (UAAL) Ratio Payroll Payroll (In Thousands) 12/31/2014 $ $178,564 $178,564 0% $20, % 12/31/2013 $ $178,605 $178,605 0% $20, % 12/31/2012 $ $167,989 $167,989 0% $20, % See accompanying independent auditors report. Future minimum lease payments under noncancelable operating leases (with initial or remaining lease terms in excess of one year) as of December 31, 2014 are: Year ending December 31: 2015 $66, , ,230 Total minimum lease payments 169,041 Less current installments of obligations under operating leases (66,589) Obligations under operating leases, excluding current installments $102,452 The District has five lease agreements for antenna space on towers or buildings in the Milwaukee area. The antennas serve as hubs for the District's radio communication system that is used to send and receive data from the District's remote facilities, which are located throughout the service area. Each lease agreement is for 10 years. 30
33 This part of the Milwaukee Metropolitan Sewerage District s (District) comprehensive annual financial report presents detailed information as a context for understanding what the information in the financial statements, note disclosures, and required supplementary information says about the District s overall financial health. Contents Financial Trends These schedules contain trend information to help the reader understand how the District s financial performance and wellbeing have changed over time. Revenue Capacity These schedules contain information to help the reader assess the District s most significant revenue sources. Debt Capacity These schedules present information to help the reader assess the affordability of the District s current levels of outstanding debt and the government s ability to issue additional debt in the future. Demographic and Economic Information These schedules offer demographic and economic indicators to help the reader understand the environment within which the District s financial activities take place. Operating Information These schedules contain service and infrastructure data to help the reader understand how the information in the District s financial report relates to the services the government provides and the activities it performs. Exhibit B-1, B-2 B-3, B-4, B-5, B-6, B-7, B-8, B-9, B-10, B-11 B-12, B-13, B-14, B-15 B-16, B-17 B-18, B-19 Statistical Section 31
34 Exhibit B-1 Net Position By Components FOR THE FISCAL YEARS ENDED DECEMBER 31, 2005 THROUGH 2014 Fiscal Year (In Thousands) Investment in Capital Assets $ 2,486,416 $ 2,464,531 $ 2,466,406 $ 2,505,430 $ 2,481,000 Restricted - Capital Projects and Programs 34,527 46,210 37,633 21,158 17,781 Restricted - Equipment Replacement 14,411 14,411 14,411 14,916 16,066 Restricted - Debt Service 25,541 26,518 24,829 5,801 16,568 Unrestricted (4,382) 4,131 10,905 14,488 17,288 $ 2,556,513 $ 2,555,801 $ 2,554,184 $ 2,561,793 $ 2,548,703 32
35 Fiscal Year (In Thousands) $ 2,436,462 $ 2,343,490 $ 2,363,207 $ 2,307,119 $ 2,241,063 46, ,391 60,236 88, ,138 16,066 17,116 19,181 22,678 35,964 11,650 10,745 5,539 6,631 9,177 20,726 26,813 33,427 (25,045) (30,501) $ 2,531,803 $ 2,503,555 $ 2,481,590 $ 2,400,087 $ 2,371,841 33
36 Exhibit B-2 Change In Net Position FOR THE FISCAL YEARS ENDED DECEMBER 31, 2005 THROUGH 2014 Total Operating Nonoperating Income/(Loss) Change Operating Operating Income/ Revenues/ Before Capital Capital In Net Year Revenue Expenses (Loss) (Expenses) Contributions Contributions Position (In Thousands) 2014 $ 78,806 $ 175,605 $ (96,799) $ 91,507 $ (5,292) $ 6,004 $ , ,921 (89,524) 88,125 (1,399) 3,016 1, , ,924 (84,290) 72,440 (11,850) 4,241 (7,609) , ,675 (80,160) 91,201 11,041 2,049 13, , ,985 (76,202) 91,374 15,172 1,728 16, , ,909 (76,051) 102,305 26,254 1,994 28, , ,024 (77,435) 98,800 21, , , ,114 (80,357) 93,215 12, , , ,942 (75,403) 89,733 14,330 13,916 28, , ,245 (71,274) 89,928 18,654 2,384 21,038 34
37 Exhibit B-3 Operating Revenue by Source FOR THE FISCAL YEARS ENDED DECEMBER 31, 2005 THROUGH 2014 Total Sewer Operating User Year Revenue Charge Fertilizer Other (In Thousands) 2014 $ 78,806 $ 70,029 $ 7,993 $ ,397 69,572 7,667 1, ,634 69,578 7,827 1, ,515 69,570 7,252 1, ,783 70,355 7, ,858 68,460 7, ,589 62,430 7, ,757 49,232 4, ,539 48,005 5, ,971 46,779 5,
38 Exhibit B-4 Operating Expenses FOR THE FISCAL YEARS ENDED DECEMBER 31, 2005 THROUGH 2014 Industrial Total System- Laboratory & Waste & Finance, Operating Operation & Research Conveyance Engineering & Year Expenses Maintenance Services Monitoring Administration Depreciation (In Thousands) 2014 $ 175,605 $ 58,754 $ 2,449 $ 3,444 $ 23,311 $ 87, ,921 57,130 2,448 3,227 22,331 82, ,924 55,177 2,511 3,458 21,803 79, ,675 56,896 2,170 3,280 20,121 76, ,985 55,218 2,115 3,794 21,310 71, ,909 58,055 2,339 3,774 19,610 69, ,024 55,267 2,463 3,745 18,298 68, ,114 43,627 2,375 3,818 17,418 66, ,942 41,166 2,341 3,524 16,292 65, ,245 39,418 2,172 3,370 15,661 63,624 36
39 Exhibit B-5 Nonoperating Revenue and Expenses FOR THE FISCAL YEARS ENDED DECEMBER 31, 2005 THROUGH 2014 Capital Investment Capital Total Charges Income and Program Non-Operating Municipalities Change in Gain (Loss) on Land Expenditures Revenues Property Outside the Fair Value of Interest Disposal of Contributed to and Year (Expenses) Taxes District Investments Expenses Capital Assets Municipalities Other (In Thousands) 2014 $ 91,507 $ 90,919 $ 29,396 $ 437 $ (24,260) $ (2,110) $ (722) $ (2,153) ,125 88,626 28,424 (53) (24,293) (1,582) (176) (2,821) ,440 86,485 27, (22,663) (5,033) (8,782) (5,620) ,201 85,212 24, (21,783) 87-2, ,374 82,390 22, (13,333) (2,134) - 1, ,305 82,332 22,757 2,176 (11,725) 6, ,800 80,729 23,642 5,509 (12,430) 152-1, ,215 78,359 21,561 10,302 (15,195) (1,150) (1,506) ,733 76,086 21,428 9,821 (17,309) (987) (874) 1, ,928 74,619 22,982 6,421 (14,630) 185 (671) 1,022 37
40 Exhibit B-6 User Charge Revenue by Municipality Within the District FOR THE FISCAL YEARS ENDED DECEMBER 31, 2005 THROUGH 2014 Fiscal Year Municipality City of Cudahy $ 1,618,550 $ 1,507,280 $ 1,613,522 $ 1,656,103 $ 1,805,096 City of Franklin 2,040,662 2,006,441 1,914,760 1,925,628 1,931,327 City of Glendale 900, , , , ,462 City of Greenfield 1,945,286 1,944,800 1,964,108 1,962,998 1,957,031 City of Milwaukee 40,235,500 40,211,422 40,081,180 40,329,654 41,323,722 City of Oak Creek 2,133,231 2,069,149 1,991,631 2,005,209 2,052,065 City of St. Francis 540, , , , ,714 City of Wauwatosa 2,961,982 2,997,566 3,115,200 3,088,718 3,144,526 City of West Allis 3,726,150 3,717,622 3,716,622 3,721,541 3,679,178 Village of Bayside 239, , , , ,068 Village of Brown Deer 735, , , , ,976 Village of Fox Point 363, , , , ,502 Village of Greendale 788, , , , ,827 Village of Hales Corners 436, , , , ,876 Village of River Hills 84,893 84,355 85,807 89,742 88,543 Village of Shorewood 676, , , , ,074 Village of West Milwaukee 917, ,000 1,105,930 1,006, ,309 Village of Whitefish Bay 697, , , , ,223 Total Within the District $ 61,042,204 $ 60,825,796 $ 60,911,783 $ 61,088,112 $ 61,953,519 38
41 Fiscal Year $ 1,855,515 $ 1,648,318 $ 1,164,578 $ 1,095,397 $ 1,006,096 1,800,766 1,634,272 1,298,726 1,208,857 1,121, , , , , ,069 1,872,833 1,710,028 1,389,123 1,326,295 1,289,413 40,763,430 36,321,630 28,697,714 28,197,896 28,163,570 1,905,558 1,729,957 1,372,215 1,312,991 1,230, , , , , ,053 2,924,523 2,727,814 2,128,407 2,090,334 2,042,760 3,443,449 3,166,204 2,579,476 2,510,275 2,303, , , , , , , , , , , , , , , , , , , , , , , , , ,688 83,757 77,198 61,807 61,787 54, , , , , ,364 1,062,403 1,074, , , , , , , , ,421 $ 60,423,213 $ 54,762,037 $ 43,136,980 $ 42,066,901 $ 41,218,317 39
42 Exhibit B-7 User Charge Revenue by Municipality Outside the District FOR THE FISCAL YEARS ENDED DECEMBER 31, 2005 THROUGH 2014 Fiscal Year Municipality City of Brookfield $ 917,553 $ 898,795 $ 897,586 $ 956,248 $ 935,751 City of Mequon 1,206,940 1,094,553 1,119,264 1,077,743 1,056,814 City of Muskego 1,092,905 1,054,548 1,041,072 1,024,359 1,004,530 City of New Berlin 1,859,908 1,818,911 1,827,310 1,764,458 1,776,161 City of South Milwaukee* 30,496 28,042 27,588 25,225 27,456 Village of Butler 175, , , , ,528 Village of Caledonia 26,174 25,528 25,639 26,407 25,047 Village of Elm Grove 325, , , , ,781 Village of Germantown 1,387,769 1,413,618 1,278,930 1,190,224 1,185,985 Village of Menomonee Falls 1,777,329 1,745,112 1,799,637 1,750,504 1,721,685 Village of Thiensville 186, , , , ,356 Total Outside the District $ 8,986,711 $ 8,745,822 $ 8,666,392 $ 8,482,032 $ 8,401,094 * Household Hazardous Waste Program Charges Only 40
43 Fiscal Year $ 903,262 $ 838,566 $ 664,314 $ 662,935 $ 620,430 1,018, , , , , , , , , ,525 1,717,723 1,604,871 1,259,612 1,249,252 1,159,745 26,594 25,121 26,673 25,927 19, , , , , ,547 25,597 24,837 18,795 18,986 21, , , , , ,986 1,046,395 1,196, , , ,513 1,670,983 1,546,221 1,227,280 1,198,371 1,135, , , , , ,871 $ 8,036,502 $ 7,667,928 $ 6,094,913 $ 5,938,026 $ 5,561,056 41
44 Exhibit B-8 User Charge Rates FOR THE FISCAL YEARS ENDED DECEMBER 31, 2005 THROUGH 2014 Flow Biochemical Oxygen Total Suspended Connection (Cents Per Demand (BOD) Solids (TSS) Charge Year 1000 Gallons) (Cents Per Pound) (Cents Per Pound) (Dollars Per Year) 2014 $ $ $ $ Volumetric rate computed for domestic strength sewage using the equivalencies of 310 mg/l BOD equals pounds per thousand gallons and 370 mg/l TSS equals pounds per thousand gallons. This rate is applicable to the entire residential class and noncertified commercial users located within the District's Service Area. 42
45 Volumetric Average Million of Gallons (Dollars Per Household of Sewage 1,000 Gallons) (Dollars Per Year) Treated $ $ , , , , , , , , , ,914 43
46 Exhibit B-9 Wastewater Loadings by Customer Class FOR THE FISCAL YEARS ENDED DECEMBER 31, 2005 THROUGH 2014 Fiscal Year PARAMETER Billable Flow (1,000 Gallons) RESIDENTIAL 17,769,153 17,613,063 17,879,709 18,320,590 18,967,992 NON-CERTIFIED COMMERCIAL 10,399,901 10,353,855 10,833,579 10,536,191 10,446,335 CERTIFIED COMMERCIAL 1,684,463 1,710,422 1,819,600 1,703,993 1,727,538 CERTIFIED INDUSTRIAL 3,675,147 3,936,045 4,199,362 4,281,621 4,233,640 TOTALS 33,528,663 33,613,385 34,732,250 34,842,396 35,375,505 Biochemical Oxygen Demand (Pounds) RESIDENTIAL 45,940,473 45,536,920 46,226,302 47,366,157 49,039,952 NON-CERTIFIED COMMERCIAL 26,888,015 26,768,965 28,009,249 27,240,384 27,008,069 CERTIFIED COMMERCIAL 3,673,331 3,663,473 3,855,902 3,657,812 3,700,567 CERTIFIED INDUSTRIAL 39,320,945 43,583,211 41,248,840 40,762,360 36,817,277 TOTALS 115,822, ,552, ,340, ,026, ,565,865 Total Suspended Solids (Pounds) RESIDENTIAL 54,832,149 54,350,489 55,173,312 56,533,775 58,531,540 NON-CERTIFIED COMMERCIAL 32,092,121 31,950,040 33,430,370 32,512,699 32,235,413 CERTIFIED COMMERCIAL 4,380,708 4,366,923 4,544,170 4,297,500 4,344,976 CERTIFIED INDUSTRIAL 18,622,057 18,653,681 19,999,548 19,664,094 19,073,819 TOTALS 109,927, ,321, ,147, ,008, ,185,748 Connections RESIDENTIAL 266, , , , ,190 NON-CERTIFIED COMMERCIAL 37,373 37,164 37,483 37,104 37,168 CERTIFIED COMMERCIAL 2,012 2,030 2,014 1,991 1,937 CERTIFIED INDUSTRIAL TOTALS 306, , , , ,037 44
47 Fiscal Year ,320,420 19,698,689 20,026,541 20,533,243 20,836,934 10,630,049 11,023,024 11,287,080 11,402,418 11,618,451 1,719,087 1,811,252 1,831,139 1,817,212 1,830,504 4,428,295 4,949,082 4,940,546 4,990,285 5,631,645 36,097,851 37,482,047 38,085,306 38,743,158 39,917,533 49,951,014 50,928,990 51,776,620 53,086,645 53,871,809 27,482,929 28,498,927 29,181,616 29,479,812 30,038,342 3,708,026 3,782,908 3,846,072 3,813,845 3,920,354 37,344,665 33,061,583 32,762,861 31,931,705 46,030, ,486, ,272, ,567, ,312, ,860,739 59,618,952 60,786,216 61,797,902 63,361,480 64,298,611 32,802,206 34,014,850 34,829,671 35,185,582 35,852,214 4,342,935 4,425,570 4,496,269 4,459,543 4,594,815 18,840,371 18,401,146 19,091,693 18,711,208 24,411, ,604, ,627, ,215, ,717, ,157, , , , , ,468 37,286 37,245 37,005 36,656 36,481 1,980 2,075 2,078 2,034 2, , , , , ,828 45
48 Exhibit B-10 Ten Largest Sewer Users FOR THE FISCAL YEARS ENDED DECEMBER 31, 2005 AND Sewer Revenue Sewer Revenue Customer Type of Business Amount % Amount % MillerCoors Brewery $ 2,913, % $ 2,015, % D.R. Diedrich & Co. Leather tanning and finishing 693, % 288, % Malteurop North America Malt manufacturing 493, % - Patrick Cudahy Process meat products 487, % 185, % Milwaukee Water Works Water utility 428, % 531, % Wisconsin Paperboard Paperboard mill 410, % Gehl Guernsey Farms Inc. Food preparation 380, % 250, % Jonas Advanced Waste Hi-Mar Centralized Waste Treater 328, % Chris Hansen/Maple Food preparation 310, % Cargil Meat Solutions Meat packing plants 303, % 313, % Milwaukee County DHHS Health services 192, % Campbell Soup Supply Company Food preparation 269, % International Malting Corporation a Malt manufacturing 332, % LeSaffre Yeast Corp. b Food preparation 1,363, % Subtotal (10 largest) $ 6,751, % $ 5,743, % Balance from other customers 63,277, % 41,036, % Grand Totals $ 70,028, % $ 46,779, % a Consolidated to Malteurop North America b Moved out of state 46
49 Exhibit B-11 Property Tax Information FOR THE FISCAL YEARS ENDED DECEMBER 31, 2005 THROUGH 2014 Equalized Tax Rate Value Per $1,000 of Taxable Tax Equalized Year Property Levies Value 2014 $ 54,607,126,500 $ 93,639,000 $ ,567,657,800 91,222, ,435,721,000 88,694, ,252,275,690 86,531, ,383,339,276 85,674, ,267,788,363 82,458, ,866,836,566 82,458, ,086,040,141 80,841, ,345,510,236 78,486, ,665,579,328 76,200, Due to varying assessment policies in the municipalities of the District, the District uses equalized value of taxable property for tax rate purposes. Equalized valuations are net of the Tax Incremental District valuations. Equalized valuations amounts provided by Department of Revenue - State of Wisconsin. 47
50 Exhibit B-12 Bonded Debt Limit and Ratio of Bonded Debt to Equalized Value FOR THE FISCAL YEARS ENDED DECEMBER 31, 2005 THROUGH 2014 Fiscal Year Equalized Value (1) $ 57,151,739,300 $ 56,031,757,800 $ 56,637,438,900 $ 59,760,633,490 Debt Limit (5% of equalized value) (2) $ 2,857,586,965 $ 2,801,587,890 $ 2,831,871,945 $ 2,988,031,675 Outstanding Bonds Issued by the District $ 233,835,000 $ 265,665,000 $ 296,380,000 $ 309,080,000 Clean Water Fund Program Loans 689,893, ,591, ,633, ,199,044 Total General Obligation Debt $ 923,728,418 $ 970,256,497 $ 1,009,013,839 $ 970,279,044 Legal Debt Margin $ 1,933,858,547 $ 1,831,331,393 $ 1,822,858,106 $ 2,017,752,631 Percentage of Bonded Debt to Equalized Value 1.62% 1.73% 1.78% 1.62% (1) Includes Tax Increment District valuation reported by State of Wisconsin, Department of Revenue. (2) Per Wisconsin Statutes Section
51 Fiscal Year $ 61,995,778,776 $ 65,340,474,863 $ 66,735,584,066 $ 65,642,217,041 $ 62,260,061,536 $ 55,434,188,028 $ 3,099,788,939 $ 3,267,023,743 $ 3,336,779,203 $ 3,282,110,852 $ 3,113,003,077 $ 2,771,709,401 $ 321,635,000 $ 281,440,000 $ 301,145,000 $ 247,735,000 $ 270,170,000 $ 285,335, ,150, ,285, ,575, ,824, ,824, ,685,252 $ 983,785,024 $ 892,725,569 $ 906,720,697 $ 768,559,326 $ 741,994,272 $ 725,020,252 $ 2,116,003,915 $ 2,374,298,174 $ 2,430,058,506 $ 2,513,551,526 $ 2,371,008,805 $ 2,046,689, % 1.37% 1.36% 1.17% 1.19% 1.31% 49
52 Exhibit B-13 Per Capita Debt, Personal Income and Unemployment Rate FOR THE FISCAL YEARS ENDED DECEMBER 31, 2005 THROUGH 2014 Milwaukee Outstanding Debt Milwaukee Outstanding County Personal District Personal Percentage County General Obligation District Income Income Per Per of Personal Unemployment Year Debt Population (Thousands) Capita Capita Income Rate 2014 $ 923,728, ,689 Not Available - $ % ,256, ,373 $ 39,213,035 $ 42,193 1, % 8.3% ,009,013, ,307 38,808,170 41,850 1, % 8.4% ,279, ,321 37,035,130 39,938 1, % 9.0% ,785, ,579 35,893,702 38,738 1, % 9.6% ,725, ,698 35,586,784 39, % 9.3% ,720, ,296 35,182,312 38, % 5.5% ,559, ,144 34,107,037 37, % 5.9% ,994, ,696 32,500,267 35, % 5.7% ,020, ,726 30,895,266 33, % 5.7% Note: Personal income for Milwaukee County includes City of South Milwaukee. Data for current year not yet available. District population excludes City of South Milwaukee and includes portion of Village of Bayside outside Milwaukee County. Sources: District population from U.S. Bureau of the Census and Wisconsin Department of Administration. Milwaukee County personal income from U.S. Bureau of Economic Analysis. Milwaukee County unemployment rate from Wisconsin Department of Workforce Development. 50
53 Exhibit B-14 Computation of Overlapping Debt FOR THE FISCAL YEAR ENDED DECEMBER 31, 2014 Percentage of Amount of Debt Net Debt Debt Within Within District Name of Government Unit Outstanding District Boundary Boundary Villages & Cities: Village of Bayside $ 15,178, % $ 15,178,665 Village of Brown Deer 23,597, % 23,597,849 Village of Fox Point 11,062, % 11,062,421 Village of Greendale 17,405, % 17,405,000 Village of Hales Corners 6,211, % 6,211,444 Village of River Hills 6,772, % 6,772,277 Village of Shorewood 35,034, % 35,034,140 Village of West Milwaukee 8,721, % 8,721,653 Village of Whitefish Bay 41,200, % 41,200,767 City of Cudahy 23,988, % 23,988,464 City of Franklin 37,711, % 37,711,522 City of Glendale 35,525, % 35,525,000 City of Greenfield 40,355, % 40,355,000 City of Milwaukee 759,463, % 759,463,723 City of Oak Creek 84,840, % 84,840,000 City of Saint Francis 10,780, % 10,780,000 City of Wauwatosa 84,685, % 84,685,000 City of West Allis 75,644, % 75,644,912 Total Cities and Villages $ 1,318,177,837 $ 1,318,177,837 School Districts: Brown Deer $ 27,200, % $ 27,200,312 Cudahy 16,974, % 16,974,428 Fox Point-Bayside 5,260, % 5,260,000 Franklin 33,940, % 33,940,000 Glendale-River Hills 4,128, % 4,128,196 Greendale 15,975, % 15,975,000 Greenfield 51,979, % 51,979,428 Maple Dale-Indian Hill 2,536, % 2,536,465 Milwaukee Area Technical College 109,920, % 86,968,704 Milwaukee Public 104,000, % 104,000,923 Nicolet High School 7,675, % 7,675,000 Oak Creek-Franklin 43,555, % 43,555,000 Shorewood 19,860, % 19,860,000 Saint Francis 12,715, % 12,715,000 Wauwatosa West Allis-West Milwaukee 14,167, % 13,208,674 Whitefish Bay 15,860, % 15,860,000 Whitnall 280, % 280,000 Total School Districts $ 486,027,588 $ 462,117,130 Milwaukee County $ 685,012, % $ 671,655,158 Total Overlapping Debt $ 2,489,218,335 $ 2,451,950,125 Sources: Equalized value used to determine percentage of debt within District boundary from Wisconsin Department of Revenue. Net debt outstanding provided by the Milwaukee County Department of Administration. 51
54 Exhibit B-15 Ten Largest Taxpayers for Milwaukee County FOR THE FISCAL YEARS ENDED DECEMBER 31, 2005 AND 2014 Name of Business Type of Business Mayfair Mall LLC Shopping Mall Bayshore Town Center LLC Shopping Mall Northwestern Mutual Life Insurance Co. Insurance US Bank Corp Banking BRE Southridge Mall LLC Shopping Mall Mandel Group Real Estate Wal-Mart/Sam's Club Retailer Metropolitan Associates Real Estate Marcus Corp./Milw. City Center/Pfister Hotels, Theaters, Convention Center Forest County Potawatomi Community Hotel, Parking Structure Covenant Health Care Health care 411 East Wisconsin Avenue Real estate M&I Marshall & Ilsley Bank a Banking Towne Realty b Real estate Total for Ten Largest a Now BMO Harris Bank b Divested Holdings Source: Largest Industrial Taxpayer - Milwaukee County Non-Industrial Taxpayer - MMSD 52
55 Percentage of Percentage of Equalized Total Equalized Equalized Total Equalized Valuation Valuation Valuation Valuation $ 406,619, % $ 280,997, % 319,735, % 308,805, % 254,665, % 276,645, % 239,447, % 161,689, % 144,953, % 158,094, % 145,863, % 126,746, % 127,736, % 120,951, % 114,424, % 84,939, % 146,277, % 94,807, % 122,828, % 122,235, % $ 2,110,089, % $ 1,648,374, % 53
56 Exhibit B-16 Population by Municipality FOR THE FISCAL YEARS ENDED DECEMBER 31, 2005 THROUGH 2014 Percentage Fiscal Year Change Municipality Bayside 4,376 4,380 4,380 4,383 4,300 4,170 4,172 4,181 4,207 4, % Brown Deer 12,157 12,086 12,065 12,001 11,999 11,720 11,705 11,715 11,750 11, % Cudahy 18,224 18,227 18,247 18,253 18,267 18,650 18,620 18,530 18,430 18, % Fox Point 6,676 6,630 6,644 6,665 6,701 6,803 6,818 6,821 6,808 6, % Franklin 35,702 35,810 35,520 35,504 35,451 33,700 33,550 33,380 33,000 32, % Glendale 12,773 12,845 12,808 12,833 12,872 12,980 12,990 12,970 12,935 13, % Greendale 14,144 14,165 14,123 14,027 14,046 13,950 13,995 14,025 14,040 14, % Greenfield 36,687 36,770 36,740 36,672 36,720 36,300 36,270 36,140 36,150 36, % Hales Corners 7,678 7,691 7,683 7,685 7,692 7,646 7,646 7,640 7,642 7, % Milwaukee 595, , , , , , , , , , % Oak Creek 34,707 34,695 34,530 34,495 34,451 32,600 32,470 32,410 32,104 31, % River Hills 1,584 1,587 1,591 1,593 1,597 1,634 1,641 1,621 1,625 1, % St. Francis 9,465 9,462 9,452 9,448 9,365 8,936 8,952 8,877 8,808 8, % Shorewood 13,183 13,189 13,174 13,177 13,162 13,360 13,425 13,440 13,470 13, % Wauwatosa 46,766 46,705 46,320 46,380 46,396 45,800 45,880 45,930 46,120 46, % West Allis 60,272 60,300 60,300 60,365 60,411 60,600 60,370 60,410 60,300 60, % West Milwaukee 4,197 4,205 4,200 4,206 4,206 4,029 4,047 4,034 4,052 4, % Whitefish Bay 14,105 14,126 14,105 14,109 14,110 13,820 13,875 13,830 13,885 13, % Total District population 928, , , , , , , , , ,726 Total population served by the District (2) 1,074,101 1,074,130 1,071,835 1,071,622 1,051,876 1,054,725 1,061,180 1,058,440 1,057,992 1,059, = 100% 101.4% 101.4% 101.2% 101.2% 99.3% 99.6% 100.2% 99.9% 99.9% 100.0% Total state population 5,732,981 5,717,110 5,703,525 5,694,236 5,686,986 5,688,040 5,675,156 5,648,124 5,617,744 5,580, = 100% 102.7% 102.4% 102.2% 102.0% 101.9% 101.9% 101.7% 101.2% 100.7% 100.0% (1) Includes all or parts of the following municipalities outside the District: Brookfield, Butler, Elm Grove, Germantown, Menomonee Falls, Mequon, Muskego, New Berlin, Thiensville and Village of Caledonia. Sources: U.S. Department of Commerce, Bureau of the Census, Department Service Center, Wisconsin Department of Administration, MMSD Cost Recovery Procedures Manual. 54
57 Exhibit B-17 Principal Private Sector Employers FOR THE FISCAL YEARS ENDED DECEMBER 31, 2005 AND Percentage Percentage Employer Employees of Total Rank Employees of Total Rank Aurora Health Care Inc. 24, % 1 14, % 1 Wheaton Franciscan Healthcare 10, % 2 Froedtert & Community Health 9, % 3 Roundy Supermarkets Inc. 9, % 4 6, % 4 Kohl's Corp. 7, % 5 6, % 7 Quad/Graphics Inc. 6, % 6 8, % 3 GE Healthcare 5, % 7 6, % 6 Columbia St. Mary's Health System 5, % 8 5, % 9 The Medical College of Wisconsin Inc. 5, % 8 Northwestern Mutual 5, % 10 Covenant Healthcare System Inc. 9, % 2 Marshall & Ilsley Corp. 6, % 5 SBC Corp. 6, % 8 Wal-Mart 5, % 10 Total for Ten Largest 88, % 75, % Total Milwaukee County Employment 447, % 427, % Note: Employee count reflects number of full-time equivalent employees in the Milwaukee area, including Milwaukee, Kenosha, Racine, Waukesha, Ozaukee, Walworth and Washington counties. Source: Employee count from Milwaukee Business Journal Book of Lists, Total County Employment from Wisconsin's Workforce and Labor Market Information System. 55
58 Exhibit B-18 Number of Employees by Identifiable Activity FOR THE FISCAL YEARS ENDED DECEMBER 31, 2005 THROUGH 2014 Full-time Equivalent Employees as of December 31, Engineering/Inspection/Construction/Water Quality Engineering Planning Operations Compliance Lab/Monitoring Administration Office of the Executive Director Legal Services Internal Services Total Employees Source: Milwaukee Metropolitan Sewerage District Payroll Records and O&M & Capital Budgets. 56
59 Full-time Equivalent Employees as of December 31,
60 Exhibit B-19 Operating and Capital Indicators FOR THE FISCAL YEARS ENDED DECEMBER 31, 2005 THROUGH 2014 Fiscal Year Wastewater Treatment Miles of Sewers Number of Water Reclamation Facilities Treatment Capacity (MGD) Storage Capacity (millions of gallons) Amount Treated Annually (millions of gallons) 68,300 73,900 60,100 74,100 Percentage of Treatment Capacity Utilized 56.70% 61.30% 49.90% 61.50% Number of Inline Storage System Events Number of Overflows Greenseams Acres Acquired to Date 3,058 2,682 2,500 2,348 Household Hazardous Waste (lbs collected) 1 909, , , ,804 Milorganite Production (tons) 45,408 47,954 45,203 49,376 Milorganite Tons Sold 45,498 47,672 41,378 36,073 Average selling price per ton shipped $ $ $ $ Does not include medicine collection pounds. Sources: MMSD O&M and Capital Budgets, MMSD Annual Capacity, Management, Operation, and Maintenance (CMOM) Program Report, and MMSD real estate records. 58
61 Fiscal Year ,300 72,200 77,600 67,400 69,400 62, % 59.90% 64.40% 56.00% 57.70% 52.20% ,254 2,034 1,848 1,621 1, ,266 1,095, ,113 1,306,475 1,326,732 1,016,601 48,817 45,338 40,786 27,693 33,566 43,175 36,685 39,277 35,792 32,722 41,469 42,073 $ $ $ $ $ $


62 MMSD s Mission To cost-effectively protect public health and the environment, prevent pollution and enhance the quality of area waterways Overall responsibility for preparation of this report was provided by: Mark T. Kaminski, Director of Finance/Treasurer, CPA Starr M. Pentek-Schuetz, Graphic Designer 60
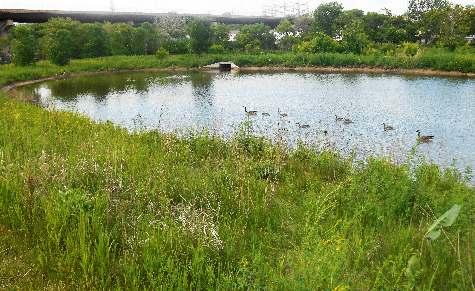


63 Bioretention


64 Milwaukee Metropolitan Sewerage District 260 W. Seeboth Street, Milwaukee, WI
2015 Comprehensive Annual Financial Report
 2015 Comprehensive Annual Financial Report For the Years Ended December 31, 2015 and 2014 Milwaukee Metropolitan Sewerage District Milwaukee, Wisconsin Jones Island Water Reclamation Facility 2015 Comprehensive
2016 Comprehensive Annual Financial Report
 2016 Comprehensive Annual Financial Report For the Years Ended December 31, 2016 and 2015 Milwaukee Metropolitan Sewerage District Milwaukee, Wisconsin SOUTH SHORE WATER RECLAMATION FACILITY 2016 Comprehensive
2017 Operations & Maintenance and Capital Budgets
 2017 Operations & Maintenance and Capital Budgets Milwaukee Metropolitan Sewerage District Milwaukee, Wisconsin Milwaukee Metropolitan Sewerage District 2017 Budget Commissioners John R. Hermes Chair Kris
ELECTRONIC PACKET NOVEMBER 13, 2017 POLICY, FINANCE, & PERSONNEL COMMITTEE MEETING. RELEASED: Monday, November 6, 2017
 ELECTRONIC PACKET NOVEMBER 13, 2017 POLICY, FINANCE, & PERSONNEL COMMITTEE MEETING RELEASED: Monday, November 6, 2017 Item 4 COMMISSION FILE NO: 17-110-11 DATE INTRODUCED: November 13, 2017 INTRODUCED
CITY OF LAKE ELMO, MINNESOTA COMPREHENSIVE ANNUAL FINANCIAL REPORT FOR THE FISCAL YEAR ENDED DECEMBER 31, 2017
 COMPREHENSIVE ANNUAL FINANCIAL REPORT FOR THE FISCAL YEAR ENDED DECEMBER 31, 2017 PREPARED BY: FINANCE DEPARTMENT CITY OF LAKE ELMO, MINNESOTA FINANCIAL STATEMENTS For the Fiscal Year Ended December 31,
ELECTRONIC PACKET. November 5, 2018 POLICY, FINANCE, & PERSONNEL COMMITTEE MEETING. RELEASED: Monday, October 29, 2018
 ELECTRONIC PACKET November 5, 2018 POLICY, FINANCE, & PERSONNEL COMMITTEE MEETING RELEASED: Monday, October 29, 2018 Item 4 COMMISSION FILE NO: 18-114-11 DATE INTRODUCED: November 5, 2018 INTRODUCED
MADISON METROPOLITAN SEWERAGE DISTRICT Madison, Wisconsin. FINANCIAL STATEMENTS December 31, 2015 and 2014
 MADISON METROPOLITAN SEWERAGE DISTRICT Madison, Wisconsin FINANCIAL STATEMENTS TABLE OF CONTENTS PAGE INDEPENDENT AUDITOR S REPORT... 1 MANAGEMENT S DISCUSSION AND ANALYSIS... 3 BASIC FINANCIAL STATEMENTS
BUCKEYE ELEMENTARY SCHOOL DISTRICT NO. 33
 BUCKEYE ELEMENTARY SCHOOL DISTRICT NO. 33 Comprehensive Annual Financial Report Fiscal Year Ended June 30, 2016 25555 West Durango Street Buckeye, Arizona 85326 BUCKEYE, ARIZONA COMPREHENSIVE ANNUAL FINANCIAL
COMPREHENSIVE ANNUAL FINANCIAL REPORT CITY OF ORMOND BEACH, FLORIDA FISCAL YEAR ENDED SEPTEMBER 30, 2018
 City of Ormond Beach Florida Photo by Sam West Comprehensive Annual Financial Report Fiscal Year Ended September 30, 2018 COMPREHENSIVE ANNUAL FINANCIAL REPORT FISCAL YEAR ENDED Prepared by: Finance Department
CITY OF LAKE ELMO, MINNESOTA COMPREHENSIVE ANNUAL FINANCIAL REPORT FOR THE FISCAL YEAR ENDED DECEMBER 31, 2016
 COMPREHENSIVE ANNUAL FINANCIAL REPORT FOR THE FISCAL YEAR ENDED DECEMBER 31, 2016 PREPARED BY: FINANCE DEPARTMENT CITY OF LAKE ELMO, MINNESOTA FINANCIAL STATEMENTS For the Fiscal Year Ended December 31,
CITY OF MINNETRISTA, MINNESOTA COMPREHENSIVE ANNUAL FINANCIAL REPORT YEAR ENDED DECEMBER 31, 2013
 , MINNESOTA COMPREHENSIVE ANNUAL FINANCIAL REPORT YEAR ENDED DECEMBER 31, 2013 PREPARED BY THE FINANCE DEPARTMENT OF THE CITY OF MINNETRISTA, MINNESOTA BRIAN GRIMM DIRECTOR OF FINANCE TABLE OF CONTENTS
CITY OF FRIENDSWOOD, TEXAS
 COMPREHENSIVE ANNUAL FINANCIAL REPORT YEAR ENDED SEPTEMBER 30, 2011 Officials Issuing Report: Roger C. Roecker City Manager Cindy S. Edge Director of Administrative Services COMPREHENSIVE ANNUAL FINANCIAL
Comprehensive Annual Financial Report
 Comprehensive Annual Financial Report Cambrian Commons, Rosemount - Built in 2016 For the Year Ended June 30, 2016 Dakota County Community Development Agency A component unit of Dakota County, Minnesota
City of Bentonville, Arkansas
 Comprehensive Annual Financial Report For the Year Ended December 31, 2016 Prepared by: Denise Land Finance Director Jake Harper Assistant Finance Director Visit our web site at: www.bentonvillear.com
MADISON METROPOLITAN SEWERAGE DISTRICT Madison, Wisconsin. FINANCIAL STATEMENTS December 31, 2016 and 2015
 MADISON METROPOLITAN SEWERAGE DISTRICT Madison, Wisconsin FINANCIAL STATEMENTS TABLE OF CONTENTS PAGE INDEPENDENT AUDITORS REPORT... 1 MANAGEMENT S DISCUSSION AND ANALYSIS... 3 BASIC FINANCIAL STATEMENTS
VILLAGE OF PALMETTO BAY, FLORIDA TABLE OF CONTENTS
 VILLAGE OF PALMETTO BAY, FLORIDA TABLE OF CONTENTS INTRODUCTORY SECTION Letter of Transmittal... i - iv Elected and Appointed Officials... v Organization Chart... vi Certificate of Achievement for Excellence
Comprehensive Annual Financial Report
 City of Brentwood, Missouri Comprehensive Annual Financial Report For the year ended December 31, 2014 Brentwood City Hall 2348 South Brentwood Boulevard Brentwood, Missouri 63144 brentwoodmo.org COMPREHENSIVE
CITY OF MINNETRISTA, MINNESOTA COMPREHENSIVE ANNUAL FINANCIAL REPORT YEAR ENDED DECEMBER 31, 2014
 , MINNESOTA COMPREHENSIVE ANNUAL FINANCIAL REPORT YEAR ENDED DECEMBER 31, 2014 PREPARED BY THE FINANCE DEPARTMENT OF THE, MINNESOTA BRIAN GRIMM DIRECTOR OF FINANCE TABLE OF CONTENTS YEAR ENDED DECEMBER
QUEEN CREEK UNIFIED SCHOOL DISTRICT NO. 95
 QUEEN CREEK UNIFIED SCHOOL DISTRICT NO. 95 Comprehensive Annual Financial Report Fiscal Year Ended June 30, 2016 20217 East Chandler Heights Road Queen Creek, Arizona 85142 QUEEN CREEK, ARIZONA COMPREHENSIVE
Milwaukee Metropolitan Sewerage District 2010 Annual Budget
 Milwaukee Metropolitan Sewerage District 2010 Annual Budget Dale J. Richards Chair Commissioners Wallace White Vice Chair Lyle A. Balistreri Pedro Colón David Cullen Michal Ann Dawson Ben Gramling Ronald
Comprehensive Annual Financial Report
 City of Brentwood, Missouri Comprehensive Annual Financial Report For the year ended December 31, 2012 Brentwood City Hall 2348 South Brentwood Boulevard Brentwood, Missouri 63144 brentwoodmo.org COMPREHENSIVE
VILLAGE OF PINGREE GROVE, ILLINOIS COMPREHENSIVE ANNUAL FINANCIAL REPORT
 VILLAGE OF PINGREE GROVE, ILLINOIS COMPREHENSIVE ANNUAL FINANCIAL REPORT FOR THE FISCAL YEAR ENDED APRIL 30, 2018 COMPREHENSIVE ANNUAL FINANCIAL REPORT FOR THE FISCAL YEAR ENDED APRIL 30, 2018 Prepared
VILLAGE OF KEY BISCAYNE, FLORIDA
 COMPREHENSIVE ANNUAL FINANCIAL REPORT FOR THE FISCAL YEAR ENDED SEPTEMBER 30, 2012 Prepared by: THE FINANCE DEPARTMENT COMPREHENSIVE ANNUAL FINANCIAL REPORT FOR THE FISCAL YEAR ENDED SEPTEMBER 30, 2012
City of Sanford, North Carolina Comprehensive Annual Financial Report For the Fiscal Year Ended June 30, 2005 TABLE OF CONTENTS INTRODUCTORY SECTION
 City of Sanford, North Carolina Comprehensive Annual Financial Report For the Fiscal Year Ended TABLE OF CONTENTS INTRODUCTORY SECTION PAGE Letter of Transmittal 1 GFOA Certificate of Achievement 5 Organizational
Celebrating 25 Years of Excellence
 Celebrating 25 Years of Excellence Comprehensive Annual Financial Report Fiscal Year Ended June 30, 2017 Chino Hills, California , CALIFORNIA COMPREHENSIVE ANNUAL FINANCIAL REPORT FISCAL YEAR ENDED JUNE
Marina Coast Water District Marina, California
 Marina Coast Water District Marina, California Comprehensive Annual Financial Report For The Fiscal Years Ended June 30, 2014 and 2013 11 Reservation Road, Marina California 93933 Marina Coast Water District
WEST BEND WATER AND SEWER UTILITIES Enterprise Funds of the City of West Bend, Wisconsin
 WEST BEND WATER AND SEWER UTILITIES Enterprise Funds of the City of West Bend, Wisconsin FINANCIAL STATEMENTS Including Independent Auditors' Report WEST BEND WATER AND SEWER UTILITIES Enterprise Funds
City of Murphy, Texas
 Comprehensive Annual Financial Report Fiscal Year Ended September 30, 2018 Prepared by: Finance Department This Page Left Intentionally Blank Comprehensive Annual Financial Report For the Fiscal Year Ended
DISCOVERY Clean Water Alliance. Vancouver, Washington
 DISCOVERY Clean Water Alliance Vancouver, Washington Comprehensive Annual Financial Report For The Fiscal Year Ended December 31, 2016 DISCOVERY CLEAN WATER ALLIANCE Vancouver, Washington COMPREHENSIVE
SALEM CITY CORPORATION FINANCIAL STATEMENTS
 FINANCIAL STATEMENTS FOR THE YEAR ENDED JUNE 30, 2014 TABLE OF CONTENTS Introductory Section: Page Letter of transmittal 3 Financial Section: Independent Auditors Report 7 Management Discussion and Analysis
SUNNYSIDE UNIFIED SCHOOL DISTRICT NO. 12 COMPREHENSIVE ANNUAL FINANCIAL REPORT FOR THE FISCAL YEAR ENDED JUNE 30, 2015
 COMPREHENSIVE ANNUAL FINANCIAL REPORT FOR THE FISCAL YEAR ENDED JUNE 30, 2015 2238 East Ginter Road Tucson, Arizona 85706 TUCSON, ARIZONA COMPREHENSIVE ANNUAL FINANCIAL REPORT FOR THE FISCAL YEAR ENDED
HEBER-OVERGAARD UNIFIED SCHOOL DISTRICT NO. 6
 HEBER-OVERGAARD UNIFIED SCHOOL DISTRICT NO. 6 Comprehensive Annual Financial Report Fiscal Year Ended June 30, 2012 3375 Buckskin Canyon Road P.O. Box 547 Heber, Arizona 85928 HEBER, ARIZONA COMPREHENSIVE
UPPER GWYNEDD TOWNSHIP
 ANNUAL FINANCIAL REPORT Year Ended December 31, 2011 INTRODUCTORY SECTION TABLE OF CONTENTS Page No. INTRODUCTORY SECTION Table of Contents...................................................................................................................
SALEM CITY CORPORATION FINANCIAL STATEMENTS
 FINANCIAL STATEMENTS FOR THE YEAR ENDED JUNE 30, 2016 ii Table of Contents Introductory Section Page Letter of transmittal... 3 Financial Section Independent Auditors Report... 7 Management Discussion
ROCK RIVER WATER RECLAMATION DISTRICT ROCKFORD, ILLINOIS FINANCIAL STATEMENTS AND INDEPENDENT AUDITOR S REPORT. For the Year Ended April 30, 2016
 FINANCIAL STATEMENTS AND INDEPENDENT AUDITOR S REPORT For the Year Ended April 30, 2016 TABLE OF CONTENTS Page(s) INDEPENDENT AUDITOR S REPORT... 1-3 GENERAL PURPOSE EXTERNAL FINANCIAL STATEMENTS Management
MADISON METROPOLITAN SEWERAGE DISTRICT Madison, Wisconsin. FINANCIAL STATEMENTS December 31, 2013 and 2012
 Madison, Wisconsin FINANCIAL STATEMENTS TABLE OF CONTENTS PAGE INDEPENDENT AUDITORS REPORT... 1 MANAGEMENT DISCUSSION AND ANALYSIS... 3 BASIC FINANCIAL STATEMENTS Statements of Net Position... 13 Statements
VILLAGE OF CARPENTERSVILLE Carpentersville, Illinois
 Carpentersville, Illinois FINANCIAL STATEMENTS Including Independent Auditors' Report As of and for the Year Ended April 30, 2012 TABLE OF CONTENTS As of and for the Year Ended April 30, 2012 Independent
BUCKEYE ELEMENTARY SCHOOL DISTRICT NO. 33
 BUCKEYE ELEMENTARY SCHOOL DISTRICT NO. 33 Comprehensive Annual Financial Report Fiscal Year Ended June 30, 2015 25555 West Durango Street Buckeye, Arizona 85326 BUCKEYE, ARIZONA COMPREHENSIVE ANNUAL FINANCIAL
C i t y o f R o a n o k e Te x a s
 C i t y o f R o a n o k e Te x a s C O M P R E H E N S I V E A N N U AL F I N AN C I AL R E P O R T For Fiscal Year Ended September 30, 2010 www.roanoketexas.com CITY OF ROANOKE, TEXAS COMPREHENSIVE ANNUAL
Ypsilanti Community Utilities Authority Environmental Leaders
 Ypsilanti Community Utilities Authority Environmental Leaders Dedicated to Providing Top Quality, Cost Effective, and Environmentally Safe Water and Wastewater Services to our Customers ANNUAL REPORT Year
WISCONSIN CENTER DISTRICT Milwaukee, Wisconsin. FINANCIAL STATEMENTS December 31, 2009 and 2008
 Milwaukee, Wisconsin FINANCIAL STATEMENTS TABLE OF CONTENTS PAGE INDEPENDENT AUDITOR S REPORT...1 MANAGEMENT S DISCUSSION AND ANALYSIS...2 FINANCIAL STATEMENTS Statements of Net Assets...7 Statements of
CITY OF HOWELL, MICHIGAN
 COMPREHENSIVE ANNUAL FINANCIAL REPORT For the Fiscal Year Ended June 30, 2017 Prepared by: Finance Department This page intentionally left blank. Table of Contents INTRODUCTORY SECTION Page Letter of Transmittal
CITY OF OAK GROVE, KENTUCKY. Financial Statements and Supplementary Information. For the Year Ended June 30, 2018
 Financial Statements and Supplementary Information For the Year Ended June 30, 2018 Table of Contents Independent Auditor s Report 1-2 Management s Discussion and Analysis 3-8 Basic Financial Statements:
City of Chicago Department of Water Management Sewer Fund Comprehensive Annual Financial Report For the Year Ended December 31, 2012
 City of Chicago Department of Water Management Sewer Fund Comprehensive Annual Financial Report For the Year Ended December 31, 2012 Rahm Emanuel, Mayor Lois Scott, Chief Financial Officer Amer Ahmad,
City of La Palma Agenda Item No. 6
 City of La Palma Agenda Item No. 6 MEETING DATE: December 20, 2016 TO: FROM: SUBMITTED BY: CITY COUNCIL CITY MANAGER Sea Shelton, Administrative Services Director AGENDA TITLE: Comprehensive Annual Financial
Ypsilanti Community Utilities Authority. Years Ended August 31, 2016 and Comprehensive Annual Financial Report
 Ypsilanti Community Utilities Authority Years Ended August 31, 2016 and 2015 Comprehensive Annual Financial Report This page intentionally left blank. Table of Contents Page Introductory Section Letter
CITY OF CHILTON, WISCONSIN ANNUAL FINANCIAL REPORT DECEMBER 31, 2012
 ANNUAL FINANCIAL REPORT DECEMBER 31, 2012 December 31, 2012 Table of Contents Page No. INDEPENDENT AUDITORS REPORT 1-2 MANAGEMENT S DISCUSSION AND ANALYSIS 3-8 GOVERNMENT-WIDE FINANCIAL STATEMENTS Statement
Vistancia Community Facilities District Peoria, Arizona. Annual Financial Report For Fiscal Year Ended June 30, 2016
 Vistancia Community Facilities District Peoria, Arizona Annual Financial Report For Fiscal Year Ended June 30, 2016 District Board: Cathy Carlat, Chairperson Bridget Binsbacher, Vice-Chairperson John Edwards
SALEM CITY CORPORATION FINANCIAL STATEMENTS
 FINANCIAL STATEMENTS FOR THE YEAR ENDED JUNE 30, 2017 Allred Jackson, PC 50 East 2500 North, Suite 200 North Logan, UT 84341 (P) 435.752.6441 (F) 435.752.6451 www.allredjackson.com ii Table of Contents
BROWARD COUNTY, FLORIDA WATER AND WASTEWATER FUND A Major Fund of Broward County, Florida
 BROWARD COUNTY, FLORIDA WATER AND WASTEWATER FUND A Major Fund of Broward County, Florida Financial Statements For the Years Ended BROWARD COUNTY, FLORIDA WATER AND WASTEWATER FUND FINANCIAL STATEMENTS
Deer Valley Unified School District #97
 Deer Valley Unified School District #97 COMPREHENSIVE ANNUAL FINANCIAL REPORT FOR THE YEAR ENDED JUNE 30, 2011 Deer Valley Unified School District Phoenix, Arizona Prepared by: Fiscal Services Department
CITY OF COUNTRYSIDE, ILLINOIS COMPREHENSIVE ANNUAL FINANCIAL REPORT. For the Year Ended April 30, 2010
 COMPREHENSIVE ANNUAL FINANCIAL REPORT For the Year Ended April 30, 2010 Prepared by The City of Countryside Finance Department TABLE OF CONTENTS Page(s) INTRODUCTORY SECTION Principal Officials... Organizational
BUCKEYE ELEMENTARY SCHOOL DISTRICT NO. 33
 BUCKEYE ELEMENTARY SCHOOL DISTRICT NO. 33 Comprehensive Annual Financial Report Fiscal Year Ended June 30, 2017 25555 West Durango Street Buckeye, Arizona 85326 BUCKEYE, ARIZONA COMPREHENSIVE ANNUAL FINANCIAL
TOLLESON UNION HIGH SCHOOL DISTRICT NO. 214
 TOLLESON UNION HIGH SCHOOL DISTRICT NO. 214 Comprehensive Annual Financial Report Fiscal Year Ended June 30, 2017 9801 West Van Buren Street Tolleson, Arizona 85353 TOLLESON, ARIZONA COMPREHENSIVE ANNUAL
CITY OF MINNETRISTA, MINNESOTA COMPREHENSIVE ANNUAL FINANCIAL REPORT YEAR ENDED DECEMBER 31, 2016
 , MINNESOTA COMPREHENSIVE ANNUAL FINANCIAL REPORT YEAR ENDED DECEMBER 31, 2016 PREPARED BY THE FINANCE DEPARTMENT OF THE CITY OF MINNETRISTA, MINNESOTA BRIAN GRIMM DIRECTOR OF FINANCE TABLE OF CONTENTS
Marina Coast Water District Marina, California
 Marina Coast Water District Marina, California Comprehensive Annual Financial Report For The Fiscal Year Ended June 30, 2015 11 Reservation Road, Marina California 93933 Marina Coast Water District Marina,
ALHAMBRA ELEMENTARY SCHOOL DISTRICT NO. 68
 ALHAMBRA ELEMENTARY SCHOOL DISTRICT NO. 68 Comprehensive Annual Financial Report Fiscal Year Ended June 30, 2013 4510 North 37 th Avenue Phoenix, Arizona 85019 PHOENIX, ARIZONA COMPREHENSIVE ANNUAL FINANCIAL
Environmental Improvement Fund
 Informational Paper 64 Environmental Improvement Fund Wisconsin Legislative Fiscal Bureau January, 2009 Environmental Improvement Fund Prepared by Kendra Bonderud Wisconsin Legislative Fiscal Bureau One
CLERK OF THE CIRCUIT COURT MONROE COUNTY BRANCH OFFICE
 BRANCH OFFICE MARATHON SUB COURTHOUSE 3117 OVERSEAS lllghway MARATHON, FLORlDA 33050 TEL. (305) 289-6027 FAX (305) 289-1745 CLERK OF THE CIRCUIT COURT MONROE COUNTY BRANCH OFFICE MONROE COUNTY COURTHOUSE
VILLAGE OF PALMETTO BAY VILLAGE OF PARKS
 VILLAGE OF PALMETTO BAY VILLAGE OF PARKS COMPREHENSIVE ANNUAL FINANCIAL REPORT FOR THE FISCAL YEAR ENDED SEPTEMBER 30, 2013 VILLAGE OF PALMETTO BAY, FLORIDA TABLE OF CONTENTS INTRODUCTORY SECTION Letter
Town of Ramapo, New York
 Town of Ramapo, New York BASIC FINANCIAL STATEMENTS AND SUPPLEMENTARY INFORMATION FOR THE YEAR ENDED DECEMBER 31, 2015 TOWN OF RAMAPO, NEW YORK Table of Contents TABLE OF CONTENTS 2 INDEPENDENT AUDITOR
SUNNYSIDE UNIFIED SCHOOL DISTRICT NO. 12 COMPREHENSIVE ANNUAL FINANCIAL REPORT FOR THE FISCAL YEAR ENDED JUNE 30, 2014
 COMPREHENSIVE ANNUAL FINANCIAL REPORT FOR THE FISCAL YEAR ENDED JUNE 30, 2014 2238 East Ginter Road Tucson, Arizona 85706 TUCSON, ARIZONA COMPREHENSIVE ANNUAL FINANCIAL REPORT FOR THE FISCAL YEAR ENDED
SUNNYSIDE UNIFIED SCHOOL DISTRICT NO. 12 COMPREHENSIVE ANNUAL FINANCIAL REPORT FOR THE FISCAL YEAR ENDED JUNE 30, 2012
 COMPREHENSIVE ANNUAL FINANCIAL REPORT FOR THE FISCAL YEAR ENDED JUNE 30, 2012 2238 East Ginter Road Tucson, Arizona 85706 TUCSON, ARIZONA COMPREHENSIVE ANNUAL FINANCIAL REPORT FOR THE FISCAL YEAR ENDED
FOREST PRESERVE DISTRICT OF DuPAGE COUNTY, ILLINOIS COMPREHENSIVE ANNUAL FINANCIAL REPORT
 FOREST PRESERVE DISTRICT OF DuPAGE COUNTY, ILLINOIS COMPREHENSIVE ANNUAL FINANCIAL REPORT FOR THE FISCAL YEAR ENDED JUNE 30, 2015 FOREST PRESERVE DISTRICT OF DUPAGE COUNTY, ILLINOIS COMPREHENSIVE ANNUAL
DEER VALLEY UNIFIED SCHOOL DISTRICT NO. 97
 DEER VALLEY UNIFIED SCHOOL DISTRICT NO. 97 Comprehensive Annual Financial Report Fiscal Year Ended June 30, 2012 20402 North 15 th Avenue Phoenix, Arizona 85027 PHOENIX, ARIZONA COMPREHENSIVE ANNUAL FINANCIAL
Comptroller Summary. Comptroller. Original Adjusted % Change % Change. FY 16 FY 17 FY 17 FY 18 Orig. FY 17 Adj. FY 17
 Summary FY 16 FY 17 FY 17 FY 18 Orig. FY 17 Adj. FY 17 Administration $432,391 $392,900 $415,190 $438,980 11.73% 5.73% Accounting 1,076,405 921,540 962,370 998,910 8.40% 3.80% Bond Issuance Expense 208,529
QUEEN CREEK UNIFIED SCHOOL DISTRICT NO. 95
 QUEEN CREEK UNIFIED SCHOOL DISTRICT NO. 95 Comprehensive Annual Financial Report Fiscal Year Ended June 30, 2014 20217 East Chandler Heights Road Queen Creek, Arizona 85142 QUEEN CREEK, ARIZONA COMPREHENSIVE
COMPREHENSIVE ANNUAL FINANCIAL REPORT. City of Murphy, Texas
 COMPREHENSIVE ANNUAL FINANCIAL REPORT Fiscal Year Ended September 30, 2008 City of Murphy, Texas Council/Administrator Form of Government City Manager James Fisher Director of Finance Linda Truitt CITY
This page intentionally left blank.
 This page intentionally left blank. Table of Contents Introductory Section Page Letter of Transmittal 1 GFOA Certificate of Achievement 5 Organizational Chart 6 List of Principal City Officials 7 Financial
RUNNING SPRINGS WATER DISTRICT ANNUAL FINANCIAL REPORT. Years Ended June 30, 2018 and 2017
 RUNNING SPRINGS WATER DISTRICT ANNUAL FINANCIAL REPORT Years Ended June 30, 2018 and 2017 Running Springs Water District Annual Financial Report Years Ended June 30, 2018 and 2017 I. INTRODUCTORY SECTION
CITY OF SHELTON, CONNECTICUT ANNUAL FINANCIAL REPORT. June 30, 2017
 ANNUAL FINANCIAL REPORT June 30, 2017 TABLE OF CONTENTS Page Number FINANCIAL SECTION Independent Auditor s Report 1-2 Management s Discussion and Analysis 3a-3g Basic Financial Statements: Government-Wide
BUTLER ELEMENTARY SCHOOL DISTRICT NO. 53
 BUTLER ELEMENTARY SCHOOL DISTRICT NO. 53 FINANCIAL STATEMENTS AS OF AND FOR THE YEAR ENDED JUNE 30, 2014 AND INDEPENDENT AUDITORS' REPORT TABLE OF CONTENTS AS OF AND FOR THE YEAR ENDED JUNE 30, 2014 Page(s)
VILLAGE OF PALMETTO BAY, FLORIDA COMPREHENSIVE ANNUAL FINANCIAL REPORT FOR THE FISCAL YEAR ENDED SEPTEMBER 30, 2015
 VILLAGE OF PALMETTO BAY, FLORIDA COMPREHENSIVE ANNUAL FINANCIAL REPORT FOR THE FISCAL YEAR ENDED SEPTEMBER 30, 2015 VILLAGE OF PALMETTO BAY, FLORIDA TABLE OF CONTENTS INTRODUCTORY SECTION (Unaudited) Letter
VILLAGE OF CARPENTERSVILLE Carpentersville, Illinois
 Carpentersville, Illinois FINANCIAL STATEMENTS Including Independent Auditors' Report For the Year Ended TABLE OF CONTENTS Independent Auditors' Report Management's Discussion and Analysis i -ii iii -
CITY OF EAST GRAND RAPIDS, MICHIGAN FINANCIAL STATEMENTS FOR THE YEAR ENDED JUNE
 , MICHIGAN FINANCIAL STATEMENTS Vredeveld Haefner LLC TABLE OF CONTENTS FINANCIAL SECTION PAGE Independent Auditors Report 1-2 Management s Discussion and Analysis 3-8 Basic Financial Statements Government-wide
City of Healdsburg. Comprehensive Annual Financial Report Year Ended June 30, Healdsburg Ridge.
 City of Healdsburg California Healdsburg Ridge Comprehensive Annual Financial Report Year Ended June 30, 2011 www.cityofhealdsburg.org CITY OF HEALDSBURG ADMINISTRATION 401 Grove Street Healdsburg,
FINANCIAL STATEMENTS AND INDEPENDENT AUDITORS REPORT GAINESVILLE REGIONAL UTILITIES GAINESVILLE, FLORIDA SEPTEMBER 30, 2018 AND 2017
 FINANCIAL STATEMENTS AND INDEPENDENT AUDITORS REPORT GAINESVILLE REGIONAL UTILITIES GAINESVILLE, FLORIDA SEPTEMBER 30, 2018 AND 2017 FINANCIAL STATEMENTS AND INDEPENDENT AUDITORS REPORT GAINESVILLE REGIONAL
METROPOLITAN NORTH GEORGIA WATER PLANNING DISTRICT ATLANTA, GEORGIA FINANCIAL STATEMENTS
 METROPOLITAN NORTH GEORGIA WATER PLANNING DISTRICT ATLANTA, GEORGIA FINANCIAL STATEMENTS For the Year Ending December 31, 2017 METROPOLITAN NORTH GEORGIA WATER PLANNING DISTRICT TABLE OF CONTENTS Page(s)
CITY OF EAST GRAND RAPIDS, MICHIGAN FINANCIAL STATEMENTS FOR THE YEAR ENDED JUNE
 , MICHIGAN FINANCIAL STATEMENTS Vredeveld Haefner LLC TABLE OF CONTENTS FINANCIAL SECTION PAGE Independent Auditors Report 1-2 Management s Discussion and Analysis 3-8 Basic Financial Statements Government-wide
Comprehensive Annual Financial Report
 City of Brentwood, Missouri Comprehensive Annual Financial Report For the year ended December 31, 2013 Brentwood City Hall 2348 South Brentwood Boulevard Brentwood, Missouri 63144 brentwoodmo.org COMPREHENSIVE
WATAUGA COUNTY, NORTH CAROLINA FINANCIAL STATEMENTS FOR THE FISCAL YEAR ENDED JUNE 30, 2017
 WATAUGA COUNTY, NORTH CAROLINA FINANCIAL STATEMENTS FOR THE FISCAL YEAR ENDED JUNE 30, 2017 Misty D. Watson, CPA, PA PO Box 2122 Boone, NC 28607 WATAUGA COUNTY, NORTH CAROLINA BOARD OF COUNTY COMMISSIONERS
CITY OF OAK CREEK Oak Creek, Wisconsin
 Oak Creek, Wisconsin FINANCIAL STATEMENTS Including Independent Auditors' Report As of and for the Year Ended December 31, 2011 TABLE OF CONTENTS As of and for the Year Ended December 31, 2011 Independent
Dunthorpe-Riverdale Service District No. 1 A Component Unit of Multnomah County, Oregon. Financial Statements and Reports of Independent Auditors
 Dunthorpe-Riverdale Service District No. 1 A Component Unit of Multnomah County, Oregon Financial Statements and Reports of Independent Auditors For the Fiscal Years Ended June 30, 2017 and 2016 Prepared
LOMBARD ELEMENTARY SCHOOL DISTRICT 44 LOMBARD, ILLINOIS
 COMPREHENSIVE ANNUAL FINANCIAL REPORT OF LOMBARD ELEMENTARY SCHOOL DISTRICT 44 LOMBARD, ILLINOIS As of and for the Year Ended June 30, 2016 Officials Issuing Report Dr. Michael Robey, Superintendent of
Greater New Haven Water Pollution Control Authority. Financial Report June 30, 2016 and 2015
 Greater New Haven Water Pollution Control Authority Financial Report June 30, 2016 and 2015 Contents Financial Section Independent auditor s report 1-2 Management s Discussion and Analysis - unaudited
DEDHAM-WESTWOOD WATER DISTRICT Financial Statements For the Year Ended December 31, 2017 (With Independent Auditors Report Thereon)
") DEDHAM-WESTWOOD WATER DISTRICT Financial Statements For the Year Ended December 31, 2017 (With Independent Auditors Report Thereon) Dedham-Westwood Water District TABLE OF CONTENTS PAGE INDEPENDENT AUDITORS
DEDHAM-WESTWOOD WATER DISTRICT Financial Statements For the Year Ended December 31, 2017 (With Independent Auditors Report Thereon) Dedham-Westwood Water District TABLE OF CONTENTS PAGE INDEPENDENT AUDITORS
2017 Comprehensive Annual Financial Report
 2017 Comprehensive Annual Financial Report For the Fiscal Year Ended December 31, 2017 COMPREHENSIVE ANNUAL FINANCIAL REPORT For The Fiscal Year Ended December 31, 2017 THE CITY OF BROOKFIELD, WISCONSIN
CITY OF RACINE. Racine, Wisconsin FINANCIAL STATEMENTS. Including Independent Auditors' Report. As of and for the Year Ended December 31, 2013
 Racine, Wisconsin FINANCIAL STATEMENTS Including Independent Auditors' Report As of and for the Year Ended December 31, 2013 TABLE OF CONTENTS As of and for the Year Ended December 31, 2013 Independent
COMPREHENSIVE ANNUAL FINANCIAL REPORT OF THE EAST CEDAR CREEK FRESH WATER SUPPLY DISTRICT
 COMPREHENSIVE ANNUAL FINANCIAL REPORT OF THE EAST CEDAR CREEK FRESH WATER SUPPLY DISTRICT FOR FISCAL YEAR ENDED March 31, 2018 General Manager Bill Goheen COMPREHENSIVE ANNUAL FINANCIAL REPORT FOR THE
CITY OF COLEMAN, FLORIDA. Annual Financial Report. September 30, (With Independent Auditors' Report Thereon)
") Annual Financial Report September 30, 2018 (With Independent Auditors' Report Thereon) INTRODUCTORY SECTION This section contains the following subsections: List of City Council and Principal City Officials
Annual Financial Report September 30, 2018 (With Independent Auditors' Report Thereon) INTRODUCTORY SECTION This section contains the following subsections: List of City Council and Principal City Officials
MADISON COUNTY, FLORIDA ANNUAL FINANCIAL REPORT SEPTEMBER 30, 2017
 MADISON COUNTY, FLORIDA ANNUAL FINANCIAL REPORT SEPTEMBER 30, 2017 MADISON COUNTY, FLORIDA THIS REPORT CONTAINS THE FOLLOWING SECTIONS Madison County, Florida (Government-Wide) Basic Financial Statements,
CHINLE UNIFIED SCHOOL DISTRICT NO. 24
 CHINLE UNIFIED SCHOOL DISTRICT NO. 24 Comprehensive Annual Financial Report Fiscal Year Ended June 30, 2012 PO Box 587 Chinle, Arizona 86503 CHINLE, ARIZONA COMPREHENSIVE ANNUAL FINANCIAL REPORT FOR THE
CAMDEN COUNTY MUNICIPAL UTILITIES AUTHORITY REPORT OF AUDIT FOR THE YEARS ENDED DECEMBER 31, 2015 AND 2014 WITH SUPPLEMENTARY INFORMATION
 CAMDEN COUNTY MUNICIPAL UTILITIES AUTHORITY REPORT OF AUDIT WITH SUPPLEMENTARY INFORMATION FOR THE YEARS ENDED DECEMBER 31, 2015 AND 2014 31700 CAMDEN COUNTY MUNICIPAL UTILITIES AUTHORITY TABLE OF CONTENTS
NORTHAMPTON COUNTY JACKSON, NORTH CAROLINA
 NORTHAMPTON COUNTY JACKSON, NORTH CAROLINA BASIC FINANCIAL STATEMENTS FOR THE YEAR ENDED JUNE 30, 2008 NORTHAMPTON COUNTY JACKSON, NORTH CAROLINA Financial Statements June 30, 2008 Board of Commissioners
MASSACHUSETTS SCHOOL BUILDING AUTHORITY. Financial Statements and Required Supplementary Information. June 30, 2015
 Financial Statements and Required Supplementary Information (With Independent Auditors Report Thereon) Table of Contents Page(s) Independent Auditors Report 1 2 Management s Discussion and Analysis Required
VILLAGE OF GOLF, FLORIDA COMPREHENSIVE ANNUAL FINANCIAL REPORT FOR THE FISCAL YEAR ENDED SEPTEMBER 30, 2014
 VILLAGE OF GOLF, FLORIDA COMPREHENSIVE ANNUAL FINANCIAL REPORT FOR THE FISCAL YEAR ENDED SEPTEMBER 30, 2014 Prepared by: Finance Department VILLAGE OF GOLF, FLORIDA TABLE OF CONTENTS INTRODUCTORY SECTION
CHEROKEE COUNTY WATER AND SEWERAGE AUTHORITY CHEROKEE COUNTY, GEORGIA FINANCIAL STATEMENTS FOR THE FISCAL YEAR ENDED AUGUST 31, 2016
 CHEROKEE COUNTY WATER AND SEWERAGE AUTHORITY CHEROKEE COUNTY, GEORGIA FINANCIAL STATEMENTS FOR THE FISCAL YEAR ENDED AUGUST 31, 2016 TOGETHER WITH INDEPENDENT AUDITORS REPORTS FINANCIAL STATEMENTS AUGUST
NIAGARA FALLS WATER BOARD Basic Financial Statements, Supplementary Information and Independent Auditors Report December 31, 2017 and 2016
 Basic Financial Statements, Supplementary Information and Independent Auditors Report December 31, 2017 and 2016 Table of Contents Independent Auditors Report 1-3 Management s Discussion and Analysis 4-10
DEER VALLEY UNIFIED SCHOOL DISTRICT NO. 97
 DEER VALLEY UNIFIED SCHOOL DISTRICT NO. 97 Comprehensive Annual Financial Report Fiscal Year Ended June 30, 2016 20402 North 15 th Avenue Phoenix, Arizona 85027 PHOENIX, ARIZONA COMPREHENSIVE ANNUAL FINANCIAL
KNOX-CHAPMAN UTILITY DISTRICT OF KNOX COUNTY. Knoxville, Tennessee COMPREHENSIVE ANNUAL FINANCIAL REPORT
 KNOX-CHAPMAN UTILITY DISTRICT OF KNOX COUNTY Knoxville, Tennessee COMPREHENSIVE ANNUAL FINANCIAL REPORT For the Years Ended February 28, 2014 and 2013 PREPARED BY: Carol Taylor, Finance Director KNOX-CHAPMAN