2015 Annual Financial Report
|
|
|
- Gervais Shelton
- 6 years ago
- Views:
Transcription

1 2015 Annual Financial Report
2
3 TABLE OF CONTENTS Message from President Norton...1 Management s Responsibility for Financial Reporting...2 Independent Auditors Report...3 Management Discussion and Analysis...6 Financial Statements Statement of Net Position...33 Statement of Revenues, Expenses, and Changes in Net Position...34 Statement of Cash Flows...35 Notes to the Financial Statements...37 Other Budget, Financial and Enrollment Data Operating Budget Summary...68 Actual and Projected Net Revenues Available for Debt Service...69 General Financial Information and Operating Data...70 Enrollment, Admissions, Student Charges, and Faculty Data...74 University Administration...77
4

5 Message from President Norton The University of Northern Colorado provides opportunities for students to earn high-quality degrees that prepare them for work, life and responsible citizenship. UNC is uniquely positioned among Colorado s public research universities to provide transformative education to students through the intersection of our academic programs, research and community relationships. UNC purposefully connects teaching and research. Our faculty are expert researchers and talented teachers who not only use their research to inform their courses, but also engage students in collaborative research. This type of access to faculty scholars opens up a world of learning opportunities for UNC students. By working together with faculty researchers, students build on what they learn in class, put what they ve learned to work, and become better critical thinkers, collaborators and problem solvers. UNC graduates are prepared not only with the baseline of knowledge in their chosen fields, but also with the ability to discover, create and incorporate new ideas into their thinking as they set out into the world. Many of our graduates are the first in their family to go to college. UNC is a critical access point for students whose educational opportunities historically have been limited by socio-economic status or other demographics, and we are committed to finding sustainable ways to educate these students even as the state funding landscape changes. We are actively engaged in state policy, planning and funding discussions and continue to make the case for state investment in higher education. We are also responding to the imperative that public universities must make their own way in our changing world. UNC is adapting to unprecedented and continuing change by focusing on innovation, developing programs to meet the changing needs of society, and meeting the changing needs of students. As we continue moving forward in the coming year, your interest and support are greatly appreciated. Sincerely, Kay Norton President 1
6 Management s Responsibility for Financial Reporting The accompanying financial statements of the University of Northern Colorado for the year ended June 30, 2015, were prepared by management in conformity with generally accepted accounting principles. The management of the University is responsible for the integrity and objectivity of these financial statements, which are presented on the accrual basis of accounting and, accordingly, include some amounts based upon judgment. Other financial information in the annual financial report is consistent with that in the financial statements. The system of internal accounting controls is designed to assure that the financial reports and the books of accounts properly reflect the transactions of the institution, in accordance with established policies and procedures as implemented by qualified personnel. The Board of Trustees of the University of Northern Colorado monitors the financial and accounting operations of the institution, including the review and discussion of periodic financial statements, the evaluation and adoption of budgets, and the reporting of independent certified public accountants. Michelle F. Quinn Senior Vice President for Finance and Administration and Chief Financial Officer 2

7 RubinBrown LLP Certified Public Accountants & Business Consultants th Street Suite 300 Denver, CO Independent Auditors Report T F W rubinbrown.com E info@rubinbrown.com Members of the Legislative Audit Committee: Report On the Financial Statements We have audited the accompanying financial statements of the University of Northern Colorado (the University) and its discretely presented component unit, collectively, as an institution of higher education of the State of Colorado as and for the year ended June 30, 2015 and the related notes to the financial statements, which collectively comprise the University s basic financial statements as listed in the table of contents. Management s Responsibility for the Financial Statements Management is responsible for the preparation and fair presentation of these financial statements in accordance with accounting principles generally accepted in the United States of America; this includes the design, implementation and maintenance of internal control relevant to the preparation and fair presentation of financial statements that are free from material misstatement, whether due to fraud or error. Auditors Responsibility Our responsibility is to express an opinion on these financial statements based on our audit. We did not audit the financial statements of the University of Northern Colorado Foundation (the Foundation), the University s discretely presented component unit, whose statements reflect total assets of $121,597,368 as of June 30, 2015, and total revenues of $15,858,640 for the year then ended. Those statements were audited by other auditors whose report has been furnished to us. Our opinion, insofar as it relates to amounts included for the Foundation, is based solely on the report of the other auditors. We conducted our audit in accordance with auditing standards generally accepted in the United States of America and the standards applicable to financial audits contained in Government Auditing Standards, issued by the Comptroller General of the United States. Those standards require that we plan and perform the audit to obtain reasonable assurance about whether the financial statements are free from material misstatement. The financial statements of the Foundation were not audited in accordance with Government Auditing Standards. 3
8 Members of the Legislative Audit Committee An audit involves performing procedures to obtain audit evidence about the amounts and disclosures in the financial statements. The procedures selected depend on the auditors judgment, including the assessment of the risks of material misstatement of the financial statements, whether due to fraud or error. In making those risk assessments, the auditor considers internal control relevant to the entity s preparation and fair presentation of the financial statements in order to design audit procedures that are appropriate in the circumstances, but not for the purpose of expressing an opinion on the effectiveness of the entity s internal control. Accordingly, we express no such opinion. An audit also includes evaluating the appropriateness of accounting policies used and the reasonableness of significant accounting estimates made by management, as well as evaluating the overall presentation of the financial statements. We believe that the audit evidence we have obtained is sufficient and appropriate to provide a basis for our audit opinion. Opinion In our opinion, based on our audit and the report of other auditors, the financial statements referred to above present fairly, in all material respects, the financial position of the University as of June 30, 2015, and the changes in its financial position and its cash flows for the year then ended in accordance with accounting principles generally accepted in the United States of America. Emphasis Of Matters As discussed in Note 1, the University adopted the provisions of GASB Statement No. 68, Accounting and Financial Reporting for Pensions, as amended by GASB Statement No. 71, Pension Transition for Contributions Made Subsequent to the Measurement Date. Our opinion is not modified with respect to this matter. As discussed in Note 1, the financial statements of the University, an institution of higher education in the State of Colorado, are intended to present the financial position, the changes in financial position and cash flows of only that portion of the business-type activities of the State that is attributable to the transactions of the University. They do not purport to, and do not, present fairly the financial position of the State of Colorado as of June 30, 2015, the changes in its financial position, or, where applicable, its cash flows for the year then ended in conformity with accounting principles generally accepted in the United States of America. Our opinion is not modified with respect to this matter. Other Matters Required Supplementary Information Accounting principles generally accepted in the United States of America require that the management s discussion and analysis, schedule of the University s proportionate share of the net pension liability and schedule of the University contributions to the pension be presented to supplement the basic financial statements. Such information, although not a part of the basic financial statements, is required by the Governmental Accounting Standards Board, who considers it to be an essential part of financial reporting for placing the basic financial statements in an appropriate operational, economic, or historical context. We have applied certain limited procedures to the required supplementary information in accordance with auditing standards generally accepted in the United States of America, which consisted of inquiries of management about the methods of preparing the information and comparing the information for consistency with management s responses to our inquiries, the basic financial statements and other knowledge we obtained during our audit of the basic financial statements. We do not express an opinion or provide any assurance on the information because the limited procedures do not provide us with sufficient evidence to express an opinion or provide any assurance. 4
9 Members of the Legislative Audit Committee Supplementary Information Our audit was conducted for the purpose of forming an opinion on the basic financial statements that collectively comprise the University s financial statements. The information on the Description of the University of Northern Colorado and the Message from the President has not been subjected to the auditing procedures applied in the audit of the basic financial statements, and accordingly, we do not express an opinion or provide any assurance on it. Other Reporting Required By Government Auditing Standards In accordance with Government Auditing Standards, we have also issued our report dated January 7, 2016, on our consideration of the University s internal control over financial reporting and on our tests of its compliance with certain provisions of laws, regulations, contracts and grant agreements and other matters. The purpose of that report is to describe the scope of our testing of internal control over financial reporting and compliance and the results of that testing, and not to provide an opinion on internal control over financial reporting or on compliance. That report is an integral part of an audit performed in accordance with Government Auditing Standards in considering the University s internal control over financial reporting and compliance. January 7,
10 MANAGEMENT DISCUSSION AND ANALYSIS Overview Management Discussion and Analysis We are pleased to present this financial discussion and analysis of the University of Northern Colorado (the University or UNC). It is intended to make the University s financial statements easier to understand and to communicate its financial situation in an open and accountable manner. It provides an objective analysis of the University s financial position and results of operations as of and for the fiscal years ended June 30, 2015, with comparative information for fiscal years 2014 and University management is responsible for the completeness and fairness of this discussion and analysis, the financial statements, and related footnote disclosures. The presented information relates to the financial activities of the University, a public comprehensive baccalaureate and specialized graduate research university, and focuses on the financial condition and results of operations as a whole. The financial statements for the University of Northern Colorado Foundation, Incorporated, a legally separate organization whose operations benefit the University, is discretely presented within the University s financial statements. Unless otherwise noted, the information and financial data included in management s discussion and analysis relate solely to the University. Understanding the Financial Statements Financial highlights are presented in this discussion and analysis to help your assessment of the University s financial activities. Since this presentation includes highly summarized data, it should be read in conjunction with the financial statements, which have the following parts: Independent Auditors Report presents an unmodified opinion prepared by the University s auditors (an independent certified public accounting firm, RubinBrown LLP) on the fairness, in all material respects, of the University and its discretely presented component units respective financial position. Statement of Net Position presents the assets, deferred outflows of resources, liabilities, deferred inflows of resources, and net position of the University at a point in time (June 30, 2015). Its purpose is to present a financial snapshot of the University. This statement aids readers in determining the assets available to continue the University s operations; evaluating how much the University owes to vendors, investors, and lending institutions; and understanding the University s net position and its availability for expenditure by the University. Statement of Revenues, Expenses, and Changes in Net Position presents the total revenues earned and expenses incurred by the University for operating, nonoperating, and other related activities during a period of time (the year ended June 30, 2015). Its purpose is to assess the University s operating results. Statement of Cash Flows presents University cash receipts and payments during a period of time (the year ended June 30, 2015). Its purpose is to assess the University s ability to generate net cash flows and meet its payment obligations as they come due. Notes to the Financial Statements present additional information to support the financial statements and are commonly referred to as Notes. Their purpose is to clarify and expand on the information in the financial statements. Notes are referenced in this discussion to indicate where details of the financial highlights may be found. We suggest that you combine this financial analysis with relevant nonfinancial indicators to assess the overall health of the University. Examples of nonfinancial indicators include trend and quality of applicants, freshman class size, student retention, building condition, and campus safety. 6
11 MANAGEMENT DISCUSSION AND ANALYSIS Financial Highlights In fiscal year 2015 the Government Accounting Standards Board (GASB) required the implementation of Statement No. 68, Accounting and Financial Reporting of Pensions (GASB 68). This new standard requires a significant change in accounting for the Public Employees Retirement Association of Colorado (PERA) pension plan. PERA is a cost-sharing multiple employer defined benefit pension plan. Under the prior accounting model governed by GASB 27:Accounting for Pensions by State and Local Governmental Employers, the University of Northern Colorado was required to disclose the plan information in the footnotes to the financial statements, but did not report a liability for the net pension obligation. Now, under GASB 68: Accounting and Financial Reporting of Pensions, the University is required to recognize a liability for its proportionate share of the plan s underfunded status. The University s proportionate share in fiscal year 2015 was $124.4 million. Under the prior accounting methodology, the expense that UNC incurred annually was the employer portion of the annual required contributions to PERA. Under GASB 68, the University must recognize expense for the employer portion of annual contributions as well as UNC s proportionate share of other events that affect the net pension liability such as: Changes in benefit terms Changes in economic and demographic assumptions Differences between economic and demographic assumptions and actual experience Differences between expected and actual investment returns Change in the University s proportionate share of the net pension liability These items are recorded on the Statement of Net Position as Deferred Outflows or Deferred Inflows of Resources and amortized to fringe benefit expense. In fiscal year 2015, the University of Northern Colorado recognized $5.6 million in Deferred Outflows of Resources, $1.7 million of Deferred Inflows of Resources on the Statement of Net Position, and $3.0 million in non-cash operating expenditures on the Statement of Revenues Expenses, and Changes in Net Position as a result of the implementation of GASB 68. GASB 68 information was not available to re-state fiscal year 2014 financial statements on a comparative basis. Therefore, only fiscal year 2015 is presented in the financial statements and notes. Three years of information is included the Management Discussion and Analysis with adaptations to the presentation to point out the impact of GASB 68. Selected financial highlights for the fiscal year ended June 30, 2015, include: University assets total $323.3 million, deferred outflows of resources total $8.8 million, liabilities total $297.9 million, and deferred inflows of resources total $2.6 million resulting in a net position of $31.6 million. Of this amount, $10.1 million is restricted for purposes for which the donor, grantor, or other external party intended and $102.7 million is related to investments in capital assets. The remaining ($81.2 million), which is unrestricted net position, is comprised of ($120.5 million) from the implementation of GASB 68: Accounting and Financial Reporting for Pensions and $39.3 million, which may be used to meet the University s ongoing obligations. Net position decreased $13.6 million on the Statement of Revenues, Expenses, and Changes in Net Position. Of this current year decrease in net position, $3.0 million was attributable to additional benefit expenses recognized as a result of the implementation of GASB 68: Accounting and Financial Reporting for Pensions. The remaining $10.6 million resulted from normal operations of the institution. In addition to this decrease, the beginning balance of the fiscal year 2015 net position was decreased $117.5 million in compliance with the implementation guidelines for GASB 68: Accounting and 7
12 MANAGEMENT DISCUSSION AND ANALYSIS Financial Reporting for Pensions. Therefore, the total decrease in net position impacting the financial statements is $131.1 million. The following table outlines the changes in net position for fiscal year 2015: Summary of Changes in Net Position (in millions) Adjustment to beginning net position for GASB 68 $ (117.5) Current year GASB 68 impact on net position (3.0) Current year impact from University operations (10.6) Total change in net position $ (131.1) Detail of current year change in net position from University operations: Decrease in cash used to cover operating deficits and capital construction $ (9.5) Decrease in accounts receivable from the UNC Foundation (1.7) Decrease in capital assets net of depreciation (3.5) Decrease in student accounts receivable and loans (0.7) Increase in accounts payable and unearned revenues (0.8) Decrease in bonds and capital leases payable 6.7 Net increase in deferred outflows and inflows related to bond refundings (1.1) Total current year impact from University operations $ (10.6) Total operating revenues of $187.1 million, less total operating expenses of $211.2 million, resulted in a net operating loss of $24.1 million. This operating loss was partially offset by net nonoperating revenues of $8.7 million and other changes of $1.8 million, resulting in the $13.6 million decrease in net position. Statement of Net Position The Statement of Net Position is a financial snapshot of the University at June 30, It presents the fiscal resources of the University (assets), the consumption of net position that applies to future periods (deferred outflows of resources), the claims against those resources (liabilities), the acquisition of net position that applies to future periods (deferred inflows of resources), and the residual available for future operations (net position). Assets and liabilities are classified by liquidity as either current or noncurrent. Net Position is classified in three basic categories: net investment in capital assets, restricted, or unrestricted. The Statement of Net Position presents information on all of the University s assets, deferred outflows of resources, and liabilities, with the difference between the financial statement elements reported as net position. Over time, increases or decreases in net position may serve as a useful indicator of the strength of the financial position of the University. 8
13 MANAGEMENT DISCUSSION AND ANALYSIS Assets Current Assets $ 71,693,447 $ 83,299,916 $ 92,378,317 Capital 244,504, ,970, ,524,258 Other Noncurrent Assets 7,121,458 7,484,690 7,825,307 Assets Current Assets Condensed Statement of Net Position as of June 30, Total Assets 323,318, ,755, ,727,882 Deferred Outflows of Resources Deferred Amounts on Debt Refundings 3,279,368 3,503,130 2,899,403 Deferred Amount on Pensions (GASB 68) 5,570, Total Deferred Outflows of Resources 8,850,080 3,503,130 2,899,403 Liabilities Current Liabilities 30,936,397 30,062,061 29,439,314 Bonds/Notes Payable, Noncurrent 136,294, ,100, ,452,299 Net Pension Liability (GASB 68) 124,356, Other Noncurrent Liabilities 6,294,898 7,333,028 8,579,810 Total Liabilities 297,882, ,495, ,471,423 Deferred Inflows of Resources Deferred Amounts on Debt Refundings 934, Deferred Amount on Pensions (GASB 68) 1,711, Total Deferred Inflows of Resources 2,646, Net Position Net Investment in Capital Assets 102,659, ,486, ,168,718 Restricted - Nonexpendable 307, , ,555 Restricted - Expendable 9,922,568 9,617,606 9,535,567 Unrestricted (GASB 68) (120,497,030) - - Unrestricted 39,247,592 51,351,443 61,144,022 Total Net Position $ 31,640,092 $ 162,763,458 $ 172,155,862 Current assets decreased $11.6 million between fiscal year 2014 and fiscal year The decrease was primarily due to the $9.5 million dollar decrease in total cash. The other large factor was a decrease of $1.7 million in accounts receivable from the University of Northern Colorado Foundation, Inc. The cash for the operating agreement and student scholarships remained invested at the Foundation until 2014 fiscal year end for maximum returns, and the cash was received by the University in July In fiscal year 2015, the University collected the cash for these items prior to June 30, 2015; therefore, the year-end accounts receivable was significantly less than the prior fiscal year. 9
14 MANAGEMENT DISCUSSION AND ANALYSIS Unrestricted cash and cash equivalents and capital assets are the largest portions of the University s total assets. At June 30, 2015, 2014, and 2013, cash and cash equivalents were $61.0, $69.5, and $79.9 million, which comprised 18.9%, 20.5%, and 22.7% of the University s total assets, respectively. The majority of the cash is held by the State Treasury and is comprised of general, self-supported, restricted, agency, and other cash funds. Unrestricted cash and cash equivalents decreased $8.5 million during fiscal year 2015, $10.4 million during fiscal year 2014, and $0.3 million during fiscal year In all three fiscal years management utilized reserves to cover deficits from operating activities and to invest in capital projects, which included addressing deferred maintenance. At the end of fiscal year 2013, the capital projects cash included $12.7 million transferred from reserves to fund fiscal year 2014 capital projects. Similarly, at the end of fiscal year 2014, the capital projects included $7.0 million that had been transferred from reserves to fund fiscal year 2015 capital projects. In fiscal year 2015, the University changed the timing of project cash transfer transactions, and the fiscal year 2015 balance reflects only the remaining cash expenditures expected to complete the projects in fiscal year 2015 and prior. On July 1, 2015, $6.0 million was transferred from reserves to capital projects to fund the fiscal year 2016 board approved capital budget. Strategic investments have been a combination of new cash invested and prior year cash balances committed to fund multi-year activities identified in UNC s nine core strategic plans. In fiscal years 2015, 2014, and 2013, the University added $2.8, $2.8, and $2.6 million, respectively, to strategic investments, funded from a combination of operating cash and reserves. As the University has pursued strategic initiatives, the prior year earmark of cash has been gradually expended, as is seen by the downward trend in the Unrestricted Cash and Cash Equivalents table. Fiscal year 2016 will be the first year that cash in the strategic investment will not exceed the expected annual expenditures. Strategic investment cash has historically been transferred to the appropriate funds at the beginning of each fiscal year as necessary to meet the budgeted requirements of that fiscal year and that practice remains consistent through the three fiscal years disclosed in the Unrestricted Cash and Cash Equivalents table. The University also holds $750,000 in restricted cash for bond covenants as a noncurrent asset in reserves. The following table indicates the expected uses of unrestricted cash and cash equivalents: Unrestricted Cash and Cash Equivalents as of June 30, Operating On-Campus Education and General $ 27,442,528 $ 20,368,379 $ 21,552,142 Housing, Dining, Parking, University Center 1,598,874 3,888,123 4,083,652 Extended Studies and Other 676, , ,388 Designated for Restricted Funds 1,381, ,824 60,190 Strategic Investments 3,125,383 5,953,716 9,165,522 Capital Projects 3,865,202 12,470,925 14,793,010 Reserves 22,882,187 25,377,418 29,848,805 Total Cash and Cash Equivalents $ 60,971,397 $ 69,491,267 $ 79,890,709 10

15 MANAGEMENT DISCUSSION AND ANALYSIS Student accounts receivable is the second largest current asset and is presented net of allowance for doubtful accounts. Net student accounts receivable as of June 30, 2015, 2014, and 2013, is $6.1, $6.4, and $7.2 million, respectively. The net student accounts receivable decrease was $0.3 million, or (5.0%), from fiscal year 2014 to 2015, and $0.8 million, or 10.8%, from fiscal year 2013 to These decreases reflect the application of the reserve policy, which is a graduated increase in the reserve for uncollectible accounts based on the age of the outstanding account balance. Gross accounts receivable was higher in each year, but older uncollected accounts shifted into the 810 days and older category, which is reserved 100%, creating a decrease in net accounts receivable. Inventories, loans to students, and other assets remained essentially the same amount between fiscal year 2013 and fiscal year Other receivables consist primarily of amounts due to the University from reimbursable grants and contracts. The majority of these are federal, state, or UNC Foundation agreements that have a very high probability of collection. The University spends the money first and then bills the sponsoring agency for reimbursement. Other receivables were $2.6 million in fiscal year 2015, $4.3 million in fiscal year 2014, and $2.7 million in fiscal year In fiscal year 2014, the University ended the year with a large accounts receivable balance of $2.4 million from the University of Northern Colorado Foundation, Inc. This was a deliberate decision to keep the funds invested at the Foundation for the longest amount of time possible for a maximum return. In fiscal year 2015, the majority of the Foundation cash was collected prior to June 30, Capital Assets Capital assets are defined as any asset used in operations with an initial useful life extending beyond one year. The University s single largest fiscal resource is its campus facilities. As of June 30, 2015, capital assets of $505.5 million, net of $261.0 million accumulated depreciation, totaled $244.5 million. This is a $3.4 million decrease from fiscal year 2014, when capital assets of $493.4 million, net of $245.5 million accumulated depreciation, totaled $247.9 million. Capital assets of $481.6 million, net of $230.1 million accumulated depreciation, totaled $251.5 million at June 30, The capital assets decrease of $7.0 million from fiscal year 2013 to 2015 is primarily because depreciation expense has been greater than additions for the past two fiscal years. 11
16 MANAGEMENT DISCUSSION AND ANALYSIS In fiscal year 2015 there were $9.9 million of construction projects completed: $7.9 million was reclassified from construction in progress to building and improvements, $1.0 million was reclassified to equipment and vehicles, and $1.0 million was reclassified to land improvements. The building improvements included the Kepner Financial Education Center, the Fraiser Hall sound rooms, roofs on the University Center and several other smaller buildings, heating systems in the University Apartments, air conditioning in Butler Hancock, central campus chillers, and the University Center Fire Alarms. The equipment and vehicles included scoreboards for Athletics and University Center emergency telephones. The land improvements included parking lot resurfacing, non-potable water main line repairs, and the 14 th Avenue pavement projects. The University ended the fiscal year with $6.8 million in construction in progress. The larger projects in progress at year end, that will be completed and capitalized in fiscal year 2016, include the fire sprinklers at Kepner and Parsons Hall, the Carter Hall window replacement, the Frasier theater acoustical improvements, seal coats for parking lots, the University Center ballroom renovations, and roofs on Brown, Dickeson, Lujan, Nottingham, Patton House, Gunter, and Parsons Halls. Additional information on additions, disposals, and transfers of capital assets can be found in Note 6: Capital Assets. A summary of the capital asset balances is reflected in the following table: Capital Assets Net of Accumulated Depreciation as of June 30, Land and Improvements $ 24,325, % $ 24,229, % $ 25,152, % Buildings and Improvements 193,330, % 197,809, % 202,350, % Construction In Progress 6,814, % 6,532, % 7,475, % Library Books 8,232, % 7,952, % 7,744, % Equipment 10,076, % 9,741, % 7,251, % Art and Historical Treasures 1,725, % 1,705, % 1,550, % Total Capital Assets $ 244,504, % $ 247,970, % $ 251,524, % Other Noncurrent Assets Other noncurrent assets consist of loans to students, restricted cash, and investments. The restricted cash is a reserve required by bond covenants and has not changed. The restricted investments are donated funds that were gifted directly to University of Northern Colorado in the past and could not be legally transferred to the Foundation. The value of this portfolio changes minimally each year based on the market gains or losses on the investments. Loans to students are the largest portion of other noncurrent assets. These are primarily Perkins loans that are managed under the appropriate federal guidelines through a third party loan processor. This loan program has sunset. More information about it is available in Note 20: Subsequent Events. Loans to students, net of allowance for doubtful accounts, that are due after June 30, totaled $5.8, $6.1, and $6.4 million, at June 30, 2015, 2014, and 2013, respectively. 12
17 MANAGEMENT DISCUSSION AND ANALYSIS Liabilities Non-Debt Related Liabilities The University s non-debt obligations and commitments arising from past events that are expected to result in a consumption of resources include amounts owed to vendors, personnel commitments, and unearned revenue. Note 7: Liabilities and Unearned Revenues provides more detailed information for current liabilities expected to be paid within one year and noncurrent liabilities expected to be paid after one year. Accounts payable and accrued liabilities of $15.9 million are the most significant non-debt related liabilities. They increased $0.5 million in fiscal year The largest portion of this liability is $12.4 million of payroll earned in June 2015, which is payable to employees on July 1, 2015; therefore, it is an accrued liability at fiscal year-end each year. The payroll liability was $12.4 million at June 30, 2014, and $11.4 million at June 30, Unearned revenues of $7.8 million include tuition and fees and certain auxiliary revenues received by June 30, 2015, which are for services to be provided in fiscal year It also includes revenues received from grant and contract sponsors and the UNC Foundation that have not yet been earned. These amounts will be recognized as revenue in future periods after all conditions have been satisfied. Unearned revenue fluctuations of a $0.3 million decrease in fiscal year 2014, followed by a $0.3 million increase in fiscal year 2015 are attributable to summer tuition and other activities. Compensated absences are an estimate of the amount payable to employees in the future for their vested rights under the various leave and retirement programs. This estimate is based on personnel policies that define vacation and sick leave to which the employees may be entitled (see Note 1: Nature of Operations and Summary of Significant Accounting Policies). The noncurrent liability for compensated absences was $4.4, $4.4, and $4.1 million, at June 30, 2015, 2014, and 2013, respectively. University Debt The single largest liability for the University is outstanding bonds payable. The University has four fixed rate bond issues and one variable rate bond issue outstanding for a total principal of $133.6 million. The carrying value of these bonds includes $6.7 million in premiums that will be amortized over the remaining life of the bonds; consequently, the liability on the Statement of Net Position is $140.3 million. Prior to fiscal year 2014, deferred amounts resulting from the refunding of bonds payable were recorded as part of the bond liability. In fiscal year 2014, GASB 65: Reporting Items Previously Recorded as Assets and Liabilities was implemented, and the deferred amounts resulting from refunding of bonds payable were reclassified into two new financial statement elements: deferred outflows of resources and deferred inflows of resources. Deferred outflows of resources represent the future consumption of net position and deferred inflows of resources represent the acquisition of net position that applies to future periods. The University has $3.3 million of deferred outflows of resources and $0.9 million of deferred inflows of resources from the refunding activities of bonds payable. The deferred amounts resulting from refunding bonds payable originate from the difference in the carrying value of the bonds (principal plus unamortized discount or premium) and the amount it costs to retire or refinance the bonds. A book loss on refunding is classified as deferred outflow of resources and a book gain is classified as a deferred inflow of resources. Each is amortized and the expense or reduction of expense is recognized over the same time period that the University is realizing the economic gain from reduced interest expense related to the refunding transactions. 13
18 MANAGEMENT DISCUSSION AND ANALYSIS On June 3, 2015, University of Northern Colorado Board of Trustees issued the 2015A Institutional Enterprise Revenue Bonds at a total par amount of $21.5 million bearing fixed interest rates of 4.0% to 5.0%, payable semiannually. Principal maturities begin June 1, 2036 and continue through June 1, Proceeds from the sale of these bonds were used to refund $21.3 million of the remaining Series 2005 Auxiliary Revenue Refunding and Improvement bonds. This refunding will provide the University with an economic gain of $2.2 million through future interest savings. The refunding also created a book gain of $0.9 million, which is recorded as a deferred inflow of resources and will be amortized as a reduction to interest expense over the life of the 2015A issue. Details of the individual bond issues of University of Northern Colorado are included in Note 8: Bonds, Capital Leases and Notes Payable. On July 1, 2014, University of Northern Colorado Board of Trustees entered into an agreement with Wells Fargo Bank, N.A., to continue holding 100% of the Series 2011B variable rate bonds for another three year term, ending June 30, The agreement included the $19.3 million of principal that remained outstanding at June 30, More specific information about the terms of the variable rate bonds is included in Note 8: Bonds, Capital Leases and Notes Payable. Moody s Investor Service assigned an A1 underlying rating with a negative outlook and an Aa2 enhanced rating with a stable outlook to the Series 2015A Institutional Enterprise Revenue Refunding Bonds. Moody s affirmed the A1 underlying and Aa2 enhanced rating on the University s outstanding rated debt, but they revised the underlying outlook to negative. The outlook revision from stable to negative reflects the University s declining liquidity and rising fixed costs associated with an aggressive plan to grow enrollment by 25% by fall The enhanced rating outlook, based on the University s participation in the Colorado Higher Education State Aid Intercept Program, remains stable, which is based on the State of Colorado s current rating and outlook. Standard & Poor s was not consulted for a rating at the time the University issued the Series 2015A bonds. On March 5, 2014, Standard and Poor s assigned an A underlying rating (SPUR) to the Series 2014A Institutional Enterprise Revenue Refunding Bonds and affirmed its A long-term rating and SPUR on the University s outstanding bonds. The outlook on all ratings was stable. The AA- long-term rating from Standard and Poor s on UNC s bonds was an enhanced rating based upon the University s participation in the Colorado Higher Education State Aid Intercept Program. The 2011B variable rate bonds are not rated by either agency. A summary of University debt and the related deferred outflows and inflows of resources is presented in the following table: Summary of Debt Outstanding and Debt-Related Deferred Outflows and Inflows of Resources as of June 30, Revenue Bonds $ 140,314,974 $ 145,326,818 $ 148,067,299 Deferred Outflows of Resources (3,279,368) (3,503,130) (2,899,403) Deferred Inflows of Resources 934, Notes Payable - 948,823 - Capital Lease Obligations 3,489,566 4,210,893 5,680,697 Total 141,460, ,983, ,848,593 Less Current Portion of Debt (5,645,895) (5,525,026) (4,944,286) Long-Term Debt and Deferred Outflows and Inflows of Resources $ 135,814,173 $ 141,458,378 $ 145,904,307 14


19 MANAGEMENT DISCUSSION AND ANALYSIS The bond debt payments are made from pledged revenues comprised of auxiliary housing, food service, parking and other sales, plus identified pledged student fees, extended campus net revenues, and student tuition revenues. A detailed schedule of actual and estimated revenues and expenses is included in the Other Budget, Financial, and Enrollment Data section of the annual financial report. 15
.")


20 MANAGEMENT DISCUSSION AND ANALYSIS Net Position The University s net position may have restrictions imposed by external parties, such as donors, or it may be invested in capital assets (property, plant, and equipment). To help understand the nature of the University s net position, net position is classified into the following categories: Net Investment In Capital Assets Net investment in capital assets represents the University s investment in campus facilities and equipment, net of accumulated depreciation and debt service, necessary to fulfill academic, student housing and food service, athletics, and other purposes. This is the University s largest class of net position, which comprises $102.7, $101.5, and $101.2 million of the University s net position for fiscal years 2015, 2014, and 2013, respectively. In the past three years, the University management has allocated a significant portion of unrestricted cash reserves to capital projects, primarily to address deferred maintenance on campus. The University capitalized $13.3, $14.0, and $6.7 million of new assets in fiscal years 2015, 2014, and 2013, respectively, and ended fiscal year 2015 with $6.8 million in construction in progress. Depreciation expense has been greater than capital additions; therefore, the dollar value of net investment in capital assets is not changing substantially, but it is becoming a larger percentage of the net position portfolio. 16
21 MANAGEMENT DISCUSSION AND ANALYSIS Restricted Nonexpendable The University s restricted nonexpendable net position is comprised of endowment funds for which the donor has required that the original principal be set aside for perpetual investment. The University s restricted nonexpendable net position has remained at $0.3 million for the last three fiscal years and includes only those endowment funds that cannot be legally transferred to the University of Northern Colorado Foundation, Inc. (the Foundation). The majority of the endowment assets benefiting the University are held by the Foundation, which is a discretely presented component unit in the financial statements. Restricted Expendable The University s restricted expendable net position is comprised of resources that may be fully expended, but only for specific purposes identified by the donor or entity originally providing the funds. The majority of the restricted expendable net position category consists of revolving Perkins loan funds and restricted bond reserves. A very small portion of net position identified as restricted expendable is generated from investment earnings on restricted nonexpendable endowment net position described above. Allowable expenditures for these funds are scholarships and other academic support expenditures. 17


22 MANAGEMENT DISCUSSION AND ANALYSIS The University s restricted expendable net position at June 30, 2015, 2014, and 2013 was $9.9, $9.6, and $9.5 million, respectively. The Revolving Student Loan Funds include $8.3 million of Perkins Loans, a Federal program which has been discontinued as of October 1, Please see Note 20: Subsequent Events for more information on this topic. Unrestricted Unrestricted net position is usually available for spending for any lawful purpose under the full discretion of management. However, the University may place some limitations on future use by designating unrestricted net position for certain purposes during the annual budget process. Unrestricted net position of $39.3 million includes operating funds and reserves. Unrestricted net positon of ($120.5) includes the PERA net pension liability and its related deferred outflows and inflows of resources. The change in total net position resulting from the implementation of GASB 68: Accounting and Financial Reporting of Pensions is outlined in the following table: Summary of Changes in Net Position (in millions) Adjustment to beginning net position for GASB 68 $ (117.5) Current year GASB 68 impact on net position (3.0) Subtotal GASB 68 impact (120.5) Current year impact from University operations (10.6) Total change in Net Position $ (131.1) Detail of GASB 68 Impact to Statement of Net Position Deferred outflows of resources $ 5.6 Net pension liability (124.4) Deferred inflows of resources (1.7) GASB 68 impact on change in Net Position $ (120.5) 18


23 MANAGEMENT DISCUSSION AND ANALYSIS The following graph depicts a three-year history of net position by category: Statement of Revenues, Expenses, and Changes in Net Position The Statement of Revenues, Expenses, and Changes in Net Position presents the financial activity of the University over the fiscal year. All changes in net position are reported as soon as the underlying event giving rise to the change occurs, regardless of the timing of related cash flows. Thus, revenues and expenses are reported in this statement for some items that will result in cash flows only in future fiscal periods. A key component of this statement is the differentiation between operating and nonoperating activities. The tables and charts related to the Statement of Revenue, Expenses, and Changes in Net Position that follow have been adjusted, for comparative purposes, to include the impact of GASB 68: Accounting and Financial Reporting of Pensions. Operating revenues are earned by providing goods and services to the various customers of the University. Operating expenses are paid to acquire or produce goods and services necessary to carry out the mission of the University. They are directly related to generating operating revenues. Nonoperating revenues include investment income, state appropriations, Pell grant revenue, capital grants and gifts, and gains or losses on the disposal of assets. These revenues are not earned from the sale of goods and services and, therefore, are considered nonoperating. 19
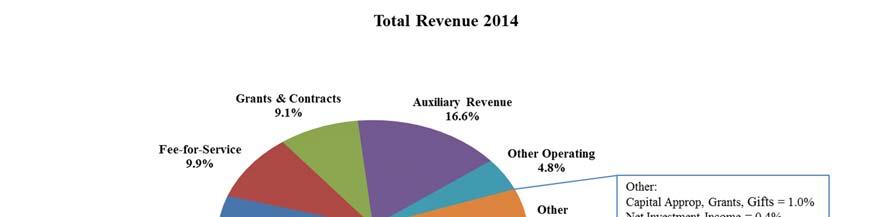
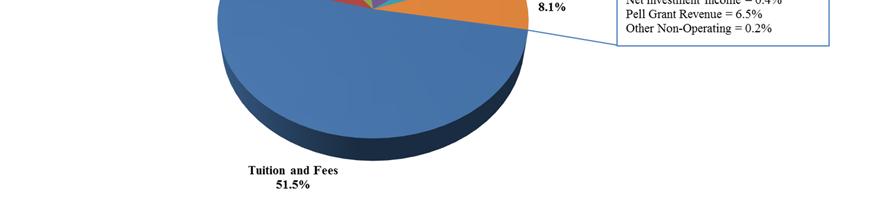
24 MANAGEMENT DISCUSSION AND ANALYSIS Condensed Statement of Revenues, Expenses, and Changes in Net Position For the Year Ended June 30, Operating Revenues Net Tuition and Fees $ 102,175,619 $ 102,853,226 $ 103,803,210 Fee-for-Service 21,916,149 19,782,469 17,915,857 Grants and Contracts 21,851,247 18,238,653 17,222,531 Auxiliary 31,272,265 33,213,951 33,642,896 Other 9,847,995 9,523,404 9,803,557 Total Operating Revenues 187,063, ,611, ,388,051 Operating Expenses Education and General 163,942, ,975, ,404,933 Education and General (GASB 68) 2,996, Auxiliary 27,209,745 26,810,670 26,761,610 Depreciation 17,069,138 16,592,499 16,279,574 Total Operating Expenses 211,217, ,378, ,446,117 Operating Loss (24,154,453) (19,766,531) (12,058,066) Nonoperating Revenues & Expenses Federal Grant and Contracts 12,732,959 13,024,992 13,638,482 Other Nonoperating Revenue/Expense Nonoperating Capital Interest Expense 1,322,240 1,207, ,292 (5,295,433) (5,749,898) (6,010,802) Gain (Loss) before Other Items (15,394,687) (11,284,025) (4,082,094) Capital Appropriations and Contributions 616,702 1,701, ,288 Capital Grants and Gifts 1,156, ,400 - Loss on Disposal of Assets (1,052) (17,191) (6,322) Increase (Decrease) in Net Position (13,622,773) (9,392,404) (3,881,128) Net Position - Beginning of Year 162,763, ,155, ,036,990 GASB 68 Adjustment to Net Position (117,500,593) - - Net Position - End of Year $ 31,640,092 $ 162,763,458 $ 172,155,862 Total Revenues Total University revenues of $202.9, $199.7, and $196.5 million in fiscal years 2015, 2014, and 2013, respectively, consist of operating revenue, Pell grants, other nonoperating revenue, capital appropriations and contributions, and capital grants and gifts. Total revenues increased $3.2 million, or 1.6%, between fiscal years 2014 and 2015 and increased $3.2 million, or 1.6%, between fiscal years 2014 and
25 MANAGEMENT DISCUSSION AND ANALYSIS 21
26 MANAGEMENT DISCUSSION AND ANALYSIS Operating Revenues Operating revenue for fiscal years 2015, 2014, and 2013, of $187.1, $183.6, and $182.4 million, respectively, is derived from tuition and fees, auxiliary activity, grants and contracts, state fee-for-service, and other operating revenues. The proportion of operating revenue to total revenue has remained consistent at 92% over the past two fiscal years. Tuition and fee revenue decreased $0.7 million between fiscal years 2014 and 2015 and $0.9 million between fiscal years 2013 and Tuition rates increased, but were offset by declines in enrollment and increases in scholarship allowance, which reduces tuition revenue. Credit hours are the driving factor in revenue realization and total annual credit hours declined 4.8%, 4.9%, and 0.8% in the academic years , , and , respectively. Total credit hours for all terms (summer, fall, interim, and spring) were 301,106, 316,319, and 332,547 for the academic years , , and , respectively. Tuition and fee revenue is shown net of $22.1, $18.3, and $17.9 million in scholarship allowances for fiscal years 2015, 2014, and 2013, respectively. Auxiliary revenue for fiscal years 2015, 2014, and 2013 is net of $6.3, $5.0, and $5.2 million in scholarship allowances, respectively. Scholarship allowances are those portions of the University s tuition and fees which are paid by other revenues, primarily federal and state grants for financial aid, and also general institutional scholarships. Approximately 69% of total financial aid is reclassified as a reduction to tuition and fees and auxiliary revenue because it is recognized in other revenue categories. Scholarship allowance increased significantly in the last fiscal year because of increases of $1.5 million in institutional scholarships, and $1.7 million in financial aid from the State of Colorado. In previous years, named and endowed scholarships from the UNC Foundation were not recognized in revenues and expenses in the University of Northern Colorado financial statements. This was changed in fiscal year 2015 to better reflect the impact of the Foundation support to the University. As a result, $3.4 million of named and endowed scholarships from the UNC Foundation were recognized as revenue and an equivalent amount of scholarship expense, thus impacting the calculation for scholarship allowance, but not impacting the University s net position. During fiscal years 2015, 2014, and 2013, the Colorado Department of Higher Education (CDHE) provided the University $37.3, $33.6, and $32.3 million, respectively, in College Opportunity Fund (COF) and Feefor-Service (FFS) contract revenue. COF is included in tuition revenue and FFS has a separate line on the financial statements. COF and FFS are both classified as operating revenue. The College Opportunity Fund provides a stipend to qualified undergraduate students. The students use the stipend to pay a portion of their tuition. The COF stipend provided to students was $75 per credit hour in fiscal year 2015, compared to $64 and $62 per credit hour in fiscal years 2014 and 2013, respectively. In fiscal years 2015, 2014, and 2013, the University applied $15.4, $13.8, and $14.4 million of COF stipends against student tuition bills, respectively. This amount is included in tuition revenues. State FFS contract revenue helps support graduate and specialized undergraduate education services. These funds are in addition to tuition paid by students. During fiscal years 2015, 2014, and 2013 the Colorado Department of Higher Education provided the University $21.9, $19.8, and $17.9 million, respectively. 22


27 MANAGEMENT DISCUSSION AND ANALYSIS The total amount of COF and FFS support has increased $5.0 million since fiscal year Auxiliary revenue decreased $1.9 million between fiscal years 2014 and 2015 and had previously decreased $0.4 million between fiscal years 2013 and On-campus housing occupancy in fiscal year 2015 increased to 82.4%, but the related revenue increase was mostly offset by a decrease in meal plan revenue due to a rate restructure. The increase in auxiliary scholarship allowance of $1.2 million, due to increased financial aid revenues applied to tuition and room and board, also decreased auxiliary revenue in fiscal year A drop in on-campus housing occupancy from 86.2% in fiscal year 2013 to 80.4% in fiscal year 2014 created the revenue decrease in fiscal year Room rates are tiered for the various residence halls, and price increases for fiscal year 2014 ranged from 1.8% to 9.7%. The Tier 1 hall rates were decreased by 2.4% in The board rates for meal plans increased 2.9% to 4.1%, depending on the meal plan purchased. Auxiliary revenue is a major source of support for the University s debt service payments. A detailed schedule of actual and estimated revenues and expenses for debt service is included in the Other Budget, Financial, and Enrollment Data section of the Annual Financial Report. Other operating revenues include the operating agreement between UNC and the Foundation, athletic camp fees, accounts receivable service charges, Bear Logic computer sales, and various other charges for services. This revenue has remained reasonably consistent, ranging from $9.5 to $9.8 million during the three-year period. The largest single source of revenue in this classification is the unrestricted support of University scholarships from the UNC Foundation, which has been $1.7, $1.9, and $1.7 million in fiscal years 2015, 2014, and 2013, respectively. Grants and Contracts Revenue At June 30, 2015, 2014, and 2013, grants and contracts revenue comprised $34.6, $31.3, and $30.9 million or 17.0%, 15.7%, and 15.7% of the University s total revenues, respectively. Grants and contracts revenue is presented in the table below in two categories: restricted and financial aid. The restricted sources are from sponsored programs and UNC Foundation support. Financial aid is received by the University from federal, state, foundation, and other private sponsors. The financial aid reported as revenue is based on generally accepted accounting principles for proper financial statement recognition and is not a comprehensive measure of all financial aid available to students. It does not include amounts received by students from third parties, institutional support, or loans. 23
28 MANAGEMENT DISCUSSION AND ANALYSIS Grants and Contracts Revenue For the Year Ended June 30, Federal Grants $ 5,808,551 $ 6,877,981 $ 7,687,878 State and Local Grants 250, , ,429 UNC Foundation Grants and Gifts 3,986,400 4,822,218 3,968,696 Other Private Grants 350, , ,429 Total Restricted Grants and Contracts 10,396,426 12,247,462 12,014,432 Federal Financial Aid 710, , ,771 Federal Pell Financial Aid 12,732,959 13,024,992 13,638,482 State and Non-Gov't Financial Aid 6,448,169 4,376,763 4,331,509 UNC Foundation Named & Endowed 3,475, UNC Foundation Scholarships 821, , ,819 Total Financial Aid 24,187,780 19,016,183 18,846,581 Total Grants and Contract Revenue $ 34,584,206 $ 31,263,645 $ 30,861,013 Restricted Grants and Contracts In fiscal year 2015, total restricted grants were $10.4 million, or 30.1%, of total grants and contracts revenue. This is less than the past two years, where it comprised 39.2% in fiscal year 2014 and 38.9% in fiscal year 2013 of the total grants and contracts revenue. The primary sources of funding for restricted grants and contracts are from the federal government and the UNC Foundation. In fiscal year 2015, federal funding for restricted grants and contracts made up $5.8 million, or 55.9%, of the total restricted grants and contracts revenue. Federal funding decreased $1.1 million, or 15.5%, from fiscal year 2014 to fiscal year These decreases were in National Science Foundation awards and other U.S. Department of Education grants. A large five-year non-renewable National Science Foundation award for the Math Teacher Leadership Center ended in fiscal year 2014, creating a significant variance in funding between fiscal years 2014 and The Department of Education consolidated the Technical Assistance and Continuing Education (TACE) program into a digital-based training format located in Washington, D.C. The University of Northern Colorado was impacted by the discontinued regional model, which resulted in a loss of funding from this federal program. The fiscal year 2015 federal revenue came from the U.S. Department of Education ($2.8 million), the National Science Foundation ($1.0 million), other federal sources ($0.7 million), and federal sub-recipient awards from other institutions ($1.3 million). UNC Foundation funds are generally donated for grants, program support, and scholarships. Grants and program support are included in the top portion of the Grants and Contracts Revenue table and as shown, grew to $4.8 million in fiscal year 2014 and decreased to $4.0 million in fiscal year 2015 as a result of 24
29 MANAGEMENT DISCUSSION AND ANALYSIS fluctuations in UNC s spending patterns for funds raised at the Foundation. UNC recognizes revenue and expense as the University utilizes the donor funds. The Foundation recognizes revenue when the funds are donated. The UNC Foundation grants and gifts is a combination of $0.4 million of specific project grants and $3.6 million in gifts and endowment payouts utilized for program support in athletics and in the colleges within the University. State, local, and private funding in restricted grants and contracts was $0.6 million, or 5.8%, of the total restricted grants and contracts revenue in fiscal year This funding has increased $0.2 million since fiscal year State, local and private grants do not provide a significant source of restricted grants and contracts revenue. Financial Aid Total financial aid was 69.9%, 60.8%, and 61.1% of total grants and contracts revenue in fiscal years 2015, 2014 and 2013, respectively. Federal Pell grant financial aid is considered nonoperating revenue, but is included in this analysis of all grants and contracts revenue. The Federal Pell grant program is awarded to eligible students based on financial need. All students who are eligible for the Pell grant are awarded the money. The University is not limited to a certain amount of Pell grant awards in an academic or fiscal year. The variance in Pell grant revenue from academic year to academic year is based on changes in the eligibility of our students and federal legislation. Pell awards were $12.7, $13.0, and $13.6 million in fiscal years 2015, 2014, and 2013, respectively. The UNC Foundation Named and Endowed Scholarships is a separate line item in the Grants and Contracts Revenue chart to point out an accounting change that was implemented in fiscal year The prior years were not restated for comparison; therefore, the impact to revenue is broken out on a separate line item so the users of the financial statements can clearly see the impact of the change. The University of Northern Colorado Foundation named and endowed scholarships were not previously included in the revenues and expenses in the University of Northern Colorado financial statements because the transactions were accounted for in agency funds. In fiscal year 2015, the University changed this accounting practice and these awards are now included in restricted revenues and scholarship expense to better represent the Foundation s financial aid contribution to the University s students. The UNC Foundation Scholarships line item in the Grants and Contract Revenue chart represents annual donations that are primarily for athletic scholarships. It also includes donations for the Greeley Promise Scholarship Award and money raised through the annual phone-a-thon to support institutional financial aid awards. During the fiscal year 2013 financial planning process, University management made a decision to invest the donations, allowable by donor agreement, at the Foundation for fiscal year 2013 and fund athletic scholarships out of institutional resources. This is why the table reflects only $0.2 million in fiscal year The University changed its policy to raise scholarship funds in one year and utilize those donations for awards to students in the following year. The UNC Foundation financial aid was back to $0.7 million in fiscal year 2014 and $0.8 million in fiscal year 2015 because it now reflects the use of funds raised in the prior year. State financial aid has grown from $4.3 million in fiscal year 2013 to $6.4 million in fiscal year These annual amounts are based on state appropriations and the allocation models used to distribute resources within the state university system. 25


30 MANAGEMENT DISCUSSION AND ANALYSIS Operating Expenses For fiscal year 2015, total expenses of $216.5 million included operating expenses of $211.2 million and interest expenses and other losses of $5.3 million. Operating expenses increased 3.9% in fiscal year 2015 and 5% in fiscal year The change from fiscal year 2013 to 2014 was $8.9 million, and the change from fiscal year 2014 to 2015 was $7.8 million. Natural Classification Operating Expenses by Natural Classification For the Year Ended June 30, Personnel Costs $ 137,499, % $ 130,561, % $ 122,543, % Cost of Goods Sold 5,044, % 4,770, % 5,210, % Other Current Expenses 51,604, % 51,454, % 50,411, % Depreciation 17,069, % 16,592, % 16,279, % Total Operating Expenses $ 211,217, % $ 203,378, % $ 194,446, % Natural classification is a method of grouping expenses according to the type of costs that are incurred. The classifications tell what was purchased rather than why an expense was incurred. Personnel costs are the University s largest expense and increased $8.0 million from fiscal year 2013 to 2014 and $6.9 million from fiscal year 2014 to The largest portion of cost of goods sold expense in the University is in auxiliary services. It increased $0.3 million from fiscal year 2014 to 2015 and decreased $0.4 million from fiscal year 2013 to This is in relation to occupancy fluctuations (86.2% in fiscal year 2013, down to 80.4% in fiscal year 2014 and back up to 82.4% in fiscal year 2015) over the three-year period. Other current expenditures represent all other operating expense, which includes supplies, purchased services, utilities, and travel. It increased $0.1 million, or 0.3%, from fiscal year 2014 to 2015, and $1.0 million, or 2.1%, from fiscal year 2013 to Depreciation increased $0.8 million since fiscal year 2013 as a result of capitalizing more depreciable assets. 26
31 MANAGEMENT DISCUSSION AND ANALYSIS Wages and Benefits For the Year Ended June 30, 2014 to 2015 Change $ Chg % Chg Faculty $ 43,865,574 $ 42,874,021 $ 39,996,664 $ 991, % Administrative 26,756,245 25,222,765 23,342,016 1,533, % Graduate and Teaching Assistants 9,842,578 9,801,063 9,387,362 41, % Classified 19,718,508 19,470,505 18,882, , % Student 6,312,677 6,254,999 5,971,453 57, % Other 923,649 1,078,595 1,250,975 (154,946) -14.4% Subtotal Wages 107,419, ,701,948 98,830,769 2,717, % Fringe Benefits 27,084,329 25,859,191 23,713,207 1,225, % Fringe Benefits (GASB 68) 2,996, ,996,437 - Total Wages and Benefits $ 137,499,997 $ 130,561,139 $ 122,543,976 $ 6,938, % In fiscal year 2013, the University began investing in a five-year compensation plan to move the average salaries to 90% of the average salaries of institutions identified as UNC s peer group. In fiscal 2013, management raised salaries with an overall pool of 5%, including a 3% one-time performance incentive payment for classified staff who met performance expectations, a 3% maintenance-of-effort increase for faculty and administrative employees who met performance expectations, and a 2% pool of funds for faculty and administrative personnel to address parity and equity. In addition, graduate stipends were increased 3% and adjunct faculty contracts were increased 2%. In fiscal year 2014, the University continued working toward the five-year compensation goals by raising salaries with an overall 5% salary pool consisting of 3% to address faculty and exempt staff parity and merit, a 2% maintenance of effort increase for faculty and exempt staff, and classified staff increases ranging from 2.6% to 4.4% as directed by the State of Colorado. Graduate stipends and adjunct faculty salaries were not increased in fiscal year In fiscal year 2015, the University again continued working toward the five-year compensation plan by raising salaries with an overall 3% salary pool consisting of 2% to address faculty and exempt staff parity and merit, a 1% maintenance of effort increase for faculty and exempt staff, and classified staff increases ranging from 2.0% to 4.5% as directed by the State of Colorado. Graduate stipends and adjunct faculty salaries were not increased in fiscal year In addition to salary increases, the University made targeted investments in positions in fiscal year 2014, consistent with the University-wide staffing plan. The annual staffing plan is a position-by-position assessment of the most effective way to accomplish university priorities. Vacant positions may be restructured or eliminated. In fiscal year 2014, new faculty positions were added to programs with growing enrollments. In the past two fiscal years, since the economy has rebounded, the University has been experiencing more turnover in administrative positions. Temporary savings from vacancies creates fluctuations in expenditures from one year to the next. 27
32 MANAGEMENT DISCUSSION AND ANALYSIS Included in the graduate and teaching assistant costs are tuition and fee waivers for graduate students and room and board waivers for resident assistants in the residence halls. These amounts increase annually with graduate tuition and fee and room and board rate increases. The increase in fringe benefits each year is primarily due to the changes in contributions to the Public Employees Retirement Association (PERA) retirement plan as well as retirement contributions to both PERA and the Optional Retirement Plan (ORP) on higher salary levels. The statutory employer contribution was 10.15% for fiscal years 2013, 2014, and 2015 and is expected to remain constant. The Amortization Equalization Disbursement (AED) and the Supplemental Amortization Equalization Disbursement (SAED) percentages have increased from 3.0% and 2.5% at the beginning of fiscal year 2013, to 4.2% and 4.0%, respectively, at the end of fiscal year These rates will continue to increase through fiscal year 2017, when they both reach 5.0%. PERA changes the rates at January 1 each year in concert with the pension plan year ending December 31 each year. More information related to PERA is in Note 10: Defined Benefit Pension Plan and Note 11: Other PERA Retirement Plans. In fiscal year 2015, the implementation of GASB 68 included an additional $3.0 million of non-cash benefit expense because under the new accounting pronouncement, the University recognizes a proportionate share of the full PERA unfunded pension liability with related deferred outflows and inflows of resources. The expense impact of these balance sheet changes is recognized in benefit expense. Functional Classification Operating Expenses by Functional Classification For the Year Ended June 30, Instruction $ 78,279, % $ 76,012, % $ 72,014, % Research 2,583, % 2,947, % 2,623, % Public Service 1,743, % 1,931, % 1,987, % Academic Support 20,974, % 20,587, % 20,133, % Student Services 27,257, % 24,471, % 22,584, % Institutional Support 13,574, % 12,360, % 10,441, % Operation of Plant 10,032, % 10,431, % 9,916, % Scholarships and Fellowships 12,494, % 11,231, % 11,703, % Auxiliary Operating Expenditures 27,209, % 26,810, % 26,761, % Depreciation 17,069, % 16,592, % 16,279, % Total Operating Expenses $ 211,217, % $ 203,378, % $ 194,446, % Functional classification is a method of grouping expenses according to the purpose for which the costs are incurred. The classifications tell why an expense was incurred rather than what was purchased. There were increases in most of the functional categories. The most significant increases were in instruction, student services, scholarships and fellowships, and institutional support. Of the $7.8 million increase in total operating expenses, $6.9 million is attributable to increases in wages of $2.7 million plus benefits of $4.2 million, which are reflected throughout all of the functional categories. Each functional area was increased by a portion of the $3.0 million of non-cash benefits expense for GASB 68 based on its proportion of PERA payroll, which is outlined in the following table: 28
33 MANAGEMENT DISCUSSION AND ANALYSIS GASB 68 Functional Expense Instruction $ 883,145 Research 12,307 Public Service 15,805 Academic Support 436,379 Student Services 245,283 Institutional Support 536,200 Operation of Plant 586,733 Scholarships and Fellowships - Auxiliary Operating Expenditures 280,585 Depreciation - Total Non-cash GASB 68 Expense $ 2,996,437 Scholarships and Fellowships increased $1.3 million. This is from a combination of increases of $1.5 million in institutional aid, $1.7 million from the State of Colorado, and $3.4 million of named and endowed scholarships included from the Foundation. Approximately 69% of the scholarships are reclassified as a reduction of tuition and auxiliary revenue in the scholarship allowance calculation model. The remainder is shown as Scholarships and Fellowships expense. This is a representation of the amount of scholarships awarded to students that the University does not receive from other sources, such as the federal and state governments or the UNC Foundation. These increases in functional expenses are offset by a $0.9 million decrease in non-personnel expenditures. Expenses decreased in Research from reductions in Federal funding but savings were realized in Public Service, Institutional Support, Operating of Maintenance and Plant, and Auxiliaries (some from decreases in cost of sales and utilities and other reductions from cost saving measures). Expenses were increased in Academic Support, Student Support, and Instruction as we invest in new ways of serving our customers and redirect spending into the areas that directly support students. A matrix in Note 15: Operating Expenses by Function Compared with Operating Expenses by Natural Classification demonstrates how much expense by natural classification is included in each functional classification. Nonoperating Revenues and Expenses The nonoperating financial statement line item titled Federal grant and contract revenue is Pell grants; it is the largest portion of nonoperating revenue. The University received $0.3 million less in fiscal year 2015 than in fiscal year 2014 and $0.6 million less in fiscal year 2014 than in fiscal year The amount of Pell revenue is based on student need and several other factors set by the federal government. The University Office of Financial Aid works with all eligible students to help them determine if they qualify for this aid. The University s other nonoperating revenues are made up of investment income and activities that are not earned from the sale of goods and services, such as broadband lease revenue, purchasing card rebate revenues and utility rebate revenue from the use of the west campus generator. The expenses in this category include the costs of issuing bonds. The lease and rebate revenues were $0.8, $0.8 and $0.4 million in fiscal years 2015, 2014, and 2013, respectively. The increase from fiscal year 2013 to 2014 was utility rebate revenue from use of the west 29
34 MANAGEMENT DISCUSSION AND ANALYSIS campus generator, which in fiscal year 2015 earned the University $0.6 million. Fiscal years 2015 and 2014 each included bond issue costs of $0.1 and $0.4 million, respectively. Interest on capital-related debt decreased $0.7 million since fiscal year Savings were realized from refinancing the 2005 bond issue to more favorable interest rates in the 2014A and 2015A issues. The interest on capital-related debt in the Statement of Revenues, Expenses, and Changes in Net Position is slightly different from what is reflected on the Statement of Cash Flows. The Statement of Cash Flows represents the cash payments, where the Statement of Revenues, Expenses, and Changes in Net Position includes both the cash payments and the non-cash amortization transactions related to the bond refunding. Other Changes In fiscal year 2015 the University received $0.6 million in state capital appropriations for fire sprinkler upgrades and roof replacements. The University received $1.2 million in capital grants and gifts for the Kepner Financial Education Center, Gray Hall, and the Athletics scoreboards. In fiscal year 2014 the University received $1.7 million in state capital appropriations for the campus chillers and $0.2 million in capital grants and gifts, which were donations of photochromic prints for the library and a spectrometer. There were no significant items in other changes in fiscal
35 MANAGEMENT DISCUSSION AND ANALYSIS Economic Outlook The University s financial (or economic) position is impacted primarily by enrollment and it is also affected by funding from the state legislature. The combination of tuition, fees, and auxiliary revenue generated from students is 63.1% of the University s operating revenue. The College Opportunity Fund plus the Feefor-Service contract comprised 20.0% of the University s operating revenues in fiscal year The University received an increase of $3.7 million for these state-funded revenues in fiscal year The economic outlook from Legislative Council is optimistic for the next two fiscal years and they report that the Colorado economy continues to expand with increasing employment, falling unemployment rates, gains in consumer spending, and a strong real estate market. The growth in Colorado s economy in the past several years has outpaced the nation because the northern part of the state received a boost from the development of oil wells. This development has slowed with the drop in oil prices, but underlying momentum in other sectors of the economy is helping to offset the decline, and Legislative Council expects growth through fiscal year to be similar to that of the nation as a whole. The September 2015, Legislative Council revenue estimates indicated that the State may be addressing a budget deficit in fiscal year State general fund revenue for fiscal year 2016 is forecasted to be $220.4 million, or 2.1%, lower than the amount budgeted to be spent and saved in the required reserve. The University will be monitoring the developments with the Governor s budget proposals and the impact on Higher Education funding. University management continues to move forward with strategic planning to achieve long-term fiscal sustainability assuming limited state support. Student Headcount Enrollment Fall Final Under Percent (for Fiscal Year) Graduate Graduate Total Change Fall 14 (FY15) 9,469 2,581 12, % Fall 13 (FY14) 9,947 2,763 12, % Fall 12 (FY13) 10,318 2,752 13, % Fall 11 (FY12) 10,414 2,624 13, % Fall 10 (FY11) 10,464 2,566 13, % The University s percentage enrollment growth history over the past five years peaked in fall 2010 at 2.5%. It remained relatively flat until fall 2013, when it dipped 2.8% from fall 2012, then 5.2% from fall 2013 to fall The outlook for fall 2015 is that student enrollment will be slightly higher than fall At fall 2015 census, the University enrollment was 152 students greater than census the previous year. The University is experiencing growth in new student enrollment but has fewer continuing students because of larger graduating classes from the prior years of higher enrollments. The University continues to focus on increasing enrollment. The University President, Kay Norton, set a goal of growing to 15,000 students by fall of To reach the targeted enrollment goals, the strategy is to focus on responding to the growing demand for graduate programs and cementing UNC s position in the undergraduate market by enhancing the quality of students educational experiences. At the same time, University management is working to fully integrate UNC s student support functions to continue improving student persistence. 31
36 MANAGEMENT DISCUSSION AND ANALYSIS This growth strategy has five major targets: 1. Grow enrollment to over 15,000 students by fall Increase the proportion of graduate students in our total enrollment from 20% to 25% by fall Increase the average year-to-year undergraduate persistence rate by 2.8 percentage points (to 83.6 percent) by fall Identify at least $2.4 million in new sustainable cost savings by the end of fiscal year Pursue funding to break ground on the Campus Commons in the summer of 2016 and complete the second of two construction phases by the end of Achieving the five major targets requires reserve spending to invest in strategic improvements. It also includes refining operational practices to be more effective and efficient. Revenue growth is expected to be combined with expenditure savings to rebalance the University s financial position before reserves are depleted. For additional information regarding this report please contact: Office of the Assistant Vice President for Finance University of Northern Colorado th Street Campus Box 22 Greeley, CO (970)
37 FINANCIAL STATEMENTS
38
39 FINANCIAL STATEMENTS STATEMENT OF NET POSITION As of June 30, 2015 University of Northern Colorado University of Northern Colorado Foundation, Inc. ASSETS Current Assets Cash and cash equivalents $ 60,971,397 $ 1,361,845 Restricted cash and cash equivalents with trustee - - Student accounts receivable, net of allowance of $8,663,405 6,112,930 - Pledges receivable, net - 2,595,759 Other receivables 2,626, ,248 Investments - 27,857,131 Inventories 1,098,916 - Loans to students, net 421,855 - Other assets 461,563 90,750 Total Current Assets 71,693,447 32,078,733 Noncurrent Assets Restricted cash and cash equivalents 750,000 - Restricted investments 611,115 - Pledges receivable, net - 4,623,877 Loans to students, net 5,760,343 - Investments permanently restricted for endowment - 83,891,733 Capital assets, net 244,504,014 1,003,025 Total Noncurrent Assets 251,625,472 89,518,635 TOTAL ASSETS 323,318, ,597,368 DEFERRED OUTFLOWS OF RESOURCES Deferred amount on debt refundings 3,279,368 - Deferred amount on pensions 5,570,712 - TOTAL DEFERRED OUTFLOWS OF RESOURCES 8,850,080 - LIABILITIES Current Liabilities Accounts payable and accrued liabilities 15,901, ,020 Unearned revenue 7,765,784 - Bonds/notes payable, current portion 4,020,000 - Capital leases payable, current portion 1,625,895 - Funds held for the University of Northern Colorado - 614,539 Other current liabilities 1,622,854 - Total Current Liabilities 30,936,397 1,546,559 Noncurrent Liabilities Bonds/notes payable 136,294,974 - Capital leases payable 1,863,671 - Other noncurrent liabilities 64,802 - Net pension liabilities 124,356,394 - Annuity obligations - 136,612 Compensated absence liabilities 4,366,425 - Total Noncurrent Liabilities 266,946, ,612 TOTAL LIABILITIES 297,882,663 1,683,171 DEFERRED INFLOWS OF RESOURCES Deferred amount on debt refundings 934,896 - Deferred amount on pensions 1,711,348 - TOTAL DEFERRED INFLOWS OF RESOURCES 2,646,244 - NET POSITION Net investment in capital assets 102,659,407 1,003,025 Restricted for: Nonexpendable Scholarships and fellowships 306,155 45,146,766 Academic support 1,400 - Other - 38,744,967 Expendable Scholarships and fellowships 300,497 4,457,385 Loans 8,690,538 - Bond reserve 750,000 - Other 181,533 17,474,431 Unrestricted (81,249,438) 13,087,623 TOTAL NET POSITION $ 31,640,092 $ 119,914,197 See notes to the financial statements 33
40 FINANCIAL STATEMENTS STATEMENT OF REVENUES, EXPENSES, AND CHANGES IN NET POSITION For the Year Ended June 30, 2015 University of University of Northern Colorado Northern Colorado Foundation, Inc. Operating Revenues Student tuition and fees, net $ 102,175,619 Contributions - 11,712,637 Contributed services - 79,708 Federal grants and contracts 6,519,131 - State and local grants and contracts 6,698,749 - State fee-for-service 21,916,149 - Nongovernmental grants and contracts 8,633,367 - Sales and services of educational activities 407,533 - Auxiliary operating revenue 31,272,265 - Interest and dividends - 1,898,854 Net realized and unrealized gain - 1,637,104 Other operating revenue 9,440, ,337 Total Operating Revenues 187,063,275 15,858,640 Operating Expenses Educational and general Instruction 78,279,035 - Research 2,583,079 - Public service 1,743,671 - Academic support 20,974,001 - Student services 27,257,539 - Institutional support 13,574,402 - Operation of plant 10,032,241 - Scholarships and fellowships 12,494,877 - Program - 11,289,698 Management and general - 748,846 Fundraising - 218,197 Pledged receivable write off - 31,335 Auxiliary operating expenditures 27,209,745 - Depreciation and amortization 17,069,138 - Total Operating Expenses 211,217,728 12,288,076 Operating Income (Loss) (24,154,453) 3,570,564 Nonoperating Revenues (Expenses) Investment income, net of investment expense 626,146 - Interest on capital asset related debt (5,295,433) - Federal grants and contracts revenue 12,732,959 - Other nonoperating revenue 696,094 - Net Nonoperating Revenues (Expenses) 8,759,766 - Income (Loss) Before Other Revenues (Expenses) or Gains (Losses) (15,394,687) 3,570,564 Capital appropriations 616,702 - Capital grants and gifts 1,156,264 - Loss on disposal of capital assets (1,052) - Total Other Changes 1,771,914 - Increase (Decrease) in Net Position (13,622,773) 3,570,564 Net Position Beginning of year, as previously reported 162,763, ,343,633 Prior period adjustment from change in accounting principle (117,500,593) - Net position beginning of year, as restated 45,262, ,343,633 Net Position, End of Year $ 31,640,092 $ 119,914,197 See notes to the financial statements 34
41 FINANCIAL STATEMENTS STATEMENT OF CASH FLOWS For the Year Ended June 30, Operating Activities Cash Received Tuition and fees $ 102,360,617 Colorado State fee-for-service 21,916,149 Sales and services of educational activities 303,725 Sales and services of auxiliary activities 31,779,862 Grants and contracts 7,957,724 Federal financial aid 613,180 State financial aid 6,448,169 UNC Foundation grants 442,548 UNC Foundation gifts 3,543,852 UNC Foundation scholarships 4,296,072 Other receipts 9,692,370 Student loans collected 1,450,020 Cash Payments Payments to or for employees (132,799,055) Payments to suppliers (45,352,031) Scholarships disbursed (12,494,877) Student loans disbursed (1,124,681) Net cash provided (used) by operating activities (966,356) Noncapital Financing Activities Federal Pell grant non-operating funds 12,732,959 Other nonoperating revenues - rental, lease, other 1,998,157 Agency inflows - campus organizations and scholarships 10,372,257 Agency outflows - campus organizations and scholarships (10,400,380) Agency inflows - student loans 73,645,603 Agency outflows - student loans (73,645,603) Net cash provided by noncapital financing activities 14,702,993 Capital and Related Financing Activities Acquisition and construction of capital assets (12,838,815) Proceeds and payments related to notes/lease payable - Proceeds from 2015A bonds issued 21,549,572 Proceeds from 2015A issue placed in escrow (21,355,742) Bond refinancing costs paid (182,494) Proceeds from 2014A bonds issued - Proceeds from 2014A issue placed in escrow - Principal paid on note payable - Principal paid on bonds payable (3,855,000) Principal paid on capital leases (1,670,150) Interest paid on capital debt and note payable (5,518,409) Net cash provided (used) by capital & related financing activities (23,871,038) Investing Activities Investment earnings (loss) 639,212 Net cash provided (used) by investing activities 639,212 Decrease in Cash and Cash Equivalents (9,495,189) Cash and Cash Equivalents, Beginning of Year 71,216,586 Cash and Cash Equivalents, End of Year $ 61,721,397 See notes to the financial statements 35
42 FINANCIAL STATEMENTS STATEMENT OF CASH FLOWS For the Year Ended June 30, Reconciliation of Net Operating Revenues (Expenses) to Net Cash Provided by Operating Activities Operating income (loss) $ (24,154,453) Depreciation and amortization expense 17,069,138 Amoritization of pension-related deferred outflows and inflows 2,996,437 Student loan cancellations 95,423 Changes in operating assets and liabilities Student accounts receivable, net 338,876 Other receivables, net 1,710,226 Loans to students, net 313,046 Inventories 22,916 Other current assets (11,676) Accounts payable (1,225,680) Accrued payroll 1,583,270 Unearned revenues 275,499 Other liabilities 44,126 Accrued compensated absences (23,504) Net cash provided (used) by operating activities $ (966,356) Reconciliation of Cash and Cash Equivalents to the Statement of Net Position Cash and cash equivalents $ 60,971,397 Restricted cash with trustee - Restricted cash and cash equivalents 750,000 Total cash and cash equivalents $ 61,721,397 Supplemental Cash Flows Information Cash assets financed by state capital contribution $ 616,702 Loss on disposal of assets $ 1,052 See notes to the financial statements 36
43 NOTES TO THE FINANCIAL STATEMENTS Note 1: Nature of Operations and Summary of Significant Accounting Policies Nature of Operations and Governance The University of Northern Colorado (the University or UNC) is a public institution of higher education offering a broad general curriculum, along with preparation for selected professions within the fields of business, education, health services, and music. UNC also offers programs for pre-professions such as prelaw, pre-medicine, and others. The University is an institution of the state of Colorado with operations funded largely through student tuition, fees, and the State of Colorado College Opportunity Fund. As an institution of the state of Colorado, the University s operations and activities are funded in part through feefor-service contracts with the state. The University also engages in research, offers student financial aid, and provides other services which are funded through grants and contracts, including grants from the University of Northern Colorado Foundation, Incorporated (the Foundation). The Board of Trustees is the governing body of the University and is comprised of seven members appointed by the Governor plus one faculty member elected by the faculty and one student member elected by the student body. Reporting Entity and Component Units The financial statements of the University include all of the integral parts of the University s operations. The University applied various criteria to determine if it is financially accountable for any organization that would require that organization to be included in the University s reporting entity. These criteria include fiscal dependency, financial benefit/burden relationship, selection of governing authority, designation of management, ability to significantly influence operations, and accountability for fiscal matters. The financial statements present the University (primary government) and its discretely presented component unit in accordance with generally accepted accounting principles in the United States of America. The component unit is included in the University s reporting entity because of the significance of its operational and financial relationships with the University, in accordance with Statement No. 61 of the Governmental Accounting Standards Board (GASB), The Financial Reporting Entity. Financial statements of the discretely presented component unit can be obtained from its administrative office. The University has the University of Northern Colorado Foundation, Incorporated, as a discretely presented component unit. The University of Northern Colorado Foundation, Incorporated The University of Northern Colorado Foundation, Incorporated (the Foundation) is a legally separate, taxexempt component unit of the University, incorporated under Article 40, Title 7 of the Colorado Revised Statutes of The Foundation was established in February 1966 to promote the welfare, development, and growth of the University and also to permit the Foundation to engage in activities that may be beyond the scope of the Board of Trustees of the University. Although the University does not control the timing or amount of receipts from the Foundation, the majority of resources that the Foundation holds and invests are restricted to the activities of the University by the donors. Because these restricted resources held by the Foundation can be used only by, or for the benefit of, the University, the Foundation is considered a component unit of the University and is discretely presented in the University s financial statements. 37
44 NOTES TO THE FINANCIAL STATEMENTS Restatement The fiscal year 2015 beginning Net Position was restated on the Statement of Net Positon and Statement of Revenues, Expenses, and Changes in Net Positon in compliance with GASB 68: Accounting for Financial Reporting of Pensions. GASB 68 required the University of Northern Colorado to present its proportionate share of the Public Employees Retirement Association of Colorado s (PERA) underfunded net pension liability and associated deferred outflows and inflows of resources in the financial statements. Beginning net position was decreased by $117.5 million. The University s proportionate share of the underfunded net liability for fiscal year 2015 was $124.4 million, deferred outflows of resources are $5.6 million and deferred inflows of resources are $1.7 million on the Statement of Net Position. The Statement of Revenues, Expenses, and Changes in Net Position includes $3.0 million of non-cash benefit expense from transactions related to the change in the liability and amortizations of the pension-related deferred outflows and inflows of resources. Information to re-state fiscal year 2014 on a comparative basis was not available; therefore, the University elected to present a single year in the 2015 Annual Financial Report. Basis of Accounting and Presentation The basic financial statements of the University have been presented using the economic resources measurement focus and the accrual basis of accounting. Under the accrual basis of accounting, revenues from exchange transactions are recognized when earned and expenses from exchange transactions are recorded when an obligation is incurred. All significant intra-agency transactions are eliminated. The University prepares its financial statements as a business-type activity in conformity with all applicable pronouncements of the Governmental Accounting Standards Board (GASB). The Foundation reports under Financial Accounting Standards Board (FASB) standards. As such, certain revenue recognition criteria and presentation features are different from GASB revenue recognition criteria and presentation features. No modifications have been made to the Foundation s financial information in the University s financial reporting for these differences. Unrestricted Cash and Cash Equivalents For purposes of reporting cash flows, the University defines cash and cash equivalents as cash on hand, demand deposit accounts with financial institutions, pooled cash with the State Treasurer, and all highly liquid investments with original maturities of three months or less. As of June 30, 2015, cash equivalents consisted primarily of funds invested through the State Treasurer s cash management program. Restricted Cash and Cash Equivalents Assets are reported as restricted when restrictions on asset use change the nature or normal understanding of the availability of the assets. For the University, restricted cash and cash equivalents include amounts restricted by bond covenants. Restricted Cash and Cash Equivalents with Trustee Cash is reported as held in trust when a third party retains the money in a fiduciary capacity, whether as a trustee, agent, escrow agent, or otherwise, for a short period of time. Investments and Investment Income Investments in equity and debt securities are carried at fair value. Fair value is determined using quoted market prices. Investment income consists of interest and dividend income plus the current year change in unrealized gain (loss) on the fair value of investments. The University s investments generally include direct obligations of the U.S. government and its agencies, money market funds, mutual funds, and 38
45 NOTES TO THE FINANCIAL STATEMENTS guaranteed investment contracts. Endowments are pooled to the extent possible under gift agreements. The Foundation manages certain endowments for the University in accordance with its investment policy. The classification of investments as current or noncurrent is based on the underlying nature and restricted use of the asset. Current investments are those without restrictions imposed by third parties that can be used to pay current obligations of the University. Noncurrent investments include restricted investments and those investments designated to be used for long-term obligations. Accounts Receivable Accounts receivable consists of tuition and fee charges to students and auxiliary enterprise services provided to students, faculty, and staff. Accounts receivable also includes amounts due from the federal government, state and local governments, or private sources in connection with reimbursement of allowable expenditures made pursuant to the University s grants and contracts. Accounts receivable is recorded net of estimated uncollectible amounts. Inventories Inventories consisting of computer products, books, food, and other consumable supplies are carried at the lower of cost or market. Cost is determined using the first-in, first-out (FIFO) basis. Loans to Students The University makes loans to students under various federal and other loan programs. Such loans receivable is recorded net of estimated uncollectible amounts. The allowance for uncollectible loans netted against loans to students was $2,339,468 at June 30, Capital Assets Capital assets are recorded at cost at the date of acquisition or fair market value at the date of donation if acquired by gift. The University s capitalization policy includes items with a value of $5,000 or more and an estimated useful life greater than one year. Renovations to buildings and other improvements that significantly increase the value and extend the useful life of the structure are capitalized. Routine repairs and maintenance are charged to expenses. Major outlays for capital assets and improvements are capitalized as construction in progress throughout the building project. The University capitalizes interest costs as a component of construction in progress. Total interest is presented in the following table: University Interest Capitalized and Expensed 2015 Interest capitalized on self-funded capital projects $ (89,495) Interest charged to expense for bonds and capital leases 5,384,928 Total interest $ 5,295,433 The University has capitalized collections, such as works of art and historical artifacts. The nature of certain collections is such that the value and usefulness of the collection does not change over time. These collections have not been depreciated in the University s financial statements. Assets under capital leases are recorded at the present value of the future minimum lease payments and amortized using the straight-line method over the shorter of the lease term or the estimated useful life of 39
46 NOTES TO THE FINANCIAL STATEMENTS the asset being leased. Such amortization is included as depreciation expense in the accompanying financial statements. Depreciation is computed using the straight-line method over the estimated useful life of the asset, generally 40 years for buildings and improvements, 20 years for land improvements, 3 years for software, 10 years for library books, and 3-10 years for equipment and vehicles. Depreciation expense is not allocated among functional categories. Deferred Outflows and Inflows of Resources In addition to assets, the statement of net position contains a separate section for deferred outflows of resources and deferred inflows of resources. These separate financial statement elements, deferred outflows and inflows of resources, represent the consumption of net position that applies to future periods; therefore, they are not recognized as an outflow or inflow of resources (expense/or deduction to expense) until that time. Capital Lease Liabilities Capital leases consist of various lease-purchase contracts and other lease agreements. Such contracts provide that any commitments beyond the current year are contingent upon funds being budgeted for such purposes by the Board of Trustees. It is reasonably assured that such leases will be renewed in the normal course of business and therefore are treated as non-cancelable for financial reporting purposes. Unearned Revenues The University prorates the summer session revenues on a 50% split between two fiscal years. Tuition, fees and certain auxiliary revenues received before June 30, but determined by this proration to be earned in the following year, are recorded as unearned revenues. Unearned revenues also include amounts received from grant and contract sponsors that have not yet been earned. Classification of Revenues The University has classified its revenues as either operating or nonoperating revenues according to the following criteria: Operating Revenues Operating revenues include activities that have the characteristics of exchange transactions, such as (1) student tuition and fees, net of scholarship allowances; (2) sales and services of auxiliary enterprises; (3) contracts and grants for research activities; and (4) interest on student loans. Nonoperating Revenues Nonoperating revenues include activities that have the characteristics of non-exchange transactions, such as gifts and contributions, state appropriations, investment income, and other revenue sources that are defined as nonoperating revenues by GASB 9: Reporting Cash Flows of Proprietary and Nonexpendable Trust Funds and Governmental Entities That Use Proprietary Fund Accounting, and GASB 34: Basic Financial Statements and Management s Discussion and Analysis. Pell grants of $12,732,959 at June 30, 2015, are recorded as nonoperating revenue as defined by the 2007 amendment of the GASB Comprehensive Implementation Guide regarding nonoperating presentation of Pell grants (Question ) 40
47 NOTES TO THE FINANCIAL STATEMENTS Tax-Exempt Status and Income Taxes As a Colorado state institution of higher education, the income of the University is generally exempt from federal and state income taxes under Section 115 of the Internal Revenue Code and a similar provision of state law. However, any income unrelated to the exempt purpose of the University is subject to tax under Section 511(a)(2)(B) of the Internal Revenue Code. The University had income tax liability related to income generated from activities unrelated to the University s exempt purposes of $31,670 as of June 30, These activities include the taxable portion of sponsorship agreements that are considered advertising by the Internal Revenue Service tax code definitions. It also includes taxable income related to the rental of campus facilities for weddings, conferences, and other activities unrelated to the mission of the institution. Use of Estimates The preparation of financial statements in conformity with accounting principles generally accepted in the United States of America requires management to make estimates and assumptions that affect the reported amounts of assets and liabilities and disclosure of contingent assets and liabilities at the date of the financial statements and the reported amounts of revenues, expenses, and other changes in net position during the reporting period. Actual results could differ from those estimates. Significant estimates have been made regarding compensated absences expense, scholarship allowances, and bad debt allowances for accounts receivable as described below. Compensated Absences Accrued Liability University policies permit most employees to accumulate vacation and sick leave benefits that may be realized as paid time off or, in limited circumstances, as a cash payment. Vacation and sick leave benefits taken as paid time off are recognized as an expense when the time off occurs. Accrued compensated absences liabilities are recognized based upon estimated cash payments due to employees upon termination or retirement. The limitations on such payments are defined by the rules associated with the personnel systems of the University. Employees accrue and vest in vacation and sick leave earnings based on their hire date and length of service. Vacation accruals are paid in full upon separation, whereas only a portion of sick leave is paid upon specific types of separation, such as retirement. Compensated absences liabilities are computed using the regular pay and termination pay rates in effect at the financial statement date plus an additional amount for compensation-related payments, such as Social Security and Medicare taxes, computed using rates in effect at that date. Scholarship Discounts and Allowances Student tuition, fee revenues, and certain other revenues from students are reported net of scholarship allowances in the Statement of Revenues, Expenses, and Changes in Net Position. Certain governmental grants, such as Pell grants and other federal, state, or nongovernmental financial aid programs, are recorded as either operating or nonoperating revenues in the University s financial statements. To the extent that revenues from such programs are used to satisfy tuition and fees and other student charges, the University has recorded scholarship allowances. The scholarship allowances on tuition and fees and housing were approximately $28.3 million for the fiscal year ended June 30, Bad Debt Allowance Bad debt expense and an allowance against receivables are estimated based upon the age of the receivables and historical collection rates. 41
48 NOTES TO THE FINANCIAL STATEMENTS Note 2: Cash and Cash Equivalents Unrestricted Cash and Cash Equivalents For operating purposes, the University holds unrestricted cash and cash equivalent deposits in several bank accounts at U.S. financial institutions. The University also maintains unrestricted cash on hand for petty cash and change fund daily operating purposes. Unrestricted Cash and Cash Equivalents 2015 Cash on hand $ 48,150 Cash with U.S. financial institutions 7,067,549 Cash with Colorado State Treasurer 53,679,030 Unrealized gain (loss) -- cash with State Treasurer 176,668 Total unrestricted cash and cash equivalents $ 60,971,397 The University deposits its unrestricted cash with the Colorado State Treasury as required by Colorado Revised Statutes (C.R.S.). The State Treasury pools these deposits and invests them in securities authorized by Section , C.R.S. The State Treasury acts as a bank for all state agencies and institutions of higher education, with the exception of the University of Colorado. Money deposited in the State Treasury is invested until the cash is needed. As of June 30, 2015, the University had total cash on deposit with the State Treasury of $54.4 million ($53.6 million unrestricted and $0.8 restricted), which represented approximately 0.7% of the total $7,684.5 million fair value of deposits in the State Treasury Pool (Pool). For financial reporting purposes all of the State Treasury investments are reported at fair value, which is determined based on quoted market prices at fiscal year-end. On the basis of the University s participation in the Pool, the University reports an increase or decrease in cash for its share of the Treasury s unrealized gains and losses on the Pool s underlying investments. The State Treasury does not invest any of the Pool s resources in any external investment pool, and there is no assignment of income related to participation in the Pool. The unrealized gains/losses included in income reflect only the change in fair value for the fiscal year. Investments in the State Treasury Pool are exposed to custodial credit risk if the securities are uninsured, are not registered in the state s name, and are held by either the counterparty to the investment purchase or the counterparty s trust department or agent, but not in the state s name. At June 30, 2015, none of the investments in the State Treasury Pool were subject to custodial credit risk. Restricted Cash and Cash Equivalents The University holds restricted cash of $750,000 with the State Treasury to meet required bond covenants related to the auxiliary revenue refunding and improvement bonds. Custodial Credit Risk Cash and Cash Equivalents Custodial credit risk for cash and cash equivalents exists when, in the event of the failure of a depository financial institution, the University may be unable to recover deposits or recover collateral securities that are in the possession of an outside party. Under GASB 40: Deposit and Investment Risk Disclosures, deposits are exposed to custodial credit risk if the deposits are not covered by depository insurance and the deposits are (a) uncollateralized or (b) collateralized, with securities held by the pledging financial institution or the pledging financial institution s trust department or agent, but not in the depositorgovernment s name. To manage custodial credit risk, unrestricted cash and cash equivalents with the State Treasury and U.S. financial institutions are made in accordance with University policy and state law, 42
49 NOTES TO THE FINANCIAL STATEMENTS including the Public Deposit Protection Act (PDPA). PDPA requires all eligible depositories holding public deposits to pledge designated eligible collateral having market value equal to at least 102% of the deposits exceeding those amounts insured by federal depository insurance. Deposits collateralized under the PDPA are considered to be collateralized with securities held by the pledging institution in the University s name. At June 30, 2015, all of the cash and cash equivalents held by the State Treasury and U.S. financial institutions were therefore not subject to custodial credit risk. The State Treasury Pool was not subject to foreign currency risk or concentration of credit risk in fiscal year Additional information on investments of the State Treasury Pool may be obtained in the State s Comprehensive Annual Financial Report for the year ended June 30, Restricted Cash and Cash Equivalents with Trustee At June 30, 2015, the University does not hold current or restricted cash with a trustee. Note 3: Investments The University s investments on June 30, 2015 are certain endowments held at the Foundation and are restricted by the donors. These investments are subject to Colorado Revised Statutes Title 15, Article 1, Part 11 Uniform Prudent Management of Institutional Funds or UPMIFA. Fair value of investments held at June 30, are detailed in the following table: Investment Types 2015 Maturity Fixed Income U.S. Government Obligations $ 476, years Fixed Income U.S. Government Obligations 102,066 Less than 1 year Money Market Funds 32,735 Less than 1 year Total University Restricted Investments $ 611,115 Custodial Credit Risk Investments Custodial credit risk for investments is the risk that, in the event of the failure of the counterparty, the University will not be able to recover the value of its investments or collateral securities that are in the possession of an outside party. Therefore, exposure arises if the securities are uninsured, are not registered in the University s name, and are held by either the counterparty to the investment purchase or the counterparty s trust department or agent, but not in the University s name. The University does not have a formal investment policy regarding custodial credit risk. The balance of the University s investments is endowment funds managed by the Foundation according to the custodial agreement between the University and the Foundation approved on December 14, These securities are held in the Foundation s name as agent of the University and are not subject to custodial credit risk. Interest Rate Risk Investments Interest rate risk is the risk that changes if the market rate of interest will adversely affect the value of an investment. Interest rate risk applies only to debt investments. Interest rate risk can be managed by managing the duration to effective maturity and/or the weighted-average maturity of the investments. The duration method uses the present value of cash flows, weighted for those cash flows as a percentage of the 43
50 NOTES TO THE FINANCIAL STATEMENTS investment s full price. The weighted-average maturity method measures the time to maturity in years weighted to reflect the dollar size of the individual investments within an investment type. The University does not have a formal investment policy that limits investment maturities as a means of managing its exposure to fair value losses arising from increasing interest rates. The duration to effective maturity and weighted-average maturity of each investment type held by the University is identified in the investment risk schedule. Credit Quality Risk Credit quality risk is the risk that an issuer or other counterparty to an investment will not fulfill its obligations. Credit risk applies only to debt investments. Mutual funds and certain other investments are not categorized as to credit quality risk because ownership is not evidenced by a security. This risk is assessed by national rating agencies, which assign a credit quality rating for many investments. State law limits investments in securities, at the time of purchase, to securities with the top two ratings issued by nationally recognized statistical rating organizations. The University does not have a formal policy related to investment credit quality risk that would further limit its investment choices. All of the University s investments have a Moody s rating of Aaa or better and a Standard & Poor s rating of AA+ or better. Credit quality risk is not available for the Foundation. Maturities and credit ratings for the University s investments held at June 30, are detailed below: 2015 Maturities and Credit Ratings by Investment Type Fair Value Duration to Maturity Weighted - Average Maturity S&P Credit Rating The University U.S. Government Obligations $ 578, yrs 2.35 yrs AA+ Money Market Funds 32,735 N/A N/A N/A Total Investments as of June 30 $ 611,115 The UNC Foundation s investments held at June 30, are detailed below: Investment Types 2015 Foundation Investments Cash and cash equivalents $ 578,746 Equities 44,161,612 Fixed income 25,472,190 Alternative investments 14,985,605 Other 26,550,711 Total Foundation Investments $ 111,748,864 44
51 NOTES TO THE FINANCIAL STATEMENTS Note 4: Accounts, Contributions, and Loans Receivable Accounts and loans receivable are shown, net of allowances for doubtful accounts, in the accompanying Statement of Net Position. Net receivables at June 30, are detailed below: Accounts, Contributions and Loans Receivable 2015 Student accounts receivable - current $ 14,776,335 Allowance for doubtful accounts (8,663,405) Subtotal student accounts receivable - net 6,112,930 Student loans receivable - current 1,959,722 Allowance for doubtful accounts (1,537,867) Subtotal student loans receivable - net 421,855 Student loans receivable - noncurrent 6,561,945 Allowance for doubtful accounts (801,602) Subtotal noncurrent student loans receivable - net 5,760,343 Other receivables - current Sponsored programs - federal grants receivable 545,017 Sponsored programs - nonfederal grants receivable 13,346 Student loans program - federal loans receivable 167,172 Accounts receivable related party - the Foundation 872,125 Other accounts receivable 1,029,126 Subtotal other receivables - current 2,626,786 Total University accounts, loans & other receivables $ 14,921,914 Related Party Receivable Gifts and grants receivable from the Foundation to the University were $0.9 million at June 30, Foundation Contributions and Pledges Receivable Foundation gifts of cash and other assets received without donor stipulations are reported as unrestricted contributions. Gifts received with a donor stipulation that limits their use are reported as temporarily or permanently restricted contributions. When a donor-stipulated time restriction ends or purpose restriction is accomplished, temporarily restricted net position is reclassified to unrestricted net position and reported in the statement of activities as net position released from restrictions. Unconditional gifts expected to be collected within one year are reported at their net realizable value. Unconditional gifts expected to be collected in future years are reported at the present value of estimated future cash flows discounted by using a risk-free interest rate. An allowance for uncollectible contributions is established by Foundation management based on management s analysis of specific pledge receivables. 45
52 NOTES TO THE FINANCIAL STATEMENTS Conditional gifts depend on the occurrence of a specified future and uncertain event to bind the potential donor and are recognized as assets and revenue when the conditions are substantially met and the gift becomes unconditional. Note 5: Other Assets Inventories and other current and noncurrent assets are shown as of June 30, detailed below: Other Assets 2015 The University Inventories for supply use $ 833,419 Inventories for resale 265,497 Total inventories $ 1,098,916 Prepaid expenses $ 461,563 Total other current assets $ 461,563 The Foundation Prepaid expenses and other current assets $ 90,750 Note 6: Capital Assets The following is a summary of University capital asset activity as of June 30: 2015 Capital Assets and Accumulated Depreciation Beginning Balance Additions Disposals Transfers Ending Balance Capital Assets Land $ 10,270,198 $ - $ - $ - $ 10,270,198 Land improvements 20,926, ,044,373 21,971,370 Non-depreciable land improvements 4,264, ,264,026 Buildings and improvements 381,203, ,915, ,119,355 Equipment and vehicles 22,178,054 1,404,405 (324,602) 984,977 24,242,834 Software 3,018,568 11, ,030,564 Library materials 42,281,925 1,934,993 (1,224,221) - 42,992,697 Non-depreciable art/historical 1,705,245 20, ,725,488 Leasehold improvements 1,059, ,059,732 Construction in progress 6,532,413 10,227,302 - (9,945,213) 6,814,502 Total capital assets 493,440,650 13,598,939 (1,548,823) - 505,490,766 Less accumulated depreciation Land improvements 11,505, , $ 12,397,954 Buildings and improvements 183,394,347 12,394, ,789,109 Equipment and vehicles 12,488,100 2,025,438 (327,949) - 14,185,589 Software 2,966,876 44, ,011,666 Library materials 34,329,329 1,655,080 (1,224,221) - 34,760,188 Leasehold improvements 785,812 56, ,246 Total accumulated depreciation 245,469,784 17,069,138 (1,552,170) - 260,986,752 Net capital assets $ 247,970,866 $ (3,470,199) $ 3,347 $ - $ 244,504,014 46
53 NOTES TO THE FINANCIAL STATEMENTS The following is a summary of Foundation capital asset activity for the year ended June 30: Foundation Capital Assets 2015 Capital assets Buildings and improvements $ 1,283,411 Equipment and vehicles 253,132 Total capital assets 1,536,543 Less accumulated depreciation (533,518) Net capital assets $ 1,003,025 Note 7: Liabilities and Unearned Revenues The following is a summary of liabilities as of June 30: The University Liabilities and Unearned Revenues 2015 Accounts payable and accrued liabilities Accounts payable $ 3,003,864 Accrued salaries and benefits 12,418,603 Accrued interest expense 417,235 Other accrued liabilities 62,162 Total accounts payable and accrued liabilities 15,901,864 Current unearned revenue Summer tuition and other activities 6,908,924 Restricted grants and contracts 252,786 Auxiliary and housing 576,424 Broadband lease 27,650 Total current unearned revenue 7,765,784 Other current liabilities Deposits held 897,295 Insurance liability 49,611 Deposits held in custody for agency funds 273,697 Compensated absences liability 402,251 Subtotal other current liabilities 1,622,854 Other noncurrent liabilities Long-term deposit liabilities held 64,802 Compensated absences liability 4,366,425 Net pension liability 124,356,394 Subtotal other noncurrent liabilities 128,787,621 Bonds, capital leases and notes payable Current bonds and capital leases 5,645,895 Noncurrent bonds, capital leases 138,158,645 Total bonds, capital leases and notes payable 143,804,540 Total liabilities and unearned revenue $ 297,882,663 47
54 NOTES TO THE FINANCIAL STATEMENTS The Foundation Liabilities and Unearned Revenues The following is a summary of Foundation liabilities as of June 30: The Foundation Liabilities and Unearned Revenues 2015 Accounts payable and accrued liabilities $ 932,020 Funds held for the University 614,539 Annuity obligations 136,612 Total Liabilities and Unearned Revenues $ 1,683,171 Charitable Gift Annuity Obligations The Foundation has entered into several charitable gift annuity contracts. These contracts require the Foundation to make fixed payments to the beneficiaries over their lifetimes. Under a charitable gift annuity contract, the assets received by the Foundation are not held in trust separately from other investments of the Foundation. On the date each charitable gift annuity was established, the Foundation recorded a contribution equal to the difference between the amount transferred from the donor and the present value of the future cash flows expected to be paid to the specified beneficiaries, using a discount rate equal to the then current Applicable Federal Rate. At the end of these contracts, the majority of these assets are to be endowed and are included in permanently restricted net position at June 30 as follows: Charitable Gift and Annuity Contracts Assets held under gift contracts $ ,530 Less associated liabilities (136,612) Present value of assets held under contract $ 74,918 Note 8: Bonds, Capital Leases and Notes Payable Bonds, Capital Leases and Notes Payable The following table provides a summary of Bonds, Capital Leases and Notes Payable liabilities as of June 30, 2015: Bonds, Capital Leases and Notes Payable Summary Interest Rates Final Maturity Balance 2015 Fixed Rate - Auxiliary Revenue Bonds 2.0%-5.0% 2040 $ 120,969,974 Variable Rate - Institutional Enterprise Revenue Bonds (2011B) 0.823% ,345,000 Capital Leases Payable 1.49%-6.02% ,489,566 Total Bonds, Capital Leases and Notes Payable $ 143,804,540 The interest rate on the Series 2011B variable rate demand bonds is calculated monthly based on 70% of the one month London Interbank Offered Rate (LIBOR) that is published two business days prior to the reset date plus a spread factor of The interest rate on the Series 2011B as of June 30, 2015 was 0.823%. The 2011B bond issue documents utilize a projected annual interest rate of 3.5%. 48
55 NOTES TO THE FINANCIAL STATEMENTS Changes in Bonds, Capital Leases and Notes Payable The table below presents the summary of changes in bonds, capital leases, and notes payable for the fiscal year ended June 30: 2015 Changes in Bonds, Capital Leases, and Notes Payable Beginning Balance Additions Deductions Ending Balance Current Portion Bonds Payable $ 137,315,000 $ 21,510,000 $ 25,190,000 $ 133,635,000 $ 4,020,000 Plus unamortized premiums 8,011,818 39,572 1,371,416 6,679,974 - Total revenue bonds payable 145,326,818 21,549,572 26,561, ,314,974 4,020,000 Capital leases payable 4,210, ,823 1,670,150 3,489,566 1,625,895 Notes payable 948, , Total Bonds, Capital Leases, and Notes Payable $ 150,486,534 $ 22,498,395 $ 29,180,389 $ 143,804,540 $ 5,645,895 Revenue and Refunding Bonds A general description of each revenue bond issue, original issuance amount, and the amount outstanding as of June 30, 2015, are detailed in the table Revenue Bond Detail. The fixed rate revenue bonds interest is payable semi-annually and principal payments are paid annually (Series 2008, 2011A, 2014A, and 2015A). The variable rate demand bond interest is paid monthly and principal is remitted annually (Series 2011B). The bonds are not secured by any encumbrance, mortgage, or other pledge of property, except pledged revenues. Bond provisions require the University to maintain compliance with certain rate covenants related to the bonds. The Master Enterprise Bond Resolution authorizing the issuance of Institutional Enterprise Revenue Bonds, and adopted by the University s Board of Trustees, specifies debt service coverage requirements. The debt service coverage provisions require net pledged revenues to be equal to the combined principal and interest payments of the revenue bonds due during any subsequent fiscal year for the life of the associated revenue bonds. These debt service requirements are detailed in the table Combined Fixed and Variable Rate Bond Debt Service Requirements in this footnote. The Master Enterprise Bond Resolution also includes a covenant which provides that during the period in which the bonds are outstanding and subject to applicable law, the University will continue to impose such fees and charges as are included within the gross revenue and will continue the present operation and use of the University s facilities. The University will continue to maintain reasonable fees, rental rates, and other charges for the use of all facilities and for services rendered by the University and will return annually gross revenues sufficient to pay all amounts required with respect to prior bond obligations, to pay operation and maintenance expenses, and to pay the annual debt service requirements of the bonds and any parity obligations payable from net revenues. The University believes it is in compliance with all existing pledged revenue requirements of its outstanding bonds. The 2008 Bonds payable are secured by a first lien, but not necessarily an exclusive first lien, derived from 10% of gross general fund tuition revenues, net student fee revenues, and net auxiliary facility system revenues. The 2011A, 2011B, 2014A, and 2015A bonds are also secured by a pledge of the revenues derived from net extended studies revenues and gross facility and administrative indirect cost recoveries. The University has pledged these revenues through 2040 to repay $133,635,000 in auxiliary revenue bonds plus interest. As of June 30, 2015, total pledged revenue and the associated debt service coverage are summarized in the table on the following page: 49
56 NOTES TO THE FINANCIAL STATEMENTS Net Pledged Revenue Available for Revenue Bond Debt Service 2015 Gross auxiliary facility and student fee revenues $ 48,161,311 Less auxiliary facility and student fee operating expenses 34,308,206 Net auxiliary and student fee facility revenue 13,853,105 Other pledged tuition and revenue 10% of tuition revenue 7,425,025 Indirect cost recoveries 546,219 Extended campus net revenue 4,900,737 Subtotal other pledged tuition and revenue 12,871,981 Total Net Pledged Revenue $ 26,725,086 Net prior bonds debt service (2005, 2008 bonds) 3,232,306 Series 2011A, 2011B and 2014A 6,699,632 Total Net Debt Service $ 9,931,938 Prior debt service coverage (2005, 2008 bonds) 6.58x 2011A, 2011B and 2014A bond debt service coverage 3.51x Total net debt service as a percentage of gross auxiliary facilities and student fee revenues 20.6% Total net debt service as a percentage of total net pledged revenues 37.2% Refunding Revenue Bond Activity On June 3, 2015, the University issued at par $21,510,000 Series 2015A Institutional Enterprise Revenue Refunding Bonds for the purpose of currently refunding $21,335,000 of the outstanding Series 2005 Auxiliary Revenue Refunding and Improvement bonds. The Series 2015A bonds bear fixed interest rates of 4.00% to 5.00%, payable semiannually. Principal maturities begin June 1, 2036, and continue through June 1, The current refunding resulted in a decrease in payments to service the new debt versus the old debt of $3,453,708, an economic gain of $2,248,062, and a deferred amount on refunding of $938,023. The deferred amount on refunding is being amortized as a deferred inflow of resources over the remaining life of the new debt. The proceeds of $21,355,742 from the 2015A issue were deposited to the Series 2005 Escrow Account and the Series 2005 bonds were called in June 2015, pursuant to the terms and provisions of the escrow agreement by and between the Board of Trustees of UNC and U.S. Bank National Association, as escrow agent. On July 1, 2011, the University issued at par $21,130,000 Series 2011B Variable Rate Demand Institutional Enterprise Revenue Refunding Bonds for the purpose of currently refunding $22,975,000 of the outstanding Series 2001A Colorado Educational and Cultural Facilities Authority, Student Housing LLC I, Revenue Bonds (Arlington Park). Principal maturities began June 1, 2013, and continue through June 1, On July 1, 2014, the University entered into an agreement with Wells Fargo Bank, National Association, to continue holding 100% of the Series 2011B Bonds for another term of three years, ending June 30, The agreement was for the $19,960,000 of principal that remained outstanding at June 30, The schedule of principal maturities remained the same and will continue through June 1, The interest rate on the Series 2011B variable rate demand bonds is calculated monthly based on 70% of the one month London Interbank Offered Rate (LIBOR) that is published two business days prior to the reset date plus a spread factor of This spread factor is subject to the maintenance of the current ratings 50
57 NOTES TO THE FINANCIAL STATEMENTS assigned by Moody s and Standard & Poor s to the long-term, unenhanced Parity Bonds of the Board. In the event of a change in this credit rating, the applicable spread shall increase by the table set forth in the Article I Section 1.01(c)(a) of the First Supplement and Amendment to the Second Supplemental Resolution. The interest rate on the Series 2011B as of June 30, 2015, was 0.823%. The 2011B bond issue documents utilize a projected annual interest rate of 3.5%. Revenue Bond Detail Original Issuance Outstanding Balance 2015 Fixed Rate Revenue Bonds Series 2005 $ 24,215,000 $ %-5.00%, Auxiliary Revenue Refunding and Improvement Bonds, issued July 28, 2005, in the original amount of $85,000,000, and maturing in varying amounts through June 1, On April 2, 2014 $52,735,000 was advanced refunded using proceeds from the 2014A issue. The Series 2005 bonds maturing on June 1, 2014, 2015 and remain unrefunded and outstanding in the aggregate principal amount of $24,215,000 at the time of refunding. These bonds were refunded in June 2015, with the proceeds from the Series 2015A issue. Series ,145,000 4,730, %-5.00%, Auxiliary Revenue Refunding Bonds, issued May 22, 2008, in the original amount of $9,145,000, and maturing in varying amounts through June 1, Series 2011A 41,690,000 36,425, %-5.00% Auxiliary Facilities System Revenue Refunding Bonds issued July 1, 2011, in the original amount of $41,690,000 and maturing in varying amounts through June 1, Series 2014A 52,465,000 51,625,000 2%-5% Institutional Enterprise Revenue Refunding Bonds, issued April 2, 2014, in the original amount of $52,465,000 and maturing in varying amounts through June 1, Proceeds from the sale of these bonds were used to advance refund a portion of the Auxiliary Facilities System Revenue Refunding and Improvement Bonds, Series Series 2015A 21,510,000 21,510,000 4%-5% Institutional Enterprise Revenue Refunding Bonds, issued June 3, 2015, in the original amount of $21,510,000 and maturing in varying amounts from June 1, 2036 to June 1, Proceeds from the sale of these bonds were used to refund the unrefunded portion of the Auxiliary Facilities System Revenue Refunding and Improvement Bonds, Series Total Fixed Rate Revenue Bonds $ 149,025,000 $ 114,290,000 Add unamortized premium 6,679,974 Less unamortized discount - Total Outstanding Fixed Rate Revenue Bonds Payable $ 149,025,000 $ 120,969,974 Variable Rate Revenue Bonds Series 2011B $ 21,130,000 $ 19,345,000 Variable Rate Demand Institutional Enterprise Revenue Refunding Bonds. Issued July 1, 2011, in the original amount of $21,130,000 and maturing June 1, These bonds are held by Wells Fargo NA and the demand begins July 1, These bonds refunded all of the outstanding Colorado Educational and Cultural Facilities Authority, Student Housing LLC Revenue Bonds (Arlington Park) Add unamortized premium - Less unamortized discount - Total Outstanding Variable Rate Revenue Bonds $ 21,130,000 $ 19,345,000 Total bonds before premium, discount and deferred amounts $ 170,155,000 $ 133,635,000 Add total unamortized premium 6,679,974 Less unamortized discount - Total Outstanding Revenue Bonds Payable $ 170,155,000 $ 140,314,974 51
58 NOTES TO THE FINANCIAL STATEMENTS Debt Service Requirements on Revenue Bonds The future minimum revenue bonds debt service requirements as of June 30, are reported in the tables below: Fixed Rate Bonds Debt Service Requirements Year Ending June 30 Principal Interest 2016 $ 3,380,000 $ 5,115, ,515,000 4,988, ,650,000 4,849, ,810,000 4,694, ,965,000 4,531, ,655,000 19,839, ,675,000 13,820, ,130,000 7,355, ,510,000 2,807,850 Total $ 114,290,000 $ 68,002,287 Variable Rate Bonds Debt Service Requirements Year Ending June 30 Principal Interest 2016 $ 640,000 $ 159, , , , , , , , , ,070, , ,835, , ,740, , ,270,000 10,449 Total $ 19,345,000 $ 1,949,542 The University calculates the interest for the 2011B variable rate bonds using a rate of 0.823% in effect on June 30, 2015, the financial statement date. The stated interest rate is 3.5%. Combined Fixed and Variable Rate Bond Debt Service Requirements Year Ending June 30 Principal Interest Total 2016 $ 4,020,000 $ 5,274,363 $ 9,294, ,175,000 5,142,180 9,317, ,335,000 4,998,261 9,333, ,520,000 4,837,476 9,357, ,700,000 4,668,484 9,368, ,725,000 20,429,074 47,154, ,510,000 14,231,189 47,741, ,870,000 7,552,503 36,422, ,780,000 2,818,299 25,598,299 Total $ 133,635,000 $ 69,951,829 $ 203,586,829 52
59 NOTES TO THE FINANCIAL STATEMENTS Capital Lease Obligations Assets under capital leases at June 30, 2015, include equipment totaling $3,489,565. These agreements provide that any obligations payable after the current fiscal year are contingent upon funds for that purpose being available. The University debt service payments, including interest, required for these capital leases payable as of June 30, are detailed below: Capital Lease Minimum Payments Fiscal Years Ending June 30, Lease Payments 2016 $ 1,669, ,485, ,477 Total minimum lease payments 3,553,446 Less amount representing interest (63,881) Amount representing principal for future minimum lease payments $ 3,489,565 Note 9: Operating Leases The University leases property and equipment under operating leases expiring in various years through Rental expense under these agreements for the year ended June 30, 2015, was $1,172,251. The University s future minimum lease payments under non-cancelable operating leases as of June 30, are detailed below: Fiscal Years Ending June 30, Lease Payments 2016 $ 1,219, , , , , ,952 $ 4,090,477 53
60 NOTES TO THE FINANCIAL STATEMENTS Note 10: Defined Benefit Pension Plan Summary of Significant Accounting Policies University of Northern Colorado participates in the State Division Trust Fund (SDTF), a cost-sharing multiple-employer defined benefit pension fund administered by the Public Employees Retirement Association of Colorado (PERA). The net pension liability, deferred outflows of resources and deferred inflows of resources related to pensions, pension expense, information about the fiduciary net position and additions to/deductions from the fiduciary net position of the SDTF have been determined using the economic resources measurement focus and the accrual basis of accounting. For this purpose, benefit payments (including refunds of employee contributions) are recognized when due and payable in accordance with the benefit terms. Investments are reported at fair value. General Information about the Pension Plan Plan description Eligible employees of the University of Northern Colorado are provided with pensions through the State Division Trust Fund (SDTF) a cost-sharing multiple-employer defined benefit pension plan administered by PERA. Plan benefits are specified in Title 24, Article 51 of the Colorado Revised Statutes (C.R.S.), administrative rules set forth at 8 C.C.R , and applicable provisions of the federal Internal Revenue Code. Colorado State law provisions may be amended from time to time by the Colorado General Assembly. PERA issues a publicly available comprehensive annual financial report that can be obtained at Benefits provided PERA provides retirement, disability, and survivor benefits. Retirement benefits are determined by the amount of service credit earned and/or purchased, highest average salary, the benefit structure(s) under which the member retires, the benefit option selected at retirement, and age at retirement. Retirement eligibility is specified in tables set forth at C.R.S , 604, 1713, and The lifetime retirement benefit for all eligible retiring employees under the PERA Benefit Structure is the greater of the: Highest average salary multiplied by 2.5 percent and then multiplied by years of service credit The value of the retiring employee s member contribution account plus a 100 percent match on eligible amounts as of the retirement date. This amount is then annuitized into a monthly benefit based on life expectancy and other actuarial factors. In all cases, the service retirement benefit is limited to 100 percent of highest average salary and also cannot exceed the maximum benefit allowed by federal Internal Revenue Code. Members may elect to withdraw their member contribution accounts upon termination of employment with all PERA employers, waiving rights to any lifetime retirement benefits earned. If eligible, the member may receive a match of either 50 percent or 100 percent on eligible amounts, depending on when contributions were remitted to PERA, the date employment was terminated, whether five years of service credit has been obtained, and the benefit structure under which contributions were made. Benefit recipients who elect to receive a lifetime retirement benefit are generally eligible to receive postretirement cost-of-living adjustments (COLAs), referred to as annual increases in the C.R.S. Benefit recipients under the PERA benefit structure who began eligible employment before January 1, 2007, receive an annual increase of 2 percent, unless PERA has a negative investment year, in which case the annual 54
61 NOTES TO THE FINANCIAL STATEMENTS increase for the next three years is the lesser of 2 percent or the average of the Consumer Price Index for Urban Wage Earners and Clerical Workers (CPI-W) for the prior calendar year. Benefit recipients under the PERA benefit structure who began eligible employment after January 1, 2007, receive an annual increase of the lesser of 2 percent or the average CPI-W for the prior calendar year, not to exceed 10 percent of PERA s Annual Increase Reserve for the SDTF. Disability benefits are available for eligible employees once they reach five years of earned service credit and are determined to meet the definition of disability. State Troopers whose disability is caused by an onthe-job injury are immediately eligible to apply for disability benefits and do not have to meet the five years of service credit requirement. The disability benefit amount is based on the retirement benefit formula shown above considering a minimum 20 years of service credit, if deemed disabled. Survivor benefits are determined by several factors, which include the amount of earned service credit, highest average salary of the deceased, the benefit structure(s) under which service credit was obtained, and the qualified survivor(s) who will receive the benefits. Funding Policy Contributions Eligible employees and the University of Northern Colorado are required to contribute to the SDTF at a rate set by Colorado statute. The contribution requirements are established under C.R.S , et seq. Eligible employees with the exception of State Troopers are required to contribute 8 percent of their PERA-includable salary. The employer contribution requirements for all employees except State Troopers are summarized in the table below: Fiscal Year 2013 Fiscal Year 2014 Fiscal Year 2015 CY12 CY13 CY14 CY to to to to to to Employer Contribution Rate 10.15% 10.15% 10.15% 10.15% 10.15% 10.15% Amount of Employer Contribution Apportioned to the Heath Care Trust Fund as specified in C.R.S. Section (1)(f) -1.02% -1.02% -1.02% -1.02% -1.02% -1.02% Amount Apportioned to the SDTF 9.13% 9.13% 9.13% 9.13% 9.13% 9.13% Amortization Equalization Disbursement (AED) as specified in C.R.S. Section % 3.40% 3.40% 3.80% 3.80% 4.20% Supplemental Amortization Equalization Disbursement (SAED) as specified in C.R.S., Section % 3.00% 3.00% 3.50% 3.50% 4.00% Total Employer Contribution Rate to the SDTF 14.63% 15.53% 15.53% 16.43% 16.43% 17.33% 1 Rates are expressed as a percentage of salary as defined in C.R.S (42). Employer contributions are recognized by the SDTF in the period in which the compensation becomes payable to the member and the University of Northern Colorado is statutorily committed to pay the contributions to the SDTF. Employer contributions recognized by the SDTF from the University of Northern Colorado were $5,990,532 for the year ended June 30,
62 NOTES TO THE FINANCIAL STATEMENTS Pension Liabilities, Pension Expense, and Deferred Outflows of Resources and Deferred Inflows of Resources Related to Pensions At June 30, 2015, the University of Northern Colorado reported a liability of $124,356,394 for its proportionate share of the net pension liability. The net pension liability was measured as of December 31, 2014, and the total pension liability used to calculate the net pension liability was determined by an actuarial valuation as of December 31, Standard update procedures were used to roll forward the total pension liability to December 31, The University of Northern Colorado s proportion of the net pension liability was based on its contributions to the SDTF for the calendar year 2014 relative to the total contributions of participating employers to the SDTF. At December 31, 2014, the University of Northern Colorado proportion was percent, which was a decrease of from its proportion measured as of December 31, For the year ended June 30, 2015, the University of Northern Colorado recognized pension expense of $9,002,615. The University of Northern Colorado reported deferred outflows of resources and deferred inflows of resources related to pensions from the following sources: Deferred Deferred Outflows of Inflows of Resources Resources Difference between expected and actual experience $9,214 Net difference between projected and actual earnings on pension plan investments $2,535,643 Changes in proportion and differences between contributions recognized and proportionate share of contributions Contributions subsequent to the measurement date $3,035,069 $1,702,134 Total $5,570,712 $1,711,348 An amount of $3,035,069 reported as deferred outflows of resources related to pensions, resulting from contributions subsequent to the measurement date, will be recognized as a reduction of the net pension liability in the year ended June 30, Other amounts reported as deferred outflows of resources and deferred inflows of resources related to pensions will be recognized in pension expense as follows: Year ended June 30: 2016 (281,239) 2017 (162,288) , , Thereafter - 56
63 NOTES TO THE FINANCIAL STATEMENTS Actuarial assumptions The total pension liability in the December 31, 2013, actuarial valuation was determined using the following actuarial assumptions and other inputs: Price inflation 2.80% Real wage growth 1.10% Wage inflation 3.90% Salary increases, including wage inflation % Long-term investment Rate of Return, net of pension plan investment expenses, including 7.50% price inflation Future post-retirement benefit increases: PERA Benefit Structure hired prior to 1/1/07; and DPS Benefit Structure (automatic) 2.00% PERA Benefit Structure hired after 12/31/06 (ad hoc, substantively automatic) Financed by the Annual Increase Reserve Mortality rates were based on the RP-2000 Combined Mortality Table for Males or Females, as appropriate, with adjustments for mortality improvements based on a projection of Scale AA to 2020 with Males set back 1 year, and Females set back 2 years. The actuarial assumptions used in the December 31, 2013, valuation were based on the results of an actuarial experience study for the period January 1, 2008, through December 31, 2011, adopted by PERA s Board on November 13, 2012, and an economic assumption study, adopted by PERA s Board on November 15, 2013, and January 17, The SDTF s long-term expected rate of return on pension plan investments was determined using a lognormal distribution analysis in which best estimate ranges of expected future real rates of return (expected return, net of investment expense and inflation) were developed for each major asset class. These ranges were combined to produce the long-term expected rate of return by weighting the expected future real rates of return by the target asset allocation percentage and then adding expected inflation. As of the most recent analysis of the long-term expected rate of return, presented to the PERA Board on November 15, 2013, the target allocation and best estimates of geometric real rates of return for each major asset class are summarized in the following table: Asset Class Target Allocation 10 Year Expected Geometric Real Rate of Return U.S. Equity Large Cap 26.76% 5.00% U.S. Equity Small Cap 4.40% 5.19% Non U.S. Equity Developed 22.06% 5.29% Non U.S. Equity Emerging 6.24% 6.76% Core Fixed Income 24.05% 0.98% High Yield 1.53% 2.64% Long Duration Gov t/credit 0.53% 1.57% Emerging Market Bonds 0.43% 3.04% Real Estate 7.00% 5.09% Private Equity 7.00% 7.15% Total % * In setting the long-term expected rate of return, projections employed to model future returns provide a range of expected longterm returns that, including expected inflation, ultimately support a long-term expected rate of return assumption of 7.50%. 57
64 NOTES TO THE FINANCIAL STATEMENTS Discount rate The discount rate used to measure the total pension liability was 7.50 percent. The projection of cash flows used to determine the discount rate assumed that employee contributions will be made at the current contribution rate and that employer contributions will be made at rates equal to the fixed statutory rates specified in law, including current and future AED and SAED, until the Actuarial Value Funding Ratio reaches 103 percent, at which point, the AED and SAED will each drop 0.50 percent every year until they are zero. Based on those assumptions, the SDTF s fiduciary net position was projected to be available to make all projected future benefit payments of current members. Therefore, the long-term expected rate of return on pension plan investments was applied to all periods of projected benefit payments to determine the total pension liability. The discount rate determination does not use the Municipal Bond Index Rate. There was no change in the discount rate from the prior measurement date. Sensitivity of the University of Northern Colorado s proportionate share of the net pension liability to changes in the discount rate The following presents the proportionate share of the net pension liability calculated using the discount rate of 7.50 percent, as well as what the proportionate share of the net pension liability would be if it were calculated using a discount rate that is 1-percentage-point lower (6.50 percent) or 1-percentage-point higher (8.50 percent) than the current rate: 1% Decrease Current Discount 1% Increase (6.50%) Rate (7.50%) (8.50%) Proportionate share of the net pension liability $159,454,973 $124,356,394 $94,833,795 Pension plan fiduciary net position Detailed information about the SDTF s fiduciary net position is available in PERA s comprehensive annual financial report which can be obtained at Payables to the pension plan University of Northern Colorado did not report payables to the STDF at June 30, Note 11: Other PERA Retirement Plans Defined Contribution Retirement Plan (DC Plan) Plan Description Employees of the State of Colorado that were hired on or after January 1, 2006, and employees of certain community colleges that were hired on or after January 1, 2008, which were eligible to participate in the SDTF, a cost-sharing multiple-employer defined benefit pension plan, have the option to participate in the SDTF or the Defined Contribution Retirement Plan (PERA DC Plan). The PERA DC Plan is an Internal Revenue Code Section 401(a) governmental profit-sharing defined contribution plan. Title 24, Article 51, Part 15 of the C.R.S., as amended, assigns the authority to establish Plan provisions to the PERA Board of Trustees. The DC Plan is also included in PERA s comprehensive annual financial report as referred to above. Funding Policy All participating employees in the PERA DC Plan, with the exception of State Troopers, are required to contribute 8.00 percent of their PERA-includable salary and the State of Colorado is required to contribute percent of PERA-includable salary on behalf of these employees. All participating State Troopers are required to contribute percent of their PERA-includable salary and the State of Colorado is required 58
65 NOTES TO THE FINANCIAL STATEMENTS to contribute percent of PERA-includable salary on behalf of these employees. Additionally, the State of Colorado is required to contribute AED and SAED to the SDTF as follows: Fiscal Year 2013 Fiscal Year 2014 Fiscal Year 2015 CY12 CY13 CY14 CY to to to to to to Amortization Equalization Disbursement (AED) as specified in C.R.S. Section % 3.40% 3.40% 3.80% 3.80% 4.20% Supplemental Amortization Equalization Disbursement (SAED) as specified in C.R.S., Section % 3.00% 3.00% 3.50% 3.50% 4.00% Total Employer Contribution Rate to the SDTF 5.50% 6.40% 6.40% 7.30% 7.30% 8.20% 1 Rates are expressed as a percentage of salary as defined in C.R.S (42). Contribution requirements are established under Title 24, Article 51, Section 1505 of the C.R.S., as amended. Participating employees of the PERA DC Plan are immediately vested in their own contributions and investment earnings and are immediately 50 percent vested in the amount of employer contributions made on their behalf. For each full year of participation, vesting of employer contributions increases by 10 percent. Forfeitures are used to pay expenses of the PERA DC Plan in accordance with PERA Rule as adopted by the PERA Board of Trustees in accordance with Title 24, Article 51, Section 204 of the C.R.S. As a result, forfeitures do not reduce pension expense. 401(k) Defined Contribution Plan (Voluntary Investment Program) Plan Description Employees of the University of Northern Colorado that are also members of the SDTF may voluntarily contribute to the Voluntary Investment Program, an Internal Revenue Code Section 401(k) defined contribution plan administered by PERA. Title 24, Article 51, Part 14 of the C.R.S., as amended, assigns the authority to establish the Plan provisions to the PERA Board of Trustees. PERA issues a publicly available comprehensive annual financial report for the Program. That report can be obtained at Funding Policy The Voluntary Investment Program is funded by voluntary member contributions up to the maximum limits set by the Internal Revenue Service, as established under Title 24, Article 51, Section 1402 of the C.R.S., as amended. 457 Deferred Compensation Plan The PERA Deferred Compensation Plan (457) was established July 1, 2009, as a continuation of the State s deferred compensation plan which was established for state and local government employees in At July 1, 2009, the State s administrative functions for the 457 plan were transferred to PERA, where all costs of administration and funding are borne by the plan participants. In calendar year 2014, participants were allowed to make contributions of up to 100 percent of their annual gross salary (reduced by their 8 percent PERA contribution) to a maximum of $17,500. Participants who are age 50 and older, and contributing the maximum amount allowable, were allowed to make an additional $5,500 contribution in 2014, for total contributions of $23,000. Contributions and earnings are tax deferred. At December 31, 2014, the plan had 17,738 participants. 59
66 NOTES TO THE FINANCIAL STATEMENTS Note 12: University Retirement Plans On March 1, 1993, the Board of Trustees adopted an Optional Retirement Plan (ORP) for faculty and exempt-administrative staff. On the date of adoption, eligible University employees were offered the choice of remaining in PERA or participating in the ORP. New faculty and administrative staff members are required to enroll in the ORP unless they have one year or more of service credit with PERA at the date of hire. The ORP is a defined contribution plan with three vendors: MetLife, TIAA-CREF, and VALIC. These vendors provide a range of investment accounts for participants. For fiscal year 2015, the employee contributed 8% and the University contributed 11.5%. The University s contribution to the ORP for the year ending June 30, 2015, was $6,072,174. All contributions are immediately invested in the employee s account. Normal retirement age for the ORP is 65. Benefits available to the employee at retirement are not guaranteed and are determined by contributions and the decisions made by participants for their individual investment accounts. The University provides a 403(b) deferred compensation plan to the University President. The Board of Trustees approved a contribution of $54,500 for fiscal year The contribution to be paid in fiscal year 2016 is expected to be $54,500. Note 13: Post-Retirement Healthcare and Life Insurance Benefits Health Care Trust Fund Plan Description The University of Northern Colorado contributes to the Health Care Trust Fund (HCTF), a cost-sharing multiple-employer healthcare trust administered by PERA. The HCTF benefit provides a health care premium subsidy and health care programs (known as PERACare) to PERA participating benefit recipients and their eligible beneficiaries. Title 24, Article 51, Part 12 of the C.R.S., as amended, establishes the HCTF and sets forth a framework that grants authority to the PERA Board to contract, self-insure, and authorize disbursements necessary in order to carry out the purposes of the PERACare program, including the administration of health care subsidies. PERA issues a publicly available comprehensive annual financial report that includes financial statements and required supplementary information for the HCTF. That report can be obtained at Funding Policy The University of Northern Colorado is required to contribute at a rate of 1.02 percent of PERA-includable salary for all PERA members as set by statute. No member contributions are required. The contribution requirements for the University are established under Title 24, Article 51, Part 4 of the C.R.S., as amended. The apportionment of the contributions to the HCTF is established under Title 24, Article 51, Section 208(1)(f) of the C.R.S., as amended. For the years ending June 30, 2015, 2014, and 2013, the University contributions to the HCTF were $389,910, $378,357, and $351,143 respectively, equal to the required contributions for each year. Colorado Higher Education Insurance Benefits Alliance (CHEIBA) Retired faculty and exempt-administrative staff are eligible to participate in the Colorado Higher Education Insurance Benefits Alliance Trust (CHEIBA). CHEIBA is a cost-sharing, multiple-employer insurance purchasing pool which allows for post-employment health coverage until the retiree is eligible for Medicare. 60
67 NOTES TO THE FINANCIAL STATEMENTS CHEIBA Trust members include Adams State University, Auraria Higher Education Center, Colorado School of Mines, Colorado State University- Pueblo, Colorado State University System and Colorado State University-Global Campus, Fort Lewis College, Metropolitan State University of Denver, University of Northern Colorado, and Western State Colorado University. As of June 30, 2015, there were no remaining participants utilizing post-retirement coverage from the trust membership because the plan was phased out during fiscal year CHEIBA financial statements are prepared under accounting principles generally accepted in the United States using the accrual basis of accounting, following governmental accounting standards for a business type activity. The financial statements can be obtained by contacting the University s Human Resource Services Department at Contributions are recognized in the period due. Benefits and refunds are recognized and paid when due according to the participating plans. The fair value of CHEIBA s investments is based on quoted market prices from national securities exchanges. There are no long-term contracts for contributions to the plan. Participating schools can withdraw their position in the plan with at least one year s notice to the CHEIBA board. Note 14: Deferred Outflows and Inflows of Resources In addition to assets and liabilities, the Statement of Net Position contains separate sections for deferred outflows of resources and deferred inflows of resources. These separate financial statement elements represent the consumption or availability of net position that applies to future periods; therefore, it will not be recognized as an outflow or inflow until that time. Deferred outflows, when amortized over the allowable period, increase expense while deferred inflows decrease expense. Deferred inflows and outflows result from deferred amounts on refunding bonds and transactions related to the University of Northern Colorado share of the Colorado Public Employee s Retirement Association (PERA) net pension liability. Additional information on the University s debt portfolio can be found in Note 8: Bonds, Capital Leases and Notes Payable. Additional information related to the PERA pension plan and related net pension liability can be found in Note 10: Defined Benefit Pension Plan. The deferred amounts resulting from refunding bond issues result from the difference in the carrying value of the refunded debt and its reacquisition price. These amounts are deferred and amortized life of the refunding debt. The following schedules outline the deferred outflows and deferred inflows of resources related to University of Northern Colorado s debt refunding activity: 61
68 NOTES TO THE FINANCIAL STATEMENTS 2015 Deferred Amounts on Debt Refundings Issue Year of Maturity Description Original Deferred Amount on Refunding Original Amortization Period in Years Remaining Amortization Period in Years Deferred Amount Remaining at June 30 Current Fiscal Year Amortization Expense Deferred Outflows of Resources Series Refunding of Series 1998 $ 213, $ 119,250 $ 13,250 Series 2011A 2031 Refunding Series 1997 and ,795, ,321, ,448 Series 2011B 2036 Refunding of Arlington Park Bonds 1,303, ,086,166 54,309 Series 2014A 2035 Advance refunding of a portion of Series , ,977 37,756 Total Deferred Outflows of Resources $ 4,111,448 $ 3,279,368 $ 223,763 Deferred Inflows of Resources Series 2015A 2040 Refunding of the remaining balance of Series 2005 (938,023) (934,896) (3,127) Total Deferred Inflows of Resources $ (938,023) $ (934,896) $ (3,127) Total Expense on Statement of Revenues, Expenses and Changes in Net Position $ 220,636 The deferred outflows and deferred inflows of resources that are related to the PERA net pension liability result from circumstances that affect the net pension liability such as: Changes in benefit terms Changes in economics and demographic assumptions Differences between economic and demographic assumptions and actual experience Differences between expected and actual investment returns Deferred outflows and deferred inflows of resources can also result from changes in University of Northern Colorado s proportionate share of the net pension liability, which is based on University of Northern Colorado s contributions as a percentage of total employer contributions during the measurement period of the plan. Deferred inflows of resources or deferred outflows of resources are amortized to expense over a five-year period or the average remaining service period of plan members. The PERA net pension liability has a measurement date of December 31 annually. Each year the contributions that University of Northern Colorado makes after the plan measurement date from January 1 to June 30, will be recorded as a deferred outflow of resources and will be recognized as a reduction of the net pension liability in the following fiscal year. The following is a summary of the deferred outflows and deferred inflows of resources related to University of Northern Colorado s proportionate share of the PERA net pension liability: 2015 Deferred Amounts Related to Net Pension Liability Description Original Deferred Amount on Refunding Original Amortization Period in Years Remaining Amortization Period in Years Deferred Amount Remaining at June 30 Current Fiscal Year Amortization Expense Deferred Outflows of Resources Pension investment results $ 3,169, $ 2,535,643 $ 633,911 Pension contributions after measurement date* 3,035,069 - Total Deferred Outflows of Resources $ 3,169,553 $ 5,570,712 $ 633,911 Deferred Inflows of Resources Pension experience results (14,132) (9,214) (4,918) Pension changes in proportionate share (2,612,366) (1,702,134) (910,232) Total Deferred Inflows of Resources $ (2,626,498) $ (1,711,348) $ (915,150) * Total Expense on Statement of Revenues, Expenses and Changes in Net Position $ (281,239) Deferred Outflows of Resources originating from pension contributions made after the measurement date (January 1, 2015 to June 30, 2015) will be recognized as a reduction to net pension liability in the following year. Each year the contributions from January 1 to June 30 will be recorded as a Deferred Outflow of Resources. 62
69 NOTES TO THE FINANCIAL STATEMENTS Note 15: Operating Expenses by Function Compared with Operating Expenses by Natural Classification Wages and Benefits Cost of Sales Other Current Expenses For the Year Ended June 30, 2015 Scholarships Utilities Travel Depreciation Total Instruction $ 70,881,415 $ 121,466 $ 5,922,502 $ - $ - $ 1,353,652 $ - $ 78,279,035 Research 1,674, , ,726-2,583,079 Public Service 1,097, , ,964-2,263 34,111-1,743,671 Academic Support 14,624,575 42,764 6,112, ,676-20,974,001 Student Services 17,811,848 93,239 6,575, ,228 2,487,712-27,257,539 Institutional Support 8,661,876-4,712, ,328-13,574,402 Operation of Plant 6,161, ,050,650-2,815,125 4,793-10,032,241 Scholarships ,494, ,494,877 Auxiliary 16,586,834 4,638,138 2,914,250-3,046,653 23,870-27,209,745 Depreciation ,069,138 17,069,138 Total Expenses $ 137,499,997 $ 5,044,030 $ 28,235,484 $ 12,494,877 $ 6,153,334 $ 4,720,868 $ 17,069,138 $ 211,217,728 Summary of Wages and Benefits Wages and Benefits For the Year Ended June 30, 2015 Faculty $ 43,865, % Administrative 26,756, % Graduate and Teaching Assistants 9,842, % Classified 19,718, % Student 6,312, % Other 923, % Subtotal Wages 107,419, % Fringe Benefits 27,084, % Fringe Benefits (GASB 68) 2,996, % Total Wages and Benefits $ 137,499, % Note 16: Legislative Appropriations Appropriated Funds The Colorado State Legislature establishes spending authority to the University in its annual Long Appropriations Bill. The Long Bill appropriated funds include an amount from the State of Colorado s College Opportunity Fund. In prior years, the annual appropriations bill included certain cash revenues from the student share of tuition and fees. For the year ended June 30, 2015, appropriated expenditures were within the authorized spending authority. For the year ended June 30, 2015, the University had a total appropriation of $37,357,
70 NOTES TO THE FINANCIAL STATEMENTS For the year ended June 30, 2015, the University s appropriated funds consisted of $15,440,878 received from students who qualified for stipends from the College Opportunity Fund and $21,916,149 as Fee-for- Service contract revenue. All other revenues and expenses reported by the University represent nonappropriated funds and are excluded from the annual appropriations bill. Non-appropriated funds include tuition and fees, grants and contracts, gifts, indirect cost recoveries, auxiliary revenues, and other revenue sources. Capital Construction State Appropriations Capital construction state appropriations are recognized only to the extent of current expenditures of $616,702. At June 30, 2015, there were $1,334,783 of unexpended capital construction state appropriations. State appropriations for capital construction include University cash funded projects and controlled maintenance. University Cash Funded Appropriated Projects During the 2009 regular session of the Colorado General Assembly, Senate Bill was passed. This bill changed the statutes that affected higher education capital construction. It provided greater flexibility and changed the way higher education capital construction is approved and recorded for state budgeting. During the transition in implementing this bill, it was determined that projects previously appropriated under the prior statutory rules would continue to follow those rules and would continue to be recorded on the state s budget as appropriated cash projects. The University did not have cash-funded projects in fiscal year Controlled Maintenance The University incurs approved expenditures for various controlled maintenance projects. At July 1, 2015, the University began two projects: fire sprinkler upgrades and roof replacements, which were classified as controlled maintenance. At June 30, 2015, $616,702 was expended on these projects and $1,334,783 remained unexpended. Note 17: Commitments and Contingencies Government Grants The University is currently participating in numerous grants from various departments and agencies of the federal and state governments. The expenditures of grant proceeds must be for allowable and eligible purposes. Single audits and audits by the granting department or agency may result in requests for reimbursement of unused grant proceeds or disallowed expenditures. Upon notification of final approval by the granting department or agency, the grants are considered closed. Collateral for State Treasury Certificates of Participation On November 6, 2008, the State Treasury entered into a lease purchase agreement under which a trustee issued $230,845,000 of State of Colorado Higher Education Capital Construction Lease Purchase Financing Program Certificates of Participation, Series The University s Butler-Hancock interior renovation project was funded with $11,591,235 from the lease purchase agreement as a state appropriation and Parsons Hall was provided as collateral. 64
71 NOTES TO THE FINANCIAL STATEMENTS Note 18: Risk Management The University is subject to risks of loss from liability for accident, property damage, and personal injury. To mitigate these risks the University has purchased the following insurance: General liability covered by Philadelphia for $3,000,000 with no deductible. Professional liability covered by Philadelphia for $3,000,000 with a $25,000 deductible. Automobile liability covered by Philadelphia for $1,000,000 with no deductible. Errors and omissions covered by RSUI Group, Inc. for $3,000,000 with a $25,000 deductible. Employment practices liability covered by RSUI Group, Inc. for $3,000,000 with a $25,000 deductible. Workers compensation covered by Pinnacol Assurance for $500,000/$500,000/$500,000 with a $1,000 deductible. Umbrella liability covered by Philadelphia for $2,000,000 with a self-insured retention of $10,000. Fidelity (employee dishonesty) covered by Philadelphia for $1,000,000 with a $5,000 deductible. Other property covered by Midwestern Higher Education Compact for $500,000,000 with a $25,000 deductible. The University became fully insured through several insurance companies in 2006 and is covered by insurance for everything above its reserve and deductible. The coverage in fiscal year 2015 is consistent with previous years and there have been no significant reductions in coverage. There have been no settlements exceeding coverage. The University uses a fringe benefit and risk management fund to pay expenses related to workers compensation and other liability insurance. The University s liability on June 30, 2015, was $56,093, which represents deductibles based on an analysis of claims. Note 19: Other Disclosures Multi-Year Employment Contracts During 2015, the University maintained four multi-year employment contracts for athletic coaches. The intent of the multi-year terms (four years) is to allow the coaches sufficient time to recruit and build successful athletic teams. These contracts are subject to termination for just cause and funds availability. Note 20: Subsequent Events Perkins Loan Program The University participates in the Federal Perkins Loan Program, under which loans are provided to eligible students and repayments are made directly to the University to provide funding for future eligible participants in the program. Effective October 1, 2015, the Department of Education has stipulated that new loans may not be disbursed under the program (some exceptions and a 2 year continuation was provided in Federal 2016 omnibus spending bill, passed on by Congress on December 18, 2015). Pursuant to GASB accounting standards, the University has recorded previous contributions from the Federal Government for this program as revenue (and related restricted net position) in the period that the funds were received. The closure of this program, while not certain or determinable at this point, could result in the University recording an obligation to refund previous federal contributions received under this program to the Department of Education. 65
72 NOTES TO THE FINANCIAL STATEMENTS University of Northern Colorado has $2.3 million in cash, $0.6 million in current accounts receivable, $5.4 million in non-current accounts receivable, and a restricted net position of $8.3 million in the Perkins Loan funds at June 30, Capital Leases On July 31, 2015, the University paid off its capital lease obligation to Clayton Holdings LLC in the amount of $602, As of June 30, 2015, the University had a current portion of capital lease payable of $325, and a noncurrent portion of $302, related to this lease. This lease financed the athletic scoreboards. Note 21: Restatements The fiscal year 2015 beginning Net Position was restated on the Statement of Net Positon and Statement of Revenues, Expenses, and Changes in Net Positon in compliance with GASB 68: Accounting for Financial Reporting of Pensions. GASB 68 required the University of Northern Colorado to present its proportionate share of the Public Employees Retirement Association of Colorado s (PERA) underfunded net pension liability and associated deferred outflows and inflows of resources in the financial statements. The following chart demonstrates the effect of the restatement on the University of Northern Colorado s net position: Summary of Changes in Net Position (in millions) Net position as of June 30, 2014 $ Restatement of beginning net position from GASB 68 (117.5) Restated beginning net position 45.2 Current year change in net position (13.6) Net position as of June 30, 2015 $ 31.6 Information to restate fiscal year 2014 on a comparative basis was not available; therefore, the University elected to present a single year in the 2015 Annual Financial Report. 66
73 OTHER BUDGET, FINANCIAL AND ENROLLMENT DATA
74 OPERATING BUDGET SUMMARY Budget FY 2015 Budget FY 2016 Change REVENUES Tuition-Resident $ 59,456,589 $ 59,949,926 $ 493,337 Tuition-NonResident 16,723,242 13,677,301 (3,045,941) Tuition-WICHE/WUE NonRes 7,151,015 8,928,038 1,777,023 Student Fees 12,872,700 12,730,265 (142,435) Academic Fees-General Funds 5,431,676 5,614, ,526 Tuition-Extended Campus 13,593,982 16,764,034 3,170,052 Academic Fees-Extended Campus 77,918 84,245 6,327 Room and Board 30,113,215 32,531,988 2,418,773 Subtotal Tuition, Fees and Room & Board 145,420, ,279,999 4,859,662 Scholarships (including Foundation) 1 (19,784,800) (26,479,792) (6,694,992) Graduate GA/TA Waivers (3,785,692) (3,960,692) (175,000) R & B Waivers (1,142,938) (1,142,938) - Subtotal Discounting (24,713,430) (31,583,422) (6,869,992) COF Resident 17,177,543 17,177,543 - Fee For Service 20,179,484 23,915,186 3,735,702 Subtotal State Support 37,357,027 41,092,729 3,735,702 Foundation Restricted Gifts for Operations 4,312,341 3,291,533 (1,020,808) Foundation Capital Gifts - 1,006,500 1,006,500 Foundation Restricted Scholarships 1-4,281,972 4,281,972 Foundation Unrestricted (designated for scholarships) 1,670,000 1,770, ,000 Subtotal Foundation Support 5,982,341 10,350,005 4,367,664 Other Auxiliary Services 7,180,134 7,434, ,664 Restricted Grant Facilities/Admin Recovery 775, ,000 (170,000) Other Revenue 7,296,469 7,042,111 (254,358) Net Non-Operating Revenues 1,686,149 1,284,481 (401,668) Subtotal Other Revenue 16,937,752 16,366,390 (571,362) NET REVENUES 180,984, ,505,701 5,521,674 EXPENSES AND MANDATORY TRANSFERS Faculty Salaries 43,512,603 44,042, ,985 Exempt Salaries 24,929,103 25,479, ,599 Classified Salaries 20,413,321 19,843,276 (570,045) Graduate Stipends 4,584,268 4,614,610 30,342 Other Wages/Compensation 5,614,818 5,979, ,049 Fringe Benefits 26,631,000 27,590, ,000 Subtotal Personnel Expenses 125,685, ,550,043 1,864,930 Cost of Sales 5,231,472 5,399, ,994 Other Current Expenses 9,914,665 9,614,148 (300,517) Purchased Services 9,664,218 9,875, ,992 Supplies 6,812,970 6,553,799 (259,171) Utilities 6,950,809 6,892,642 (58,167) Travel 3,823,873 4,029, ,235 Capital 2,339,436 2,258,361 (81,075) Subtotal Non-personnel Expenses 44,737,443 44,622,734 (114,709) Mandatory Transfer Out-Debt Service 9,400,204 9,296,917 (103,287) Mandatory Transfer Out-Capital Lease 1,741,118 1,669,597 (71,521) Transfer Out - Foundation Capital Projects - 1,006,500 1,006,500 Subtotal Transfers 11,141,322 11,973, ,692 TOTAL EXPENSES AND TRANSFERS 181,563, ,145,791 2,581,913 NET REVENUES LESS EXPENSES AND TRANSFERS $ (579,851) $ 2,359,910 $ 2,939,761 1 Named and endowed scholarships from the UNC Foundation were added to the fiscal year 2016 budget. 68
75 ACTUAL AND PROJECTED NET REVENUES AVAILABLE FOR DEBT SERVICE Actual FY 2013 Actual FY 2014 Actual FY 2015 Projected 7 FY 2016 Projected 7 FY 2017 Operating Revenues Housing and Food Contracts 8 $ 31,757,917 $ 30,851,298 $ 30,566,461 $ 32,531,988 $ 33,182,628 Short Term Room and Board 9 2,502,958 3,041,378 2,678,310 2,740,172 2,794,975 Student Fees 10 5,624,710 5,748,853 7,536,830 8,238,732 8,485,894 Parking Fees 2,144,058 2,056,702 1,989,046 2,181,112 2,224,734 Other Auxiliary Sales and Services 5,636,864 5,577,946 5,268,680 4,642,664 4,688,868 Other Auxiliary Investment Revenues 123, , ,984 90,297 91,200 Gross Revenues 47,790,217 47,381,074 48,161,311 50,424,965 51,468,299 Operating Expenses Cost of Sales 6,362,220 6,128,600 6,463,456 6,497,513 6,596,777 Personal Services 11 11,043,667 11,509,601 12,124,275 13,385,989 13,787,568 Other General Expenses 10,212,130 9,366,716 9,287,786 9,504,343 9,599,386 Utilities 3,030,631 3,411,988 3,307,213 3,726,094 3,912,399 Room and Board Scholarships ,046,338 3,554,790 3,625,886 Travel and Subsistence 32,824 49,507 36,175 52,312 52,835 Capital Outlay, Operations 63,952 94,724 42,963 55,000 55,550 Total Operating Expenses 30,745,424 30,561,136 34,308,206 36,776,041 37,630,401 Net Auxiliary and Student Fee Facility Revenues 17,044,793 16,819,938 13,853,105 13,648,924 13,837,898 10% of Tuition Revenues 1, 12 7,758,977 7,677,096 7,425,025 7,275,455 7,695,789 Other Net Revenues Indirect Cost Recoveries 2 706, , , , ,000 Extended Studies Net Revenues 4,767,861 4,331,399 4,900,737 5,641,896 5,953,706 Other Pledged Tuition and Revenues 13,233,289 12,649,542 12,871,981 13,382,351 14,114,495 Total Net Pledged Revenues 30,278,082 29,469,480 26,725,086 27,031,275 27,952,393 Debt Service Prior Bond Debt Service 3 5,750,756 4,442,856 3,232, , ,744 Subtotal Prior Bond Debt Service 5,750,756 4,442,856 3,232, , ,744 Series 2011A Debt Service 3,083,919 3,088,819 3,092,419 3,085,619 3,092,619 Series 2011B Debt Service 4 1,314,550 1,314,425 1,313,600 1,317,075 1,314,675 Series 2014A Debt Service - 1,218,651 2,293,613 3,863,613 3,861,513 Series 2015A Debt Service , ,400 Subtotal 2011A, 2011B, 2014A and 2015A Bond Debt Service 4,398,469 5,621,895 6,699,632 9,171,649 9,179,207 Total Debt Service $ 10,149,225 $ 10,064,751 $ 9,931,938 $ 9,812,268 $ 9,817,951 Prior Debt Service Coverage ( 2005, 2008 Bonds) x 5.51 x 6.58 x x x 2011A, 2011B, 2014A and 2015A Bond Debt Service Coverage x 4.45 x 3.51 x 2.88 x 2.98 x 1 10% of Tuition includes general fund tuition. Extended studies tuition is included in extended studies net revenues. 2 Indirect cost recoveries are also commonly referred to as grant facilities & administrative costs. 3 Includes the Series 2005 bonds, and Series 2008 bonds for FY Starting in FY 2014 it includes the unrefunded portion of the Series 2005 and the Series 2008 bonds. Starting in FY 2016 prior bond debt service includes only the Series 2008 bonds. 4 The Series 2011B bonds are variable rate bonds and debt service is estimated assuming a 3.5% interest rate. 5 Calculation assumes the prior bond debt service is paid before calculating coverage for the 2011A, 2011B, 2014A and 2015A issues. 6 Room and board scholarships issued by the univeristy have increased and are a substantial expense beginning in FY Prior to FY 2015 these scholarships were immaterial and covered by other university revenue sources. 7 FY 2016 Projected and FY 2017 Projected include the following assumptions: 8 Housing and food contracts revenue is based on a tiered rate structure and occupancy estimates. FY 2016 room and board rates remained essentially the same but an occupancy increase is expected. Room and board rates are assumed to increase by 2% for the FY 2017 projections. 9 Short term room and board is expected to increase by approximately 2.3% in FY It is projected to increase an additional 2% for FY A new capital fee was added in FY Student fees are projected to increase 9.3% for FY 2016 and a 3% increase is projected for FY Personnel for FY 2016 is a combination of a 3% salary increase and changes in staffing. Personnel is expected to increase 3% in FY 2017 as well. 12 Resident undergraduate tuition rates are budgeted to increase 5.8% for FY 2016 and a 5% increase is projected for FY
76 GENERAL FINANCIAL INFORMATION AND OPERATING DATA State Support The State of Colorado provides support to public higher education through two avenues. The College Opportunity Fund provides per-credit-hour stipends to qualified resident undergraduate students to pay a portion of their tuition. The State of Colorado also enters into Fee-for-Service contracts with higher education institutions to support graduate and specialized undergraduate educational services. In fiscal years 2010 and 2011 the State distributed American Recovery and Reinvestment Act funds to higher education. The following table is a five-year history of UNC s state support expressed as a percentage of total operating revenue: College Opportunity Fund Projected Net Revenues for Debt Service State Support as a Percentage of Total Operating Revenue Support Before ARRA State Support w/arra Stimulus Total Operating Revenue Total Support as a % of Total Revenues Fee-For- Fiscal Year Service ARRA Stimulus ,033,165 23,809,625 38,842,790 1,781,300 40,624, ,873,187 23% ,689,892 18,611,714 33,301,606-33,301, ,378,329 18% ,398,973 17,915,857 32,314,830-32,314, ,388,051 18% ,857,591 19,782,469 33,640,060-33,640, ,611,703 18% ,440,878 21,916,149 37,357,027-37,357, ,063,275 20% The following sections of this report provide additional information to supplement the actual, budgeted, and projected net revenues available for debt service included in the table on the previous page. University Housing and Dining Facilities The University provides economical and convenient housing accommodations for more than 3,100 students, including undergraduate, graduate and students with families. All residence halls and apartments are managed by professional staff members who are trained to provide support to students and encourage a successful academic experience at the University. Student Housing Utilitzation Fiscal Year Design Capacity Utilization Rate , % , % , % , % , % 70
77 GENERAL FINANCIAL INFORMATION AND OPERATING DATA Room and board revenues for the fiscal years through are summarized below. Room and Board Rates and Revenues (in dollars) University Fiscal Year Low Room Rate 1 High Room Rate 1 Apartments 19-Meal Plan Total Revenue ,094 2, /month 2,366 29,577, ,385 2, /month 2,490 32,693, ,457 2, /month 2,565 31,757, ,400 3, /month 2,670 30,851, ,400 3, /month 2,780 30,566,461 1 Room rates vary depending upon the room style and amenities. The lowest and highest rates are reflected to provide a range for the semester. Single occupancy in a room carries an additional charge of approximately $250 for a small room and $500 for a large room. Housing and Dining facilities also generate revenue from summer conferences and youth camps as well as other special events. The table below displays the short-term revenues from these events. Short-Term Room and Board Fiscal Year Total Revenue ,933, ,094, ,502, ,041, ,678,310 71
78 GENERAL FINANCIAL INFORMATION AND OPERATING DATA Student Activity Fee The University charges a mandatory student activity fee that is assessed on all credits up to a maximum of ten credits per semester for all students. A portion of the revenue from this mandatory student fee is pledged as part of gross revenues for the operation, maintenance, programming, and debt service associated with the facilities. These facilities consist of the University Center, the Campus Recreation Center, the Sports and Recreation Complex, the Student Health Center, and the Counseling Center. The following table depicts the total student activity fee as well as the pledged portion of the fee. The fee amounts below do not include technology, library, or other fees. Fiscal Year Academic Year Fee Overall Student Fee Budget Total Pledged Student Fees Student Services 1 Debt Service 1 Facility Operations 1 Repair and Renovations ,014,741 5,605,636 1,253,575 2,020,261 1,994, , ,977,513 5,501,705 1,253,576 1,718,330 1,994, , ,010 10,409,928 5,624,710 1,290,272 1,706,491 2,045, , ,047 10,921,070 5,748,853 1,372,291 1,614,110 2,158, ,091 1 Component of Total Pledged Student Fees Student Activity Fees (in dollars) 2 Repair and renovation budgets were suspended for FY due to an enrollment dip In fiscal year 2015, the University created a new capital fee by combining the capital portion of the existing student fee of $244 with a $206 increase for a total capital fee of $450 per student annually. To highlight this change, the Student Activity Fees chart will be presented as follows for fiscal year 2015 and subsequent years: Student Activity Fees (in dollars) Fiscal Year Academic Year Student Fee 1 Academic Year Capital Fee Overall Student Fee Budget Total Pledged Student Fees Pledged Student Services Fee Pledged Capital and Facilities Student Fee Amount Used To Pay Debt Service Amount Transferred to Reserves for Capital ,872,700 7,536,830 3,370,171 4,166,659 1,651,520 2,608,241 1 Includes LEAF Fee 72
79 GENERAL FINANCIAL INFORMATION AND OPERATING DATA Parking Fees The University has 38 parking lots at its Greeley, Colorado campus, with over 5,900 parking spaces. Total annual parking revenues for the last five fiscal years are presented in the table below. Parking Permits and Fines Revenues (in dollars) Fiscal Year Permit Basic Fee Total Revenue ,977, ,066, ,144, ,056, ,989,046 Other Auxiliary Sales and Services A variety of other revenue streams are generated by the operations of residence halls, dining halls, the University Center, the Campus Recreation Center, the Sports and Recreation Complex, the Student Health Center, and the Counseling Center. These include catering, cash foods sales, retail operations, space rental, recreation class fees, health care charges, counseling session charges, and campus vending sales. Other Auxiliary Sales and Services Revenues (in dollars) Fiscal Year Revenue 3,860,688 5,513,561 5,636,864 5,577,946 5,268,680 73
80 ENROLLMENT, ADMISSIONS, STUDENT CHARGES, AND FACULTY DATA ENROLLMENT Fall HEADCOUNT (Fall Final) Total Headcount 13,030 13,038 13,070 12,710 12,050 % Change 2.5% 0.1% 0.2% -2.8% -5.2% Undergraduate Headcount 10,464 10,414 10,318 9,947 9,469 % Change 1.7% -0.5% -0.9% -3.6% -4.8% % Undergraduate Headcount 80.3% 79.9% 78.9% 78.3% 78.6% Full Time Undergraduate Headcount 9,198 9,293 9,119 8,733 8,339 % Change 2.0% 1.0% -1.9% -4.2% -4.5% % Full time Undergraduate Headcount 87.9% 89.2% 88.4% 87.8% 88.1% Part Time Undergraduate Headcount 1,266 1,121 1,199 1,214 1,130 % Change -0.5% -11.5% 7.0% 1.3% -6.9% % Part time Undergraduate Headcount 12.1% 10.8% 11.6% 12.2% 11.9% Graduate Headcount 2,566 2,624 2,752 2,763 2,581 % Change 6.0% 2.3% 4.9% 0.4% -6.6% % Graduate Headcount 19.7% 20.1% 21.1% 21.7% 21.4% Extended Campus Headcount 1,754 1,706 1,820 1,896 1,775 % Change 18.1% -2.7% 6.7% 4.2% -6.4% FTE (Fall Final) Total FTE 10,502 10,524 10,398 10,016 9,504 % Change 2.3% 0.2% -1.2% -3.7% -5.1% Undergraduate FTE 9,286 9,333 9,206 8,808 8,358 % Change 1.4% 0.5% -1.4% -4.3% -5.1% % Undergraduate FTE 88.4% 88.7% 88.5% 87.9% 87.9% Graduate FTE 1,216 1,191 1,192 1,208 1,147 % Change 9.7% -2.1% 0.1% 1.3% -5.0% % Graduate FTE 11.6% 11.3% 11.5% 12.1% 12.1% Extended Campus FTE % Change 23.7% -7.7% -10.4% 20.3% 0.5% Fiscal Year/Academic Summer-Spring (Complete Year: Summer, Fall, Interim, Spring) Total Annual Credit Hours 334, , , , ,106 % Change 2.2% 0.2% -0.8% -4.9% -4.8% Credit Hours by Residency Main campus - Resident 271, , , , ,536 Main campus - Nonresident 31,865 33,963 36,802 39,650 39,236 Extended Campus 30,855 31,983 33,189 33,270 32,334 Credit Hours by Term Summer 31,539 31,664 32,013 30,652 27,668 Fall 157, , , , ,562 Interim 1,816 1,594 1,662 1,774 1,804 Spring 143, , , , ,072 Credit Hours by Class Undergraduate 289, , , , ,979 Graduate 45,169 45,213 46,115 44,253 43,127 74
81 ENROLLMENT, ADMISSIONS, STUDENT CHARGES, AND FACULTY DATA ADMISSIONS Fall New Freshmen Admissions (Fall Final) Freshmen Applicants 6,420 6,654 6,762 6,001 6,159 % Change 4.6% 3.6% 1.6% -11.3% 2.6% Freshmen Acceptances 5,653 5,949 6,066 5,289 5,552 % Accepted 88.1% 89.4% 89.7% 88.1% 90.1% Freshmen Matriculants 2,260 2,274 2,178 1,939 1,970 % Matriculated 40.0% 38.2% 35.9% 36.7% 35.5% Matriculants / Applicants 35.2% 34.2% 32.2% 32.3% 32.0% % Instate Students 90.9% 89.5% 89.2% 87.6% 85.5% New Transfer Student Admissions (Fall Final) Transfer Applicants 1,469 1,373 1,397 1,187 1,235 % Change 29.3% -6.5% 1.7% -15.0% 4.0% Transfer Acceptances 1,404 1,330 1,272 1,136 1,183 % Accepted 95.6% 96.9% 91.1% 95.7% 95.8% Transfer Matriculants % Matriculated 59.1% 61.4% 59.2% 57.9% 56.6% Matriculants / Applicants 56.5% 59.5% 53.9% 55.4% 54.3% % Instate Students 83.1% 84.6% 82.3% 81.9% 80.4% Fiscal Year/Academic Summer-Spring New Graduate Student Admissions (Full Year) Graduate Applicants 1,906 2,583 2,445 2,477 2,742 % Change 9.8% 35.5% -5.3% 1.3% 10.7% Graduate Acceptances 1,178 1,461 1,380 1,345 1,280 % Accepted 61.8% 56.6% 56.4% 54.3% 46.7% Graduate Matriculants % Matriculated 72.6% 67.9% 63.9% 67.7% 65.4% Matriculants / Applicants 44.9% 38.4% 36.1% 36.8% 30.5% % Instate Students 70.2% 68.1% 67.7% 65.6% 65.6% NEW FRESHMEN STUDENT QUALITY INDICATORS Fall SAT Scores 1,051 1,053 1,052 1,027 1,050 ACT Scores % of Freshmen in Top 25% of their H.S. 38% 38% 35% 36% 35% NEW FRESHMEN RETENTION AND GRADUATION RATES Cohort Year Retention Rate (Fresh to Soph Year) 69.9% 66.5% 66.2% 69.5% 71.6% Cohort Year Graduation Rate (within 4 years) 26.6% 26.9% 26.6% 29.4% 28.1% Cohort Year Graduation Rate (within 5 years) 42.2% 42.7% 42.7% 44.0% 45.3% Cohort Year Graduation Rate (within 6 years) 45.6% 44.8% 44.8% 46.3% 47.9% 75
82 ENROLLMENT, ADMISSIONS, STUDENT CHARGES, AND FACULTY DATA STUDENT CHARGES - UNDERGRADUATE Fiscal Year/Academic Fall & Spring Tuition - Resident (15 cr hrs per sem) $4,680 $5,300 $5,464 $5,748 $6,024 % Change 8.9% 13.2% 3.1% 5.2% 4.8% Tuition - Nonresident (15 cr hrs per sem) $15,864 $16,822 $16,988 $17,292 $17,568 % Change 9.1% 6.0% 1.0% 1.8% 1.6% Room and Board (Tier 1 Dorm and 19 meals) $8,920 $9,750 $10,044 $10,140 $10,360 % Change 6.6% 9.3% 3.0% 1.0% 2.2% Required Fees and Charges* (15 cr hrs per sem) $1,317 $1,324 $1,373 $1,420 $1,709 % Change 14.0% 0.5% 3.7% 3.4% 20.4% Total Costs Charged - Resident $14,917 $16,374 $16,881 $17,308 $18,093 % Change 7.9% 9.8% 3.1% 2.5% 4.5% Total Costs Charged - Nonresident $26,101 $27,896 $28,405 $28,852 $29,637 % Change 8.4% 6.9% 1.8% 1.6% 2.7% *This includes student activity fees, technology fees (beginning in FY09), library fees (beginning in FY10), capital fee (beginning in FY15). TUITION CHARGES - GRADUATE* Fiscal Year/Academic Fall-Spring Tuition Master's Low - Resident $5,562 $6,390 $7,668 $7,974 $8,208 % Change 15.1% 14.9% 20.0% 4.0% 2.9% Tuition Master's High - Resident $6,678 $8,010 $9,216 $9,486 $9,774 % Change 15.1% 19.9% 15.1% 2.9% 3.0% Tuition Doctoral Low - Resident $6,498 $8,190 $8,190 $8,514 $8,766 % Change 15.2% 26.0% 0.0% 4.0% 3.0% Tuition Doctoral High - Resident $7,794 $8,964 $10,044 $10,440 $10,746 % Change 15.2% 15.0% 12.0% 3.9% 2.9% Tuition Master's Low - Nonresident $14,202 $16,326 $13,860 $14,112 $14,364 % Change 15.1% 15.0% -15.1% 1.8% 1.8% Tuition Master's High - Nonresident $15,300 $17,604 $18,810 $19,080 $19,368 % Change 15.0% 15.1% 6.9% 1.4% 1.5% Tuition Doctoral Low - Nonresident $16,560 $19,278 $19,278 $19,602 $19,854 % Change 15.0% 16.4% 0.0% 1.7% 1.3% Tuition Doctoral High - Nonresident $17,856 $19,638 $20,754 $21,132 $21,438 % Change 15.0% 10.0% 5.7% 1.8% 1.4% *Academic year amount (based on 9 credit hours per semester). In FY09-10 a tiered pricing structure was adopted and the high and low are presented. FACULTY DATA - FALL CENSUS Fall Total Faculty Full time Faculty Part time Faculty Student to Faculty Ratio* *[(Full time Students + 1/3 Part time Students) / (Full time Faculty + 1/3 Part time Faculty)] 76

83 BOARD OF TRUSTEES AS OF JUNE 30, 2015 Richard L. Monfort Chairman of the Board of Trustees Self-Employed Businessman/Investor Paul Washington Vice Chairman of the Board of Trustees Executive Director of the Denver Office of Economic Development S. Kato Crews Partner, Hoffman Crews Nies Waggener & Foster Christine Scanlan President and CEO of the Keystone Center Kelly M. Johnson Senior Vice President of Patient Care Services and Chief Nursing Officer Children s Hospital Kevin Ahern Founder, Chairman and CEO of CIC Bancshares, Inc. Tony Salazar Executive Director of the Colorado Education Association R. Vishwanathan Vish Iyer Faculty Trustee University of Northern Colorado Julie DeJong Student Trustee University of Northern Colorado ADMINISTRATION AS OF JUNE 30, 2015 Kay Norton President Robbyn Wacker Provost and Senior Vice President for Academic Affairs Michelle Quinn Senior Vice President and Chief Financial Officer Treasurer to the Board of Trustees Daniel Satriana, Jr. Vice President and General Counsel Secretary to the Board of Trustees Allison Steg Haskett Interim Vice President for Development and Alumni Relations Dan Weaver Vice President for External and University Relations Gloria Reynolds Assistant to the President Additional copies of the 2015 Annual Financial Report may be obtained from: Susan L. Simmers Assistant Vice President for Finance University of Northern Colorado th Street, Campus Box 22 Greeley, CO (970)
84
2013 Annual Financial Report
 2013 Annual Financial Report TABLE OF CONTENTS Message from President Norton... 1 Management s Responsibility for Financial Reporting... 2 Independent Auditors Report... 3 Management Discussion and Analysis...
FINANCIAL STATEMENTS AND INDEPENDENT AUDITOR S REPORTS YEAR ENDED JUNE 30, 2017 TABLE OF CONTENTS
 FINANCIAL STATEMENTS AND INDEPENDENT AUDITOR S REPORTS YEAR ENDED JUNE 30, 2017 TABLE OF CONTENTS Page MANAGEMENT S LETTER... 1 INDEPENDENT AUDITOR S REPORT... 2-4 MANAGEMENT S DISCUSSION AND ANALYSIS...
CALIFORNIA STATE UNIVERSITY, POMONA. Financial Statements. June 30, (With Independent Auditors Report Thereon)
") Financial Statements (With Independent Auditors Report Thereon) Table of Contents Page Independent Auditors Report 1 Management s Discussion and Analysis (Unaudited) 3 Financial Statements: Statement of
Financial Statements (With Independent Auditors Report Thereon) Table of Contents Page Independent Auditors Report 1 Management s Discussion and Analysis (Unaudited) 3 Financial Statements: Statement of
MOREHEAD STATE UNIVERSITY. Single Audit Reports Under Uniform Guidance
 Single Audit Reports Under Uniform Guidance As of and for the Years Ended June 30, 2017 and 2016 with Report of Independent Auditors M CONTENTS Management s Discussion and Analysis... 1 Report of Independent
SAN JOSE STATE UNIVERSITY. Financial Statements. June 30, (With Independent Auditors Report Thereon)
") Financial Statements (With Independent Auditors Report Thereon) Table of Contents Page Independent Auditors Report 1 Management s Discussion and Analysis 3 Financial Statements: Statement of Net Assets
Financial Statements (With Independent Auditors Report Thereon) Table of Contents Page Independent Auditors Report 1 Management s Discussion and Analysis 3 Financial Statements: Statement of Net Assets
SAN FRANCISCO STATE UNIVERSITY. Financial Statements. June 30, (With Independent Auditors Report Thereon)
") Financial Statements (With Independent Auditors Report Thereon) Table of Contents Page(s) Independent Auditors Report 1 2 Management s Discussion and Analysis (Unaudited) 3 14 Financial Statements: Statement
Financial Statements (With Independent Auditors Report Thereon) Table of Contents Page(s) Independent Auditors Report 1 2 Management s Discussion and Analysis (Unaudited) 3 14 Financial Statements: Statement
CALIFORNIA STATE UNIVERSITY, NORTHRIDGE. Financial Statements. June 30, (With Independent Auditors Report Thereon)
") Financial Statements (With Independent Auditors Report Thereon) Table of Contents Page Independent Auditors Report 1 Management s Discussion and Analysis 3 Basic Financial Statements: Statement of Net
Financial Statements (With Independent Auditors Report Thereon) Table of Contents Page Independent Auditors Report 1 Management s Discussion and Analysis 3 Basic Financial Statements: Statement of Net
CALIFORNIA STATE UNIVERSITY, FULLERTON. Financial Statements. June 30, (With Independent Auditors Report Thereon)
") Financial Statements (With Independent Auditors Report Thereon) Table of Contents Page Independent Auditors Report 1 Management s Discussion and Analysis (Unaudited) 3 Financial Statements: Statement of
Financial Statements (With Independent Auditors Report Thereon) Table of Contents Page Independent Auditors Report 1 Management s Discussion and Analysis (Unaudited) 3 Financial Statements: Statement of
WESTFIELD STATE UNIVERSITY (an agency of the Commonwealth of Massachusetts) FINANCIAL STATEMENTS AND MANAGEMENT S DISCUSSION AND ANALYSIS
 FINANCIAL STATEMENTS AND MANAGEMENT S DISCUSSION AND ANALYSIS") FINANCIAL STATEMENTS AND MANAGEMENT S DISCUSSION AND ANALYSIS JUNE 30, 2016 Financial Statements and Management s Discussion and Analysis June 30, 2016 C O N T E N T S Independent Auditors Report 1-2 Management
FINANCIAL STATEMENTS AND MANAGEMENT S DISCUSSION AND ANALYSIS JUNE 30, 2016 Financial Statements and Management s Discussion and Analysis June 30, 2016 C O N T E N T S Independent Auditors Report 1-2 Management
CALIFORNIA POLYTECHNIC STATE UNIVERSITY, SAN LUIS OBISPO. Financial Statements. June 30, (With Independent Auditors Report Thereon)
") Financial Statements (With Independent Auditors Report Thereon) Table of Contents Page Independent Auditors Report 1 Management s Discussion and Analysis 3 Financial Statements: Statement of Net Assets
Financial Statements (With Independent Auditors Report Thereon) Table of Contents Page Independent Auditors Report 1 Management s Discussion and Analysis 3 Financial Statements: Statement of Net Assets
CALIFORNIA STATE UNIVERSITY, CHICO. Financial Statements. June 30, (With Independent Auditors Report Thereon)
") Financial Statements (With Independent Auditors Report Thereon) Table of Contents Page Independent Auditors Report 1 Management s Discussion and Analysis (unaudited) 3 Financial Statements: Statement of
Financial Statements (With Independent Auditors Report Thereon) Table of Contents Page Independent Auditors Report 1 Management s Discussion and Analysis (unaudited) 3 Financial Statements: Statement of
KENTUCKY STATE UNIVERSITY (A Component Unit of the Commonwealth of Kentucky) FINANCIAL STATEMENTS June 30, 2018
 FINANCIAL STATEMENTS June 30, 2018") (A Component Unit of the Commonwealth of Kentucky) FINANCIAL STATEMENTS FINANCIAL STATEMENTS CONTENTS INDEPENDENT AUDITOR S REPORT... 1 MANAGEMENT'S DISCUSSION AND ANALYSIS... 3 FINANCIAL STATEMENTS KENTUCKY
(A Component Unit of the Commonwealth of Kentucky) FINANCIAL STATEMENTS FINANCIAL STATEMENTS CONTENTS INDEPENDENT AUDITOR S REPORT... 1 MANAGEMENT'S DISCUSSION AND ANALYSIS... 3 FINANCIAL STATEMENTS KENTUCKY
WINSTON-SALEM STATE UNIVERSITY
 STATE OF NORTH f CAROLINA OFFICE OF THE STATE AUDITOR BETH A. WOOD, CPA WINSTON-SALEM STATE UNIVERSITY WINSTON-SALEM, NORTH CAROLINA FINANCIAL STATEMENT AUDIT REPORT FOR THE YEAR ENDED JUNE 30, 2017 A
WASHBURN UNIVERSITY OF TOPEKA FINANCIAL STATEMENTS JUNE 30, 2016
 FINANCIAL STATEMENTS JUNE 30, 2016 Index Page Independent Auditors Report... 1-3 Management s Discussion And Analysis... 4-28 Financial Statements Statements Of Net Position... 29-30 Statements Of Financial
CALIFORNIA STATE UNIVERSITY, EAST BAY. Financial Statements. June 30, (With Independent Auditors Report Thereon)
") Financial Statements (With Independent Auditors Report Thereon) Table of Contents Page Independent Auditors Report 1 Management s Discussion and Analysis 3 Financial Statements: Statement of Net Assets
Financial Statements (With Independent Auditors Report Thereon) Table of Contents Page Independent Auditors Report 1 Management s Discussion and Analysis 3 Financial Statements: Statement of Net Assets
WASHBURN UNIVERSITY OF TOPEKA FINANCIAL STATEMENTS JUNE 30, 2013
 FINANCIAL STATEMENTS JUNE 30, 2013 Index Page Independent Auditors Report... 1-4 Management s Discussion And Analysis... 5-27 Financial Statements Statements Of Net Position... 28-29 Statements Of Financial
CALIFORNIA STATE UNIVERSITY, FRESNO. Financial Statements. June 30, (With Independent Auditors Report Thereon)
") Financial Statements (With Independent Auditors Report Thereon) Table of Contents Page Independent Auditors Report 1 Management s Discussion and Analysis 3 Financial Statements: Statement of Net Assets
Financial Statements (With Independent Auditors Report Thereon) Table of Contents Page Independent Auditors Report 1 Management s Discussion and Analysis 3 Financial Statements: Statement of Net Assets
MORGAN STATE UNIVERSITY. Financial Statements Together with Report of Independent Public Accountants
 Financial Statements Together with Report of Independent Public Accountants Years Ended JUNE 30, 2016 AND 2015 CONTENTS REPORT OF INDEPENDENT PUBLIC ACCOUNTANTS 1 MANAGEMENT S DISCUSSION AND ANALYSIS 3
WINSTON-SALEM STATE UNIVERSITY
 STATE OF NORTH f CAROLINA OFFICE OF THE STATE AUDITOR BETH A. WOOD, CPA WINSTON-SALEM STATE UNIVERSITY WINSTON-SALEM, NORTH CAROLINA FINANCIAL STATEMENT AUDIT REPORT FOR THE YEAR ENDED JUNE 30, 2018 A
Oklahoma Panhandle State University
 Oklahoma Panhandle State University An Organizational Unit of the Board of Regents For the Oklahoma Agricultural and Mechanical Colleges Financial Statements with Independent Auditors Reports June 30,
MONROE COMMUNITY COLLEGE (A Component Unit of the County of Monroe, New York)
") MONROE COMMUNITY COLLEGE (A Component Unit of the County of Monroe, New York) Financial Statements As of August 31, 2017 and 2016 Together with Independent Auditor s Report MONROE COMMUNITY COLLEGE (A
MONROE COMMUNITY COLLEGE (A Component Unit of the County of Monroe, New York) Financial Statements As of August 31, 2017 and 2016 Together with Independent Auditor s Report MONROE COMMUNITY COLLEGE (A
Colorado School of Mines Financial Statements and Independent Auditor s Reports Financial Audit Years Ended June 30, 2016 and 2015
 Financial Statements and Independent Auditor s Reports Financial Audit Years Ended June 30, 2016 and 2015 Compliance Audit Year Ended June 30, 2016 LEGISLATIVE AUDIT COMMITTEE Representative Dan Nordberg
WORCESTER STATE UNIVERSITY (AN AGENCY OF THE COMMONWEALTH OF MASSACHUSETTS) FINANCIAL STATEMENTS AND MANAGEMENT S DISCUSSION AND ANALYSIS WITH
 FINANCIAL STATEMENTS AND MANAGEMENT S DISCUSSION AND ANALYSIS WITH") (AN AGENCY OF THE COMMONWEALTH OF MASSACHUSETTS) FINANCIAL STATEMENTS AND MANAGEMENT S DISCUSSION AND ANALYSIS WITH SUPPLEMENTARY INFORMATION AND OTHER REPORTS YEARS ENDED JUNE 30, 2017 AND 2016 AND INDEPENDENT
(AN AGENCY OF THE COMMONWEALTH OF MASSACHUSETTS) FINANCIAL STATEMENTS AND MANAGEMENT S DISCUSSION AND ANALYSIS WITH SUPPLEMENTARY INFORMATION AND OTHER REPORTS YEARS ENDED JUNE 30, 2017 AND 2016 AND INDEPENDENT
MONROE COMMUNITY COLLEGE (A Component Unit of the County of Monroe, New York)
") MONROE COMMUNITY COLLEGE (A Component Unit of the County of Monroe, New York) Financial Statements As of August 31, 2016 and 2015 Together with Independent Auditor s Report MONROE COMMUNITY COLLEGE (A
MONROE COMMUNITY COLLEGE (A Component Unit of the County of Monroe, New York) Financial Statements As of August 31, 2016 and 2015 Together with Independent Auditor s Report MONROE COMMUNITY COLLEGE (A
Oklahoma Panhandle State University
 Oklahoma Panhandle State University Financial Statements with Independent Auditors Reports June 30, 2017 and 2016 Contents Independent Auditor s Report 1 2 Management s Discussion and Analysis (Unaudited)
HARFORD COMMUNITY COLLEGE COMPONENT UNIT FINANCIAL STATEMENTS AND SINGLE AUDIT COMPLIANCE REPORTS YEAR ENDED JUNE 30, 2017
 COMPONENT UNIT FINANCIAL STATEMENTS AND SINGLE AUDIT COMPLIANCE REPORTS TABLE OF CONTENTS INDEPENDENT AUDITORS REPORT 1 MANAGEMENT DISCUSSION AND ANALYSIS (UNAUDITED) 4 FINANCIAL STATEMENTS STATEMENT OF
ANNUAL SYSTEM FINANCIAL REPORT
 SYSTEM FINANCIAL REPORT 2016 ANNUAL SYSTEM FINANCIAL REPORT Funds associated with the following functions and revenue sources: housing, dining, services and activities fee, student union building fee,
STATE OF MISSISSIPPI INSTITUTIONS OF HIGHER LEARNING. Financial Statements. June 30, 2017 and (With Independent Auditors Reports Thereon)
") Financial Statements (With Independent Auditors Reports Thereon) (THIS PAGE LEFT BLANK INTENTIONALLY) Table of Contents Independent Auditors Report 1 Management s Discussion and Analysis (Unaudited) 4
Financial Statements (With Independent Auditors Reports Thereon) (THIS PAGE LEFT BLANK INTENTIONALLY) Table of Contents Independent Auditors Report 1 Management s Discussion and Analysis (Unaudited) 4
INDEPENDENT AUDITORS REPORT 1 MANAGEMENT S DISCUSSION AND ANALYSIS Statements of Net Assets 11
 University of Idaho Financial Statements for the Years Ended June 30, 2003 and 2002 and Independent Auditors Report Including Single Audit Reports for the Year Ended June 30, 2003 UNIVERSITY OF IDAHO TABLE
Financial Statements and Reports Required by Uniform Guidance June 30, 2018 and 2017 The University of Oklahoma - Norman Campus
 Financial Statements and Reports Required by Uniform Guidance June 30, 2018 and 2017 The University of Oklahoma - Norman Campus eidebailly.com Table of Contents June 30, 2018 and 2017 Independent Auditor
Cleveland State University (a component unit of the State of Ohio) Financial Report with Supplemental Information June 30, 2018
 Financial Report with Supplemental Information June 30, 2018") Cleveland State University (a component unit of the State of Ohio) Financial Report with Supplemental Information June 30, 2018 Contents Independent Auditor s Report 1-3 Management s Discussion and Analysis
Cleveland State University (a component unit of the State of Ohio) Financial Report with Supplemental Information June 30, 2018 Contents Independent Auditor s Report 1-3 Management s Discussion and Analysis
Financial Statements and Report of Independent Certified Public Accountants
 Financial Statements and Report of Independent Certified Public Accountants Community College of Philadelphia Contents Page Report of Independent Certified Public Accountants 3 Management s discussion
Financial Statements June 30, 2017 and 2016 The University of Oklahoma - Norman Campus
 Financial Statements June 30, 2017 and 2016 The University of Oklahoma - Norman Campus Table of Contents June 30, 2017 and 2016 Independent Auditor s Report... 1 Management's Discussion and Analysis (Unaudited)...
NORTHWESTERN OKLAHOMA STATE UNIVERSITY
 NORTHWESTERN OKLAHOMA STATE UNIVERSITY A DEPARTMENT OF THE REGIONAL UNIVERSITY SYSTEM OF OKLAHOMA ANNUAL FINANCIAL STATEMENTS AND INDEPENDENT AUDITOR S REPORT AS OF AND FOR THE YEAR ENDED JUNE 30, 2015
2017 Annual Financial Report
 2017 Annual Financial Report Consolidated Financial Statements as of and for the Years Ended June 30, 2017 and 2016, Independent Auditors Report, and Management s Discussion and Analysis 3 Independent
Report of Independent Auditors in accordance with the Uniform Guidance and Financial Statements for
 Report of Independent Auditors in accordance with the Uniform Guidance and Financial Statements for June 30, 2016 and 2015 LEWIS-CLARK STATE COLLEGE TABLE OF CONTENTS Page REPORT OF INDEPENDENT AUDITORS
WASHBURN UNIVERSITY OF TOPEKA FINANCIAL STATEMENTS JUNE 30, 2017
 FINANCIAL STATEMENTS JUNE 30, 2017 Index Page Independent Auditors Report... 1-3 Management s Discussion And Analysis... 4-24 Financial Statements Statements Of Net Position... 25-26 Statements Of Financial
STATE OF ILLINOIS ILLINOIS STATE UNIVERSITY. FINANCIAL AUDIT (In Accordance with the Single Audit Act and OMB Circular A-133)
") STATE OF ILLINOIS ILLINOIS STATE UNIVERSITY FINANCIAL AUDIT (In Accordance with the Single Audit Act and OMB Circular A-133) For The Years Ended June 30, 2009 and 2008 Performed as Special Assistant Auditors
STATE OF ILLINOIS ILLINOIS STATE UNIVERSITY FINANCIAL AUDIT (In Accordance with the Single Audit Act and OMB Circular A-133) For The Years Ended June 30, 2009 and 2008 Performed as Special Assistant Auditors
STATE OF MISSISSIPPI INSTITUTIONS OF HIGHER LEARNING. Financial Statements. June 30, 2016 and (With Independent Auditors Reports Thereon)
") Financial Statements (With Independent Auditors Reports Thereon) (THIS PAGE LEFT BLANK INTENTIONALLY) Table of Contents Independent Auditors Report 1 Management s Discussion and Analysis (Unaudited) 4
Financial Statements (With Independent Auditors Reports Thereon) (THIS PAGE LEFT BLANK INTENTIONALLY) Table of Contents Independent Auditors Report 1 Management s Discussion and Analysis (Unaudited) 4
SOUTHEAST MISSOURI STATE UNIVERSITY FINANCIAL STATEMENTS JUNE 30, 2018
 SOUTHEAST MISSOURI STATE UNIVERSITY FINANCIAL STATEMENTS JUNE 30, 2018 Contents Page Independent Auditors Report... 1-3 Management s Discussion And Analysis... 4-11 Financial Statements Statement Of Net
CENTRAL STATE UNIVERSITY Wilberforce, Ohio. FINANCIAL STATEMENTS June 30, 2017 and 2016
 Wilberforce, Ohio FINANCIAL STATEMENTS Wilberforce, Ohio FINANCIAL STATEMENTS CONTENTS INDEPENDENT AUDITOR S REPORT... 1 MANAGEMENT S DISCUSSION AND ANALYSIS (UNAUDITED)... 3 FINANCIAL STATEMENTS STATEMENTS
MORGAN STATE UNIVERSITY. Financial Statements Together with Report of Independent Public Accounts
 Financial Statements Together with Report of Independent Public Accounts For the Years Ended JUNE 30, 2013 AND 2012 CONTENTS REPORT OF INDEPENDENT PUBLIC ACCOUNTANTS 1 MANAGEMENT S DISCUSSION AND ANALYSIS
TRUMAN STATE UNIVERSITY A COMPONENT UNIT OF THE STATE OF MISSOURI FINANCIAL STATEMENTS JUNE 30, 2017
 A COMPONENT UNIT OF THE STATE OF MISSOURI FINANCIAL STATEMENTS JUNE 30, 2017 Contents Page Independent Auditors Report... 1-2 Management s Discussion And Analysis... 3-12 Financial Statements Statement
BRISTOL COMMUNITY COLLEGE (an Agency of the Commonwealth of Massachusetts) FINANCIAL STATEMENTS AND MANAGEMENT S DISCUSSION AND ANALYSIS
 FINANCIAL STATEMENTS AND MANAGEMENT S DISCUSSION AND ANALYSIS") (an Agency of the Commonwealth of Massachusetts) FINANCIAL STATEMENTS AND MANAGEMENT S DISCUSSION AND ANALYSIS JUNE 30, 2017 Financial Statements and Management s Discussion and Analysis C O N T E N T
(an Agency of the Commonwealth of Massachusetts) FINANCIAL STATEMENTS AND MANAGEMENT S DISCUSSION AND ANALYSIS JUNE 30, 2017 Financial Statements and Management s Discussion and Analysis C O N T E N T
BUNKER HILL COMMUNITY COLLEGE (an agency of the Commonwealth of Massachusetts) FINANCIAL STATEMENTS AND MANAGEMENT S DISCUSSION AND ANALYSIS
 FINANCIAL STATEMENTS AND MANAGEMENT S DISCUSSION AND ANALYSIS") FINANCIAL STATEMENTS AND MANAGEMENT S DISCUSSION AND ANALYSIS JUNE 30, 2017 Financial Statements and Management s Discussion and Analysis C O N T E N T S Independent Auditors Report 1-3 Management s Discussion
FINANCIAL STATEMENTS AND MANAGEMENT S DISCUSSION AND ANALYSIS JUNE 30, 2017 Financial Statements and Management s Discussion and Analysis C O N T E N T S Independent Auditors Report 1-3 Management s Discussion
STATE OF MISSISSIPPI INSTITUTIONS OF HIGHER LEARNING. Financial Statements. June 30, 2014 and (With Independent Auditors Reports Thereon)
") Financial Statements (With Independent Auditors Reports Thereon) (THIS PAGE LEFT BLANK INTENTIONALLY) Table of Contents Independent Auditors Report 1 Management s Discussion and Analysis (Unaudited) 4
Financial Statements (With Independent Auditors Reports Thereon) (THIS PAGE LEFT BLANK INTENTIONALLY) Table of Contents Independent Auditors Report 1 Management s Discussion and Analysis (Unaudited) 4
SOUTHEASTERN OKLAHOMA STATE UNIVERSITY
 SOUTHEASTERN OKLAHOMA STATE UNIVERSITY A DEPARTMENT OF THE REGIONAL UNIVERSITY SYSTEM OF OKLAHOMA ANNUAL FINANCIAL STATEMENTS AND INDEPENDENT AUDITOR S REPORT AS OF AND FOR THE YEAR ENDED JUNE 30, 2016
UNIVERSITY OF ALASKA
 UNIVERSITY OF ALASKA (A Component Unit of the State of Alaska) Financial Statements (With Independent Auditors Report Thereon) University of Alaska (A Component Unit of the State of Alaska) Financial Statements
University of NORTH ALABAMA FINANCIAL REPORT 2017
 University of NORTH ALABAMA FINANCIAL REPORT 2017 Table of Contents September 30, 2016 PART I FINANCIAL STATEMENTS Independent Auditor s Report... 1 Management s Discussion and Analysis... 4 Statement
SOUTHEAST MISSOURI STATE UNIVERSITY FINANCIAL STATEMENTS JUNE 30, 2016
 SOUTHEAST MISSOURI STATE UNIVERSITY FINANCIAL STATEMENTS JUNE 30, 2016 Contents Page Independent Auditors Report... 1-3 Management s Discussion And Analysis... 4-13 Financial Statements Statement Of Net
SOUTHWESTERN OKLAHOMA STATE UNIVERSITY
 SOUTHWESTERN OKLAHOMA STATE UNIVERSITY A DEPARTMENT OF THE REGIONAL UNIVERSITY SYSTEM OF OKLAHOMA ANNUAL FINANCIAL STATEMENTS AND INDEPENDENT AUDITOR S REPORT AS OF AND FOR THE YEAR ENDED JUNE 30, 2016
HUMBOLDT STATE UNIVERSITY SPONSORED PROGRAMS FOUNDATION
 HUMBOLDT STATE UNIVERSITY SPONSORED PROGRAMS FOUNDATION BASIC FINANCIAL STATEMENTS, SUPPLEMENTARY INFORMATION, AND SINGLE AUDIT REPORTS Including Schedules Prepared for Inclusion in the Financial Statements
The following document was not prepared by the Office of the State Auditor, but was prepared by and submitted to the Office of the State Auditor by a
 The following document was not prepared by the Office of the State Auditor, but was prepared by and submitted to the Office of the State Auditor by a private CPA firm. The document was placed on this web
The William Paterson University of New Jersey
 The William Paterson University of New Jersey (A Component Unit of the State of New Jersey) Financial Statements and Management s Discussion and Analysis Table of Contents Page Independent Auditors Report
SOUTHEASTERN OKLAHOMA STATE UNIVERSITY
 SOUTHEASTERN OKLAHOMA STATE UNIVERSITY A DEPARTMENT OF THE REGIONAL UNIVERSITY SYSTEM OF OKLAHOMA ANNUAL FINANCIAL STATEMENTS AND INDEPENDENT AUDITOR S REPORT AS OF AND FOR THE YEAR ENDED JUNE 30, 2017
SONOMA STATE UNIVERSITY. Financial Statements. June 30, (With Independent Auditors Report Thereon)
") Financial Statements (With Independent Auditors Report Thereon) Table of Contents Page Independent Auditors Report 1 Management s Discussion and Analysis 3 Financial Statements: Statement of Net Assets
Financial Statements (With Independent Auditors Report Thereon) Table of Contents Page Independent Auditors Report 1 Management s Discussion and Analysis 3 Financial Statements: Statement of Net Assets
Cleveland State University (a component unit of the State of Ohio) Financial Report Including Supplemental Information June 30, 2015
 Financial Report Including Supplemental Information June 30, 2015") Cleveland State University (a component unit of the State of Ohio) Financial Report Including Supplemental Information June 30, 2015 Contents Report of Independent Auditors 1-3 Management s Discussion
Cleveland State University (a component unit of the State of Ohio) Financial Report Including Supplemental Information June 30, 2015 Contents Report of Independent Auditors 1-3 Management s Discussion
JOHNSON COUNTY COMMUNITY COLLEGE FINANCIAL STATEMENTS JUNE 30, 2017
 JOHNSON COUNTY COMMUNITY COLLEGE FINANCIAL STATEMENTS JUNE 30, 2017 Contents Independent Auditor s Report 1 2 Management s Discussion and Analysis 3 13 Financial Statements Statements of net position 14
Kent State University. Financial Report June 30, 2010
 Kent State University Financial Report June 30, 2010 Table of Contents June 30, 2010 and 2009 Page(s) Management s Discussion and Analysis (unaudited)... 1-8 Financial Statements Report of Independent
Jacksonville State University Financial Statements September 30, 2017 and 2016
 Financial Statements September 30, 2017 and 2016 Table of Contents September 30, 2017 and 2016 PART I FINANCIAL STATEMENTS PAGE Independent Auditor s Report... 1 Management s Discussion and Analysis...
WORCESTER STATE UNIVERSITY (AN AGENCY OF THE COMMONWEALTH OF MASSACHUSETTS) FINANCIAL STATEMENTS AND MANAGEMENT S DISCUSSION AND ANALYSIS WITH
 FINANCIAL STATEMENTS AND MANAGEMENT S DISCUSSION AND ANALYSIS WITH") (AN AGENCY OF THE COMMONWEALTH OF MASSACHUSETTS) FINANCIAL STATEMENTS AND MANAGEMENT S DISCUSSION AND ANALYSIS WITH SUPPLEMENTARY INFORMATION, STATISTICAL INFORMATION AND OTHER REPORTS YEARS ENDED JUNE
(AN AGENCY OF THE COMMONWEALTH OF MASSACHUSETTS) FINANCIAL STATEMENTS AND MANAGEMENT S DISCUSSION AND ANALYSIS WITH SUPPLEMENTARY INFORMATION, STATISTICAL INFORMATION AND OTHER REPORTS YEARS ENDED JUNE
BUNKER HILL COMMUNITY COLLEGE (an agency of the Commonwealth of Massachusetts) FINANCIAL STATEMENTS AND MANAGEMENT S DISCUSSION AND ANALYSIS
 FINANCIAL STATEMENTS AND MANAGEMENT S DISCUSSION AND ANALYSIS") FINANCIAL STATEMENTS AND MANAGEMENT S DISCUSSION AND ANALYSIS JUNE 30, 2016 Financial Statements and Management s Discussion and Analysis C O N T E N T S Independent Auditors Report 1-2 Management s Discussion
FINANCIAL STATEMENTS AND MANAGEMENT S DISCUSSION AND ANALYSIS JUNE 30, 2016 Financial Statements and Management s Discussion and Analysis C O N T E N T S Independent Auditors Report 1-2 Management s Discussion
Financial Statements June 30, 2016 Rogers State University
 Financial Statements Rogers State University www.eidebailly.com Table of Contents Independent Auditor s Report... 1 Management s Discussion and Analysis... 4 Financial Statements Statement of Net Position...
SOUTHEASTERN OKLAHOMA STATE UNIVERSITY
 SOUTHEASTERN OKLAHOMA STATE UNIVERSITY A DEPARTMENT OF THE REGIONAL UNIVERSITY SYSTEM OF OKLAHOMA ANNUAL FINANCIAL STATEMENTS AND INDEPENDENT AUDITOR S REPORT AS OF AND FOR THE YEAR ENDED JUNE 30, 2018
HUMBOLDT STATE UNIVERSITY. Financial Statements. June 30, 2011
 Financial Statements Table of Contents Page Management s Discussion and Analysis 2 Financial Statements: Statement of Net Assets 11 Statement of Revenues, Expenses, and Changes in Net Assets 12 Statement
LETTER FROM THE EXECUTIVE VICE CHANCELLOR, CHIEF FINANCIAL OFFICER
 LETTER FROM THE EXECUTIVE VICE CHANCELLOR, CHIEF FINANCIAL OFFICER The California State University is a remarkable institution that is comprised of 23 campuses offering an outstanding education to 438,157
Financial Statements June 30, 2017 Rogers State University
 Financial Statements Rogers State University www.eidebailly.com Table of Contents Independent Auditor s Report... 1 Management s Discussion and Analysis... 4 Financial Statements Statement of Net Position...
Cleveland State University (a component unit of the State of Ohio) Financial Report Including Supplemental Information June 30, 2017
 Financial Report Including Supplemental Information June 30, 2017") Cleveland State University (a component unit of the State of Ohio) Financial Report Including Supplemental Information June 30, 2017 Contents Report of Independent Auditors 1-3 Management s Discussion
Cleveland State University (a component unit of the State of Ohio) Financial Report Including Supplemental Information June 30, 2017 Contents Report of Independent Auditors 1-3 Management s Discussion
UNIVERSITY SYSTEM OF MARYLAND. Financial Statements and Supplemental Data Together with Report of Independent Public Accountants
 Financial Statements and Supplemental Data Together with Report of Independent Public Accountants For the Years Ended June 30, 2014 and 2013 Page REPORT OF INDEPENDENT PUBLIC ACCOUNTANTS 1 MANAGEMENT'S
STATE OF NORTH CAROLINA
 STATE OF NORTH CAROLINA WINSTON-SALEM STATE UNIVERSITY WINSTON-SALEM, NORTH CAROLINA FINANCIAL STATEMENT AUDIT REPORT FOR THE YEAR ENDED JUNE 30, 2012 OFFICE OF THE STATE AUDITOR BETH A. WOOD, CPA STATE
Report of Independent Auditors and Financial Statements for
 Report of Independent Auditors and Financial Statements for June 30, 2013 and 2012 LEWIS-CLARK STATE COLLEGE TABLE OF CONTENTS Page REPORT OF INDEPENDENT AUDITORS 1-2 MANAGEMENT S DISCUSSION AND ANALYSIS
Henderson State University
 Arkadelphia, Arkansas Basic Financial Statements and Other Reports June 30, 2016 LEGISLATIVE JOINT AUDITING COMMITTEE HENDERSON STATE UNIVERSITY TABLE OF CONTENTS JUNE 30, 2016 Independent Auditor's Report
Southwestern Michigan College. Financial Report with Additional Information June 30, 2017
 Financial Report with Additional Information June 30, 2017 Board of Trustees Mr. Thomas Jerdon Chairperson Mr. Keith McKenzie Vice Chairperson Mr. William White Secretary Ms. Becky L. Moore Treasurer Ms.
Financial Statements and Supplemental Information and Data Together with Report of Independent Public Accountants
 Financial Statements and Supplemental Information and Data Together with Report of Independent Public Accountants For the Years Ended June 30, 2017 and 2016 This page intentionally left blank. UNIVERSITY
Basic Financial Statements, Management s Discussion and Analysis and Supplementary Information. June 30, 2012 and 2011
 Basic Financial Statements, Management s Discussion and Analysis and Supplementary Information (With Independent Auditors Report Thereon) Table of Contents Independent Auditors Report 1 Management s Discussion
The William Paterson University of New Jersey
 The William Paterson University of New Jersey (A Component Unit of the State of New Jersey) Financial Statements and Management s Discussion and Analysis Table of Contents Page Independent Auditors Report
Southwestern Michigan College. Financial Report with Additional Information June 30, 2016
 Financial Report with Additional Information June 30, 2016 Board of Trustees Mr. Thomas Jerdon Chairperson Mr. Keith McKenzie Vice Chairperson Mr. William White Secretary Ms. Becky L. Moore Treasurer Ms.
UNIVERSITY OF NORTHERN COLORADO: FINANCIAL REPORT 03/31/2017
 UNIVERSITY OF NORTHERN COLORADO: FINANCIAL REPORT 03/31/2017 OVERVIEW Financial highlights of the fiscal year 2016-17 3 rd quarter financial report are summarized below: Cash (pages 2-3) The University
AS OF AND FOR THE YEAR ENDED JUNE 30, 2016
 TM FINANCIAL STATEMENTS AND SCHEDULE OF EXPENDITURES OF FEDERAL AWARDS WITH REPORTS OF INDEPENDENT AUDITORS AS OF AND FOR THE YEAR ENDED TABLE OF CONTENTS YEAR ENDED INDEPENDENT AUDITORS REPORT 3 MANAGEMENT
Financial Statements. C.S. Mott Community College Flint, Michigan. June 30, 2017 and 2016
 Financial Statements C.S. Mott Community College Flint, Michigan June 30, 2017 and 2016 Table of Contents Page Independent Auditors Report on Financial Statements 1-2 Management s Discussion and Analysis
Colorado State University System Financial Statements and Independent Auditor s Reports Financial Audit Years Ended June 30, 2018 and 2017 Compliance
 Colorado State University System Financial Statements and Independent Auditor s Reports Financial Audit Compliance Audit Year Ended June 30, 2018 THIS PAGE LEFT BLANK INTENTIONALLY TABLE OF CONTENTS YEARS
KENTUCKY STATE UNIVERSITY. FINANCIAL STATEMENTS June 30, 2010 and 2009
 FINANCIAL STATEMENTS June 30, 2010 and 2009 FINANCIAL STATEMENTS June 30, 2010 and 2009 CONTENTS REPORT OF INDEPENDENT AUDITORS... 1 MANAGEMENT S DISCUSSION AND ANALYSIS... 3 FINANCIAL STATEMENTS KENTUCKY
ELIZABETH CITY STATE UNIVERSITY
 STATE OF NORTH f CAROLINA OFFICE OF THE STATE AUDITOR BETH A. WOOD, CPA ELIZABETH CITY STATE UNIVERSITY ELIZABETH CITY, NORTH CAROLINA FINANCIAL STATEMENT AUDIT REPORT FOR THE YEAR ENDED JUNE 30, 2017
Kent State University (a component unit of the State of Ohio)
") Kent State University (a component unit of the State of Ohio) Financial Report Including Supplementary Information June 30, 2018 Table of Contents June 30, 2018 and 2017 Page(s) Independent Auditor s Report...
Kent State University (a component unit of the State of Ohio) Financial Report Including Supplementary Information June 30, 2018 Table of Contents June 30, 2018 and 2017 Page(s) Independent Auditor s Report...
BALTIMORE CITY COMMUNITY COLLEGE. Financial Statements Together with Report of Independent Public Accountants
 Financial Statements Together with Report of Independent Public Accountants For the JUNE 30, 2013 AND 2012 CONTENTS REPORT OF INDEPENDENT PUBLIC ACCOUNTANTS 1 MANAGEMENT S DISCUSSION AND ANALYSIS 3 FINANCIAL
UNIVERSITY OF SOUTH ALABAMA (A Component Unit of the State of Alabama)
") Basic Financial Statements and Supplementary Information on Federal Awards Programs Table of Contents Management s Discussion and Analysis (Unaudited) 1 Independent Auditors Report 13 Basic Financial Statements:
Basic Financial Statements and Supplementary Information on Federal Awards Programs Table of Contents Management s Discussion and Analysis (Unaudited) 1 Independent Auditors Report 13 Basic Financial Statements:
Washburn University of Topeka
 Accountants Report and Financial Statements (Including Reports Required Under OMB-133) June 30, 2008 and 2007 June 30, 2008 and 2007 Contents Independent Accountants Report on Financial Statements and
UNIVERSITY OF ALASKA
 UNIVERSITY OF ALASKA (A Component Unit of the State of Alaska) Financial Statements (With Independent Auditors Report Thereon) University of Alaska (A Component Unit of the State of Alaska) Financial Statements
JOHNSON COUNTY COMMUNITY COLLEGE FINANCIAL STATEMENTS JUNE 30, 2018
 JOHNSON COUNTY COMMUNITY COLLEGE FINANCIAL STATEMENTS JUNE 30, 2018 Contents Independent Auditor s Report 1 2 Management s Discussion and Analysis 3 13 Financial Statements Statements of net position 14
WESTERN CAROLINA UNIVERSITY
 STATE OF NORTH ff CAROLINA OFFICE OF THE STATE AUDITOR BETH A. WOOD, CPA WESTERN CAROLINA UNIVERSITY CULLOWHEE, NORTH CAROLINA FINANCIAL STATEMENT AUDIT REPORT FOR THE YEAR ENDED JUNE 30, 2017 A CONSTITUENT
HOLYOKE COMMUNITY COLLEGE (an agency of the Commonwealth of Massachusetts)
") HOLYOKE COMMUNITY COLLEGE INDEPENDENT AUDITORS' REPORTS AS REQUIRED BY THE UNIFORM GUIDANCE AND GOVERNMENT AUDITING STANDARDS AND RELATED INFORMATION JUNE 30, 2016 Independent Auditors' Reports as Required
HOLYOKE COMMUNITY COLLEGE INDEPENDENT AUDITORS' REPORTS AS REQUIRED BY THE UNIFORM GUIDANCE AND GOVERNMENT AUDITING STANDARDS AND RELATED INFORMATION JUNE 30, 2016 Independent Auditors' Reports as Required
2015ANNUAL FINANCIAL. for the Fiscal Year Ended June 30, 2015 (Including Independent Auditors Report)
") 2015ANNUAL FINANCIAL REPORT for the Fiscal Year Ended June 30, 2015 (Including Independent Auditors Report) GEORGIA STATE UNIVERSITY - TABLE OF CONTENTS - Page SECTION I FINANCIAL INDEPENDENT AUDITOR'S
2015ANNUAL FINANCIAL REPORT for the Fiscal Year Ended June 30, 2015 (Including Independent Auditors Report) GEORGIA STATE UNIVERSITY - TABLE OF CONTENTS - Page SECTION I FINANCIAL INDEPENDENT AUDITOR'S
MASSACHUSETTS COLLEGE OF LIBERAL ARTS (an agency of the Commonwealth of Massachusetts) FINANCIAL STATEMENTS AND MANAGEMENT S DISCUSSION AND ANALYSIS
 FINANCIAL STATEMENTS AND MANAGEMENT S DISCUSSION AND ANALYSIS") MASSACHUSETTS COLLEGE OF LIBERAL ARTS FINANCIAL STATEMENTS AND MANAGEMENT S DISCUSSION AND ANALYSIS June 30, 2017 Financial Statements and Management s Discussion and Analysis C O N T E N T S Independent
MASSACHUSETTS COLLEGE OF LIBERAL ARTS FINANCIAL STATEMENTS AND MANAGEMENT S DISCUSSION AND ANALYSIS June 30, 2017 Financial Statements and Management s Discussion and Analysis C O N T E N T S Independent
SOUTHWESTERN COMMUNITY COLLEGE
 STATE OF NORTH CAROLINA OFFICE OF THE STATE AUDITOR BETH A. WOOD, CPA SOUTHWESTERN COMMUNITY COLLEGE SYLVA, NORTH CAROLINA FINANCIAL STATEMENT AUDIT REPORT FOR THE YEAR ENDED JUNE 30, 2015 A COMPONENT
FAYETTEVILLE STATE UNIVERSITY
 STATE OF NORTH f CAROLINA OFFICE OF THE STATE AUDITOR BETH A. WOOD, CPA FAYETTEVILLE STATE UNIVERSITY FAYETTEVILLE, NORTH CAROLINA FINANCIAL STATEMENT AUDIT REPORT FOR THE YEAR ENDED JUNE 30, 2017 A CONSTITUENT
ANNUAL FINANCIAL REPORT. June 30, 2016
 ANNUAL FINANCIAL REPORT June 30, 2016 NORTH DAKOTA UNIVERSITY SYSTEM ANNUAL FINANCIAL REPORT Fiscal Year Ended JUNE 30, 2016 Prepared by the North Dakota University System Director of Financial Reporting
Massachusetts State College Building Authority (A Component Unit of the Commonwealth of Massachusetts)
") (A Component Unit of the Commonwealth of Massachusetts) Financial Statements (With Supplementary Information) and Independent Auditor's Reports June 30, 2017 and 2016 Index Page Independent Auditor's Report
(A Component Unit of the Commonwealth of Massachusetts) Financial Statements (With Supplementary Information) and Independent Auditor's Reports June 30, 2017 and 2016 Index Page Independent Auditor's Report
ST. CHARLES COMMUNITY COLLEGE FINANCIAL STATEMENTS FOR THE YEARS ENDED JUNE 30, 2018 AND 2017
 ST. CHARLES COMMUNITY COLLEGE FINANCIAL STATEMENTS FOR THE YEARS ENDED JUNE 30, 2018 AND 2017 ST. CHARLES COMMUNITY COLLEGE CONTENTS PAGE INDEPENDENT AUDITORS REPORT 1 MANAGEMENT S DISCUSSION AND ANALYSIS
UNIVERSITY OF NORTHERN COLORADO: FINANCIAL REPORT 06/30/2017
 UNIVERSITY OF NORTHERN COLORADO: FINANCIAL REPORT 06/30/2017 OVERVIEW Financial highlights of the fiscal year ending June 30, 2017 financial report are summarized below: Cash (pages 2-3) The University
Financial Statements and Supplemental Data Together with Report of Independent Public Accountants
 Financial Statements and Supplemental Data Together with Report of Independent Public Accountants For the Years Ended June 30, 2016 and 2015 This page intentionally left blank. UNIVERSITY SYSTEM OF MARYLAND