Patterns of Poverty in South Africa: A Mixed-Methods Investigation
|
|
|
- Marylou Hampton
- 6 years ago
- Views:
Transcription
1 This paper is work in progress. Please do not cite or quote. Comments welcome. Patterns of Poverty in South Africa: A Mixed-Methods Investigation By Simone Schotte a*, Rocco Zizzamia b,c and Murray Leibbrandt b May 2017 a University of Göttingen and GIGA German Institute of Global and Area Studies, Germany b Southern Africa Labour and Development Research Unit (SALDRU), University of Cape Town, South Africa c Department of International Development, University of Oxford, UK ABSTRACT This paper provides a dynamic perspective on the experience of poverty in South Africa. Using four waves of panel data from the National Income Dynamics Study (NIDS), our analysis reveals that poverty affects many more people in South Africa than a cross-sectional viewpoint would suggest. We observe that eight out of ten South Africans find themselves in a situation of poverty at least once over the investigated six-year time period between 2008 and 2014/15, of which four persistently fall below the (upper bound) poverty line. In addition to NIDS panel data, we also draw on qualitative data collected in Khayelitsha by the authors to come to a richer understanding of the causal mechanisms which explain the poverty persistence and transitions observed using NIDS. Using this mixed methods approach, facilitates an understanding of the heterogeneity in the experience of poverty in South Africa, which has the potential of unlocking important information for policy-makers with respect to the design and targeting of antipoverty policies. Our analysis shows that those who experience persistent poverty are characterized by exceptionally low levels of human capital and financial assets, as well as their geographical isolation from markets and employment opportunities. Ensuring a basic degree of economic security and service provision through social policies will remain a necessary precondition for this group to meet their basic health, education and nutritional needs, which may facilitate a potential integration in the productive economy only over the long term. In addition, we show that the economic instability that those who are moving in and out of poverty experience is closely linked to their vulnerable position in the labor market. Here, policymakers are likely to face an important trade-off between flexible labour market arrangements to foster job creation, and the creation of fewer, but better and more stable jobs that will allow more South Africans to remain out of poverty over the longer term. Keywords: South Africa; chronic poverty; poverty dynamics; vulnerability to poverty; mixed methods * Correspondence to: Rocco Zizzamia, rocco.zizzamia@qeh.ox.ac.uk i
2 Acknowledgements We are grateful to Pramila Krishnan, Ravi Kanbur, David Neves, Victor Sulla, Precious Zikhali, Nga Thi Viet Nguyen, Kanishka Kacker, participants at the 2017 HDCA Conference in Cape Town, and anonymous reviewers at the Oxford Department for International Development for helpful suggestions. We are also indebted to an exceptional team of fieldworkers, among whom Mzulungile Cabanga, Sibongile Mthini, Andiswa Mtini and Amanda Moocha deserve special mention. This project is being run with the financial support of the Southern African Labour and Development Research Unit, the German Institute for Global and Area Studies, St Anne s College, Oxford, and the Department of International Development at the University of Oxford. Part of this paper was written for The World Bank Poverty Reduction and Economic Management Unit, Africa Region. Responsibility for the content of the paper remains our own. ii
3 1. Introduction More than a few scholars have investigated the patterns and determinants of poverty in post-apartheid South Africa (see Finn et al. (2014) for a short review). However, a fundamental shortcoming of most existing analyses is that they are often blind to the fact that poverty is lived in a world of risk and uncertainty (Dercon, 2006). That is, poverty is not a static, timeless state it is a dynamic and evolving phenomenon, with a past and a future (Calvo and Dercon, 2009). In this paper, we are therefore less concerned with measuring aggregate poverty rates and trends in South Africa, but aim at deepening our understanding of the extent and the determinants of transitions into and out of poverty that are masked in cross-sectional analyses. It is widely acknowledged that being able to afford a certain basket of goods at a given point in time does not in itself give a sufficient indication of whether the same will be true in the near future. Even those who are currently non-poor may face a non-negligible risk of falling into poverty and see their lives dominated by concerns of coping with the threat of economic misfortune to avert downward mobility. Similarly, not all households below the poverty line are alike. Poverty tends to be self-perpetuating, but while some households may have always been poor, others may have suffered some negative economic shock that only temporarily pushed them below the poverty line (see, inter alia, Dercon, 2006; Glewwe and Gibson, 2006). Given these considerations, in the international literature, growing attention has been paid to the study of vulnerability to poverty, broadly understood as the risk of remaining poor or falling (deeper) into poverty (see, inter alia, Klasen and Waibel, 2013; Dercon, 2006; Cafiero and Vakis, 2006; Hoddinott and Quisumbing, 2003). There are three main reasons that motivate this focus: First, vulnerability reduces the well-being of households, even if a deterioration in material well-being does not materialize. Evidence from the psychological and health literature has exposed economic insecurity as a source of considerable discomfort (see Cafiero and Vakis, 2006). This implies that it is not only current income or consumption levels that matter for actual welfare, but also the risks a household faces, as well as its (in)ability to prevent, mitigate and cope with these (Klasen and Waibel, 2012: 17). In consequence, vulnerability can both aggravate the material deprivation of those who are already poor and present a serious threat to the well-being of households who are presently non-poor but remain at the edge of slipping into poverty. Second, vulnerability has the potential to create poverty traps. Combining research on poverty dynamics with research on risks, shocks and coping mechanisms (Holzmann et al., 2003; Klasen and Waibel, 2012), a number of studies have argued that poverty tends to be self-perpetuating, for example, because households that face a high exante risk to poverty are more likely to opt for stable, low-return sources of income than to invest in activities with more lucrative but also more uncertain outcomes (see Dercon, 2006; Cafiero and Vakis, 2006). Also, if the poor are more exposed to risk than the non-poor and/or are less able to deal with negative economic shocks when they do occur, then this vulnerability will contribute significantly to poverty as a persistent state. This applies, for example, if households are forced to liquidate their productive asset base, decrease caloric intake, or if children are taken out of school to work (Dercon, 2006). Empirical evidence accordingly suggests that poverty repeated over time has a more detrimental impact on people s lives, especially for children, than poverty that does not recur (Foster, 2009). For example, a longer time spent in poverty has been associated with increased stunting and diminished cognitive abilities (Brooks-Gunn and Duncan, 1997), worse health outcomes (McDonough and Berglund, 2003), and increased risks of staying poor (Stevens, 1994). Thus, given the importance of taking the duration of poverty into consideration, two core quantitative methodologies have been developed to evaluate the extent of chronic versus transient poverty. 1
4 Third, measures of economic vulnerability aim to identify the (types of) households with highest risks of future poverty, whether this means remaining poor or becoming poor in the future. This forward-looking perspective is critical for the design of appropriate poverty reduction policies, given that to fight poverty in the long run, it is at least as important to prevent future poverty as it is to combat existing poverty (Klasen and Waibel, 2012: xi). In this context, it is important to know who is at highest risk of becoming poor, and what characteristics make poverty persistent at an individual or household level. While the importance of understanding vulnerability in an analysis of poverty dynamics is evident, with a few exceptions (Carter and May, 2001; Woolard and Klasen, 2005; Agüero et al., 2007; Finn, Leibbrandt and Levinsohn, 2013; Finn and Leibbrandt, 2016), vulnerability has received relatively little attention in South Africa, even within research which has used panel data to study poverty dynamics. Moreover, much of the earlier work is limited by the lack of availability of nationally representative panel data and mainly focuses on risk factors predominant in rural settings, while empirical research that investigates poverty dynamics for the country as a whole including its large and growing urban population remains scarce. Bigsten and Shimeles (2004), Kedir and McKay (2005), Islam and Shimeles (2006), Faye et al. (2011), and Azomahou and Yitbarek (2014) are among the exceptions that analyze poverty dynamics in urban Sub-Saharan Africa, excluding South Africa. To enrich our understanding of poverty dynamics in urban contexts, our qualitative investigation was based in an urban township environment in Cape Town. The present study therefore aims to contribute to the existing literature by providing an in-depth analysis of the extent and nature of chronic and transient poverty and vulnerability to poverty in South Africa, using a combination of recently available nationally representative panel dataset (introduced in the next section) and data from qualitative fieldwork focusing on livelihood dynamics in Khayelisha, an African township in Cape Town. Drawing on the four waves of panel data, in section 3 we provide an overview of the poverty transitions experienced by individuals in South Africa between 2008 and 2014/15. We provide transition matrices (differentiating between different degrees of poverty by using three distinct poverty lines) to gain a basic understanding of the degree of economic mobility in our data. We then move to investigate the duration of poverty spells and calculate intertemporal consumption averages to decompose standard poverty measures into chronic and transient components. On this basis, section 4 offers a descriptive profile of the poor in South Africa, taking the time spent in poverty into account. Subsequently, in section 5 we use a model of poverty transitions to examine the individual and household characteristics that are associated with observed mobility patterns. The model is fitted to a pooled dataset of waveto-wave transitions, with inter-wave poverty entry and poverty exit being treated separately. This approach will allow us to give an indication of the role played by initial conditions and state dependence, that is, the extent to which individuals who have experienced poverty in the past are more likely to experience poverty in the future. In a sixth section we describe the design of our qualitative field research in Khayelitsha, and discuss some findings and what they might reveal about the causal mechanisms by means of which poverty transitions (which we have analysed quantitatively) occur. In the seventh and final section of this paper we summarize our results and discuss implications for policy. 2. Data, definitions and limitations The data for this dynamic assessment comes from the National Income Dynamics Study (NIDS) implemented by the Southern Africa Labour and Development Research Unit (SALDRU) at the University of Cape Town. NIDS is South Africa s first national panel study, which started off in 2008 with a nationally representative sample of over 28,000 individuals in 7,300 households. At present, there are four waves of data available, which are each spaced approximately two years apart, thus covering a 6-year time period from 2008 to 2014/15. Along with income, 2
5 expenditure, asset wealth and debt, NIDS also gathers information on socio-economic behaviour, including education, employment, parental background, health, and social attitudes, for example. As our focus in this study is on poverty dynamics and transitions, individuals need to be successfully tracked over at least two consecutive survey waves. For most of the analysis, data from pairs of consecutive waves were pooled, such that transitions that occurred from wave 1 to wave 2, wave 2 to wave 3, and wave 3 to wave 4 are treated identically in the analysis. Where necessary, the analysis is restricted to a balanced panel of 17,265 individuals who were successfully interviewed in all four waves. All monetary values used in this paper were deflated to January 2015 prices using the Statistics South Africa (Stats SA) headline consumer price index (Stats SA, 2016). Poverty was defined in terms of per capita household expenditure, which is assumed to give a better approximation of permanent household income than the reported income. Households were classified as being poor versus non-poor using Stats SA s upper bound poverty line (UBPL) set at R963 per person per month. The line is one of three national poverty lines that have been derived using a costof-basic-needs approach to capture different degrees of poverty. For completeness, we in addition distinguish households that fall below the food poverty line (FPL) set at R430, which captures the level of consumption below which individuals are unable to purchase sufficient food to fulfil their caloric requirements, even if all expenditure is dedicated to food; and households that fall below the lower-bound poverty line (LBPL) set at R629, which allows for spending on non-food items, but requires that individuals sacrifice some food consumption in order to fulfil these non-food needs. In order to correct for the presence panel attrition, panel weights have been constructed. For the pooled sample, for each of the three sub-periods (2008 to 2010/11, 2010/11 to 2012 and 2012 to 2014/15) the weights are created separately, benchmarking the characteristics of the population that was successfully re-interviewed in two successive survey waves against the population characteristics in the full sample. Specifically, respondents that were successfully tracked from wave 1 to wave 2 received a new weight derived by adjusting the original wave 1 survey design weight such that the distribution of households by geographic location (area and province), gender of the household head, and race of the household head was identical to the cross-sectional distribution in wave1, and the poverty headcounts (using the FPL, LBPL, and UBPL respectively) in wave 1 and wave 2 when restricted to the pooled panel were identical to the cross-sectional headcounts in the respective survey wave. 1 In doing so, we use an optimization procedure that asserts that the new weights comply with this set of externally specified conditions while requiring the least additional information and being as close as possible to the initial design weights (in order to retain the survey design information with minimum information loss). 2 The same process was applied to the wave 2 to wave 3, and wave 3 to wave 4 periods. The new weights were scaled such that the total sum of weights was identical across sub-periods. For the balanced panel, an analogous procedure is applied. Before moving on to the analysis, it is important to briefly highlight some of the limitation of the data at hand. The 2008 sample was drawn on a nationally representative basis and the poverty headcount (UBPL) calculated from this data based on per capita household income (56.7) or expenditure (60.1 percent) closely matches official statistics (56.8 percent). 3 However, the poverty trends observed over subsequent waves should be treated with caution (see 1 Since the household is the primary sampling unit, the objective function and the population constraints are evaluated at the household level, such that the new weights are identical within the same household. 2 Different methods have been proposed to compute new survey weights that are as close as possible to the initial design weights (and hence retain the survey design information with minimum information loss), while achieving externally specified marginal population totals (see, e.g., Cai et al., 2006; Pacifico, 2010; Pacifico, 2014; Wittenberg, 2010). In this paper, we use the command maxentropy by Wittenberg (2010), which is a generalization of iterative raking. 3 Using the living conditions survey, a poverty headcount (UBPL) of 56.8 was estimated ( 3
6 Table 1). Using household expenditure, poverty increased up to 2010/11, with a remarkable rise by five percentage points in the share of households being pushed below the food poverty line. From 2010/11 to 2014/15 poverty levels decreased, with the strongest fall observed from 2012 to 2014/15. This general trend is consistent across key variables and robust across subsamples. When using incomes instead of expenditures, an even stronger fall in the poverty headcount by more than ten percentage points between 2008 and 2014/15 is observed. A similar pattern emerges when restricting the sample to respondents that were successfully interviewed in all four waves. However, particularly the strong reduction in poverty over the last two years of NIDS may raise doubts, given that it was not mirrored by a major event at the macro-level. 4 There are thus good reasons to believe that the poverty dynamics observed in NIDS are not fully representative at the national level but rather apply to a certain section that was somewhat more likely to be upwardly mobile. 5 Nevertheless, we believe that our estimates can still offer important information on the household characteristics and events associated with movements into and out of poverty. It is important to note that our estimates of the chances for poverty exit should thus be treated as an upper bound. In other words, poverty will tend to be yet more persistent at the national level. Last but not least, it is important to note that NIDS is a panel tracking individual respondents. This implies that, although our poverty measure is defined at the household level, changes in the poverty status over time will be observed at the level of the individual and will not necessarily be identical across members initially belonging to the same household, as the household composition may change. 3. Poverty transitions and the duration of poverty In this section, we offer a descriptive assessment of the extent of movements into and out of poverty. In Table 2 we present four sets of poverty transition matrices using the FPL, LBPL, and UBPL for the period from 2008 to 2010/11, 2010/11 to 2012, 2012 to 2014/15 as well as the pooled sample of wave-to-wave transitions between time t-1 and t. We find that, on average, around 64.2 percent of those who lived below the FPL in one year had not improved their situation two years later, while 35.8 percent had moved above the FPL. Naturally, the higher we set the poverty line, the lower the share of individuals who make it out of poverty, and thus the higher the share that stays poor. Specifically, we observe that 74.4 (82.7) percent of those living below the LBPL (UBPL) did not escape poverty according to the respective definition. To the contrary, on average, 17.9 percent of those with a per capita expenditure above the FPL had fallen below this threshold from one survey wave to the next. Similarly, 22.3 (24.8) percent of those who were non-poor according the LBPL (UBPL) definition, had fallen into poverty using the respective measure. Table 3 incorporates a finer subdivision that accounts for the depth of poverty. The values on the diagonal of the transition matrix indicate the share of individuals who maintained their poverty status, whereas those below the diagonal were downwardly mobile, and those above the diagonal were upwardly mobile. We find that, on average, those living below the FPL were the most likely to be trapped in extreme poverty. Their chance of moving out of poverty completely by moving above the UBPL was just above 10 percent. In contrast, those with consumption levels between the FLP and the UBPL experienced particularly high levels of volatility. While about every fourth individual living between the FPL and LBPL exited poverty, the same holds true for one in three of those with expenditures between the LBPL and UBPL. On the other hand, 37.9 percent of the former and 26.2 percent of the latter fell into extreme poverty. 4 Please note that by using a panel of pooled wave-to-wave transitions, we attempt to limit the influence of the last survey wave. 5 We are grateful to Victor Sulla and Kanishka Kacker for pointing this out. 4
7 In Figures 1a and 1b we use a poverty transition tree to display the probabilities of all possible combinations of poverty status for balanced panel members across four waves of NIDS. The figures show three interesting results. First, they give an idea of the complexity of the poverty transitions experienced over time, looking beyond the simple wave-to-wave transitions. Second, poverty affects a much larger share of the population than covered by one crosssection (one wave). While the average poverty rate between 2008 and 2014/15 was around 61 percent, 78.1 percent of the South African population experienced at least one poverty spell over the period under consideration. And third, the figure illustrates that being poor in one survey wave increases the risk of also being poor in the next wave, and vice versa. We observe that about 60.1 percent of all individuals do not change their poverty status between 2008 and 2014/15. Specifically, 21.9 of all initially non-poor percent stayed out of poverty in all four waves, while 38.2 percent of all initially poor remained poor. This last observation gives an indication of an important dimension of poverty overlooked in cross-sectional studies: its duration or persistence over time. Two rival approaches have been commonly used in the literature to decompose poverty at one point in time into a long-run, chronic component, and a short-run transient component: The components approach, developed by Jalan and Ravallion (1998), calculates the permanent component of a household s income (or consumption expenditures) by taking the intertemporal average. The chronically poor are then identified as those for whom this component falls below the poverty line. Alternatively, the spells approach, accounts more explicitly for the time spent in poverty by counting the number of poverty spells experienced over a given number of time periods and defining a duration cut-off above which households are classified as chronically poor (Bane and Ellwood, 1986; Calvo and Dercon, 2009; Foster, 2009). Applying both approaches to South Africa suggests that chronic poverty is the dominant contributor towards total poverty. In Table 4 we present the results of the components approach. We observe that between 70 and 80 percent of the poor using the LBPL definition or 80 to 90 percent of the poor using the UBPL definition can be classified as chronically poor. That is, for a relatively large share of the population, poverty is a permanent state. The share of the transient poor tended to be highest in 2010/11, when likely in reaction to the global economic crisis a number of households had been temporarily pushed below the poverty line. Using the spells approach, in Table 5 we decompose the standard set of Foster-Greer-Thorbecke poverty measures into chronic and transient components following an approach developed by Foster (2009). This allows us to investigate the link between the duration spent in poverty and the traditional dimensions of incidence, depth and severity. Since there are four periods, we can separately look at individuals that were poor in none, one, two, three, or all four waves. In line with our findings using the components approach, we observe that chronic poverty is the dominant contributor to total poverty in all survey waves. If a minimum of three spells spent in poverty is specified as the duration cut-off, then chronic poverty is observed to be responsible for between 85.7 and 90.6 percent of the total poverty headcount. If we were to define only those as chronically poor who fell below the poverty line in all four waves, the chronic poor would still make up about 60 percent of the overall poverty headcount (see Table 5). In the descriptive statistics in this paper we adopt the latter definition of chronic poverty. When looking at the depth and severity of poverty, which is when taking the distance of the poor to the poverty line into consideration, the share attributable to the chronic poor increases further. Those who were poor in all four waves make up about two thirds of the total poverty gap und three quarter of the squared poverty gap or poverty severity index (see Table 5). This is to say that the chronically poor (i.e., those who were poor in all four waves) tend to be those who experience the highest levels of deprivation. Naturally, the further the distance to the poverty line, the lower the chances someone has to escape poverty. 5
8 4. Descriptive poverty profile In this section, we contrast the average household profile of those who were always (i.e. chronically) poor, never poor or sometimes poor (i.e. experienced one to three poverty spells) in the first four waves of NIDS. Using the UBPL, in ten members of the balanced sample two were never poor, four were sometime poor and four were always poor. In addition, we also look at the group of respondents who experienced chronic extreme poverty, which is who fell below the FPL in all four survey waves. This applies to one in three respondents who were chronically poor according to the UBPL definition. We largely observe a monotonous relationship between key variables at the household level and the duration individuals spend in poverty, with the largest difference being observed between the always and the never poor. As can be seen from Table 6, with R 6,506 per month ($35.75 per day in 2011 PPPs), the average per capita household expenditure is highest among those who remained out of poverty in all four waves. This average level drops by two thirds when looking at those who experienced one poverty spell and further reduces the more persistent the poverty experience. With R 375 per month ($2.06 per day in 2011 PPPs), the average expenditure level of those who were poor in all four waves falls below the FPL, and the average distance to the UBPL amounts to R 588 per month this is, on average, they would need about 2.5 times the financial means available to them to satisfy their basic needs. However, chronically poor households are not only deprived in their basic needs including non-food requirements, but they must often fear not being able to afford adequate nutrition for all household members at all times, even though only one third of them permanently falls below the FPL. Following Jenkins (2011), we use the sample standard deviation of the distribution of individual changes in log per capita household expenditure between consecutive survey waves as a measure of volatility (V t = sd(y it y it 1 )). As reported in Table 6, naturally, those who change their poverty status at least once over the four-period interval tend to have more volatile expenditures, with volatility being highest among those who spend two out of four waves in poverty and volatility being lowest among those who were always or never poor. Nevertheless, being always or never poor does not signify that expenditure levels are not subject to any type of shocks. In terms of the household composition, an important observation from Table 6 is that larger households not only face a higher risk to experience a poverty spell, but poverty also tends to be more persistent. Specifically, those who were poor in all four survey waves live in households that on average count seven members, which is more than twice the size compared to those who were never poor. Of the seven members, about half (3.5) are below age 18. We observe that chronic poverty particularly affects children in South Africa, with every second child below age 15 growing up in a situation of persistent poverty. More serious still, almost every fifth child lives in a household that persistently lacks the financial means to afford adequate nutrition for all members. This is particularly worrisome as a number of studies have shown that being raised in poverty places children at a higher risk for a number of factors ranging from inadequate nutrition over decreased cognitive stimulation to violent crime and abuse, which can hamper the cognitive, social, and emotional development of the child and increase the risk to poverty in adulthood (Brooks-Gunn and Duncan, 1997). This can further contribute to a cycle of chronic poverty if these children were more likely to in turn become the parents of children who will then also grow up in a context of poverty. In Table 6 we furthermore observe that most households, independent of their size, rely on a single-income earner. The working poor thus not only have to take care of an importantly higher number of dependents, but average labour market earnings are also much lower. In return, poverty tends to be a more temporary phenomenon for those with higher earnings from the labour market. Interestingly, in absolute terms, income from government grants is fairly stable across the population. This is, the group averages are relatively close to the overall average of R1,595 per household. While fairly constant in absolute terms (probably because of very broad access to old age pensions), 6
9 the importance of social grants in the lives of the poor evidently remains very significant. Specifically, half of those experiencing chronic poverty rely on government grants as the main source of income. The same holds for two thirds of those who persistently live below the food poverty line and frequently rely on grant income for survival. Unsurprisingly, those who are poor in multiple periods are also observed to be relatively more deprived in terms of their access to basic goods and services. As reported in Table 6, of the chronic poor, only 21 percent had access to electricity, flowing water, a flushable toilet and formal housing, while close to 77 percent of the never poor had access to all the above. In addition, nine in ten of those who did not experience poverty are urban dwellers as compared to four out of ten among the chronic poor. Despite many efforts to address the past, the spatial patterns of segregation remain visible in post-apartheid South Africa. Chronic poverty, and particularly chronic extreme poverty, is most dominant in the deep rural or traditional areas of the country, comprising traditional villages and communally-owned land, which includes those areas where the former homelands were located. Accordingly, chronic (extreme) poverty is over-proportionally concentrated KwaZulu-Natal, followed by the Eastern Cape, whereas those resilient to poverty predominantly live in Gauteng and the Western Cape. In Table 7 we explore the relationship between characteristics of the household head and poverty persistence. On average, respondents live in households where the head is close to 50 years old, which is about 20 years above the population average. Even though there does not seem to be a strong relationship between the age of the household head and poverty risks, we observe that those living in households with younger heads tend to face slightly higher volatility in consumption, more frequently moving in and out of poverty, whereas poverty tends to be of a more persistent nature the older the head of household. The higher average age of the household head among those living in chronic (extreme) poverty may likely be the result of processes of household formation, where adult children or grandchildren co-reside with (grant-)parents that receive the old-age pension, thus forming larger, intergenerational households (see Klasen and Woolard, 2009). Furthermore, those living in households with a female household head tend to be much more prone to chronic (extreme) poverty. This to an important extent reflects the higher incidence of poverty and vulnerability to poverty among single mothers, who are often the poorest of the poor. We observe that race remains strongly associated with the incidence and duration of poverty in South Africa, with the experience of chronic poverty, and particularly chronic extreme poverty, still being almost exclusively confined to the black African population (see Table 7). While eight in ten South Africans are black, only four in ten are stably nonpoor. This is, almost half of the black South African population will tend to experience at least one poverty spell over a 6 year period. In contrast, while one in ten South Africans are white, whites make up 40 percent of the non-poor. As one may expect, Table 7 reveals a strong relationship between the educational attainment of household heads and the incidence and persistence of poverty (similar patterns are observed when looking at individual education levels). Of those who did not experience a single poverty spell, 93 percent lived in households where the household head had attained at least some secondary schooling. Of these two thirds had either completed secondary education or even attained some or completed tertiary education. Particularly having attained some tertiary education appears to be importantly correlated with lower consumption volatility and poverty risks. This observation may in part result from the type of job accessible to those with higher levels of education, as detailed below. In turn, those who experienced higher volatility and multiple poverty spells on average lived in households where the head had not completed primarily schooling. Among the chronic poor, only 5 percent of the household heads had completed secondary education, whereas half of them had either no schooling or less than primary education complete. Table 7 highlights that those who remain stably out of poverty live in households where the head is more likely to actively participate in the labour market, and of those who participate, a substantially larger share is employed. For this group, only 26 percent of household heads are economically inactive, unemployment is at around 5 percent, and 69 percent are in employment. By contrast, more than half of those living in chronic poverty have an economically 7
10 inactive household head, of which 40 percent are pensioners, and one in three live in households where the head is working. Furthermore, when assessing the quality of employment among those with a working head, we observe that the incidence and persistence of poverty is higher, the more insecure the type of employment of the household head. Those who remain stably out of poverty, generally have a household head who is formally employed with a permanent work contract. In contrast, more precarious forms of work dominate among those in (extreme) chronic poverty. Here, half of the household heads are either self-employed in the informal sector, in casual employment or engage in subsistence farming (this is work on the own plot or food garden). Where the head works as an employee, the informal sector share is large, while the share of permanent work contracts and union coverage are low Modelling poverty transitions and testing for true state dependence In this section, we more closely examine the factors that correlate with the risks to poverty, taking the initial poverty status explicitly into consideration. 7 Regressions are fitted to the pooled sample of wave-to-wave transitions Regression analysis of transitions into and out of poverty Table 8 to Table 10 report the average marginal effects of a probit regression where the dependent variable is the individual poverty status at time t. This is, the dependent variable takes on a value of 1 if an individual is classified as poor at time t, and zero otherwise. The explanatory variables include a wide range of characteristics of the household that the individual lived in at time t-1. This is, all explanatory variables were measured with a time lag (i.e. prior to a potential poverty transition) and, in line with most of the poverty modelling literature, are thus assumed to be pre-determined. For this very reason, variables summarizing the occurrence of economic shocks or other types of trigger events are not used in this specification. Their association with transitions into or out of poverty will be assessed in section 6. There are good reasons to believe that households that experienced poverty in the past face a higher risk to experience poverty in the future. Therefore, we present two sets of estimates, depending on the poverty status in the initial period. The first (second) column of each set shows the marginal effect of a change in the respective characteristics of the household on the probability of poverty persistence (entry), which is the likelihood of being poor in the current survey wave for someone who was poor (non-poor) in the past survey wave (two years ago). It is important to note that poverty persistence and poverty entry are mutually exclusive events. This implies that any variable that is estimated to increase (reduce) the likelihood of poverty persistence, will automatically reduce (increase) the chances of poverty exit to exactly the same extent. The same logic applies to the estimated chances of poverty entry as opposed to resilience to poverty. Our findings for the baseline specification reported in Table 8 indicate that the risk of falling into poverty for those living in initially non-poor households decreases with the age of the household head. Members of female headed households are on average up to ten percent more likely to slip into poverty and two percent less likely to escape poverty than members of households where the head is male. Complementing the descriptive profile offered in section 4, we observe that race remains a strong predictor of poverty in South Africa, with black Africans being at the highest risk of being poor. In comparison, whites are 25.1 percent less likely to fall into poverty and more than 50 percent less likely to remain poor, even after controlling for differences in education. 6 Note that in South Africa, both subsistence agriculture and the informal sector are very small compared to most countries in the developing world (see Seekings and Nattrass, 2005, Chapter 3 for an historical assessment). 7 Note that all regressions presented in this section have been weighted using the panel weights for the sample of wave-to-wave transitions (see section 2). 8
11 Higher levels of education of the household head are strong predictors for a lower vulnerability to poverty. Especially living in a household where the head has attained some tertiary education reduces the average risk to poverty by about 30 percent compared to those living in households where the head has no schooling. The effect of primary and secondary schooling by contrast differs considerable between initially poor versus non-poor households. Specifically, those living in households where the head has attained at least some secondary education are on average 4 percent less likely to remain poor, whereas the risk of falling into poverty is reduced by 17.1 percent. For those where the head has completed secondary schooling, the average poverty risk is reduced by 9.8 percent if initially poor and 26.2 percent if initially non-poor. Primary schooling of the household head is associated with a 6.9 percent lower average risk of falling into poverty compared to those with no schooling, whereas there is hardly any statistically significant difference with respect to the likelihood to remain in poverty. This divide in the marginal effect of education for initially poor versus non-poor households may be explained by a number of factors. For example, poverty may lead to a depreciation of human capital and employment skills, causing low-pay or unemployment spells and thus increasing the duration spent in poverty. We can also imagine that there is a difference in the quality of education between those observed to be poor versus non-poor. Lastly, there may be a sorting effect to the extent that those with higher ability or better motivation at the same level of education tend to be overrepresented in the non-poor group. We will return to this discussion in the next section that aims to disentangle the effects of true state dependence and unobserved heterogeneity. With respect to the household composition, the presence of economically dependent household members goes in line with an elevated vulnerability to poverty. The number of employed household members by contrast has an important vulnerability reducing effect that though is smaller for the initially poor than the non-poor. In addition to the explanations suggested earlier, we may imagine that being poor can bring difficulties in finding good quality jobs, for example through social network effects, reducing in turn the probability of exiting poverty. We find that individuals living in households reporting government grants as their main source of income (as compared to labour market income) face an elevated risk to poverty. A similar result would have been obtained when controlling for the share of grant income in total household income, or when controlling for the (change in) receipt of specific types of grants (state old age pension, disability, child support, foster care, and care dependency grant). Three main factors may explain this apparently counterintuitive finding: First, household that are at higher risk to poverty (or just became eligible due to some negative economic shock) are more likely to receive grants. Unfortunately, operationalizing the eligibility criteria in detail (varying by grant type, over time, and between single and married recipients) to disentangle this effect is not straight forward in NIDS and would go beyond the scope of this paper. Second, as the previous section has mentioned, some evidence suggests that household formation responses may play a role. Specifically, Klasen and Woolard (2009) argue that state transfers (particularly noncontributory old age pensions) take on the function of a private safety net in South Africa, and may attract additional dependents to the households. Third, previous research has suggested that grants have reduced the depth and severity of poverty in South Africa (Leibbrandt et al., 2010), but not the incidence. Because our model is only sensitive to transitions around the poverty line, we cannot capture improvements at lower levels of income. In terms of geographic patterns, having access to basic services is associated with a five percent lower vulnerability to poverty. We observe that for the initially non-poor, the risk to falling into poverty is about seven percent lower in urban than in traditional areas, whereas the chances to escape poverty are not significantly different between regions. Everything else being equal, mobility out of poverty and especially mobility into poverty appear highest in the Western Cape (although the difference in not statistically significant for all provinces). Poverty persistence is on average highest in KwaZulu-Natal, followed by the Eastern Cape. Here, ceteris paribus, both movements into and out of poverty are comparatively infrequent, which may on the one hand indicate lower volatility, but on the other can also stand for a more rigid social structure. 9
12 Controlling for the time horizon under study, we find that risks of remaining in or falling into poverty were ceteris paribus higher between wave 1 and wave 2 (2008 to 2010/11) than between wave 2 and wave 3 (2010/11 to 2012) or wave 3 and wave 4 (2012 to 2014/15). When running the regression separately for the three sub-periods (2008 to 2010/11, 2010/11 to 2012 and 2012 to 2014/15), we observe that the signs of the estimated effects are largely consistent, but the effect sizes tends to vary across periods (though not always establishing any clear trend). In Table 9 we augment the model by gradually adding controls for the labour market status of the household head. 8 Controls for the province of each household and the time period are included but not reported. The estimated average marginal effects for the set of variables capturing the head s demographic characteristics and the composition of the household closely resemble the results reported above. In addition, we find that for the non-poor having an older household head generally tends to be associated with a more stable socio-economic position, such that non-poor people living in households with older heads face a lower risk to falling into poverty. With respect to the labour market controls, we estimate that persons living in a household where the head is unemployed face a similar risk to poverty as those with an economically inactive head. However, having a working head not necessarily goes line with a lower vulnerability to poverty. The effect rather seems to crucially depend on the type of employment that the head engages in, especially with regard to its stability and duration. Everything else being equal, we find that members of households where the head engages in subsistence farming are just as vulnerable to poverty as those where the head is inactive or unemployed. Those living in households where the head is casually employed or helps other people with their business are on average 3.8 percent more likely to remain poor than those with inactive heads. More substantial is yet the difference among the presently non-poor, where such an unstable job position of the household head is associated with an 18 percent higher risk of falling into poverty, thus constituting an important vulnerability factor. Self-employment of the household head can provide an avenue out of poverty. However, while self-employment of the household head in the informal sector is associated with a two percent higher chance of poverty exit, those living in households where the head runs a formal sector business (registered for income tax and/or VAT) face an 11.3 percent higher chance of making it out of poverty (see column (2)). Similarly, among the non-poor, self-employment of the household head in the informal or the formal sector is respectively associated with a six or 12 percent lower risk of poverty entry. Member of households where the head works as an employee on average face a 3.1 percent lower risk to remain in poverty and 3.9 percent lower risk to transition into poverty. The effect is however mainly driven by those who have a permanent work contract, which is associated with an about five percent lower vulnerability to poverty. By contrast, for those with a temporary work contract or with a contract of unspecified duration, the effect is not statistically significant (see column (3)). Among the non-poor, the strongest effect is estimated for those where the head is a member of a trade union, which can be related to a 7.8 percent lower risk of slipping into poverty (see column (4)). This effect is likely explained by higher wages and higher job security associated with union membership. In Table 10 we take a yet closer look at the type of employment that household heads who work as employees engage in. We find that members of households where the head is employed in the service sector (see column (2)) especially in higher skilled occupations, such as professionals, technicians, or clerical support workers (see column (1)) are considerably less vulnerable to poverty. In particular, this applies to jobs in electricity gas and water supply, as well as community, social and personal services, where public sector employment tends to be an important contributor. In fact, we find a strong and significant relation between the average share of employment in the public sector and reduced poverty risks (see column (3)). 9 In addition, mining sector jobs are on average 8 Note that in this specification we need to drop the controls for having grant versus labor market earnings as the main source of income. The effect of employment on the risk to poverty is captured by the controls for the employment status of the household head as well as the control for the total number of workers in the household. 9 Public sector employment is not reported in NIDS. The sector level shares have therefore been calculated from the Quarterly Labor Force Surveys (QLFS) by sub-period (2008, 2010/11, 2012, 2014/15) and imputed to NIDS data. 10
13 associated with a 15.6 percent lower chance of remaining poor and 11.4 percent lower risk of falling into poverty. By contrast, households with head working in agriculture generally face a higher vulnerability to poverty Robustness checks In this section, we perform three sets of checks to assess the robustness of our results. First, we run the regression model reported in Table 10 column (3) on three different subsamples: (i) members of households where the household head is black 10, (ii) respondents successfully interviewed in all four waves (strictly balanced panel), and (iii) households heads only (see Table A.1 in the Appendix). The estimated effects show the same sign as in the specification using the full sample and effect sizes are comparable. Second, we add a set of individual-level controls to the regression model in order to account for the fact that some household members may be more likely to escape (or fall into) poverty by moving to a different household. Also in this specification, the estimated effects of characteristics at the level of the household/ household head are very close to the model estimated without individual-level controls. In addition, we find that female respondents, ceteris paribus, face a higher risk to enter poverty and have lower chances to exit poverty than males. Everything else being equal, better educated individuals are at lower risk to poverty, even though the level of education of the household head tends to be the more important determinant (see Table A.2 in the Appendix). By specifying the current poverty status to be a function of the realised discrete poverty outcome in the last period (following a standard approach pioneered by Heckman, 1981b), we allow the impact of the variables that explain current poverty to vary conditional on whether the individual or household was initially poor or not. This way, the specification provides estimates for both poverty persistence and entry rates. Third, following an approach developed by Cappellari and Jenkins (2002, 2004, and 2008) drawing on Stewart and Staffield (1999), a multivariate probit regression framework is used that jointly estimates a system of three equations, including (1) a first-order Markov process of poverty transitions between two consecutive panel waves, t 1 and t, (2) the poverty status at t 1 (in order to account for potential endogeneity of initial conditions), and (3) an equation for sample retention (to consider potential non-random attrition), allowing free correlation between the unobservables affecting each of these three processes. 11 We find that effect sizes tend to be slightly overestimated in the split sample regression presented above given that the estimated effects pick up both, the effects on the initial and current poverty status and should thus be interpreted as an upper bound. However, the coefficient estimates for most covariates from the split sample regressions fall within the 95-percent confidence interval of the coefficient estimates form the multivariate regression analysis (see Table A.3 in the Appendix). 10 Note that the race of the household head and other household members generally coincide (correlation coefficient of 0.98). 11 Controlling for the observed and unobserved determinants of initial poverty status is important in presence of state dependence; this is, if there are reasons to believe that households who have experienced poverty in the past face a higher risk to experience poverty in the future (Heckman 1981a) for example due to a poverty- or risk-related change in behaviour, constraints relevant for future choices, the depreciation of human capital, and alike. The need to control for unobserved heterogeneity in this respect results from the fact that individuals or households with more favourable characteristics will tend to leave poverty earlier (Heckman 1981a). In practice, the initial poverty status can hardly be considered exogenous. In other words, those who are observed to be poor in the first wave of data tend to be a non-random sample of the population, given that individuals with a higher tendency to remain permanently poor are likely to be overrepresented in the sample (Cappellari and Jenkins 2004; 2008). In addition, endogenous selection may occur with regard to the sub-sample of individuals for whom the poverty status is observed at two consecutive points in time. 11
14 6. Qualitative insights into poverty dynamics [Note that our analysis of qualitative data is ongoing. The results in this section are incomplete and at an early stage of analysis. Because of this, the full triangulation of our quantitative and qualitative data is yet to be fully undertaken] While the analysis of NIDS panel data allows us to reveal a number of important findings regarding the patterns and determinants of poverty persistence and transitions, it is important to acknowledge the limitations of a purely quantitative analysis investigating vulnerability and poverty dynamics. First, as a panel which follows individuals not households, NIDS is not well equipped to illuminate the mechanisms determining the relationship between changes in household composition and poverty transitions. Since consumption is measured at the household level and is simply divided by household size to derive the per capita consumption measure used for poverty classification, the addition or loss of household members has a mechanical effect on observed poverty incidence. This mechanical effect on consumption measurement imperfectly captures the true welfare effect of demographic events such as births and deaths. The dissolution and formation of new households further complicates the inter-temporal measurement of consumption. Second, NIDS contains scant information on the strategies that the poor use to cope in the face of economic adversity. For example, understanding how households draw on social networks to smooth income by negotiating distributional claims from their neighbours, friends, and family is a central part of the livelihood strategies of the poor. This may take forms that are not easily observed in quantitative data such as the migration of a household member to provide care work in another household which in turn allows another household member to take up work. The relationship between formal social assistance (in the form of cash grants, for example) and informal coping strategies remains obscure in survey data such as NIDS. Third, since NIDS only began collecting data in 2008, analysing both longer term welfare trajectories as well as temporary, between-wave welfare fluctuations remains beyond reach. If longer term trajectories also are important in determining the welfare impact of shocks in the short-term, not being able to observe these more structural trends may compromise the quantitative analysis of poverty dynamics (Davis, 2011). This is especially the case in the quantitative analysis above, where we pool wave-to-wave transitions, thus allowing us to analyse changes only within two-year time frames. Further, missing out on observing between-wave fluctuation also may mean that an analysis of NIDS data underestimates the extent of mobility. Fortunately, a rich qualitative and mixed-methods literature exists which has been able to shed light on the complex determinants of household dynamics and the role of social capital in determining economic resilience. Adato et al (2006;2007) combine qualitative methods with KwaZulu-Natal panel data to explore the role of social capital in determining resilience to poverty and upward mobility. They find that social capital tends to smooth consumption and stabilise welfare, thereby preventing downward mobility, rather than providing a mechanism for promoting upward mobility. Similarly, Du Toit and Neves (2006; 2007a; 2007b; 2009; 2014) investigate the determinants of economic vulnerability and chronic poverty in Cape Town townships and in rural Transkei. They use qualitative data to explore the role that migrant networks, which link informal and formal economic activities and rural and urban spaces, work to enable hybrid livelihood profiles, which allow the poor to survive, alleviate poverty and reduce vulnerability by allowing costs and resources, opportunities and shocks to be shared and redistributed (2009:1). Like Adato et al (2006, 2007), they find that extended household networks bridging urban/rural, formal/informal divides work in complex and conflicted ways to redistribute scarce resources within and between households, to smooth consumption and mitigate risks. 12
15 According to Kanbur (2003), there is a broad consensus regarding the relative strengths (and weaknesses) of qualitative and quantitative data, without, however a concomitant clarity regarding how to draw on the respective strengths in such a way that the complementarities can be fruitfully exploited. 12 The challenge in applying mixedmethods research is to be able to exploit the advantages of qualitative and quantitative data in such a way that the value of the research output is greater than the sum of its qualitative and quantitative parts. In other words, mixedmethods research should use the qualitative element to add value to the quantitative element, and vice versa. To achieve this synergistic objective, a sampling strategy was designed to select a sample for the qualitative study which can be identified as similar enough in relevant respects to certain categories of respondents in the NIDS sample that the benefits of qual-quant mixing still apply. 13 A very short survey was used for the purpose of selecting participants based on a crude wealth-ranking exercise. Following this first step, a longer survey questionnaire, which mimics the NIDS questionnaire in such a way that the comparability between this study s sample and the NIDS survey is guaranteed for the variables which were most important in the quantitative analyses in the preceding sections, was designed and implemented. This questionnaire focussed on labour market insertion, self-employment, household composition, remittance and grant income, living standards, and included a greatly expanded shock module 14 (relative to NIDS). While this questionnaire was not administered to a sample large enough to be used as a valuable source for statistical analysis alone, its value to this project consists in its utility in nesting the qualitative within the quantitative analysis Site selection Field research was undertaken in Khayelitsha, a young, large, and rapidly growing township about 20 kilometres from Cape Town s city centre. Khayelitsha was established by the apartheid government in 1985 as a site for relocations from other, overcrowded African townships in Cape Town primarily Crossroads. Khayelitsha grew rapidly, and growth was accelerated in 1987 when pass laws, which restricted the movement of Africans to urban centres, were abolished in According to the 2011 Census, the population of Khayelitsha was 392,000 making it South Africa s second largest township after Soweto. Figure 2 illustrates the rapid growth of Khayelitsha in the period between 1984 and Khayelitsha s demographic profile has a high share of young people and is largely made up of rural to urban migrants almost all of whom are from the Eastern Cape. Khayelitsha has high levels of income poverty and is facing serious challenges in education, crime, employment, housing, sanitation, service delivery and substance abuse. According to 2011 Census data, only 36 percent of residents above the age of 20 have completed high school, only 62 percent of the labour force is employed, and 55 percent of households live in informal dwellings (Census, 2011). 12 According to Kanbur, the strengths of quantitative methods for poverty research are: i) the possibility of aggregation, ii) possibility of measuring the reliability of results, and iii) exploiting leverage in policy debates. The strengths of qualitative methods for poverty research are: i) a richer definition of poverty, ii) insight into causal processes, and superior accuracy and depth in answering certain questions. In brief, the difference between the two can be distilled by understanding that quantitative methods provide breadth of information, while qualitative methods provide depth of information. 13 Unfortunately, households from the NIDS panel could not participate in the qualitative analysis. NIDS has stringent ethical standards regarding anonymity of respondents, and as an ongoing nationally representative panel, has an interest in not allowing qualitative follow-up interviews for fear of introducing attrition bias. 14 This shock module was a structural form model of shock identification, loosely based on the model discussed by De Weerdt, in which respondents are taken through a list of shocks and asked whether they have experienced each given shock (2008). The questionnaire expanded on De Weerdt s model, and probed for coping mechanisms and the interactions between shocks. In this shock module respondents were asked about shocks which occurred in the last five years thus focussing on short and medium term fluctuations. 13
16 However, these aggregate statistics obscure the extent of socio-economic diversity within Khayelitsha. Many residents of wealthier areas such as Ilitha Park, Khwezi Park and Bonghweni are unambiguous candidates for belonging to an African middle class and act and spend the part, with their high-walls, guard dogs, private security, satellite television, and their reputation, amongst other residents, for being stuck up. In other areas, it is not uncommon to see a well-maintained formal house with new furniture, tiled floors and a plasma television next door to a one room shack, making within-street inequality much more clearly visible than it is in Cape Town s wealthier suburbs. In addition to the advantage of displaying a considerable degree of socio-economic heterogeneity, Khayelitsha was also selected as a study site because of its urban character. As shown in the sections above, chronic poverty is a predominantly rural phenomenon, while the major share of churning around the poverty line is predominantly concentrated in urban areas. In order to focus our qualitative research on the latter, we chose to select an impoverished urban area for study. Our guiding assumption that Khayelitsha was a site of considerable economic mobility and instability was confirmed during the course of our fieldwork. In selecting areas within Khayelitsha to conduct interviews, we took care to develop a sampling frame which could ensure that our sample represented the socio-economic diversity within Khayelitsha and could thus allow us, even without making claims of representivity, to meaningfully interpret the study results within the broader quantitative analysis. The maps in Figure 3 illustrate how Census data was used, at the small area, sub-ward council level to select areas within Khayelitsha to sample households. Using this data and maps such as those reproduced below, data was collected in areas which ensured a basic degree of diversity in terms of educational attainment, poverty status, concentration of informal housing, concentration of rural to urban migrants, household size, and labour market insertion. While this sampling strategy provided a guideline to the selection of areas, the input of field researchers, who live in Khayelitsha, was also invaluable Field research methods In addition to the two surveys which we administered (described above), field research consisted of focus group discussions and (FGDs) and life-history interviews (LHSs). FGDs were held with groups which were selected from the sample collected in the first survey round. FGDs ranged from between 3 to 10 participants. Some groups were single gender, and others were mixed. Discussions lasted about two hours each, and were conducted in isixhosa. The purpose of these group discussions was two-fold: First, using visual aids in the form of four boxes arranged in ascendant order from 4 (lowest box) to 1 (highest box), participants were prompted to discuss what it meant for someone to be in each respective box, representing different levels of society. Second, participants were prompted to discuss what determines movements between boxes both upward and downward. In both elements of the discussion defining the boxes and discussing dynamics participants drew on their own experiences and the experiences of people known personally to them. This proved to be an exercise which produced rich insights into the determinants of transitions, the nature of risk faced by the urban poor, and the role of social networks in causing and preventing downward mobility as well as facilitating upward mobility. In addition, these insights are used to improve the design of the longer structured survey (discussed above). Importantly, the insights from these discussions allow us to undertake meaningful comparisons between our qualitative data and the quantitative analysis of poverty dynamics conducted above. The latter is anchored around analysing transitions across a basic needs poverty line, which is not directly observable in out qualitative research. 14
17 Therefore, being able to converge upon a common understanding of what it means to be in box one, two, three or four, and incorporating these categories in our qualitative research allows us to triangulate our quantitative findings on the determinants on poverty transitions and our qualitative findings on the determinants of box transitions. The most common characteristics of the various boxes which were converged upon in the FGDs are the following: Box 1: Those in box one are the economic success stories of the township. They are either successful entrepreneurs in the community taxi and tavern owners are especially prominent or are stably employed in permanent and well-paid work for the government or in the private sector. The children of those in box one are educated, employed and/or married and live on their own. Box 2: Those in box two are neither poor nor wealthy. They are employed, usually in a lower-level white collar occupation. Compared to those in box one, they tend to face the need to support a larger number of dependents, which may also include members of the extended family. Box 3: Those in box three are considered to be poor. They have their most elementary needs such as food and electricity satisfied, but still need to economise a lot. They cannot put any money to the side since all income is consumed. Considering the preceding quantitative analysis, they may match closest with those households falling below the UBPL. They tend to derive income from the labour market, but are typically in jobs that are poorly paid, of limited duration, unregulated by labour legislation, or subject to seasonal fluctuations. This boy may also include smaller households that have access to an old age pension or disability grant. Box 4: Those in box four have repeatedly been characterised as going to sleep on an empty stomach, which most close matches with our understanding of households falling below the FPL. They typically have no access to income from the labour market but survive off child support grants and/or support from others in the community, including food donations by neighbours. Some eke out a living from survivalist forms of self-employment and/or do ad hoc piece jobs. These people live hand-to-mouth. They have few assets, live in informal dwellings, and might not even be able to afford electricity. Having conducted these FGDs and having arrived at a definition of economic stratification as described above, we undertook the primary element of our field research, which consisted of semi-structured life-history interviews. Our methods drew partly from the life-history interview techniques used by Davis (2011) in rural Bangladesh and partly from Adato et al s (2007) household events mapping technique used in rural KwaZulu-Natal. Both Adato et al (2007) and Davis (2011) s interviewing techniques follow a similar structure, and have similar aims, with the notable difference that Adato et al focus on the household as the unit of analysis, while Davis (like us) focusses on the respondent s own life history. In both methodologies, the respondent/household recounts the individual s/household s history, with a focus on major events and processes which determined the well-being of the individual / household members. Both approaches make use of a large sheet of blank paper, on which major events, processes and coping strategies are mapped chronologically. In addition to the x-axis representing time, Davis also incorporated a y-axis representing well-being. This allows the interviewer and interviewees to trace together the fluctuations of well-being over time and to link these fluctuations to their determinants as depicted in Figure Preliminary results Our qualitative field research largely confirms, while adding explanatory depth, the patterns and determinants of dynamics discussed in the NIDS-based analysis in the above sections. It should be stressed that our qualitative research, because of being concentrated in an urban environment, is best able to illuminate the casual mechanisms 15
18 determining welfare fluctuations at, or below, the poverty line. It is not a useful tool for understanding low-level chronic poverty, which is a predominantly rural phenomenon. In what follows, we focus our analysis on two broad families of transition determinants which were confirmed to be most important in the quantitative analysis: demographic and labour market determinants of transitions. There is a cost to this differentiation: A major insight from the qualitative data was in coming to understand that large welfare fluctuations were usually caused by interacting casual processes. Labour market and demographic events often interacted in complex ways to cause/off-set welfare fluctuations. For this reason, these categories will inevitably overlap, and ought to be considered somewhat fluid Demographic determinants of transitions Among demographic determinants of transitions, we include births and deaths of household members as well as the in- and out- migration of members of a household. In our analysis of NIDS panel data, we find that household size is a strong predictor of poverty and vulnerability to poverty. Consequently, births and deaths can function as trigger events, which are associated with descents into poverty. These conclusions are confirmed in the qualitative data we collected. In FGDs, participants affirmed that not having dependants is an enabling condition for economic security and upward mobility, allowing adult household members to accumulate capital, minimise risk and engage in profitable self-employment. In our analysis of NIDS data, the large marginal effect that children have on poverty status and vulnerability to poverty might, however, obscure the casual mechanisms by means of which children affect household well-being. In our quantitative analysis, increasing household size has a mechanical effect on per capita consumption by increasing the denominator in the household consumption per capita equation. However, we have little evidence from our qualitative research that the consumption burden of children is large enough to have a welfare impact, after taking into account the increased income through the receipt of a child support grant. Rather, it seems that children have a lagged effect on household well-being. This lagged effect occurs through two core mechanisms: First, ceremonial expenses for the initiation (circumcision ritual) of male children in Xhosa culture can be exorbitant. Financing these ceremonies requires saving and borrowing such that an attempt is made at smoothing the consumption burden both before and after the event. Second, children represent a source of considerable risk. This risk is linked closely to the issues of substance and alcohol abuse, which dramatically increase the burden of dependency, either through increased drug/alcohol consumption or through the household accumulating debts through a child s recklessness and/or criminal activities. Having educated, employed and/or married children was seen to reduce this dependent-associated risk. Thus, while the qualitative analysis confirms that children do have an impact on determining transitions into poverty and constraining upward mobility, this operates according to a different mechanism to that which is suggested by the quantitative analysis. The experience of a death in a household is a strong predictor of poverty entry or persistence. Again, in a quantitative analysis the true impact of a death on household well-being is potentially underestimated: Losing a household member has a mechanical effect on observed per capita consumption, which might off-set the true economic impact of experiencing a death in the household. Using data from LHIs we are able to reveal rich insights into the complex ways households coped with death shocks. 16
19 The heterogeneity regarding the severity of the impact of death shocks on different households in our sample was striking. Some households, despite having experienced multiple deaths in short succession, were able to cope effectively to maintain a stable standard of living, while for other households a single death could be devastating and plunge it into deep (food) poverty. It appears that the interaction between three key variables jointly determine the severity of the impact of a death shock. First, in a context in which funeral rituals are exorbitantly expensive, whether or not a household has funeral insurance is fundamental in determining how large the short term economic shock is. Second, strong social networks appear to be critical in mitigating the cost both economic and non-economic that death has on a household. Third, whether or not the deceased was a wage-earner or a pension recipient determines the longer-term impact of death on a household, and may mean the difference between a sustained fall into poverty and a temporary dip. For those households which experienced a death of a wage/pension recipient without strong social networks and/or funeral insurance, the descent into poverty was sustained. Those who could draw upon strong social networks and who belonged to burial societies often were able to smooth consumption effectively. Box 1: How Vivian s household dealt effectively with successive deaths Vivian is an elderly domestic worker living with her sister and aunt in Makhaza, Khayelitsha. Vivian s household has experienced several traumatic deaths in the last twenty years. In the late 1990s, the household was affected by three deaths (both her parents and her brother) in short succession, and more recently by the murder of two nephews. However, a number of factors combined to ensure that these deaths did not affect the family economically: 1. Vivian is the breadwinner of the household and her income was unaffected. 2. Membership of burial schemes minimised the immediate cost of funeral expenses 3. The extended family united in solidarity to ensure that costs were shared. Because of this, these deaths did not have a large effect on household well-being. Box 2: How Khanya s household was affected by the death of her mother Khanya is a young woman living with her grandmother and children in a small shack in Site B, Khayelitsha. She is unemployed and looking for work. At present, her household subsists almost entirely on income from state child support grants and old age pensions. The passing of Khanya s mother in 2014 represented an enormous shock for this household. Although her mother was insured in a burial scheme, because this person was the only source of income for the family, her death had a profound impact on the well-being of the family. Extended family members have not been able to provide assistance, and no one in the family has been able to step up and fill the deceased s role as the breadwinner, with the result that the household struggles to afford even its most basic needs, such as food and electricity. In the event of another negative shock, the family has no means of coping. Interpreting qualitative evidence on the impact of births and deaths on household well-being does not come without its own set of challenges. The emotions associated with deaths might lead to an overestimation of their economic impact or at least make a death shock more likely to be listed as a negative event. Births, on the other hand, are perceived as positive household events, and the negative long-run economic impact is consequently downplayed. The provision of child support grants also softens the immediate economic impact of a birth, potentially making it even less likely that a birth is identified as a burdensome economic event. While the costs and risks associated with child dependents was understood clearly by our participants, because this burden is more a result of a life-course process, the negative impact of adding a dependant to a household was almost never associated with a birth Labour market determinants of transitions As emerges clearly from our analysis of NIDS data, a qualitative perspective confirms that labour market position is a crucial factor determining both current poverty status, as well as the likelihood of becoming poor, remaining poor, or 17
20 remaining non-poor. In addition, we were able to use out qualitative data to explore how events tied to the labour market determine poverty transitions. Again, it should be stressed that our field research revealed how difficult it is to disentangle causal mechanisms linked to the labour market from social networks, demographic events, and so on. Being able to understand labour market events as embedded in and interacting with other causal processes is a strength of qualitative research. The first thing worth noting is that the societal boxes defined in section 6.2 above are clearly distinct in terms of their labour market characteristics. The top two boxes boxes one and two are characterised by stable, formal work. Those in box three, on the other hand, while often employed, are incorporated on adverse terms. Their work is characterised as piece work short term, insecure, informal and unregulated. They appear just as likely to find formal employment (and potentially move out of poverty into box two) as they are to become unemployed (and potentially move into box four). There appears to be a high degree of churning between boxes three and four. Those in box four are at the bottom of the societal ladder by virtue of their exclusion from the labour market. This illustrates how fundamental a transition within the labour market can be in determining poverty entries and exits. However, episodes of unemployment for those in all boxes except box four seem to be of relatively short duration. Those who have worked in a formal job for a longer period generally find a new job much more easily, and hence have the luxury of being able to quit a job when unsatisfied. Even those employed in box three (especially younger workers without dependents) seem to quit unsatisfying work Box 3: Masande s employment history Masande is a young man living in a backyard shack behind his family s house in Makhaza, Khayelitsha. He was born in Khayelitsha, and has completed high-school. His spoken English is good. He has a child, but is estranged from the child s mother. Shortly after finishing school, his brother helped him find his first job at a petrol station. During this time Masande bagan drinking heavily and eventually decided to quit his job. In his words: I just got fed up doing the same thing over and over again. I had no responsibility, no child, so there was no reason to stay in an unpleasant job. After quitting the job at the petrol station he found work at a warehouse, but absconded after two weeks becasue the pay was low and the hours long. His next job was at a pharmacy, but the irregular hours meant that he was spending a large part of his (variable) income on expensive taxis taxis are the only form of transport available early in the morning and late at night. After quitting, he worked for a short while as a security guard, but the irregular hours also meant that not much of his income remained after transport expenses. After a few weeks he was fired for sleeping on the job. When his daughter was born he had been unemployed for over a year. The burden of supporting his daughter motivated him to find work again. As before, his (employed) brother helped him find work at the same petrol station from which he had quit. He has been working there for four months. frequently, only to find similar work after a short period of unemployment. This suggests that exit and entry costs are low, thereby increasing worker flows. The same, however, does not apply to those who are self-employed in the informal economy. Even when small businesses appear to be profitable for a period of time, when those in informal self-employment experience an economic shock, they seem to have a much harder time getting back on their feet. Because most of these microentrepreneurs do not have savings or insurance, they seldom have enough capital to start the same/a new business after a negative shock occurs, and hence often end up doing very unstable piece jobs. While formal jobs come with UIF and provident funds that help to buffer shocks, the self-employed cannot avail themselves of similar coping mechanisms. The interaction between social networks and the labour market is relevant in understanding how labour market events determine mobility patterns. It is unsurprising that social networks appear to facilitate upward mobility through lowering search costs and providing a pathway into employment. However, it also emerged strongly from 18
21 our field research that once employment is found, social networks lead to an increase in distributive demands being made on the wage-earner, thereby offsetting the ability to use employment as a means of achieving upward economic mobility. Social networks thus appear to play a dual role - both enabling and constraining upward mobility through the labour market. An implication of this is that the lack of covariate upward mobility constrains idiosyncratic upward mobility. 7. Conclusion Throughout the developing world, increasing attention is being paid to the dynamics of poverty. The proliferation of panel data in many developing countries has allowed researchers to investigate the extent of chronic poverty and to differentiate this from more transient experiences of poverty. In addition, the rise of a focus on poverty dynamics has led to investigation into the determinants of vulnerability to poverty even amongst the non-poor. These developments promise, in turn, to facilitate the more appropriate targeting of anti-poverty policy to address the specific demands of dealing with chronic and transient poverty respectively. Taking up this challenge in the South African context, in this paper, we have shown how a static, cross-sectional perspective in the analysis of poverty misses some important and policy relevant features of the experience of poverty. At its core, the dynamic analysis presented here reveals that poverty affects many more people in South Africa than a cross-sectional viewpoint would suggest. Specifically, while four out of ten South Africans persistently fall below the (upper bound) poverty line, eight out of ten find themselves in a situation of poverty at least once over the investigated six-year time period between 2008 and 2014/15. Understanding the extent of heterogeneity in the experience of poverty in South Africa can provide important information for policy-makers with respect to the design and targeting of anti-poverty policies. Our analysis shows that the chronic poor, understood as those who were poor in all four survey ways under study, are characterized by exceptionally low levels of human capital and financial assets as well as their geographical isolation from markets and employment opportunities. These characteristics make them unlikely candidates for fruitful integration into the productive economy in the short term. However, ensuring a basic degree of economic security and service provision for this group will be a necessary precondition for ensuring that their health, education and nutritional needs are met. In addition to the provision of basic services, cash transfers (currently in the form of pensions, disability grants and child support grants) are, for many of South Africa s chronic poor, an indispensable source of income which has the crucial advantage of being highly predictable and dependable (Dercon, 2001; Mkandawire, 2005). For the purpose of meeting the chronic poor s immediate basic needs as well as ensuring the basic stability required for the possibility of integration in the productive economy in the long term, social policy targeted towards this group would be most suitably focused on exploring models of effective redistribution. In addition to the chronic poor, a substantial portion of the population appears to be composed of households that are moving into and out of poverty over time. This high level of churning around the poverty line presents another complex policy challenge. These highly insecure households are especially in need of effective mechanisms to cope with economic vulnerability, and, compared to the chronic poor, are also more likely candidates for integration into the productive economy with the appropriate social policy interventions. This group is more urban, better educated and relies more heavily on income earned in the labour market than those experiencing poverty as a persistent state. Like the chronic poor, this group stands to benefit from a base level of stability provided by state social policy. However, this is not enough to keep them stably out of poverty. We show that the economic instability this group experiences is closely linked to their vulnerable position in the labour market. It is the transient poor and the vulnerable that would benefit most from employment growth and a policy focus on improving employment stability for workers in precarious forms of employment. In this regard, policymakers are likely to face an important trade-off 19
22 between flexible labour market arrangements to foster job creation, and the creation of fewer, but better and more stable jobs that will allow more South Africans to escape poverty over the longer term. 20
23 References Adato, M., Lund, F., & Mhlongo, P. (2007). Methodological innovations in research on the dynamics of poverty: A longitudinal study in KwaZulu-Natal, South Africa. World Development, 35(2), Adato, M., Carter, M. R., & May, J. (2006). Exploring poverty traps and social exclusion in South Africa using qualitative and quantitative data. The Journal of Development Studies, 42(2), Agüero, J., Carter, M. R., & May, J. (2007). Poverty and inequality in the first decade of South Africa's democracy: What can be learnt from panel data from KwaZulu-Natal?. Journal of African Economies, 16(5), Azomahou, T. T., & Yitbarek, E. A. (2015). Poverty persistence and informal risk management: Micro evidence from urban Ethiopia. UNU-MERIT Working Paper Series, , Maastricht: Maastricht Economic and social Research institute on Innovation and Technology (UNU-MERIT) & Maastricht Graduate School of Governance (MGSoG). Bane, M., & Ellwood, D. (1986). Slipping into and out of poverty: the dynamics of spells. Journal of Human Resources, 21(1), Bigsten, A., & Shimeles, A. (2004): Dynamics of poverty in Ethiopia, no. 2004/39. Research Paper, UNU-WIDER, United Nations University (UNU). Brooks-Gunn, J., & Duncan, G. J. (1997). The effects of poverty on children. The future of children, Cai, L., Creedy, J., & Kalb, G. (2006). Accounting for Population Ageing in Tax Microsimulation Modelling by Survey Reweighting. Australian Economic Papers 45, Calvo, C. & Dercon, S. (2009). Chronic Poverty and All That: The Measurement of Poverty over Time. In T. Addison, D. Hulme & R. Kanbur (Eds.), Poverty Dynamics: Interdisciplinary Perspectives (pp ). Oxford, Oxford University Press. Cafiero, C., & Vakis, R. (2006). Risk and Vulnerability Considerations in Poverty Analysis: Recent Advances and Future Directions, (Social Protection Discussion Paper 0610). Washington D.C.: The World Bank. Carter, M., & May, J., One Kind of Freedom: Poverty Dynamics in Post-apartheid South Africa. World Development, 29(12): Dercon, S. (2001). Assessing vulnerability. Publication of the Jesus College and CSAE, Department of Economics, Oxford University. Dercon, S. (2006). Vulnerability: A micro perspective. (QEH Working Paper Series, Working Paper No. 149). Oxford: Department of International Development, University of Oxford. Davis, P. (2011). Escaping poverty: patterns and causes of poverty exits in rural Bangladesh. (Working Paper 194). Bath, U.K.: Chronic Poverty Research Centre Davis, P., & Baulch, B. (2011). Parallel realities: exploring poverty dynamics using mixed methods in rural Bangladesh. The journal of development studies, 47(1), Du Toit, A., & Neves, D. (2006). Vulnerability and social protection at the margins of the formal economy: Case studies from Khayelitsha and the Eastern Cape. Institute for Poverty, Land and Agrarian Studies (PLAAS), USAID and Chronic Poverty Research Centre (CPRC). Du Toit, A. & David Neves (2014) The government of poverty and the arts of survival: mobile and recombinant strategies at the margins of the South African economy. The Journal of Peasant Studies, 41(5):
24 Du Toit, A. & Neves, D. (2007a). In search of South Africa s second economy : Chronic poverty, economic marginalization, and adverse incorporation in Mt Frere and Khayelitsha. (CPRC Working Paper 102). Cape Town, South Africa: Programme for Land and Agrarian Studies. Du Toit, A. & Neves, D. (2007b). Informal Social Protection in Post-Aparthied Migrant Networks: Vulnerability, Social Networks and Reciprocal Exchange in the Eastern and Western Cape, South Africa. (BWPI Working Paper 74). Cape Town, South Africa: Programme for Land and Agrarian Studies. Du Toit, A. & Neves, D. (2009). Trading on a Grant: Integrating Formal and Informal Social Protection in Post- Apartheid Migrant Networks. (BWPI Working Paper 75). Cape Town, South Africa: Programme for Land and Agrarian Studies. Faye, O., N. Islam, & Zulu, E. (2011). Poverty Dynamics in Nairobis Slums: Testing for True State Dependence and Heterogeneity Effects," CEPS/INSTEAD Working Paper, ( ). Finn, A., & Leibbrandt, M. (2016). The dynamics of poverty in the first four waves of NIDS. Cape Town: Southern Africa Labor and Development Research Unit (SALDRU), University of Cape Town. SALDRU Working Paper Number 174/ NIDS Discussion Paper 2016/1. Finn, A. (2014). A National Minimum Wage in the Context of the South African Labour Market. (National Minimum Wage Research Initiative at the University of the Witwatersrand, Working Paper 2015/1). Johannesburg: NMWRI, University of the Witwatersrand Finn, A. & Leibbrandt, M. (2013). The Dynamics of Poverty in the First Three Waves of NIDS. (SALDRU Working Paper 119/NIDS Discussion Paper 2013/1). Cape Town: SALDRU, University of Cape Town Foster, J. (2009). A Class of Chronic Poverty Measures. In T. Addison, D. Hulme & R. Kanbur (Eds.), Poverty Dynamics: Interdisciplinery Perspectives (pp ). Oxford, Oxford University Press. Glewwe, P., & Gibson, J. (2006). Analysis of poverty dynamics. Handbook of Poverty Statistics, Hoddinott, J. & Quisumbing, A., Methods for Microeconomic Risk and Vulnerability Assessments (Social Protection Discussion Paper Series, No. 0324) Washington D.C. The World Holzmann, R., Sherburne-Benz, L., & Tesliuc, E. (2003). Social risk management: The World Bank's approach to social protection in a globalizing world. Washington, DC: World Bank. Islam, N., & Shimeles, A. (2006. Poverty dynamics in Ethiopia: State dependence and transitory shocks," Essays on Labour Supply and Poverty: A Microeconometric Application. Department of Economics, Göteborg University. Jalan, J., & Ravallion, M. (1998). Transient poverty in post-reform rural China. Journal of Comparative Economics, 26(2), Jenkins, S Changing Fortunes: Income Mobility and Poverty Dynamics in Britain. Oxford: Oxford University Press. Kanbur, S. R. (Ed.). (2003). Q-squared, combining qualitative and quantitative methods in poverty appraisal. Orient Blackswan. Kedir, A. M., & McKay, A. (2005). Chronic poverty in urban Ethiopia: Panel data evidence. International Planning Studies, 10(1), Klasen, S., & Waibel, H. (Eds.) (2013). Vulnerability to Poverty: Theory, measurement and determinants, with case studies from Thailand and Vietnam. Palgrave Macmillan. Klasen, S., & Woolard, I. (2009). Surviving unemployment without state support: unemployment and household formation in South Africa. Journal of African economies, 18(1),
25 wave 1 (2008) Leibbrandt, M., I. Woolard, A. Finn, & Argent, J. (2010). Trends in South African Income Distribution and Poverty since the Fall of Apartheid, OECD Working Papers, No McDonough, P., & Berglund, P. (2003). Histories of poverty and self-rated health trajectories. Journal of Health and Social Behavior, Mkandawire, T., & United Nations Research Institute for Social Development. (2005). Targeting and universalism in poverty reduction. Geneva: United Nations Research Institute for Social Development. Pacifico, D., sreweight: A Stata command to reweight survey data to external totals. Stata Journal 14, Pacifico, D., REWEIGHT: The Stata command for survey reweighting (Center for the Analysis of Public Policies (CAPP) No. 0079). Universita di Modena e Reggio Emilia, Dipartimento di Economia Marco Biagi. Seekings, J., & Nattrass, N. (2005). Class, Race and Inequality in South Africa. New Haven and London: Yale University Press. StatsSA (2016). Quarterly Labour Force Survey, Quarter 3: Available: [31 January 2017] Stevens, A. H. (1994). The dynamics of poverty spells: Updating Bane and Ellwood. The American Economic Review, 84(2), Ward, P Transient Poverty, Poverty Dynamics, and Vulnerability to Poverty: An Empirical Analysis Using a Balanced Panel from Rural China. World Development. 78: Wittenberg, M., An introduction to maximum entropy and minimum cross-entropy estimation using Stata. Stata Journal 10, 315. Woolard, I., & Klasen, S. (2005). Determinants of income mobility and household poverty dynamics in South Africa. Journal of Development Studies, 41(5), Tables Table 1: Poverty rates (%) for South Africa, /15 Poverty Line (PL) / /15 Change /15 <Food PL (<R430) < Lower bound PL (<R629) <Upper bound PL (<R963) Growth rate (%) GDP per capita (StatsSA) Source: Author s calculations using NIDS waves 1 to 4. Growth rate (%) GDP per capita from official StatsSA statistics. Table 2: Poverty transition matrices for South Africa, /15 a) /11 wave 2 (2010/11) Poverty Line (PL) Food PL (<R430) Lower bound PL (<R629) Upper bound PL (<R963) Poor Non-Poor Poor Non-Poor Poor Non-Poor Poor Non-Poor b) 2010/ wave 3 (2012) Poverty Line (PL) Food PL (<R430) Lower bound PL (<R629) Upper bound PL (<R963) 23
26 t 1 (origi n) Wave 3 (2012) Wave 2 (2010/11) Wave 1 (2008) t-1 (origin) wave 3 (2012) Poor Non-Poor Poor Non-Poor Poor Non-Poor Poor wave 2 (2010/1 1) Non-Poor c) /15 wave 4 (2014/15) Poverty Line (PL) Food PL (<R430) Lower bound PL (<R629) Upper bound PL (<R963) Poor Non-Poor Poor Non-Poor Poor Non-Poor Poor Non-Poor d) Pooled t (destination) Poverty Line (PL) Food PL (<R430) Lower bound PL (<R629) Upper bound PL (<R963) Poor Non-Poor Poor Non-Poor Poor Non-Poor Poor Non-Poor Source: Author s calculations using NIDS waves 1 to 4 pooled panel of wave-to-wave transitions (weights corrected for panel attrition). Table 3: Extended poverty transition matrices for South Africa, /15 a) /11 Wave 2 (2010/11) Poverty Line <Food (extreme) Food - Lower Lower - Upper Upper Bound <R430 R430 - R629 R629 - R963 R963 Total <Food (extreme) Food - Lower Lower - Upper >Upper Bound b) 2010/ Wave 3 (2012) Poverty Line <Food (extreme) Food - Lower Lower - Upper Upper Bound <R430 R430 - R629 R629 - R963 R963 Total <Food (extreme) Food - Lower Lower - Upper >Upper Bound c) /15 Wave 4 (2014/15) Poverty Line <Food (extreme) Food - Lower Lower - Upper Upper Bound <R430 R430 - R629 R629 - R963 R963 Total <Food (extreme) Food - Lower Lower - Upper >Upper Bound d) Pooled t (destination) Poverty Line <Food (extreme) Food - Lower Lower - Upper Upper Bound <R430 R430 - R629 R629 - R963 R963 Total <Food (extreme) Food - Lower
27 Lower - Upper >Upper Bound Source: Author s calculations using NIDS waves 1 to 4 pooled panel of wave-to-wave transitions (weights corrected for panel attrition). Table 4: Chronic versus transient poverty components, /15 Lower bound poverty line (R629) 25 Upper bound poverty line (R963) / /15 Total / /15 Total Chronic poor (%) Transient poor (%) Source: Author s calculations using NIDS waves 1 to 4 balanced panel (weights corrected for panel attrition). Note: Following Jalan and Ravallion (1998), for each respondent, we calculate the intertemporal average of per capita household expenditure. The chronically (transient) poor are then identified as those who were observed to be poor in the respective period and for whom this permanent expenditure component (i.e., the intertemporal average) falls below (above) the respective poverty line. Table 5: Duration in poverty and contribution to poverty measures (upper bound poverty line), /15 # of waves Share in poverty headcount (%) Share in poverty gap (%) Share in poverty severity (%) in poverty / / / / / / to Source: Author s calculations using NIDS balanced panel for waves 1 to 4 (weights corrected for panel attrition). Table 6: Average household characteristics by number of waves the individual spent in poverty (balanced panel), /15 Never Sometime Poor (# of spells) Always Always Poor Poor Poor (FPL) Total # of respondents (balanced panel) 1,676 1,102 1,734 3,915 8,838 2,795 17,265 Weighted share of respondents (balanced panel) 22% 9% 10% 20% 39% 13% 100% Average household expenditure per capita 6,506 2,186 1, ,075 Average volatility (s.d. of changes in log expenditures) Average distance to UBPL (poor only) # of workers in HH # of members in HH Main source of income a Labor market income 82.9% 83.9% 68.0% 58.5% 41.9% 30.5% 60.8% Government grant income 3.7% 11.4% 23.3% 33.0% 52.4% 65.2% 31.0% Remittance income 1.8% 3.2% 4.7% 5.5% 3.9% 2.5% 3.8% Subsistence agricultural income 0.2% 0.1% 0.1% 0.3% 0.5% 0.4% 0.3% Investment income 11.1% 1.3% 3.0% 2.2% 1.1% 1.3% 3.8% Other income from government 0.3% 0.1% 0.8% 0.5% 0.2% 0.2% 0.3% Share of income derived from source Labor market income 79.3% 79.3% 62.5% 52.9% 37.5% 29.1% 61.7% Government grant income 5.5% 14.3% 28.1% 37.6% 54.4% 63.6% 27.6% Remittance income 2.4% 4.2% 5.7% 6.3% 5.7% 4.9% 5.9% Subsistence agricultural income 0.2% 0.2% 0.3% 0.6% 0.8% 0.8% 0.5% Investment income 12.1% 1.8% 2.8% 2.3% 1.4% 1.3% 3.7% Other income from government 0.1% 0.1% 0.1% 0.0% 0.1% 0.1% 0.7% Mean household income by income source (if non-zero) Labor market income 20,493 9,973 5,789 4,303 3,321 2,748 9,196 Government grant income 1,442 1,189 1,492 1,372 1,781 1,998 1,595 Remittance income 2,403 1,794 1,512 1,703 1, ,591 Subsistence agricultural income 1, Investment income 18,554 3,613 2,786 1,765 1,278 1,225 11,617 Other income from government 1,543 1,167 2,896 5,409 1,366 1,082 2,392 Access to services
28 House, cluster, town house 83.6% 76.8% 70.2% 69.1% 59.7% 50.8% 69.5% Tap water in house/on plot 96.9% 93.1% 81.9% 75.2% 58.4% 44.8% 75.8% Flush toilet in/outside house 95.1% 83.9% 65.7% 53.8% 31.9% 16.9% 58.3% Access to electricity 95.6% 92.1% 86.6% 86.5% 76.6% 68.8% 85.2% Combined (shelter/water/sanitation/electricity) 77.0% 63.7% 46.6% 37.1% 21.3% 9.5% 43.0% Geographic location b Urban 90.6% 81.4% 67.8% 58.9% 38.9% 21.9% 61.1% Traditional 5.3% 14.9% 26.2% 36.9% 56.3% 74.3% 34.4% Farms 4.1% 3.7% 6.0% 4.2% 4.8% 3.9% 4.6% Province Western Cape 17.7% 15.7% 12.1% 11.4% 6.1% 4.5% 11.2% Eastern Cape 7.2% 5.8% 10.6% 11.9% 17.8% 19.2% 12.5% Northern Cape 2.5% 3.4% 3.4% 2.5% 2.0% 0.6% 2.5% Free State 5.0% 6.2% 6.1% 5.9% 4.8% 3.6% 5.3% KwaZulu-Natal 16.1% 4.7% 13.1% 19.3% 28.1% 41.6% 20.1% North West 5.2% 8.5% 4.1% 5.2% 5.0% 4.7% 5.3% Gauteng 37.5% 38.1% 34.2% 23.4% 13.1% 3.1% 24.9% Mpumalanga 4.9% 6.8% 8.7% 9.9% 10.3% 9.5% 8.5% Limpopo 4.0% 10.9% 7.7% 10.4% 12.8% 13.1% 9.7% Source: Author s calculations using NIDS waves 1 to 4 balanced panel (weights corrected for panel attrition). Notes: a Imputed rental income has been excluded. Government grants include i) State old age pension, ii) Disability, iii) Child Support, iv) Foster Care, and v) Care dependency grant. Other income from government includes i) Unemployment Insurance Fund and ii) Workmen's compensation. Investment Income includes i) Interest/dividend income, ii) Rental income, and iii) Private pensions and annuities. b In line with the 2011 census, three settlement types are distinguished in NIDS: 1. Urban - A continuously built-up area that is established through cities, towns, townships, small towns, and hamlets. 2. Traditional - Communally-owned land under the jurisdiction of traditional leaders. Settlements within these areas are villages. 3. Farms - Land allocated for and used for commercial farming including the structures and infrastructure on it. Those parts of the country falling under the jurisdiction of traditional authorities (or traditional chiefs) are considered as rural, mainly due to their lack of infrastructure due to past legacy. 26
29 Table 7: Characteristics of the household head by number of waves the individual spent in poverty (balanced panel), /15 Never Transient Poor (# of spells) Always Always Poor Poor Poor (FPL) Total # of respondents (balanced panel) 1,676 1,102 1,734 3,915 8,838 2,795 17,265 Age Female 33.1% 45.5% 51.3% 58.0% 66.9% 70.6% 54.2% Race African 37.8% 78.2% 81.5% 89.7% 94.1% 97.2% 78.1% Colored 11.7% 15.7% 12.2% 8.7% 5.9% 2.8% 9.3% Asian/Indian 9.0% 0.4% 2.5% 1.5% 0.0% 0.0% 2.6% White 41.4% 5.7% 3.8% 0.0% 0.0% 0.0% 10.0% Education (average level if 25 years or older) No schooling 0.5% 6.6% 7.6% 16.8% 27.6% 37.7% 15.5% Less than primary completed (grades 1 to 6) 3.2% 12.6% 13.7% 24.0% 28.4% 29.3% 19.0% Primary completed (grade 7) 2.7% 7.1% 9.6% 9.0% 11.3% 10.4% 8.4% Secondary not completed (grades 8 to 11) 31.1% 39.0% 48.3% 39.2% 27.2% 19.9% 33.7% Secondary completed (grade 12) 23.5% 16.2% 11.8% 6.5% 4.4% 2.6% 10.9% Tertiary 38.9% 18.5% 9.1% 4.5% 1.1% 0.3% 12.6% Employment status Inactive 26.4% 26.6% 37.6% 43.7% 53.5% 58.8% 41.7% - of which share pensioners 31.2% 23.3% 41.4% 32.1% 39.9% 42.2% 36.2% Unemployed (discouraged) 1.2% 1.6% 2.6% 3.3% 3.1% 3.1% 2.6% Unemployed (strict) 3.5% 10.5% 9.7% 10.5% 11.8% 11.7% 9.4% Employed 68.8% 61.3% 50.2% 42.4% 31.6% 26.4% 46.3% - of which share with more than one activity 9.0% 8.3% 7.2% 7.5% 6.5% 6.0% 7.8% Employment type (if EMPLOYED) a Subsistence agriculture 0.6% 1.0% 2.4% 4.5% 9.5% 18.1% 4.0% Casual worker/ helping others 2.6% 4.8% 8.9% 9.6% 13.7% 13.4% 7.8% Self-employed 11.2% 12.7% 12.4% 17.9% 18.2% 18.3% 14.6% - of which share in formal sector b 53.4% 41.7% 8.3% 9.4% 3.9% 0.3% 21.4% Employee 85.6% 81.5% 76.2% 68.0% 58.6% 50.2% 73.6% - of which share in formal sector c 95.3% 82.8% 76.8% 69.7% 57.5% 46.3% 79.2% - of which share with permanent contract 80.1% 69.3% 60.1% 53.3% 42.9% 26.1% 64.0% - of which share member in trade union 53.2% 43.8% 36.1% 22.6% 17.5% 11.2% 37.1% Source: Author s calculations using NIDS waves 1 to 4 balanced panel (weights corrected for panel attrition). Notes: a The distinction of different types of employment (derived from the five questions that in combination are used to classify respondents as employed in NIDS): (i) employee, (ii) self-employed, (iii) casual employed/ help other people with their business, (iv) work on plot or food garden (subsistence farming). b For self-employed, formal businesses are registered for income tax &/or VAT. Casual workers/ helping others and subsistence farmers are classified as informal by definition. c For employees, formal employment is defined as either (i) having a written employment agreement, or (ii) medical aid deduction from salary, or (iii) pension/provident fund deduction from salary. 27
30 Table 8: Marginal effects for transitioning into and out of poverty, intertemporal comparison Probability of being poor in t (pooled) ( /11) (2010/ ) ( /15) Probit regression on split sample poor non-poor poor non-poor poor non-poor poor non-poor in t-1 in t-1 in t-1 in t-1 in t-1 in t-1 in t-1 in t-1 Characteristics of the household head (HoH) in t-1 HoH age *** *** * * HoH age squared (x0.01) ** HoH is female 0.019*** 0.104*** 0.013* 0.109*** *** 0.039*** 0.077*** HoH race group (base: African) Coloured *** 0.032** *** *** Asian/Indian *** *** *** *** *** *** 0.153*** *** White *** *** *** *** *** *** HoH level of education (base_no schooling) Less than primary completed (grades 1 to 6) *** *** *** Primary completed (grade 7) 0.015* *** *** *** 0.041*** Secondary not completed (grades 8 to 11) *** *** *** *** *** *** ** Secondary completed (grade 12) *** *** *** *** *** *** *** *** Tertiary *** *** *** *** *** *** *** *** Characteristics of the household (HH) in t-1 Composition of the HH No. of children (<18 years) 0.027*** 0.049*** 0.021*** 0.061*** 0.027*** 0.053*** 0.031*** 0.015** No. of members in working age (18-60 years) 0.010*** 0.033*** 0.008*** 0.022*** 0.009*** 0.060*** 0.009*** 0.043*** No. of elderly members (60+ years) *** *** * 0.124*** ** No. of employed members *** ** *** 0.023** *** *** *** Main source of income (base: Labour) Government grants 0.052*** 0.155*** 0.029*** 0.169*** 0.046*** 0.095*** 0.083*** 0.188*** Other income sources a ** 0.030*** 0.096*** Combined access to shelter/water/sanitation/electricity *** *** *** *** ** * *** Geographic location (base: traditional) Urban *** ** *** *** Farms 0.027*** ** Province fixed effects (base: Western Cape) Eastern Cape 0.036*** *** *** 0.039** *** *** Northern Cape ** ** * Free State *** 0.036** *** *** *** KwaZulu-Natal 0.044*** * 0.071*** 0.059* 0.068*** North West *** *** 0.032* *** Gauteng *** *** *** Mpumalanga 0.028*** *** *** 0.060*** * Limpopo 0.019* *** *** 0.064*** *** Time fixed effects (base: Wave 2) Wave *** *** Wave *** *** Log-likelihood -15,833-9,500-4,561-3,571-4,601-2,537-6,362-2,994 Model chi2 2,101 1, , , d.f Pseudo R Number of observations 49,174 15,370 14,965 5,093 15,790 4,326 18,394 5,951 Asymptotic standard errors are robust for the presence of repeated observations on the same individual. *** p<0.01, ** p<0.05, * p<0.1 Source: Author s calculations using NIDS waves 1 to 4 pooled panel of wave-to-wave transitions (probability weights corrected for panel attrition have been used in the regression analysis). Notes: a Imputed rental income has been excluded. Government grants include i) State old age pension, ii) Disability, iii) Child Support, iv) Foster Care, and v) Care dependency grant. Other income sources include i) Remittance income, ii) Subsistence agricultural income, iii) Investment income, and iv) Other income from government (compare Table 6). 28
31 Table 9: Marginal effects for transitioning into and out of poverty, labor market status Probability of being poor in t (1) (2) (3) (4) probit regression on split sample poor non-poor poor non-poor poor non-poor poor non-poor in t-1 in t-1 in t-1 in t-1 in t-1 in t-1 in t-1 in t-1 Characteristics of the household head (HoH) in t-1 HoH age *** *** *** *** HoH age squared (x0.01) * * HoH is female 0.026*** 0.098*** 0.022*** 0.097*** 0.023*** 0.095*** 0.023*** 0.092*** HoH race group (base: African) Coloured *** *** *** *** Asian/Indian *** *** *** *** *** *** *** *** White *** *** *** *** *** *** *** *** HoH level of education (base: no schooling) Less than primary completed (grades 1 to 6) *** *** *** *** Primary completed (grade 7) 0.018** *** 0.019** *** 0.018** *** 0.018** *** Secondary not completed (grades 8 to 11) *** *** *** *** *** *** *** *** Secondary completed (grade 12) *** *** *** *** *** *** *** *** Tertiary *** *** *** *** *** *** *** *** HoH employment status (base: inactive) a Unemployed (discouraged) Unemployed (strict) ** ** ** ** Subsistence farmer Casual worker/ helping others 0.038*** 0.180*** 0.037*** 0.179*** 0.038*** 0.179*** 0.038*** 0.178*** Self-employed ** * 0.059*** *** * 0.055** Self-employed # Formal b ** *** ** *** ** *** Employee *** *** Employee # Formal c *** Employee # Permanent contract *** *** *** Employee # Union member ** *** Characteristics of the household (HH) in t-1 Composition of the HH No. of children (<18 years) 0.032*** 0.054*** 0.032*** 0.054*** 0.032*** 0.054*** 0.032*** 0.053*** No. of members in working age (18-60 years) 0.009*** 0.044*** 0.009*** 0.044*** 0.009*** 0.044*** 0.009*** 0.044*** No. of elderly members (60+ years) 0.008* 0.082*** 0.008* 0.079*** 0.008* 0.079*** 0.008* 0.080*** No. of employed members *** *** *** *** *** *** *** *** Combined access to *** *** *** *** *** *** *** *** shelter/water/sanitation/electricity Geographic location (base: traditional) Urban *** * *** *** *** Farms 0.038*** 0.053** 0.036*** 0.053** 0.041*** 0.056** 0.039*** 0.044* Province fixed effects YES YES YES YES YES YES YES YES Time fixed effects YES YES YES YES YES YES YES YES Log-likelihood -16,868-9,536-16,836-9,516-16,834-9,496-16,828-9,452 Model chi2 2,173 2,032 2,197 2,068 2,234 2,063 2,235 2,137 d.f Pseudo R Number of observations 51,195 15,390 51,195 15,390 51,195 15,390 51,195 15,390 Asymptotic standard errors are robust for the presence of repeated observations on the same individual. *** p<0.01, ** p<0.05, * p<0.1 Source: Author s calculations using NIDS waves 1 to 4 pooled panel of wave-to-wave transitions (probability weights corrected for panel attrition have been used in the regression analysis). Notes: a The distinction of different types of employment (derived from the five questions that in combination are used to classify respondents as employed in NIDS): (i) employee, (ii) self-employed, (iii) casual employed/ help other people with their business, (iv) work on plot or food garden (subsistence farming). b For self-employed, formal businesses are registered for income tax &/or VAT. Casual workers/ helping others and subsistence farmers are classified as informal by definition. c For employees, formal employment is defined as either (i) having a written employment agreement, or (ii) medical aid deduction from salary, or (iii) pension/provident fund deduction from salary. 29
32 Table 10: Marginal effects for transitioning into and out of poverty, sector of employment Probability of being poor in t (1) (2) (3) probit regression on split sample poor non-poor poor non-poor poor non-poor in t-1 in t-1 in t-1 in t-1 in t-1 in t-1 Characteristics of the household head (HoH) in t-1 HoH level of education (base: no schooling) Less than primary completed (grades 1 to 6) *** *** *** Primary completed (grade 7) 0.019** *** 0.020** *** 0.018** *** Secondary not completed (grades 8 to 11) *** *** *** *** *** *** Secondary completed (grade 12) *** *** *** *** *** *** Tertiary *** *** *** *** *** *** HoH employment status (base: inactive) Unemployed (discouraged) Unemployed (strict) ** ** ** Subsistence farmer Casual worker/ helping others 0.036*** 0.178*** 0.036*** 0.178*** 0.038*** 0.179*** Self-employed * 0.057*** * 0.057*** ** Self-employed # Formal ** *** ** *** ** *** Employee by occupation Managers ** ** Professionals * *** Technicians and associate professionals *** ** Clerical support workers *** *** Service and sales workers ** Skilled agricultural, forestry and fishery workers *** Craft and related trades workers ** Plant and machine operators, and assemblers *** Elementary occupations ** Employee by industry Private households ** Agriculture, hunting, forestry and fishing 0.044*** 0.066* Mining and Quarrying *** *** Manufacturing Electricity, gas and water supply *** * Construction Wholesale and Retail trade; repair etc * Transport, storage and communication ** Financial intermediation, insurance, etc *** Community, social and personal services *** *** Employee Employee # Permanent contract *** Employee # Union member *** Employee # Share of public employment in sector a *** *** Controls for demographic characteristics of HoH in t-1 YES YES YES YES YES YES Controls for characteristics of the household in t-1 YES YES YES YES YES YES Province fixed effects YES YES YES YES YES YES Time fixed effects YES YES YES YES YES YES Log-likelihood -16,700-9,309-16,615-9,341-16,810-9,431 Model chi2 2,214 2,189 2,355 2,192 2,267 2,143 d.f Pseudo R Number of observations 50,942 15,155 50,897 15,179 51,195 15,390 Asymptotic standard errors are robust for the presence of repeated observations on the same individual. *** p<0.01, ** p<0.05, * p<0.1 Source: Author s calculations using NIDS waves 1 to 4 pooled panel of wave-to-wave transitions (probability weights corrected for panel attrition have been used in the regression analysis). Notes: a The average share of public sector employment by industry and survey year has been calculated from the 2008, 2010/11, 2012, and 2014/15 Quarterly Labour Force Surveys. 30
33 Table 11: Average and genuine state dependence, /15 Poverty Persistence Entry ASD Persistence Entry GSD Poverty Line Year GSD/ASD Headcount (I) (II) (I)-(II) (III) (IV) (III)-(IV) Food 2010/ (R 430) / Mean Lower Bound 2010/ (R 629) / Mean Upper Bound 2010/ (R 963) / Mean Source: Author s calculations using NIDS waves 1 to 4 pooled panel of wave-to-wave transitions (weights corrected for panel attrition). Notes: (I) Is the average probability of being poor for those who were poor in the last period. (II) Is the average probability of being poor for those who were non-poor in the last period. (III) Is the average probability of being poor conditional on being poor in the last period. (IV) Is the average probability of being poor conditional on being non-poor in the last period. Figures Figure 1: Poverty transitions tree by initial poverty status a) Initially poor b) Initially non-poor P 2008 ( 61.4%) P 2010 (53.5%) N 2010 (8.0%) P 2012 (47.4%) N 2012 (6.0%) P 2012 (4.9%) N 2012 (3.1%) P 2014 (38.2%) N 2014 (9.2%) P 2014 (3.2%) N 2014 (2.9%) P 2014 (3.6%) N 2014 (1.3%) P 2014 (1.4%) N 2014 (1.7%) N 2008 (38.6%) P 2010 (11.5%) N 2010 (27.1%) P 2012 (7.5%) N 2012 (4.0%) P 2012 (3.8%) N 2012 (23.3%) P 2014 (5.0%) N 2014 (2.4%) P 2014 (1.1%) N 2014 (2.9%) P 2014 (1.3%) N 2014 (2.4%) P 2014 (1.4%) N 2014 (21.9%) Source: Author s calculations using NIDS balanced panel for waves 1 to 4 (weights corrected for panel attrition). Note: P = Poor (<R963); N = Non-Poor ( R963). 31

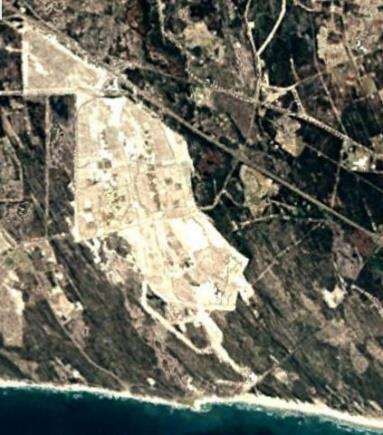
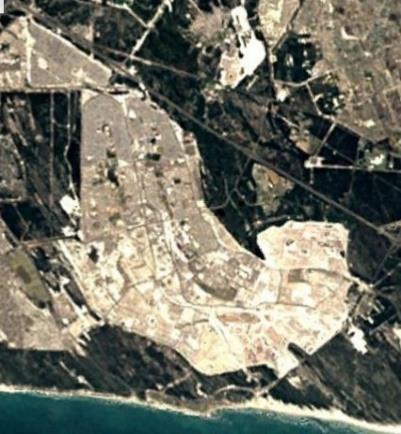
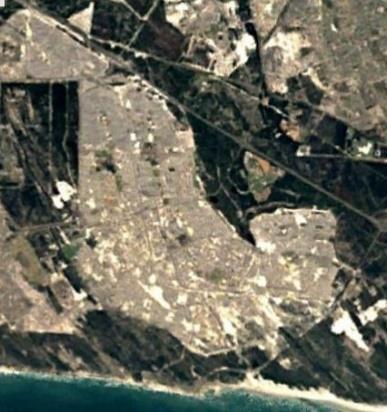
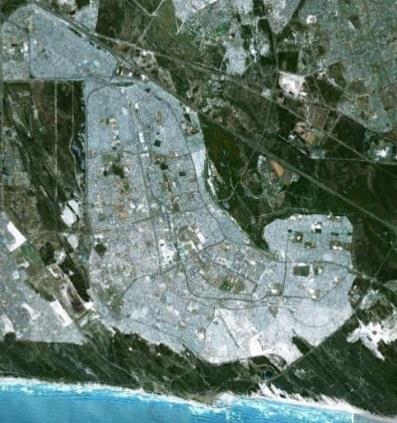
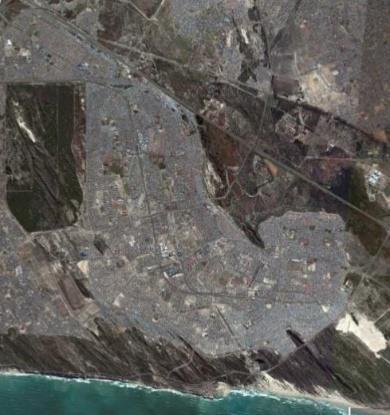
34 Figure 2: Growth of Khayelitsha, Source: Google Earth, historical imagery 32
 Formal versus informal settlements Total b) Poverty")
35 Figure 3. Sample selection a) Formal versus informal settlements Total b) Poverty status based on approximated mean per capita income Selected Sample 33
Poverty: Analysis of the NIDS Wave 1 Dataset
 Poverty: Analysis of the NIDS Wave 1 Dataset Discussion Paper no. 13 Jonathan Argent Graduate Student, University of Cape Town jtargent@gmail.com Arden Finn Graduate student, University of Cape Town ardenfinn@gmail.com
Southern Africa Labour and Development Research Unit
 Southern Africa Labour and Development Research Unit The Dynamics of Poverty in the First Three Waves of NIDS by Arden Finn and Murray Leibbrandt Working Paper Series Number 119 NIDS Discussion Paper 2013/1
Downloads from this web forum are for private, non-commercial use only. Consult the copyright and media usage guidelines on
 Econ 3x3 www.econ3x3.org A web forum for accessible policy-relevant research and expert commentaries on unemployment and employment, income distribution and inclusive growth in South Africa Downloads from
The persistence of urban poverty in Ethiopia: A tale of two measurements
 WORKING PAPERS IN ECONOMICS No 283 The persistence of urban poverty in Ethiopia: A tale of two measurements by Arne Bigsten Abebe Shimeles January 2008 ISSN 1403-2473 (print) ISSN 1403-2465 (online) SCHOOL
Double-edged sword: Heterogeneity within the South African informal sector
 Double-edged sword: Heterogeneity within the South African informal sector Nwabisa Makaluza Department of Economics, University of Stellenbosch, Stellenbosch, South Africa nwabisa.mak@gmail.com Paper prepared
HOUSEHOLDS INDEBTEDNESS: A MICROECONOMIC ANALYSIS BASED ON THE RESULTS OF THE HOUSEHOLDS FINANCIAL AND CONSUMPTION SURVEY*
 HOUSEHOLDS INDEBTEDNESS: A MICROECONOMIC ANALYSIS BASED ON THE RESULTS OF THE HOUSEHOLDS FINANCIAL AND CONSUMPTION SURVEY* Sónia Costa** Luísa Farinha** 133 Abstract The analysis of the Portuguese households
Dennis Essers. Institute of Development Management and Policy (IOB) University of Antwerp
 University of Antwerp") South African labour market transitions during the global financial and economic crisis: Micro-level evidence from the NIDS panel and matched QLFS cross-sections Dennis Essers Institute of Development
South African labour market transitions during the global financial and economic crisis: Micro-level evidence from the NIDS panel and matched QLFS cross-sections Dennis Essers Institute of Development
Monitoring the Performance
 Monitoring the Performance of the South African Labour Market An overview of the Sector from 2014 Quarter 1 to 2017 Quarter 1 Factsheet 19 November 2017 South Africa s Sector Government broadly defined
Monitoring the Performance of the South African Labour Market
 Monitoring the Performance of the South African Labour Market An overview of the South African labour market for the Year Ending 2012 6 June 2012 Contents Recent labour market trends... 2 A labour market
Labour. Labour market dynamics in South Africa, statistics STATS SA STATISTICS SOUTH AFRICA
 Labour statistics Labour market dynamics in South Africa, 2017 STATS SA STATISTICS SOUTH AFRICA Labour Market Dynamics in South Africa 2017 Report No. 02-11-02 (2017) Risenga Maluleke Statistician-General
THE PERSISTENCE OF POVERTY IN NEW YORK CITY
 MONITORING POVERTY AND WELL-BEING IN NYC THE PERSISTENCE OF POVERTY IN NEW YORK CITY A Three-Year Perspective from the Poverty Tracker FALL 2016 POVERTYTRACKER.ROBINHOOD.ORG Christopher Wimer Sophie Collyer
Demographic and Economic Characteristics of Children in Families Receiving Social Security
 Each month, over 3 million children receive benefits from Social Security, accounting for one of every seven Social Security beneficiaries. This article examines the demographic characteristics and economic
Monitoring the Performance of the South African Labour Market
 Monitoring the Performance of the South African Labour Market An overview of the South African labour market for the Year Ending 2012 8 October 2012 Contents Recent labour market trends... 2 A labour market
Tracking Poverty through Panel Data: Rural Poverty in India
 Tracking Poverty through Panel Data: Rural Poverty in India 1970-1998 Shashanka Bhide and Aasha Kapur Mehta 1 1. Introduction The distinction between transitory and chronic poverty has been highlighted
Persistent at-risk-of-poverty in Ireland: an analysis of the Survey on Income and Living Conditions
 Social Inclusion Technical Paper Persistent at-risk-of-poverty in Ireland: an analysis of the Survey on Income and Living Conditions 2005-2008 Bertrand Maître Helen Russell Dorothy Watson Social Inclusion
Income and Non-Income Inequality in Post- Apartheid South Africa: What are the Drivers and Possible Policy Interventions?
 Income and Non-Income Inequality in Post- Apartheid South Africa: What are the Drivers and Possible Policy Interventions? Haroon Bhorat Carlene van der Westhuizen Toughedah Jacobs Haroon.Bhorat@uct.ac.za
Women in the South African Labour Market
 Women in the South African Labour Market 1995-2005 Carlene van der Westhuizen Sumayya Goga Morné Oosthuizen Carlene.VanDerWesthuizen@uct.ac.za Development Policy Research Unit DPRU Working Paper 07/118
Monitoring the Performance of the South African Labour Market
 Monitoring the Performance of the South African Labour Market An overview of the South African labour market for the Year ending 2011 5 May 2012 Contents Recent labour market trends... 2 A labour market
Transition Events in the Dynamics of Poverty
 Transition Events in the Dynamics of Poverty Signe-Mary McKernan and Caroline Ratcliffe The Urban Institute September 2002 Prepared for the U.S. Department of Health and Human Services, Office of the Assistant
A Long Road Back to Work. The Realities of Unemployment since the Great Recession
 1101 Connecticut Ave NW, Suite 810 Washington, DC 20036 http://www.nul.org A Long Road Back to Work The Realities of Unemployment since the Great Recession June 2011 Valerie Rawlston Wilson, PhD National
Table 1 sets out national accounts information from 1994 to 2001 and includes the consumer price index and the population for these years.
 WHAT HAPPENED TO THE DISTRIBUTION OF INCOME IN SOUTH AFRICA BETWEEN 1995 AND 2001? Charles Simkins University of the Witwatersrand 22 November 2004 He read each wound, each weakness clear; And struck his
Wealth Inequality Reading Summary by Danqing Yin, Oct 8, 2018
 Summary of Keister & Moller 2000 This review summarized wealth inequality in the form of net worth. Authors examined empirical evidence of wealth accumulation and distribution, presented estimates of trends
What has happened to inequality and poverty in post-apartheid South Africa. Dr Max Price Vice Chancellor University of Cape Town
 What has happened to inequality and poverty in post-apartheid South Africa Dr Max Price Vice Chancellor University of Cape Town OUTLINE Examine trends post-apartheid (since 1994) Income inequality Overall,
Using the British Household Panel Survey to explore changes in housing tenure in England
 Using the British Household Panel Survey to explore changes in housing tenure in England Tom Sefton Contents Data...1 Results...2 Tables...6 CASE/117 February 2007 Centre for Analysis of Exclusion London
Exiting Poverty: Does Sex Matter?
 Exiting Poverty: Does Sex Matter? LORI CURTIS AND KATE RYBCZYNSKI DEPARTMENT OF ECONOMICS UNIVERSITY OF WATERLOO CRDCN WEBINAR MARCH 8, 2016 Motivation Women face higher risk of long term poverty.(finnie
Discussion paper 1 Comparative labour statistics Labour force survey: first round pilot February 2000
 Discussion paper 1 Comparative labour statistics Labour force survey: first round pilot February 2000 Statistics South Africa 27 March 2001 DISCUSSION PAPER 1: COMPARATIVE LABOUR STATISTICS LABOUR FORCE
Characteristics of Eligible Households at Baseline
 Malawi Social Cash Transfer Programme Impact Evaluation: Introduction The Government of Malawi s (GoM s) Social Cash Transfer Programme (SCTP) is an unconditional cash transfer programme targeted to ultra-poor,
Exiting poverty : Does gender matter?
 CRDCN Webinar Series Exiting poverty : Does gender matter? with Lori J. Curtis and Kathleen Rybczynski March 8, 2016 1 The Canadian Research Data Centre Network 1) Improve access to Statistics Canada detailed
Monitoring the Performance of the South African Labour Market
 Monitoring the Performance of the South African Labour Market An overview of the South African labour market from 1 of 2009 to of 2010 August 2010 Contents Recent labour market trends... 2 A brief labour
Open Working Group on Sustainable Development Goals. Statistical Note on Poverty Eradication 1. (Updated draft, as of 12 February 2014)
") Open Working Group on Sustainable Development Goals Statistical Note on Poverty Eradication 1 (Updated draft, as of 12 February 2014) 1. Main policy issues, potential goals and targets While the MDG target
Open Working Group on Sustainable Development Goals Statistical Note on Poverty Eradication 1 (Updated draft, as of 12 February 2014) 1. Main policy issues, potential goals and targets While the MDG target
Did the Social Assistance Take-up Rate Change After EI Reform for Job Separators?
 Did the Social Assistance Take-up Rate Change After EI for Job Separators? HRDC November 2001 Executive Summary Changes under EI reform, including changes to eligibility and length of entitlement, raise
Monitoring the Performance of the South African Labour Market
 Monitoring the Performance of the South African Labour Market An overview of the South African labour market from 3 of 2010 to of 2011 September 2011 Contents Recent labour market trends... 2 A brief labour
The Probability of Experiencing Poverty and its Duration in Adulthood Extended Abstract for Population Association of America 2009 Annual Meeting
 Abstract: The Probability of Experiencing Poverty and its Duration in Adulthood Extended Abstract for Population Association of America 2009 Annual Meeting Lloyd D. Grieger, University of Michigan Ann
To understand the drivers of poverty reduction,
 Understanding the Drivers of Poverty Reduction To understand the drivers of poverty reduction, we decompose the distributional changes in consumption and income over the 7 to 1 period, and examine the
Income Inequality, Mobility and Turnover at the Top in the U.S., Gerald Auten Geoffrey Gee And Nicholas Turner
 Income Inequality, Mobility and Turnover at the Top in the U.S., 1987 2010 Gerald Auten Geoffrey Gee And Nicholas Turner Cross-sectional Census data, survey data or income tax returns (Saez 2003) generally
Social protection and labor market outcomes in South Africa
 Social protection and labor market outcomes in South Africa Cally Ardington, University of Cape Town Till Bärnighausen, Harvard School of Public Health and Africa Centre for Health and Population Studies
IMPACT OF GOVERNMENT PROGRAMMES USING ADMINISTRATIVE DATA SETS SOCIAL ASSISTANCE GRANTS
 IMPACT OF GOVERNMENT PROGRAMMES USING ADMINISTRATIVE DATA SETS SOCIAL ASSISTANCE GRANTS Project 6.2 of the Ten Year Review Research Programme Second draft, 19 June 2003 Dr Ingrid Woolard 1 Introduction
In or out? Poverty dynamics among older individuals in the UK
 In or out? Poverty dynamics among older individuals in the UK by Ricky Kanabar Discussant: Maria A. Davia Outline of the paper & the discussion The PAPER: What does the paper do and why is it important?
Monitoring the Performance of the South African Labour Market
 Monitoring the Performance of the South African Labour Market An overview of the South African labour market for the Year Ending 2016 14 July 2016 Contents Recent labour market trends... 2 A labour market
Gender Differences in the Labor Market Effects of the Dollar
 Gender Differences in the Labor Market Effects of the Dollar Linda Goldberg and Joseph Tracy Federal Reserve Bank of New York and NBER April 2001 Abstract Although the dollar has been shown to influence
Kyrgyz Republic: Borrowing by Individuals
 Kyrgyz Republic: Borrowing by Individuals A Review of the Attitudes and Capacity for Indebtedness Summary Issues and Observations In partnership with: 1 INTRODUCTION A survey was undertaken in September
MONTENEGRO. Name the source when using the data
 MONTENEGRO STATISTICAL OFFICE RELEASE No: 50 Podgorica, 03. 07. 2009 Name the source when using the data THE POVERTY ANALYSIS IN MONTENEGRO IN 2007 Podgorica, july 2009 Table of Contents 1. Introduction...
Southern Africa Labour and Development Research Unit
 Southern Africa Labour and Development Research Unit Mobility and Inequality in the First Three Waves of NIDS by Arden Finn and Murray Leibbrandt Working Paper Series Number 120 NIDS Discussion Paper 2013/2
Achievements and Challenges of Social Assistance-Based Social Protection: The case of South Africa
 Achievements and Challenges of Social Assistance-Based Social Protection: The case of South Africa Ken Harttgen, Stephan Klasen University of Göttingen Ingrid Woolard, University of Cape Town ABCDE Conference,
Discussion paper 1 Comparative labour statistics Labour force survey: first round pilot February 2000
 Discussion paper 1 Comparative labour statistics Labour force survey: first round pilot February 2000 Statistics South Africa 27 March 2001 DISCUSSION PAPER 1: COMPARATIVE LABOUR STATISTICS LABOUR FORCE
Understanding the underlying dynamics of the reservation wage for South African youth. Essa Conference 2013
 _ 1 _ Poverty trends since the transition Poverty trends since the transition Understanding the underlying dynamics of the reservation wage for South African youth ASMUS ZOCH Essa Conference 2013 KEYWORDS:
CONSUMPTION POVERTY IN THE REPUBLIC OF KOSOVO April 2017
 CONSUMPTION POVERTY IN THE REPUBLIC OF KOSOVO 2012-2015 April 2017 The World Bank Europe and Central Asia Region Poverty Reduction and Economic Management Unit www.worldbank.org Kosovo Agency of Statistics
Online Appendix: Revisiting the German Wage Structure
 Online Appendix: Revisiting the German Wage Structure Christian Dustmann Johannes Ludsteck Uta Schönberg This Version: July 2008 This appendix consists of three parts. Section 1 compares alternative methods
Low Earnings For High Education Greek Students Face Weak Performance Incentives
 Low Earnings For High Education Greek Students Face Weak Performance Incentives Wasilios Hariskos, Fabian Kleine, Manfred Königstein & Konstantinos Papadopoulos 1 Version: 19.7.2012 Abstract: The current
Globalization and the Feminization of Poverty within Tradable and Non-Tradable Economic Activities
 Istanbul Technical University ESRC Research Papers Research Papers 2009/02 Globalization and the Feminization of Poverty within Tradable and Non-Tradable Economic Activities Raziye Selim and Öner Günçavdı
SOCIAL SUPPORT NETWORKS AND THEIR EFFECTS ON HARDSHIP AVOIDANCE AMONG LOW-INCOME HOUSEHOLDS
 SOCIAL SUPPORT NETWORKS AND THEIR EFFECTS ON HARDSHIP AVOIDANCE AMONG LOW-INCOME HOUSEHOLDS Gregory B. Mills and Sisi Zhang Urban Institute Copyright December, 2013. The Urban Institute. Permission is
Characteristics of the euro area business cycle in the 1990s
 Characteristics of the euro area business cycle in the 1990s As part of its monetary policy strategy, the ECB regularly monitors the development of a wide range of indicators and assesses their implications
Southern Africa Labour and Development Research Unit
 Southern Africa Labour and Development Research Unit Social stratification, life chances and vulnerability to poverty in South Africa by Simone Schotte, Rocco Zizzamia and Murray Leibbrandt Working Paper
AN EXAMINATION OF THE LABOUR MARKET TRANSITIONS OF MINIMUM WAGE WORKERS IN IRELAND PAUL REDMOND, SEAMUS MCGUINNESS AND BERTRAND MAîTRE
 RESEARCH SERIES NUMBER 75 October 2018 AN EXAMINATION OF THE LABOUR MARKET TRANSITIONS OF MINIMUM WAGE WORKERS IN IRELAND PAUL REDMOND, SEAMUS MCGUINNESS AND BERTRAND MAîTRE EVIDENCE FOR POLICY AN EXAMINATION
Ruhm, C. (1991). Are Workers Permanently Scarred by Job Displacements? The American Economic Review, Vol. 81(1):
. Are Workers Permanently Scarred by Job Displacements? The American Economic Review, Vol. 81(1):") Are Workers Permanently Scarred by Job Displacements? By: Christopher J. Ruhm Ruhm, C. (1991). Are Workers Permanently Scarred by Job Displacements? The American Economic Review, Vol. 81(1): 319-324. Made
Are Workers Permanently Scarred by Job Displacements? By: Christopher J. Ruhm Ruhm, C. (1991). Are Workers Permanently Scarred by Job Displacements? The American Economic Review, Vol. 81(1): 319-324. Made
Measuring Chronic Non-Income Poverty 1
 Measuring Chronic Non-Income Poverty 1 Isabel Günther and Stephan Klasen February 2007 Department of Economics, University of Göttingen isabel.guenther@wiwi.uni-goettingen.de sklasen@uni-goettingen.de
Female household headship and poverty. analysis. in South Africa: an employment-based. Chijioke Nwosu Catherine Ndinda
 Female household headship and poverty in South Africa: an employment-based analysis Chijioke Nwosu Catherine Ndinda Outline Introduction Aim & objectives Literature review SA context Analytical methods
ANNEX 1: Data Sources and Methodology
 ANNEX 1: Data Sources and Methodology A. Data Sources: The analysis in this report relies on data from three household surveys that were carried out in Serbia and Montenegro in 2003. 1. Serbia Living Standards
Poverty traps and structural poverty in South Africa. Reassessing the evidence from KwaZulu-Natal. Julian May and Ingrid Woolard August 2007
 Poverty traps and structural poverty in South Africa. Reassessing the evidence from KwaZulu-Natal Julian May and Ingrid Woolard August 2007 School of Development Studies, Howard College Campus, University
GAO GENDER PAY DIFFERENCES. Progress Made, but Women Remain Overrepresented among Low-Wage Workers. Report to Congressional Requesters
 GAO United States Government Accountability Office Report to Congressional Requesters October 2011 GENDER PAY DIFFERENCES Progress Made, but Women Remain Overrepresented among Low-Wage Workers GAO-12-10
Vulnerability to Poverty and Risk Management of Rural Farm Household in Northeastern of Thailand
 2011 International Conference on Financial Management and Economics IPEDR vol.11 (2011) (2011) IACSIT Press, Singapore Vulnerability to Poverty and Risk Management of Rural Farm Household in Northeastern
No K. Swartz The Urban Institute
 THE SURVEY OF INCOME AND PROGRAM PARTICIPATION ESTIMATES OF THE UNINSURED POPULATION FROM THE SURVEY OF INCOME AND PROGRAM PARTICIPATION: SIZE, CHARACTERISTICS, AND THE POSSIBILITY OF ATTRITION BIAS No.
Shifts in Non-Income Welfare in South Africa
 Shifts in Non-Income Welfare in South Africa 1993-2004 DPRU Policy Brief Series Development Policy Research unit School of Economics University of Cape Town Upper Campus June 2006 ISBN: 1-920055-30-4 Copyright
Poverty and Social Transfers in Hungary
 THE WORLD BANK Revised March 20, 1997 Poverty and Social Transfers in Hungary Christiaan Grootaert SUMMARY The objective of this study is to answer the question how the system of cash social transfers
For Online Publication Additional results
 For Online Publication Additional results This appendix reports additional results that are briefly discussed but not reported in the published paper. We start by reporting results on the potential costs
Gender Pay Differences: Progress Made, but Women Remain Overrepresented Among Low- Wage Workers
 Cornell University ILR School DigitalCommons@ILR Federal Publications Key Workplace Documents 10-2011 Gender Pay Differences: Progress Made, but Women Remain Overrepresented Among Low- Wage Workers Government
The current study builds on previous research to estimate the regional gap in
 Summary 1 The current study builds on previous research to estimate the regional gap in state funding assistance between municipalities in South NJ compared to similar municipalities in Central and North
Universal Social Protection
 Universal Social Protection Universal pensions in South Africa Older Persons Grant South Africa is ranked as an upper-middle income country but characterized by high poverty incidence and inequality among
Automated labor market diagnostics for low and middle income countries
 Poverty Reduction Group Poverty Reduction and Economic Management (PREM) World Bank ADePT: Labor Version 1.0 Automated labor market diagnostics for low and middle income countries User s Guide: Definitions
The Influence of Ill Health on Chronic and Transient Poverty: Evidence from Uganda. David Lawson University of Manchester. CPRC Working Paper No 41
 The Influence of Ill Health on Chronic and Transient Poverty: Evidence from Uganda David Lawson University of Manchester CPRC Working Paper No 41 Chronic Poverty Research Centre ISBN Number 1-904049-40-0
South African Baseline Study on Financial Literacy
 Regional Dissemination Conference on Building Financial Capability South African Baseline Study on Financial Literacy Lyndwill Clarke Head: Consumer Education 30-31 January 2013 Nairobi, Kenya Outline
Usage of Sickness Benefits
 Final Report EI Evaluation Strategic Evaluations Evaluation and Data Development Strategic Policy Human Resources Development Canada April 2003 SP-ML-019-04-03E (également disponible en français) Paper
AUGUST THE DUNNING REPORT: DIMENSIONS OF CORE HOUSING NEED IN CANADA Second Edition
 AUGUST 2009 THE DUNNING REPORT: DIMENSIONS OF CORE HOUSING NEED IN Second Edition Table of Contents PAGE Background 2 Summary 3 Trends 1991 to 2006, and Beyond 6 The Dimensions of Core Housing Need 8
Aaron Sojourner & Jose Pacas December Abstract:
 Union Card or Welfare Card? Evidence on the relationship between union membership and net fiscal impact at the individual worker level Aaron Sojourner & Jose Pacas December 2014 Abstract: This paper develops
Older workers: How does ill health affect work and income?
 Older workers: How does ill health affect work and income? By Xenia Scheil-Adlung Health Policy Coordinator, ILO Geneva* January 213 Contents 1. Background 2. Income and labour market participation of
Executive summary WORLD EMPLOYMENT SOCIAL OUTLOOK
 Executive summary WORLD EMPLOYMENT SOCIAL OUTLOOK TRENDS 2018 Global economic growth has rebounded and is expected to remain stable but low Global economic growth increased to 3.6 per cent in 2017, after
Southern Africa Labour and Development Research Unit
 Southern Africa Labour and Development Research Unit A National Minimum Wage in the Context of the South African Labour Market by Arden Finn Working Paper Series Number 153 About the Author(s) and Acknowledgments
CHAPTER VIII. ANALYSIS OF POVERTY DYNAMICS. Paul Glewwe and John Gibson. Introduction
 CHAPTER VIII. ANALYSIS OF POVERTY DYNAMICS Paul Glewwe and John Gibson Introduction Chapter 7 focused almost exclusively on analysis of poverty at a single point in time. Yet, in a given time period, people
What is So Bad About Inequality? What Can Be Done to Reduce It? Todaro and Smith, Chapter 5 (11th edition)
") What is So Bad About Inequality? What Can Be Done to Reduce It? Todaro and Smith, Chapter 5 (11th edition) What is so bad about inequality? 1. Extreme inequality leads to economic inefficiency. - At a
What is So Bad About Inequality? What Can Be Done to Reduce It? Todaro and Smith, Chapter 5 (11th edition) What is so bad about inequality? 1. Extreme inequality leads to economic inefficiency. - At a
To What Extent is Household Spending Reduced as a Result of Unemployment?
 To What Extent is Household Spending Reduced as a Result of Unemployment? Final Report Employment Insurance Evaluation Evaluation and Data Development Human Resources Development Canada April 2003 SP-ML-017-04-03E
AIM-AP. Accurate Income Measurement for the Assessment of Public Policies. Citizens and Governance in a Knowledge-based Society
 Project no: 028412 AIM-AP Accurate Income Measurement for the Assessment of Public Policies Specific Targeted Research or Innovation Project Citizens and Governance in a Knowledge-based Society Deliverable
THE WELFARE MONITORING SURVEY SUMMARY
 THE WELFARE MONITORING SURVEY SUMMARY 2015 United Nations Children s Fund (UNICEF) November, 2016 UNICEF 9, Eristavi str. 9, UN House 0179, Tbilisi, Georgia Tel: 995 32 2 23 23 88, 2 25 11 30 e-mail:
IJPSS Volume 2, Issue 4 ISSN:
 Poverty and inequality in Services Sector of Sudan Ali Musa Abaker* Ali Abd Elaziz Salih** ABSTRACT: This research paper aims to address income poverty and inequality in service sector of Sudan. Poverty
Issue Brief. Characteristics of the Nonelderly with Selected Sources of Health Insurance and Lengths of Uninsured Spells
 June 1998 Jan. Characteristics of the Nonelderly with Selected Sources of Health Insurance and Lengths of Uninsured Spells by Craig Copeland, EBRI Feb. Mar. Apr. May Jun. Jul. Aug. EBRI EMPLOYEE BENEFIT
A Profile of Payday Loans Consumers Based on the 2014 Canadian Financial Capability Survey. Wayne Simpson. Khan Islam*
 A Profile of Payday Loans Consumers Based on the 2014 Canadian Financial Capability Survey Wayne Simpson Khan Islam* * Professor and PhD Candidate, Department of Economics, University of Manitoba, Winnipeg
WHO S LEFT TO HIRE? WORKFORCE AND UNEMPLOYMENT ANALYSIS PREPARED BY BENJAMIN FRIEDMAN JANUARY 23, 2019
 JANUARY 23, 2019 WHO S LEFT TO HIRE? WORKFORCE AND UNEMPLOYMENT ANALYSIS PREPARED BY BENJAMIN FRIEDMAN 13805 58TH STREET NORTH CLEARNWATER, FL, 33760 727-464-7332 Executive Summary: Pinellas County s unemployment
The use of linked administrative data to tackle non response and attrition in longitudinal studies
 The use of linked administrative data to tackle non response and attrition in longitudinal studies Andrew Ledger & James Halse Department for Children, Schools & Families (UK) Andrew.Ledger@dcsf.gsi.gov.uk
COMMUNITY ADVANTAGE PANEL SURVEY: DATA COLLECTION UPDATE AND ANALYSIS OF PANEL ATTRITION
 COMMUNITY ADVANTAGE PANEL SURVEY: DATA COLLECTION UPDATE AND ANALYSIS OF PANEL ATTRITION Technical Report: February 2012 By Sarah Riley HongYu Ru Mark Lindblad Roberto Quercia Center for Community Capital
2. Employment, retirement and pensions
 2. Employment, retirement and pensions Rowena Crawford Institute for Fiscal Studies Gemma Tetlow Institute for Fiscal Studies The analysis in this chapter shows that: Employment between the ages of 55
NBER WORKING PAPER SERIES MAKING SENSE OF THE LABOR MARKET HEIGHT PREMIUM: EVIDENCE FROM THE BRITISH HOUSEHOLD PANEL SURVEY
 NBER WORKING PAPER SERIES MAKING SENSE OF THE LABOR MARKET HEIGHT PREMIUM: EVIDENCE FROM THE BRITISH HOUSEHOLD PANEL SURVEY Anne Case Christina Paxson Mahnaz Islam Working Paper 14007 http://www.nber.org/papers/w14007
Appendix A. Additional Results
 Appendix A Additional Results for Intergenerational Transfers and the Prospects for Increasing Wealth Inequality Stephen L. Morgan Cornell University John C. Scott Cornell University Descriptive Results
COMMUNITY ADVANTAGE PANEL SURVEY: DATA COLLECTION UPDATE AND ANALYSIS OF PANEL ATTRITION
 COMMUNITY ADVANTAGE PANEL SURVEY: DATA COLLECTION UPDATE AND ANALYSIS OF PANEL ATTRITION Technical Report: February 2013 By Sarah Riley Qing Feng Mark Lindblad Roberto Quercia Center for Community Capital
Patterns of Unemployment
 Patterns of Unemployment By: OpenStaxCollege Let s look at how unemployment rates have changed over time and how various groups of people are affected by unemployment differently. The Historical U.S. Unemployment
The Effect of Unemployment on Household Composition and Doubling Up
 The Effect of Unemployment on Household Composition and Doubling Up Emily E. Wiemers WORKING PAPER 2014-05 DEPARTMENT OF ECONOMICS UNIVERSITY OF MASSACHUSETTS BOSTON The Effect of Unemployment on Household
Barriers to employment, welfare time-limit exemptions and material hardship among long-term welfare recipients in California.
 Barriers to employment, welfare time-limit exemptions and material hardship among long-term welfare recipients in California. Jane Mauldon University of California Berkeley Rebecca London Stanford University
Assessment of Active Labour Market Policies in Bulgaria: Evidence from Survey Data
 Assessment of Active Labour Market Policies in Bulgaria: Evidence from Survey Data Atanas Atanassov * Summary: The paper presents the main results of a research that focuses on the subsequent assessment
The Lack of Persistence of Employee Contributions to Their 401(k) Plans May Lead to Insufficient Retirement Savings
 Plans May Lead to Insufficient Retirement Savings") Upjohn Institute Policy Papers Upjohn Research home page 2011 The Lack of Persistence of Employee Contributions to Their 401(k) Plans May Lead to Insufficient Retirement Savings Leslie A. Muller Hope College
Upjohn Institute Policy Papers Upjohn Research home page 2011 The Lack of Persistence of Employee Contributions to Their 401(k) Plans May Lead to Insufficient Retirement Savings Leslie A. Muller Hope College
Health and the Future Course of Labor Force Participation at Older Ages. Michael D. Hurd Susann Rohwedder
 Health and the Future Course of Labor Force Participation at Older Ages Michael D. Hurd Susann Rohwedder Introduction For most of the past quarter century, the labor force participation rates of the older
Estimating the Causal Effect of Enforcement on Minimum Wage Compliance: The Case of South Africa
 Estimating the Causal Effect of Enforcement on Minimum Wage Compliance: The Case of South Africa Haroon Bhorat* Development Policy Research Unit haroon.bhorat@uct.ac.za Ravi Kanbur Cornell University sk145@cornell.edu
Labour Market: Analysis of the NIDS Wave 1 Dataset
 Labour Market: Analysis of the NIDS Wave 1 Dataset Discussion Paper no. 12 Vimal Ranchod Southern African Labour & Development Research Unit vimal.ranchhod@gmail.com July 2009 1. Introduction The purpose