2017 Risks and Process of Retirement Survey Report of Findings
|
|
|
- Edmund Harry Ford
- 6 years ago
- Views:
Transcription


1 2017 Risks and Process of Retirement Survey Report of Findings January 2018
2 Risks and Process of Retirement Survey Report of Findings AUTHOR Greenwald & Associates SPONSOR Society of Actuaries Committee on Post Retirement Needs & Risks PROJECT OVERSIGHT GROUP MEMBERS Anna Rappaport, Chair Vickie Bajtelsmit Carol Bogosian Barbara Butrica Craig Copeland Paula Hogan Barbara Hogg Cindy Levering Frank O Connor Andrea Sellars Cecilia Shiner Linda Stone Tom Toale Jack Van derhei Paul Yakoboski Caveat and Disclaimer The opinions expressed and conclusions reached by the authors are their own and do not represent any official position or opinion of the Society of Actuaries or its members. The Society of Actuaries makes no representation or warranty to the accuracy of the information Copyright 2018 by the Society of Actuaries. All rights reserved.
3 3 TABLE OF CONTENTS INTRODUCTION & METHODOLOGY... 8 EXECUTIVE SUMMARY SURVEY FINDINGS RETIREMENT CONCERNS & PREPARATION FINANCIAL WELLNESS AMONG PRE-RETIREES & RETIREES HOUSING DECISIONS FOR RETIREMENT PLANNING FOR FUTURE LONG-TERM CARE NEEDS IMPACT OF ADVISOR USE AND FINANCIAL PLANS TRENDED CORE FINDINGS PROFILE OF SURVEY RESPONDENTS APPENDIX: POSTED QUESTIONNAIRE
4 4 TABLE OF FIGURES Figure 1: Concerns in Retirement Figure 2: Concerns in Retirement by Income Figure 3: Concerns in Retirement by Gender Figure 4: Concerns in Retirement by Age Figure 5: Amount of Thought Given to Financial Retirement Aspects Figure 6: Amount of Thought Given to Financial Retirement Aspects by Income Figure 7: Amount of Thought Given to Financial Retirement Aspects by Gender Figure 8: Amount of Thought Given to Financial Retirement Aspects by Age Figure 9: Actions Taken for Financial Protection Figure 10: Actions Taken for Financial Protection by Income Figure 11: Actions Taken for Financial Protection by Gender Figure 12: Actions Taken for Financial Protection by Age Figure 13: Financial Security Figure 14: Financial Security by Income Figure 15: Financial Security by Gender Figure 16: Financial Security by Age Figure 17: Financial Security by Debt Figure 18: Financial Security by Health Status Figure 19: Assessment of Current Financial Management Figure 20: Assessment of Current Financial Management by Income Figure 21: Assessment of Current Financial Management by Gender Figure 22: Assessment of Current Financial Management by Age Figure 23: Assessment of Current Financial Management by Financial Advisor Figure 24: Assessment of Current Financial Management by Financial Plan Figure 25: Types of Debt Owed Figure 26: Types of Debt Owed by Income Figure 27: Types of Debt Owed by Gender Figure 28: Types of Debt Owed by Age Figure 29: Amount of Debt Owed Excluding Mortgage Debt Figure 30: Amount of Debt Owed Excluding Mortgage Debt by Income Figure 31: Amount of Debt Owed Excluding Mortgage Debt by Gender Figure 32: Amount of Debt Owed Excluding Mortgage Debt by Age Figure 33: Negative Impact of Debt Figure 34: Negative Impact of Debt by Income Figure 35: Negative Impact of Debt by Gender Figure 36: Negative Impact of Debt by Age Figure 37: Ability to Handle Financial Shocks in Retirement Figure 38: Ability to Handle Financial Shocks in Retirement by Income Figure 39: Ability to Handle Financial Shocks in Retirement by Gender Figure 40: Ability to Handle Financial Shocks in Retirement by Age Figure 41: Ability to Handle Financial Shocks in Retirement by Financial Advisor
5 5 Figure 42: Ability to Handle Financial Shocks in Retirement by Financial Plan Figure 43: Financial Plans in Place Figure 44: Financial Plans in Place by Income Figure 45: Financial Plans in Place by Gender Figure 46: Financial Plans in Place by Age Figure 47: Management of Financial Plans in Place Figure 48: Management of Financial Plans in Place by Income Figure 49: Management of Financial Plans in Place by Gender Figure 50: Management of Financial Plans in Place by Age Figure 51: Spending in Retirement Figure 52: Spending in Retirement by Income Figure 53: Spending in Retirement by Gender Figure 54: Spending in Retirement by Age Figure 55: Likelihood to Use Education and Support on Financial Topics Figure 56: Likelihood to Use Education and Support on Financial Topics by Income Figure 57: Likelihood to Use Education and Support on Financial Topics by Gender Figure 58: Likelihood to Use Education and Support on Financial Topics by Age Figure 59: Housing Related Concerns Figure 60: Housing Related Concerns by Income Figure 61: Housing Related Concerns by Gender Figure 62: Housing Related Concerns by Age Figure 63: Amount Spent on Housing Figure 64: Amount Spent on Housing by Income Figure 65: Amount Spent on Housing by Gender Figure 66: Amount Spent on Housing by Age Figure 67: Market Value of Home Figure 68: Market Value of Home by Income Figure 69: Market Value of Home by Gender Figure 70: Market Value of Home by Age Figure 71: Equity Built in Primary Home Figure 72: Equity Built in Primary Home by Income Figure 73: Equity Built in Primary Home by Gender Figure 74: Equity Built in Primary Home by Age Figure 75: Willingness to Use Home to Fund Retirement Figure 76: Willingness to Use Home to Fund Retirement by Income Figure 77: Willingness to Use Home to Fund Retirement by Gender Figure 78: Willingness to Use Home to Fund Retirement by Age Figure 79: Plan to Stay in Current Home Figure 80: Plan to Stay in Current Home by Income Figure 81: Plan to Stay in Current Home by Gender Figure 82: Plan to Stay in Current Home by Age Figure 83: Plan to Stay in Current Home by Home Ownership Figure 84: Plans for Moving in Retirement Figure 85: Plans for Moving in Retirement by Income Figure 86: Plans for Moving in Retirement by Gender Figure 87: Plans for Moving in Retirement by Age
6 6 Figure 88: Important Attributes in Deciding Where to Live in Retirement Figure 89: Important Attributes in Deciding Where to Live in Retirement Figure 90: Important Attributes in Deciding Where to Live in Retirement Figure 91: Important Attributes in Deciding Where to Live in Retirement by Income Figure 92: Important Attributes in Deciding Where to Live in Retirement by Gender Figure 93: Important Attributes in Deciding Where to Live in Retirement by Age Figure 94: Attractiveness of Senior Communities and Long-term Care Facilities Figure 95: Attractiveness of Senior Communities and Long-Term Care Facilities by Income Figure 96: Attractiveness of Senior Communities and Long-Term Care Facilities by Gender Figure 97: Attractiveness of Senior Communities and Long-Term Care Facilities by Age Figure 98: Expected Age to Move into Senior Community or Long-term Care Facility Figure 99: Expected Age to Move into Senior Community or Long-term Care Facility by Income Figure 100: Expected Age to Move into Senior Community or Long-term Care Facility by Gender Figure 101: Expected Age to Move into Senior Community or Long-Term Care Facility by Age Figure 102: Parents Care Experiences in Retirement Figure 103: Parents Care Experiences in Retirement by Income Figure 104: Parents Care Experiences in Retirement by Gender Figure 105: Parents Care Experiences in Retirement by Age Figure 106: Parents Financial Circumstances in Retirement Figure 107: Parents Financial Circumstances in Retirement by Income Figure 108: Parents Financial Circumstances in Retirement by Gender Figure 109: Parents Financial Circumstances in Retirement by Age Figure 110: Financial Support Provided to Parents Figure 111: Financial Support Provided to Parents by Income Figure 112: Financial Support Provided to Parents by Gender Figure 113: Financial Support Provided to Parents by Age Figure 114: Ever Spent Time Caring for Someone Figure 115: Ever Spent Time Caring for Someone by Income Figure 116: Ever Spent Time Caring for Someone by Gender Figure 117: Ever Spent Time Caring for Someone by Age Figure 118: Currently Spending Any Time Caring for Someone Figure 119: Currently Spending Any Time Caring for Someone by Income Figure 120: Currently Spending Any Time Caring for Someone by Gender Figure 121: Currently Spending Any Time Caring for Someone by Age Figure 122: Household Burden of Caregiving Figure 123: Household Burden of Caregiving by Income Figure 124: Household Burden of Caregiving by Gender Figure 125: Household Burden of Caregiving by Age Figure 126: Likelihood of Personally Requiring Long-term Care Figure 127: Likelihood of Personally Requiring Long-term Care by Income Figure 128: Likelihood of Personally Requiring Long-term Care by Gender Figure 129: Likelihood of Personally Requiring Long-term Care by Age Figure 130: Primary Caregiver for Long-Term Care Support Figure 131: Primary Caregiver for Long-Term Care Support by Income Figure 132: Primary Caregiver for Long-Term Care Support by Gender Figure 133: Primary Caregiver for Long-Term Care Support by Age
7 7 Figure 134: Plans to Pay for Long-term Care Figure 135: Plans to Pay for Long-term Care by Income Figure 136: Plans to Pay for Long-term Care by Gender Figure 137: Plans to Pay for Long-term Care by Age Figure 138: Familiarity with Benefits Programs and Products Figure 139: Familiarity with Benefits Programs and Products by Income Figure 140: Familiarity with Benefits Programs and Products by Gender Figure 141: Familiarity with Benefits Programs and Products by Age Figure 142: Preparations for the Cost of Long-term Care Figure 143: Preparations for the Cost of Long-term Care by Income Figure 144: Preparations for the Cost of Long-term Care by Gender Figure 145: Preparations for the Cost of Long-term Care by Age Figure 146: Level of Financial Concern Based on Parents Experiences Figure 147: Level of Financial Concern Based on Parents Experiences by Income Figure 148: Level of Financial Concern Based on Parents Experiences by Gender Figure 149: Level of Financial Concern Based on Parents Experiences by Age Figure 150: Level of Financial Concern Based on Parents Experiences by Parents Who Needed Long-Term Care. 143 Figure 151: Pre-retiree Concerns in Retirement by Advisor, Plan Status and Asset Level Figure 152: Retiree Concerns in Retirement by Advisor, Plan Status and Asset Level Figure 153: Pre-retiree Financial Security by Advisor, Plan Status and Asset Level Figure 154: Retiree Financial Security by Advisor, Plan Status and Asset Level Figure 155: Pre-retirees Ability to Handle Financial Shocks in Retirement by Advisor, Plan Status and Asset Level 150 Figure 156: Retirees Ability to Handle Financial Shocks in Retirement by Advisor, Plan Status and Asset Level Figure 157: Pre-retirees Negative Impact of Debt by Advisor, Plan Status and Asset Level Figure 158: Retirees Negative Impact of Debt by Advisor, Plan Status and Asset Level Figure 159: Pre-retiree Actions Taken/Planning for Financial Protection by Advisor, Plan Status and Asset level Figure 160: Retiree Actions Taken/Planning for Financial Protection by Advisor, Plan Status and Asset level Figure 161: Pre-retiree Thought Given to Long-term Care by Advisor, Plan Status and Asset Level Figure 162: Retiree Thought Given to Long-term Care by Advisor, Plan Status and Asset Level Figure 163: Pre-retiree Familiarity with Benefits Programs and Products by Advisor, Plan Status and Asset Level. 159 Figure 164: Retiree Familiarity with Benefits Programs and Products by Advisor, Plan Status and Asset Level Figure 165: Trended Issues of Concern, Among Pre-retirees Figure 166: Trended Issues of Concern, Among Retirees Figure 167: Trended Estimate of Personal Life Expectancy, Among Pre-retirees Figure 168: Trended Estimate of Personal Life Expectancy, Among Retirees Figure 169: Trended Risk Management Strategies, Among Pre-retirees Figure 170: Trended Risk Management Strategies, Among Retirees Figure 171: Trended Homeownership, Among Pre-retirees Figure 172: Trended Homeownership, Among Retirees Figure 173: Trended Expected Retirement Age, Among Pre-retirees Figure 174: Trended Actual Retirement Age, Among Retirees Figure 175: Trended Parents Experiences During Retirement, Among Pre-retirees Figure 176: Trended Parents Experiences During Retirement, Among Retirees Figure 177: Trended Impact of Debt, Among Pre-retirees with Debt Figure 178: Trended Impact of Debt, Among Retirees with Debt Figure 179: Respondent Demographics
8 8 INTRODUCTION & METHODOLOGY This report presents the results of an online survey of Americans ages 45 to 80 conducted in July 2017 by Greenwald & Associates on behalf of the Society of Actuaries (SOA). The purpose of the study was to evaluate Americans retirement concerns and preparedness, sense of financial wellness, housing plans during retirement, view of long-term care needs, and use and impact of financial advisors and plans. This is the ninth study sponsored by the SOA that focuses on these issues. The first was conducted in August 2001, before both the events of Sept. 11 and the subsequent significant declines in investment markets. The second study was conducted in August 2003, the third in June/July 2005, the fourth in June 2007, the fifth in July 2009, the sixth in July 2011, the seventh in August 2013, and the eighth study was conducted in July The ninth study was conducted in June From year to year, the recurring themes do not change much, even though the environment has changed. During the time since the survey series started, there has been a shift to defined contribution plans, the average age of the population surveyed has continued to increase, and there have been two periods of economic turmoil, including a major decline and slow recovery in housing prices. The Affordable Care Act was passed in 2010, and its future under a new administration in 2017 is unknown. To identify changes over time, the 2017 study includes some questions posed in the 2015 study and repeats some questions that were asked in earlier iterations of the survey. A comparison of the 2017 results to the results from previous iterations of the study (where available) and a demographic profile of the survey respondents can be found in the Trended Core Findings chapter of this report. Emphasis was placed on questions that focus on pre-retirees and retirees financial wellbeing now and in retirement, housing decisions and the use of home equity and issues related to caregiving and long-term care. Areas of emphasis vary by year, so this report should be considered together with reports from prior years. This report includes some of the repeated questions in the section on trended findings. The questionnaire for the study was designed by Greenwald & Associates, in cooperation with the SOA Committee on Post-Retirement Needs and Risks and its Project Oversight Group appointed by that committee. A total of 2,055 interviews (1,030 pre-retirees and 1,025 retirees) lasting an average of 20 minutes were conducted using Research Now s online consumer panel, from June 20 through June 30, Respondents born between 1937 and 1972 qualified for participation in the study. An additional 203 interviews were conducted among retired widows, 8
9 9 and results for widows are presented in the report where these results differ meaningfully from the results for retirees overall. As in previous iterations, respondents were classified as retirees if they described their employment status as retiree, had retired from a previous career, or were not currently employed and were either age 65 or older or had a retired spouse. All other respondents were classified as pre-retirees. The questions to determine retiree or pre-retiree status were asked early in the questionnaire. The sample data are weighted by age, sex, education, and household income to match targets obtained from the March 2016 Current Population Survey (CPS). This study includes pre-retirees and retirees at all income levels. Additional details about the weighting procedure are available upon request. To provide the most accurate comparisons with the results from the prior studies, the 2013 data was reweighted in 2015 using the same weighting variables as in 2015, and now Therefore, the results for 2013 presented in this report may not match data previously reported from this study. No theoretical basis exists for judging the accuracy of estimates obtained from non-probability samples, such as the online sample used for this survey. Most online samples are considered nonprobability samples because selection is not random and the probability that an individual from the target population will be included is unknown. However, there are possible sources of error in all surveys (both probability and non-probability) that may affect the reliability of survey results. These include imperfect sampling frames, refusals to be interviewed and other forms of nonresponse, the effects of question wording and question order, interviewer bias, and screening. While attempts are made to minimize these factors, it is impossible to quantify the errors that may result from them. In addition, caution should be exercised when comparing specific numerical results of the 2017 study with the results from questions from the 2011 or earlier iterations of the survey. Starting in 2013, this study was conducted online, while all previous studies in the series were conducted by telephone. Following this introduction is an executive summary. Page numbers are included for each of the highlighted findings so that the corresponding survey results can be easily located in the body of the report. The subsequent section presents the survey findings for each question asked on the survey. Findings for key questions are broken out for both pre-retirees and retirees by household income, age, and gender. This is followed by a comparison of the 2017 results to the results from previous iterations of the study and a demographic profile of the survey respondents. A posted questionnaire, which lists all of the survey questions and tabulated responses, is appended to the end of the report. Data presented in this report may not total to 100 percent due to rounding or missing categories. 9
10 10 EXECUTIVE SUMMARY This survey, like its predecessors, indicates the great financial/emotional challenge of the retirement period. The potential length of retirement for many, the uncertainties that abound and the certainty, eventually, of a decline in health all promote a certain level of concern, even to the many who enter retirement with a feeling of financial security. In 2017, the level of concern on a number of issues is notably higher than in The survey results do not clearly indicate the cause of this higher level of concern. It is pertinent that the equity market has performed well over the past two years and was doing very well at the time of the interviewing. On the other side, a change in political climate creates a higher level of uncertainty than has been experienced in quite some time and this may have led to higher levels of concern in finance-related areas. RETIREMENT CONCERNS AND PREPARATIONS Maintaining their desired quality of life and having enough money to pay for long-term care and health care worry both pre-retirees and retirees. While many have thought about their lifestyle in retirement and made important steps to prepare financially, such as eliminating consumer debt and cutting back on spending, many have not taken a number of steps that can help achieve financial security throughout retirement, such as consulting with a financial professional and purchasing a financial product that provides guaranteed income for life. Similar to previous years, pre-retirees are expecting to retire later than when retirees actually stopped working. (page 177) Each wave of this survey explores pre-retirees and retirees concerns. These results are similar to past waves of data, although 2017 sees an overall increase in anxiety. (page 163) o As in 2015, pre-retirees have a much higher level of concern than retirees on almost all of the finance-related issues measured in the survey. Inflation, health care, and long-term care continue to be top concerns for retirees and preretirees. (page 163) Respondents are moderately concerned about housing during the retirement period. Roughly half of pre-retirees and retirees worry about remaining in their home as they age, and over one in three coupled respondents worry about their spouse or partner s ability to stay in their home if they die first. (page 73) Few (15%) pre-retirees say their savings are ahead of schedule. About half of preretirees (51%) say their savings are behind schedule and one in three (33%) say they are on track. (page 25) 10
11 11 As expected, retirees are more likely than pre-retirees to have taken steps to financially protect themselves as they age. However, many pre-retirees plan to take these steps. As in past years, eliminating consumer debt, saving as much as they can and cutting back on spending are the most common preparations pre-retirees and retirees have made and plan to make to prepare for retirement. (page 154, 155) Many pre-retirees state they plan to take a number of steps to protect themselves financially as they age. Seven in ten (70%) state they intend to completely pay off their mortgage, including the 26% who have already done that. Fifty-eight percent have or plan to take less risky investments and 42% have or plan to postpone taking Social Security. (page 154) FINANCIAL WELLNESS Most pre-retirees and retirees feel financially secure. Especially among, pre-retirees, this security does not extend to their future outlook. Although most pre-retirees say their current financial situation is stable, they are a little less likely than retirees to feel secure. In addition to feeling slightly less secure, pre-retirees compared to retirees, are more likely to have problematic debt levels and higher spending. Additionally, nearly two-thirds of pre-retirees predict they will live on less income in retirement leading them to feel unprepared for substantial, but common, financial shocks that tend to occur in retirement. For instance, less than half of pre-retirees felt prepared to address unexpected healthcare costs. Most pre-retirees and retirees feel they do an excellent or very good job of managing their household s day-to-day budgeting and making medical decisions, but believe their efforts on more complex matters are less effective. They are especially doubtful in their efforts and plans to afford long-term care. There are also a number of areas in which pre-retirees and retirees feel vulnerable to financial setbacks caused by events they cannot control. Part of the reason for that vulnerability appears to be related to the fact that many have not conducted basic financial planning steps, such as the preparation of a comprehensive financial plan or owning insurance policies that could help them deal with financial exigencies. Despite feeling vulnerable, many are uninterested in education and support that could be provided by employers or community groups that could help them plan for retirement, manage their money and mitigate risk. Most feel secure in their current financial situation with pre-retirees feeling slightly less secure (62% pre-retirees vs. 70% retirees, 72% retired widows). The plurality of pre-retirees and retirees say they are now spending what they should, but pre-retirees are a little more likely to say their spending is problematic. (page 34) 11
12 12 o Not surprisingly, those in fair or poor health and in debt feel less secure. (page 36) The relatively high sense of financial security felt by most pre-retirees and retirees may be driven by their confidence in managing their household s finances. Over seven in ten pre-retirees (71%) and retirees (73%) and eight in ten retired widows (80%) say they are at least very good at paying bills and managing day-to-day spending. (page 37) Many pre-retirees and retirees feel confident in their ability to perform simple household financial tasks but fewer feel self-assured about their ability to perform more complex tasks. Compared to those already retired, pre-retirees feel particularly apprehensive about their abilities to live within a budget (47% pre-retirees vs. 57% retirees, 61% retired widows) and save for emergencies (38% pre-retirees vs. 51% retirees, 52% retired widows). (page 37) Pre-retirees are more likely to be in debt. About two in five retirees (38%) and retired widows (40%) are debt free, compared to only one in five pre-retirees (20%). The debt owed by pre-retirees is more likely to have a negative effect on their lifestyles (51% preretirees vs. 35% retirees, 37% retired widows).(page 41,49) Significant differences exist in the planning and insurance coverage of pre-retirees and retirees. Pre-retirees are more likely to be covered by a life insurance policy (77% pre-retirees vs. 53% retirees, 54% retired widows) while the retired are more likely to have an estate plan, will or trust and a comprehensive financial plan. Those who own these policies and plans review them frequently. (page 59) Costly financial shocks could be detrimental to a vast majority. For instance, only one in three say they could financially handle a 25% drop in their home value, running out of assets or a family member needing financial support. While a majority feel they are prepared to handle small financial shocks, there are still a significant number who would have trouble dealing with car repairs or home repairs. (page 52) As indicated, pre-retirees feel especially vulnerable to high health care costs. Therefore, it is not surprising they feel significantly less prepared than retirees to handle out-of-pocket medical expenses (48% pre-retirees vs. 61% retirees, 65% retired widows feel prepared to absorb medical costs). (page 52) Most are not currently consulting with a financial professional, but retirees report a moderate amount of interest and pre-retirees a high amount of interest in receiving support and education on a variety of finance-related topics. Younger pre-retirees and retirees are more interested than older respondents in nearly every topic. (page 68) 12
13 13 HOUSING DECISIONS A plurality of retirees live in single family homes with a significant amount of home equity. Very few live in communities designed for seniors and tend to move infrequently. Both retirees and pre-retirees see their homes as an important source of stability and security. Most are strongly committed to staying in their home throughout their retirement and, additionally, do not want to live with their children. Pre-retirees are naturally more uncertain about their future housing plans. The cost of housing (mortgage, rent, real estate taxes, maintenance) represents over a quarter of overall expenses for nearly half of retirees. Retirees see access to quality healthcare services, shopping and restaurants, transportation and professional support as important housing attributes during retirement. They also value housing that is near family members and inexpensive to maintain. There is a fairly even split in viewpoints on the use of home equity to fund retirement. Roughly equal proportions are 1) willing to use home equity to fund retirement as much as other possible assets 2) willing to use home equity only as a last resort and 3) do not intend to touch their home equity to fund their retirement. Pre-retirees are more willing than retirees to use home equity to fund retirement. Very few have a reverse mortgage or would consider one. People are committed to staying in their homes as they age. Although most do not have significant housing concerns, roughly half (52% pre-retirees, 47% retirees, 54% retired widows) are concerned about being able to remain in their home throughout retirement. (page 21) Pre-retirees are unlikely to have paid off their home mortgage. Only one in four (27%) pre-retirees own their home free and clear compared to roughly half of retirees (46%) and retired widows (50%). This difference may be driving pre-retirees housing concerns. Pre-retirees are more likely to be concerned that their home equity will not support their retirement plans (44% pre-retirees vs. 31% retirees, 35% retired widows) and that they have too much housing debt (33% pre-retirees vs. 16% retirees, 17% retired widows). (page 41, 73) The plurality of retirees and pre-retirees spend less than 25% of their overall expenses on housing. However, for a sizable proportion housing is more expensive, particularly for renters. For 16% of pre-retirees and 15% of retirees housing represents at least half of their overall expenses. (page 76) Homeownership affects the amount spent on housing. Compared to renters, homeowners spend less on housing. (page 75) For many homeowners, their home is a large asset in which they have built up considerable equity. 13
14 14 Pre-retirees and retirees hold divided views on selling their primary home to fund retirement, with pre-retirees expressing more willingness to do so than retirees. While about half of pre-retirees (47%), retirees (50%) and retired widows (54%) are familiar with reverse mortgages, very few (8% pre-retirees, 9% retirees, 10% retired widows) have a reverse mortgage or intend to get one. (page 82, 86, 134) The majority of retirees (64%) and retired widows (71%) and even close to half of pre-retirees (44%) plan to stay in their current home throughout retirement. The higher proportion of retirees planning to stay may be attributable to the fact that many retirees have already moved to their retirement home, while pre-retirees have yet to take that step. (page 88) Among those planning to move or are unsure, most are interested in downsizing but a sizable portion of pre-retirees (24%), retirees (35%) and retired widows (29%) plan to move to a similarly sized home in retirement. Very few are interested in upsizing. (page 90) Access to quality healthcare is the top housing attribute for all of those surveyed, over one in three pre-retirees (35%) and about half of retirees (45%) and retired widows (50%) say it is very important. Housing attributes that increase access to services such as transportation, shops and restaurants and professional help are also high in importance. (page 93) Living near family is also of value to pre-retirees and retirees but it is especially a priority for retired widows who are also more likely to find all aspects of living in an emotionally supportive community to be important. (page 94) Though living near loved ones is important, very few retirees plan to move in with family or have their family move in with them in retirement and a significant proportion (29% pre-retirees, 25% retirees, 35% retired widows) worry about being a burden. Additionally, a notable amount of uncertainty exists. Nearly one in five retired widows (18%) and pre-retirees (18%) and one in six retirees (14%) are unsure if they would live with family in retirement. (page 101) Given the value pre-retirees and retirees place on independence it is not surprising that independent living is considered a more attractive housing arrangement than assisted living or a continuing care retirement community. Half of pre-retirees and retirees find independent living very attractive, but only about one in six (15% preretirees and retirees) find assisted living very attractive and similar proportions (14% preretirees and 16% retirees) feel that way about a continuing care retirement community. However, about half of pre-retirees and retirees feel that assisted living and CCRCs are somewhat attractive. Very few find a nursing home attractive. (page 101) 14
15 15 LONG-TERM CARE AND CAREGIVING Paying for long-term care is a concern for many. These concerns are likely due, at least in part, to a majority of pre-retirees and retirees having at least one parent experience a condition that limited their independence. Additionally, about half of pre-retirees and retirees and seven in ten retired widows have been caregivers. Despite these experiences, few believe they are very likely to need care themselves, but most understand that requiring care would be a significant burden, financially and emotionally. If they required long-term care, most say they would rely on Medicare or pay for it themselves, which is noteworthy because Medicare pays for long-term care only in very limited circumstances. Many of the respondents appear to have insufficient financial resources to afford long-term care services for a lengthy period of time. Planning for long-term care appears to shape respondents concerns about their financial security in retirement, and seems to be affected by their parents experiences. Pre-retirees and retirees whose parents required long-term care are more likely to be concerned about their own financial security. Pre-retirees are less likely to have parents who have required long-term care, no doubt because their parents on average, are younger than the parents of retirees. Nevertheless, many pre-retirees and retirees parents have required care from family, friends or professional caregivers. Compared to previous waves of data, there is an increase in the number of respondents whose parents required long-term care or experienced a decrease in independence due to physical or cognitive decline. (page 109, page 178) A majority of pre-retirees and retirees say their parents are or were financially comfortable in retirement. (page 112) Despite this comfort for a sizable minority, their parents required financial help. Roughly one in five pre-retirees and retirees have provided their parents with financial support and a significant minority (21% pre-retirees, 32% retirees) say their parents required help in managing their finances after losing the capacity to do so themselves. (page 115) Many have also been caregivers. Half of pre-retirees (47%) and retirees (53%) and nearly three in four of retired widows (72%) have been a caregiver. (page 117) Experience with caregiving is extensive among pre-retirees and retirees. Roughly seven in ten pre-retirees (73%) and retirees (67%) have been at least somewhat involved in deciding their parents long-term care. (page 117) Current caregivers say providing care is more of an emotional burden than a financial or physical one. A different story emerges when the individual needing care is in their household but three in four pre-retirees (79%) and retirees (73%) admit if their spouse or themselves required long term care it would be a major financial burden. (page 126) 15
16 16 Retirees and pre-retirees are giving a significant amount of thought to the issue of how to pay for long-term care and who will provide it, but majorities still feel it is unlikely they will ever require it. (page 124) A plurality of pre-retirees (41%) and retirees (33%) would turn to their spouse for caregiving needs while retired widows are more likely to rely on their children (30% daughter or daughter-in-law, 15% son or son-in-law) or a long-term care facility (20%). Significant portions of pre-retirees (18%) and retirees (22%) are uncertain about who they would turn to for care. (page 127) Although Medicare only provides long-term care benefits in limited circumstances, it is still the benefit program that one in three pre-retirees (33%) and half of retirees (50%) and retired widows (55%) plan to rely on. Other ways pre-retirees and retirees plan to pay for long-term care are to pay for it themselves and rely on health insurance. However, it should be noted that most health insurance plans do not cover long-term care or cover it in extremely restricted circumstances for a limited period of time. Only about one in seven say they would rely on long-term care insurance and even fewer say they will turn to family and friends to help them pay for long-term care. (page 131) Not only is Medicare the benefit program most are planning to use for long term care, but it is also the program the respondents say they are most familiar with: retirees and retired widows are especially familiar with Medicare. While they are familiar with Medicare, they have inflated expectations with regard to what it covers. About half are familiar with Medicaid and long-term care insurance. (page 134) Among pre-retirees and retirees only about one in five are at least somewhat familiar with approaches to help guarantee retirement income and could help provide funds for long-term care, such as longevity insurance or deferred income annuities. (page 134) Almost half of pre-retirees say they have saved money to pay for potential long-term care costs: few have taken other steps to prepare for the possible need for long-term care. There is no indication that those who have saved would have enough to cover a major long-term care event. Many say they intend to take a variety of steps. (page 137) The experiences of their parents have impacted the views of pre-retirees and retirees and are more likely to increase concerns about financial security in retirement. Overall, more than half of pre-retirees (56%) and four in ten retirees (43%) say they are more concerned about their own financial security because of their parents experiences. Only a small portion are less concerned (9% pre-retirees, 14% retirees) (page 140) Pre-retirees and retirees whose parents required long-term care are especially concerned. Two-thirds (67%) of pre-retirees and nearly half (46%) of retirees say their parents experience made them more concerned about their own financial security, a far higher level of concern than among those who parents did not require care (41% preretirees and 32% retirees). (page 143) 16
17 17 DIFFERENCES BY POPULATION SUBGROUP This section summarizes meaningful differences by key population subgroups. Detailed tabulations by subgroup are shown in subsequent sections. Differences by Household Income There are stark differences in responses by household income. As in previous waves, both retirees and pre-retirees with lower household incomes are more likely than those with higher incomes to be concerned about most retirement risks, including risks related to housing. Lower income pre-retirees are more likely to expect to retire later or not retire at all. However, in this year s wave there is no significant difference by income regarding actual retirement age. Not surprisingly, higher income pre-retirees and retirees feel more financially secure and are more confident in their ability to manage financial tasks and absorb financial shocks in retirement. High-income and low-income pre-retirees and retirees mitigate financial retirement risks differently. Lower income households are more likely to cut back on spending while higher income households are more likely to eliminate consumer debt, invest in stocks or stock mutual funds, pay off their primary home mortgage or move assets into more conservative investments. Additionally, higher income pre-retirees and retirees are more likely to have given at least some thought to important aspects of retirement including their desired lifestyle, adequacy of current savings to meet retirement expenses and retirement investment strategies. Affluent retirees and pre-retirees are more likely to be more proactive about steps to try to assure financial security throughout retirement. More high-income pre-retirees and retirees have taken steps to financially prepare for retirement, such as owning life and disability insurance, having a will, estate plan or living will and creating an investment plan or comprehensive financial plan. Compared to those less affluent, they are also more interested in several topics of financial education, including healthcare expenses and estate and will planning. Household income is not correlated to indebtedness, but it is correlated to the type of debt owed. Higher income retirees and pre-retirees are more likely to have a personal or car loan while those earning less are more likely to owe money to a healthcare provider or have taken a loan from family or friends. Lower income pre-retirees and retirees are more uncertain about key aspects of their retirement compared to those with higher incomes. They are more likely to be concerned about burdening their children and are unsure if they will move in with family during retirement. They are more uncertain about when they may require a long-term care solution, who would be their primary caregiver and how they would pay for care. They are also less 17
18 18 proactive and less familiar with long-term care solutions and less likely to have made financial preparations for the potential need for long-term care. Differences by Gender On average, women anticipate living slightly longer than men. Compared to men, women are more intensely concerned about certain financial aspects of retirement including keeping up with the rate of inflation, paying for a nursing home or long-term care, depleting their savings and maintaining their standard of living. Despite these increased concerns, there is little significant difference in how men and women are preparing to protect themselves financially. Generally, women see themselves as more financially vulnerable than men. Women feel slightly less secure and less prepared to absorb financial shocks. However, men and women devise and manage financial plans and obtain insurance coverage at similar rates. Female retirees and retired widows are more likely to be working with a financial advisor than their male counterparts, but, still, few are. Moreover, pre-retired women are more interested than men in receiving financial advice and support on a variety of topics, including planning for income in retirement, how to determine financial readiness and estate and will planning. Compared to men, women are more concerned about remaining in their home as they age, having a choice in where they live, building a sufficient amount of equity to support them in retirement and managing housing debt. They also are more likely to place importance on living in an emotionally supportive community including near family and friends. Women are not only more likely than men to spend time being a caregiver, but they are also more likely to be relied upon by men and parents. Men are more likely to turn to their spouses for long-term care than women. Moreover, pre-retirees and retirees are more likely to rely upon their daughters than their sons for care. There is little difference between how men and women plan to pay for long-term care, but among pre-retirees, men are more familiar with benefit programs and products. Differences by Age Differences in responses by age, particularly among pre-retirees, tend to mirror differences between pre-retirees and retirees. For example, younger pre-retirees and younger retirees are more likely than their older counterparts to indicate they are very or somewhat concerned about nearly all financial aspects of retirement and some aspects of housing such as having too much housing debt. 18
19 19 Despite younger pre-retirees and retirees increased concerns, younger pre-retirees are less likely to have already taken important financial steps, including eliminating consumer and mortgage debt and consulting a financial professional. Compared to pre-retirees and retirees over age 65, younger respondents feel less financially secure and are less likely to positively rate their ability to manage day-to-day spending, live within a budget or save for the long-term. Additionally, more younger preretirees and retirees in debt say it has negatively impacted their lifestyle. These increased concerns lead younger pre-retirees and retirees to be more interested than their older counterparts in receiving financial education and support. Older pre-retirees and retirees are more likely than those younger to plan to remain in their current home, but age is not strongly correlated to which housing attributes people find important. Older pre-retirees and retirees are more likely than their younger counterparts to have had a parent who experienced an illness that limited their ability to care for themselves. Additionally, they are more likely to be familiar with Medicare and have taken steps to prepare to pay for long-term care. 19
20 20 SURVEY FINDINGS RETIREMENT CONCERNS & PREPARATION Retirees face a retirement lasting an estimated 30 years, while pre-retirees anticipate roughly a 20-year retirement. Retirees face a number of financial planning challenges and potential financial risks. Many retirees express concern, and pre-retirees even more so. These findings are consistent with past waves of this research and are examined in-depth further in the report. This section examines retirement concerns, expected longevity and savings endurance as well as strategies and actions taken by pre-retirees and retirees. Pre-retirees, now a median age 54, have a little over 10 years until expected retirement, expecting to retire at a median age of 65. Retirees, median age 67, report that they retired seven years ago, at age 60 (median). Pre-retirees anticipate working 5 years longer than retirees actually did. This finding is consistent with past waves of this research, and other research, including the Employee Benefit Research Institute s annual Retirement Confidence Survey, also finds a gap between when pre-retirees expect to retire and when retirees actually do. The difference is typically attributable to people retiring earlier than they plan for reasons of health or changes in the workplace. Asked to estimate their own personal life expectancy, both pre-retirees and retirees alike believe they will live to age 85 (median). On the whole, this means most expect to spend at least 20 years in retirement, a long (and uncertain) period of time to plan for, and concerning to many. Pre-retirees expect retirement to last 20 years, while retirees estimate closer to 30 years (27 years, median). This 10-year gap is potentially problematic, as pre-retirees may be significantly underestimating how long their resources will need to last in retirement. Maintaining their desired quality of life and paying for long-term care and health care continue to be top concerns for both pre-retirees and retirees. While many have given thought to their retirement lifestyle and the adequacy of their savings, fewer have taken financial planning action to help mitigate their concerns and the financial risks they may face during the retirement period. Concerns in Retirement Pre-retirees and retirees are most concerned about their savings keeping up with inflation, having enough money to pay for a nursing home or long-term care if needed, and affording quality health care. Compared to 2015, there is increased concern. Entering retirement causes particularly high levels of stress as pre-retirees are more concerned for nearly all of the retirement issues examined. 20

21 21 Remaining in their home and the ability of their spouse or partner to stay at home also causes worry. Roughly half of pre-retirees and retirees worry about remaining in their home as they age, and over one in three coupled respondents worry about their spouse or partner s ability to stay at home. Figure 1: Concerns in Retirement How concerned are you about each of the following (during retirement)? 1. Asked among homeowners 2. Asked among homeowners with a spouse or partner 21
22 22 Figure 2: Concerns in Retirement by Income How concerned are you about each of the following (during retirement)? (%Very/Somewhat concerned) <$50K (n=241) Pre-retirees Retirees Retired Widows $50K to $99K (n=395) $100K+ (n=394) <$35K (n=318) $35K to $74K (n=391) $75K+ (n=316) <$35K (n=185) $35K+ (n=236) (a) (b) (c) (a) (b) (c) (a) (b) The value of your savings and investments might not keep up with inflation 82%C 81% C 72% 66% C 58% C 45% 76% B 57% You might not have enough money to pay for a long stay in a nursing home or a long period of nursing care at home 78 C 76 C BC 59 C B 56 You might not have enough money to pay for adequate health care 86 C 78 C BC 50 C B 45 You might deplete all of your savings 79 C 74 C BC 49 C B 46 You might not be able to maintain a reasonable standard of living for the rest of your life 80 BC 70 C BC 48 C B 46 There might come a time when you (and your spouse/partner) are incapable of managing your finances You might not be able to maintain the same standard of living after your spouse/partner s death, if he/she should die first Your spouse/partner might not be able to maintain the same standard of living after your death 74 BC 61 C BC 49 C B C 64 C BC 47 C C 60 C BC 46 C You might be a victim of a fraud or scam 53 C C B 49 You might not be able to leave money to your children or other heirs 53 BC 43 C BC 31 C B 21 You may not be able to stay in your home as you age 1 65 C 57 C BC Your spouse or partner may not be able to stay in your home, if you should die first 2 53 C 43 C BC 38 C Asked among homeowners 2. Asked among homeowners with a spouse or partner 22
23 23 Figure 3: Concerns in Retirement by Gender How concerned are you about each of the following (during retirement)? (%Very/Somewhat concerned) Pre-retirees Male (n=511) Female (n=519) Male (n=493) Retirees Female (n=532) (a) (b) (a) (b) The value of your savings and investments might not keep up with inflation 71% 83% A 52% 62% A You might not have enough money to pay for a long stay in a nursing home or a long period of nursing care at home A A You might not have enough money to pay for adequate health care A You might deplete all of your savings A A You might not be able to maintain a reasonable standard of living for the rest of your life A There might come a time when you (and your spouse/partner) are incapable of managing your finances A You might not be able to maintain the same standard of living after your spouse/partner s death, if he/she should die first A Your spouse/partner might not be able to maintain the same standard of living after your death B 35 You might be a victim of a fraud or scam You might not be able to leave money to your children or other heirs A A You may not be able to stay in your home as you age A A Your spouse or partner may not be able to stay in your home, if you should die first Asked among homeowners 2. Asked among homeowners with a spouse or partner 23
24 24 Figure 4: Concerns in Retirement by Age How concerned are you about each of the following (during retirement)? (%Very/Somewhat concerned) (n=519) Pre-retirees Retirees Retired Widows (n=423) 65+ (n=88) (n=394) (n=415) (n=216) (n=180) (n=241) (a) (b) (c) (a) (b) (c) (a) (b) The value of your savings and investments might not keep up with inflation 80%C 77% 67% 58% 58% 53% 67% 65% You might not have enough money to pay for a long stay in a nursing home or a long period of nursing care at home You might not have enough money to pay for adequate health care 78 C 75 C C 55 C You might deplete all of your savings You might not be able to maintain a reasonable standard of living for the rest of your life There might come a time when you (and your spouse/partner) are incapable of managing your finances You might not be able to maintain the same standard of living after your spouse/partner s death, if he/she should die first Your spouse/partner might not be able to maintain the same standard of living after your death 71 BC C 58 C C B C B You might be a victim of a fraud or scam 49 B B 48 You might not be able to leave money to your children or other heirs 47 BC You may not be able to stay in your home as you age Your spouse or partner may not be able to stay in your home, if you should die first Asked among homeowners 2. Asked among homeowners with a spouse or partner 24
 who consider themselves to be behind by a lot. Only 15% feel ahead of schedule. Perhaps their lack of confidence is warranted.")
25 25 Mitigating Financial Risks in Retirement Despite feeling currently financially secure, pre-retirees have little confidence in their retirement preparations, as half say their financial planning and savings are behind schedule, including one in five (21%) who consider themselves to be behind by a lot. Only 15% feel ahead of schedule. Perhaps their lack of confidence is warranted. Roughly three in ten have given little or no thought to whether or not their savings will be sufficient to cover their retirement expenses (31%) or even the type of lifestyle they want in retirement (28%). Few have given a great deal of thought to retirement assets and investments. Just 28% of pre-retirees have given a great deal of thought to how long their assets will last in retirement, and just one in six (16%) have seriously considered how they should invest their assets during retirement. Figure 5: Amount of Thought Given to Financial Retirement Aspects How much thought have you given to each of the following aspects of your finances in retirement? 25
26 26 Figure 6: Amount of Thought Given to Financial Retirement Aspects by Income How much thought have you given to each of the following aspects of your finances in retirement? (%A great deal/some) <$50K (n=241) Pre-retirees Retirees Retired Widows $50K to $99K (n=395) $100K+ (n=394) <$35K (n=318) $35K to $74K (n=391) $75K+ (n=316) <$35K (n=185) $35K+ (n=236) (a) (b) (c) (a) (b) (c) (a) (b) The type of lifestyle you want for the rest of your life 64% 66% 80% AB 56% 79% A 86% AB 60% 86% A How well your current savings will meet your expense needs for retirement A 77 AB A 82 AB A What the cost of healthcare will be during your retirement A 77 A How long your assets will last in retirement A 74 AB A 79 A A Who will manage your finances if you become unable A 67 A A How you should invest your financial assets during retirement AB A 77 AB A 26
27 27 Figure 7: Amount of Thought Given to Financial Retirement Aspects by Gender How much thought have you given to each of the following aspects of your finances in retirement? Pre-retirees Retirees (%A great deal/some) Male (n=511) Female (n=519) Male (n=493) Female (n=532) (a) (b) (a) (b) The type of lifestyle you want for the rest of your life 71% 72% 71% 73% How well your current savings will meet your expense needs for retirement What the cost of healthcare will be during your retirement How long your assets will last in retirement Who will manage your finances if you become unable A How you should invest your financial assets during retirement 58 B Figure 8: Amount of Thought Given to Financial Retirement Aspects by Age How much thought have you given to each of the following aspects of your finances in retirement? (%A great deal/some) (n=519) Pre-retirees Retirees Retired Widows (n=423) 65+ (n=88) (n=394) (n=415) (n=216) (n=180) (n=241) (a) (b) (c) (a) (b) (c) (a) (b) The type of lifestyle you want for the rest of your life 70% 74% 72% 73% 72% 69% 80% B 68% How well your current savings will meet your expense needs for retirement A A What the cost of healthcare will be during your retirement A 75 A How long your assets will last in retirement A B 65 Who will manage your finances if you become unable A 59 A B 66 How you should invest your financial assets during retirement
28 28 Financial Protection Strategies in Retirement Retirees, not surprisingly, are more likely to have already taken steps to protect themselves financially as they age while pre-retirees plan to do many of these things in the future. Tackling consumer debt, saving as much as possible, and cutting back expenses are the most common actions pre-retirees and retirees have taken or plan to take to protect themselves financially. More than three in four pre-retirees have or plan to take these steps, as have more than six in ten retirees. In comparison to 2015, more pre-retirees plan to eliminate all consumer debt and completely pay off their mortgage. There are some strategies that seem more popular among pre-retirees than retirees. In addition to differences in expected versus actual retirement ages, pre-retirees are much more likely to say that they have or will work longer to improve their retirement finances; 51% of pre-retirees have or plan to work longer, compared to just 10% of retirees. Although question wording changed significantly, the proportion of pre-retirees willing to work longer has increased from Another pronounced difference, pre-retirees are more likely to say that have or plan to postpone claiming Social Security; four in ten pre-retirees (42%) say this, compared to two in ten retirees (20%). More so than retirees, more than a third of pre-retirees say they have or plan to purchase a product that provides guaranteed lifetime income (35% vs. 24% of retirees). In 2017, there is increased interest among pre-retirees and retirees in buying a product that provides guaranteed lifetime income. Lastly, while majorities have or aim to pay off their mortgage, pre-retirees are more likely to cite this as a step they have or will take to protect themselves financially in retirement (70% vs. 62% of retirees). 28
?")
29 29 Figure 9: Actions Taken for Financial Protection Have you already done the following, plan to do it in the future, or have no plans to do it to protect yourself financially (after you retire/as you get older)? 29
30 30 Figure 10: Actions Taken for Financial Protection by Income Have you already done the following, plan to do it in the future, or have no plans to do it to protect yourself financially (after you retire/as you get older)? %Already done <$50K (n=241) Pre-retirees Retirees Retired Widows $50K to $99K (n=395) $100K+ (n=394) <$35K (n=318) $35K to $74K (n=391) $75K+ (n=316) <$35K (n=185) $35K+ (n=236) (a) (b) (c) (a) (b) (c) (a) (b) Eliminate all of your consumer debt, by paying off all credit cards and loans 23% 34% A 43% AB 34% 50% A 58% A 37% 56% A Try to save as much money as you can AB A 55 A Cut back on spending 37 BC BC 42 C B 36 Completely pay off your mortgage A A 51 A A Move your assets to less risky investments as you get older A 31 AB A 47 A A Invest a portion of your money in stocks or stock mutual funds A 58 AB A 60 AB A Consult a financial professional for advice or guidance A 32 AB A 50 AB A Postpone taking Social Security A A 9 19 A Buy a product or choose an employer plan option that will provide you with guaranteed income for life 7 16 A 18 A 6 23 A 31 A 9 28 A Work longer 19 B B
31 31 Figure 11: Actions Taken for Financial Protection by Gender Have you already done the following, plan to do it in the future, or have no plans to do it to protect yourself financially (after you retire/ as you get older)? %Already done Male (n=511) Pre-retirees Female (n=519) Male (n=493) Retirees Female (n=532) (a) (b) (a) (b) Eliminate all of your consumer debt, by paying off all credit cards and loans 38% 34% 47% 45% Try to save as much money as you can Cut back on spending A A Completely pay off your mortgage Move your assets to less risky investments as you get older Invest a portion of your money in stocks or stock mutual funds 49 B Consult a financial professional for advice or guidance A Postpone taking Social Security Buy a product or choose an employer plan option that will provide you with guaranteed income for life B 15 Work longer
32 32 Figure 12: Actions Taken for Financial Protection by Age Have you already done the following, plan to do it in the future, or have no plans to do it to protect yourself financially (after you retire/ as you get older)? %Already done (n=519) Pre-retirees Retirees Retired Widows (n=423) 65+ (n=88) (n=394) (n=415) (n=216) (n=180) (n=241) (a) (b) (c) (a) (b) (c) (a) (b) Eliminate all of your consumer debt, by paying off all credit cards and loans 30% 40% A 57% AB 42% 46% 53% A 49% 46% Try to save as much money as you can AB B 38 Cut back on spending Completely pay off your mortgage A 38 A Move your assets to less risky investments as you get older A 49 AB Invest a portion of your money in stocks or stock mutual funds AB Consult a financial professional for advice or guidance A 41 A Postpone taking Social Security AB 9 17 A B 11 Buy a product or choose an employer plan option that will provide you with guaranteed income for life A 22 A Work longer AB
33 33 FINANCIAL WELLNESS AMONG PRE-RETIREES & RETIREES Feelings of security vary, but most pre-retirees and retirees feel financially secure. Further, a majority of pre-retirees and retirees feel they do an excellent or very good job of managing their household s day to day budgeting and making medical decisions. However, on more complex matters, most rate their efforts as less effective. People are least likely to feel they have done a good job of planning for possible long-term care costs. Debt is a significant issue for many. There are also a number of areas in which pre-retirees and retirees feel vulnerable to a financial setback caused by events they cannot control. Part of the reason for that vulnerability is that many have not conducted basic financial planning steps, such as the preparation of a comprehensive financial plan that could help them deal with financial exigencies. Further, many do not have disability insurance (other than Social Security) and long-term care insurance that also offer important protections. Most do not use the services of a professional financial advisor. Those who use an advisor or have a financial plan feel more secure and have made more preparations to protect themselves financially in retirement. These significant differences are examined in-depth further in the report. Despite a feeling of vulnerability, many are not interested in education and support that employers or community groups might provide that could help them take effective action in planning for retirement, managing money in retirement and deal with key risk. This section will examine how pre-retirees, retirees and retired widows assess their financial security and what steps they have taken or are interested in taking to protect themselves in retirement. Current Financial Management Overall, about two-thirds feel financially secure, though retirees are more likely to feel this way, with one in five retirees (21%) feeling very secure compared to just 14% of pre-retirees. Health status and debt affect financial security. Pre-retirees and retirees in good health and without debt feel more secure. Roughly seven in ten (71% pre-retirees, 73% of retirees) feel they do an excellent or very good job of paying bills and managing their day-to-day finances. Fewer feel they do such a good job of living within a budget. Retirees are especially likely to feel they do well living within a budget (57% vs. 47% pre-retirees). This is perhaps not surprising considering that pre-retirees are significantly more likely to say they spend more than they should (34% vs. 23% of retirees), while retirees are more likely to say they spend much less than they could (17% vs. 11% of pre-retirees). An expected result of greater feelings of security and better budgeting retirees (51%) are more likely to say that they do an excellent or very good job of managing emergency expenses, compared to just 38% of pre-retirees who feel they are doing a good job of saving for emergencies. Retirees are also more likely to feel they are excellent or very good at making medical insurance decisions. Though their insurance decisions may be simpler, nearly two-thirds of retirees (63%) suggest they make good health insurance decisions, compared to just 56% of pre-retirees. Only two in five pre-retirees feel they are doing an excellent or very good job of investing for the long term (39%) or saving for emergencies (38%). Far fewer, however, among both retirees and preretirees feel they are excellent or very good at planning for long-term care. Fewer than a quarter 33
34 34 of retirees (23%) and just 19% of pre-retirees feel they have done an excellent or very good job on this. Figure 13: Financial Security How financially secure do you feel currently? Figure 14: Financial Security by Income How financially secure do you feel currently? (%Very/Somewhat secure) $50K (n=241) Pre-retirees Retirees Retired Widows $50K to $99K $100K+ (n=395) (n=394) <$35K (n=318) $35K to $74K (n=391) $75K+ (n=316) <$35K (n=185) $35K+ (n=236) (a) (b) (c) (a) (b) (c) (a) (b) Very secure 5% 10% 20% AB 8% 22% A 37% AB 8% 30% A Somewhat secure A 56 AB A 56 A Not too secure 34 C 29 C C 17 C 5 26 B 11 Not at all secure 31 BC 10 C 5 27 BC 8 C 2 18 B 3 NET: Very/Somewhat secure A 76 AB A 93 AB A NET: Not too/not at all secure 65 BC 39 C BC 25 C 7 44 B 18 34
35 35 Figure 15: Financial Security by Gender How financially secure do you feel currently? (%Very /Somewhat secure) Male (n=511) Pre-retirees Female (n=519) Male (n=493) Retirees Female (n=532) (a) (b) (a) (b) Very secure 14% 13% 23% 19% Somewhat secure 55 B Not too secure Not at all secure 8 15 A NET: Very/Somewhat secure 69 B NET: Not too/not at all secure A Figure 16: Financial Security by Age How financially secure do you feel currently? (%Very /Somewhat secure) (n=519) Pre-retirees Retirees Retired Widows (n=423) 65+ (n=88) (n=394) (n=415) (n=216) (n=180) (n=241) (a) (b) (c) (a) (b) (c) (a) (b) Very secure 10% 17% A 20% 21% 19% 25% 20% 19% Somewhat secure A Not too secure 29 B Not at all secure 11 C 15 C 5 18 C NET: Very/Somewhat secure AB A 75 A NET: Not too/not at all secure 40 C 37 C BC

36 36 Figure 17: Financial Security by Debt How financially secure do you feel currently? Figure 18: Financial Security by Health Status How financially secure do you feel currently? 36

37 37 Figure 19: Assessment of Current Financial Management How would you rate your household s management of the following financial tasks? 37
38 38 Figure 20: Assessment of Current Financial Management by Income How would you rate your household s management of the following financial tasks? (%Excellent/Very good) <$50K (n=241) Pre-retirees Retirees Retired Widows $50K to $99K $100K+ (n=395) (n=394) <$35K (n=318) $35K to $74K (n=391) $75K+ (n=316) <$35K (n=185) $35K+ (n=236) (a) (b) (c) (a) (b) (c) (a) (b) Paying bills and managing day-to-day spending 58% 69% A 79% AB 60% 80% A 84% A 68% 86% A Medical insurance decisions A 69 AB A 76 A A Living within a budget A 67 A A Drawing income from your savings and investments A 69 AB A Saving for emergencies/managing emergency expenses A 48 AB A 74 AB A Saving and investing for the long-term A 53 AB Planning for long-term care A 23 A A 39 AB A Figure 21: Assessment of Current Financial Management by Gender How would you rate your household s management of the following financial tasks? (%Excellent/Very good) Male (n=511) Pre-retirees Female (n=519) Male (n=493) Retirees Female (n=532) (a) (b) (a) (b) Paying bills and managing day-to-day spending 71% 71% 74% 73% Medical insurance decisions Living within a budget Drawing income from your savings and investments Saving for emergencies/managing emergency expenses Saving and investing for the long-term Planning for long-term care
39 39 Figure 22: Assessment of Current Financial Management by Age How would you rate your household s management of the following financial tasks? (%Excellent/Very good) (n=519) Pre-retirees Retirees Retired Widows (n=423) 65+ (n=88) (n=394) (n=415) (n=216) (n=180) (n=241) (a) (b) (c) (a) (b) (c) (a) (b) Paying bills and managing day-to-day spending 68% 72% 89% AB 69% 74% 81% A 74% 79% Medical insurance decisions A AB Living within a budget A B Drawing income from your savings and investments AB Saving for emergencies/managing emergency expenses A 50 A AB Saving and investing for the long-term Planning for long-term care Figure 23: Assessment of Current Financial Management by Financial Advisor How would you rate your household s management of the following financial tasks? (%Excellent/Very good) Work With An Advisor (n=342) Pre-retirees Retirees Retired Widows Do Not Work With An Advisor (n=688) Work With An Advisor (n=367) Do Not Work With An Advisor (n=658) Work With An Advisor (n=172) Do Not Work With An Advisor (n=249) (a) (b) (a) (b) (a) (b) Paying bills and managing day-to-day spending 79% B 67% 88% B 67% 86% B 72% Medical insurance decisions 68 B B B 64 Living within a budget 56 B B B 56 Drawing income from your savings and investments B B 35 Saving for emergencies/managing emergency expenses 51 B B B 37 Saving and investing for the long-term 59 B Planning for long-term care 28 B B B 16 39
40 40 Figure 24: Assessment of Current Financial Management by Financial Plan How would you rate your household s management of the following financial tasks? (%Excellent/Very good) Have A Financial Plan (n=325) Pre-retirees Do Not Have A Financial Plan (n=705) Have A Financial Plan (n=453) Retirees Do Not Have A Financial Plan (n=572) (a) (b) (a) (b) Paying bills and managing day-to-day spending 85% B 65% 89% B 63% Medical insurance decisions 75 B B 51 Living within a budget 70 B B 45 Drawing income from your savings and investments B 27 Saving for emergencies/managing emergency expenses 66 B B 33 Saving and investing for the long-term 69 B Planning for long-term care 37 B B 10 40
41 41 Debt Pre-retirees carry more types of non-mortgage debt and in greater amounts than retirees. Seventy-one percent of pre-retirees have some type of non-mortgage debt. Nearly half of preretirees (46%) have credit card debt, compared to about a third of retirees (36%). They are more likely to have a car or personal loan (44% vs. 29% of retirees), college or student loans (15% vs. 3%), and they are more likely to have taken a loan from their workplace retirement plan (8% vs. 1%). In addition, pre-retirees are more likely to have a mortgage (55% vs. 29%), as well as a home equity or home improvement loan (19% vs. 11%). Debt was a special topic explored in 2015; details of these trended findings can be found on page 161. Figure 25: Types of Debt Owed Do you (and/or your spouse/partner) currently have any of the following non-mortgage debt/do you currently own your primary home, rent, or have some other primary living arrangement? 1. Asked among homeowners 41
42 42 Figure 26: Types of Debt Owed by Income Do you (and/or your spouse/partner) currently have any of the following non-mortgage debt/do you currently own your primary home, rent, or have some other primary living arrangement? Types of Debt Owed <$50K (n=241) Pre-retirees Retirees Retired Widows $50K to $99K $100K+ (n=395) (n=394) <$35K (n=318) $35K to $74K (n=391) $75K+ (n=316) <$35K (n=185) $35K+ (n=236) (a) (b) (c) (a) (b) (c) (a) (b) Own primary home and owe money on a mortgage 36% 53% A 65% AB 19% 30% A 39% AB 19% 30% A Credit card debt BC B 29 Personal or car loan from a bank or credit union A 48 A A A home equity line of credit or home improvement loan A 7 14 Debt to a health care provider 16 BC BC B 1 College or student loans A loan from a workplace retirement plan 5 9 A * A loan from family or friends 8 BC B Asked among homeowners * = <.5% 42
43 43 Figure 27: Types of Debt Owed by Gender Do you (and/or your spouse/partner) currently have any of the following non-mortgage debt/do you currently own your primary home, rent, or have some other primary living arrangement? Types of Debt Owed Male (n=511) Pre-retirees Female (n=519) Male (n=493) Retirees Female (n=532) (a) (b) (a) (b) Own primary home and owe money on a mortgage 52% 57% 29% 28% Credit card debt Personal or car loan from a bank or credit union A home equity line of credit or home improvement loan Debt to a health care provider College or student loans A loan from a workplace retirement plan A loan from family or friends Asked among homeowners 43
44 44 Figure 28: Types of Debt Owed by Age Do you (and/or your spouse/partner) currently have any of the following non-mortgage debt/do you currently own your primary home, rent, or have some other primary living arrangement? Types of Debt Owed (n=519) Pre-retirees Retirees Retired Widows (n=423) 65+ (n=88) (n=394) (n=415) (n=216) (n=180) (n=241) (a) (b) (c) (a) (b) (c) (a) (b) Own primary home and owe money on a mortgage 59% B 49% 50% 31% C 32% C 17% 24% 25% Credit card debt 49 C Personal or car loan from a bank or credit union A home equity line of credit or home improvement loan Debt to a health care provider 10 C 10 C 4 13 BC College or student loans 20 BC A loan from a workplace retirement plan 10 BC 6 C 1 2 C A loan from family or friends 5 B 2 C Asked among homeowners Amount of Debt One-quarter of pre-retirees with debt (25%) have non-mortgage debts totaling between $20,000 and $49,999 and another 18% have $50,000 or more of non-mortgage debt. While retirees are less likely to report certain types of debt, there are many who are carrying non-mortgage debt in retirement 54% of retirees have some type of non-mortgage debt. Of those, 18% have debt balances of $20,000 to $49,999 and 8% have debts of $50,000 or more. 44
45 45 Figure 29: Amount of Debt Owed Excluding Mortgage Debt Not including your mortgage, approximately how much debt do you (and your spouse/partner) have in total? (Asked among those in debt) 45
46 46 Figure 30: Amount of Debt Owed Excluding Mortgage Debt by Income Not including your mortgage, approximately how much debt do you (and your spouse/partner) have in total? (Asked among those in debt) Amount of Debt Owed Excluding Mortgage Debt <$50K (n=174) Pre-retirees Retirees Retired Widows $50K to $99K $100K+ (n=272) (n=268) <$35K (n=191) $35K to $74K (n=202) $75K+ (n=172) <$35K (n=109) $35K+ (n=113) (a) (b) (c) (a) (b) (c) (a) (b) Less than $1,000 12% C 8% C 4% 12% 7% 10% 10% 15% $1,000 to $4, C 9 27 BC $5,000 to $9, $10,000 to $14, C 18 C $15,000 to $19, $20,000 to $29, A 4 13 A $30,000 to $49, A 10 A 5 7 $50,000 to $74, AB $75,000 to $99, A -- 2 $100,000 or more B AB * 2 * = <.5% 46
47 47 Figure 31: Amount of Debt Owed Excluding Mortgage Debt by Gender Not including your mortgage, approximately how much debt do you (and your spouse/partner) have in total? (Asked among those in debt) Amount of Debt Owed Excluding Mortgage Debt Male (n=334) Pre-retirees Female (n=380) Male (n=266) Retirees Female (n=299) (a) (b) (a) (b) Less than $1,000 3% 10% A 8% 12% $1,000 to $4, $5,000 to $9, $10,000 to $14, $15,000 to $19, $20,000 to $29, $30,000 to $49, B $50,000 to $74, $75,000 to $99, $100,000 or more
48 48 Figure 32: Amount of Debt Owed Excluding Mortgage Debt by Age Not including your mortgage, approximately how much debt do you (and your spouse/partner) have in total? (Asked among those in debt) Amount of Debt Owed Excluding Mortgage Debt (n=375) Pre-retirees (n=283) 65+ (n=56) (n=230) Retirees (n=225) (n=110) Retired Widows (n=90) (n=132) (a) (b) (c) (a) (b) (c) (a) (b) Less than $1,000 6% 8% 9% 8% 13% 9% 15% 11% $1,000 to $4, $5,000 to $9, $10,000 to $14, $15,000 to $19, $20,000 to $29, $30,000 to $49, C $50,000 to $74, B C -- 3 * $75,000 to $99,999 4 C 3 C -- 4 C $100,000 or more C 3 C -- 2 * * = <.5% Negative Impacts of Debt Given that they have more debt overall, pre-retirees are, not surprisingly, more likely to say it has negatively impacted their ability to save and invest, with three in ten (28%) saying it has impacted them a great deal. Fewer retirees with non-mortgage debt (35%) feel that it is negatively affecting their ability to maintain their desired lifestyle. 48
?")
49 49 Figure 33: Negative Impact of Debt To what extent, if at all, has debt negatively impacted (how much you are able to put away each month in savings and investments/your ability to maintain your desired lifestyle)? (Asked among those in debt) Figure 34: Negative Impact of Debt by Income To what extent, if at all, has debt negatively impacted (how much you are able to put away each month in savings and investments/your ability to maintain your desired lifestyle)? (Asked among those in debt) Negative Impact of Debt <$50K (n=174) Pre-retirees Retirees Retired Widows $50K to $99K (n=272) $100K+ (n=268) <$35K (n=191) $35K to $74K (n=202) $75K+ (n=172) <$35K (n=109) $35K+ (n=113) (a) (b) (c) (a) (b) (c) (a) (b) A great deal 43% BC 24% 25% 23% BC 8% C 2% 15% 7% Somewhat BC B 16 A little Not at all 9 21 A 30 AB A 64 AB A NET: A great deal/somewhat 65 BC BC 26 C B 23 NET: A little/not at all A 54 A A 87 AB A 49
50 50 Figure 35: Negative Impact of Debt by Gender To what extent, if at all, has debt negatively impacted (how much you are able to put away each month in savings and investments/your ability to maintain your desired lifestyle)? (Asked among those in debt) Negative Impact of Debt Male (n=334) Pre-retirees Female (n=380) Male (n=266) Retirees Female (n=299) (a) (b) (a) (b) A great deal 25% 31% 11% 14% Somewhat A little Not at all NET: A great deal/somewhat A NET: A little/not at all B 60 Figure 36: Negative Impact of Debt by Age To what extent, if at all, has debt negatively impacted (how much you are able to put away each month in savings and investments/your ability to maintain your desired lifestyle)? (Asked among those in debt) Negative Impact of Debt (n=375) Pre-retirees Retirees Retired Widows (n=283) 65+ (n=56) (n=230) (n=225) (n=110) (n=90) (n=132) (a) (b) (c) (a) (b) (c) (a) (b) A great deal 30% C 28% 17% 12% 14% 12% 11% 11% Somewhat BC A little Not at all NET: A great deal/somewhat 54 C C NET: A little/not at all A A
51 51 Financial Shocks in Retirement Current feelings of financial insecurity combined with high debt levels combined leave preretirees, in particular, feeling largely unable to manage some significant financial shocks that can emerge over the course of a retirement lasting at least 20 years. Pre-retirees are especially likely to say they feel unprepared to handle a significant out-of-pocket medical expense during retirement (50% feel unprepared vs. 33% retirees). They are also less prepared than retirees to manage a 25% drop in their home value (51% vs. 35%), and expectedly feel even less prepared to handle depleted assets in retirement (61% vs. 47%). Two in three pre-retirees (65%) and retirees (67%) feel prepared to handle a needed car repair or replacement, and just half could manage a major home repair or improvement (50% pre-retirees and 54% retirees). Fewer still 31% of pre-retirees and 34% of retirees feel able to handle a family member in need of financial help. Those with comprehensive financial plans and those who work with an advisor say they are more prepared to handle financial shocks in retirement. 51
?")
52 52 Figure 37: Ability to Handle Financial Shocks in Retirement How well prepared are you financially to handle the following (during retirement)? 52
53 53 Figure 38: Ability to Handle Financial Shocks in Retirement by Income How well prepared are you financially to handle the following (during retirement)? (%Very/Somewhat prepared) <$50K (n=241) Pre-retirees Retirees Retired Widows $50K to $99K $100K+ (n=395) (n=394) <$35K (n=318) $35K to $74K (n=391) $75K+ (n=316) <$35K (n=185) $35K+ (n=236) (a) (b) (c) (a) (b) (c) (a) (b) Car repairs or replacement 44% 62% A 78% AB 42% 75% A 92% AB 48% 83% A Significant out-of-pocket medical, dental, or prescription expenses A 59 AB A 83 AB A Major home repairs or upgrades A 64 AB A 82 AB A A drop in home value of 25% or more A 42 AB A 59 AB A Running out of assets A 38 AB A 48 A A A family member in need of financial support AB A 61 AB A The death of a spouse or long-term partner during retirement A 49 AB A 60 AB 9 14 A loss in the total value of your savings of 25% or more due to poor investment decisions or a market decline A 40 AB A 56 AB A Divorce during retirement AB 3 8 A 19 AB
54 54 Figure 39: Ability to Handle Financial Shocks in Retirement by Gender How well prepared are you financially to handle the following (during retirement)? (%Very/Somewhat prepared) Male (n=511) Pre-retirees Female (n=519) Male (n=493) Retirees Female (n=532) (a) (b) (a) (b) Car repairs or replacement 67% 63% 70% 64% Significant out-of-pocket medical, dental, or prescription expenses 54 B Major home repairs or upgrades 59 B B 50 A drop in home value of 25% or more 41 B B 33 Running out of assets 36 B A family member in need of financial support The death of a spouse or long-term partner during retirement B 31 A loss in the total value of your savings of 25% or more due to poor investment decisions or a market decline 38 B Divorce during retirement B 7 54
55 55 Figure 40: Ability to Handle Financial Shocks in Retirement by Age How well prepared are you financially to handle the following (during retirement)? (%Very/Somewhat prepared) (n=519) Pre-retirees Retirees Retired Widows (n=423) 65+ (n=88) (n=394) (n=415) (n=216) (n=180) (n=241) (a) (b) (c) (a) (b) (c) (a) (b) Car repairs or replacement 62% 66% 82% AB 65% 69% 67% 69% 64% Significant out-of-pocket medical, dental, or prescription expenses A 61 A A 68 AB Major home repairs or upgrades A drop in home value of 25% or more A Running out of assets AB A family member in need of financial support A B 32 The death of a spouse or long-term partner during retirement BC A loss in the total value of your savings of 25% or more due to poor investment decisions or a market decline A C Divorce during retirement C
56 56 Figure 41: Ability to Handle Financial Shocks in Retirement by Financial Advisor How well prepared are you financially to handle the following (during retirement)? (%Very/Somewhat prepared) Work With An Advisor (n=342) Pre-retirees Retirees Retired Widows Do Not Work With An Advisor (n=688) Work With An Advisor (n=367) Do Not Work With An Advisor (n=658) Work With An Advisor (n=172) Do Not Work With An Advisor (n=249) (a) (b) (a) (b) (a) (b) Car repairs or replacement 80% B 58% 86% B 58% 84% B 55% Significant out-of-pocket medical, dental, or prescription expenses 67 B B B 52 Major home repairs or upgrades 68 B B B 38 A drop in home value of 25% or more 47 B B B 24 Running out of assets 43 B B B 29 A family member in need of financial support 44 B B B 27 The death of a spouse or long-term partner during retirement 44 B B A loss in the total value of your savings of 25% or more due to poor investment decisions or a market decline 45 B B B 19 Divorce during retirement B
57 57 Figure 42: Ability to Handle Financial Shocks in Retirement by Financial Plan How well prepared are you financially to handle the following (during retirement)? (%Very/Somewhat prepared) Have A Financial Plan (n=325) Pre-retirees Do Not Have A Financial Plan (n=705) Have A Financial Plan (n=453) Retirees Do Not Have A Financial Plan (n=572) (a) (b) (a) (b) Car repairs or replacement 86% B 56% 88% B 53% Significant out-of-pocket medical, dental, or prescription expenses 78 B B 45 Major home repairs or upgrades 77 B B 38 A drop in home value of 25% or more 60 B B 25 Running out of assets 51 B B 26 A family member in need of financial support 50 B B 23 The death of a spouse or long-term partner during retirement 56 B B 24 A loss in the total value of your savings of 25% or more due to poor investment decisions or a market decline 59 B B 18 Divorce during retirement 16 B 8 12 B 7 57
58 58 Financial Planning Steps Taken There are important gaps in many pre-retirees and retirees finance-related and personal planning. Further, this survey reveals a strong tendency for people to delay key planning tasks until retirement, with many not engaging in the tasks at all. Only four in ten pre-retirees have a living will (38%), an estate plan (36%) or a plan for investing (38%). A smaller proportion (30%) have a comprehensive financial plan. The likelihood of these important tasks being completed is higher among retirees, but not that much higher. A little over half of retirees have a living will (55%) or an estate plan (52%) while only two in five have a financial plan for investing (38%) or a comprehensive financial plan (40%). There is also evidence that many do not have the insurance protection they should have to protect themselves and their families against the financial consequences of their disability or death. Only half of pre-retirees (48%) have disability insurance. The incidence of life insurance is higher: three-quarters of pre-retirees (77%) have life insurance protection as do over half of retirees (53%). Most who have made a plan for investing or have a comprehensive financial plan do a good job of keeping it up to date. Over half of pre-retirees with an investment plan (58%) have updated or reviewed it in the past year. Similarly, over half of pre-retirees with a comprehensive financial plan (56%) have updated it or reviewed it in the past year. Retirees with these plans are slightly more likely to have updated or reviewed their plans in the past year. Living wills and estate plans are less likely to be updated annually. Nevertheless, about three-fifths of pre-retirees and two-thirds of retirees with these types of plans have reviewed them in at least the past four years. Life insurance and disability insurance are also likely to be reviewed regularly by those who have this coverage. Two in five pre-retirees with life insurance (41%) have reviewed it in the past year. Also, two in five of pre-retirees with disability insurance (41%) have reviewed this coverage in the past year. Half of pre-retirees with long-term care insurance have reviewed this coverage in the past year. Interestingly, retirees are somewhat less likely to review their coverages annually. Still, a third of retirees with life insurance (34%) have reviewed it in the past year, while 40% of retirees with long-term care insurance have conducted a review in the past year. 58


59 59 Figure 43: Financial Plans in Place Please answer 'yes' or 'no' to each of the following 59
60 60 Figure 44: Financial Plans in Place by Income Please answer 'yes' or 'no' to each of the following. (%Yes) <$50K (n=241) Pre-retirees Retirees Retired Widows $50K to $99K $100K+ (n=395) (n=394) <$35K (n=318) $35K to $74K (n=391) $75K+ (n=316) <$35K (n=185) $35K+ (n=236) (a) (b) (c) (a) (b) (c) (a) (b) Do you have life insurance? 57% 77% A 86% AB 40% 58% A 64% A 54% 55% Do you have a living will or power of attorney in case you become incapacitated? A 48 AB A 63 A A Do you have disability insurance? A 60 AB Do you have an estate plan, including a will or a trust? A 48 AB A 69 A A Do you have a formal plan for investing your assets? A 48 AB A 59 AB A Do you have a comprehensive financial plan that takes into account all of your income, debt, assets and financial issues? A 39 AB A 64 AB A Figure 45: Financial Plans in Place by Gender Please answer 'yes' or 'no' to each of the following. (%Yes) Male (n=511) Pre-retirees Female (n=519) Male (n=493) Retirees Female (n=532) (a) (b) (a) (b) Do you have life insurance? 77% 76% 50% 55% Do you have a living will or power of attorney in case you become incapacitated? Do you have disability insurance? Do you have an estate plan, including a will or a trust? A Do you have a formal plan for investing your assets? Do you have a comprehensive financial plan that takes into account all of your income, debt, assets and financial issues?
61 61 Figure 46: Financial Plans in Place by Age Please answer 'yes' or 'no' to each of the following. (%Yes) (n=519) Pre-retirees Retirees Retired Widows (n=423) 65+ (n=88) (n=394) (n=415) (n=216) (n=180) (n=241) (a) (b) (c) (a) (b) (c) (a) (b) Do you have life insurance? 76% 77% 75% 47% 55% 59% A 53% 55% Do you have a living will or power of attorney in case you become incapacitated? A A 77 AB A Do you have disability insurance? Do you have an estate plan, including a will or a trust? A 53 A A 71 AB Do you have a formal plan for investing your assets? A 56 A Do you have a comprehensive financial plan that takes into account all of your income, debt, assets and financial issues? A 48 AB


62 62 Figure 47: Management of Financial Plans in Place When was the last time you reviewed or updated the following? (Asked if own policy or plan) 62
63 63 Figure 48: Management of Financial Plans in Place by Income When was the last time you reviewed or updated the following? (Asked if own policy or plan) (%Reviewed or updated within the past 5 years) * <$50K Pre-retirees Retirees Retired Widows $50K to $99K $100K+ <$35K $35K to $74K $75K+ <$35K $35K+ (a) (b) (c) (a) (b) (c) (a) (b) Comprehensive financial plan 85% 81% 85% 76% 86% 91% A 79% 87% Plan for investing AB A Living will or power of attorney 76 C *Base sizes vary based on item tested Estate plan, will or trust Life insurance Disability insurance Figure 49: Management of Financial Plans in Place by Gender When was the last time you reviewed or updated the following? (Asked if own policy or plan) Pre-retirees Retirees (%Reviewed or updated within the past 5 years) * Male Female Male Female (a) (b) (a) (b) Comprehensive financial plan 87% 81% 86% 87% Plan for investing Living will or power of attorney Estate plan, will or trust Life insurance Disability insurance *Base sizes vary based on item tested 63
64 64 Figure 50: Management of Financial Plans in Place by Age When was the last time you reviewed or updated the following? (Asked if own policy or plan) Pre-retirees Retirees Retired Widows (%Reviewed or updated within the past 5 years)* (a) (b) (c) (a) (b) (c) (a) (b) Comprehensive financial plan 81% 86% 88%^ 90% B 80% 91% B 91% B 80% Plan for investing AB^ B 82 Living will or power of attorney ^ B 63 Estate plan, will or trust ^ B 60 Life insurance B 58 Disability insurance ^ *Base sizes vary based on item tested ^Base size is lower than 50 please use as directional findings only 64
 also expect to spend less in retirement, much more than the 35% of retirees who say they spend less.")
65 65 Retirement Spending A contributing factor to pre-retirees retirement insecurity is that over three in five (63%) anticipate living off lower incomes in retirement. The exact same share of pre-retirees (63%) also expect to spend less in retirement, much more than the 35% of retirees who say they spend less. Small numbers of retirees (14%) are more likely to say that they spend more in retirement, compared to just one in ten pre-retirees who expect to spend more (9%). Figure 51: Spending in Retirement As you age (in retirement), do you expect you will spend more or less than you do now or about the same? 65
66 66 Figure 52: Spending in Retirement by Income As you age (in retirement), do you expect you will spend more or less than you do now or about the same? Spending in Retirement <$50K (n=241) Pre-retirees Retirees Retired Widows $50K to $99K (n=395) $100K+ (n=394) <$35K (n=318) $35K to $74K (n=391) $75K+ (n=316) <$35K (n=185) $35K+ (n=236) (a) (b) (c) (a) (b) (c) (a) (b) Much more than you spend now 3% 2% 1% 2% 1% 3% 2% 5% Somewhat more than you spend now About the same as you spend now Somewhat less than you spend now 13 BC A 54 A Much less than you spend now 22 C BC B 1 NET: Spend more 16 BC A NET: Spend less A Figure 53: Spending in Retirement by Gender As you age (in retirement), do you expect you will spend more or less than you do now or about the same? Spending in Retirement Male (n=511) Pre-retirees Female (n=519) Male (n=493) Retirees Female (n=532) (a) (b) (a) (b) Much more than you spend now 2% 2% 2% 2% Somewhat more than you spend now About the same as you spend now Somewhat less than you spend now Much less than you spend now NET: Spend more NET: Spend less
67 67 Figure 54: Spending in Retirement by Age As you age (in retirement), do you expect you will spend more or less than you do now or about the same? Spending in Retirement (n=519) Pre-retirees Retirees Retired Widows (n=423) 65+ (n=88) (n=394) (n=415) (n=216) (n=180) (n=241) (a) (b) (c) (a) (b) (c) (a) (b) Much more than you spend now 2% C 2% C -- 3% 2% 1% 5% 3% Somewhat more than you spend now About the same as you spend now A Somewhat less than you spend now 51 B Much less than you spend now NET: Spend more NET: Spend less Financial Advice and Education Most retirees and pre-retirees are not working with a professional financial advisor. We explore these findings in-depth beginning on page 144. However, they report moderate levels of interest in getting more support and education on financial topics, especially pre-retirees and those who perceive themselves as financially insecure. One third of pre-retirees (32%) and retirees (32%) consult with a financial advisor; retired widows (41%) are more likely to work with one. Those working with a financial advisor consult them on a variety of topics; including investment transactions, saving and investing for retirement and how to generate income in retirement. Though healthcare and long-term care are priorities for retirees and pre-retirees, few are working with an advisor to deal with them. Pre-retirees have some, but not a strong level, of interest in financial education on topics from determining their retirement lifestyle to discussing finances with elderly parents. Although seven in ten pre-retirees say they are likely to use education or support aimed at teaching them how to plan for income and health care expenses in retirement, fewer are very likely. Interest in financial education is generally lower among retirees and retired widows than among pre-retirees, even on financial issues directly related to financial management in retirement. For example, only a quarter of pre-retirees say they would be very likely to use education and support offered by an employer or community organization on planning for health care expenses 67
68 68 in retirement (26%), estate planning and will preparation (25%) and planning for income in retirement (24%). In each case, however, a substantial proportion, although less than a majority, say they would be somewhat likely to use the material. About one in five pre-retirees state they would be very likely to use education and support on how to save for retirement (21%), what retirement lifestyle issues to think through (20%), how to determine retirement readiness (19%) and how to recognize and avoid financial fraud (19%). As stated, retirees are considerably less likely to consider using education and support on these issues. Figure 55: Likelihood to Use Education and Support on Financial Topics For each topic below, how likely would you be to use this type of education or support, if offered through your employer or a community organization? 68
69 69 Figure 56: Likelihood to Use Education and Support on Financial Topics by Income For each topic below, how likely would you be to use this type of education or support, if offered through your employer or a community organization? (%Very/Somewhat likely) <$50K (n=241) Pre-retirees Retirees Retired Widows $50K to $99K (n=395) $100K+ (n=394) <$35K (n=318) $35K to $74K (n=391) $75K+ (n=316) <$35K (n=185) $35K+ (n=236) (a) (b) (c) (a) (b) (c) (a) (b) Planning for income in retirement 61% 75% A 69% How to determine retirement readiness A How to save for retirement How to plan for healthcare expenses in retirement A 73 A 34% 50% A 55% A 36% 46% How to recognize and avoid financial fraud C A 51 A A Estate planning and will preparation A 63 A A 57 AB A What retirement lifestyle issues to think through, including where to live A A 41 A A How to manage your income and expenses in retirement A 46 A How to discuss finances with elderly parents A 12 A 7 8 Funding college for children or grandchildren A 21 A
70 70 Figure 57: Likelihood to Use Education and Support on Financial Topics by Gender For each topic below, how likely would you be to use this type of education or support, if offered through your employer or a community organization? (%Very/Somewhat likely) Male (n=511) Pre-retirees Female (n=519) Male (n=493) Retirees Female (n=532) (a) (b) (a) (b) Planning for income in retirement 64% 73% A How to determine retirement readiness A How to save for retirement A How to plan for healthcare expenses in retirement % 44% How to recognize and avoid financial fraud Estate planning and will preparation A What retirement lifestyle issues to think through, including where to live How to manage your income and expenses in retirement How to discuss finances with elderly parents Funding college for children or grandchildren
71 71 Figure 58: Likelihood to Use Education and Support on Financial Topics by Age For each topic below, how likely would you be to use this type of education or support, if offered through your employer or a community organization? (%Very/Somewhat Likely) (n=519) Pre-retirees Retirees Retired Widows (n=423) 65+ (n=88) (n=394) (n=415) (n=216) (n=180) (n=241) (a) (b) (c) (a) (b) (c) (a) (b) Planning for income in retirement 73% C 68% C 49% How to determine retirement readiness 66 C 62 C How to save for retirement 67 C 62 C How to plan for healthcare expenses in retirement 72 C 71 C 57 51% C 42% 39% 48% B 36% How to recognize and avoid financial fraud 60 C Estate planning and will preparation 63 C BC B 30 What retirement lifestyle issues to think through, including where to live 65 C How to manage your income and expenses in retirement C B 34 How to discuss finances with elderly parents 33 BC 20 C C 8 C Funding college for children or grandchildren 30 BC 17 C
72 72 HOUSING DECISIONS FOR RETIREMENT For most retirees, their home is a source of stability and security that they wish to retain. The plurality live in single family homes, move infrequently and homeowners have built a significant amount of equity. Most retirees have a strong commitment to staying in their home throughout their retirement. Most do not want to live with their children. Further, the cost of housing is modest for many retirees and homeowners generally spend less on housing than renters. In terms of important attributes of a home in retirement, most retirees prefer a home with good access to quality health care in particular, but also access to shopping, transportation and professional support, access to family and low maintenance costs. Pre-retirees are, naturally, much more uncertain about their plans for housing in retirement. However, there are segments of retirees and pre-retirees for whom the home represents a significant portion of their overall expenses. There is a fairly even split on the use of home equity to fund retirement. Roughly equal proportions are 1) just as willing to use home equity as other sources to fund retirement or just a little less willing, 2) willing to use home equity as a last resort and 3) do not intend to touch their home equity to fund their retirement. Pre-retirees are more willing than retirees to use home equity to fund retirement. Very few have a reverse mortgage or would consider one. This section will examine pre-retirees and retirees housing decisions, their values and priorities and how they plan to leverage housing to meet their needs and goals as they age. Using Home Equity in Retirement There is clearly a strong desire for people to be able to stay in their home as they age. The highest level of housing-related concern, of the five areas covered in this survey, is concern about being able to stay in the home through the life course. However, only about one in six is very concerned about this and another approximately one in three (35% of pre-retirees and 31% of retirees) is somewhat concerned. There is very little concern about having too much housing debt among retirees, but about a third of pre-retirees are at least somewhat concerned about this. A key financial planning issue is how retirees handle the equity in their homes. One potential use is to try to retain home equity, often the most valuable asset retirees have, for their heirs. However, only about one in ten is very concerned about being able to leave their home or home equity as an inheritance, although another two in ten are somewhat concerned about this. Half of pre-retirees (48%) are at least somewhat concerned about their ability to have a choice of where to live in retirement and almost that proportion (44% of pre-retirees) are at least somewhat concerned about their home equity being sufficient to support their retirement plans. 72
73 73 The pronounced differences in homeownership among pre-retirees and retirees may be driving some of the increased concern among pre-retirees. Notably pre-retirees are most likely to have not paid off their home mortgage. Only one in four (27%) of pre-retirees own their home free and clear compared to roughly half of retirees (46%) and retired widows (50%). Pre-retirees are more likely to be concerned that their home equity will not support their retirement plans (44% pre-retirees vs. 31% retirees, 35% retired widows) and that they have too much housing debt (33% pre-retirees vs. 16% retirees, 17% retired widows). Figure 59: Housing Related Concerns How concerned are you about each of the following (in retirement)? (Asked among homeowners) 73
74 74 Figure 60: Housing Related Concerns by Income How concerned are you about each of the following (in retirement)? (Asked among homeowners) (%Very/Somewhat concerned) <$50K (n=137) Pre-retirees Retirees Retired Widows $50K to $99K $100K+ (n=322) (n=367) <$35K (n=190) $35K to $74K (n=328) $75K+ (n=290) <$35K (n=129) $35K+ (n=200) (a) (b) (c) (a) (b) (c) (a) (b) You may not be able to stay in your home as you age 65% C 57% C 45% 60% BC 44% 38% 59% 49% Not having a choice in where you live in retirement 61 C 55 C BC 32 C B 33 The equity you have in your home may not be sufficient to support your retirement plans 60 BC 46 C BC 30 C B 23 You may not be able to leave your home or the money from the sale of your home as an inheritance 41 C 38 C BC 27 C B 23 Having too much housing debt (mortgage, refinancing or home equity loan debt) 47 BC B B 13 Figure 61: Housing Related Concerns by Gender How concerned are you about each of the following (in retirement)? (Asked among homeowners) Pre-retirees Retirees (%Very/Somewhat concerned) Male (n=416) Female (n=410) Male (n=401) Female (n=407) (a) (b) (a) (b) You may not be able to stay in your home as you age 47% 57% A 41% 53% A Not having a choice in where you live in retirement A A The equity you have in your home may not be sufficient to support your retirement plans A You may not be able to leave your home or the money from the sale of your home as an inheritance Having too much housing debt (mortgage, refinancing or home equity loan debt) A A 74
75 75 Figure 62: Housing Related Concerns by Age How concerned are you about each of the following (in retirement)? (%Very/Somewhat concerned) (n=407) (Asked among homeowners) Pre-retirees Retirees Retired Widows (n=343) 65+ (n=76) (n=306) (n=339) (n=163) (n=144) (n=185) (a) (b) (c) (a) (b) (c) (a) (b) You may not be able to stay in your home as you age 52% 53% 50% 43% 50% 46% 55% 52% Not having a choice in where you live in retirement The equity you have in your home may not be sufficient to support your retirement plans You may not be able to leave your home or the money from the sale of your home as an inheritance 35 BC Having too much housing debt (mortgage, refinancing or home equity loan debt) 37 B B Housing Arrangements and Costs Most pre-retirees and retirees reside in single family homes. Retired widows are a little more likely than pre-retirees to live in a small apartment or condo building (16% retired widows vs. 10% pre-retirees) or an independent senior living community (11% retired widows vs. 1% preretirees). Even among retirees and retired widows, few reside in communities designated for seniors. Pre-retirees and retirees do not often move. Only one in five pre-retirees (18%) and retired widows (22%) and one in four retirees (25%) have moved within the past five years. For the plurality, housing expenses represent less than 25% of their expenses. However, significant portions of pre-retirees and retirees are spending more. Housing expenses are generally higher for renters and those who have a mortgage. Close to half (42% of pre-retirees and 47% of retirees) spend less than 25% of their total expenses on housing. For about one in three (37% of pre-retirees and 33% of retirees) housing accounts for between a quarter and a half of all expenses. However, for 15% of retirees and 16% of pre-retirees housing represents at least half of their overall expenses. Four in five pre-retirees, retirees and retired widows spend less than half of their total expenses on housing and about two in five spend less than 25%. 75

76 76 Figure 63: Amount Spent on Housing About what proportion of your total expenses go toward housing, including mortgage or rent payments, Homeowners' Association or condo fees, real estate taxes, insurance, energy costs, and home maintenance? Figure 64: Amount Spent on Housing by Income About what proportion of your total expenses go toward housing, including mortgage or rent payments, Homeowners' Association or condo fees, real estate taxes, insurance, energy costs, and home maintenance? Proportion of Total Expenses Toward Housing <$50K (n=241) Pre-retirees Retirees Retired Widows $50K to $99K $100K+ (n=395) (n=394) <$35K (n=318) $35K to $74K (n=391) $75K+ (n=316) <$35K (n=185) $35K+ (n=236) (a) (b) (c) (a) (b) (c) (a) (b) Less than 25% 25% 40% A 53% AB 28% 56% A 64% A 28% 53% A 25% to 49% C B 32 50% to 74% 25 BC 14 C 7 16 BC % or more 8 BC 3 C BC B 1 Not sure 8 C BC
77 77 Figure 65: Amount Spent on Housing by Gender About what proportion of your total expenses go toward housing, including mortgage or rent payments, Homeowners' Association or condo fees, real estate taxes, insurance, energy costs, and home maintenance? Proportion of Total Expenses Toward Housing Male (n=511) Pre-retirees Female (n=519) Male (n=493) Retirees Female (n=532) (a) (b) (a) (b) Less than 25% 49% B 37% 54% B 40% 25% to 49% % to 74% A % or more 1 4 A 2 6 A Not sure Figure 66: Amount Spent on Housing by Age About what proportion of your total expenses go toward housing, including mortgage or rent payments, Homeowners' Association or condo fees, real estate taxes, insurance, energy costs, and home maintenance? Proportion of Total Expenses Toward Housing (n=519) Pre-retirees Retirees Retired Widows (n=423) 65+ (n=88) (n=394) (n=415) (n=216) (n=180) (n=241) (a) (b) (c) (a) (b) (c) (a) (b) Less than 25% 40% 43% 53% A 45% 48% 49% 45% 38% 25% to 49% % to 74% 16 C 11 C A 75% or more Not sure A 77
78 78 Home Value and Built Equity Among homeowners, the majority of pre-retirees (60%) and half of retirees (50%) and retired widows (50%) own a home with a market value of $200,000 or more. Many have also built up a significant amount of equity. Over half of pre-retirees (55%) and three in five retirees (61%) and retired widows (61%) have built up over $100,000 of home equity. Most want to retain the equity they have accumulated in their home. About half of pre-retirees (47%), retirees (50%) and retired widows (54%) are familiar with reverse mortgages but only one in ten (8% pre-retirees, 9% retirees, 10% retired widows) have a reverse mortgage or intend to get one. Figure 67: Market Value of Home What do you estimate is the current market value of your primary home? For example, if you sold your home tomorrow, this is the amount you would expect to sell it for. (Asked among homeowners) 78
79 79 Figure 68: Market Value of Home by Income What do you estimate is the current market value of your primary home? For example, if you sold your home tomorrow, this is the amount you would expect to sell it for. (Asked among homeowners) Market Value of Current Home <$50K (n=137) Pre-retirees Retirees Retired Widows $50K to $99K (n=322) $100K+ (n=367) <$35K (n=190) $35K to $74K (n=328) $75K+ (n=290) <$35K (n=129) $35K+ (n=200) (a) (b) (c) (a) (b) (c) (a) (b) Less than $35,000 7% BC 1% -- 16% BC 1% * 11% B * $35,000 to $49,999 8 C 3 C -- 6 C 3 C % $50,000 to $99, BC 12 C 1% 15 BC 7 C 1% 15 B 5 $100,000 to $149, C 16 C 3 24 C 16 C 6 23 B 11 $150,000 to $199, BC AC $200,000 to $299, A 26 A A 23 A A $300,000 to $399, AB AB 4 14 A $400,000 to $499,999 * 4 A 14 AB 1 4 A 12 AB 2 10 A $500,000 or more 1 6 A 22 AB AB 4 16 A * = <.5% 79
80 80 Figure 69: Market Value of Home by Gender What do you estimate is the current market value of your primary home? For example, if you sold your home tomorrow, this is the amount you would expect to sell it for. (Asked among homeowners) Market Value of Current Home Male (n=416) Pre-retirees Female (n=410) Male (n=401) Retirees Female (n=407) (a) (b) (a) (b) Less than $35,000 1% 2% 5% 6% $35,000 to $49, * 5 A $50,000 to $99, $100,000 to $149, $150,000 to $199, $200,000 to $299, $300,000 to $399, $400,000 to $499, $500,000 or more * = <.5% 80
81 81 Figure 70: Market Value of Home by Age What do you estimate is the current market value of your primary home? For example, if you sold your home tomorrow, this is the amount you would expect to sell it for. (Asked among homeowners) Market Value of Current Home (n=407) Pre-retirees Retirees Retired Widows (n=343) 65+ (n=76) (n=306) (n=339) (n=163) (n=144) (n=185) (a) (b) (c) (a) (b) (c) (a) (b) Less than $35,000 1% 2% C -- 7% 4% 5% 5% 5% $35,000 to $49, % $50,000 to $99, C B 6 $100,000 to $149, $150,000 to $199, $200,000 to $299, B $300,000 to $399, $400,000 to $499, $500,000 or more
82 82 Figure 71: Equity Built in Primary Home How much equity do you currently have in your primary home? (Asked among homeowners) 82
83 83 Figure 72: Equity Built in Primary Home by Income How much equity do you currently have in your primary home? Equity in Primary Home <$50K (n=137) (Asked among homeowners) Pre-retirees Retirees Retired Widows $50K to $99K (n=322) $100K+ (n=367) <$35K (n=190) $35K to $74K (n=328) $75K+ (n=290) <$35K (n=129) $35K+ (n=200) (a) (b) (c) (a) (b) (c) (a) (b) None/zero 6% C 2% * 10% BC 2% 1% 5% 2% Less than $10, BC 4 2% 10 BC 2 C -- 7 B 1 $10,000 to $34, BC 10 C 3 12 BC 5 C $35,000 to $49, C $50,000 to $99, C 9 17 B 9 $100,000 to $149, A $150,000 to $199, AC $200,000 to $299, A 19 A 5 14 A 15 A 7 20 A $300,000 to $399, AB AB 1 10 A * = <.5% $400,000 to $499, AB 3 7 $500,000 or more -- 4 A 8 AB * 2 A 21 AB 1 12 A 83
84 84 Figure 73: Equity Built in Primary Home by Gender How much equity do you currently have in your primary home? (Asked among homeowners) Equity in Primary Home Male (n=416) Pre-retirees Female (n=410) Male (n=401) Retirees Female (n=407) (a) (b) (a) (b) None/zero 2% 2% 3% 5% Less than $10, $10,000 to $34, $35,000 to $49, $50,000 to $99, $100,000 to $149, $150,000 to $199, B $200,000 to $299, $300,000 to $399, $400,000 to $499, $500,000 or more
85 85 Figure 74: Equity Built in Primary Home by Age How much equity do you currently have in your primary home? (Asked among homeowners) Equity in Primary Home (n=407) Pre-retirees Retirees Retired Widows (n=343) 65+ (n=76) (n=306) (n=339) (n=163) (n=144) (n=185) (a) (b) (c) (a) (b) (c) (a) (b) None/zero 2% 2% 1% 4% 4% 4% 2% 5% Less than $10, B $10,000 to $34, $35,000 to $49,999 9 C 7 C $50,000 to $99, $100,000 to $149, $150,000 to $199, $200,000 to $299, $300,000 to $399, A 16 A $400,000 to $499, $500,000 or more Using Home to Fund Retirement There are quite divided views on the tactic of selling one s primary home to fund retirement, with pre-retirees expressing more willingness than retirees. Thirty-seven percent of pre-retirees and 28% of retirees are just as willing or only a little less likely to use their home as any other asset for this purpose. About the same proportion of pre-retirees and a somewhat larger proportion of retirees say they would be reluctant to sell their home to fund retirement, but would do so if the money was absolutely needed. Twenty-four percent of pre-retirees and 35% of retirees assert they would never touch their home equity to fund retirement. 85
 Figure 76: Willingness to Use Home to Fund Retirement by Income Which best describes how you feel about selling your primary home to fund your")
86 86 Figure 75: Willingness to Use Home to Fund Retirement Which best describes how you feel about selling your primary home to fund your retirement? (Asked among those who have built home equity) Figure 76: Willingness to Use Home to Fund Retirement by Income Which best describes how you feel about selling your primary home to fund your retirement? (Asked among those who have built home equity) Willingness to Use Home to Fund Retirement You would be just as willing to use it as any other asset you own <$50K (n=113) Pre-retirees Retirees Retired Widows $50K to $99K (n=293) $100K+ (n=348) <$35K (n=143) $35K to $74K (n=297) $75K+ (n=279) <$35K (n=100) $35K+ (n=186) (a) (b) (c) (a) (b) (c) (a) (b) 14% 18% 21% 12% 15% 10% 14% 21% You would be a little less likely to use it than other assets you own A 5 16 A You would be reluctant to use it, but would if you absolutely needed the money for something like medical or long-term care B You would never touch it NET: Willing to use primary home to fund retirement A A A NET: Not willing to use primary home to fund retirement 72 C C B 63 86
87 87 Figure 77: Willingness to Use Home to Fund Retirement by Gender Which best describes how you feel about selling your primary home to fund your retirement? (Asked among those who have built home equity) Willingness to Use Home to Fund Retirement Male (n=387) Pre-retirees Female (n=367) Male (n=375) Retirees Female (n=344) (a) (b) (a) (b) You would be just as willing to use it as any other asset you own 17% 20% 10% 15% You would be a little less likely to use it than other assets you own You would be reluctant to use it, but would if you absolutely needed the money for something like medical or long-term care You would never touch it B 29 NET: Willing to use primary home to fund retirement A NET: Not willing to use primary home to fund retirement B 66 Figure 78: Willingness to Use Home to Fund Retirement by Age Which best describes how you feel about selling your primary home to fund your retirement? (Asked among those who have built home equity) Willingness to Use Home to Fund Retirement You would be just as willing to use it as any other asset you own (n=368) Pre-retirees Retirees Retired Widows (n=317) 65+ (n=69) (n=267) (n=305) (n=147) (n=131) (n=155) (a) (b) (c) (a) (b) (c) (a) (b) 21% 18% 13% 8% 17% A 11% 18% 19% You would be a little less likely to use it than other assets you own You would be reluctant to use it, but would if you absolutely needed the money for something like medical or long-term care You would never touch it B 27 NET: Willing to use primary home to fund retirement NET: Not willing to use primary home to fund retirement
88 88 Preferences to Stay in Home Two thirds of retirees (64%) and an even higher proportion of retired widows plan to stay in their home throughout their retirement. Even close to half of pre-retirees, who are looking out over a longer time horizon, plan on keeping their home for the rest of their lives. The higher proportion of retirees planning to stay may be attributable to the fact that many retirees have already moved to their retirement home and pre-retirees have yet to take that step. Also notable is that those who own their home free and clear are more likely to be planning to remain there throughout retirement compared to those with mortgage debt and renters. Figure 79: Plan to Stay in Current Home Do you plan to live in your current home throughout your retirement? Yes No Not sure Pre-retirees (n=1,030) 44% 27% 29% Retirees (n=1,025) 64% 13% 23% Retired Widows (n=421) 71% 10% 19% Figure 80: Plan to Stay in Current Home by Income Do you plan to live in your current home throughout your retirement? Plan to Live in Current Home Throughout Retirement <$50K (n=241) Pre-retirees Retirees Retired Widows $50K to $99K (n=395) $100K+ (n=394) <$35K (n=318) $35K to $74K (n=391) $75K+ (n=316) <$35K (n=185) $35K+ (n=236) (a) (b) (c) (a) (b) (c) (a) (b) Yes 46% 45% 43% 69% C 65% 59% 78% B 67% No A 8 12 Not sure
89 89 Figure 81: Plan to Stay in Current Home by Gender Do you plan to live in your current home throughout your retirement? Plan to Live in Current Home Throughout Retirement Male (n=511) Pre-retirees Female (n=519) Male (n=493) Retirees Female (n=532) (a) (b) (a) (b) Yes 43% 46% 61% 68% A No B 9 Not sure Figure 82: Plan to Stay in Current Home by Age Do you plan to live in your current home throughout your retirement? Plan to Live in Current Home Throughout Retirement (n=519) Pre-retirees Retirees Retired Widows (n=423) 65+ (n=88) (n=394) (n=415) (n=216) (n=180) (n=241) (a) (b) (c) (a) (b) (c) (a) (b) Yes 41% 45% 62% AB 54% 68% A 78% AB 70% 74% No 29 C BC Not sure C 23 C
90 90 Figure 83: Plan to Stay in Current Home by Home Ownership Do you plan to live in your current home throughout your retirement? Plan to Live in Current Home Throughout Retirement Own Home, No Mort. (n=282) Pre-retirees Retirees Retired Widows Own Home, W/ Mort. (n=544) Rent/ Other (n=204) Own Home, No Mort. (n=497) Own Home, W/ Mort. (n=311) Rent/ Other (n=217) Own Home, No Mort. (n=222) Own Home, W/ Mort. (n=107) Rent/ Other (n=92) (a) (b) (c) (a) (b) (c) (a) (b) (c) Yes 60% BC 46%C 18% 75% BC 66% C 42% 79% C 74% C 55% No AB AB A Not sure A AB A Preference for Moving in Retirement If people do move during retirement, there is a strong tendency to downsize. Very few (5% of pre-retirees and 4% of retirees) would move during retirement to a larger house. Nevertheless, 35% of retirees say that if they moved, they would move to a home that is similar in size to their current home. Figure 84: Plans for Moving in Retirement [Do you plan to/if you moved during retirement, would you most likely] downsize your home in retirement, move to a similarly sized home, or up-size your home in retirement? (Asked among those not planning to stay in their home or not sure) Downsize your home in retirement Move to a similarly sized home in retirement Up-size your home in retirement Pre-retirees (n=587) 72% 24% 5% Retirees (n=380) 61% 35% 4% Retired Widows (n=122) 69% 29% 2% 90
91 91 Figure 85: Plans for Moving in Retirement by Income [Do you plan to/if you moved during retirement, would you most likely] downsize your home in retirement, move to a similarly sized home, or up-size your home in retirement? (Asked among those not planning to stay in their home or not sure) Plans for Moving in Retirement <$50K (n=142) Pre-retirees Retirees Retired Widows $50K to $99K (n=218) $100K+ (n=227) <$35K (n=105) $35K to $74K (n=143) $75K+ (n=132) <$35K (n=44) $35K+ (n=78) (a) (b) (c) (a) (b) (c) (a) (b) Downsize your home in retirement 60% 68% 80% AB 55% 64% 65% 57% 76% A Move to a similarly sized home in retirement 33 C 29 C Up-size your home in retirement Figure 86: Plans for Moving in Retirement by Gender [Do you plan to/if you moved during retirement, would you most likely] downsize your home in retirement, move to a similarly sized home, or up-size your home in retirement? (Asked among those not planning to stay in their home or not sure) Plans for Moving in Retirement Male (n=303) Pre-retirees Female (n=284) Male (n=197) Retirees Female (n=183) (a) (b) (a) (b) Downsize your home in retirement 73% 71% 59% 64% Move to a similarly sized home in retirement Up-size your home in retirement
92 92 Figure 87: Plans for Moving in Retirement by Age [Do you plan to / If you moved during retirement, would you most likely] downsize your home in retirement, move to a similarly sized home, or up-size your home in retirement? (Asked among those not planning to stay in their home or not sure) Plans for Moving in Retirement (n=311) Pre-retirees Retirees Retired Widows (n=236) 65+ (n=40) (n=185) (n=142) (n=53) (n=56) (n=66) (a) (b) (c) (a) (b) (c) (a) (b) Downsize your home in retirement 71% 71% 78% 62% 59% 65% 62% 75% Move to a similarly sized home in retirement Up-size your home in retirement Factors in Retirement Housing Decisions Throughout these data, health care is a top concern and priority; therefore, it is no surprise that access to quality care is the top housing attribute for all audiences. Over one in three pre-retirees (35%) and about half of retirees (45%) and retired widows (50%) say that access to quality care is very important. Housing attributes that help pre-retirees and retirees live affordably with easy access to needed services such as low home maintenance, low cost of living and the ability to receive professional help if needed, also rise to the top in terms of importance. Most value an emotionally supportive community and living in proximity to family and friends, but not to the same extent as quality healthcare, access to needed services and affordability. Living close to family is particularly valued by retired widows, half (48%) say it is very important. Additionally, retired widows are more likely to place importance on finding a supportive community (77% retired widows vs. 67% pre-retirees, retirees) and having a sense of belonging (69% retired widows vs. 57% pre-retirees, retirees). Housing attributes that contribute to a good quality of life, such as fitness amenities, nature and scenery, and being near a large airport are still important to pre-retirees and retirees but not a priority. Quality of life attributes are more important to preretirees and retired widows than retirees in general. 92

93 93 Figure 88: Important Attributes in Deciding Where to Live in Retirement Thinking about where you plan to live throughout your retirement, how important is it that the home and/or location you choose offer the following? Areas of Concern: Access to Needed Services and Affordable Cost of Living 93

94 94 Figure 89: Important Attributes in Deciding Where to Live in Retirement Thinking about where you plan to live throughout your retirement, how important is it that the home and/or location you choose offer the following? Areas of Concern: Emotional Support 94
95 95 Figure 90: Important Attributes in Deciding Where to Live in Retirement Thinking about where you plan to live throughout your retirement, how important is it that the home and/or location you choose offer the following? Areas of Concern: Quality of Life 95
96 96 Figure 91: Important Attributes in Deciding Where to Live in Retirement by Income Thinking about where you plan to live throughout your retirement, how important is it that the home and/or location you choose offer the following? Pre-retirees Retirees Retired Widows (%Very/Somewhat important) <$50K (n=241) <$50K to $99K $100K+ (n=395) (n=394) <$35K (n=318) $35K to $74K (n=391) $75K+ (n=316) <$35K (n=185) $35K+ (n=236) (a) (b) (c) (a) (b) (c) (a) (b) Near quality healthcare and/or hospitals 80% 86% 89% A 85% 89% 93% A 88% 93% Low or no home maintenance required C Nearby shops and restaurants AB Located in desirable/preferred climate The ability to receive professional care or support if you need it An area with a low cost of living 90 C 85 C BC 81 C B 71 Located near family Located near friends Access to needed transportation C A culture of mutual support: neighbors or friends who help each other when they need it C Nearby parks or opportunities to enjoy nature/scenery A 67 A Gives you a sense of belonging to a community A The ability to receive help with chores, like cleaning or laundry 65 C Public services for seniors, such as library courses, or senior centers A A Nearby educational or cultural activities, such as classes, concerts or museums A 43 A A Access to fitness amenities such as a pool or tennis courts A A 43 A A 96
97 97 Pre-retirees Retirees Retired Widows (%Very/Somewhat important) <$50K (n=241) <$50K to $99K $100K+ (n=395) (n=394) <$35K (n=318) $35K to $74K (n=391) $75K+ (n=316) <$35K (n=185) $35K+ (n=236) (a) (b) (c) (a) (b) (c) (a) (b) Opportunities for social engagements, such as shared meals, bridge clubs or holiday parties A 39 A A Near a larger airport to make travel easy AB A 47 AB A Near a college or university A
98 98 Figure 92: Important Attributes in Deciding Where to Live in Retirement by Gender Thinking about where you plan to live throughout your retirement, how important is it that the home and/or location you choose offer the following? Pre-retirees Retirees (%Very/Somewhat important) Male (n=511) Female (n=519) Male (n=493) Female (n=532) (a) (b) (a) (b) Near quality healthcare and/or hospitals 84% 88% 85% 92% A Low or no home maintenance required A A Nearby shops and restaurants A Located in desirable/preferred climate A The ability to receive professional care or support if you need it A An area with a low cost of living Located near family A A Located near friends A A Access to needed transportation A A culture of mutual support: neighbors or friends who help each other when they need it A A Nearby parks or opportunities to enjoy nature/scenery Gives you a sense of belonging to a community A A The ability to receive help with chores, like cleaning or laundry A A Public services for seniors, such as library courses, or senior centers A A Nearby educational or cultural activities, such as classes, concerts or museums A Access to fitness amenities such as a pool or tennis courts Opportunities for social engagements, such as shared meals, bridge clubs or holiday parties A A 98
99 99 Pre-retirees Retirees (%Very/Somewhat important) Male (n=511) Female (n=519) Male (n=493) Female (n=532) (a) (b) (a) (b) Near a larger airport to make travel easy Near a college or university A 99
100 100 Figure 93: Important Attributes in Deciding Where to Live in Retirement by Age Thinking about where you plan to live throughout your retirement, how important is it that the home and/or location you choose offer the following Pre-retirees Retirees Retired Widows (%Very/Somewhat important) (n=519) (n=423) 65+ (n=88) (n=394) (n=415) (n=216) (n=180) (n=241) (a) (b) (c) (a) (b) (c) (a) (b) Near quality healthcare and/or hospitals 86% 85% 92% 87% 91% 88% 88% 92% Low or no home maintenance required B Nearby shops and restaurants B 83 Located in desirable/preferred climate A The ability to receive professional care or support if you need it An area with a low cost of living 84 C B 74 Located near family Located near friends Access to needed transportation A culture of mutual support: neighbors or friends who help each other when they need it Nearby parks or opportunities to enjoy nature/scenery Gives you a sense of belonging to a community The ability to receive help with chores, like cleaning or laundry B Public services for seniors, such as library courses, or senior centers Nearby educational or cultural activities, such as classes, concerts or museums Access to fitness amenities such as a pool or tennis courts 47 B C 35 C Opportunities for social engagements, such as shared meals, bridge clubs or holiday parties 46 B
101 101 Pre-retirees Retirees Retired Widows (%Very/Somewhat important) (n=519) (n=423) 65+ (n=88) (n=394) (n=415) (n=216) (n=180) (n=241) (a) (b) (c) (a) (b) (c) (a) (b) Near a larger airport to make travel easy C Near a college or university Future Housing Plans Though living near loved ones is important, only 4% of pre-retirees and 5% of retirees plan to move in with family or have their family move in with them in retirement. A significant minority are uncertain if they would live with family: nearly one in five retired widows (18%) and preretirees (18%) and one in six retirees (14%) are unsure if they would live with family in retirement. Uncertainty is highest among the economically vulnerable, including those who are low income, have high amounts of debt and do not have a comprehensive financial plan. Remaining in their home is a top concern and maintaining independence is relatedly important. About one in three retired widows (35%), three in ten pre-retirees (29%) and one in four retirees (25%) worry about burdening their children. Currently, most live on their own or with their spouse. Roughly one in ten retirees (12%) and one in five (18%) retired widows live with adult children and an even smaller percentage live with other family or friends. Information was collected on the perceived attractiveness of four types of housing: independent living, assisted living, a continuing care retirement community (CCRC) and a nursing home. As expected, independent living is much more attractive than the other housing types. Half of preretirees and retirees find independent living very attractive, but only about one in six (15% preretirees and retirees) find assisted living very attractive and similar proportions (14% pre-retirees and 16% retirees) feel that way about a continuing care retirement community. However, about half of pre-retirees and retirees feel that assisted living and CCRCs are somewhat attractive. Very few find a nursing home attractive. Most are not sure about at what age they might move into a senior community or long-term care facility. Pre-retirees are more likely to imagine a specific age they would move into a facility whereas retirees and retired widows are more uncertain (57% pre-retirees vs. 71% retirees, 71% retired widows.) 101

102 102 Figure 94: Attractiveness of Senior Communities and Long-term Care Facilities If you needed assistance and it met your care needs, how attractive would the following types of senior communities and long-term care facilities be to you? 102
103 103 Figure 95: Attractiveness of Senior Communities and Long-Term Care Facilities by Income If you needed assistance and it met your care needs, how attractive would the following types of senior communities and long-term care facilities be to you? (%Very/Somewhat attractive) <$50K (n=241) Pre-retirees Retirees Retired Widows $50K to $99K $100K+ (n=395) (n=394) <$35K (n=318) $35K to $74K (n=391) $75K+ (n=316) <$35K (n=185) $35K+ (n=236) (a) (b) (c) (a) (b) (c) (a) (b) Independent living 87% 92% 90% 88% 88% 90% 86% 91% Assisted living A Continuing care communities (which provide an increasing amount of care depending on needs all in the same location/facility) A Nursing home Figure 96: Attractiveness of Senior Communities and Long-Term Care Facilities by Gender If you needed assistance and it met your care needs, how attractive would the following types of senior communities and long-term care facilities be to you? (%Very/Somewhat attractive) Male (n=511) Pre-retirees Female (n=519) Male (n=493) Retirees Female (n=532) (a) (b) (a) (b) Independent living 90% 90% 88% 90% Assisted living A Continuing care communities (which provide an increasing amount of care depending on needs all in the same location/ facility) Nursing home

104 104 Figure 97: Attractiveness of Senior Communities and Long-Term Care Facilities by Age If you needed assistance and it met your care needs, how attractive would the following types of senior communities and long-term care facilities be to you? (%Very/Somewhat attractive) (n=519) Pre-retirees Retirees Retired Widows (n=423) 65+ (n=88) (n=394) (n=415) (n=216) (n=180) (n=241) (a) (b) (c) (a) (b) (c) (a) (b) Independent living 90% 91% 89% 92% C 88% 84% 93% B 85% Assisted living Continuing care communities (which provide an increasing amount of care depending on needs all in the same location/facility) Nursing home Figure 98: Expected Age to Move into Senior Community or Long-term Care Facility At what age do you think you might move into one of these senior communities or long-term care facilities? (Asked among those who found at least one item attractive about senior communities or longterm care facilities) 104
105 105 Figure 99: Expected Age to Move into Senior Community or Long-term Care Facility by Income At what age do you think you might move into one of these senior communities or long-term care facilities? (Asked among those who found at least one item attractive about senior communities or longterm care facilities) Expected Age to Move into Senior Community or Long-term Care Facility <$50K (n=221) Pre-retirees Retirees Retired Widows $50K to $99K $100K+ (n=371) (n=365) <$35K (n=289) $35K to $74K (n=366) $75K+ (n=294) <$35K (n=168) $35K+ (n=224) (a) (b) (c) (a) (b) (c) (a) (b) Under 75 14% C 8% 7% 5% 4% 4% 5% 1% 75 to A 10 A 2 7 A 80 to A 17 A A to A 1 6 A 6 A 4 11 A 90 or older A Not sure/no way of knowing 65 C BC B
106 106 Figure 100: Expected Age to Move into Senior Community or Long-term Care Facility by Gender At what age do you think you might move into one of these senior communities or long-term care facilities? (Asked among those who found at least one item attractive about senior communities or longterm care facilities) Expected Age to Move into Senior Community or Long-Term Care Facility Male (n=469) Pre-retirees Female (n=488) Male (n=451) Retirees Female (n=498) (a) (b) (a) (b) Under 75 11% 7% 4% 5% 75 to to to or older Not sure/no way of knowing A 106
107 107 Figure 101: Expected Age to Move into Senior Community or Long-Term Care Facility by Age At what age do you think you might move into one of these senior communities or long-term care facilities? (Asked among those who found at least one item attractive about senior communities or longterm care facilities) Expected Age to Move into Senior Community or Long-Term Care Facility (n=480) Pre-retirees Retirees Retired Widows (n=393) 65+ (n=84) (n=369) (n=383) (n=197) (n=173) (n=219) (a) (b) (c) (a) (b) (c) (a) (b) Under 75 11% C 9% C -- 8% BC 2% 1% 5% B 1% 75 to BC 5 3% 9 C 5 C to BC to or older Not sure/no way of knowing A A 81 AB
108 108 PLANNING FOR FUTURE LONG-TERM CARE NEEDS Affording long-term care is a top-of-mind concern for retirees and pre-retirees, in part because many watched their parents experience physical or cognitive decline that increased their reliance on family, friends or professional caregivers. Despite declines in health, most pre-retirees and retirees say their parents enjoyed a comfortable retirement and very few paid for long-term care or gave financial help. Pre-retirees and retirees are familiar with long-term care as many have been involved in making care decisions for their parents, but few believe they are very likely to need it themselves. Although they do not want to face the prospect of needing long-term care, they understand it would be a significant burden financially and emotionally. When it comes to paying for long-term, care most plan to rely on Medicare or pay for it themselves. Planning for long-term care shapes pre-retirees and retirees concerns about their financial security in retirement; these fears are correlated to their parents retirement experiences. This section explores pre-retirees and retirees fears about planning for long-term care in retirement, the preparations they are making and the relationship between their parents experiences and their own concerns. Experience with Parents Long-Term Care Needs By the time they reach retirement, most people have had at least one parent require long-term care. The share of pre-retirees and retirees reporting that at least one parent required long-term care or experienced limited independence increased in Sixty-eight percent of retirees report that at least one parent had an illness or disability that limited their ability to care for themselves, 61% had a parent who required a family member or friend to provide care or support and 48% had a parent who needed professional support because they could not care for themselves. Pre-retirees had lower levels of these experiences, no doubt because their parents have not on average reached the age of the parents of retirees, but their parents also have had fairly high incidences of needed support from family, friends or professional caregivers. 108

109 109 Figure 102: Parents Care Experiences in Retirement To the best of your knowledge, did either of your parents experience any of the following during retirement? (Asked among those whose parents lived to retirement) 109
110 110 Figure 103: Parents Care Experiences in Retirement by Income To the best of your knowledge, did either of your parents experience any of the following during retirement? Experienced by Parents in Retirement (% Yes) (Asked among those whose parents lived to retirement) <$50K (n=203) Pre-retirees Retirees Retired Widows $50K to $99K (n=342) $100K+ (n=351) <$35K (n=208) $35K to $74K (n=291) $75K+ (n=258) <$35K (n=118) $35K+ (n=180) (a) (b) (c) (a) (b) (c) (a) (b) An illness or disability that limited their ability to care for themselves 49% 52% 53% 66% 67% 70% 74% 76% The need for family or friends to provide care or support because they were unable to care for themselves The need for professional care or support because they were unable to care for themselves Figure 104: Parents Care Experiences in Retirement by Gender To the best of your knowledge, did either of your parents experience any of the following during retirement? (Asked among those whose parents lived to retirement) Pre-retirees Retirees Experienced by Parents in Retirement (% Yes) Male (n=440) Female (n=456) Male (n=365) Female (n=392) (a) (b) (a) (b) An illness or disability that limited their ability to care for themselves 53% 51% 63% 72% A The need for family or friends to provide care or support because they were unable to care for themselves A The need for professional care or support because they were unable to care for themselves
111 111 Figure 105: Parents Care Experiences in Retirement by Age To the best of your knowledge, did either of your parents experience any of the following during retirement? (Asked among those whose parents lived to retirement) Experienced by Parents in Retirement (% Yes) (n=467) Pre-retirees Retirees Retired Widows (n=360) 65+ (n=69) (n=302) (n=306) (n=149) (n=132) (n=166) (a) (b) (c) (a) (b) (c) (a) (b) An illness or disability that limited their ability to care for themselves 46% 58% A 67% A 63% 70% 74% A 79% 72% The need for family or friends to provide care or support because they were unable to care for themselves The need for professional care or support because they were unable to care for themselves A 56 A A A Parents Financial Status in Retirement One in eight pre-retirees (13%) and three in ten retirees (29%) report that their parents died before retirement. Only 20% of pre-retirees and 19% of retirees state that their parents lived until retirement and were financially constrained in the retirement period. Half (52% of preretirees and 51% of retirees) state their parents were financially comfortable in retirement and another three in ten (28% of pre-retirees and 29% of retirees) say their parents were very financially comfortable during retirement. 111

112 112 Figure 106: Parents Financial Circumstances in Retirement How would you describe your parents' financial circumstances in retirement? *Data has been rebased to show only those with parents who lived to retirement 112
113 113 Figure 107: Parents Financial Circumstances in Retirement by Income How would you describe your parents' financial circumstances in retirement? Pre-retirees Retirees Retired Widows Description of Parents Financial Circumstances Restricted, living a reduced or constrained lifestyle <$50K (n=183) $50K to $99K (n=292) $100K+ (n=413) <$35K (n=256) $35K to $74K (n=228) $75K+ (n=249) <$35K (n=125) $35K+ (n=163) (a) (b) (c) (a) (b) (c) (a) (b) 21% 18% 20% 23% 20% 16% 18% 15% Comfortable, able to meet all their expenses with occasional treats Very comfortable, able to meet all their expenses and enjoy extras Does not apply, parents deceased before they retired* 17 C BC 27 C B 23 *Data has been rebased to show only those with parents who lived to retirement Figure 108: Parents Financial Circumstances in Retirement by Gender How would you describe your parents' financial circumstances in retirement? Description of Parents Financial Circumstances Male (n=388) Pre-retirees Female (n=499) Male (n=351) Retirees Female (n=382) (a) (b) (a) (b) Restricted, living a reduced or constrained lifestyle 18% 21% 19% 20% Comfortable, able to meet all their expenses with occasional treats Very comfortable, able to meet all their expenses and enjoy extras Does not apply, parents deceased before they retired* *Data has been rebased to show only those with parents who lived to retirement 113
114 114 Figure 109: Parents Financial Circumstances in Retirement by Age How would you describe your parents' financial circumstances in retirement? Description of Parents Financial Circumstances Restricted, living a reduced or constrained lifestyle (n=491) Pre-retirees Retirees Retired Widows (n=334) 65+ (n=61) (n=314) (n=272) (n=148) (n=124) (n=164) (a) (b) (c) (a) (b) (c) (a) (b) 20% 19% 20% 20% 19% 17% 21% 12% Comfortable, able to meet all their expenses with occasional treats Very comfortable, able to meet all their expenses and enjoy extras Does not apply, parents deceased before they retired* A *Data has been rebased to show only those with parents who lived to retirement Financial Support Provided to Parents Despite their parents fairly high levels of financial comfort, pre-retirees and retirees have provided some financial support to their parents. Overall, roughly two in ten pre-retirees and retirees report providing some level of financial support to their retired parents. Seven percent of pre-retirees provided regular financial support to parents in the past or are doing so now. Another 14% of pre-retirees provided retired parents occasional financial support, or are doing so now. For retirees, the levels are similar: 3% provided regular financial support to parents in the past or are doing so now and 15% are, or have in the past, provided occasional financial support. Managing a retired parents finances is also a task a significant minority have had to take on. One in five of pre-retirees (21%) and one-third of retirees (32%) say their parents required someone outside the home to manage their finances. Running out of assets (28% pre-retirees, 21% retirees), cognitive decline (25% pre-retirees, 30% retirees), or a chronic, debilitating illness (25% each) are the top reasons why retired parents required support. More than two out of ten pre-retirees (22%) and retirees (23%) report their parents required financial help as a result of needing long-term care. 114
115 115 Figure 110: Financial Support Provided to Parents Did you provide or are you providing financial support to your parents during their retirement? (Asked among those whose parents lived to retirement) Figure 111: Financial Support Provided to Parents by Income Did you provide or are you providing financial support to your parents during their retirement? (Asked among those whose parents lived to retirement) Financial Support Provided to Parents <$50K (n=203) Pre-retirees Retirees Retired Widows $50K to $99K (n=342) $100K+ (n=351) <$35K (n=208) $35K to $74K (n=291) $75K+ (n=258) <$35K (n=118) $35K+ (n=180) (a) (b) (c) (a) (b) (c) (a) (b) Yes, currently providing regular financial support 3% 2% 4% -- 1% 1% 1% * Yes, currently providing occasional financial support A 3% 4 3 * -- Yes, provided regular financial support in the past % Yes, provided occasional financial support in the past No, have not provided any financial support 85 C NET: Have provided financial support A * = <.5% 115
116 116 Figure 112: Financial Support Provided to Parents by Gender Did you provide or are you providing financial support to your parents during their retirement? (Asked among those whose parents lived to retirement) Financial Support Provided to Parents Male (n=440) Pre-retirees Female (n=456) Male (n=365) Retirees Female (n=392) (a) (b) (a) (b) Yes, currently providing regular financial support 3% 3% 1% * Yes, currently providing occasional financial support % Yes, provided regular financial support in the past Yes, provided occasional financial support in the past No, have not provided any financial support NET: Have provided financial support * = <.5% Figure 113: Financial Support Provided to Parents by Age Did you provide or are you providing financial support to your parents during their retirement? (Asked among those whose parents lived to retirement) Financial Support Provided to Parents (n=467) Pre-retirees Retirees Retired Widows (n=360) 65+ (n=69) (n=302) (n=306) (n=149) (n=132) (n=166) (a) (b) (c) (a) (b) (c) (a) (b) Yes, currently providing regular financial support 4% B 1% 4% 1% *% -- 1% -- Yes, currently providing occasional financial support 10 BC BC 1 2% * -- Yes, provided regular financial support in the past % Yes, provided occasional financial support in the past No, have not provided any financial support A NET: Have provided financial support 24 B * = <.5% 116
117 117 Caregiving Experience Being actively involved in making long-term care decisions for retired parents is common, as roughly seven in ten pre-retirees (73%) and retirees (67%) whose parents required care say they were at least somewhat involved in making decisions about how and where their parent would receive the care they needed. Caregiving is extensive. Half of pre-retirees (47%) and retirees (53%) and nearly two-thirds of retired widows (72%) have been a caregiver at some point in their lives, although a smaller proportion are currently providing care (32% pre-retirees, 23% retirees, 12% retired widows). Most caregivers are caring for a parent or an in-law. As caregivers age, those they provide care to shifts. Caregivers who are younger are most likely to be providing care to a parent or an inlaw, while caregivers who are older are more likely to be caring for their spouse and adult relatives or children. Figure 114: Ever Spent Time Caring for Someone Have you ever spent time caring for someone? Yes No Pre-retirees (n=1,030) 47% 53% Retirees (n=1,025) 53% 47% Retired Widows (n=421) 72% 28% 117
118 118 Figure 115: Ever Spent Time Caring for Someone by Income Have you ever spent time caring for someone? Ever Spent Time Caring for Someone <$50K (n=241) Pre-retirees Retirees Retired Widows $50K to $99K (n=395) $100K+ (n=394) <$35K (n=318) $35K to $74K (n=391) $75K+ (n=316) <$35K (n=185) $35K+ (n=236) (a) (b) (c) (a) (b) (c) (a) (b) Yes 54% C 50% C 41% 53% 53% 52% 69% 76% No AB Figure 116: Ever Spent Time Caring for Someone by Gender Have you ever spent time caring for someone? Pre-retirees Retirees Ever Spent Time Caring for Someone Male (n=511) Female (n=519) Male (n=493) Female (n=532) (a) (b) (a) (b) Yes 35% 56% A 43% 63% A No 65 B B 37 Figure 117: Ever Spent Time Caring for Someone by Age Have you ever spent time caring for someone? Ever Spent Time Caring for Someone (n=519) Pre-retirees Retirees Retired Widows (n=423) 65+ (n=88) (n=394) (n=415) (n=216) (n=180) (n=241) (a) (b) (c) (a) (b) (c) (a) (b) Yes 46% 45% 56% 53% 53% 52% 80% B 67% No A 118
119 119 Figure 118: Currently Spending Any Time Caring for Someone Are you currently spending any time caring for someone? (Asked among those who have ever spent time caregiving) Yes No Pre-retirees (n=479) 32% 68% Retirees (n=563) 23% 77% Retired Widows (n=304) 12% 88% Figure 119: Currently Spending Any Time Caring for Someone by Income Are you currently spending any time caring for someone? (Asked among those who have ever spent time caregiving) Pre-retirees Retirees Retired Widows Currently Spending Any Time Caring for Someone <$50K (n=133) $50K to $99K (n=188) $100K+ (n=158) <$35K (n=180) $35K to $74K (n=220) $75K+ (n=163) <$35K (n=127) $35K+ (n=177) (a) (b) (c) (a) (b) (c) (a) (b) Yes 28% 31% 37% 21% 21% 27% 12% 11% No
120 120 Figure 120: Currently Spending Any Time Caring for Someone by Gender Are you currently spending any time caring for someone? (Asked among those who have ever spent time caregiving) Pre-retirees Retirees Currently Spending Any Time Caring for Someone Male (n=180) Female (n=299) Male (n=218) Female (n=345) (a) (b) (a) (b) Yes 29% 34% 24% 22% No Figure 121: Currently Spending Any Time Caring for Someone by Age Are you currently spending any time caring for someone? (Asked among those who have ever spent time caregiving) Currently Spending Any Time Caring for Someone (n=231) Pre-retirees Retirees Retired Widows (n=201) 65+ (n=47) (n=223) (n=225) (n=115) (n=140) (n=164) (a) (b) (c) (a) (b) (c) (a) (b) Yes 34% 30% 33%^ 30% C 20% 15% 16% B 8% No ^ A A ^Base size is lower than 50 please use as directional findings only Burden of Caregiving Pre-retirees and retirees see the burden of providing care as more emotional than physical or financial. Roughly three in ten pre-retirees (35%), retirees (26%) and retired widows (27%) say being a care provider is a catastrophic or major emotional burden. Eleven percent of pre-retirees and 15% of retirees consider caregiving a catastrophic or major financial burden. 120
121 121 Figure 122: Household Burden of Caregiving How much of a burden has caregiving been for your household...? (Asked among current caregivers) ^Base size is lower than 50 please use as directional findings only Figure 123: Household Burden of Caregiving by Income How much of a burden has caregiving been for your household...? (Asked among current caregivers) (% Catastrophic/Major burden) <$50K (n=39) Pre-retirees Retirees Retired Widows $50K to $99K (n=64) $100K+ (n=60) <$35K (n=36) $35K to $74K (n=49) $75K+ (n=40) <$35K (n=17) $35K+ (n=20) (a) (b) (c) (a) (b) (c) (a) (b) Mentally or emotionally 38%^ 24% 42% 18%^ 44%^AC 20%^ 24%^ 41%^ Physically 14^ ^ 27^C 3^ 18^ 9^ Financially 18^ ^ 18^ 14^ 18^ 9^ ^Base size is lower than 50 please use as directional findings only 121
122 122 Figure 124: Household Burden of Caregiving by Gender How much of a burden has caregiving been for your household...? (Asked among current caregivers) (% Catastrophic/Major burden) Male (n=54) Pre-retirees Female (n=109) Male (n=48) Retirees Female (n=77) (a) (b) (a) (b) Mentally or emotionally 25% 40% 11%^ 37% A Physically ^ 22 A Financially ^ 14 ^Base size is lower than 50 please use as directional findings only Figure 125: Household Burden of Caregiving by Age How much of a burden has caregiving been for your household...? (Asked among current caregivers) Pre-retirees Retirees Retired Widows (% Catastrophic/Major burden) (n=84) (n=63) 65+ (n=16) (n=63) (n=43) (n=19) (n=23) (n=14) (a) (b) (c) (a) (b) (c) (a) (b) Mentally or emotionally 32% 39% 40%^ 33% 18%^ 16%^ 43%^ 16%^ Physically ^ 17 10^ 7^ 12^ 16^ Financially 9 C 17 C ^ 20^ 12^ 16^ ^Base size is lower than 50 please use as directional findings only 122
123 123 Planning for Future LTC Needs Roughly three in five pre-retirees (60%) and retirees (63%), as well as three in four (73%) retired widows, have thought about how they will receive long-term care if they need it and who will provide their care. Pre-retirees and retirees whose parents required care in retirement and those who are currently a caregiver are much more likely to have thought about their own long-term care needs. A significant proportion, but less than half (43% of pre-retirees and 45% of retirees) think it is unlikely that they will ever need long term care. Majorities believe it unlikely they will ever need care for activities of daily living or for cognitive decline. Fifty-one percent of pre-retirees and 54% of retirees think it is unlikely that they will need help with the activities of daily living and 61% of pre-retirees and 68% of retirees believe it is unlikely they will need care because of cognitive decline. 123


124 124 Figure 126: Likelihood of Personally Requiring Long-term Care As you age, how likely do you think it is that you, personally, will require...? 124
125 125 Figure 127: Likelihood of Personally Requiring Long-term Care by Income As you age, how likely do you think it is that you, personally, will require...? Pre-retirees Retirees Retired Widows (%Very/Somewhat likely) <$50K (n=241) $50K to $99K (n=395) $100K+ (n=394) <$35K (n=318) $35K to $74K (n=391) $75K+ (n=316) <$35K (n=185) $35K+ (n=236) (a) (b) (c) (a) (b) (c) (a) (b) Any type of long-term care 52% 57% 58% 50% 55% 59% A 50% 58% Care for the activities of daily living, such as getting in and out of bed, getting dressed, toileting, bathing, or eating Care for cognitive decline, Alzheimer s or dementia Figure 128: Likelihood of Personally Requiring Long-term Care by Gender As you age, how likely do you think it is that you, personally, will require...? (%Very/Somewhat likely) Male (n=511) Pre-retirees Female (n=519) Male (n=493) Retirees Female (n=532) (a) (b) (a) (b) Any type of long-term care 58% 55% 51% 57% Care for the activities of daily living, such as getting in and out of bed, getting dressed, toileting, bathing, or eating A Care for cognitive decline, Alzheimer s or dementia
126 126 Figure 129: Likelihood of Personally Requiring Long-term Care by Age As you age, how likely do you think it is that you, personally, will require...? Pre-retirees Retirees Retired Widows (%Very/Somewhat likely) (n=519) (n=423) 65+ (n=88) (n=394) (n=415) (n=216) (n=180) (n=241) (a) (b) (c) (a) (b) (c) (a) (b) Any type of long-term care 59% 54% 52% 59% B 48% 55% 58% 51% Care for the activities of daily living, such as getting in and out of bed, getting dressed, toileting, bathing, or eating B B 59 B 46 Care for cognitive decline, Alzheimer s or dementia 41 C 38 C B Primary Long-Term Caregivers The plurality of pre-retirees (41%) and retirees (33%) would turn to their spouse for long-term care if they required it. Retired widows are more likely to rely on their children (30% daughter or daughter in law, 15% son or son in law) or a long-term care facility (20%). There is greater reliance upon women as caregivers as men are more likely than women to turn to their spouse for care and respondents overall are more inclined to rely upon their daughters rather than sons. Some are uncertain of where they would turn for long term care. Roughly one in five pre-retirees (18%), retirees (22%) and retired widows (19%) say they are unsure who would be caregiver for them. The burden of requiring extensive long-term care extends to family finances as over threefourths of pre-retirees (79%), retirees (73%) and retired widows (74%) say paying for a nursing home would be a major burden. 126
127 127 Figure 130: Primary Caregiver for Long-Term Care Support Who is or would be your primary caregiver if you need long-term care support? (Asked among those currently receiving care or likely to receive care) 127
128 128 Figure 131: Primary Caregiver for Long-Term Care Support by Income Who is or would be your primary caregiver if you need long-term care support? (Asked among those currently receiving care or likely to receive care) Primary Caregiver for Long- Term Care Support <$50K (n=139) Pre-retirees Retirees Retired Widows $50K to $99K (n=299) $100K+ (n=234) <$35K (n=172) $35K to $74K $75K+ <$35K (n=222) (n=191) (n=94) $35K+ (n=145) (a) (b) (c) (a) (b) (c) (a) (b) Spouse/partner 15% 36% A 56% AB 25% 32% 45% AB 1% -- Daughter or daughter-in-law C 16 C 7 38 B 25% Care provided in a long-term care facility A Professional aides A 6 13 Son or son-in-law Sister 3 3 * Other relative Non-relative, friend or neighbor 4 * * 1 * 1 * 1 Brother 1 3 C -- 1 * * = <.5% Not sure 27 C 23 C C B
129 129 Figure 132: Primary Caregiver for Long-Term Care Support by Gender Who is or would be your primary caregiver if you need long-term care support? (Asked among those currently receiving care or likely to receive care) Primary Caregiver for Long-Term Care Support Male (n=296) Pre-retirees Female (n=306) Male (n=273) Retirees Female (n=312) (a) (b) (a) (b) Spouse/partner 50% B 34% 46% B 21% Daughter or daughter-in-law 5 16 A 7 18 A Care provided in a long-term care facility Professional aides 12 B Son or son-in-law A Sister Other relative * 3 A 1 2 Non-relative, friend or neighbor 1 2 * 1 Brother 2 * 1 * Not sure * = <.5% 129
130 130 Figure 133: Primary Caregiver for Long-Term Care Support by Age Who is or would be your primary caregiver if you need long-term care support? (Asked among those currently receiving care or likely to receive care) Primary Caregiver for Long-Term Care Support (n=321) Pre-retirees Retirees Retired Widows (n=236) 65+ (n=45) (n=240) (n=227) (n=118) (n=111) (n=128) (a) (b) (c) (a) (b) (c) (a) (b) Spouse/partner 43% 38% 43%^ 35% 31% 32% 1% -- Daughter or daughter-in-law ^ % Care provided in a long-term care facility 8 9 7^ 8 19 A 17 A Professional aides ^ B 6 Son or son-in-law 7 8 8^ Sister 2 1 2^ Other relative 3 C Non-relative, friend or neighbor 1 1 3^ 1 1 * * 1 Brother * 2 C -- 1 * ^Base size is lower than 50 please use as directional findings only * = <.5% Cost of Long-Term Care Not sure ^ 28 B If extensive long-term care was needed, 33% of pre-retirees and 50% of retirees believe Medicare would be one of the sources of funds they would turn to. Three in ten (31% of preretirees and 30% of retirees) say they would expect health insurance to cover these costs. These results are interesting because Medicare and health insurance only cover long-term care in very limited circumstances, and when they do provide benefits, it is for very limited periods of time. Only four in ten (41% of pre-retirees and 38% of retirees) say they would pay for extensive longterm care themselves and very few (16% of pre-retirees and 13% of retirees) state that long-term care insurance would be used to pay for their extended long-term care. Very few are planning to require help from children or other family to pay for long-term care. 130

131 131 Figure 134: Plans to Pay for Long-Term Care If you (or your spouse/partner) required extensive long-term care in a nursing home, how would you pay for it? Please select all that apply. 131
132 132 Figure 135: Plans to Pay for Long-Term Care by Income If you (or your spouse/partner) required extensive long-term care in a nursing home, how would you pay for it? Please select all that apply. Plans to Pay for Long-term Care <$50K (n=241) Pre-retirees Retirees Retired Widows $50K to $99K (n=395) $100K+ (n=394) <$35K (n=318) $35K to $74K (n=391) $75K+ (n=316) <$35K (n=185) $35K+ (n=236) (a) (b) (c) (a) (b) (c) (a) (b) Medicare 29% 37% 32% 58% BC 48% 40% 64% B 48% You (and/or your spouse or partner) will pay A 53 AB A 64 AB A Health insurance A 34 A A Medicaid BC B 11 Long-term care insurance 7 17 A 19 A 5 12 A 25 AB 8 28 A Children or other family help Not sure 45 BC C 20 C Figure 136: Plans to Pay for Long-Term Care by Gender If you (or your spouse/partner) required extensive long-term care in a nursing home, how would you pay for it? Please select all that apply. Plans to Pay for Long-term Care Male (n=511) Pre-retirees Female (n=519) Male (n=493) Retirees Female (n=532) (a) (b) (a) (b) Medicare 29% 36% 44% 56% A You (and/or your spouse or partner) will pay 47 B Health insurance Medicaid Long-term care insurance Children or other family help Not sure
133 133 Figure 137: Plans to Pay for Long-Term Care by Age If you (or your spouse\partner) required extensive long-term care in a nursing home, how would you pay for it? Please select all that apply. Plans to Pay for Long-term Care (n=519) Pre-retirees Retirees Retired Widows (n=423) 65+ (n=88) (n=394) (n=415) (n=216) (n=180) (n=241) (a) (b) (c) (a) (b) (c) (a) (b) Medicare 30% 33% 47% AB 39% 58% A 55% A 51% 59% You (and/or your spouse or partner) will pay Health insurance 34 B Medicaid B Long-term care insurance 18 B Children or other family help Not sure 34 C 31 C Familiarity with Long-Term Care Programs and Products Eighty-three percent of retirees (and 91% of retired widows) say they are at least somewhat familiar with the benefits provided by Medicare, with 45% saying they are very familiar with the benefits provided by the program. While only 18% of pre-retirees claim to be very familiar with benefits provided by Medicare, another 47% are somewhat familiar. A little over half (56% preretirees and 58% retirees) say they are very or somewhat familiar with the benefits provided by the Medicaid program. There is lower familiarity with the benefits provided by long-term care insurance, but just about half (50% of pre-retirees and 47% of retirees) say they are at least somewhat familiar with the benefits of this insurance. Familiarity with the benefits of reverse mortgages is somewhat lower and familiarity with longevity insurance and deferred income annuities is far lower. 133

134 134 Figure 138: Familiarity with Benefits Programs and Products How familiar are you with the benefits provided by the following programs/products...? 134
135 135 Figure 139: Familiarity with Benefits Programs and Products by Income How familiar are you with the benefits provided by the following programs/products...? (%Very/Somewhat familiar) <$50K (n=241) Pre-retirees Retirees Retired Widows $50K to $99K $100K+ (n=395) (n=394) <$35K (n=318) $35K to $74K (n=391) $75K+ (n=316) <$35K (n=185) $35K+ (n=236) (a) (b) (c) (a) (b) (c) (a) (b) Medicare 58% 62% 70% A 85% 84% 80% 91% 91% Medicaid C Long-term care insurance A 61 AB A 62 AB A Reverse mortgage A A 59 A A Longevity insurance or Deferred income annuities A A Figure 140: Familiarity with Benefits Programs and Products by Gender How familiar are you with the benefits provided by the following programs/products...? Pre-retirees Retirees (%Very/Somewhat familiar) Male (n=511) Female (n=519) Male (n=493) Female (n=532) (a) (b) (a) (b) Medicare 68% 62% 81% 85% Medicaid 61 B Long-term care insurance 56 B Reverse mortgage 57 B Longevity insurance or Deferred income annuities 29 B B
136 136 Figure 141: Familiarity with Benefits Programs and Products by Age How familiar are you with the benefits provided by the following programs/products...? (%Very/Somewhat familiar) (n=519) Pre-retirees Retirees Retired Widows (n=423) 65+ (n=88) (n=394) (n=415) (n=216) (n=180) (n=241) (a) (b) (c) (a) (b) (c) (a) (b) Medicare 62% 63% 89% AB 74% 89% A 90% A 88% 93% Medicaid B Long-Term Care Insurance AB Reverse Mortgage A Longevity Insurance or Deferred Income Annuities AB Long-Term Care Plans Almost half of pre-retirees say they have saved money to pay for the potential costs of a nursing home or a home health aide. Among those who have saved, there is no indication they would have saved enough. Beyond that, very few have taken any action to prepare for the possible need for long-term care, although many say they intend to take a variety of steps. Only 11% of preretirees and 17% of retirees have even discussed with their families how they would pay for a nursing home or home health aide. Similar proportions (9% pre-retirees and 13% retirees) have discussed this issue with a financial professional and only about one in ten has bought long-term care insurance. Additionally, some have financial or legal plans in place that may be useful if they required care. More than half of retirees (55%) have a living will or power of attorney in place in the event that they become incapacitated; fewer than four in ten pre-retirees have this (38%). Retired widows (71%) are more likely to have a living will compared to other retirees. Three in four pre-retirees own life insurance (77%) and half have disability insurance (48%). Pre-retirees are more likely than retirees (53%) and retired widows (54%) to have life insurance. 136
137 137 Figure 142: Preparations for the Cost of Long-Term Care Have you done or do you plan to prepare for the costs of nursing home care or having a home aide in the following ways? 137
138 138 Figure 143: Preparations for the Cost of Long-Term Care by Income Have you done or do you plan to prepare for the costs of nursing home care or having a home aide in the following ways? (%Already done) <$50K (n=241) Pre-retirees Retirees Retired Widows $50K to $99K (n=395) $100K+ (n=394) <$35K (n=318) $35K to $74K (n=391) $75K+ (n=316) <$35K (n=185) $35K+ (n=236) (a) (b) (c) (a) (b) (c) (a) (b) Save on your own 28% 41% A 57% AB 29% 51% A 65% AB 33% 66% A Discussed how you will pay for long-term care with your family A AB A Discussed how you will pay for long-term care with a financial professional 3 8 A 13 AB 5 12 A 23 AB 6 30 A Purchase long-term care insurance 5 11 A 11 A 5 11 A 24 AB 8 29 A Sell your home * = <.5% Use a reverse mortgage 2 * * 2 2 * 4 B * Figure 144: Preparations for the Cost of Long-Term Care by Gender Have you done or do you plan to prepare for the costs of nursing home care or having a home aide in the following ways? (%Already done) Male (n=511) Pre-retirees Female (n=519) Male (n=493) Retirees Female (n=532) (a) (b) (a) (b) Save on your own 51% B 41% 49% 43% Discussed how you will pay for long-term care with your family Discussed how you will pay for long-term care with a financial professional Purchase long-term care insurance Sell your home A * = <.5% Use a reverse mortgage *
139 139 Figure 145: Preparations for the Cost of Long-Term Care by Age Have you done or do you plan to prepare for the costs of nursing home care or having a home aide in the following ways? Pre-retirees Retirees Retired Widows (%Already done) (n=519) (n=423) 65+ (n=88) (n=394) (n=415) (n=216) (n=180) (n=241) (a) (b) (c) (a) (b) (c) (a) (b) Save on your own 43% 45% 62% AB 43% 46% 52% 53% 48% Discussed how you will pay for long-term care with your family Discussed how you will pay for long-term care with a financial professional 6 13 A Purchase long-term care insurance A Sell your home A 8 12 Use a reverse mortgage * 1 5 A -- 4 A * = <.5% Influence of Parent Experiences Both pre-retirees and retirees indicate concern and a lack of planning for long-term care in retirement. Their parents retirement experience clearly influences their views, especially among those whose parents required long-term care. Overall, more than half of pre-retirees (56%) and four in ten retirees (43%) state their parents experiences in retirement have made them more concerned about their own financial security in retirement. Moreover, among those whose parents required long-term care, 67% of pre-retirees and 46% of retirees say their parents experience made them more concerned about their own financial security, far more concern than among those whose parents did not require care (41% preretirees and 32% retirees). 139
140 140 Figure 146: Level of Financial Concern Based on Parents Experiences On the whole, do you think your parents' experiences have made you more or less concerned about - Your financial security in retirement? (Asked among those whose parents lived to retirement) Figure 147: Level of Financial Concern Based on Parents Experiences by Income On the whole, do you think your parents' experiences have made you more or less concerned about - Your financial security in retirement? (Asked among those whose parents lived to retirement) Level of Financial Concern Based on Parents Experiences <$50K (n=203) Pre-retirees Retirees Retired Widows $50K to $99K (n=342) $100K+ (n=351) <$35K (n=208) $35K to $74K (n=291) $75K+ (n=258) <$35K (n=118) $35K+ (n=180) (a) (b) (c) (a) (b) (c) (a) (b) Much more concerned 37% BC 23% 22% 22% BC 13% 11% 27% B 15% Somewhat more concerned No more or less concerned A 38 A A Somewhat less concerned A A Much less concerned NET: Much/Somewhat more concerned 67 BC C B 42 NET: Much/Somewhat less concerned A 140
141 141 Figure 148: Level of Financial Concern Based on Parents Experiences by Gender On the whole, do you think your parents' experiences have made you more or less concerned about - Your financial security in retirement? (Asked among those whose parents lived to retirement) Level of Financial Concern Based on Parents Experiences Male (n=440) Pre-retirees Female (n=456) Male (n=365) Retirees Female (n=392) (a) (b) (a) (b) Much more concerned 22% 28% 12% 18% Somewhat more concerned No more or less concerned Somewhat less concerned Much less concerned NET: Much/Somewhat more concerned A NET: Much/Somewhat less concerned B
142 142 Figure 149: Level of Financial Concern Based on Parents Experiences by Age On the whole, do you think your parents' experiences have made you more or less concerned about - Your financial security in retirement? (Asked among those whose parents lived to retirement) Level of Financial Concern Based on Parents Experiences (n=467) Pre-retirees Retirees Retired Widows (n=360) 65+ (n=69) (n=302) (n=306) (n=149) (n=132) (n=166) (a) (b) (c) (a) (b) (c) (a) (b) Much more concerned 26% 25% 22% 16% 17% 12% 21% 20% Somewhat more concerned B 21 No more or less concerned Somewhat less concerned 8 C 5 C A Much less concerned NET: Much/Somewhat more concerned B 41 NET: Much/Somewhat less concerned 11 C 8 C A 142
143 143 Figure 150: Level of Financial Concern Based on Parents Experiences by Parents Who Needed Long-Term Care On the whole, do you think your parents' experiences have made you more or less concerned about - Your financial security in retirement? (Asked among those whose parents lived to retirement) Level of Financial Concern Based on Parents Experiences Parent Needed Care (n=519) Pre-retirees Parent Did Not Need Care (n=377) Parent Needed Care (n=575) Retirees Parent Did Not Need Care (n=182) (a) (b) (a) (b) Much more concerned 33% B 15% 18% B 8% Somewhat more concerned 33 B No more or less concerned A Somewhat less concerned 2 11 A 9 10 Much less concerned A NET: Much/Somewhat more concerned 67 B B 32 NET: Much/Somewhat less concerned 4 16 A A 143
144 144 IMPACT OF ADVISOR USE AND FINANCIAL PLANS Most pre-retirees and retirees do not work with a financial advisor and do not have a comprehensive financial plan. Only 32% of pre-retirees and an equal proportion of retirees have a professional financial advisor. Advisor use is higher among those with assets over $100,000 or more (Pre-retirees: 15% vs.45%; Retirees: 8% vs. 56%). Moreover, only 40% of retirees and 30% of pre-retirees have a comprehensive financial plan. Expectedly, those with higher assets (Pre-retirees: 13% vs.42%; Retirees: 17% vs. 64%) and those working with a financial advisor (Pre-retirees: 15% vs. 62%; Retirees 23% vs.76%) are more likely to have created a comprehensive financial plan. Pre-retirees and retirees with financial advisors and comprehensive plans are more likely to be women, college graduates and married couples. Even though those with higher asset levels tend to feel greater financial security and have prepared more extensively for retirement, consulting with a professional financial advisor boosts feelings of economic wellness. Pre-retirees and retirees who work with a financial advisor make more financial preparations. Regardless of asset level or advisor status respondents say they are eliminating debt, saving more and spending less. Having an advisor and comprehensive financial plan increases the likelihood of lower asset pre-retirees and retirees to make or be planning to make less common preparations such as moving their assets to less risky investments, investing in stocks or buying a lifetime income product. Advisees and planners also give more thought to many aspects of aging including what they would like out of retirement and how they plan to pay for long-term care. Retirees and pre-retirees with investable assets totaling less than $100,000 and who are not working with an advisor are financially vulnerable in retirement. They are less prepared to handle financial shocks, less confident in managing their household s finances, more uncertain of their housing arrangements in retirement and less familiar with long-term care solutions. Concerns in Retirement, by Advisor Use, Plan Status and Asset Level Lower asset pre-retirees and retirees defined as less than $100,000 in assets - are more concerned about financial aspects of retirement. However, even among lower asset respondents, working with an advisor and having a financial plan slightly alleviates these concerns. Lower asset respondents working with an advisor are slightly less concerned than their asset level counterparts not working with an advisor in regard to depleting their savings, maintaining a reasonable standard of living and becoming incapable of managing their finances. Not only do pre-retirees in consultation with an advisor feel slightly less concerned, they re also more likely to feel their financial planning is ahead of schedule. Advisees and planners also give more thought to many financial aspects including their desired lifestyle, sufficiency of their current savings and healthcare costs. Those with lower assets not in consultation with an advisor give significantly less thought to these topics. 144
145 145 Figure 151: Pre-retiree Concerns in Retirement by Advisor, Plan Status and Asset Level How concerned are you about each of the following (during retirement)? Pre-retirees (%Very/Somewhat concerned) The value of your savings and investments might not keep up with inflation Total Advisor/Income Advisor+Plan/Income Total (n=1,030) <$100K Adv (n=62) $100K+ Adv (n=261) <$100K No Adv (n=341) $100K+ No Adv (n=304) <$100K Adv/Plan (n=27*) $100K+ Adv/Plan (n=164) <$100K No Adv/No Plan (n=308) $100K+ No Adv/No Plan (n=223) (a) (b) (a) (b) (a) (b) (a) (b) 77% 85% B 68% 84% B 75% 85% B 60% 86% B 77% You might not have money to pay for adequate health care B B B B 67 You might not have enough money to pay for a long stay in a nursing home or a long period of nursing care at home B B 67 You might deplete all of your savings B B B 66 You might not be able to maintain a reasonable standard of living for the rest of your life There might come a time when you (and your spouse/partner) are incapable of managing your finances You might not be able to maintain the same standard of living after your spouse/partner s death, if he/she should die first Your (spouse/partner) might not be able to maintain the same standard of living after your death B B B B B B B B B B B B 51 You might be a victim of a fraud or scam B B B You might not be able to leave money to your children or other heirs B B B 35 You may not be able to stay in your home as you age^ B B B 47 Your spouse or partner may not be able to stay in your home, if you should die first^ B ^Asked among homeowners *Base size under 50, please use caution 145
146 146 Figure 152: Retiree Concerns in Retirement by Advisor, Plan Status and Asset Level How concerned are you about each of the following (during retirement)? Retirees (%Very/Somewhat concerned) You might not have enough money to pay for a long stay in a nursing home or a long period of nursing care at home The value of your savings and investments might not keep up with inflation Total Advisor/Income Advisor+Plan/Income Total (n=1,025) <$100K Adv (n=43*) $100K+ Adv (n=292) <$100K No Adv (n=363) $100K+ No Adv (n=222) <$100K Adv/Plan (n=26*) $100K+ Adv/Plan (n=224) <$100K No Adv/No Plan (n=308) $100K+ No Adv/No Plan (n=115) (a) (b) (a) (b) (a) (b) (a) (b) 59% 82% B 47% 65% B 55% 76% B 44% 68% 68% B B You might not have money to pay for adequate health care B B B B 53 You might deplete all of your savings B B B 52 You might not be able to maintain a reasonable standard of living for the rest of your life There might come a time when you (and your spouse/partner) are incapable of managing your finances B B B B B B 39 You might be a victim of a fraud or scam You might not be able to maintain the same standard of living after your spouse/partner s death, if he/she should die first Your (spouse/partner) might not be able to maintain the same standard of living after your death You might not be able to leave money to your children or other heirs B B B B B B B 21 You may not be able to stay in your home as you age^ B B B B 47 Your spouse or partner may not be able to stay in your home, if you should die first^ B B B 31 ^Asked among homeowners *Base size under 50, please use caution 146
147 147 Financial Wellness in Retirement, by Advisor Use, Plan Status and Asset Level Pre-retirees and retirees with assets of $100,000 or more feel more financially secure and confident in their financial management skills and ability to absorb financial shocks in retirement compared to those with lower assets. These respondents are likely to have made or plan to make basic preparations for retirement. Even among this economically stable cohort, having an advisor boosts their feelings economic wellness. Respondents with over $100,000 in assets who have a financial advisor and comprehensive plan are more likely (compared to their asset level counterparts) to have financial plans and policies and have made or are planning to make other retirement preparations such as moving their money into less risky investments (Pre-retirees 100K, No adv/plan: 71% Pre-retirees 100K, Adv/plan: 84%; Retirees 100K, No adv/plan: 42% Retirees 100K, Adv/plan: 84%) and investing in stocks and stock mutual funds (Pre-retiree 100K, No adv/plan: 66% Pre-retiree 100K, Adv/plan: 76% ; Retiree 100K, No adv/plan: 38% Retiree 100K, Adv/plan: 83%). Additionally, they re less likely to have credit card debt or be negatively affected by the debt they own. Lower asset level respondents generally feel more vulnerable compared to those with higher assets but working with an advisor and having a comprehensive financial plan boosts their financial security, assuredness and preparedness as well. Retirees and pre-retirees with investable assets totaling less than $100,000 and who do not have an advisor or comprehensive financial are particularly vulnerable. Lower asset pre-retirees and retirees without an advisor or plan are less likely to have made important preparations for retirement and have future-facing plans and policies. Additionally, they feel more exposed to financial shocks such as car repairs, home repairs and medical expenses. Their vulnerability extends to borrowing as they are more likely to own credit card debt and be negatively affected by the debt they hold. 147
148 148 Figure 153: Pre-retiree Financial Security by Advisor, Plan Status and Asset Level How financially secure do you feel currently? Pre-retirees Total Advisor/Income Advisor+Plan/Income Total (n=1,030) <$100K Adv (n=62) $100K+ Adv (n=261) <$100K No Adv (n=341) $100K+ No Adv (n=304) <$100K Adv/Plan (n=27*) $100K+ Adv/Plan (n=164) <$100K No Adv/No Plan (n=308) $100K+ No Adv/No Plan (n=223) (a) (b) (a) (b) (a) (b) (a) (b) Very secure 14% 14% 27% A 3% 14% A 25% 34% 1% 10% A Somewhat secure A A Not too secure B B B 23 Not at all secure B B 25 NET: Very/Somewhat secure A A A NET: Not too/not at all secure B B B 28 *Base size under 50, please use caution 148
149 149 Figure 154: Retiree Financial Security by Advisor, Plan Status and Asset Level How financially secure do you feel currently? Retirees Total Advisor/Income Advisor+Plan/Income Total (n=1,025) <$100K Adv (n=43*) $100K+ Adv (n=292) <$100K No Adv (n=363) $100K+ No Adv (n=222) <$100K Adv/Plan (n=26*) $100K+ Adv/Plan (n=224) <$100K No Adv/No Plan (n=308) $100K+ No Adv/No Plan (n=115) (a) (b) (a) (b) (a) (b) (a) (b) Very secure 21% 16% 40% A 5% 30% A 18% 47% A 5% 18% A Somewhat secure A A Not too secure B 4 28 B B 8 Not at all secure B ^ B 1 NET: Very/Somewhat secure A A A NET: Not too/not at all secure B 4 58 B B 9 ^=>.05% *Base size under 50, please use caution 149
150 150 Figure 155: Pre-retirees Ability to Handle Financial Shocks in Retirement by Advisor, Plan Status and Asset Level How well prepared are you financially to handle the following (during retirement)? Pre-retirees (%Very/Somewhat prepared) Total Advisor/Income Advisor+Plan/Income Total (n=1,030) <$100K Adv (n=62) $100K+ Adv (n=261) <$100K No Adv (n=341) $100K+ No Adv (n=304) <$100K Adv/Plan (n=27*) $100K+ Adv/Plan (n=164) <$100K No Adv/No Plan (n=308) $100K+ No Adv/No Plan (n=223) (a) (b) (a) (b) (a) (b) (a) (b) Car repairs or replacement 65% 68% 82% 40% 76% A 69% 88% 36% 71% A Major home repairs or upgrades A A A Significant out-of-pocket medical, dental, or prescription expenses The death of a spouse or long-term partner during retirement A A A A A A A A drop in home value of 25% or more A A A A family member in need of financial support A A A loss in the total value of your savings of 25% or more due to poor investment decisions or a market decline A A Running out of assets A A A Divorce during retirement *Base size under 50, please use caution 150
151 151 Figure 156: Retirees Ability to Handle Financial Shocks in Retirement by Advisor, Plan Status and Asset Level How well prepared are you financially to handle the following (during retirement)? Total Advisor/Income Advisor+Plan/Income Retirees (%Very/Somewhat prepared) Total (n=1,025) <$100K Adv (n=43*) $100K+ Adv (n=292) <$100K No Adv (n=363) $100K+ No Adv (n=222) <$100K Adv/Plan (n=26*) $100K+ Adv/Plan (n=224) <$100K No Adv/No Plan (n=308) $100K+ No Adv/No Plan (n=115) (a) (b) (a) (b) (a) (b) (a) (b) Car repairs or replacement 67% 47% 90% A 46% 89% A 50% 92% A 42% 84% A Significant out-of-pocket medical, dental, or prescription expenses A A A A Major home repairs or upgrades A A A A A drop in home value of 25% or more A A A Running out of assets A A A The death of a spouse or long-term partner during retirement A A A A family member in need of financial support A A A A A loss in the total value of your savings of 25% or more due to poor investment decisions or a market decline A A A Divorce during retirement A 5 14 A A 4 14 A *Base size under 50, please use caution 151
152 152 Figure 157: Pre-retirees Negative Impact of Debt by Advisor, Plan Status and Asset Level To what extent, if at all, has debt negatively impacted (how much you are able to put away each month in savings and investments/your ability to maintain your desired lifestyle)? (Among those in debt) Pre-retirees Negative Impact of Debt on Lifestyle Total Advisor/Income Advisor+Plan/Income Total (n=714) <$100K Adv (n=44*) $100K + Adv (n=163) <$100K No Adv (n=281) $100K+ No Adv (n=189) <$100K Adv/Plan (n=19*) $100K+ Adv/Plan (n=93) <$100K No Adv/No Plan (n=254) $100K+ No Adv/No Plan (n=152) (a) (b) (a) (b) (a) (b) (a) (b) A great deal 28% 23% 18% 41% B 21% 16% 10% 45% B 23% Somewhat A little Not at all A A A NET: A great deal/somewhat A B 50 NET: A little/not at all A A *Base size under 50, please use caution 152
153 153 Figure 158: Retirees Negative Impact of Debt by Advisor, Plan Status and Asset Level To what extent, if at all, has debt negatively impacted (how much you are able to put away each month in savings and investments/your ability to maintain your desired lifestyle)? (Among those in debt) Retirees Negative Impact of Debt on Lifestyle Total Advisor/Income Advisor+Plan/Income Total (n=565) <$100K Adv (n=26*) $100K+ Adv (n=134) <$100K No Adv (n=267) $100K+ No Adv (n=87) <$100K Adv/Plan (n=14*) $100K+ Adv/Plan (n=95) <$100K No Adv/No Plan (n=227) $100K+ No Adv/No Plan (n=51) (a) (b) (a) (b) (a) (b) (a) (b) A great deal 13% 6% 2% 21% B 2% -- 2% 22% B -- Somewhat B 6 28 B 9 44% B 7 29 B 10% A little B Not at all A A A A NET: A great deal/somewhat B 8 49 B B 9 51 B 10 NET: A little/not at all A A A A *Base size under 50, please use caution 153
154 154 Figure 159: Pre-retiree Actions Taken/Planning for Financial Protection by Advisor, Plan Status and Asset level Have you already done the following, plan to do it in the future, or have no plans to do it to protect yourself financially (after you retire/ as you get older)? Pre-retirees (%Already done/plan do to) Eliminate all of your consumer debt, by paying off all credit cards and loans Total Advisor/Income Advisor+Plan/Income Total (n=1,030) <$100K Adv (n=62) $100K+ Adv (n=261) <$100K No Adv (n=341) $100K+ No Adv (n=304) <$100K Adv/Plan (n=27*) $100K+ Adv/Plan (n=164) <$100K No Adv/No Plan (n=308) $100K+ No Adv/No Plan (n=223) (a) (b) (a) (b) (a) (b) (a) (b) 89% 83% 93% 86% 92% 88% 94% 86% 91% Try to save as much as you can Cut back on spending B B 70 Completely pay off your mortgage A A A Move your assets to less risky investments as you get older A A A Invest a portion of your money in stocks or stock mutual funds A A Consult a financial professional for advice or guidance A A Work longer B Postpone taking Social Security A Buy a product or choose an employer plan option that will provide you with guaranteed income for life A *Base size under 50, please use caution 154
155 155 Figure 160: Retiree Actions Taken/Planning for Financial Protection by Advisor, Plan Status and Asset level Have you already done the following, plan to do it in the future, or have no plans to do it to protect yourself financially (after you retire/ as you get older)? Retirees (%Already done/plan do to) Eliminate all of your consumer debt, by paying off all credit cards and loans Total Advisor/Income Advisor+Plan/Income Total (n=1,025) <$100K Adv (n=43*) $100K+ Adv (n=292) <$100K No Adv (n=363) $100K+ No Adv (n=222) <$100K Adv/Plan (n=26*) $100K+ Adv/Plan (n=224) <$100K No Adv/No Plan (n=308) $100K+ No Adv/No Plan (n=115) (a) (b) (a) (b) (a) (b) (a) (b) 82% 90% 90% 78% 86% A 84% 89% 76% 86% A Try to save as much as you can A A Cut back on spending B B B 59 Completely pay off your mortgage A A Move your assets to less risky investments as you get older A A Invest a portion of your money in stocks or stock mutual funds A A Consult a financial professional for advice or guidance A A Buy a product or choose an employer plan option that will provide you with guaranteed income for life A Postpone taking Social Security A Work longer *Base size under 50, please use caution 155
156 156 Housing Topics in Retirement, by Advisor Use, Plan Status and Asset Level Views on housing in retirement appear unaffected by advisor use and plan status. Regardless of working with an advisor, higher asset respondents are more open to the idea of selling their home to fund retirement compared to those with assets under $100,000, who are more reluctant. Also, nearly all pre-retirees and retirees, regardless of asset level and advisor status, share the priorities of living near quality healthcare facilities and in a low or no maintenance home. Interestingly, among lower asset pre-retirees who work with an advisor, there is increased importance placed on quality of life attributes including being in a desirable climate, proximity to nature and scenery, a culture of mutual support and the ability to receive help with chores. Regardless of whether they work with an advisor or have a financial plan, lower asset respondents are more concerned about burdening their family in retirement or as they age. Yet, lower asset respondents working with an advisor are more likely to be planning to move in with family. Respondents of the same asset level without an advisor or plan are less certain of their living arrangements in retirement. Long-Term Care Preparations, by Advisor Use, Plan Status and Asset Level Asset level and advisor use aside, most pre-retirees and retirees have had at least one parent who had an illness or disability that limited their independence in retirement. Although very few paid for their parents long-term care, lower asset respondents are more likely to be very concerned about paying for their own long-term care. Lower asset retirees and pre-retirees without a plan or advisor are more uncertain of how they would pay for long-term care and are less familiar with benefit programs including Medicare, long-term care insurance, and reverse mortgages. Working with an advisor may help lower asset retirees and pre-retirees manage long-term care concerns and costs, as pre-retirees who work with an advisor have given more thought to how they would receive long-term care and are less likely to perceive long-term care as a catastrophic burden. 156
157 157 Figure 161: Pre-retiree Thought Given to Long-term Care by Advisor, Plan Status and Asset Level How much thought have you given to how you will receive long-term care, should you need it as you age, and who will provide care for you? Pre-retirees Thought Given to Long-term Care Total Advisor/Income Advisor+Plan/Income Total (n=1,030) <$100K Adv (n=62) $100K+ Adv (n=261) <$100K No Adv (n=341) $100K+ No Adv (n=304) <$100K Adv/Plan (n=27*) $100K+ Adv/Plan (n=164) <$100K No Adv/No Plan (n=308) $100K + No Adv/No Plan (n=223) (a) (b) (a) (b) (a) (b) (a) (b) A great deal 12% 28% B 12% 11% 10% 42% B 14% 10% 9% Somewhat A little A Not at all A NET: A great deal/somewhat B NET: A little/not at all A *Base size under 50, please use caution 157
158 158 Figure 162: Retiree Thought Given to Long-term Care by Advisor, Plan Status and Asset Level How much thought have you given to how you will receive long-term care, should you need it as you age, and who will provide care for you? Total Advisor/Income Advisor+Plan/Income Retirees Thought Given to Long-term Care Total (n=1,025) <$100K Adv (n=43*) $100K+ Adv (n=292) <$100K No Adv (n=363) $100K+ No Adv (n=222) <$100K Adv/Plan (n=26*) $100K+ Adv/Plan (n=224) <$100K No Adv/No Plan (n=308) $100K + No Adv/No Plan (n=115) (a) (b) (a) (b) (a) (b) (a) (b) A great deal 19% 43% B 23% 20% 13% 31% 24% 21% B 7% Somewhat A little Not at all NET: A great deal/somewhat NET: A little/not at all *Base size under 50, please use caution 158
159 159 Figure 163: Pre-retiree Familiarity with Benefits Programs and Products by Advisor, Plan Status and Asset Level How familiar are you with the benefits provided by the following programs/products...? Pre-retirees (%Very/Somewhat familiar) Total Advisor/Income Advisor+Plan/Income Total (n=1,030) <$100K Adv (n=62) $100K+ Adv (n=261) <$100K No Adv (n=341) $100K+ No Adv (n=304) <$100K Adv/Plan (n=27*) $100K+ Adv/Plan (n=164) <$100K No Adv/No Plan (n=308) $100K + No Adv/No Plan (n=223) (a) (b) (a) (b) (a) (b) (a) (b) Medicare 65% 68% 71% 57% 68% A 83% 73% 56% 63% Medicaid Long-term care insurance A A Reverse mortgage A A Longevity insurance or Deferred Income Annuities A A *Base size under 50, please use caution 159
160 160 Figure 164: Retiree Familiarity with Benefits Programs and Products by Advisor, Plan Status and Asset Level How familiar are you with the benefits provided by the following programs/products...? Total Advisor/Income Advisor+Plan/Income Retirees (%Very/Somewhat familiar) Total (n=1,025) <$100K Adv (n=43*) $100K+ Adv (n=292) <$100K No Adv (n=363) $100K+ No Adv (n=222) <$100K Adv/Plan (n=26*) $100K+ Adv/Plan (n=224) <$100K No Adv/No Plan (n=308) $100K + No Adv/No Plan (n=115) (a) (b) (a) (b) (a) (b) (a) (b) Medicare 83% 89% 83% 82% 81% 90% 83% 81% 78% Medicaid B B 44 Reverse mortgage A A Long-term care insurance A A Longevity insurance or Deferred Income Annuities A *Base size under 50, please use caution 160
161 161 TRENDED CORE FINDINGS A great deal of caution should be exercised when comparing the results of the 2017, 2015 and 2013 studies with the results from questions from earlier iterations of the survey. While the 2017, 2015 and 2013 studies were conducted online, all previous studies in the series were conducted by telephone. A test comparing online and telephone results for pre-retirees showed that telephone respondents were more likely than online respondents to choose responses at the extremes of attitudinal scales and to respond in what they may have perceived as more socially acceptable ways, such as providing later expected ages for retirement and indicating that they have a financial plan for retirement income and spending. In addition, telephone respondents are less likely than online respondents to select the don t know response. Therefore, many of the differences between the 2017, 2015 and 2013 findings and the findings from previous years may be the result of the change in survey mode rather than an indication of a true shift in attitudes or behaviors of the pre-retiree and retiree populations. Nevertheless, some conclusions about recurring themes and trends can be drawn, which are outlined below and illustrated in subsequent figures. Pre-retirees continue to say they will retire at a later age than retirees actually did retire. Though the exact order may vary, inflation, health care, and long-term care continue to head the list of retirement risks that pre-retirees and retirees are concerned about. Preretirees remain more likely than retirees to say they are concerned about these risks. Compared to 2013 and 2015, concerns about retirement risk spike in 2017 among preretirees and retirees. The three primary risk management strategies used by both pre-retirees and retirees remain elimination of debt, saving as much as possible, and reduce spending. More so than in 2015, majorities of pre-retirees plan to eliminate all consumer debt and completely pay off their mortgage. Although there was a wording change in the survey instrument that may influence trended results, it appears pre-retirees are more likely than they were in 2015 to indicate that they plan to work longer. Both pre-retirees and retirees are more likely than in 2015 to say they have or will buy a product that provides guaranteed lifetime income. An increasing share of both pre-retirees and retirees report that at least one of their parents experienced a debilitating illness or disability in retirement, or that their parent lost the ability to manage his or her own finances. 161
162 162 These recurring themes do not change much, even though the environment has changed. During the time since the survey series started, there has been a continued shift to defined contribution plans, the average age of the population has continued to increase, and there have been two periods of economic turmoil, including a major decline and slow recovery in housing prices. The Affordable Care Act was passed in 2010, and its future under a new administration in 2017 is unknown. These environmental changes have served to complicate the challenges that Americans face. 162
163 163 Managing Risks in Retirement Figure 165: Trended Issues of Concern, Among Pre-retirees How concerned are you about each of the following (in retirement)? The value of your savings and investments might not keep up with inflation* Very Concerned Somewhat Concerned Not Too Concerned Not at All Concerned 2017 (n=1,030, online) 33% (n=1,035, online) 19% (n=1,000, online) 30% (n=800, telephone) 43% (n=403, telephone) 31% (n=401, telephone) 23% (n=300, telephone) 26% (n=301, telephone) 42% (n=318, telephone) 24% You might not have enough money to pay for adequate health care 2017 (n=1,030, online) 37% (n=1,035, online) 26% (n=1,000, online) 34% (n=800, telephone) 43% (n=403, telephone) 31% (n=401, telephone) 35% (n=300, telephone) 42% (n=301, telephone) (good health care) 49% (n=318, telephone) (good health care) 30% You might not have enough money to pay for a long stay in a nursing home or a long period of nursing care at home 2017 (n=1,030, online) 35% (n=1,035, online) 22% (n=1,000, online) 27% (n=800, telephone) 34% (n=403, telephone) 22% (n=401, telephone) 23% (n=300, telephone) 35% (n=301, telephone) 33% *Prior to 2011, the wording for this question was you might not be able to keep the value of your savings and investments up with inflation. 163
164 164 Figure 166: Trended Issues of Concern, Among Pre-retirees (Cont.) How concerned are you about each of the following (in retirement)? You might deplete all of your savings Very Concerned Somewhat Concerned Not Too Concerned Not at All Concerned 2017 (n=1,030, online) 32% (n=1,035, online) 21% (n=1,000, online) 27% (n=800, telephone) 33% (n=403, telephone) 23% (n=401, telephone) 18% (n=300, telephone) (and be left only with SS) 28% (n=301, telephone) (and be left only with SS) 37% You might not be able to maintain a reasonable standard of living for the rest of your life 2017 (n=1,030, online) 30% (n=1,035, online) 20% (n=1,000, online) 25% (n=800, telephone) 27% (n=403, telephone) 23% (n=401, telephone) 19% (n=300, telephone) 24% (n=301, telephone) 34% (n=318, telephone) 20% There might come a time when you (and your spouse/partner) are incapable of managing your finances 2017 (n=1,030, online) 21% (n=1,035, online) 12% (n=1,000, online) 14% You might not be able to maintain the same standard of living after your spouse s/partner s death, if he/she should die first (if married) 2017 (n=673, online) 23% (n=654, online) 12% (n=709, online) 18%
165 165 Figure 167: Trended Issues of Concern, Among Pre-retirees (Cont.) How concerned are you about each of the following (in retirement)? Your spouse/partner may not be able to maintain the same standard of living after your death, if you should die first (if married) Very Concerned Somewhat Concerned Not Too Concerned Not at All Concerned 2017 (n=673, online) 23% (n=654, online) 10% (n=709, online) 19% (n=599, telephone) 21% (n=307, telephone) 14% (n=299, telephone) 10% (n=206, telephone) 16% (n=200, telephone) 25% (n=216, telephone) 17% You might be a victim of a fraud or scam 2017 (n=1,030, online) 13% (n=1,035, online) 6% (n=1,000, online) 9% The equity you have in your home may not be sufficient to support your retirement plans (if homeowner) 2017 (n=826, online) 15% (n=782, online) 9% (n=810, online) 15% (n=727, telephone) 21% You might not be able to leave money to your children or other heirs 2017 (n=1,030, online) 17% (n=1,035, online) 12% (n=1,000, online) 13% (n=800, telephone) 18% (n=403, telephone) 11% (n=401, telephone) 10% (n=300, telephone) 16% (n=301, telephone) 13% (n=300, telephone) (left only with Social Security) 28% (n=301, telephone) (left only with Social Security) 37%
166 166 Figure 168: Trended Issues of Concern, Among Retirees How concerned are you about each of the following (in retirement)? You might not have enough money to pay for a long stay in a nursing home or a long period of nursing care at home Very Concerned Somewhat Concerned Not Too Concerned Not at All Concerned 2017 (n=1,025, online) 26% (n=1,005, online) 19% (n=1,000, online) 20% (n=800, telephone) 32% (n=401, telephone) 18% (n=400, telephone) 27% (n=302, telephone) 24% (n=303, telephone) 20% The value of your savings and investments might not keep up with inflation* 2017 (n=1,025, online) 24% (n=1,005, online) 14% (n=1,000, online) 22% (n=800, telephone) 37% (n=401, telephone) 23% (n=400, telephone) 23% (n=302, telephone) 22% (n=303, telephone) 25% (n=282, telephone) 21% You might not have enough money to pay for adequate health care 2017 (n=1,025, online) 25% (n=1,005, online) 14% (n=1,000, online) 19% (n=800, telephone) 34% (n=401, telephone) 23% (n=400, telephone) 26% (n=302, telephone) 23% (n=303, telephone) (good health care) 22% (n=282, telephone) (good health care) 22% *Prior to 2011, the wording for this question was you might not be able to keep the value of your savings and investments up with inflation. 166
167 167 Figure 169: Trended Issues of Concern, Among Retirees (Cont.) How concerned are you about each of the following (in retirement)? You might not be able to maintain a reasonable standard of living for the rest of your life Very Concerned Somewhat Concerned Not Too Concerned Not at All Concerned 2017 (n=1,025, online) 23% (n=1,005, online) 15% (n=1,000, online) 14% (n=800, telephone) 28% (n=401, telephone) 17% (n=400, telephone) 20% (n=302, telephone) 17% (n=303, telephone) 17% (n=282, telephone) 17% You might deplete all of your savings 2017 (n=1,025, online) 22% (n=1,005, online) 14% (n=1,000, online) 16% (n=800, telephone) 27% (n=401, telephone) 20% (n=400, telephone) 23% (n=302, telephone) (left only with Social Security) 20% (n=303, telephone) (left only with Social Security) 25% There might come a time when you (and your spouse/partner) are incapable of managing your finances 2017 (n=1,025, online) 18% (n=1,005, online) (n=1,000, online) You might be a victim of a fraud or scam 2017 (n=1,025, online) 15% (n=1,005, online) 9% (n=1,000, online) 10%
168 168 Figure 170: Trended Issues of Concern, Among Retirees (Cont.) How concerned are you about each of the following (in retirement)? You might not be able to maintain the same standard of living after your spouse s/partner s death, if he/she should die first (if married) Very Concerned Somewhat Concerned Not Too Concerned Not at All Concerned 2017 (n=549, online) 17% (n=598, online) 10% (n=749, online) 15% Your spouse/partner may not be able to maintain the same standard of living after your death, if you should die first (if married) 2017 (n=549, online) 19% (n=598, online) 9% (n=749, online) 17% (n=521, telephone) 20% (n=260, telephone) 14% (n=261, telephone) 17% (n=181, telephone) 18% (n=194, telephone) 15% (n=169, telephone) 16% You might not be able to leave money to your children or other heirs 2017 (n=1,025, online) 13% (n=1,005, online) 9% (n=1,000, online) 8% (n=800, telephone) 17% (n=401, telephone) 9% (n=400, telephone) 14% (n=302, telephone) 10% (n=303, telephone) 11% The equity you have in your home may not be sufficient to support your retirement plans (if homeowner) 2017 (n=808, online) 12% (n=802, online) 9% (n=888, online) 8% (n=723, telephone) 21%


169 169 Figure 171: Trended Estimate of Personal Life Expectancy, Among Pre-retirees Until what age do you think that you can expect to live? Figure 172: Trended Estimate of Personal Life Expectancy, Among Retirees Until what age do you think that you can expect to live? 169
170 170 Figure 173: Trended Risk Management Strategies, Among Pre-retirees For each, please indicate whether you (and your spouse/partner) have done that, plan to do that in the future, or have no plans to do that. Eliminate all of your consumer debt, by paying off all credit cards and loans Total Use of Strategy Already Done Plan to Do in Future No Plans To Do 2017 (n=1,030, online) 92% (n=1,035, online) 88% (n=1,000, online) 93% (n=800, telephone) 90% (n=403, telephone) 90% (n=401, telephone) 89% (n=300, telephone) 88% Try to save as much money as you can 2017 (n=1,030, online) 91% (n=1,035, online) 90% (n=1,000, online) 92% (n=800, telephone) 89% (n=403, telephone) 85% (n=401, telephone) 90% (n=300, telephone) 84% Cut back on spending 2017 (n=1,030, online) 80% (n=1,035, online) 81% (n=1,000, online) 88% (n=800, telephone) 83% (n=403, telephone) 78% (n=401, telephone) 73% (n=300, telephone) 79% Completely pay off your mortgage 2017 (n=1,030, online) 77% (n=1,035, online) 70% (n=1,000, online) 73% (n=800, telephone) 82% (n=403, telephone) 80% (n=401, telephone) 76% (n=212, telephone) 88%
171 171 Figure 174: Trended Risk Management Strategies, Among Pre-retirees (Cont.) For each, please indicate whether you (and your spouse/partner) have done that, plan to do that in the future, or have no plans to do that. Invest a portion of your money in stocks or stock mutual funds Total Use of Strategy Already Done Plan to Do in Future No Plans To Do 2017 (n=1,030, online) 65% (n=1,035, online) 59% (n=1,000, online) 63% (n=800, telephone) 67% (n=403, telephone) 64% (n=401, telephone) 65% (n=300, telephone) 62% Move your assets to less risky investments as you get older 2017 (n=1,030, online) 65% (n=1,035, online) 56% (n=1,000, online) 64% (n=800, telephone) 65% (n=403, telephone)* 65% (n=401, telephone)* 59% (n=300, telephone)* 56% Consult a financial professional for advice or guidance 2017 (n=1,030, online) 60% (n=1,035, online) 60% (n=1,000, online) 61% (n=800, telephone) 63% * Wording prior to 2017: increasingly conservative investments. 171
172 172 Figure 175: Trended Risk Management Strategies, Among Pre-retirees (Cont.) For each, please indicate whether you (and your spouse/partner) have done that, plan to do that in the future, or have no plans to do that. Work longer Total Use of Strategy Already Done Plan to Do in Future No Plans To Do 2017 (n=1,030, online) 60% (n=1,035, online)* 46% Postpone taking Social Security 2017 (n=1,030, online) 52% (n=1,035, online) 50% (n=1,000, online) 50% (n=800, telephone) 44% (n=403, telephone) 39% Buy a product or choose an employer plan option that will provide you with guaranteed income for life 2017 (n=1,030, online) 44% (n=1,035, online) 33% (n=1,000, online) 37% (n=800, telephone) 40% (n=403, telephone) 38% (n=401, telephone) 32% (n=300, telephone) 39% *2015 wording: Postpone retirement. 172
173 173 Figure 176: Trended Risk Management Strategies, Among Retirees For each, please indicate whether you (and your spouse/partner) have done that, plan to do that in the future, or have no plans to do that. Eliminate all of your consumer debt, by paying off all credit cards and loans Total Use of Strategy Already Done Plan to Do in Future No Plans To Do 2017 (n=1,025, online) 85% (n=1,005, online) 86% (n=1,000, online) 90% (n=800, telephone) 83% (n=401, telephone) 81% (n=400, telephone) 79% (n=302, telephone) 81% Try to save as much money as you can 2017 (n=1,025, online) 74% (n=1,005, online) 74% (n=1,000, online) 79% (n=800, telephone) 81% (n=401, telephone) 75% (n=400, telephone) 76% (n=302, telephone) 74% Completely pay off your mortgage 2017 (n=1,025, online) 67% (n=1,005, online) 64% (n=1,000, online) 75% (n=800, telephone) 75% (n=401, telephone) 77% (n=400, telephone) 76% (n=269, telephone) 83% Cut back on spending 2017 (n=1,025, online) 65% (n=1,005, online) 76% (n=1,000, online) 77% (n=800, telephone) 76% (n=401, telephone) 68% (n=400, telephone) 67% (n=302, telephone) 65%
174 174 Figure 177: Trended Risk Management Strategies, Among Retirees (Cont.) For each, please indicate whether you (and your spouse/partner) have done that, plan to do that in the future, or have no plans to do that. Move your assets to less risky investments as you get older Total Use of Strategy Already Done Plan to Do in Future No Plans To Do 2017 (n=1,025, online) 48% (n=1,005, online) 48% (n=1,000, online) 56% (n=800, telephone) 58% (n=401, telephone)* 58% (n=400, telephone)* 49% (n=302, telephone)* 52% Invest a portion of your money in stocks or stock mutual funds 2017 (n=1,025, online) 45% (n=1,005, online) 48% (n=1,000, online) 57% (n=800, telephone) 53% (n=401, telephone) 52% (n=400, telephone) 56% (n=302, telephone) 54% Consult a financial professional for advice or guidance 2017 (n=1,025, online) 43% (n=1,005, online) 46% (n=1,000, online) 49% (n=800, telephone) 56% *Wording prior to 2017: increasingly conservative investments. 174
175 175 Figure 178: Trended Risk Management Strategies, Among Retirees (Cont.) For each, please indicate whether you (and your spouse/partner) have done that, plan to do that in the future, or have no plans to do that. Buy a product or choose an employer plan option that will provide you with guaranteed income for life Total Use of Strategy Already Done Plan to Do in Future No Plans To Do 2017 (n=1,025, online) 28% (n=1,005, online) 22% (n=1,000, online) 28% (n=800, telephone) 39% (n=401, telephone) 24% (n=400, telephone) 25% (n=302, telephone) 33% Postpone taking Social Security 2017 (n=1,025, online) 21% (n=1,005, online) 20% (n=1,000, online) 21% (n=800, telephone) 35% (n=401, telephone) 33% Work longer 2017 (n=1,025, online) 11% (n=1,005, online)* 12% *2015 wording: Postpone retirement. 175

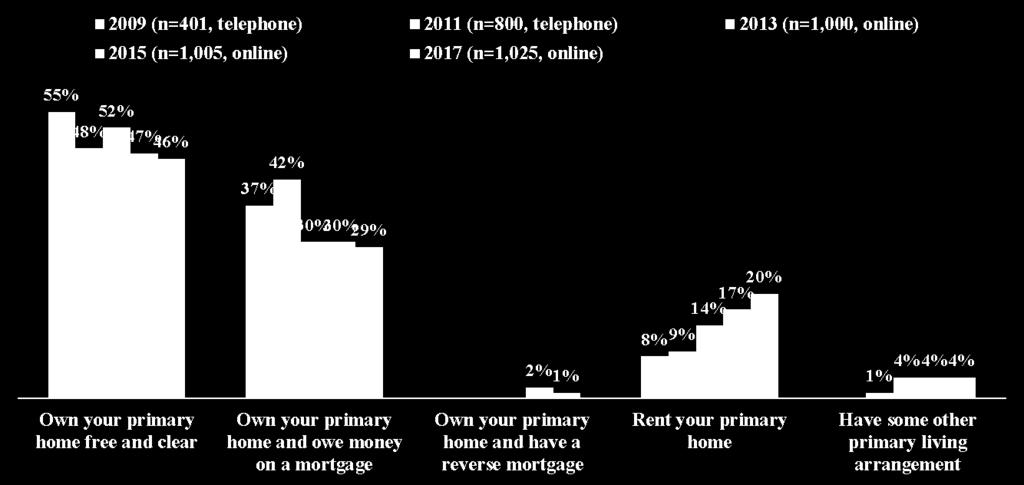
176 176 Figure 179: Trended Homeownership, Among Pre-retirees Do you currently own or rent your primary home or do you have some other primary living arrangement? Figure 180: Trended Homeownership, Among Retirees Do you currently own or rent your primary home or do you have some other primary living arrangement? 176


177 177 Process of Retirement Figure 181: Trended Expected Retirement Age, Among Pre-retirees Expected retirement age (from primary occupation) Figure 182: Trended Actual Retirement Age, Among Retirees Actual retirement age (from primary occupation) 177

178 178 Parents Retirement Figure 183: Trended Parents Experiences During Retirement, Among Pre-retirees To the best of your knowledge, did either of your parents experience any of the following during retirement? Figure 184: Trended Parents Experiences During Retirement, Among Retirees To the best of your knowledge, did either of your parents experience any of the following during retirement? 178


179 179 Figure 185: Trended Impact of Debt, Among Pre-retirees with Debt To what extent, if at all, has debt negatively impacted how much you are able to put away each month in savings and investments? Figure 186: Trended Impact of Debt, Among Retirees with Debt To what extent, if at all, has debt negatively impacted your ability to maintain your desired lifestyle? 179
2013 Risks and Process of Retirement Survey Report of Findings. Sponsored by The Society of Actuaries
 2013 Risks and Process of Survey Report of Findings Sponsored by The Society of Actuaries Prepared by Mathew Greenwald & Associates, Inc. December 2013 2013 Society of Actuaries, All Rights Reserved The
Retirement Survey Report Key Findings and Issues: Housing In Retirement Risks and Process of Retirement Survey Report
 Retirement Survey Report Key Findings and Issues: Housing In Retirement 2017 Risks and Process of Retirement Survey Report ACKNOWLEDGMENTS THIS REPORT WAS PREPARED WITH INPUT AND ASSISTANCE FROM THE PROJECT
Risks of Retirement Key Findings and Issues. February 2004
 Risks of Retirement Key Findings and Issues February 2004 Introduction and Background An understanding of post-retirement risks is particularly important today in light of the aging society, the volatility
Financial Perspectives on Aging and Retirement Across the Generations
 Financial Perspectives on Aging and Retirement Across the Generations GREENWALD & ASSOCIATES October 2018 Table of Contents Executive Summary 2 Background and Methodology 3 Key Findings 5 Retrospectives
SOA 2009 Risks and Process of Retirement Survey
 SOA 2009 Risks and Process of Retirement Survey The Impact of Retirement Risks on Women WISER Symposium December 2, 2010 Cindy Levering, SOA Committee on Post-Retirement Needs and Risks Agenda Introduction,
Special Report. Retirement Confidence in America: Getting Ready for Tomorrow EBRI EMPLOYEE BENEFIT RESEARCH INSTITUTE. and Issue Brief no.
 December 1994 Jan. Feb. Mar. Retirement Confidence in America: Getting Ready for Tomorrow Apr. May Jun. Jul. Aug. EBRI EMPLOYEE BENEFIT RESEARCH INSTITUTE Special Report and Issue Brief no. 156 Most Americans
Changes in Retirement Handling the Expected and Unexpected
 Changes in Retirement Handling the Expected and Unexpected Presenters: Ruth Helman, Greenwald & Associates Anna M. Rappaport, FSA, MAAA July 1, 2015 Reference Documents Society of Actuaries 2014 Report:
Understanding and Managing the Risks of Retirement Risks and Process of Retirement Survey Report
 Retirement Survey Report Key Findings and Issues: Understanding and Managing the Risks of Retirement 2013 Risks and Process of Retirement Survey Report 1 Introduction and Background For more than 15 years,
Post-Retirement Risks and
 Understanding and Managing Post-Retirement Risks A series of reports presenting highlights from the Society of Actuaries extensive body of research on post-retirement risks and issues. Post-Retirement
Misperceptions and Management of Retirement Risks
 Misperceptions and Management of Retirement Risks FPA of Greater Indiana and CFA Society Indianapolis Joint Meeting September 20, 2013 Presenter: Carol Bogosian, ASA President of CAB Consulting 1 1 Learning
GENDER AND MARITAL STATUS COMPARISONS AMONG WORKERS
 2017 RCS FACT SHEET #5 GENDER AND MARITAL STATUS COMPARISONS AMONG WORKERS Are unmarried men and women equally likely to plan and save for retirement? Do they have similar expectations about their needs
Perceived Helpfulness of Financial Well-being Programs: Results From the 2017 and 2018 Retirement Confidence Surveys
 September 2010 No. 346 August 20, 2018 No. 457 Perceived Helpfulness of Financial Well-being Programs: Results From the 2017 and 2018 Retirement Confidence Surveys By Craig Copeland, Ph.D., Employee Benefit
The 2011 Consumer Financial Literacy Survey Final Report
 The 2011 Consumer Financial Literacy Survey Final Report Prepared For: The National Foundation for Credit Counseling March 2011 Prepared By: Harris Interactive Inc. Public Relations Research 1 Summary
Reflections in the Mirror: Defined contribution plan participants
 Reflections in the Mirror: Defined contribution plan participants offer their perspectives and perceptions around retirement savings 2014 FINDINGS OF NATIONAL PLAN PARTICIPANT SURVEY Non-FDIC Insured May
2018 Retirement Confidence Survey
 2018 Retirement Confidence Survey April 24, 2018 Employee Benefit Research Institute 1100 13 th Street NW, Suite 878 Washington, DC 20005 Phone: (202) 659-0670 Fax: (202) 775-6312 Greenwald & Associates
Women and Retirement. From Need to Opportunity: Engaging this Growing and Powerful Investor Segment
 Women and Retirement From Need to Opportunity: Engaging this Growing and Powerful Investor Segment January 2011 Overview When planning for retirement, the opportunities presented by female clients are
Women and Post-Retirement Risks
 Understanding and Managing Post-Retirement Risks A series of reports presenting highlights from the Society of Actuaries extensive body of research on post-retirement risks and issues. Women and Post-Retirement
Saving and Investing Among High Income African-American and White Americans
 The Ariel Mutual Funds/Charles Schwab & Co., Inc. Black Investor Survey: Saving and Investing Among High Income African-American and Americans June 2002 1 Prepared for Ariel Mutual Funds and Charles Schwab
2016 Retirement Confidence Survey
 2016 Retirement Confidence Survey A Secondary Analysis of the Findings from Respondents Age 50+ Alicia R. Williams, PhD and Eowna Young Harrison, BS AARP Research https://doi.org/10.26419/res.00159.001
2005 Survey of Owners of Non-Qualified Annuity Contracts
 2005 Survey of Owners of Non-Qualified Annuity Contracts Conducted by The Gallup Organization and Mathew Greenwald & Associates for The Committee of Annuity Insurers 2 2005 SURVEY OF OWNERS OF NON-QUALIFIED
2019 Retirement Confidence Survey Summary Report April 23, 2019
 2019 Retirement Confidence Survey Summary Report April 23, 2019 Employee Benefit Research Institute 1100 13 th Street NW, Suite 878 Washington, DC 20005 Phone: (202) 659-0670 Fax: (202) 775-6312 Greenwald
Retirement Survey Report Key Findings and Issues: Spending Patterns and Debt
 Retirement Survey Report Key Findings and Issues: Spending Patterns and Debt ACKNOWLEDGMENTS THIS REPORT WAS PREPARED WITH INPUT AND ASSISTANCE FROM THE PROJECT OVERSIGHT GROUP: Anna Rappaport, Chair Vickie
The Impact of Long-Term Care Costs on Retirement Wealth Needs
 The Impact of Long-Term Care Costs on Retirement Wealth Needs (Selections from Society of Actuaries Monograph: Managing the Impact of Long-Term Care Needs and Expense on Retirement Secturiy: A Holistic
What really matters to women investors
 JANUARY 2014 What really matters to women investors Exploring advisor relationships with and the Silent Generation. INVESTED. TOGETHER. Certainly a great deal has been written about women and investing
Transamerica Small Business Retirement Survey
 Transamerica Small Business Retirement Survey Summary of Findings October 16, 2003 Table of Contents Background and Objectives 3 Methodology 4 Key Findings 2003 8 Key Trends - 1998 to 2003 18 Detailed
17 th Annual Transamerica Retirement Survey Influences of Gender on Retirement Readiness
 1 th Annual Transamerica Retirement Survey Influences of Gender on Retirement Readiness December 2016 TCRS 1335-1216 Transamerica Institute, 2016 Welcome to the 1 th Annual Transamerica Retirement Survey
Prudential Retirement s Fifth Annual Workplace Report on Retirement Planning
 Prudential Retirement s Fifth Annual Workplace Report on Retirement Planning Quantitative research with America s youngest and oldest workers to test attitudes about the new auto-pilot retirement plans.
Minority Workers Remain Confident About Retirement, Despite Lagging Preparations and False Expectations
 Issue Brief No. 306 June 2007 Minority Workers Remain Confident About Retirement, Despite Lagging Preparations and False Expectations by Ruth Helman, Mathew Greenwald & Associates; Jack VanDerhei, Temple
2017 Retirement Confidence Survey
 2017 Retirement Confidence Survey A Secondary Analysis of the Findings from Respondents Age 50+ Alicia R. Williams and S. Kathi Brown AARP Research December 2017 https://doi.org/10.26419/res.00174.001
Shocks and the Unexpected: An Important Factor in Retirement
 Understanding and Managing Post-Retirement Risks A series of reports presenting highlights from the Society of Actuaries extensive body of research on post-retirement risks and issues. Shocks and the Unexpected:
AMERICA AT HOME SURVEY American Attitudes on Homeownership, the Home-Buying Process, and the Impact of Student Loan Debt
 AMERICA AT HOME SURVEY 2017 American Attitudes on Homeownership, the Home-Buying Process, and the Impact of Student Loan Debt 1 Objective and Methodology Objective The purpose of the survey was to understand
Finding the Links Between Retirement, Stress, and Health
 Finding the Links Between Retirement, Stress, and Health LOCKTON RETIREMENT SERVICES One in five workers reports feeling high levels of stress, and the top two drivers for this are economic: their jobs
Gender And Marital Status Comparisons Among Workers
 Page 1 2018 RCS FACT SHEET #5 Gender And Marital Status Comparisons Among Workers Are unmarried men and women equally likely to plan and save for retirement? Do they have similar expectations about their
The 2011 Retirement Confidence Survey: Confidence Drops to Record Lows, Reflecting the New Normal
 March 2011 No. 355 The 2011 Retirement Confidence Survey: Confidence Drops to Record Lows, Reflecting the New Normal By Ruth Helman, Mathew Greenwald & Associates, and Craig Copeland and Jack VanDerhei,
FINANCIAL LITERACY AND RETIREMENT PREPAREDNESS
 PRUDENTIAL INVESTMENTS» MUTUAL FUNDS FINANCIAL LITERACY AND RETIREMENT PREPAREDNESS WHITE PAPER STUDY FINDINGS Key Themes Financial literacy continues to pose a serious challenge to achieving retirement
Arkansas Voters Age 50+ and the 2014 Election. Key Findings from a Survey among Likely Voters Age 50/over Conducted June 2014 for
 Arkansas Voters Age 50+ and the 2014 Election Key Findings from a Survey among Likely Voters Age 50/over Conducted June 2014 for Methodology Statewide telephone survey among 1,200 likely 2014 voters age
Pennsylvania Voters Age 50+ and the 2014 Election. Key Findings from a Survey among Likely Voters Age 50/over Conducted June 2014 for
 Pennsylvania Voters Age 50+ and the 2014 Election Key Findings from a Survey among Likely Voters Age 50/over Conducted June 2014 for Methodology Statewide telephone survey among 800 likely 2014 voters
Understanding consumer attitudes & awareness
 Understanding consumer attitudes & awareness JOHN HANCOCK 2015 LONG-TERM CARE SURVEY RESULTS & INSIGHTS LTC-7100 11/15 For professional use only. Not for use with the public. As more and more Baby Boomers
The Future of Retirement A balancing act. India Report
 The Future of Retirement A balancing act India Report The research The Future of Retirement is a world-leading independent research study into global retirement trends, commissioned by HSBC. The global
MassMutual Women s Retirement Risk Study
 A P R I L 2 0 1 8 July 2018 MassMutual s Retirement Risk Study Background & Methodology Background To better understand the investment preferences and philosophies of women approaching retirement as well
Employee Financial Wellness Survey 2017 results
 www.pwc.com/us/financialeducation results Click on a topic to go directly to that section. About this survey 2 Foreword 3 Financial well-being Defining financial wellness 6 Top financial concerns 7 Impact
The American College Defined Contribution Rollover Survey
 The American College Defined Contribution Rollover Survey January 2016 Table of Contents Methodology 3 Key Findings 5 The Rollover Decision 14 Retirement Financial Planning 33 Investment Management 52
IRA Asset Allocation, 2013, and Longitudinal Results, , p. 10
 September 2015 Vol. 36, No. 9 2015 EBRI/Greenwald & Associates Health and Voluntary Workplace Benefits Survey: Most Workers Continue to Give Low Ratings to Health Care System, but Declining Number Report
10th Annual Transamerica Retirement Survey Full-Time & Part-Time Workers
 10th Annual Transamerica Retirement Survey Full-Time & Part-Time Workers Transamerica Center for Retirement Studies Table of Contents PAGE Objectives 4 Methodology 5 Terminology 6 Profile of Respondents
Boomer Expectations for Retirement. How Attitudes about Retirement Savings and Income Impact Overall Retirement Strategies
 Boomer Expectations for Retirement How Attitudes about Retirement Savings and Income Impact Overall Retirement Strategies April 2011 Overview January 1, 2011 marked a turning point in the retirement industry,
w w w. I C A o r g
 w w w. I C A 2 0 1 4. o r g SOA Post-Retirement Risk Research what it tells about the state and direction of retirement security in the US Presenter: Anna M. Rappaport Anna Rappaport Consulting Agenda
The State of Employee Benefits: Findings From the 2018 Health and Workplace Benefits Survey
 January 10, 2019 No. 470 The State of Employee Benefits: Findings From the 2018 Health and Workplace Benefits Survey By Lisa Greenwald, Greenwald & Associates, and Paul Fronstin, Ph.D., Employee Benefit
Retirement Check-In survey
 Retirement Check-In survey Abstract Baby boomers are a bundle of contradictions when it comes to how they say they feel about their retirement. But while their financial attitudes may shift, the actions
Financial Shocks, Unexpected Expenses and Financial Experiences of Older Americans
 Financial Shocks, Unexpected Expenses and Financial Experiences of Older Americans Anna M. Rappaport Presented at the Living to 100 Symposium Orlando, Fla. January 4 6, 2017 Copyright 2017 by the Society
Scottrade Financial Behavior Study. Scottrade Financial Behavior Study 1
 2016 Scottrade Financial Behavior Study Scottrade Financial Behavior Study 1 Scottrade Financial Behavior Study Scottrade, Inc. commissioned a survey of investors to explore their attitudes and behaviors
SOA Research: Misperceptions and Management of Retirement Risks
 SOA Research: Misperceptions and Management of Retirement Risks Actuaries Clubs of Boston and Hartford & Springfield Joint Meeting November 14, 2013 Presenter: Carol Bogosian, ASA President of CAB Consulting
by Ruth Helman, Mathew Greenwald & Associates; Craig Copeland, EBRI; and Jack VanDerhei, Temple University and EBRI Fellow
 Issue Brief No. 292 April 2006 Will More of Us Be Working Forever? The 2006 Retirement Confidence Survey by Ruth Helman, Mathew Greenwald & Associates; Craig Copeland, EBRI; and Jack VanDerhei, Temple
Executive Summary Retirement Omnibus. Orange House Sweepstakes. Building a solid foundation for a secure retirement
 Executive Summary Retirement Omnibus Orange House Sweepstakes Building a solid foundation for a secure retirement Introduction In support of the Orange House Sweepstakes a national promotion that will
Session 159 PD Retirement Risk Survey & Late-in-Life Survey. Moderator: Anna M. Rappaport, FSA, MAAA
 Session 159 PD - 2017 Retirement Risk Survey & Late-in-Life Survey Moderator: Anna M. Rappaport, FSA, MAAA Presenters: Mathew Greenwald Anna M. Rappaport, FSA, MAAA SOA Antitrust Compliance Guidelines
How Retirement Readiness Varies by Gender and Family Status: A Retirement Savings Shortfall Assessment of Gen Xers
 January 17, 2019 No. 471 How Retirement Readiness Varies by Gender and Family Status: A Retirement Savings Shortfall Assessment of Gen Xers By Jack VanDerhei, Ph.D., Employee Benefit Research Institute
Retirement Savings Challenges for Women
 Military Benefit Association mba@militarybenefit.org Retirement Savings Challenges for Women 11/4/2015 Page 1 of 12, see disclaimer on final page Special Challenges for Women When it comes to saving for
Introduction 1 Key Findings 1 The Survey Retirement landscape 2
 Contents Introduction 1 Key Findings 1 The Survey 1 1. Retirement landscape 2 2. Aspirations and expectations for a changing retirement 2 The UK is ranked in the middle of the AEGON Retirement Readiness
17 th Annual Transamerica Retirement Survey Influences of Generation on Retirement Readiness
 1 th Annual Transamerica Retirement Survey Influences of Generation on Retirement Readiness December 016 TCRS 1-6 Transamerica Institute, 016 Table of Contents Welcome to the 1 th Annual Transamerica Retirement
Impact of the Market Crisis on Retirement Preparedness
 Prudential s Four Pillars of Retirement Series Impact of the Market Crisis on Retirement Preparedness Americans are rebuilding their retirement savings, and considering guarantees to protect their future
SPECIAL CONSIDERATIONS WOMEN FACE IN RETIREMENT SECURITY
 SPECIAL CONSIDERATIONS WOMEN FACE IN RETIREMENT SECURITY 2019 EBRIEFING SERIES FEBRUARY 6, 2019 SPECIAL CONSIDERATIONS WOMEN FACE IN RETIREMENT SECURITY Jack VanDerhei Research Director, EBRI The Cost
Life expectancy: A statistical measure of the average length of life from birth to death.
 STUDENT MODULE 6.2 RETIREMENT PLANNING PAGE 1 Standard 6: The student will explain and evaluate the importance of planning for retirement. Longevity and Retirement Keisha, are you ready for the party?
Florida Hispanic Voters Age 50+ and the 2014 Election
 Florida Hispanic Voters Age 50+ and the 2014 Election Key Findings from a Survey among likely Hispanic voters age 50/over Conducted June-July 2014 for Methodology Statewide telephone survey among 456 Hispanic
Understanding and Achieving Participant Financial Wellness
 Understanding and Achieving Participant Financial Wellness Insights from our research From August 25, 2017 to January 31, 2018, the companies of OneAmerica fielded an online survey to retirement plan participants
Retirement Annuity and Employment-Based Pension Income, Among Individuals Aged 50 and Over: 2006
 Retirement Annuity and Employment-Based Pension Income, Among Individuals d 50 and Over: 2006 by Ken McDonnell, EBRI Introduction This article looks at one slice of the income pie of the older population:
Florida Voters Age 50+ and the 2014 Election. Key Findings from a Survey among Likely Voters Age 50/over Conducted June 2014 for
 Florida Voters Age 50+ and the 2014 Election Key Findings from a Survey among Likely Voters Age 50/over Conducted June 2014 for Methodology Statewide telephone survey among 800 likely 2014 voters age 50/over
Boomers at Midlife. The AARP Life Stage Study. Wave 2
 Boomers at Midlife 2003 The AARP Life Stage Study Wave 2 Boomers at Midlife: The AARP Life Stage Study Wave 2, 2003 Carol Keegan, Ph.D. Project Manager, Knowledge Management, AARP 202-434-6286 Sonya Gross
Marriage and Money. January 2018
 Marriage and Money January 2018 Introduction The broad discussion in many circles about the plight of the non-prime consumer often uses assumptions about how these consumers think, what matters to them,
Ohio Voters Age 50+ and the 2014 Election. Key Findings from a Survey among Likely Voters Age 50/over Conducted June 2014 for
 Ohio Voters Age 50+ and the 2014 Election Key Findings from a Survey among Likely Voters Age 50/over Conducted June 2014 for Methodology Statewide telephone survey among 801 likely 2014 voters age 50/over
M A Y MassMutual Asian American Retirement Risk Study
 M A Y 2018 MassMutual Asian American Retirement Risk Study Background & Methodology Background To better understand the investment preferences and philosophies of those approaching retirement as well as
Segmentation Survey. Results of Quantitative Research
 Segmentation Survey Results of Quantitative Research August 2016 1 Methodology KRC Research conducted a 20-minute online survey of 1,000 adults age 25 and over who are not unemployed or retired. The survey
Determining How Current and Future Social Security Beneficiaries Make Retirement Decisions
 Determining How Current and Future Social Security Beneficiaries Make Retirement Decisions July 2011 Determining How Current and Future Social Security Beneficiaries Make Retirement Decisions Report Prepared
Aging and Retirement. Financial Priorities, Behaviors and Influence on Retirement
 Aging and Retirement Financial Priorities, Behaviors and Influence on Retirement October 2018 2 Whether a Millennial, part of the Generation or somewhere in between, there are financial challenges to be
One Quarter Of Public Reports Having Problems Paying Medical Bills, Majority Have Delayed Care Due To Cost. Relied on home remedies or over thecounter
 PUBLIC OPINION HEALTH SECURITY WATCH June 2012 The May Health Tracking Poll finds that many Americans continue to report problems paying medical bills and are taking specific actions to limit personal
2014 Insurance Barometer Study
 Full Report 2014 Insurance Barometer Study Ashley Durham Senior Research Analyst, Insurance Research (860) 285-7761 adurham@limra.com 2014 Insurance Barometer Study Ashley Durham Senior Research Analyst
Investing As We Age. Key Highlights. Innovative Research Group, Inc. September 26, Prepared for: Toronto Vancouver
 Innovative Research Group, Inc. Toronto Vancouver www.innovativeresearch.ca Key Highlights Investing As We Age September 26, 2017 Prepared for: Investor Office Ontario Securities Commission 20 Queen Street
18 th Annual Transamerica Retirement Survey Influences of Generation on Retirement Readiness. June 2018 TCRS
 th Annual Transamerica Retirement Survey Influences of Generation on Retirement Readiness June 0 TCRS -06 Transamerica Institute, 0 Welcome to the th Annual Transamerica Retirement Survey Welcome to this
LONG ISLAND INDEX SURVEY CLIMATE CHANGE AND ENERGY ISSUES Spring 2008
 LONG ISLAND INDEX SURVEY CLIMATE CHANGE AND ENERGY ISSUES Spring 2008 Pervasive Belief in Climate Change but Fewer See Direct Personal Consequences There is broad agreement among Long Islanders that global
Illinois Voters Age 50+ and the 2014 Election. Key Findings from a Survey among Likely Voters Age 50/over Conducted June 2014 for
 Illinois Voters Age 50+ and the 2014 Election Key Findings from a Survey among Likely Voters Age 50/over Conducted June 2014 for Methodology Statewide telephone survey among 802 likely 2014 voters age
Measuring and Forecasting. Financial Wellness PAGE 1
 Measuring and Forecasting Financial Wellness PAGE 1 What does financial wellness have to do with the weather? In both, the ability to measure, track, and forecast its impact leads people to be better prepared.
INTRODUCTION 1 1. RETIREMENT IN GERMANY 2 2. THE CHANGING NATURE OF RETIREMENT 2 3. THE STATE OF RETIREMENT READINESS 6
 CONTENT INTRODUCTION 1 1. RETIREMENT IN GERMANY 2 2. THE CHANGING NATURE OF RETIREMENT 2 3. THE STATE OF RETIREMENT READINESS 6 4. THE CALL-TO-ACTION: TAKE ACTION, AND DO IT NOW 8 INTRODUCTION AEGON GERMANY
Retired Steelworkers and Their Health Benefits: RESULTS FROM A 2004 SURVEY
 Retired Steelworkers and Their Health Benefits: RESULTS FROM A 2004 SURVEY May 2006 Methodology This chartpack presents findings from a survey of 2,691 retired steelworkers who lost their health benefits
CRS Report for Congress Received through the CRS Web
 Order Code RL33387 CRS Report for Congress Received through the CRS Web Topics in Aging: Income of Americans Age 65 and Older, 1969 to 2004 April 21, 2006 Patrick Purcell Specialist in Social Legislation
North Carolina Voters Age 50+ and the 2014 Election Key Findings from a Survey among Likely Voters Age 50/over Conducted June 2014 for
 North Carolina Voters Age 50+ and the 2014 Election Key Findings from a Survey among Likely Voters Age 50/over Conducted June 2014 for Methodology Statewide telephone survey among 803 likely 2014 voters
The State of Employee Benefits: Findings from the 2017 Health and Workplace Benefits Survey
 April 10, 2018 No. 448 The State of Employee Benefits: Findings from the 2017 Health and Workplace Benefits Survey By Paul Fronstin, Employee Benefit Research Institute, and Lisa Greenwald, Greenwald &
The Hartford partnered with the MIT AgeLab to conduct original research on couples and their financial planning to:
 2 Couples Planning A shared financial planning style is essential for couples today. Research from The Hartford and the MIT AgeLab shows that couples who use a division of labor approach to handle financial
Measuring and Predicting. Financial Wellness. Do your employees have their financial houses in order? PAGE 1
 Measuring and Predicting Financial Wellness Do your employees have their financial houses in order? PAGE 1 We believe being financially well is about more than just dollars and cents. It s also about how
2013 Workplace Benefits Report
 RETIREMENT & BENEFIT PLAN SERVICES WORKPLACE INSIGHTS TM 2013 Workplace Benefits Report Employees Views on Achieving Financial Wellness 2 2013 WORKPLACE BENEFITS REPORT Empowering Employees to Improve
Investing As We Age. Innovative Research Group, Inc. Toronto Vancouver
 Prepared by: Innovative Research Group, Inc. Toronto Vancouver www.innovativeresearch.ca Investing As We Age Prepared for: Investor Office Ontario Securities Commission 20 ueen Street West, 22nd loor Toronto,
MUST BE 35 TO 64 TO QUALIFY. ALL OTHERS TERMINATE. COUNTER QUOTA FOR AGE GROUPS.
 2016 Puerto Rico Survey Retirement Security & Financial Resilience Labor Force Participants (working or looking for work) age 35 to 64 and current Retirees Total sample n=800, max Retirees (may be current
PPI ALERT November 2011
 PPI ALERT November 2011 50+ and Worried about Today and Tomorrow Older Americans Express Concerns about the State of the Economy and their Current and Future Financial Well-being In late August, 2011,
INTRODUCTION AEGON GERMANY REPRESENTATIVE 1 1. RETIREMENT IN GERMANY 2 2. THE CHANGING NATURE OF RETIREMENT 2 3. THE STATE OF RETIREMENT READINESS 6
 CONTENT INTRODUCTION AEGON GERMANY REPRESENTATIVE 1 1. RETIREMENT IN GERMANY 2 2. THE CHANGING NATURE OF RETIREMENT 2 3. THE STATE OF RETIREMENT READINESS 6 4. THE CALL-TO-ACTION: TAKE ACTION, AND DO IT
INTRODUCTION. Sincerely, Beth Finkel State Director, AARP New York
 INTRODUCTION This year Generation X turned 50! AARP New York is the state s leading advocate for the 50-plus with over 2.5 million members, including 750,000 in New York City. We believe now is the time
Committee on Small Business United States Senate. Hearing on. Small Business and Health Insurance. Testimony Submitted by
 T - 137 Committee on Small Business United States Senate Hearing on Small Business and Health Insurance Testimony Submitted by Paul Fronstin Employee Benefit Research Institute Washington, DC Feb. 5, 2003
Actuaries Respond to an Aging Society
 ANNA RAPPAPORT CONSULTING STRATEGIES FOR A SECURE RETIREMENT SM Actuaries Respond to an Aging Society Chicago Actuarial Association Meeting November 14, 2007 Today s Presentation Helps us think about the
Older Homeowners: Accessing Home Equity in Retirement
 Older : Accessing Home Equity in Retirement National Housing Survey Topic Analysis Q2 2016 2016 Fannie Mae. Trademarks of Fannie Mae. 1 Research Methodology: Q2 2016 Each month, beginning in June, 2010,
Michigan Voters Age 50+ and the 2014 Election. Key Findings from a Survey among Likely Voters Age 50/over Conducted June 2014 for
 Michigan Voters Age 50+ and the 2014 Election Key Findings from a Survey among Likely Voters Age 50/over Conducted June 2014 for Methodology Statewide telephone survey among 801 likely 2014 voters age
The Allianz American Legacies Pulse Survey
 The Allianz American Legacies Pulse Survey Exploring the impact of the financial crisis on legacy strategies Allianz Life Insurance Company of North America Allianz Life Insurance Company of New York ENT-1371-N
Planning for Income to Last
 Planning for Income to Last Retirement Income Planning Not FDIC Insured May Lose Value No Bank Guarantee This guide explains why you should consider developing a retirement income plan. It also discusses
Your Guide to Life Insurance for Families
 Your Guide to Life Insurance for Families (800) 827-9990 HealthMarkets.com Your Guide to Life Insurance for Families Contents Does My Family Need Life Insurance? 4 Types of Life Insurance for Families
FINANCIAL WELLNESS: A PRIORITY FOR FINANCIAL SERVICES. January 18, 2018
 FINANCIAL WELLNESS: A PRIORITY FOR FINANCIAL SERVICES January 18, 2018 Boston Research Technologies conducted an online survey with a national sample of 1,242 employees who responded between September