Provide bulk water and sanitation services to improve quality of life and enhance sustainable economic development
|
|
|
- Noreen McCarthy
- 6 years ago
- Views:
Transcription


1 Provide bulk water and sanitation services to improve quality of life and enhance sustainable economic development
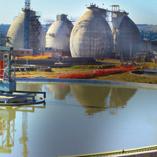
2 IMVUTSHANE DAM
3 8.0 PG PERFORMANCE AGAINST SHAREHOLDER COMPACT 9.0 PG CREATING VALUE 10.0 PG CONSERVING OUR NATURAL RESOURCES 11.0 PG ENABLING OUR PEOPLE 12.0 PG IMPROVING RESILIENCY 13.0 PG FINANCIAL SUSTAINABILITY 14.0 PG GRI CONTENT INDEX ANNUAL 1 Umgeni Water in numbers An efficient, innovative and responsible organisation on the move 410 million cubic metres of potable water per annum (1 123 Ml/d) provided to 6 customers 33 million cubic metres (90 Ml/d) of wastewater treated in R Umgeni Water million total CAPEX Spend (Parent), of which R503 million went towards projects for rural development Group employees 72% of target water infrastructure project milestones were met Financial Viability Umgeni Water maintained positive results in the year due to continued sound financial management: Revenue (Group) generated was R2.5 billion In 2017 Surplus for the year (Group) was R746 MILLION In 2017 Balance sheet reserves were R6.8 billion In 2017


4 2 ANNUAL 1.0 PG PG 9-17 ORGANISATIONAL 3.0 PG MINISTER S FOREWORD 4.0 PG ACCOUNTING AUTHORITY S 5.0 PG CHIEF EXECUTIVE S 6.0 PG CORPORATE GOVERNANCE 7.0 PG STAKEHOLDER UNDERSTANDING AND SUPPORT Vision Leading water utility that enhances value in the provision of bulk water and sanitation services. We strive to be an effectively run, public-oriented and socially accountable water utility, which has its heart and mind, focused on the provision of bulk water services. We will achieve leadership based on our performance and the sustainable value we co-create with our customers and stakeholders and continue to leave a positive legacy in our communities, region and country. Mission Provide innovative, sustainable, effective and affordable bulk water and sanitation services. Our business is the provision of bulk water services both potable and wastewater - to support government service delivery to the people of South Africa and providing water for life. This includes providing all bulk water services to our customers, facilitating integrated planning in the region, supporting municipalities and contributing to water knowledge that will lead to sustainability from source-tap-source. Strategic Intent Key Partner that enables government to deliver effective and efficient bulk water and sanitation services. Umgeni Water intends to be recognised as a strategic and sustainable partner of government, co-creating value through providing bulk water and sanitation services as a catalyst for local economic development and government s developmental agenda. Benevolent Intent Provide bulk water and sanitation services to improve quality of life and enhance sustainable economic development. Umgeni Water intends to be recognised as an organisation that has legitimate leadership and cultivates accountability. Through this people-centred approach Umgeni Water will achieve water services delivery. Bulk water services will be provided for both health and economic benefits, which contribute to addressing poverty, under-development and inequality. PLEASE RECYCLE This Annual Report is printed on Hi-Q Matte. Hi-Q Matte is manufactured in accordance with the most stringent environmental protection and sustainable forest development standards.


5 8.0 PG PERFORMANCE AGAINST SHAREHOLDER COMPACT 9.0 PG CREATING VALUE 10.0 PG CONSERVING OUR NATURAL RESOURCES 11.0 PG ENABLING OUR PEOPLE 12.0 PG IMPROVING RESILIENCY 13.0 PG FINANCIAL SUSTAINABILITY 14.0 PG GRI CONTENT INDEX 3 ANNUAL Umgeni Water Operational Area Newcastle WSA Volksrust Amajuba WSA Newcastle KwaZulu-Natal Vryheid Pongola umkhanyakude WSA Zululand WSA Glencoe Dundee umzinyathi WSA Ulundi uthukela WSA Ladysmith King Cetshwayo WSA Melmoth Empangeni umhlathuze WSA Richards Bay Eshowe umhlathuze Estcourt Greytown Mandeni amatigulu umgungundlovu WSA Howick ilembe WSA umvoti uthukela Msunduzi WSA Pietermaritzburg ethekwini WSA Tongaat umdloti Harry Gwala WSA Richmond Durban umlazi umgeni Ixopo Scottburgh Umzinto ilovu umkhomazi umzimayi Indian Ocean Kokstad Harding Port Shepstone Ugu WSA umzimkhulu Margate umthwalume umzumbe N Kilometres umtamvuna Figure 1: Umgeni Water Operational Area


6 4 ANNUAL 1.0 PG PG 9-17 ORGANISATIONAL 3.0 PG MINISTER S FOREWORD 4.0 PG ACCOUNTING AUTHORITY S 5.0 PG CHIEF EXECUTIVE S 6.0 PG CORPORATE GOVERNANCE 7.0 PG STAKEHOLDER UNDERSTANDING AND SUPPORT Contents 1.0 Report Profile Organisational Profile 9 Minister s Foreword Accounting Authority s 4.0 Report Chief Executive s 6.0 Report 26 Corporate Governance 35 Stakeholder Understanding and Support Performance against Umgeni Water Strategy and Shareholder Compact Indicators


 80 11.0 Enabling our People 95 12.")

7 8.0 PG PERFORMANCE AGAINST SHAREHOLDER COMPACT 9.0 PG CREATING VALUE 10.0 PG CONSERVING OUR NATURAL RESOURCES 11.0 PG ENABLING OUR PEOPLE 12.0 PG IMPROVING RESILIENCY 13.0 PG FINANCIAL SUSTAINABILITY 14.0 PG GRI CONTENT INDEX 5 ANNUAL 9.0 Creating Value 65 Product Quality 65 Customer Satisfaction 68 Infrastructure Stability 72 Economic Empowerment Conserving our Natural Resources 83 Environmental Sustainability including Water Resources Adequacy 83 Community Outreach and Corporate Social Investment (CSI) Enabling our People Leadership and Employee Development 95 Improving Resiliency 105 Operational Optimisation 105 Risk Management Financial Sustainability 113 Financial Review Global Reporting Initiative (GRI) Content Index 199 Statement of Accounting Authority Responsibilities and Approval of the Financial Statements 128 Report of the Audit Committee 129 Report of the Auditor-General 130 Accounting Authority Report 135 Remuneration Report 139 Financial Statements 141 Notes to Financial Statements 145


8 6 ANNUAL 1.0 PG PG 9-17 ORGANISATIONAL 3.0 PG MINISTER S FOREWORD 4.0 PG ACCOUNTING AUTHORITY S 5.0 PG CHIEF EXECUTIVE S 6.0 PG CORPORATE GOVERNANCE 7.0 PG STAKEHOLDER UNDERSTANDING AND SUPPORT R857 million spent on maintenance over the past five years AMANZIMTOTI WTW
9 8.0 PG PERFORMANCE AGAINST SHAREHOLDER COMPACT 9.0 PG CREATING VALUE 10.0 PG CONSERVING OUR NATURAL RESOURCES 11.0 PG ENABLING OUR PEOPLE 12.0 PG IMPROVING RESILIENCY 13.0 PG FINANCIAL SUSTAINABILITY 14.0 PG GRI CONTENT INDEX 7 ANNUAL 1.0 Report Profile Umgeni Water s annual report complies with statutory disclosure requirements of the Public Finance Management Act (Act 1 of 1999) and Water Services Act (Act 108 of 1997), as well as relevant regulations. In addition, Umgeni Water s Annual Report is significantly aligned to the requirements of King III regarding integrated reporting. Integration is achieved through the entity having in place an integrated strategy and value creation model based on the balanced scorecard that straddles four sustainability perspectives, together with Umgeni Water ensuring complete alignment with government s outcomes approach for performance reporting by State-Owned Entities (SOEs). report further contains the audited financial statements for. Over the years, Umgeni Water developed and embedded in-house processes for identifying, collecting, collating, validating and storing information used in managing its performance and continues to enhance these. The assurance of the Annual Report for both financial and performance information is provided by Internal Audit and the Audit Committee of the Board. In addition, as a state-owned entity, Umgeni Water is audited by the Auditor-General of South Africa for both financial and performance information. This report further contains Standard Disclosures that are in accordance with the GRI Guidelines fulfilling the GRI Comprehensive criteria. Information is included in the GRI Content Index at the end of this report. Umgeni Water has prepared annual reports every year since its establishment in This report covers the twelve-month period 1 July 2016 to 30 June This report also includes information on Umgeni Water subsidiaries. The performance content of this Annual Report shows Umgeni Water s progress with meeting predetermined objectives and performance indicators as per its approved Corporate Plan and Shareholder Compact and contains an audited performance scorecard for. The financial content of the annual Further information on the scope covered by Internal and External Auditors is provided in the Corporate Governance chapter of this report. In addition to assurance via these routes, core business processes, namely water treatment works operations, monitoring programmes and analytical laboratories are externally certified or accredited in accordance with relevant ISO and other nationally recognised standards. The annual report content is structured to provide sufficient information to all stakeholders including, customers, regulatory bodies, investors, employees and civil society, regarding Umgeni Water s annual performance and on-going progress towards sustainable development. Specific stakeholder information is contained in the Stakeholder Understanding and Support chapter of this report. +27 (33) (33) 341 ADDITIONAL INFORMATION CONCERNING ALL ASPECTS OF THE AND ITS CONTENTS CAN BE OBTAINED FROM: Umgeni Water PO Box 9, Pietermaritzburg, 3200 or at the entity s head office, 310 Burger Street, Pietermaritzburg, 3201 info@umgeni.co.za


10 8 ANNUAL 1.0 PG PG 9-17 ORGANISATIONAL 3.0 PG MINISTER S FOREWORD 4.0 PG ACCOUNTING AUTHORITY S 5.0 PG CHIEF EXECUTIVE S 6.0 PG CORPORATE GOVERNANCE 7.0 PG STAKEHOLDER UNDERSTANDING AND SUPPORT 72% of target water infrastructure project milestones were met LOWER THUKELA BWSS
11 8.0 PG PERFORMANCE AGAINST SHAREHOLDER COMPACT 9.0 PG CREATING VALUE 10.0 PG CONSERVING OUR NATURAL RESOURCES 11.0 PG ENABLING OUR PEOPLE 12.0 PG IMPROVING RESILIENCY 13.0 PG FINANCIAL SUSTAINABILITY 14.0 PG GRI CONTENT INDEX 9 ANNUAL 2.0 Organisational Profile 2.1 Legislative Mandate Umgeni Water is a state-owned entity (SOE) established in 1974 to provide water services - water supply and sanitation services - to other water services institutions in its service area. The entity operates in accordance with the Water Services Act (Act 108 of 1997) and the Public Finance Management Act (Act 1 of 1999), amongst others, and is categorised as a National Government Business Enterprise. Umgeni Water reports directly to the Department of Water and Sanitation (DWS), through the Board (Accounting Authority) and through its functionaries, the Chairman of the Board and the Chief Executive. The Minister of Water and Sanitation is the Executive Authority for water boards. 2.2 Activities of Umgeni Water The primary activities of Umgeni Water, as pronounced in section 29 of the Water Services Act, is to provide water services (water supply and sanitation services) to other water services institutions in its service area. In addition, section 30 of the Water Services Act, enables Umgeni Water to undertake other activities, provided these do not impact negatively on the entity s ability to perform its primary activity. These include: > Providing management services, training and other support services to other water services institutions, in order to promote co-operation in the provision of water services; > Supplying untreated or non-potable water to end-users who do not use the water for household purposes; > Providing catchment management services to or on behalf of the responsible authority; > With the approval of the water services authority having jurisdiction in the area, supplying water directly for industrial use, accepting industrial effluent and acting as a water services provider to consumers; > Providing water services in joint venture with water services authorities; and > Performing water conservation functions. 2.3 Supply Area and Customers (map on page 3) KwaZulu-Natal is the gazetted supply area of Umgeni Water and Mhlathuze Water and straddles a total geographical area of km 2, which is home to 11.1 million people and 2.9 million households. The KwaZulu-Natal Province comprises one (1) Metropolitan Municipality, ten (10) District Municipalities and forty-three (43) Local Municipalities. Fourteen (14) of these municipalities are Water Services Authorities as defined in the Water Services Act. The Executive Authority has initiated a process that will culminate in the establishment of a single Water Board for KwaZulu-Natal. The proposal is to amalgamate the areas served by both Umgeni Water and Mhlathuze Water into one regional water utility for KwaZulu-Natal. The process of service expansion to municipalities in KwaZulu-Natal is expected to follow timeframes proposed by the Executive Authority. At the moment Umgeni Water focuses service delivery and largely derives its revenue from the following six (6) customers: > ethekwini Metropolitan Municipality > ilembe District Municipality > Ugu District Municipality > Harry Gwala District Municipality > umgungundlovu District Municipality > Msunduzi Local Municipality


 from these customers.")
12 10 ANNUAL 1.0 PG PG 9-17 ORGANISATIONAL 3.0 PG MINISTER S FOREWORD 4.0 PG ACCOUNTING AUTHORITY S 5.0 PG CHIEF EXECUTIVE S 6.0 PG CORPORATE GOVERNANCE 7.0 PG STAKEHOLDER UNDERSTANDING AND SUPPORT These customers, located in an area spanning approximately square kilometres and a population of 6.7 million people (1.9 million households), are provided with a total of 410 million cubic metres of potable water per annum (1 123 Ml/d). In addition, the entity treats bulk wastewater totalling 33 million cubic metres per annum (90 Ml/d) from these customers. Umgeni Water s infrastructure assets in support of its bulk water services business comprise: > Approximately km of pipelines and sixty-seven (67) km of tunnels; > Fourteen (14) impoundments; > Seventeen (17) water treatment works; and > Nine (9) wastewater treatment works. MZINTO WTW
13 8.0 PG PERFORMANCE AGAINST SHAREHOLDER COMPACT 9.0 PG CREATING VALUE 10.0 PG CONSERVING OUR NATURAL RESOURCES 11.0 PG ENABLING OUR PEOPLE 12.0 PG IMPROVING RESILIENCY 13.0 PG FINANCIAL SUSTAINABILITY 14.0 PG GRI CONTENT INDEX 11 ANNUAL 2.4 Structure of Umgeni Water MINISTER OF WATER AND SANITATION Umgeni Water Parent UMGENI WATER GROUP Umgeni Water Subsidiaries Umgeni Water Board Msinsi Holdings SOC Ltd. (100%) Chief Executive and Executive Committee Umgeni Water Services SOC Ltd. (100%) Msinsi Board Durban Water Recycling (Pty) Ltd. (18.5%)

14 12 ANNUAL 1.0 PG PG 9-17 ORGANISATIONAL 3.0 PG MINISTER S FOREWORD 4.0 PG ACCOUNTING AUTHORITY S 5.0 PG CHIEF EXECUTIVE S 6.0 PG CORPORATE GOVERNANCE 7.0 PG STAKEHOLDER UNDERSTANDING AND SUPPORT The Umgeni Water Group comprises a parent, which is the dominant entity, and further has two small subsidiaries. The Executive Committee is the top management structure of Umgeni Water Parent and comprises a Chief Executive and four General Managers, namely for Operations, Engineering and Scientific Services, Finance and Corporate Services. The Chief Executive guides the day-to-day activities of the entity with powers delegated to him by the Board. The non-executive Board is the Accounting Authority and provides strategic leadership to the Executive. The Board is appointed by the Minister of Water and Sanitation. The term of office of the Board expired at the end of June 2017 and the process of appointing a new Board has commenced. i has a total balance-sheet asset value of R10.2 billion of which reserves total R6.83 billion. 2.5 Umgeni Water Strategy Umgeni Water s strategy comprises four (4) goals and ten (10) long-term sustainability outcomes. The strategy map succinctly illustrates the manner in which sustainable value is created through integrating nine (9) strategic objectives through four (4) balanced scorecard perspectives in support of the mission and mandate. Strategic Goal 1: Develop strategic partnerships, increase support to customers, improve visibility and be a regional leader in the provision of bulk water and sanitation services. With respect to the subsidiaries, Umgeni Water has 100% shareholding in Msinsi Holdings SOC Ltd. and Umgeni Water Services SOC Ltd. The latter holds an 18.5% investment in Durban Water Recycling (Pty) Ltd. The Umgeni Water Group has a head count of employees (996 permanent and 154 fixed-term contracts). In, Umgeni Water Group income was R2.51 billion and the net surplus generated was R746 million. Umgeni Water Strategic Goal 2: Expand and improve funding collaborations whilst managing key cost drivers. Strategic Goal 3: Remove system constraints and blockages through innovative thinking and improve efficiency of all inputs. Strategic Goal 4: Strengthen and develop quality human resources, infrastructure capacity and water resources sustainability to support growth. i Subsequent to the approval of the annual report, the Minister communicated her decision to appoint an Interim Board effective from 28 September AMANZIMTOTI WTW
15 8.0 PG PERFORMANCE AGAINST SHAREHOLDER COMPACT 9.0 PG CREATING VALUE 10.0 PG CONSERVING OUR NATURAL RESOURCES 11.0 PG ENABLING OUR PEOPLE 12.0 PG IMPROVING RESILIENCY 13.0 PG FINANCIAL SUSTAINABILITY 14.0 PG GRI CONTENT INDEX 13 ANNUAL 2.6 Strategy Map VISION Leading water utility that enhances value in the provision of bulk water and sanitation services. Deliver on our mandate MISSION Provide innovative, sustainable, effective and affordable bulk water and sanitation services. STRATEGIC INTENT Key Partner that enables government to deliver effective and efficient bulk water and sanitation services. BENEVOLENT INTENT Provide bulk water and sanitation services to improve quality of life and enhance sustainable economic development. CUSTOMER AND STAKEHOLDER PERSPECTIVE > SO 1: Increase services and customers > SO 2: Increase customer and stakeholder value Co-create value with our customers and stakeholders. FINANCIAL PERSPECTIVE > SO 3: Increase mobilisation of funds > SO 4: Increase financial sustainability > SO 5: Improve financial ratios Maintain and leverage our solid financial assets. PROCESS PERSPECTIVE > SO 6: Improve service delivery systems Create effective and resilient enterprise architecture - our processes, systems and technologies. ORGANISATIONAL CAPACITY PERSPECTIVE > SO 7: Improve and increase infrastructure assets > SO 8: Increase water resources sustainability > SO 9: Increase skills and competency We will enable our people, secure water resources and ensure infrastructure capacity.
16 14 ANNUAL 1.0 PG PG 9-17 ORGANISATIONAL 3.0 PG MINISTER S FOREWORD 4.0 PG ACCOUNTING AUTHORITY S 5.0 PG CHIEF EXECUTIVE S 6.0 PG CORPORATE GOVERNANCE 7.0 PG STAKEHOLDER UNDERSTANDING AND SUPPORT 2.7 Ten Outcomes for Sustainable Value Creation Umgeni Water s integrated strategy targets ten (10) outcomes: 1 Product Quality (water and wastewater): is achieved when Umgeni Water produces potable water and wastewater in full compliance with statutory and reliability requirements and consistent with customer and environmental needs. 2 Customer Satisfaction: is achieved when Umgeni Water provides reliable, responsive, and affordable services in line with explicit, customer-agreed service levels and receives timely customer feedback to maintain responsiveness to customer needs and emergencies. 3 Stakeholder Understanding and Support: is attained when Umgeni Water engenders understanding and support from statutory, contracted and non-contracted bodies for service levels, tariff structures, operating budgets, capital improvement programmes, risk management decisions, and water resources adequacy. 4 Community and Environmental Sustainability: is achieved when Umgeni Water is explicitly cognisant of and attentive to the impact it has on current and future community sustainability, supports socio-economic development, and manages its operations, infrastructure, and investments to protect, restore, and enhance the natural environment, whilst using energy and other natural resources efficiently. 5 Financial Viability: is achieved when Umgeni Water understands the organisational life-cycle costs and maintains a balance between debt and assets, while managing operating expenditures and increasing revenues. In addition, the organisation aims at a sustainable tariff that is consistent with customer expectations, recovers costs and provides for future expansion.


17 8.0 PG PERFORMANCE AGAINST SHAREHOLDER COMPACT 9.0 PG CREATING VALUE 10.0 PG CONSERVING OUR NATURAL RESOURCES 11.0 PG ENABLING OUR PEOPLE 12.0 PG IMPROVING RESILIENCY 13.0 PG FINANCIAL SUSTAINABILITY 14.0 PG GRI CONTENT INDEX 15 ANNUAL 6 Operational Optimisation: is achieved when Umgeni Water has on-going, timely, costeffective, reliable, and sustainable performance improvements in all facets of its operations, minimises resource use, loss, and impacts from day-to-day operations and maintains awareness of information and operational technology developments to anticipate and support timely adoption of improvements. 7 Operational Resiliency: is achieved when Umgeni Water's leadership and staff work together to anticipate and avoid problems and proactively identify, assess, and establish tolerance levels for, and proactively and effectively manages, a full range of business risks, consistent with industry trends and system reliability goals. 8 Infrastructure Stability: is achieved when Umgeni Water understands the conditions and costs associated with critical infrastructure assets and maintains and enhances the condition of all assets over the long-term. This is done at the lowest possible life-cycle cost and acceptable risk levels, is consistent with customer service and statutory-supported service levels, and consistent with anticipated growth and system reliability goals. The organisation further assures that asset repair, rehabilitation, and replacement efforts are coordinated to minimise disruptions and other negative consequences. 9 Water Resources Adequacy: is achieved when Umgeni Water assesses the scarcity of freshwater resources, investigates sustainable alternatives, manages water abstractions assiduously and has access to stable raw water resources to meet current and future customer needs. 10 Leadership and Employee Development: is achieved when Umgeni Water is a participatory, collaborative organisation dedicated to continual learning and improvement; recruits and retains a workforce that is competent, motivated, adaptive and works safely; ensures institutional knowledge is retained and improved; provides opportunities for professional and leadership development; and creates an integrated and well-coordinated senior leadership team.

18 16 ANNUAL 1.0 PG PG 9-17 ORGANISATIONAL 3.0 PG MINISTER S FOREWORD 4.0 PG ACCOUNTING AUTHORITY S 5.0 PG CHIEF EXECUTIVE S 6.0 PG CORPORATE GOVERNANCE 7.0 PG STAKEHOLDER UNDERSTANDING AND SUPPORT 2.8 Strategic Statements of Umgeni Water and its Functional Divisions Umgeni Water Strategic Statement: We will lead the process of providing solutions via an innovative, vigorous growth path, to increase sustainable water supply, in order to satisfy the developmental water services requirements in our region, which contribute to government objectives. Board Strategic Statement: We will consider internal and external factors, consult with stakeholders, develop a strategy, authorise implementation, manage resources, manage risks and oversee implementation, to produce a valid and approved strategic plan, deliver on strategic objectives and provide sound corporate governance, to achieve our vision and mission, in order to contribute towards government objectives. Chief Executive Office: We will position and lead the organisation, plan activities and allocate resources, implement strategy, manage risk, champion corporate governance and partner with stakeholders to deliver organisational objectives and achieve a well governed, vibrant, committed, sector-relevant and engaged organisation that delivers on its mandate. Operations: We will position ourselves, plan, structure, mobilise resources, source, specify, operate and maintain our infrastructure, abstract, treat, sell, distribute, monitor, conserve and re-use water, to deliver quality, effective, affordable water services to our stakeholders, which will deliver on organisational objectives.

19 8.0 PG PERFORMANCE AGAINST SHAREHOLDER COMPACT 9.0 PG CREATING VALUE 10.0 PG CONSERVING OUR NATURAL RESOURCES 11.0 PG ENABLING OUR PEOPLE 12.0 PG IMPROVING RESILIENCY 13.0 PG FINANCIAL SUSTAINABILITY 14.0 PG GRI CONTENT INDEX 17 ANNUAL Engineering and Scientific Services: We understand water demand, resources and technology to implement infrastructure, manage water quality, optimise treatment processes and drive social and environmental initiatives to provide innovative and optimal engineering and scientific solutions, to achieve sustainability and public health, in order to meet organisational objectives. Finance: We will plan, mobilise, account for and report on resources, manage financial risk, proactively implement procurement strategies, and maintain internal control and systems, which result in funding, control, efficient, effective and economical supply of requisites, support and monitoring of the business, to deliver sound financial management and corporate governance, to contribute towards organisational objectives. Corporate Services: We will provide a specialised, diverse and essential enabling service through the provision of holistic human capital management, property and security management, management of information, communication and technology systems, computing infrastructure, and legal services to enhance organisational service delivery capacity.

20 18 ANNUAL 1.0 PG PG 9-17 ORGANISATIONAL 3.0 PG MINISTER S FOREWORD 4.0 PG ACCOUNTING AUTHORITY S 5.0 PG CHIEF EXECUTIVE S 6.0 PG CORPORATE GOVERNANCE 7.0 PG STAKEHOLDER UNDERSTANDING AND SUPPORT 3.0 Minister s Foreword Umgeni Water as an entity remains well positioned and maintains a solid track record in responding to its mandate. NOMVULA MOKONYANE MINISTER OF WATER AND SANITATION It gives me great pleasure to write this foreword to Umgeni Water s Annual Report. During this reporting period, the Department s policy and plan developments, which further inform Umgeni Water s strategy and implementation plans, continue to be guided by the National Development Plan (NDP), the Medium Term Strategic Framework (MTSF) and the National Water Resources Strategy (NWRS), amongst other key national documents. In response to some of the challenges experienced over the medium-term period, review of certain key pieces of water legislation commenced and is on-going. This review is to ensure that there is equitable and sustainable water and sanitation access to support socio-economic growth and sustainable development for current and future generations. The legislation being reviewed includes the National Water Act, which provides a legal framework for the progressive realisation of the right to access to sufficient water, ensures that there is equity in the allocation of water, ensures there is water resources management and that water regulation is streamlined. This is interconnected with review of the Water Services Act being reviewed to improve the provisions for water services and ensure alignment with the provisions of the Municipal Systems and Municipal Finance Management acts. Governing mandates of Water Boards, such as Umgeni Water, will be enhanced as a result of this review, notably with respect to performing regional functions. In keeping with the fundamental priorities of providing clean water and decent sanitation to all, the Department remains focused on intensifying its work to review water sector institutions as directed by the National Development Plan. This includes the realignment of water boards in the various provinces to expand the sector skills base and streamline
21 8.0 PG PERFORMANCE AGAINST SHAREHOLDER COMPACT 9.0 PG CREATING VALUE 10.0 PG CONSERVING OUR NATURAL RESOURCES 11.0 PG ENABLING OUR PEOPLE 12.0 PG IMPROVING RESILIENCY 13.0 PG FINANCIAL SUSTAINABILITY 14.0 PG GRI CONTENT INDEX 19 ANNUAL delivery of water and sanitation services. In KwaZulu-Natal, the water board rationalisation is planned to increase effectiveness of the Umgeni Water, uthukela Water and Mhlathuze Water collective in the provision of regional bulk water services. The realignment is anticipated to manifest as rationalisation of systems to achieve better economies of scale, increase water access to un-serviced rural areas, facilitate differential service delivery levels and tariff modelling across the entire province, enhance market capital sourcing for infrastructure projects for KwaZulu-Natal as a whole, enable more leveraged cross-subsidisation and overall greater regional viability. This process is on-going and hopes to gain traction over the next financial year to reposition the entities to deliver services as a capable state. The Department and water board entities are responsible for the delivery of bulk water services to municipalities, which in turn have been mandated by legislation to reticulate and deliver basic services to communities. This model continued to experience challenges in the past year. Where bulk services have been delivered, more often than not, municipalities have either failed to adequately invest in reticulation infrastructure and/or failed to optimally operate and maintain such infrastructure. In response, the Department proposed collaborative and structured interventions in support of target municipalities, including with departments such as Cooperative Governance and Traditional Affairs. This effort, which is on-going, was able to guarantee some sustainable water supply and decent sanitation delivery to people living within the priority District Municipalities identified in the Back-2-Basics programme. debt-recovery measure, as water is a critical and essential service. Emphasis is therefore placed on an inter-governmental process that guarantees that those that owe the Department and its entities, service their debt obligations accordingly. Despite experiencing challenges with late payment from some small customers, Umgeni Water is to be commended on the impressive manner in which it managed its debt collection processes and its overall business to maintain balance-sheet strength during this reporting period. As further evidenced by the quality of water delivered to municipalities and progress made with bulk water infrastructure developments, for both economic growth and increasing access to rural areas, Umgeni Water as an entity remains well positioned and maintains a solid track record in responding to its mandate. Umgeni Water is to be commended on the impressive manner in which it managed its debt collection processes and its overall business to maintain balance-sheet strength during this reporting period. As further evidenced by the quality of water delivered to municipalities and progress made with bulk water infrastructure developments. The Department has made noticeable progress with revision of the water pricing strategy and the norms and standards for tariff setting. These two documents are in the process of obtaining concurrence with the Minister of Finance prior to the final gazetting for implementation. The review of the Water Pricing Strategy seeks to improve the financial viability of the country s bulk raw water resource supplies to ensure that this scarce resource is valued by all citizens. Currently, prices are below full cost for most agricultural water schemes and some schemes dedicated to industrial and domestic supply. Valuing water correctly plays a prominent and important role in meeting service delivery obligations in a sustainable manner. Outstanding water debts in South Africa owed by municipalities to water boards - remain excessively high and threaten the delivery of services. The Department and water board entities unfortunately cannot punitively switch off water supply as a The Regional Bulk Infrastructure Grant aims to develop new, refurbish, upgrade and replace ageing infrastructure that connects water resources to infrastructure serving extensive areas across municipal boundaries. The Grant is appropriated to water boards for the implementation of Bulk Projects across the provinces to address infrastructure challenges. Umgeni Water is a beneficiary of this appropriation mainly for the Lower Thukela Regional Bulk Water Scheme, the construction of which was significantly advanced during this reporting period. This is a key Regional Bulk Water Supply Scheme in support of water security in the North Coast of Durban. Umgeni Water will complete this by December 2017 and will thereby assure additional water supply to the coastal and inland areas of KwaDukuza Local Municipality, northern parts of Durban and later to Mandeni Local Municipality.
22 20 ANNUAL 1.0 PG PG 9-17 ORGANISATIONAL 3.0 PG MINISTER S FOREWORD 4.0 PG ACCOUNTING AUTHORITY S 5.0 PG CHIEF EXECUTIVE S 6.0 PG CORPORATE GOVERNANCE 7.0 PG STAKEHOLDER UNDERSTANDING AND SUPPORT Other key water projects being implemented by Umgeni Water, relevant to this reporting period, include: the construction of the Mshwathi Bulk Water Supply Scheme, construction of the Greater Mpofana Regional Scheme Phase 1, the design of the Impendle Bulk Water Supply Project, planning of the Maphumulo Bulk Water Supply Project Phase 3, and construction of the Midmar Raw Water Pipeline Augmentation and Midmar Water Treatment Works Upgrade. A devastating drought plagued South Africa over the past three years, reported to be the worst in 100 years and KwaZulu-Natal was not spared. The response to the drought has been commendable. Umgeni Water rose to the occasion with emergency interventions including construction of emergency infrastructure to facilitate inter-catchment transfers, rehabilitation and drilling of boreholes and refurbishment of infrastructure (on behalf of under resourced District Municipalities in the Province) all of which have had a significant impact on mitigating the drought impact. Municipalities in the region were equally cooperative in implementing water restrictions to end-consumers who in turn adapted to the new normal by using water resources more sparingly and efficiently. The capacity of major dams will continue to be closely monitored during the recovery period anticipated to take two to three years to full recovery. Water Resources that are more resilient to erratic weather patterns will have to be developed coupled with timely infrastructure planning and implementation. In relation to this, global warming and climate change threatens the entire globe and for its part, the Department and water entities in collaboration with Department of Environmental Affairs is continuing to refine the Climate Change Adaptation Strategy for the water sector. Water supply security is crucial and the Department complements Umgeni Water s bulk supply projects through national water resource developments, balancing this with assurance of water for agriculture, the environment, and local economic use and development. The Department is reviewing the National Water Resource Strategy, which provides an opportunity to ensure that water is at the centre of planning and that it supports the broad national economic and social development goals without compromising the long-term sustainability of water resources. To further realise its objectives, an overarching National Water and Sanitation Master Plan is being prepared for South Africa. In this regard, a process of consultation is underway and will culminate in an informed draft Master Plan by the end of the new financial year. Key water resources projects of relevance to Umgeni Water that are currently underway include the raising of the Hazelmere The Department continues to look forward to realising the promise of water for all in KwaZulu-Natal through Umgeni Water and water sector collaborators in KwaZulu- Natal in the coming period. Dam and detailed feasibility for the Upper umkhomazi Water Project. Water resource development is an important solution to close the water gap projected for South Africa between water demand and supply by 2030 and the Department will continue to forge partnerships in this regard. South Africa is still heavily reliant on surface water and its further development, with more than two thirds of the country s average annual runoff already stored in our dams. Water security requires diversification of the water mix to include groundwater, re-use of water (grey water), and desalination of sea and brackish water amongst other options. Water gaps experienced relate to both water quality and quantity. Key to water resources management is the protection of our rivers from pollution and monitoring the water quality status. Pollution by sewage remains a big problem in our catchments countrywide. During this reporting period, Umgeni Water progressed further with the upgrade of the Darvill Wastewater Treatment Works. This will sustainably serve the Msunduzi Municipality, as part of a multi-pronged strategy to ensure there is sustainable bulk sanitation, environmental
23 8.0 PG PERFORMANCE AGAINST SHAREHOLDER COMPACT 9.0 PG CREATING VALUE 10.0 PG CONSERVING OUR NATURAL RESOURCES 11.0 PG ENABLING OUR PEOPLE 12.0 PG IMPROVING RESILIENCY 13.0 PG FINANCIAL SUSTAINABILITY 14.0 PG GRI CONTENT INDEX 21 ANNUAL Umgeni Water, as a state-owned entity, is uniquely positioned and remains responsive to the Developmental State agenda, whilst maintaining principles of good leadership, transformation, service delivery, financial sustainability and collaboration with the water family. integrity and sustainability of the water value chain as a whole. The Department for its part will ensure enforcement of by-laws and also increase capacity to ensure enforcement on a continuous basis. Compliance with the Green Drop standards (in addition to the Blue Drop) will be strictly monitored and partnerships that ensure sustainability towards water security and water resources management will be encouraged. The Department is also working closely with the Water Research Commission (WRC) to find alternative innovation solutions that are not water-borne dependent, to help reduce the costs of providing dignified sanitation to all. Water and sanitation is an important means of uniting South Africa through alleviating poverty and creating jobs. Umgeni Water has contributed to job creation and transformation during this reporting period, through its successful capital infrastructure development programme and implementation of several other programmes that are developing young professionals and women employees. This commitment to skills development contributes significantly to the future sustainability of the sector and country as a whole. Umgeni Water as a state-owned entity is uniquely positioned and remains responsive to the Developmental State agenda, whilst maintaining principles of good leadership, transformation, service delivery, financial sustainability and collaboration with the water family. The end of the reporting year coincided with the end of term of the Umgeni Water Board, which served its Accounting Authority mandate with distinction. In addition, the Executive Management successfully implemented the strategy and ensured that Umgeni Water significantly met its performance and financial targets for the year. The Executive was under the sound guidance of the Chief Executive, Mr. Cyril Gamede, who also exited at year-end. Umgeni Water personnel are further to be commended for the competent, steadfast and resilient manner in which they serve the entity. Umgeni Water has performed extremely well and maintained its strong performance trend over the past five years. The Department continues to look forward to realising the promise of water for all in KwaZulu-Natal through Umgeni Water and water sector collaborators in KwaZulu-Natal in the coming period. Lastly, I would like to fully commit myself and my Department, on behalf of the Government of the Republic of South Africa, to provide the necessary shareholder support and political guidance to Umgeni Water so that the organisation s ability to continue to meet its mandate and maintain stakeholder confidence is not negatively hampered. Amongst issues that are on the priority list for me would be the fast-tracking of the process of appointing a new Board for Umgeni Water whilst ensuring that the process is aligned to legislative requirements and that it is completed before the end of the second quarter of the next reporting period. Nomvula Mokonyane Minister of Water and Sanitation 28 September 2017

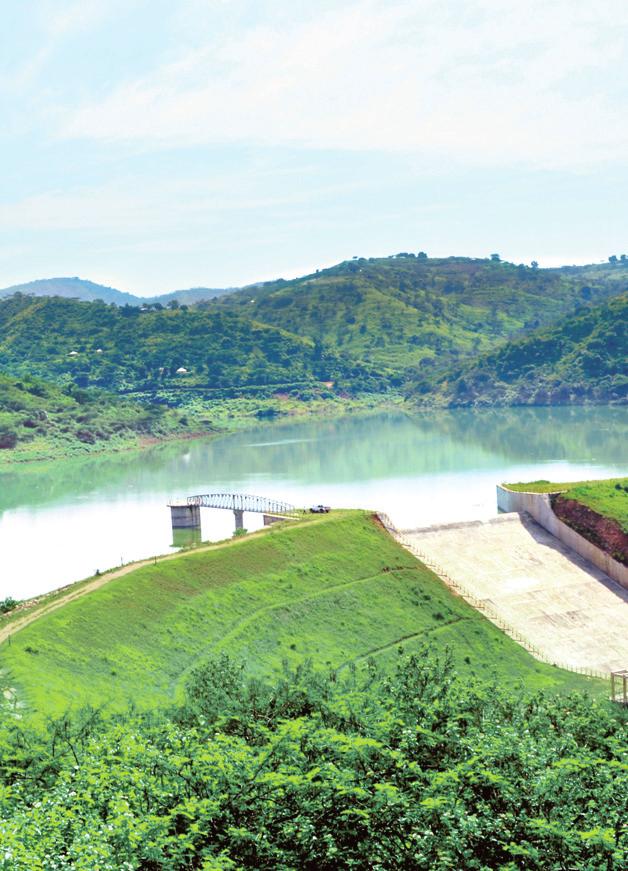
24 22 ANNUAL 1.0 PG PG 9-17 ORGANISATIONAL 3.0 PG MINISTER S FOREWORD 4.0 PG ACCOUNTING AUTHORITY S 5.0 PG CHIEF EXECUTIVE S 6.0 PG CORPORATE GOVERNANCE 7.0 PG STAKEHOLDER UNDERSTANDING AND SUPPORT 4.0 Accounting Authority s Report IMVUTSHANE DAM Overview This report deals with the key performance outcomes of Umgeni Water from a strategic perspective. Overall, Umgeni Water has demonstrated strong results in the key facets of its business, despite a difficult business climate associated with water resource shortages and reduced water sales. This Annual Report provides a synopsis of Umgeni Water s performance and status as a going concern as at the end of June 2017, consistent with the objectives and targets contained in the past year s Corporate Plan and Shareholder Compact, signed jointly with the Minister of Water and Sanitation. The activities of Umgeni Water in the period under review, remain closely aligned to and informed by key strategic plans and programmes of the Government of South Africa, including, amongst others: > The National Development Plan for South Africa for 2030, together with the Medium-Term Strategic Framework (MTSF) ;
25 8.0 PG PERFORMANCE AGAINST SHAREHOLDER COMPACT 9.0 PG CREATING VALUE 10.0 PG CONSERVING OUR NATURAL RESOURCES 11.0 PG ENABLING OUR PEOPLE 12.0 PG IMPROVING RESILIENCY 13.0 PG FINANCIAL SUSTAINABILITY 14.0 PG GRI CONTENT INDEX 23 ANNUAL > The Presidential Review Committee Report (2013) on reshaping state-owned-entities; > The National Water Resources Strategy (NWRS2), the Department of Water and Sanitation s Strategy Plan and the key focus areas for water boards highlighted by the Minister of Water and Sanitation; and > The KwaZulu-Natal Provincial Growth and Development Strategy and Plan These manifest in progress towards achieving the fourteen (14) Strategic Outcomes of Government and pertinent outputs cascading to the Executive Authority, to which Umgeni Water continues to make a significant contribution in a multitude of ways. Despite difficult business conditions caused by still-prevalent effects of drought, Umgeni Water produced a strong set of results. Notably, the core mandate and contractual obligations of Umgeni Water were effectively met in this period, demonstrated by the provision of bulk water supplies that met quantity and quality standards combined with the commissioning and progress made with bulk water infrastructure developments in support of both economic growth and increased water access to rural areas. These results are underpinned by steady Group revenue growth of 5% (R2.51 billion in 2017 from R2.38 billion in 2016) and positive net surplus of R746 million, albeit a 4.5% decrease from prior year (R781 million surplus in 2016). The positive surplus achievement is crucial to the implementation of bulk water infrastructure that is required to improve service delivery to customers and extend water provision to rural areas. This surplus is also used to repay debt and ensure that Umgeni Water maintains affordable and sustainable bulk potable water tariffs to customers into the future. Stakeholder Engagements Umgeni Water places a great deal of emphasis on accountability to its customers, the Minister and Department of Water and Sanitation, National Treasury and other stakeholders. Discussions with stakeholders during the year straddled the entire spectrum of Umgeni Water s business. The entity fully understands the expectations of its Executive Authority, as articulated in Government priority outcomes and plans, as well as the developmental needs of the KwaZulu-Natal Province, municipalities / customers and other stakeholders. In this regard, Umgeni Water continued to ensure through interventions in this reporting period that: > Adequate water resources are secured for the future; > Bulk water infrastructure is developed, adequately sized and well-maintained; > An affordable and sustainable bulk water tariff is levied to customers; and > The entity remains financially sound to continue to sustainably serve its mandate into the future. Consistent with its commitment to keep customers fully apprised, municipalities were consulted on bulk water tariffs, infrastructure development plans, including rural and social projects and overall progress with projects and plans. Discussions further centred on identifying areas where Umgeni Water could be of assistance to municipalities that were still struggling with service delivery-related problems. Umgeni Water places a great deal of emphasis on accountability to its customers, the Minister and Department of Water and Sanitation, National Treasury and other stakeholders. A cohesive response to the drought that afflicted the region was made possible through the collaborative efforts and partnerships with the Minister and Department of Water and Sanitation, municipalities and provincial departments in KwaZulu-Natal, civil society and media and cooperation by end-users who responded appropriately to water restrictions and conservation initiatives. Umgeni Water employees and management worked steadfastly with these partners to implement measures that brought relief to some communities, whilst in parallel mitigating against a whole systems failure that will have caused greater devastation. Engagements with school-going children, living in close proximity to a supply dam, were targeted for safety awareness and swimming training. This event, in which swimming professionals participated, assisted in creating heightened awareness regarding prevention of drowning and water-related incidents. In support of the Government s objective of co-operation with foreign water and sanitation-focused entities, the Umgeni Water Board and Executive Management continued to identify organisations to partner with. These included engagement and shared thinking with colleagues from Southern Africa through the Water Institute of Southern Africa and Institute of Municipal Engineers of Southern Africa at trade exhibitions and conferences. In Europe and Asia, engagements took place with a vast array of sector institutions from Europe and Africa at the Stockholm World Water Week and Singapore Water Week and in South America, as well as with two Brazilian water boards who were visited and knowledge was shared and received.
26 24 ANNUAL 1.0 PG PG 9-17 ORGANISATIONAL 3.0 PG MINISTER S FOREWORD 4.0 PG ACCOUNTING AUTHORITY S 5.0 PG CHIEF EXECUTIVE S 6.0 PG CORPORATE GOVERNANCE 7.0 PG STAKEHOLDER UNDERSTANDING AND SUPPORT Empowerment of Small Businesses In the year under review a supplier forum / engagement session was held at which various issues were raised by emerging businesses, including ambiguity of their roles vis-à-vis that of large construction companies and limited growth opportunities. Through leveraging available opportunities, Umgeni Water continues to require large companies to provide meaningful participation of smaller companies in mainstream construction projects. Presentations made to existing and potential suppliers included, amongst other information, planned infrastructure developments, available contract opportunities and protocols for registering to become suppliers and service providers of Umgeni Water. Members of the Board remained dedicated in carrying out their duties and providing leadership and guidance to Umgeni Water management in the year. All corporate governance requirements were adhered to, together with compliance with the Water Services Act (Act 108 of 1997) and the Public Finance Management Act (Act 1 of 1999), internal policies and King III Code of Governance Principles, This Annual Report further discloses full details of Board and Executive Remuneration in the financial report chapter. The Road Ahead: Risks, Challenges and Opportunities Strategic priorities in the year ahead include: > Pursuing growth and expansion opportunities; In the financial year 43% of the capital expenditure implemented was spent on strategic rural development projects... Rural Development A significant percentage of Umgeni Water s five-year capital infrastructure investment programme targets projects that support rural development and community sustainability. In the financial year 43% of the capital expenditure implemented was spent on strategic rural development projects, including the Lower Thukela Bulk Water Supply Scheme, the umshwathi Regional Bulk Water Supply Scheme and the Greater Mpofana Bulk Water Supply Scheme. Corporate Governance Board and Board Committee meetings were held according to the entity Business Cycle for the year and were well attended. (Full details are provided in the Corporate Governance chapter of this Annual Report). The critical issues presided over include the formulation of strategy aligned to the expectations of the Executive Authority and other national, provincial and customer growth and development needs, review of the entity s performance against strategy and overall fiduciary oversight over policy, statutory and related matters. > Co-operating with the process leading to the formation of the KwaZulu-Natal Utility as per programme; > Increasing alignment to customer and provincial development plans; > Strengthening relationships with all stakeholders; and > Ensuring the entity remains well managed and financially viable. Plans for the merger of Umgeni Water and Mhlathuze Water to form one regional entity for KwaZulu-Natal (KZN) are still on schedule. The single entity is expected to offer better coverage of KwaZulu-Natal, for which many parts, specifically rural areas, are not served by water boards, resulting in difficult or no access to safe drinking water. The next phase of the project plan is an independent due diligence study - expected to take eighteen to twenty-four months to complete - and will inform decision-makers as to the best option to take regarding the future of the two KZN water boards. The move to amalgamate the two water boards is not isolated from other initiatives that government is engaged in to ensure the sustainability of water supply to the province. The Accounting Authority has no reason to believe that this process will negatively affect the going concern position of the entity during the 2017/2018 financial year, but rather that it will create growth opportunities for the merged entity (once all conditional processes have been achieved) with a clear mandate from the Executive Authority. A watchful eye is being kept on the recovery progress of major dams. Of concern at this stage is the adequacy of water resources, notably the Mgeni system which supplies an estimated four million consumers in Durban, Pietermaritzburg,
27 8.0 PG PERFORMANCE AGAINST SHAREHOLDER COMPACT 9.0 PG CREATING VALUE 10.0 PG CONSERVING OUR NATURAL RESOURCES 11.0 PG ENABLING OUR PEOPLE 12.0 PG IMPROVING RESILIENCY 13.0 PG FINANCIAL SUSTAINABILITY 14.0 PG GRI CONTENT INDEX 25 ANNUAL umgungundlovu and parts of Ugu District Municipalities. It is not possible to predict exactly when above-average rainfall, needed to eradicate the deficit in major systems, will be received. At the time of compilation of this report, 15% water restrictions were still being implemented, continuing from the prior year, and expecting to continue for a further twelve-month period. The beneficial effects of imposing water restrictions are clearly evident, but on the flip-side, this impacts revenue with concomitant delays in the implementation of some infrastructure projects. Umgeni Water is pleased that it continued to receive an Unqualified Audit Report from the Auditor-General. Accompanied with this is the Fitch Ratings Agency affirmation of Umgeni Water s longterm and senior unsecured ratings at AA+. Fitch also affirmed Umgeni Water s short-term rating at F1+. The outlook in relation to long-term rating is stable. The affirmation reflects stability in Umgeni Water s stand-alone profile due to cost-effective tariffs and relatively stable funds from operations. There was also positive pronouncement from Standard and Poor s during the recalibration of the national and regional scale mapping table, resulting in Umgeni Water national scale rating being AAA for longterm and AA- for short-term. This continues to signal confidence that will put investors at ease regarding the entity s Corporate Governance, Financial and Non-Financial performance. The Accounting Authority remains satisfied that the entity is in a sound financial position and has adequate access to sufficient borrowing facilities to meet its cash requirements to continue into the foreseeable future as a going concern. Accolades and Achievements The reporting year produced some satisfying moments for Umgeni Water when, as recognition for its contribution to society and socio-economic development in KwaZulu-Natal, it received the Pietermaritzburg Chamber of Business/Nedbank Business of the Year Award in the Utilities Sector. The Accounting Authority is able to state that Umgeni Water has made a vital contribution to the province of KwaZulu-Natal and therefore to the socio-economic development of the people that live and work in the province. Two significant developments occurred as financial year 2016/17 drew to a close. These were the end of term of the Board of Umgeni Water and the departure of the Chief Executive, Cyril Gamede. The Board has provided outstanding leadership to the entity and during its term, Umgeni Water continued to Umgeni Water has made a vital contribution to the province of KwaZulu-Natal and therefore to the socio-economic development of the people that live and work in the province. make its mark as a high-performing water utility, consistently able to deliver on the needs and expectations of its customers and stakeholders. Staff and Management extend their appreciation to the Board and wish its members all the best in future endeavours. Stewardship of the outgoing Chief Executive was also characterised by customer and stakeholder satisfaction, in turn recognised through accolades in the form of awards. Mr. Gamede, in conjunction with the Executive, was instrumental in positioning Umgeni Water in the sector as a leader making significant impact on extending water services to the un-served and enhancing security of future water supply. Management and staff of Umgeni Water wish Mr. Gamede well in his future endeavours. Acknowledgements It is with a sense of appreciation that the Accounting Authority acknowledges the Minister of Water and Sanitation, Ms. Nomvula Mokonyane, for her leadership, the Portfolio Committee on Water and Sanitation and the Department of Water and Sanitation for their oversight and direction, Umgeni Water s customers, notably, ethekwini Metropolitan Municipality, ilembe District Municipality, Ugu District Municipality, Harry Gwala District Municipality, umgungundlovu District Municipality and Msunduzi Local Municipality for their collaborative engagements in the year, the out-going Board for the robust, strategic and pragmatic deliberations during their term, Umgeni Water Executives, inclusive of the out-going Chief Executive, Cyril Gamede, for the steadfast manner in which the entity s strategies and plans were executed and importantly, the employees of Umgeni Water for their dedication and hard work in realising the continued good results and performance of Umgeni Water.

 ACTING CHIEF EXECUTIVE This management report, covering the period 1 July 2016 to 30 June 2017 focuses on Umgeni Water s performance against targeted outcomes contained in the")
28 26 ANNUAL 1.0 PG PG 9-17 ORGANISATIONAL 3.0 PG MINISTER S FOREWORD 4.0 PG ACCOUNTING AUTHORITY S 5.0 PG CHIEF EXECUTIVE S RT 6.0 PG CORPORATE GOVERNANCE 7.0 PG STAKEHOLDER UNDERSTANDING AND SUPPORT 5.0 Chief Executive s Report Once again, excellent drinking water quality was provided to customers and communities, meeting the relevant SANS 241 standard at all seventeen (17) treatment works. THAMI HLONGWA CA (SA) ACTING CHIEF EXECUTIVE This management report, covering the period 1 July 2016 to 30 June 2017 focuses on Umgeni Water s performance against targeted outcomes contained in the entity s strategy. The executive continued to successfully implement the strategy through providing focussed leadership and decision-making to drive key plans, projects, programmes and initiatives during the year. As a result, progress against strategic objectives was significantly achieved during this reporting period. These are summarised at a high level per outcome in this report with more detail provided in the chapters of the annual report that follow. Product Quality Once again, excellent drinking water quality was provided to customers and communities, meeting the relevant SANS 241 standard at all seventeen (17) treatment works. Wastewater quality discharges met the target standards set for eight (8) of the nine (9) treatment works. The Darvill Wastewater Treatment Works capacity upgrade project was significantly advanced during this reporting period and will be
29 8.0 PG PERFORMANCE AGAINST SHAREHOLDER COMPACT 9.0 PG CREATING VALUE 10.0 PG CONSERVING OUR NATURAL RESOURCES 11.0 PG ENABLING OUR PEOPLE 12.0 PG IMPROVING RESILIENCY 13.0 PG FINANCIAL SUSTAINABILITY 14.0 PG GRI CONTENT INDEX 27 ANNUAL completed in 2018, leading to improvements in the quality of treated wastewater from this site. extended the duration of available supplies and successfully mitigated the risk of total system failure. Investment in maintenance of water and wastewater treatment assets totalled R190 million in the past year. Maintenance investment has been consistent over the past five years, with 7.6% of revenue or 2.45% of Property, Plant and Equipment spent in the past year, thereby continuing to assure that no major assets pose a risk to Umgeni Water. Customer Satisfaction This financial year under review coincided with a prolonged drought period that required curtailment in supply volumes to customers and in turn end users. Bulk potable water treated and supplied from seventeen (17) water treatment works systems, totalled 410 million cubic metres (1 123 Ml/d) for the year, a 6% decrease from the prior year (436 million cubic metres in 2016), attributable to the water supply restrictions imposed. The drought joint operating committee initiatives continued resulting in more judicious management and savings measures that extended the duration of available supplies and successfully mitigated the risk of total system failure. Bulk wastewater treated increased by 7%, from 31 to 33 million cubic metres per annum (90 Ml/d). Constructive meetings were held with major customers regarding performance against existing bulk supply agreements, water assurance levels for growth and development, infrastructure refurbishments, new schemes development and future tariffs. Stakeholder Understanding and Support All stakeholder engagement plans were successfully met in the year and straddled the full spectrum of stakeholders. Community and Environmental Sustainability Umgeni Water facilitates participation of targeted enterprises in the economy, leveraging off its capital expenditure and other programmes. The Contract Participation Goal target of 35% for construction contracts and professional services was well met in the reporting year. Benefits of economic transformation are realised over several years with the total award to targeted enterprises reaching R2.2 billion since the initiative started in Umgeni Water remains closely aligned to the agenda of government and engaged with the Minister and Department of Water and Sanitation, amongst others, on multiple occasions in the year for policy development, strategy alignment and statutory reporting purposes. Facilitation of drought-related joint operating committee sessions incorporating municipalities, the Department of Water and Sanitation and the Department of Cooperative Governance and Traditional Affairs CoGTA), continued during this period. Initiatives implemented through these engagements resulted in more judicious water management and savings measures that A total of temporary CAPEX Programme jobs was created in the year (1 514 in 2016) with R27.7 million paid in wages to local labour (R39.7 million in 2016), benefiting local communities. Infrastructure Stability During this reporting period, sixteen (16) strategic projects targeting five (5) water service authority customers were at various stages of planning, design and construction. These comprised nine (9) bulk water supply scheme projects, three (3) pipeline projects, three (3) wastewater treatment works projects and one (1) water treatment works project.
30 28 ANNUAL 1.0 PG PG 9-17 ORGANISATIONAL 3.0 PG MINISTER S FOREWORD 4.0 PG ACCOUNTING AUTHORITY S 5.0 PG CHIEF EXECUTIVE S RT 6.0 PG CORPORATE GOVERNANCE 7.0 PG STAKEHOLDER UNDERSTANDING AND SUPPORT Spend performance for the year of just over R1.16 billion was achieved (R2 billion in 2016) of which R503 million (43%) was spent on projects extending access to rural areas. Overall, 72% of target water infrastructure project milestones were met for these strategic projects. Details of target customers, infrastructure projects and milestones during the reporting period are as follows: (1) Lower Thukela Bulk Water Supply Scheme Serves ilembe District Municipality and ethekwini Metropolitan Municipality, along the coastal strip from north of Durban to the uthukela River. The infrastructure development comprises the uthukela River abstraction works, pump station, water treatment works and potable water pipelines to deliver 55 Ml/d in Phase 1 (upgradable to 110 Ml/d in Phase 2). Construction of access roads, the weir, abstraction works, gravity main, and water treatment works were completed in and the scheme was commissioned. The defects liability period is underway, following which water will flow to customers. (2) umshwathi Regional Bulk Water Supply Scheme Serves umgungundlovu District Municipality and ilembe District Municipality. This phased infrastructure development comprises four pipelines of total length 91 km, two booster pump stations and three reservoirs of total storage 30 Ml/d. Construction of the 27 km Pipeline from Claridge to Wartburg was completed in 2015/2016. In construction of the next phase commenced comprising three pipelines, totalling 64 km, linking Wartburg to Ozwathini via Dalton and Efaye, two booster pump stations and two reservoirs sized 8 Ml and 10 Ml at Wartburg and Dalton respectively. These are targeted for completion in 2017/2018. A further 12 Ml reservoir is scheduled for construction at Ozwathini in 2018/2019. (3) Wartburg to Bruynshill Pipeline and Pump Station Serves umgungundlovu District Municipality. The infrastructure development includes construction of a 10.5 km potable water pipeline and a pump station, which is currently under construction. The target date for full completion is March (4) Greater Mpofana Bulk Water Supply Scheme Serves umgungundlovu District Municipality. The infrastructure development comprises construction of a water treatment works, two storage reservoirs and two bulk pipelines. The construction of the 20 Ml/d Rosetta Water Treatment Works adjacent to Spring Grove Dam commenced in and is scheduled for completion in 2019/2020. Construction of the 5 Ml and 12 Ml/d reservoirs feeding Nottingham Road and Bruntville, respectively, is complete and commissioning is 70% complete. The construction of the Nottingham Road Pipeline - from the WTW to Nottingham Road Reservoir - is complete and the Bruntville Pipeline - from the Water Treatment Works to Bruntville Reservoir - is scheduled for completion in 2018/2019.
31 8.0 PG PERFORMANCE AGAINST SHAREHOLDER COMPACT 9.0 PG CREATING VALUE 10.0 PG CONSERVING OUR NATURAL RESOURCES 11.0 PG ENABLING OUR PEOPLE 12.0 PG IMPROVING RESILIENCY 13.0 PG FINANCIAL SUSTAINABILITY 14.0 PG GRI CONTENT INDEX 29 ANNUAL (5) Vulindlela Bulk Water Supply Scheme Upgrade Serves Msunduzi Local Municipality. In the infrastructure design was in progress and is 60% complete. Design is scheduled for completion in 2017/2018 and construction is planned for completion in 2019/2020. (6) Impendle Bulk Water Supply Scheme Serves umgungundlovu District Municipality. The planning of the scheme is underway and design will commence in 2017/2018. Construction of the scheme is scheduled to commence in (7) Maphumulo Bulk Water Supply Scheme Phase 3 Serves ilembe District Municipality, which includes KwaMaphumulo, Ndwedwe, and KwaDukuza Local Municipalities, and will serve 150,000 people in Maqumbi, Ashville, Maphumulo, Masibambisane, KwaSizabantu and Ngcebo supply areas. Phase 1, completed in 2013, comprised the imvutshane River abstraction, 6 Ml/d Water Treatment Works (WTW), potable water pipelines, booster pump stations and reservoirs. Phase 2, construction of the imvutshane Dam, was completed in Phase 3 includes the upgrade of the WTW from 6 to 12 Ml/d and upgrade of the raw water and booster pump stations for which design was well underway in and construction is scheduled to commence in 2017/2018 for completion in 2018/2019. (8) umkhomazi Water Project Serves ethekwini Metropolitan Municipality, umgungundlovu District Municipality, Msunduzi Local Municipality, Ugu District Municipality and ilembe District Municipality. Phase 1 of the infrastructure development includes a dam on the umkhomazi River, raw water tunnel to Baynesfield, balancing dam, raw water pipeline, water treatment works and bulk potable storage reservoir at Baynesfield and bulk potable water pipeline to Umlaas Road. Phase 2 includes a further dam higher up on the umkhomazi River at Impendle, raw water tunnel, raw water pipeline, water treatment works capacity and reservoir storage upgrades and a second bulk potable water pipeline. In the detailed feasibility study and an environment impact assessment for phase 1 was in progress.
 Lower umkhomazi BWSS Serves ethekwini Metropolitan Municipality and Ugu District Municipality and will augment the coastal areas from Amanzimtoti")
32 30 ANNUAL 1.0 PG PG 9-17 ORGANISATIONAL 3.0 PG MINISTER S FOREWORD 4.0 PG ACCOUNTING AUTHORITY S 5.0 PG CHIEF EXECUTIVE S RT 6.0 PG CORPORATE GOVERNANCE 7.0 PG STAKEHOLDER UNDERSTANDING AND SUPPORT (9) Lower umkhomazi BWSS Serves ethekwini Metropolitan Municipality and Ugu District Municipality and will augment the coastal areas from Amanzimtoti to Hibberdene via the South Coast Pipeline. The planned infrastructure comprises a dam at Ngwadini and two raw water abstraction systems together with pipelines, raw water pump stations and raw water reservoir, a water treatment works (100 Ml/d upgradable to 150 Ml/d), storage reservoir and bulk potable water pipeline. In the detail feasibility and preliminary design were completed. The detailed design is planned for completion in 2018/2019. (10) Nungwane Pipeline Serves ethekwini Metropolitan Municipality and Ugu District Municipality. The construction stage of the 13.5 km raw water pipeline from Nungwane Dam to Amanzimtoti Water Treatment Works commenced in and is scheduled for completion in 2018/2019. (11) South Coast Pipeline Phase 2B Serves Ugu District Municipality, including Pennington, Kelso, Malangeni and Shayamoya. The pipeline is designed to supply approximately 16.5 Ml/d and will link Scottburgh South to Pennington and then to Malangeni Reservoir. Construction is scheduled to commence in 2017/2018 for completion in 2018/2019. (12) Mhlabatshane Bulk Water Supply Scheme Phase 2 - Mzimkhulu River Abstraction Serves Ugu District Municipality and will reach and provide potable water access for over inhabitants in ten tribal authority areas. The infrastructure development comprises an abstraction works on the umzimkhulu River, pump station and pipeline to deliver water to the Mhlabatshane Water Treatment Works and upgrade of the Water Treatment Works from 4 Ml/d to 8 Ml/d. Phase 1, the commissioning of the Bulk Water Supply Scheme, was completed in 2014/2015. Planning of Phase 2 was completed in and project has progressed to the detailed design stage, which is scheduled for completion in 2019/2020.
33 8.0 PG PERFORMANCE AGAINST SHAREHOLDER COMPACT 9.0 PG CREATING VALUE 10.0 PG CONSERVING OUR NATURAL RESOURCES 11.0 PG ENABLING OUR PEOPLE 12.0 PG IMPROVING RESILIENCY 13.0 PG FINANCIAL SUSTAINABILITY 14.0 PG GRI CONTENT INDEX 31 ANNUAL (13) Midmar Raw Water Pipeline Augmentation, Raw Water Pump Station and WTW Upgrade Serves ethekwini Metropolitan Municipality, umgungundlovu District Municipality and the Msunduzi Local Municipality. The planned infrastructure development includes duplication of the raw water pipeline and water treatment works upgrade. The construction of the 1.6 km raw water pipeline was completed in. The Midmar Water Treatment Works upgrade, from 250 Ml/d to 375 Ml/d was in construction in and completion is scheduled for 2017/2018. (14) Darvill WWTW Capacity Increase Serves Msunduzi Local Municipality. The works capacity is being upgraded from 65 Ml/d to 100 Ml/d. Construction is in progress and includes a new inlet works, primary and secondary settling tanks, pumps and pump station, reactor, chlorination house and anaerobic digesters, amongst other components. Completion is scheduled for 2017/2018. (15) Trustfeeds WWTW Serves umgungundlovu District Municipality and ilembe District Municipality. The infrastructure development comprises a 1 Ml/d Wastewater Treatment works, 4.5 km bulk sewer outfall pipeline and a 1.5 km gravel access road. Planning and design were completed at the end of. Construction of the bulk sewer and gravel access road will be completed in 2017/2018 and construction of the Wastewater Treatment works will be completed in 2019/2020. (16) Mpophomeni WWTW Serves umgungundlovu District Municipality and umngeni Local Municipality. The infrastructure development comprises a 6 Ml/d Wastewater Treatment Works and a 6 km bulk sewer outfall pipeline. The preliminary design of the works is complete and design for sewer outfall scheduled for 2017/2018. Following this, the project will move into construction phase, planned for completion by 2020/2021.
34 32 ANNUAL 1.0 PG PG 9-17 ORGANISATIONAL 3.0 PG MINISTER S FOREWORD 4.0 PG ACCOUNTING AUTHORITY S 5.0 PG CHIEF EXECUTIVE S RT 6.0 PG CORPORATE GOVERNANCE 7.0 PG STAKEHOLDER UNDERSTANDING AND SUPPORT Water Resources Adequacy The vulnerability associated with not having sufficient water resources was brought home with the recent drought which had devastating consequences for many parts of the country. Umgeni Water is ever mindful of its high dependence on the availability of sustainable water resources. To this end, the entity continued to balance supply availability with growth in demands and update its Infrastructure Master Plan towards ensuring long-term water resources and supply sustainability. Collaboration with the Department of Water and Sanitation remains essential to ensure there is intersection of national and regional water resource development priorities. Umgeni Water continues to fund bursary students with twelve (12) students enrolled at various universities in disciplines of civil, mechanical and electrical engineering, chemistry, microbiology and finance. In partnership with National Treasury, the entity continued to implement the graduate development programme for engineers, technologists, process support and technicians. As part of this programme, forty-three (43) graduates, fourteen (14) female and twenty-nine (29) male, were developed over the five-year period and all have submitted final engineering reports to the Engineering Council of South Africa (ECSA) for certification. Progress was made with the following water resource infrastructure developments in the year: > umkhomazi (Smithfield) Dam (DWS and UW), which has progressed to detailed feasibility stage (construction by 2030); > Lower Thukela Project (UW), for which construction is complete and the new supply system planned to be brought online in 2017/2018; > imvutshane Dam (UW), which finally impounded, thereby assuring supply to Maphumulo; > Hazelmere Dam raising (DWS), for which construction is ongoing; and > Lower umkhomazi (Ngwadini) Dam, for which the detailed design is planned for completion in 2018/2019. Leadership and Employee Development The entity seeks to maintain a workforce that enables it to deliver quality services to all stakeholders. In this regard, skills development remains a key focus area, as this enables employees to excel in their individual capacity and deliver on the entity s strategy. Umgeni Water partnered with the University of KwaZulu-Natal to develop and implement a Senior Management Development Programme (SMDP) which was attended by a total of twenty (20) Senior Managers during the reporting period. The international leg of the programme provided opportunity for the Senior Managers to visit and benchmark with Sociedade de Abastecimento de Agua e Saneamento S.A (Sanasa), the State-owned water utility in Sao Paulo, as well as Aguas do Brasil, which is the largest private water utility in Brazil. The Umgeni Water Learnerships and apprenticeships programmes provided sixty-nine (69) apprentices and artisans with training, development and exposure, including in Mechanical Engineering, Electrical Engineering and Instrumentation. Umgeni Water s graduate trainee programme is aligned to guidelines provided by professional registration bodies and in the reporting period, the entity had a total of forty-one (41) graduates enrolled in engineering, science and other required professional fields, as well as thirty-one (31) in-service trainees receiving experiential training. Sixty-seven (67) of the entity s employees are on an Assisted Education Programme of which thirty-two per cent (32%) are enrolled in programmes that are directly targeting critical and scarce skills. The membership of Umgeni Water Young Professionals (UWYP) forum, established in 2014 totalled 174 at the end of this reporting period. The forum has created an enabling environment for professional growth of youth through affiliation and registration with professional bodies. In the year under review, five (5) young professionals had opportunity to travel to China, one (1) to Brazil and one (1) to Japan, further benefiting from international exposure. In partnership with National Treasury, the entity continued to implement the graduate development programme for engineers, technologists, process support and technicians. Operational Resiliency The entity s strategic risks are well aligned to its strategy. Of a total of ten (10) strategic risks, one (1) strategic risk is rated as a High risk, namely short-term water resources availability caused by continued low water levels in dams. This risk has been mitigated in the short-term through emergency water transfer schemes and implementation of water restrictions that are scheduled to continue for another twelve-month period for the Mgeni System, subject to the receipt of above-average rainfall in catchment areas. Water resources and infrastructure developments will continue to advance as planned over the medium to long-term period, in order to ensure long-term supply sustainability for the region.
35 8.0 PG PERFORMANCE AGAINST SHAREHOLDER COMPACT 9.0 PG CREATING VALUE 10.0 PG CONSERVING OUR NATURAL RESOURCES 11.0 PG ENABLING OUR PEOPLE 12.0 PG IMPROVING RESILIENCY 13.0 PG FINANCIAL SUSTAINABILITY 14.0 PG GRI CONTENT INDEX 33 ANNUAL Umgeni Water continues to maintain the quality of its laboratories at a level that ensures they provide a world-class service 365 days a year. These facilities are ISO/IEC accredited in chemistry, microbiology, hydrobiology and soil testing and have highly skilled and dedicated technical staff. Innovation, research and development projects are undertaken in partnership with academia, notably through the Umgeni Water University of KwaZulu-Natal Chair of Water Resource Management and through active participation in Water Research Commission projects. The outputs continue to enhance water and wastewater treatment processes, thereby adding to the entity s core and distinctive competencies. The SAP Enterprise Resource Planning system (SAP ON TAP) went live on the 6 th March Notwithstanding some gaps that still need to be addressed, the implementation is hailed a success. The SAP Enterprise Resource Planning (ERP) system went live on the 6 th March Notwithstanding some gaps that still need to be addressed, the implementation is hailed a success. Going forward, automation and integration of the core business processes within the entity is expected to drive huge improvements in operational efficiency and effectiveness. Operational Optimisation The recent drought further entrenched the need to judiciously safeguard our scarce water resources and other natural resources. Water efficiencies are ensured in the bulk business through careful water balancing per system. Water loss was maintained well below the entity s target level of 5%, with a total of 2.29% recorded for the year (3.85% in 2016). Energy is a crucial resource for water and wastewater treatment processes and several initiatives are underway to manage usage. Optimal pumping and other strategies remain inherent parts of the business psychology from planning, design and construction through to operation. Financial Viability Despite the drought, Umgeni Water maintained positive results in the year due to continued sound financial management: > Revenue (Group) of R2.51 billion was generated (R2.38 billion in 2016); > Net surplus (Group) was R746 million (R781 million in 2016), and > Balance sheet reserves were strengthened to R6.82 billion (R5.98 billion in 2016). The earned surplus for the year will be invested in support of the entity s future five-year R6.1 billion (not escalated) capital investment programme and used in debt reduction. As at 30 June 2017, a significant portion of capital investments were already committed. The five-year CAPEX programme excludes capital investment for areas outside the traditional supply area. Summary and Outlook Umgeni Water has continued to demonstrate resilience as an entity through steadfastly maintaining its performance at a high level during this period and continuing to serve customers well, during a period beset by water shortages. This is attributable to a combination of solid enterprisewide systems that the entity has in place, backed by highly competent employees and leadership provided by a robust executive team. The entity s performance has been consistently good over the past five-years under the sound leadership of Mr. Cyril Gamede. I would like to take the opportunity to again wish Mr. Gamede well, and hail Umgeni Water s appreciation for having developed a level of fortitude/grit in Umgeni Water employees that bodes well for the future. The Executive Authority of Umgeni Water has initiated a process towards the establishment of a single provincial water board in KwaZulu-Natal. As at the end of the reporting year, this process was still underway and is planned to culminate in a merger of Umgeni Water and Mhlathuze Water, with the former absorbing the latter. Due to a number of strategic steps that need to be taken to inform the final decision making process (which includes parliamentary processes, legislative processes and financial commitments confirmed for National Treasury) this process is expected to be concluded within the next eighteen to twenty-four months. The position of strength that has been carefully maintained within the entity provides a stable base that can be leveraged for future growth and service delivery planning for KwaZulu-Natal. The entity has maintained its reputation as a financially viable entity, creating significant value for customers and shareholders. The strength of the balance sheet and access to other strategic financial resources remain vital for expanding services in KwaZulu-Natal. Thami Hlongwa CA (SA) Acting Chief Executive 20 September 2017


36 34 ANNUAL 1.0 PG PG 9-17 ORGANISATIONAL 3.0 PG MINISTER S FOREWORD 4.0 PG ACCOUNTING AUTHORITY S 5.0 PG CHIEF EXECUTIVE S 6.0 PG CORPORATE GOVERNANCE 7.0 PG STAKEHOLDER UNDERSTANDING AND SUPPORT Umgeni Water Group employees SPRING GROVE DAM PUMP STATION
37 8.0 PG PERFORMANCE AGAINST SHAREHOLDER COMPACT 9.0 PG CREATING VALUE 10.0 PG CONSERVING OUR NATURAL RESOURCES 11.0 PG ENABLING OUR PEOPLE 12.0 PG IMPROVING RESILIENCY 13.0 PG FINANCIAL SUSTAINABILITY 14.0 PG GRI CONTENT INDEX 35 ANNUAL 6.0 Corporate Governance 6.1 Composition and Functioning of the Board Board The year end coincided with the end of term of the Board of Umgeni Water and the departure of the Chief Executive, Cyril Gamede. The process of appointing a permanent Board for Umgeni Water is being fast-tracked by the Minister and Department of Water and Sanitation and is anticipated to be completed in the new year. The Board during the reporting period comprised twelve (12) non-executive Board members and one (1) Executive Board member, the Chief Executive. The roles of the Chairman and that of the Chief Executive were separate as recommended in the King III Report on Corporate Governance (hereinafter referred to as King III ) to ensure the independence of the two positions and the clear definition of roles and responsibilities. The Chairman of the Board and all other Board members (with the exclusion of the Chief Executive), were independent non-executive directors in the manner described in King III. All Board members executed their legal duties in a professional manner, with integrity and enterprise. In terms of the Water Services Act (Act 108 of 1997), Board members (save for the Chief Executive who is appointed by the Board) are appointed by the Minister of Water and Sanitation ( the Minister ). During the reporting period, the Board was assisted with discharging its responsibilities through the following four (4) committees: > Audit Committee > Capital Projects, Fixed Assets and Procurement Committee > Human Resources and Remuneration Committee > Governance Committee Umgeni Water Board and Committee memberships during the reporting period are shown in Table 6.1. Table 6.1: Board and Committee Memberships for Period BOARD MEMBER GENDER AUDIT REMCO CAPEX 1. Mr. A Mahlalutye 1 M 2. Prof. I Vally 2 M 3. Mr. V Gounden M 4. Ms. T Shezi F 5. Ms. N Afolayan 3 F 6. Ms. Z Mathenjwa F 7. Dr. T Dube F 8. Ms. N Chamane 4 F 9. Mr. V Reddy M 10. Mr. G Atkinson M 11. Mr. T Nkhahle M 12. Mr. T Zulu M 13. Mr. C Gamede 5 M Denotes Committee Member 1 Chairman 2 Audit Committee Chairman 3 CAPEX, Fixed Assets and Procurement Committee Chairperson 4 Human Resources and Remuneration Committee Chairperson 5 Chief Executive
38 36 ANNUAL 1.0 PG PG 9-17 ORGANISATIONAL 3.0 PG MINISTER S FOREWORD 4.0 PG ACCOUNTING AUTHORITY S 5.0 PG CHIEF EXECUTIVE S 6.0 PG CORPORATE GOVERNANCE 7.0 PG STAKEHOLDER UNDERSTANDING AND SUPPORT Figure 6.1: Board Member (a) Age, (b) Race and (c) Gender Profiles in (a) Board Member Age Profile (b) Board Member Race Profile AGE RANGE African, 9 (69%) Indian, 3 (23%) White, 1 (8%) (c) Board Member Gender Profile The Board is accountable for the leadership and control of Umgeni Water. Its responsibilities include the development, review and monitoring of strategic objectives, the approval of major capital expenditure, risk management and monitoring of operational and financial performance. The government of the Republic of South Africa, represented by the Minister and the Department of Water and Sanitation, is the sole shareholder of Umgeni Water. The Board contracts with the Executive Authority, the Minister, through an annually approved shareholder compact and actively engages with the shareholder through various forums during the year. Male, 8 (62%) Female, 5 (38%) A Board Charter (reviewed in 2016) provides a framework for fiduciary duties, responsibilities and overall functioning of the Board. The Board Charter is read in conjunction with: > The Public Finance Management Act (Act 1 of 1999), as amended by the Public Finance Management Amendment Act (Act 29 of 1999), hereinafter referred to as the PFMA; > Treasury Regulations (GG 27338) as amended from time to time; > The Water Services Act (Act 108 of 1997), as amended; and As recommended by King III the Board evaluates the performance of all divisions including the finance division. This is planned for twice in the reporting year. The Members of the Board have skills that were put to good use in providing leadership, guidance and directing strategy during the period. Overall the Board functioned at a strategic level and delivered outputs in line with its mandate. Non-executive Board members receive remunerative benefits and fees as determined by the Minister on an annual basis and in line with their terms of appointment. Therefore no Board member is involved in determining his/her own remuneration. Board Members remuneration is fully disclosed in Umgeni Water s Annual Report. (Page 139). > The King Code of Governance Principles, 2009 (King III).
39 8.0 PG PERFORMANCE AGAINST SHAREHOLDER COMPACT 9.0 PG CREATING VALUE 10.0 PG CONSERVING OUR NATURAL RESOURCES 11.0 PG ENABLING OUR PEOPLE 12.0 PG IMPROVING RESILIENCY 13.0 PG FINANCIAL SUSTAINABILITY 14.0 PG GRI CONTENT INDEX 37 ANNUAL Summary of Board and Committee Meetings and Attendance in The attendance at Board and Committee meeting in the reporting period was: > 95% for Board: Five (5) normal meetings, four (4) special meetings. > 91% for Audit Committee: Six (6) normal meetings. > 79% for HR and Remuneration Committee: Five (5) normal meetings. > 79% for Procurement, Fixed Assets and Capital Projects Committee: Five (5) normal meetings. > 100% for Governance Committee. Two (2) meetings. Table 6.2: Board Meeting Attendance in BOARD MEMBER NORMAL MEETINGS SPECIAL MEETINGS GENDER 27-JUL SEP NOV MAR APR MAY MAY JUN JUN Mr. A Mahlalutye 1 M N/A 2. Prof. I Vally 2 M N/A 3. Mr. V Gounden M N/A N/A 4. Ms. T Shezi F 5. Ms. N Afolayan 3 F N/A N/A 6. Ms. Z Mathenjwa F 7. Dr. T Dube F 8. Ms. N Chamane 4 F 9. Mr. V Reddy M 10. Mr. G Atkinson M 11. Mr. T Nkhahle M 12. Mr. T Zulu M 13. Mr. C Gamede 5 M N/A Denotes Committee Member 1 Chairman 2 Audit Committee Chairman 3 CAPEX, Fixed Assets and Procurement Committee Chairperson 4 Human Resources and Remuneration Committee Chairperson 5 Chief Executive The membership of the following members, who exceeded the number of Board terms as per Schedule 1 of the Water Services Act (Act No. 108 of 1997), was terminated on 18 May > Ms. N Afolayan > Adv. V Gounden Board Committees The Board Committees are formally constituted and are chaired by non-executive Board members. The Board Committees assist the Board in the performance of duties and enable effective decision-making through providing more detailed attention to matters within the terms of reference. The committees report to the Board on activities at every meeting. In terms of the Water Services Act, the Board is authorised to delegate powers to the Committees established by the Board. The functions and powers delegated to Committees are set out in a written Terms of Reference which is formally approved by the Board. Audit Committee The Committee consisted of six (6) non-executive Board members and Professor Imtiaz Vally served as chairman. The Committee is mandated to achieve the highest level of financial management, accounting and reporting to the shareholder and to meet the requirements prescribed in section 51(1)(a)(ii) and 76(4)(d) of the Public Finance Management Act (Act 29 of 1999), as well as Treasury Regulations, 2005 (Chapter 27.1). The Audit Committee further performs a critical function of risk management by ensuring the effectiveness, quality, integrity and reliability of Umgeni Water s risk management processes. The terms of reference of the Audit Committee takes into account the recommendations in King III, the Companies Act (Act 71 of 2008), the Public Finance Management Act (Act 29 of 1999) as amended and Treasury Regulations, 2005, to ensure alignment to best practice and legislation. The Ethics Committee and Corporate Risk Committee also report through the Audit Committee.
40 38 ANNUAL 1.0 PG PG 9-17 ORGANISATIONAL 3.0 PG MINISTER S FOREWORD 4.0 PG ACCOUNTING AUTHORITY S 5.0 PG CHIEF EXECUTIVE S 6.0 PG CORPORATE GOVERNANCE 7.0 PG STAKEHOLDER UNDERSTANDING AND SUPPORT Table 6.3: Audit Committee Meeting Attendance MEMBERS COMMITTEE MEETINGS 07-SEP NOV FEB APR MAY JUN-17 Prof. I Vally 1 N/A Ms. N Afolayan N/A N/A Mr. T Nkhahle Ms. Z Mathenjwa Dr. T Dube Mr. T Zulu 1 Chairman Attendance Absence with apology Ethics Committee Umgeni Water has a Code of Ethics that provides guidelines for ethical decision-making by all employees and stakeholders. The code, which formally acknowledges the entity s intention to undertake business in an ethical manner, is communicated to all employees through various awareness and communication forums and programmes during the year. The Ethics Committee, in conjunction with the Audit and Risk committees, deliberates on Umgeni Water s compliance with the Code of Ethics and reports all matters within its scope of mandate to the Board, through the Audit Committee. The committee was mandated to promote ethical behaviour, which includes preventing incidences of fraud, bribery and other corrupt activities and to monitor the entity s compliance with relevant social, ethical and legal requirements and best practice codes. The establishment of the committee shows a deepened commitment by Umgeni Water as a responsible corporate citizen to all it stakeholders. The committee is satisfied that it has fulfilled all its statutory duties and duties assigned to it by the Board, through the Audit Committee, during the reporting period. Composition The Ethics Committee has an Independent Chairman - who is neither a member of management nor a member of the Board. The Chairman, Mr. S Shabalala, is a qualified Chartered Accountant and has extensive public and private sector experience in Financial Management and Corporate Governance matters. He is currently the Managing Director of Ukukhanya Advisory Services, a Durban-based Accounting and Auditing company. Responsibilities The Ethics Committee met four times during the year to execute its role and responsibility as prescribed by applicable legislation and included monitoring the entity s activities against legal or best practice requirements relating to: > Social and economic development, including, EE and B-BBEE; > Good corporate citizenship, including promotion of equality, prevention of unfair discrimination, Corporate Social investment and reduction of corruption, sponsorship, media and advertising; > Environment, health and public safety, including, impact of the organisation s activities, products and services, biodiversity management, waste management, energy efficiency and carbon footprint reduction; > Consumer relationships, including, advertising, public relations and consumer protection; > Labour and employment, including, the organisation s standing in terms of the International Labour Organisation Protocol on decent work and working conditions, employment relationships and contribution toward education and development of its employees and disciplinary handling; > Financial ethics, including, irregular and wasteful and fruitless expenditure; and > Fraud and hotline call management. Whistle-blowing Hotline Umgeni Water continues to provide an external whistle-blowing hotline service managed by an external service provider. This 24 hour days a year facility provides an anonymous and confidential communication channel for all stakeholders to report suspicions of fraud or otherwise unethical conduct. All hotline calls are investigated and appropriately followed up using a hotline protocol which ensures these are dealt with in a transparent and consistent manner. Trends and information of the hotline calls are further used to improve internal controls. Umgeni Water creates and maintains awareness of this facility and ensures that it is advertised by means deemed the most effective and appropriate. Internal Audit Internal Audit is an independent, co-sourced assurance function, the purpose, authority and responsibility of which is formally defined in a charter approved by the Board, in line with stipulations of the Institute of Internal Auditors. In line with the requirements of the Public Finance Management
41 8.0 PG PERFORMANCE AGAINST SHAREHOLDER COMPACT 9.0 PG CREATING VALUE 10.0 PG CONSERVING OUR NATURAL RESOURCES 11.0 PG ENABLING OUR PEOPLE 12.0 PG IMPROVING RESILIENCY 13.0 PG FINANCIAL SUSTAINABILITY 14.0 PG GRI CONTENT INDEX 39 ANNUAL Act (PFMA) and Good Governance, the internal auditors give the Audit Committee and management assurance on the appropriateness and effectiveness of internal controls. The internal auditors report regularly to the Audit Committee and have unrestricted access to the Committee Chairman. An internal audit charter has been approved by the Committee. As at 30 June, Umgeni Water had a total of four (4) unresolved Internal Audit Findings: > One (1) of these findings is due to wastewater quality compliance. Umgeni Water is currently upgrading the capacity of the Darvill Wastewater Treatment Works to address this, with completion scheduled for > The remaining three (3) findings have been allocated to responsible and accountable personnel for resolution. Management is closely monitoring progress to ensure there is closure of these in Compliance with Laws and Regulations Umgeni Water continues to enhance its compliance management system. The entity continued using its Legal Compliance register for monitoring and reporting Legal Compliance in During the year a total of twenty-eight (28) assessments were done. Three (3) areas were flagged of which one (1) was successfully addressed during the year. Two (2) outstanding matters, relating to property and security will be addressed by December An overall compliance of 99.9% has been achieved. External Audit The external auditors are responsible for implementing procedures to obtain audit evidence regarding the amounts and disclosures in the consolidated financial statements, the report on predetermined objectives and compliance with laws and regulations applicable to the entity. Amongst others, this is based on: > Assessment of the risks of material misstatement of the consolidated financial statements, the report on predetermined objectives and material non-compliance with laws and regulations; > Considering internal controls relevant to Umgeni Water s preparation and fair presentation of the financial statements, the report on predetermined objectives and compliance with laws and regulations; > Evaluating the appropriateness of accounting policies used and the reasonableness of accounting estimates made by Management; and > Evaluating the appropriateness of systems and processes that ensure the accuracy and completeness of the financial statements, the report on predetermined objectives and compliance with laws and regulations. The external auditors express an opinion on the consolidated financial statements and report on findings relating to their audit of the report on predetermined objectives and compliance with material matters in laws and regulations applicable to the entity. Human Resources and Remuneration Committee This Committee comprised six (6) non-executive directors and the Chief Executive and Ms. Nompumelelo Chamane served as chairperson. The Committee reviews and recommends to the Board all matters relating to: > Human Resources policies, organisational structure and compliance with the Employment Equity Act, (Act 55 of 1998) and other labour legislation; > Conditions of employment of executive management; > Appointment of the Chief Executive and members of executive management; > Remuneration packages of the Chief Executive, members of executive management and staff; > Succession planning for executive management; > Policies and practices for Performance Management > Strategic Human Resource related matters; and > Special rewards recommended by the Chief Executive. Table 6.4: Human Resource and Remuneration Committee Meeting Attendance MEMBERS COMMITTEE MEETINGS 14-SEP OCT FEB APR JUN-17 Ms. N Chamane 1 Ms. T Shezi Mr. V Gounden N/A Ms. Z Mathenjwa Mr. G Atkinson Mr. V Reddy Mr. C Gamede 1 Chairperson Attendance Absence with apology
42 40 ANNUAL 1.0 PG PG 9-17 ORGANISATIONAL 3.0 PG MINISTER S FOREWORD 4.0 PG ACCOUNTING AUTHORITY S 5.0 PG CHIEF EXECUTIVE S 6.0 PG CORPORATE GOVERNANCE 7.0 PG STAKEHOLDER UNDERSTANDING AND SUPPORT Capital Projects, Fixed Assets and Procurement Committee This Committee was chaired by Ms. Nombuso Afolayan and comprised eight (8) non-executive Board members and the Chief Executive. The Committee recommends procurement policies to the Board for approval, assists the Board with capital expenditure programme related decisions, including approving the release of capital expenditure above executive management s delegated authority and within the Committee s delegated authority. The Committee ensures that the entity s supply chain policies and procedures are equitable, transparent, competitive and cost effective. It reviews the organisation s infrastructure asset maintenance programme/performance. Contracts that exceed the Committee s Delegation of Authority are referred to the Board for approval. The Committee reviews and recommends amendments to the limits in the delegation of authority, relating to budget approvals for capital projects and procurement, to enable management to expedite the implementation of projects. Table 6.5: Capital Projects, Fixed Assets and Procurement Committee Meeting Attendance MEMBERS COMMITTEE MEETINGS 24-AUG NOV FEB MAR JUN-17 Ms. N Afolayan 1 N/A Ms. T Shezi Mr. G Atkinson Mr. T Nkhahle Ms. N Chamane Dr. T Dube Mr. V Reddy Mr. T Zulu Mr. C Gamede 2 N/A 1 Chairperson 2 Chief Executive Attendance Absence with apology Governance Committee The Governance Committee met on an ad-hoc basis. The Committee was chaired by the Chairman of the Board, Mr. Andile Mahlalutye, and further comprised the three (3) non-executive Committee Chairs. The Committee assists the Board in monitoring and assessing the performance of Executive Management and the Company Secretary to ensure that performance objectives and targets are met. Performance results are considered by the Remuneration and Human Resources Committee in determining the remuneration of the Chief Executive and other executives to be recommended to the Board for approval. Table 6.6: Governance Committee Meeting Attendance MEMBERS COMMITTEE MEETINGS 13-SEP APR-17 Mr. A Mahlalutye (Chairman of the Board) Ms. N Chamane (REMCO Chairperson) Ms. N Afolayan (CAPEX Committee Chairperson) Prof. I Vally (Audit Committee Chairman) Attendance
43 8.0 PG PERFORMANCE AGAINST SHAREHOLDER COMPACT 9.0 PG CREATING VALUE 10.0 PG CONSERVING OUR NATURAL RESOURCES 11.0 PG ENABLING OUR PEOPLE 12.0 PG IMPROVING RESILIENCY 13.0 PG FINANCIAL SUSTAINABILITY 14.0 PG GRI CONTENT INDEX 41 ANNUAL Delegation of Authority A comprehensive delegation of authority framework governs the authority levels for the Board and management. These are exercised through various board and management committees. The Board reviews the framework regularly. Executive Committee The Board has delegated the day-to-day running of the entity to the Chief Executive who works with Executives, each heading up a Division, to assist with this task. The Executive Committee is the highest executive decision-making structure in the entity and central to its role is the formulation and implementation of the Board s strategy and policy direction, and ensuring that all business activities are aligned in this respect. Each Division works towards the achievement of set strategic objectives for a predetermined period. The entity s wholly owned operating subsidiary also works, independently, towards enabling Umgeni Water to fulfil its mandate and contracted obligations. Company Secretariat The Company Secretary oversees the portfolio of secretariat, governance advisory services and plays a critical role in legal and governance advisory to the Board, risk and compliance management, and attends all Board and Committee meetings as secretary. The Board as a whole, as well as, individual Non-Executive Directors and members of the Executive have access to the Company Secretary who is enjoined to provide guidance on how members should discharge their duties and responsibilities in the best interests of the entity. The Company Secretary continues to oversee the preparation and coordination of the induction and on-going training of Board members and assists the Board and its Committees in formulating annual plans, agendas, minutes, and terms of reference as warranted. The Company Secretary is responsible for the flow of information to the Board and its Committees and for ensuring compliance with Board procedures. All Board members have access to the advice and services of the Company Secretary whose appointment and removal are a Board matter. The Company Secretary provides company secretary services to Umgeni Water and its subsidiary firms, is not a Director of the Company or any of its subsidiaries and accordingly maintains an independent and arm s length relationship with the Board and the Executives. Contact details of the Company Secretary appear on page 135. Post Annual Report Approval Developments The Minister has appointed an interim Board effective from 28 September The interim Board members are as follows: > Ms. Ziphozethu Mathenjwa (Chairperson); > Mr. Visvin Reddy; > Ms. Nompumelelo Chamane; > Mr. Matshedisho D. Dikoko; > Ms. Zodwa Manase; > Adv. Matshidiso Hashatse; and > Mr. Midiavhathu Tshivhase.

 & Professional Quantity Surveyor (PrQS); Programme Certificate on Economic Regulation from the London School of Economics and Political Science.")
44 42 ANNUAL 1.0 PG PG 9-17 ORGANISATIONAL 3.0 PG MINISTER S FOREWORD 4.0 PG ACCOUNTING AUTHORITY S 5.0 PG CHIEF EXECUTIVE S 6.0 PG CORPORATE GOVERNANCE 7.0 PG STAKEHOLDER UNDERSTANDING AND SUPPORT Board Members in Mr. Andile Mahlalutye MA Financial Management (London); MBL (UNISA); Graduate Diploma in Company Direction (GIMT); BSc Quantity Surveying (UCT); Certificate in NGO Development and Management (Israel); a Project Management Professional (PMP) & Professional Quantity Surveyor (PrQS); Programme Certificate on Economic Regulation from the London School of Economics and Political Science. Appointed for 1 st Board term in June End of Board term: 30 June Non-Executive Chairman of Umgeni Water Board from 2009 to June 2017; Non-Executive Board member of the Ports Regulator of South Africa since 2012; Non-Executive Director of the Richards Bay Industrial Development Zone Company since 2012; Member of the Free State Cluster Audit Committee since 2011; MD Ubudlelwane Capital Investments since 2010; Mvula Trust CEO from 2007 to 2010; Coega Development Corporation Executive from 2003 to 2007; General Manager/Project Leader with Blue IQ from 2000 to 2003; A former Non-Executive Board member of the Gauteng Gambling Board from 2011 to 2013; A former member of North West Provincial Audit Committee from 2009 to Ms. Ziphozethu (Gabsie) Mathenjwa MSc in International Business Management (University of London); MBA (UKZN); BSc (UZ); Postgraduate Diploma in Business Management (UKZN); Postgraduate Diploma in Strategic Management and Corporate Governance (UNISA/ICSA); Certificate in Financial Management and Investment (UNISA). Appointed for 1 st Board term in June End of Board term: 30 June Chairperson of Insika Foundation and the Sinafuthi Group: Board Member Denel SOC (Ltd.); Board Member Safran Turbomeca Africa; Board Member of Mitsui African Rail Solutions; Mpumalanga Provincial Department of Economic Development; Environment and Tourism Audit Committee Chairperson. Mr. Teboho Nkhahle Registered Professional Scientist; MPhil Stellenbosch University; Environmental Auditor (IRCA). Appointed for 1 st Board term in June End of Board term: 30 June Owner and MD of Environmental Impact Management Services (EIMS); Non-Executive Chairman of Lesotho Highlands Development Authority (LHDA) from 2007 to 2011; Board member of US-based Global Decisions Inc. (Development of global environment, health and safety regulations and standards database) since 2008; Member of Institute of Directors-SA since 2007; Vice Chair IoD Sustainable Development Forum from 2008 to 2009; Environmental Auditor with Eskom from 1998 to 2004.

45 8.0 PG PERFORMANCE AGAINST SHAREHOLDER COMPACT 9.0 PG CREATING VALUE 10.0 PG CONSERVING OUR NATURAL RESOURCES 11.0 PG ENABLING OUR PEOPLE 12.0 PG IMPROVING RESILIENCY 13.0 PG FINANCIAL SUSTAINABILITY 14.0 PG GRI CONTENT INDEX 43 ANNUAL Mr. Vasu Gounden MA Law (LLM) (Georgetown University); Graduate of Harvard; Wits Business School Senior Executive Programme; Honorary Doctorate of Social Sciences (UKZN). Appointed for 3 rd Board term in June End of Board term: 18 May Founder and Executive Director of the African Centre for the Constructive Resolution of Disputes (ACCORD) since 1992; Member of the Editorial Board of the Peace and Conflict Studies Journal since 1996; Elected by the World Economic Forum as a Global Leader for Tomorrow (GLT) in Board Member of the Gandhi Development Trust since 2003; Board member of Finland-based Crisis Management Initiative since 2007; Board member of the Old Mutual Science Education Foundation since 2007 (served as Chairman of the Board between ); Board member of the Dutch based Inter-Church Organisation for Development Cooperation since 2009; Member of the Advisory Board of the Insight on Africa Journal since Dr. Takalani Dube MBChB, Medical (UKZN); Diploma in Anaesthesia (DASA); Diploma in Health Services Management (UKZN); Certificate in Business Development and Management (ethekwini Business Development); Postgraduate Diploma in HIV Management in the Workplace (Stellenbosch University). Appointed for 1 st Board term in June End of Board term: 30 June Director of ethekwini Community Church since 2005; Founder and President of Centre of HOPE (HIV and Community Development Organisation) since 2000; President of Women of Virtue (Women Empowerment and Investment Organisation) since Ms. Thokozile Shezi BSc in Social Psychology/Education (USA); MSc in Measurement and Evaluation (USA); Management Development Diploma (Wits); Project Management Diploma (UP). Appointed for the 2 nd Board term in June End of Board term: 30 June Senior Manager & Head of Secretariat; KwaZulu-Natal Climate Change and Sustainable Development Council in the office of the Premier; Non-Executive Director of KZN Playhouse Company.


46 44 ANNUAL 1.0 PG PG 9-17 ORGANISATIONAL 3.0 PG MINISTER S FOREWORD 4.0 PG ACCOUNTING AUTHORITY S 5.0 PG CHIEF EXECUTIVE S 6.0 PG CORPORATE GOVERNANCE 7.0 PG STAKEHOLDER UNDERSTANDING AND SUPPORT Board Members...continued Ms. Nombuso Afolayan MBA (Finance) Luton University; Executive Leadership Development (UCT); Organisational Development Practitioner. Appointed for 2 nd Board term in June End of Board term: 18 May Chairperson of Umgeni Water CAPEX Committee from 2009 to May 2017; Founder and Executive Chairperson of FS Capital Investments; Chairperson of KwaZulu-Natal Sharks Board; Non-Executive Director at Ithala Development Finance Corporation; Executive at multinational shipping, maritime and petroleum companies in African markets. Mr. Visvin Reddy Educator (Mathematics & Computer Science) by profession; Various Diplomas and Certificates in Management and Communications. Appointed for 1 st Board term in June End of Board term: 30 June Seventeen years local government experience; Served on the Executive Committee of ethekwini Metropolitan Municipality as well as Chairman of the Infrastructure Committee; A member of various community bodies. Mr. Graham Atkinson BSc Civil Engineering (UKZN); Postgraduate Diploma in Town and Regional Planning (UKZN). Appointed for 1 st Board term in June End of Board term: 30 June Member of KZN Planning and Development Commission from 1998 to 2004; City Engineer of Pietermaritzburg from 1977 to 1986; Chief Executive of Umgeni Water from 1987 to 1994; Board Member of Umgeni Water from 1978 to 1986; Honorary Member of the Water Institute of Southern Africa (WISA) since 2002; Honorary member of the former Union of African Water Suppliers (UADE). Mr. Sbusiso Madonsela (Company Secretary) Admitted Attorney of the High Court of South Africa. LLB (UZ); Postgraduate Diploma in Compliance (UJ); holds qualifications in Construction Contracts and Construction Adjudication from the University of Pretoria. Joined the Competition Commission and occupied various portfolios, the most recent being the Commission s Legal Counsel after leaving Private Legal Practice in 2007; Joined Umgeni Water as Legal Services Manager in 2011 and held the position until December 2013; Appointed as a Company Secretary from 01 January 2014; Served as a Trustee of the Umgeni Water Provident Fund and is now the current Fund Principal Officer.

47 8.0 PG PERFORMANCE AGAINST SHAREHOLDER COMPACT 9.0 PG CREATING VALUE 10.0 PG CONSERVING OUR NATURAL RESOURCES 11.0 PG ENABLING OUR PEOPLE 12.0 PG IMPROVING RESILIENCY 13.0 PG FINANCIAL SUSTAINABILITY 14.0 PG GRI CONTENT INDEX 45 ANNUAL Ms. Nompumelelo Chamane Appointed for 1 st Board term in June End of Board term: 30 June Chairperson of Umgeni Water Board HR and Remuneration Committee from 2009 to June 2017; Councillor with ethekwini Municipality; Experienced liaison officer with provincial structures of COSATU; Member of Albert Luthuli Hospital Committee; Board member of EU-funded Cato Manor Development Association (CMDA); Chairperson of Finance Committee of St. Benedict Catholic Church. Prof. Imtiaz Vally Master of Accountancy; Chartered Accountant (SA); Chartered Management Accountant (ACMA). Appointed for 1 st Board term in June End of Board term: 30 June Chairman of Umgeni Water Board Audit Committee from 2009 to June 2017; Professor of Management Accounting and Finance at UKZN. Mr. Thabani Zulu Chartered Accountant; BCom degree; Postgraduate Diploma in Accounting (UKZN). Appointed for 1 st Board term in December End of Board term: 30 June Director of Ngubane & Company (Auditing Firm); General Manager/Head of Internal Audit for Provincial Treasury; Member of SAFCOL Audit Committee; Member of UDW Audit Committee; Member of Ndwedwe Audit Committee; CEO of the KZN Gambling Board. Management Accountant of Unilever SA; Financial Accountant at Mercedes Benz of SA (now Daimler Chrysler SA).
48 46 ANNUAL 1.0 PG PG 9-17 ORGANISATIONAL 3.0 PG MINISTER S FOREWORD 4.0 PG ACCOUNTING AUTHORITY S 5.0 PG CHIEF EXECUTIVE S 6.0 PG CORPORATE GOVERNANCE 7.0 PG STAKEHOLDER UNDERSTANDING AND SUPPORT 6.2 Functions and Management Structure During the reporting period, Umgeni Water (Group) had the following structure in response to its strategy. The core functions pertaining to each is articulated in the strategic statements that follow. Umgeni Water Group Umgeni Water Parent Subsidiaries Msinsi Holdings SOC Ltd. (100%) Umgeni Water Board Umgeni Water Services SOC Ltd. (100%) Chief Executive Durban Water Recycling (Pty) Ltd. (18.5%) GM Operations GM Engineering & Scientific Services GM Finance GM Corporate Services

.")
49 8.0 PG PERFORMANCE AGAINST SHAREHOLDER COMPACT 9.0 PG CREATING VALUE 10.0 PG CONSERVING OUR NATURAL RESOURCES 11.0 PG ENABLING OUR PEOPLE 12.0 PG IMPROVING RESILIENCY 13.0 PG FINANCIAL SUSTAINABILITY 14.0 PG GRI CONTENT INDEX 47 ANNUAL Some of the executive directors in the holding company (Umgeni Water) sit on the boards of the subsidiaries as non-executive directors, in order to ensure alignment of business processes and culture within the group (refer to Executive s profiles on page 47). Their executive positions in the holding company do not curtail their fiduciary responsibility, as non-executive directors, in the respective subsidiary entities. The group company secretariat enables all three Boards to maintain their distinct fiduciary responsibilities, whilst enhancing the group s collective values. EXCO Members in Mr. Cyril Gamede BSc (Eng) Mechanical; MSc (Eng) Industrial; MBA; Advanced Diploma in Labour Law; Certificate in Corporate Governance. Registered Professional Engineer (ECSA). Appointed as Chief Executive: Umgeni Water in August End of contract: 30 June Chairperson and Director of Msinsi Holdings SOC Ltd. from 2014 to June 2017; President of ECSA since 2012; Managing Director of K2S Consulting from 2010 to 2012; Director AEL Mining Services from 2002 to 2010; Director of Operations, Umgeni Water, from 1996 to Ms. Moketenyana Moleko BCom; Management Development Certificate; International Management and Marketing Programme Certificate. Appointed as General Manager Corporate Services in January Leadership positions held at various organisations, including the Eskom Leadership Institute, Eskom Transmission, MERSETA and South African Airways.


50 48 ANNUAL 1.0 PG PG 9-17 ORGANISATIONAL 3.0 PG MINISTER S FOREWORD 4.0 PG ACCOUNTING AUTHORITY S 5.0 PG CHIEF EXECUTIVE S 6.0 PG CORPORATE GOVERNANCE 7.0 PG STAKEHOLDER UNDERSTANDING AND SUPPORT EXCO Members in...continued Mr. Msizi Cele BSc (Eng) Mechanical; Registered Professional Engineer (ECSA); Government Certificate of Competency Machinery. Appointed as General Manager: Operations in November Managing Director of uthukela Water from 2007 to 2014; Executive Director Engineering at uthukela Water from 2005 to 2007; Member of the Institute of Municipal Engineers of South Africa; Member of the Water Institute of South Africa. Mr. Steve Gillham Registered Professional Engineer (ECSA); BSc Engineering (Civil); BCom. Appointed as General Manager: Engineering and Scientific Services in Director of Msinsi Holdings SOC Ltd. since 2014; Director of Msinsi Holdings (Pty) Ltd. from 2012 to 2014; Planning Manager from 1999 to 2012; Engineer: Umgeni Water from 1997 to 1999; Engineer with the Department of Water and Sanitation from 1984 to Mr. Thamsanqa Hlongwa Chartered Accountant (SA); BCom Honours. Appointed as General Manager: Finance in July Currently Acting Chief Executive Director of Msinsi Holdings SOC Ltd. since 2014; Chief Financial Officer KZN CoGTA from March 2007 to June 2013; Completed articles with Deloitte from 2002 to 2004; Audit Senior in Deloitte New York Office from 2004 to 2005; Senior Manager at Siyaya Management Services from 2005 to 2007; Served in sub-committees of SAICA and ABASA.

51 8.0 PG PERFORMANCE AGAINST SHAREHOLDER COMPACT 9.0 PG CREATING VALUE 10.0 PG CONSERVING OUR NATURAL RESOURCES 11.0 PG ENABLING OUR PEOPLE 12.0 PG IMPROVING RESILIENCY 13.0 PG FINANCIAL SUSTAINABILITY 14.0 PG GRI CONTENT INDEX 49 ANNUAL NAGLE DAM


52 50 ANNUAL 1.0 PG PG 9-17 ORGANISATIONAL 3.0 PG MINISTER S FOREWORD 4.0 PG ACCOUNTING AUTHORITY S 5.0 PG CHIEF EXECUTIVE S 6.0 PG CORPORATE GOVERNANCE 7.0 PG STAKEHOLDER UNDERSTANDING NDING AND SUPPORT 410 million cubic metres of potable water per annum (1 123 Ml/d) provided to 6 customers MAPHEPHETHWA WTW

53 8.0 PG PERFORMANCE AGAINST SHAREHOLDER COMPACT 9.0 PG CREATING VALUE 10.0 PG CONSERVING OUR NATURAL RESOURCES 11.0 PG ENABLING OUR PEOPLE 12.0 PG IMPROVING RESILIENCY 13.0 PG FINANCIAL SUSTAINABILITY 14.0 PG GRI CONTENT INDEX 51 ANNUAL 7.0 Stakeholder Understanding and Support Stakeholder Interaction Umgeni Water interacts with a wide range of stakeholders that are impacted on or have an interest in the business activities of the entity. Stakeholders have been clustered into four groups: > Statutory; > Strategic; > Contracted; and > Non-Contracted; UMGENI WATER STAKEHOLDERS Umgeni Water interacted with all stakeholder groupings in the year under review and generally received positive and constructive feedback, which informed future strategies, plans and programmes. Engagement with the Minister of Water and Sanitation, the Director-General of the Department of Water and Sanitation (DWS), National Treasury and SALGA took place on numerous occasions, including for formal appraisal of strategy, business plan implementation and performance indicators as per Shareholder Compact, as well as during regular Minister and DG forums and strategy sessions hosted by DWS. All statutory documents were timely submitted for the year and were of high quality. Engagements with the Minister of Water and Sanitation also took place on the subjects of drought relief and drought mitigation measures and during the commissioning of Greater Eston Bulk Water Supply Scheme. Other engagements related to bulk potable water tariff for the financial year 2017, which took place with the Ministry of Water and Sanitation, Portfolio Committee on Water and Sanitation and all customers. Statutory: > Minister of Water and Sanitation (Executive Authority) > Department of Water and Sanitation (DWS), including DG and DDGs > Portfolio Committee on Water and Sanitation via Executive Authority > National Treasury via Executive Authority Contracted: > Customers (WSAs) > Union > Staff > Suppliers > Investors Strategic Stakeholders: > Provincial Stakeholders, including, Office of the Premier, KZN CoGTA, KZN Planning Commission > Mhlathuze Water > Uthukela Water (Pty) Ltd. > Water Research Commission > SALGA and SAAWU > Human Rights Commission Non-Contracted: > Communities > Environment > Media > Academia > Other partners/collaborators
54 52 ANNUAL 1.0 PG PG 9-17 ORGANISATIONAL 3.0 PG MINISTER S FOREWORD 4.0 PG ACCOUNTING AUTHORITY S 5.0 PG CHIEF EXECUTIVE S 6.0 PG CORPORATE GOVERNANCE 7.0 PG STAKEHOLDER UNDERSTANDING NDING AND SUPPORT Umgeni Water had the opportunity to engage with the Office of the Premier and CoGTA on issues of water resources shortages in the Mgeni system and the joint development of the KZN universal water access plan. A large number of customer engagements took place, including both strategic and operational engagements and focused on performance with bulk supply agreements, service delivery needs, infrastructure plans and water conservation. Engagements also took place with customers to explore cost-effective means of mitigating the effects of the drought. Umgeni Water is aware of the importance of maintaining a healthy internal pulse and created opportunities during the year for engagement with employees and employee union (NEHAWU). This included regular staff information sessions and meetings with employee union, executive site visits, annual staff awards session, commemoration of special days in the year, sport fun days, induction programmes and communiqués informing employees of Ministerial announcements. In addition, the Chief Executive Blog ensured employees were kept updated on key water sector developments. Interaction with communities was made possible through the following: > Corporate Social Responsibility initiatives. > Dissemination of water and environmental education to learners and other attendees and interaction directly with the public at the annual Royal Agricultural Show. Awareness of the role, functions, competencies, products and services of a water utility was created. > The Umgeni Water Marathon further provided socialised interactions between employees and the public. > Special day/week events, including water week, environment and women s days, amongst several others, provided opportunities for community outreach and awareness creation. Media coverage of the organisation, in print, broadcast and online, was in the form of positive, neutral and negative reports. Media coverage of Umgeni Water is monitored by an independent company and evaluation of media coverage is based on reports supplied quarterly by this company. Suppliers, notably small, medium and micro enterprises, were engaged during a forum, where Umgeni Water provided information to current and potential suppliers to help increase future B-BBEE opportunities. In addition, Umgeni Water interacted with the Durban Chamber of Commerce, Pietermaritzburg Chamber of Business, the South African National Civic Organisation and Human Rights Commission and provided an overview of the entity s five-year capital infrastructure programme and current water resource shortages in the Mgeni System. Umgeni Water kept abreast of water-related knowledge through collaboration and knowledge exchange with water utilities in South Africa, Europe and South America. Further opportunity to engage water sector peers was made possible through attendance of the Institute of Municipal Engineers of Southern Africa Conference and Exhibition. Events that were either hosted by Umgeni Water or in which the entity participated were: > Joint launch of the National Water Week (KZN) with the Department of Water and Sanitation; > Community function related to commissioning of the Hazelmere Water Treatment Works Upgrade; > A dam safety event held to create awareness to help prevent drowning in dams and rivers; > A supplier forum; > Hosting of visiting delegation from Amatola Water; and > Presentation of Umgeni Water s annual performance to two separate stakeholder sessions, one for the media and the other for customers and financial institutions. The relationship Umgeni Water has with its stakeholders is based on transparency and mutual value creation. The achievements and feedback received in the year bear testimony to the healthy and robust stakeholder relations enjoyed by Umgeni Water.
55 8.0 PG PERFORMANCE AGAINST SHAREHOLDER COMPACT 9.0 PG CREATING VALUE 10.0 PG CONSERVING OUR NATURAL RESOURCES 11.0 PG ENABLING OUR PEOPLE 12.0 PG IMPROVING RESILIENCY 13.0 PG FINANCIAL SUSTAINABILITY 14.0 PG GRI CONTENT INDEX 53 ANNUAL Table 7.1: Summary of Stakeholders, the Nature of Engagement and Value Proposition SUMMARY OF STAKEHOLDERS, THE NATURE OF ENGAGEMENT AND VALUE PROPOSITION Statutory Stakeholders Stakeholders who have a regulatory or oversight function over Umgeni Water, among them; the Minister of Water and Sanitation, the Department of Water and Sanitation, the Portfolio Committee on Water and Sanitation and National Treasury. As a State-Owned Entity, Umgeni Water is required to interact with these stakeholders on a formal and regular basis in order to ensure that statutory requirements are met and there is alignment with government s objectives, strategies and plans. > Minister of Water and Sanitation > National Treasury > Department of Water and Sanitation > Portfolio Committee on Water and Sanitation Basis for engagement: delivery on mandate, responsive to Water Services Act, Public Finance Management Act and other pertinent legislation and regulations, delivering strategy and plans aligned to government outcomes and Executive Authority expectations, demonstrating adequate resource planning mobilisation, investing in water infrastructure, ensuring efficient water use and conservation and water quality management, demonstrating a well governed and efficiently run entity, ensuring performance in line with financial and predetermined objectives and plans to deliver sustainability, a partner that shows alignment with water sector communication strategies and plans, and a leader that contributes to establishing synergies in value chain and water sector. Umgeni Water and National Government both desire: a high-performing, well-governed, State-Owned Enterprise that mobilises resources in an equitable and cost-effective manner to advance key national objectives. Strategic Stakeholders Provincial and some national stakeholders to whom Umgeni Water provides information relating to organisation performance, water resource status, capital infrastructure plans, solutions to prolonged bulk water supply interruptions and expertise available to assist vulnerable water boards and municipalities. > Provincial Planning Commission > Mhlathuze Water > KwaZulu-Natal Provincial Government Departments > uthukela Water (Pty) Ltd. > South African Local Government Association (SALGA) > Water Research Commission > South African Association of Water Utilities (SAAWU) > South African Human Rights Commission Basis for engagement: structured implementation plan to enhance assurance of supply and extend water services to previously un-served communities, affordable tariff, water resource adequacy and sustainability as a catalyst for economic expansion, delivery on mandate and alignment to policy and National and Provincial Development Plans, partner in service delivery, accelerated service delivery, corporate governance, benchmarking and strategic information exchanges, collaboration in major events and celebrations and proactive measures to mitigate effects of prolonged water shortages and supply interruptions. Umgeni Water, KZN Province and other Strategic Stakeholders desire: sound water services delivery partnerships, affordable services, role in ensuring regional economic growth and development and exchange of strategic information. Contracted Stakeholders Stakeholders with whom Umgeni Water has contracted to provide or purchase products, services and goods. They include customers, suppliers and investors and, in the case of employees and organised labour, provision of employment and accompanying service benefits. Water Service Authorities in KwaZulu-Natal with whom Umgeni Water has bulk supply agreements comprise: > ethekwini Metropolitan Municipality > ilembe District Municipality > Ugu District Municipality > Harry Gwala District Municipality > umgungundlovu District Municipality > Msunduzi Local Municipality Basis for engagement with customers: service agreements, assurance of supply, quality and quantity, care and support, responsive to needs, tariff consultation, partnerships in socio-development initiatives and partnerships in CSI initiatives. Umgeni Water and WSA customers both desire: a high-performing, efficient, effective and responsive Water Services Provider. > Employees of Umgeni Water > National Education, Health and Allied Workers Union (NEHAWU) Basis for engagement: compliance with collective agreement, demonstrating relevance as an organisation that adds value to the sector, regular feedback and communication regarding sector issues and organisational performance, regular information sharing and feedback on entity events planned and held, regular feedback regarding progress towards dis-establishment of Umgeni Water and Mhlathuze Water and establishment of one regional entity, equitable jobs, fair labour practice, good working conditions, enabling work environment and communication, fair market-related compensation and service conditions, sound performance management and recognition system, and engaged employees, productivity, delivery and return on investment. Umgeni Water management, union and staff all desire: an equitable company, whose policies, practices, systems and feedback create motivated, engaged and aligned employees.
56 54 ANNUAL 1.0 PG PG 9-17 ORGANISATIONAL 3.0 PG MINISTER S FOREWORD 4.0 PG ACCOUNTING AUTHORITY S 5.0 PG CHIEF EXECUTIVE S 6.0 PG CORPORATE GOVERNANCE 7.0 PG STAKEHOLDER UNDERSTANDING NDING AND SUPPORT Table 7.1: Summary of Stakeholders, the Nature of Engagement and Value Proposition...continued SUMMARY OF STAKEHOLDERS, THE NATURE OF ENGAGEMENT AND VALUE PROPOSITION...continued Contracted Stakeholders...continued Stakeholders with whom Umgeni Water has contracted to provide or purchase products, services and goods. They include customers, suppliers and investors and, in the case of employees and organised labour, provision of employment and accompanying service benefits. > Suppliers and Service Providers > Investors and other Financial Institutions Basis for engagement: compliance with legislation for fair and equitable procurement, supplier development, transparency, business opportunities, integrity, fair treatment, fair pricing, fair payment terms, partnerships in BBBEE and capacity building towards more inclusive economic participation and Corporate Social Investment (CSI), environmental management and supplier footprint reduction water, energy and materials. Umgeni Water and supplier s desire: an equitable company, whose policies, practices, systems and feedback create responsive and high-performing suppliers that deliver against contractual agreements. > Chambers of Business Basis for engagement: Umgeni Water s provision of assurance of supply, quality and quantity, information on tariff, demonstration of responsible corporate citizenship and information sharing on infrastructure development projects. In turn, Umgeni Water encourages recognition for creating value, pollution prevention and safe guarding of water supply resources. Umgeni Water and business desire: a sustainable entity that adds value to society through a sound balance of economic growth, social development and environmental sustainability. Non-Contracted Stakeholders Stakeholders to whom Umgeni Water demonstrates its value as a socially responsible, efficient and high-performing entity. > Community and Civil Society Institutions Basis for engagement: Umgeni Water s demonstration of conservation and responsible use of resources, provision of clean and safe environment, exercising of responsible corporate citizenship, demonstration of transparency in corporate governance, job creation and provision of information and opportunities. In turn, Umgeni Water requires endorsement of social licence to operate, recognition for creating value, respect for property and collaboration in protecting remotely situated water assets. Umgeni Water and communities/civil society desire: a sustainable entity that adds value to society through a sound balance of economic growth, social development and environmental sustainability. > Media and General Public Basis for engagement: access to information, demonstrating accountability, transparency and good governance. In turn, Umgeni Water expects accurate and balanced reporting and media integrity. Umgeni Water and media/public desire: a sustainable entity that adds value to society. > National Sector Institutions > International sector institutions Basis for engagement: information exchange and knowledge management, collaboration in water research and development, support for water centres of excellence, student internships and experiential training and exposure, study tours and site visits, collaboration in major events, such as National Water Week, and participation in international exhibitions, specifically in Africa, knowledge management, networking and responding to bilateral agreements between South Africa and other African countries and continental water utilities. Umgeni Water and water sector-related institutions desire: a partner and sector collaborator that contributes to knowledge and skills development for the country, province and region.

57 8.0 PG PERFORMANCE AGAINST SHAREHOLDER COMPACT 9.0 PG CREATING VALUE 10.0 PG CONSERVING OUR NATURAL RESOURCES 11.0 PG ENABLING OUR PEOPLE 12.0 PG IMPROVING RESILIENCY 13.0 PG FINANCIAL SUSTAINABILITY 14.0 PG GRI CONTENT INDEX 55 ANNUAL HAZELMERE WTW


58 56 ANNUAL 1.0 PG PG 9-17 ORGANISATIONAL 3.0 PG MINISTER S FOREWORD 4.0 PG ACCOUNTING AUTHORITY S 5.0 PG CHIEF EXECUTIVE S 6.0 PG CORPORATE GOVERNANCE 7.0 PG STAKEHOLDER UNDERSTANDING AND SUPPORT 33 million cubic metres (90 Ml/d) of wastewater treated in MHLABATSHANE DAM
59 8.0 PG PERFORMANCE AGAINST SHAREHOLDER COMPACT 9.0 PG CREATING VALUE 10.0 PG CONSERVING OUR NATURAL RESOURCES 11.0 PG ENABLING OUR PEOPLE 12.0 PG IMPROVING RESILIENCY 13.0 PG FINANCIAL SUSTAINABILITY 14.0 PG GRI CONTENT INDEX 57 ANNUAL 8.0 Performance against Umgeni Water Strategy and Shareholder Compact Indicators Umgeni Water implements its strategy through a balanced scorecard, comprising four (4) Perspectives, four (4) Strategic Goals, nine (9) Strategic Objectives and nine (9) Key Performance Indicators (KPIs). Collectively the scorecard enables the organisation to achieve its ten (10) Outcomes and ultimately its Mission/Mandate to provide innovative, sustainable, effective and affordable bulk water and sanitation services to customers. The KPIs are further made up of fifty-five (55) total annual measurable Result Indicators, for which responsibilities and accountabilities are agreed and targets approved within the entity. These Result Indicators include all statutory indicators specifically targeted by the Executive Authority and approved via the Shareholder Compact. For the period 1 July 2016 to 30 June 2017, the planned initiatives were implemented and progress assessed by the entity. The detailed scorecard follows. Performance against the strategy is also illustrated graphically in Figures 8.1 to 8.4. Figure 8.1: Performance Figure 8.2: Performance Trend 91.0% 93.7% 92.5% 95.8% 92.2% Performance (92.2%) Variance (7.8%)
60 58 ANNUAL 1.0 PG PG 9-17 ORGANISATIONAL 3.0 PG MINISTER S FOREWORD 4.0 PG ACCOUNTING AUTHORITY S 5.0 PG CHIEF EXECUTIVE S 6.0 PG CORPORATE GOVERNANCE 7.0 PG STAKEHOLDER UNDERSTANDING AND SUPPORT Per cent targets met: 92.2% Per cent targets not met: 7.8% Umgeni Water has achieved excellent performance for the year continuing its positive performance trend over the years. This is illustrative of an entity that has delivered well against its mission and mandate to provide innovative, sustainable, effective and affordable bulk water and sanitation services Figure 8.3: Performance Against Strategic Goals 99.6% 97% 85% 83% Key outcomes: Stakeholder Understanding and Support, Customer Satisfaction, Product Quality, Community and Environmental Sustainability For the Financial Perspective and Strategic Goal 2: Expand and improve funding collaborations whilst managing key cost drivers, 85% performance was achieved, for which: SO 3 - Increase mobilisation of funds achieved 100%; SO 4 - Increase financial sustainability 82.7%; and SO 5 - Improve financial ratios 75%. Key Outcomes: Financial Viability, Stakeholder Understanding and Support, Customer Satisfaction, Community and Environmental Sustainability. For the Process Perspective and Strategic Goal 3: Remove system constraints and blockages through innovative thinking and improve efficiency of all inputs, 83% performance was achieved. For SO 6 - Improve service delivery systems, the entity continues to improve its systems and is progressively closing gaps. Goal 1 Goal 2 Goal 3 Goal 4 Performance 99.6% 85% 83% 97% Variance -0.4% -15% -17% -3% For the Customer and Stakeholder Perspective and Strategic Goal 1: Develop strategic partnerships, increase support to customers, improve visibility and be a regional leader in the provision of bulk water and sanitation services, 99.6% performance was achieved, for which: SO 1 - Increase services and customers achieved 100% and SO 2 - Increase customer and stakeholder value achieved 99.6%. Key outcomes: Operational Resiliency, Operational Optimisation, Community and Environmental Sustainability. For the Organisational Capacity Perspective and Strategic Goal 4: Strengthen and develop quality human resources, infrastructure capacity and water resources sustainability to support growth, 97% performance was achieved, for which: SO 7 - Improve and increase infrastructure assets achieved 91.3%; SO 8 - Increase water resources sustainability 97.7%; and SO 9 - Increase skills and competency 100%. Key outcomes: Infrastructure Stability, Water Resources Adequacy, Leadership and Employee Development. Figure 8.4: Umgeni Water Performance by Strategic Objective 100.0% 99.6% 100.0% 82.7% 75.0% 82.8% 91.3% 97.7% 100.0% SO 1 SO 2 SO 3 SO 4 SO 5 SO 6 SO 7 SO 8 SO 9 Achieved 100.0% 99.6% 100.0% 82.7% 75.0% 82.8% 91.3% 97.7% 100.0% Variance 0.0% -0.4% 0.0% -17.3% -25.0% -17.2% -8.7% -2.3% 0.0%
61 8.0 PG PERFORMANCE AGAINST SHAREHOLDER COMPACT 9.0 PG CREATING VALUE 10.0 PG CONSERVING OUR NATURAL RESOURCES 11.0 PG ENABLING OUR PEOPLE 12.0 PG IMPROVING RESILIENCY 13.0 PG FINANCIAL SUSTAINABILITY 14.0 PG GRI CONTENT INDEX 59 ANNUAL The detailed performance of the organisation against indicators and targets for follows, with further expansion in each of the Annual Report chapters. Scorecard i # RESULT INDICATOR TARGET ACTUALS VARIANCE PG# Balanced Scorecard Perspective: Customer and Stakeholder OUTCOMES: Stakeholder Understanding and Support, Community and Environmental Sustainability, Customer Satisfaction and Product Quality. Strategic Objective 1: Increase services and customers KPI 1: The extent to which UW has grown its services and customers 1.1 Number of new schemes and signed contracts for implementing new schemes. 2 new schemes and signed contracts by WSAs for implementation. 2 new schemes and signed contracts by WSAs for implementation. Nil 71 Strategic Objective 2: Increase customer and stakeholder value KPI 2: The extent to which customer and stakeholder needs have been met 2.1 Per cent directives implemented in accordance with plan. (DWS SHC Indicator) N/A (There are no current directives) N/A (There are no current directives) N/A (There are no current directives) Number of engagements with statutory stakeholders: Minister, DWS, PC and NT. (DWS SHC Indicator) 10 > 10 Nil Number of engagements with contractual stakeholders: customers, employees, union and suppliers. 6 Customers 3 Staff Sessions 3 Union Meetings 1 Supplier Forum 6 Customers 4 Staff Engagements 8 Union Meetings 1 Supplier Forum Nil Number of engagements with strategic stakeholders. 8 8 Nil Number of engagements with non-contractual stakeholders. 1 Community 4 Media 1 Community 7 Media Nil 51 1 Business 1 Business 1 National 1 National 1 International 1 International 2.6 Number of signed contracts (bulk supply agreements) in place as a % of total customers. (DWS SHC Indicator) 100% 6 customers/signed contracts. 100% 6 customers/signed contracts. Nil Number of signed contracts/ MOUs with rural Municipalities for provision of support. (DWS SHC Indicator) 3 signed contracts/mous. 5 signed contracts/mous. Nil Number of submissions in respect of Monthly Reports, Quarterly Reports, Annual Report, Tariff, Corporate Plan, SHC and Policy Statement (DWS SHC Indicator) 21 of 21 submissions: 4 Quarterly Reports, Annual Report, Tariff, Corporate Plan, SHC, Policy Statement and 12 Monthly Reports required. 21 of 21 submissions: 4 Quarterly Reports, Annual Report, Tariff, Corporate Plan, SHC, Policy Statement and 12 Monthly Reports required. Nil Per cent compliance of WTW systems with SANS 241 water quality standard per risk category. (DWS SHC Indicator) 13 WTW systems 100% compliant with Excellent SANS 241. Four (4) UMDM schemes compliant with Good SANS WTW systems 100% compliant with Excellent SANS 241. Four (4) UMDM schemes compliant with Good SANS 241. Nil 66 i Parent Only
62 60 ANNUAL 1.0 PG PG 9-17 ORGANISATIONAL 3.0 PG MINISTER S FOREWORD 4.0 PG ACCOUNTING AUTHORITY S 5.0 PG CHIEF EXECUTIVE S 6.0 PG CORPORATE GOVERNANCE 7.0 PG STAKEHOLDER UNDERSTANDING AND SUPPORT Scorecard i...continued # RESULT INDICATOR TARGET ACTUALS VARIANCE PG# Balanced Scorecard Perspective: Customer and Stakeholder...continued OUTCOMES: Stakeholder Understanding and Support, Community and Environmental Sustainability, Customer Satisfaction and Product Quality....continued Strategic Objective 2: Increase customer and stakeholder value...continued KPI 2: The extent to which customer and stakeholder needs have been met...continued 2.10 Per cent compliance of WWTW systems with discharge licence or General Authorisation requirements (DWS SHC Indicator) 7 WWTW 85% compliant. 1 WWTW 80% compliant. 1 WWTW 60% compliant. 7 WWTW 85% compliant. 0 WWTW 80% compliant. 1 WWTW 60% compliant. 1 WWTW < 80% compliant Number of schools/community initiatives undertaken Number of CSI initiatives undertaken. (DWS SHC Indicator) 2.13 Per cent PSP and contractor order values (CPGs) awarded to B-BBEE suppliers PSP and contractor order values (CPGs) awarded to B-BBEE suppliers that are women Actual B-BBEE spend as a % of total discretionary expenditure. Number of new B-BBEE entrants awarded work. (DWS SHC Indicator) 3 initiatives implemented. 3 initiatives implemented. Nil Nil 81 35% 36% (R149m of R414m) 14% 28% (R41m of R149m) Nil 79 80% spend 80% spend (estimated) Nil 80 2 new entrants. 5 new entrants awarded work. Balanced Scorecard Perspective: Financial OUTCOMES: Financial Viability, Stakeholder Understanding, Customer Satisfaction and Support, Community and Environmental Sustainability. Strategic Objective 3: Increase mobilisation of funds KPI 3: Increased funding collaboration and funds mobilised for sustainable growth, expansion and access 3.1 Operating cash flows, Rm R800m R818m Nil Current ratio (DWS SHC Indicator) 3.3 Debt to Equity ratio (DWS SHC Indicator) 1.5 to Nil Nil Interest cover ratio Nil 126 Strategic Objective 4: Increase financial sustainability KPI 4: The extent to which there are sustainable financial returns for each system, area, region and the organisation 4.1 Total expenditure, Rm and per cent variance. (DWS SHC Indicator) R2.20bn±10% R1.78bn (R0.44bn below budget) 4.2 Total surplus (loss), Rm and per cent variance. R598m±10% R751m R153m above target 4.3 Number of debtor days. (DWS SHC Indicator) 4.4 Total S30 revenue, Rm and per cent of turnover. (DWS SHC Indicator) 4.5 Per cent return on assets. (DWS SHC Indicator) 4.6 Number of breaches or instances of non-compliance to the approved materiality and significance framework. (DWS SHC Indicator) Nil 141 Nil debtor days against a target of 40. R342m ±12% of turnover. R165m 7% of turnover. R177m below budget. 5% below budget % of turnover. 5% 7.19% Nil 126 Nil The entity incurred Fruitless and Wasteful Expenditure, Irregular Expenditure and breaches or instances of non-compliance to the materiality and significance framework. R9.4m Irregular expenditure incurred. R5.2m Fruitless and Wasteful expenditure incurred
63 8.0 PG PERFORMANCE AGAINST SHAREHOLDER COMPACT 9.0 PG CREATING VALUE 10.0 PG CONSERVING OUR NATURAL RESOURCES 11.0 PG ENABLING OUR PEOPLE 12.0 PG IMPROVING RESILIENCY 13.0 PG FINANCIAL SUSTAINABILITY 14.0 PG GRI CONTENT INDEX 61 ANNUAL Scorecard i...continued # RESULT INDICATOR TARGET ACTUALS VARIANCE PG# Balanced Scorecard Perspective: Financial...continued OUTCOMES: Financial Viability, Stakeholder Understanding, Customer Satisfaction and Support, Community and Environmental Sustainability....continued Strategic Objective 5: Improve financial ratios KPI 5: Ratios for financial viability and sustainability met 5.1 Gross profit margin % for primary activity (Bulk Water and Wastewater). (DWS SHC Indicator) R1 320m of R2 448m 50% R1 306m of R2 331m 56% Nil Net profit margin % for primary activity (Bulk Water and Wastewater). (DWS SHC Indicator) R582m of R2 448m 20% R756m of R2 331m 32% Nil Gross profit margin % for secondary activity. (DWS SHC Indicator) R17.9m of R341.6m 5% R11.5m of R165m 7% Nil Net profit margin % for secondary activity. (DWS SHC Indicator) R16.2m of R341.6m 4% Loss of R4.95m against a profit of R165m. 3% loss 7% below target profit level of 4%. 159 Balanced Scorecard Perspective: Process OUTCOMES: Operational Resiliency, Operational Optimisation, Community and Environmental Sustainability. Strategic Objective 6: Improve service delivery systems KPI 6: The extent to which business processes, policies and systems are enabling strategy implementation 6.1 Turnaround time (working days) for awarding of CAPEX programme tenders, contract negotiations and issuing of signed contracts. Working days from tender advert to issuing intention of award. Working days for CPG negotiations, measured from expiry of appeals period. Working days for issuing of signed contracts, measured from conclusion of CPG negotiations. 6.2 Per cent Enterprise Resource Planning (ERP) system reviewed and implemented. 6.3 Number of environmental sustainability initiatives implemented. 6.4 Number of research and development/innovation initiatives implemented. 6.5 Unqualified external audit report with no matters of emphasis (clean audit). (DWS SHC Indicator) 6.6 Number of repeat and unresolved findings. (DWS SHC Indicator) Final Preparation Stage Complete. ERP System Go Live implemented. Post-Go Live Support implemented. 97 days average 2 of 7 tenders < days average 0 of 4 tenders < days average 0 of 2 tenders < 15 Final Preparation Stage Complete (100%). ERP System Go Live (90%) implemented. Post-Go Live Support (95%) implemented. 5 of 7 tenders > 90 4 of 4 tenders > 45 2 of 2 tenders > 15 Slight variance on outstanding SAP project related issues. Planning of future support. 3 initiatives implemented. 1 initiative completed. 2 initiatives in planning. At least one (1) new technology project implemented. Unqualified external audit report with no matters of emphasis (clean audit). Darvill Final Effluent Reuse Pilot Project in progress. An unqualified external audit report was received in respect of financial and pre-determined objectives N/A 84 Two findings were incurred with the audit of compliance with legislation, one of which was material 10 4 unresolved findings. Nil
64 62 ANNUAL 1.0 PG PG 9-17 ORGANISATIONAL 3.0 PG MINISTER S FOREWORD 4.0 PG ACCOUNTING AUTHORITY S 5.0 PG CHIEF EXECUTIVE S 6.0 PG CORPORATE GOVERNANCE 7.0 PG STAKEHOLDER UNDERSTANDING AND SUPPORT Scorecard i...continued # RESULT INDICATOR TARGET ACTUALS VARIANCE PG# Balanced Scorecard Perspective: Process...continued OUTCOMES: Operational Resiliency, Operational Optimisation, Community and Environmental Sustainability....continued Strategic Objective 6: Improve service delivery systems...continued KPI 6: The extent to which business processes, policies and systems are enabling strategy implementation...continued 6.7 Board/Committee meetings attended as a % of planned meetings and resolutions taken by the board as a % of resolutions required. (DWS SHC Indicator) 80% attendance 80% resolutions taken > 80% attendance - BOARD 95% - AUDIT 91% - REMCO 79% - CAPEX 79% - GOVERNANCE 100% - REMCO < 80% - CAPEX < 80% % (47 of 47) resolutions taken 6.8 Ethical issues addressed as assessed against key ethics areas. Seven (7) key ethics areas assessed and issues dealt with. Seven (7) key ethics areas assessed and issues dealt with. Nil Disabling Injury Frequency Ratio (DIFR) Nil Per cent compliance against legal Compliance Register. 100% against Compliance Register. 99.9% against Compliance Register. 0.1% non-compliance 39 Balanced Scorecard Perspective: Organisational Capacity OUTCOME: Infrastructure Stability. Strategic Objective 7: Improve and increase infrastructure assets KPI 7: Infrastructure expenditure within target cash flows and completion dates 7.1 CAPEX Rm against budget and % variance (DWS SHC Indicator) R1 451 of R1 814m 20% variance R1 163m 36% variance 16% variance Number of CAPEX projects within target completion dates against planned number and % variance. (DWS SHC Indicator) 85% completion 15% variance 72% projects within target dates 28% variance 13% variance from target 13% variance CAPEX spend on rural expansion related projects as % of budget. (DWS SHC Indicator) ± 30% of annual CAPEX budget. ± R566m of R1814m on rural expansion. 43% of annual CAPEX spend. 28% of annual CAPEX budget. Nil 76 R503m of R1814m on rural expansion. 7.4 Repairs and maintenance as % of PPE and Investment Property (Carrying Value). (DWS SHC Indicator) R206m ± 10% 2% of PPE. R190m (within allowable variance) 2.45% of PPE Nil 71 OUTCOME: Water Resources Adequacy. Strategic Objective 8: Increase water resources sustainability KPI 8: Sustainable water resource options identified for all systems 8.1 Supply and demand status and projections demonstrating longterm water resources adequacy per system and region. Quarterly status report Quarterly plant utilisation report. Infrastructure Master Plan updated to include long-term integrated water resources plans. 4 Quarterly status reports submitted. 4 Quarterly plant utilisation reports submitted. Infrastructure Master Plan updated and approved. Nil 70
65 8.0 PG PERFORMANCE AGAINST SHAREHOLDER COMPACT 9.0 PG CREATING VALUE 10.0 PG CONSERVING OUR NATURAL RESOURCES 11.0 PG ENABLING OUR PEOPLE 12.0 PG IMPROVING RESILIENCY 13.0 PG FINANCIAL SUSTAINABILITY 14.0 PG GRI CONTENT INDEX 63 ANNUAL Scorecard i...continued # RESULT INDICATOR TARGET ACTUALS VARIANCE PG# Balanced Scorecard Perspective: Organisational Capacity...continued OUTCOME: Water Resources Adequacy....continued Strategic Objective 8: Increase water resources sustainability...continued KPI 8 : Sustainable water resource options identified for all systems...continued 8.2 Per cent supply disrupted > 24 hours (over total supply days). (DWS SHC Indicator) 0 days Supply disruptions: (i) 10 of 365 supply days disrupted (3%). Supply disruptions: (i) 10 of 365 supply days disrupted (3%). 68 (ii) Disruptions occurred in 3 of 17 systems (18%). (ii) Disruptions occurred in 3 of 17 systems (18%). (iii) Average of 0.03% of planned sales volumes were not supplied (99.97% supplied). (iii) Average of 0.03% of planned volumes were not supplied. Overall Performance 93%. Overall Variance 7%. 8.3 Avoidable water lost (mil m 3 ) over total water produced (mil m 3 ). (DWS SHC Indicator) 5% of total sales 2.29% Nil 87 Strategic Objective 9: Increase skills and competency KPI 9: Effectiveness and efficiency of employee training and development programmes 9.1 Number of employees enrolled and developed through Senior Management Development Programme (SMDP). 20 employees (80% of programme completed). 20 employees enrolled (> 80% of programme completed). Nil Number of Artisans and Apprentices (Learnerships). (DWS SHC Indicator) plans met: - 69 Artisans and Apprentices. Nil 32; Process Controllers. 9.3 Number of Bursar degree plans met. (DWS SHC Indicator) Nil Number of Graduate Trainees (Graduates, In-service Trainees, Interns) development plans met. (DWS SHC Indicator) 28 Graduate Trainees 28 In-Service Trainees 10 Interns 41 Graduate Trainees 31 In-Service Trainees 10 Interns Nil Number of candidate engineers/ professionals developed (NT) and number of professional registration submissions. 29 developed. 7 certification submissions. 29 developed. 25 certification submissions. Nil Number of Young Professionals (YPs) enrolled and developed through Youth Development projects. 30 YPs successfully completed. 20 new YPs registered. 10 other employees registered. 34 YPs successfully completed. 24 new YPs registered. 12 other employees registered. Nil Number of permanent jobs created. Number of temporary jobs created. (DWS SHC Indicator) 9.8 Number of staff terminations, excluding normal retirements, as a % of the total staff complement. (DWS SHC Indicator) 9.9 Staff remuneration % of total operating expenditure. (DWS SHC Indicator) N/A N/A Nil temporary (CAPEX programme) temporary (CAPEX programme) Nil 8% turnover 2.8% turnover Nil 98 35% 33% Nil 141


66 64 ANNUAL 1.0 PG PG 9-17 ORGANISATIONAL 3.0 PG MINISTER S FOREWORD 4.0 PG ACCOUNTING AUTHORITY S 5.0 PG CHIEF EXECUTIVE S 6.0 PG CORPORATE GOVERNANCE 7.0 PG STAKEHOLDER UNDERSTANDING AND SUPPORT Capex JOBS CREATED and R27.7m in wages paid to local labour DARVILL WWTW
67 8.0 PG PERFORMANCE AGAINST SHAREHOLDER COMPACT 9.0 PG CREATING VALUE 10.0 PG CONSERVING OUR NATURAL RESOURCES 11.0 PG ENABLING OUR PEOPLE 12.0 PG IMPROVING RESILIENCY 13.0 PG FINANCIAL SUSTAINABILITY 14.0 PG GRI CONTENT INDEX 65 ANNUAL 9.0 Creating Value Umgeni Water ensures reciprocal value propositions are cultivated with customers and stakeholders. Value is created by actively applying the entity s core and distinctive competencies to meet identified needs. 9.1 Product Quality Management Approach Umgeni Water implements a rigorous, and system-wide, water quality management programme to give effect to its commitment to provide all its customers with safe potable water suitable for lifetime consumption and to ensure that wastewater discharges are not deleterious to the environment and downstream users. This manifests as carefully planned monitoring programmes, independent auditing, compliance reporting, catchmentconsumer water quality assessments and implementation of water safety plans. Sampling and analysis are undertaken in accordance with an ISO 9001 certified monitoring programme and SANAS accredited laboratory methods, respectively. Water quality monitoring programmes are annually reviewed for all operational sites to ensure they continue to provide sufficient information to meet legislative requirements, customer bulk supply agreements and water treatment process requirements, whilst taking into account new risks that may have been identified in the water value-chain system. Water quality risks associated with abstraction, conveyance, treatment and bulk distribution are continuously reviewed to ensure control effectiveness and quality assurance. All operational sites are equipped with Incident Management Protocols aligned to SANS 241: Drinking Water Specification. In line with our stakeholder communication plan, information on water quality performance is conveyed to all customers, stakeholders and legislative decision-makers. The entity also remains committed to providing customer support towards ensuring progressive achievement of full system (i.e. including retail) Blue and Green Drop Certifications. Information on the entity s approach to ensuring laboratory proficiency is covered in more detail in a later chapter (Improving Resiliency) of this report. Potable Water Quality Performance South African National Drinking Water Specification (SANS 241:2015) dictates compliance requirements for potable water systems and requires the performance to be reported against the following five risk categories (as per the classification tabulated further below): (1) Acute Microbiological Health; (2) Acute Chemical Health; (3) Chronic Chemical Health; (4) Aesthetic; and (5) Operational categories. Key to classification of the performance of drinking water supply systems according to SANS 241:2015 POPULATION UP TO PROPORTION OF SAMPLES COMPLIANT POPULATION > PROPORTION OF SAMPLES COMPLIANT EXCELLENT GOOD UNACCEPTABLE EXCELLENT GOOD UNACCEPTABLE Acute Microbiological Health 97% 95% <95% 99% 97% <97% Acute Chemical Health 97% 95% <95% 99% 97% <97% Chronic Chemical Health 95% 93% <93% 97% 95% <95% Operational 93% 90% <90% 95% 93% <93% Aesthetic 93% 90% <90% 95% 93% <93%
68 66 ANNUAL 1.0 PG PG 9-17 ORGANISATIONAL 3.0 PG MINISTER S FOREWORD 4.0 PG ACCOUNTING AUTHORITY S 5.0 PG CHIEF EXECUTIVE S 6.0 PG CORPORATE GOVERNANCE 7.0 PG STAKEHOLDER UNDERSTANDING AND SUPPORT Overall compliance of bulk potable water supply systems was excellent for the reporting period. Compliance per SANS 241:2015 risk category is shown in Figure 9.1 and the more detailed potable water quality compliance per water supply system is shown in Table 9.1. Figure 9.1: Bulk Systems Potable Water Quality Compliance (%) with SANS Acute Microbiological Health Acute Chemical Health Chronic Chemical Health Operational Aesthetic Table 9.1: Potable Water Quality Compliance (%) with SANS 241:2015 Per Water Supply System WATER SUPPLY SYSTEM AVERAGE DAILY VOLUME TREATED (ML/D) % VOLUME PER CENT COMPLIANCE WITH SANS 241:2015 ACUTE MICROBIOLOGICAL HEALTH ACUTE CHEMICAL HEALTH CHRONIC CHEMICAL HEALTH OPERATIONAL AESTHETIC 1 Durban Heights Wiggins Midmar DV Harris Amanzimtoti Hazelmere Maphumulo Umzinto Mvoti Mtwalume Mpofana Mhlabatshane Maphephethwa Ixopo Appelsbosch Rosetta Lidgetton Compliance per System Sixteen (16) bulk water supply systems complied with the excellent requirements for all risk categories specified in SANS 241:2015 Drinking Water Specification. The Lidgetton system reported excellent compliance, except for the operational risk category which was classified as good.
69 8.0 PG PERFORMANCE AGAINST SHAREHOLDER COMPACT 9.0 PG CREATING VALUE 10.0 PG CONSERVING OUR NATURAL RESOURCES 11.0 PG ENABLING OUR PEOPLE 12.0 PG IMPROVING RESILIENCY 13.0 PG FINANCIAL SUSTAINABILITY 14.0 PG GRI CONTENT INDEX 67 ANNUAL Wastewater Quality Performance Table 9.2 shows bulk wastewater quality compliance per system, assessed against the relevant licence or General Authorisation General Limits prescribed by the Department of Water and Sanitation (DWS). Table 9.2: Wastewater Compliance Per Treatment Works WASTEWATER TREATMENT WORKS SYSTEM VOLUME (ML/D) VOLUME (%) TARGET 2017 ACTUAL 1 Darvill % 87% 78% 85% 82% 80% 72% 2 Mpofana % % 60% 72% 3 Howick % 83% 87% 87% 89% 85% 86% 4 Richmond % % 85% 87% 5 Cool Air % % 85% 98% 6 Ixopo % 88% 95% 96% 93% 85% 94% 7 Lynnfield Park % - 66% 87% 86% 85% 96% 8 Camperdown % % 85% 97% 9 Applesbosch % % 85% 91% Bulk Wastewater Supply Systems Overall effluent compliance for the reporting period was 79%. One works, Darvill WWTW, did not meet the set target, achieving 72.4% against the target of 80% (7.6% variance). The completion of the works upgrade project, which is significantly advanced, will increase capacity and enable compliance to be improved. The proposed wetland, for detention of some storm dam spills, will also have a significant benefit once completed. The non-compliance recorded for Darvill WWTW was mainly due to process overloading, accentuated by the following: Figure 9.2: Bulk Wastewater Water Quality Compliance (%) > Power outages and construction related activities; > The intermittent spilling of the storm dam in particular caused E. coli failures; > Sludge related problems resulted in elevated suspended solids, phosphate solubilisation and COD overloading; > Total chlorine non-compliances were due to the increase in dosage to improve disinfection, particularly, when the storm dam was spilling; and > Aluminium non-compliance remains a long term problem at the site due to industrial inputs
70 68 ANNUAL 1.0 PG PG 9-17 ORGANISATIONAL 3.0 PG MINISTER S FOREWORD 4.0 PG ACCOUNTING AUTHORITY S 5.0 PG CHIEF EXECUTIVE S 6.0 PG CORPORATE GOVERNANCE 7.0 PG STAKEHOLDER UNDERSTANDING AND SUPPORT 9.2 Customer Satisfaction Geographical Markets and Customers Umgeni Water has identified the following markets for growth of water services (water and wastewater) and water related services: 1. KwaZulu-Natal: for water services and other related activities. 2. South Africa: water services and other related activities on demand. 3. Rest of Africa: knowledge management, networking and responding to bi-lateral agreements between South Africa and other countries. Within KwaZulu-Natal bulk water, wastewater services and/or water related services will progressively be increased in customer areas, driven by the regionalisation timeframe: Bulk Provision and Infrastructure Assets The core bulk water and wastewater business is undertaken in a manner that most effectively serves customers and stakeholders. As part of the value chain function, raw water is carefully abstracted from dams, rivers and borehole sources and conveyed using both gravity and the most effective pumping options to bulk water treatment works, where it is treated to meet SANS 241 quality standards and distributed to customers. Equally, with regards to wastewater treatment, influent is received from municipal sewer systems, treated at bulk wastewater treatment works and effluent discharged back into receiving systems, mindful of the quality and potential impacts on receiving systems and potential for reuse. 1. ethekwini Metropolitan Municipality: 2. Msunduzi Local Municipality: 3. ilembe District Municipality: 4. umgungundlovu District Municipality: 5. Harry Gwala District Municipality: 6. Ugu District Municipality: 7. Newcastle Local Municipality: 8. Amajuba District Municipality: 9. umzinyathi District Municipality: 10. uthukela District Municipality: 11. umkhanyakude District Municipality: 12. umhlathuze District Municipality: 13. Zululand District Municipality: 14. King Cetshwayo District Municipality: Retain and grow and Product Development Retain and grow Consolidate and grow Consolidate and grow Market penetration (Demand driven) Market penetration (Demand driven) Market Development (Demand driven) Market Development (Demand driven) Market Development (Demand driven) Market Development (Demand driven) Market Development (Future KZN entity) Market Development (Future KZN entity) Market Development (Future KZN entity) Market Development (Future KZN entity) Umgeni Water s infrastructure assets in support of water business comprise: > Approximately kilometres of pipelines and sixty-seven (67) kilometres of tunnels; > Fourteen (14) impoundments; > Seventeen (17) water treatment works; and > Nine (9) wastewater treatment works. A total of 410 million cubic metres of potable water per annum (1 123 Ml/d) are currently supplied to customers (Figure 9.3) who serve a population of 6.7 million or 1.9 million households through reticulation networks. Treatment works capacities and utilisation are shown in Figure 9.4 (a) and (b) respectively. In the year, there were 10 of 365 (3%) supply days with unplanned supply disruptions that exceeded 24 hours. These occurred in 3 of the 17 supply systems. Supply was successfully restored in these systems and the customers were kept informed on progress with the identified interventions. An average of 0.03% of planned sales volumes was not supplied (99.97% supplied). Umgeni Water continues to engage regularly with its customers, in line with service level agreements. The entity treats bulk wastewater totalling 33 million cubic metres per annum (90 Ml/d). Wastewater treatment works capacities and utilisation are shown in Figure 9.4 (c) and (d) respectively.
71 8.0 PG PERFORMANCE AGAINST SHAREHOLDER COMPACT 9.0 PG CREATING VALUE 10.0 PG CONSERVING OUR NATURAL RESOURCES 11.0 PG ENABLING OUR PEOPLE 12.0 PG IMPROVING RESILIENCY 13.0 PG FINANCIAL SUSTAINABILITY 14.0 PG GRI CONTENT INDEX 69 ANNUAL Figure 9.3: Customer Volumes Supplied (million m 3 ) Bulk Supply Agreements Bulk Supply Agreements are concluded to cover obligations of both Umgeni Water and its customers in relation to water volumes, water quality, supply pressure, service interruption intervals, metering, tariff consultation, assurance of supply and capital infrastructure plans. Water demand projections are updated based on trends in historical water sales volumes and customer demand trends. In parallel, analyses of Umgeni Water s bulk infrastructure and water works capacity in relation to demands highlight any infrastructure supply constraints or limitations on future growth that need to be responded to. Figure 9.4 (a): WTW Capacity (Ml/d) Durban Heights, 614 Ixopo, 3.2 Wiggins, 350 Maphumulo, 6 Midmar, 250 Mhlabatshane, 4 DV Harris, 110 Mpofana, 7 Hazelmere, 75 Rosetta, 0.6 Amanzimtoti, 24 Lidgetton, 0.5 Mvoti, 14.5 Mzinto, 12 Appelsbosch, 1.2 Maphephethwa, 4 Mtwalume, 7.5 Figure 9.4 (b): WTW % Utilisation 143% 140% 120% 85% 75% 73% 98% 74% 85% 80% 90% 105% 95% 100% 88% 91% 81% 36% 0% Durban Heights Wiggins Midmar DV Harris Hazelmere Amanzimtoti Mvoti Mzinto Mtwalume Maphumulo Maphephethwa Ixopo Mhlabatshane Mpofana Rosetta Lidgetton Appelsbosch
72 70 ANNUAL 1.0 PG PG 9-17 ORGANISATIONAL 3.0 PG MINISTER S FOREWORD 4.0 PG ACCOUNTING AUTHORITY S 5.0 PG CHIEF EXECUTIVE S 6.0 PG CORPORATE GOVERNANCE 7.0 PG STAKEHOLDER UNDERSTANDING AND SUPPORT Figure 9.4 (c): WWTW Design Capacity (Ml/d) Darvill, 75 Howick, 6.8 Ixopo, 1.0 Lynnfield Park, 0.2 Richmond, 2 Cool Air, 1.5 Mpofana, 5 Camperdown, 0.5 Appelsbosch, 0.5 Figure 9.4 (d): WWTW % Utilisation 214% 85% 97% 82% 80% 94% 55% 26% 34% 20% 0% Darvill Howick Ixopo Lynnfield Park Richmond Cool Air Mpofana Camperdown Appelsbosch Supply Capacity and Constraints Several works, as shown in Figures 9.4 (b&d) are currently operated above their design capacity to meet demands or needs and both long and short-term interventions are in place to address these, including major works capital upgrades, refurbishments, pipeline developments, utilisation of package plants as an interim measure and general operational and process upgrades to alleviate bottlenecks. Operational Performance and Service Planning Umgeni Water meets with all customers on a formal basis during the year to assess performance as per the signed customer bulk supply agreements. Customer requirements were significantly met in relation to supply volumes, supply pressure, service levels and metering. Structured consultation for communication of future demands, infrastructure plans and tariff assumptions took place, and robust customer inputs received. In the past year, additional engagements focussed on implementation of emergency interventions to alleviate constraints caused by the drought, agreements on water restrictions that needed to be imposed and collaborative engagement of end users regarding judicious use of water supplies. Conceptual plans for growth and expansion of water services and provision of universal access have been developed, for existing and new customers in KwaZulu-Natal (KZN). The growth plans were further refined in the reporting period. Discussion and communication with customers and stakeholders regarding these, notably implementation priorities and funding and financing will become the focus over the next few years. Customer engagement and consultation is core to Umgeni Water successfully extending access to unserved areas in KZN.
73 8.0 PG PERFORMANCE AGAINST SHAREHOLDER COMPACT 9.0 PG CREATING VALUE 10.0 PG CONSERVING OUR NATURAL RESOURCES 11.0 PG ENABLING OUR PEOPLE 12.0 PG IMPROVING RESILIENCY 13.0 PG FINANCIAL SUSTAINABILITY 14.0 PG GRI CONTENT INDEX 71 ANNUAL Support to Rural Municipalities Umgeni Water provides support to vulnerable customers to implement projects that aim to improve service delivery. In the past year, support was provided to the following customers: > Alfred Nzo District Municipality for water quality monitoring. > Ugu District Municipality for water quality monitoring. > Msunduzi Local Municipality for water quality analysis. > umgungundlovu District Municipality for water quality sampling, analysis and meter reading. Drought Management In the past year, rainfall received in the catchment area was mostly average or below-average and insufficient to improve the storage, notably of the Mgeni System, to target-sustainable levels. The latest data on the status of El Niño or La Niña shows an inconsistent trend and it is inconclusive as to which event is likely to take place in the next summer season. With rainfall forecasts being inconclusive, restrictions and curtailments are still required and a 15% restriction is continuing to be imposed on all domestic, commercial and industrial consumers for the Mgeni System. Umgeni Water continued to work with customers and communities affected by the water shortages to mitigate supply constraints. Drought management initiatives have included the facilitation of Mgeni System Drought Joint Operating Committee and imposition of daily water rationing from the water treatment works that supply the system. Close monitoring of the water resources - dam storage, abstractions and demand patterns will continue with mitigation measures implemented where necessary. Support to Harry Gwala District Municipality Water Resource constraints were experienced in the Ixopo System as a result of the drought. An emergency scheme was developed to transfer water from the St. Isidore Dam to Home Farm Dam to mitigate low levels in the dam. In addition, a 50% restriction was applied to all demand nodes that received water from the Ixopo Water Treatment Plant. As a result of these initiatives being implemented, the water supply to the town was constantly maintained and restrictions were eventually lifted in November Home Farm Dam reached full supply capacity at the beginning of Support to uthukela District Municipality Condition assessments of water and wastewater infrastructure were completed during the reporting period. Work advanced on development of proposals for operation and maintenance of schemes in discussion with the municipality. Asset Condition, Maintenance and Management Regular maintenance and inspection of all assets were undertaken during the reporting period as an intrinsic part of continued operations management. Maintenance is implemented in accordance with the asset management strategy and implementation plan for the year. This comprises planned maintenance - inclusive of preventative maintenance, repairs, redesign and modifications - complemented by on-going unplanned, reactive and corrective maintenance. Assessments of the condition of assets remain a vital part of determining the useful life and future investments required to maintain the level of service to customers. In the year, the total asset maintenance spend was 190 million (Figure 9.5 (a)). Over the years, Umgeni Water has continued to maintain its assets and on average invests 7.0% of its revenue on asset maintenance. Based on assessments conducted over the past year, there are no assets that pose significant risk to supply and the organisation envisages no major interruptions to its business over the next five years and beyond. Figure 9.5 (a): Maintenance Spend (Rm) * restated - capitalised maintenance included in CAPEX spend Figure 9.5 (b): Maintenance (%) 7.95% 4.40% 7.17% 3.96% 8.52% 3.42% 7.04% 2.39% Maintenance as a per cent of Revenue Maintenance as a per cent of PPE * % 2.45% * 2017
74 72 ANNUAL 1.0 PG PG 9-17 ORGANISATIONAL 3.0 PG MINISTER S FOREWORD 4.0 PG ACCOUNTING AUTHORITY S 5.0 PG CHIEF EXECUTIVE S 6.0 PG CORPORATE GOVERNANCE 7.0 PG STAKEHOLDER UNDERSTANDING AND SUPPORT 9.3 Infrastructure Stability Management Approach Infrastructure stability is continually assessed at Umgeni Water and informs infrastructure planning and development. This includes assessment of the capacity and condition of existing infrastructure to meet current and future needs, consistent with customer service and statutory-supported service levels, acceptable risk levels, anticipated growth and to ensure long-term system reliability goals are met. Infrastructure developments therefore comprise: > Infrastructure upgrades and rehabilitation to continue to achieve product quality and a sustainable supply to customers; Status of water access in supply area Overall access to piped (tap) water, inside the dwelling/house/ yard, is approximately 70% of the total number of people with access to water (Community Survey 2016). There are many areas that are still outside Umgeni Water s bulk water infrastructure supply footprint that receive no water from schemes. Access categories are shown in Figure 9.6 (a) (Community Survey 2016). In addition, components of the served areas that are characterised by small schemes have been found to be unsustainable. Figure 9.6 (a): Main Source of Water for Drinking - UW Operational Area (Community Survey 2016) > Infrastructure development for expansion and growth to new areas and to serve unmet needs; and > Infrastructure development and expansion to supply rural areas and municipalities to reduce backlogs and increase community sustainability. In implementing infrastructure, Umgeni Water uses local labour as its preferred work force to facilitate skills transfer and economic support to local communities. Umgeni Water further ensures there is meaningful B-BBEE through its policies, which drive provision of meaningful economic opportunities to targeted enterprises. All bulk water infrastructure developments are undertaken in an environmentally sustainable manner. Appropriate projects are subjected to Environmental Impact Assessments during project planning, design, construction and commissioning phases and manifests in the development and implementation of sound Environmental Management Plans that are independently monitored and audited during implementation. Piped (tap) water inside the dwelling/house/yard (70%) Piped (tap) water outside yard (20%) Borehole/rain-water tank inside yard (1%) Other water sources outside yard (9%) Figure 9.6 (b): Main Source of Water for Drinking by WSA - UW Operational Area (Community Survey 2016) ethekwini MM 86% 12% 2% Msunduzi MM 93% 6% 1% umgungundlovu DM 57% 24% 2% 18% ilembe DM 40% 31% 2% 27% Ugu DM 29% 56% 2% 13% Harry Gwala DM 30% 33% 4% 33% Piped (tap) water inside the dwelling/house/yard Borehole/rain-water tank inside yard Piped (tap) water outside yard Other water sources outside yard
75 8.0 PG PERFORMANCE AGAINST SHAREHOLDER COMPACT 9.0 PG CREATING VALUE 10.0 PG CONSERVING OUR NATURAL RESOURCES 11.0 PG ENABLING OUR PEOPLE 12.0 PG IMPROVING RESILIENCY 13.0 PG FINANCIAL SUSTAINABILITY 14.0 PG GRI CONTENT INDEX 73 ANNUAL Figure 9.6 (c): Main Source of Water for Drinking by WSA - Rest of KZN (Community Survey 2016) umhlathuze LM 87% 6% 1% 6% Newcastle LM 94% 4% 1% Amajuba DM 66% 14% 2% 18% uthukela DM 49% 23% 2% 27% King Cetshwayo DM 46% 25% 2% 26% Zululand DM 47% 14% 3% 37% umzinyathi DM 34% 26% 3% 36% umkhanyakude DM 27% 21% 8% 44% Piped (tap) water inside the dwelling/house/yard Borehole/rain-water tank inside yard Piped (tap) water outside yard Other water sources outside yard Universal Access Plan Working closely with national and provincial stakeholders in KwaZulu-Natal, Umgeni Water completed the planned development of Universal Access Plans (UAPs) for all Water Services Authorities (WSAs) in KwaZulu-Natal. The output comprises conceptual plans for bulk water supply schemes developed to cover all of KZN. The plans reconcile backlogs and growth in demands with bulk infrastructure to meet the needs to 2045 planning horizon. Plans are being presented and discussed with customers and stakeholders to get further inputs that will drive implementation, funding and financing priorities.

 IMPLEMENTED AS AT 30 JUNE 2017 (Rm) 1 Mkhomazi Bulk Water Supply Augmentation ethekwini MM")
76 74 ANNUAL 1.0 PG PG 9-17 ORGANISATIONAL 3.0 PG MINISTER S FOREWORD 4.0 PG ACCOUNTING AUTHORITY S 5.0 PG CHIEF EXECUTIVE S 6.0 PG CORPORATE GOVERNANCE 7.0 PG STAKEHOLDER UNDERSTANDING AND SUPPORT Current bulk infrastructure and supply footprint and the status of bulk infrastructure implemented in the reporting period is shown in Figure 9.7. Figure 9.7: Umgeni Water Current Bulk Supply Footprint and Status of Bulk Infrastructure Implemented in Table 9.3: Major Projects Implemented in PROJECT NAME OBJECTIVE MAJOR CUSTOMER TOTAL PROJECT BUDGET (Rm) IMPLEMENTED AS AT 30 JUNE 2017 (Rm) 1 Mkhomazi Bulk Water Supply Augmentation ethekwini MM umgungundlovu DM Lower umkhomazi Bulk Water Supply Scheme Rural Development ethekwini MM, Ugu DM WTW WTW 3 Lower Thukela BWSS Phase1 Rural Development ilembe DM Darvill Wastewater Treatment Works Upgrade Upgrade Msunduzi LM umshwathi Bulk Water Supply Scheme (Wartburg Phases 1-3) Rural Development umgungundlovu DM, ilembe DM Bulwer 6 Durban Heights WTW - Various Projects 7 Greater Mpofana Bulk Water Supply Scheme Phase 1 Upgrade ethekwini MM Rural Development umgungundlovu DM PS PS PS 8 Midmar WTW Upgrade ( Ml/d) - New Raw Water Pipeline and Pump Station Augmentation umgungundlovu DM, ethekwini MM and Msunduzi LM Mpophomeni Wastewater Treatment Works Expansion umgungundlovu DM Mhlabatshane Sub-Regional Scheme Phase 2 Mzimkhulu River Abstraction Rural Development Ugu DM South Coast Phase 2b Kelso to Umdoni Expansion Ugu DM Elysium Desalination Plant Augmentation Ugu DM Wartburg to Bruyns Hill Pipeline Augmentation umgungundlovu DM Wiggins WTW - Various Projects Upgrade ethekwini MM Nungwane Raw Water Aqueduct (450dia x 18km) Rehabilitation Ugu DM and ethekwini DM Kokstad PS N NW NE Umgeni Water Infrastructure Map W E SW S SE


77 8.0 PG PERFORMANCE AGAINST SHAREHOLDER COMPACT 9.0 PG CREATING VALUE 10.0 PG CONSERVING OUR NATURAL RESOURCES 11.0 PG ENABLING OUR PEOPLE 12.0 PG IMPROVING RESILIENCY 13.0 PG FINANCIAL SUSTAINABILITY 14.0 PG GRI CONTENT INDEX 75 ANNUAL PS 7 Mooi River umgungundlovu WSA Howick 9 PS8 PS PS PS PS Msunduzi WSA 4 PS PS PS PS 13 5 Wartburg Ndwedwe Maphumulo PS PS PS PS PS PS PS PS PS PS PS PS PS PS ilembe WSA PS PS uthongati Ballito 3 WTW KwaDukuza umvoti Mandeni uthukela 1 Richmond WTW PS ethekwini WSA 6 PS 14 umgeni Durban 15 umlazi MAJOR CAPEX PROJECTS STATUS Construction Design Feasibilty WTW 10 Ixopo Harry Gwala WSA PS PS PS PS PS SS Ugu WSA PS PS PS 2 PS WTW PS PS PSPS P PS PS 12 umzumbe Port Shepstone umzimkhulu 11 umzinto Pennington umthwalume umkhomazi Indian Ocean EXISTING INSTALLATIONS PS FOOTPRINTS Pumpstation Reservoirs Water Treatment Works Wastewater Works Tunnels Pipelines Dams FUTURE INSTALLATIONS & UPGRADES PS Pumpstation Reservoirs Water Treatment Works Wastewater Works Tunnels Pipelines Dams Footprint areas currently supplied by UW Bulk Infrastructure Footprint areas supplied by WSA Footprint areas that will be supplied by UW s proposed projects umtamvuma
78 76 ANNUAL 1.0 PG PG 9-17 ORGANISATIONAL 3.0 PG MINISTER S FOREWORD 4.0 PG ACCOUNTING AUTHORITY S 5.0 PG CHIEF EXECUTIVE S 6.0 PG CORPORATE GOVERNANCE 7.0 PG STAKEHOLDER UNDERSTANDING AND SUPPORT Performance with Capital Infrastructure plan Significant progress with capital infrastructure implementation was achieved during the reporting period. Spend performance for the year was R1 163 million. Of this, R503 million (43%) went towards projects for rural development. Overall, 72% of target water infrastructure project milestones were met. Key projects implemented are shown in Table 9.3. In addition, the Supply Chain Management (SCM) process, specifically the turnaround time of CAPEX programme tenders continued to be monitored during the reporting period. Umgeni Water will continue to streamline its processes and introduce more robust systems to improve turnaround. Figure 9.8: Capital Infrastructure Implemented (Parent) (Rm) Customers targeted and progress with key bulk infrastructure developments > Lower Thukela BWSS Serves ilembe District Municipality and ethekwini Metropolitan Municipality, along the coastal strip from north of Durban to the uthukela River. The infrastructure development comprises an abstraction works, pump station and weir on the uthukela River, water treatment works and potable water pipelines to deliver 55 Ml/d in Phase 1. The WTW is upgradable to deliver 110 Ml/d in Phase 2. > The weir was completed during 2014/ Rural Development Upgrade, Rehabilitation, Augmentation, Expansion Equipment, Vehicles, ICT and other Movables Total CAPEX (Rm) > In 2015/2016 construction of Access Roads, the Weir and Abstraction Works, Gravity main, Water Treatment Works civil works, Command Reservoir, Rising main and power supply were completed. > Mechanical, Electrical and Instrumental works were completed in and the scheme was commissioned. Snag items are being addressed during the defects liability period. > Darvill WWTW Capacity Increase Serves The Msunduzi Local Municipality. Upgrade of plant capacity from 65 Ml/d to 100 Ml/d. The new or additional components include an inlet works, primary and secondary settling tanks, pumps and pump station, reactor, chlorination house and anaerobic digesters, amongst other components. > Construction of WWTW upgrade was in progress during 2015/2016. > Completion scheduled mid-way in 2017/2018. > umshwathi RBWSS Serves umgungundlovu District Municipality and ilembe District Municipality. > Phase 1: 27 km pipeline from Claridge to Wartburg. Design completed in 2012/2013. Construction was completed mid 2015/2016. > Phase 2: 17 km pipeline from Wartburg to Dalton, booster pump stations, an 8 Ml reservoir at Wartburg and a 10 Ml reservoir at Dalton. Design completed in 2013/2014. Construction will be completed mid 2017/2018. > Phase 3.2: 29 km pipeline from Dalton to Efaye via Fawn Leas and a booster pump station Design completed in 2013/2014. Construction will be completed mid 2017/2018. > Phase 3.3b: 18 km pipeline from the Fawn Leas to Ozwathini pipeline. Construction will be completed mid 2017/2018. > Phase 3.3c: 12 Ml reservoir at Ozwathini construction phase planned. Construction expected to be completed mid 2018/2019. > Wartburg to Bruynshill Pipeline and the pump station umgungundlovu District Municipality. The construction of the potable water pipeline entails the 10.5 km pipe with associated works; and the construction of the pump station. > Construction of the potable water pipeline and pump station is in progress. > Full construction will be completed by end of March > Midmar Raw Water Pipeline Augmentation, Raw Water Pump Station and WTW Upgrade Serves ethekwini Metropolitan Municipality, umgungundlovu District Municipality and the Msunduzi Local Municipality. The construction of the raw water pipeline entails the pipeline with associated works. Upgrade of plant capacity from 250 Ml/d to 375 Ml/d. > Construction of Duplicate Raw Water pipeline has been completed during. > Construction of WTW upgrade was in progress during. > Completion will be achieved mid-way in 2017/2018.
79 8.0 PG PERFORMANCE AGAINST SHAREHOLDER COMPACT 9.0 PG CREATING VALUE 10.0 PG CONSERVING OUR NATURAL RESOURCES 11.0 PG ENABLING OUR PEOPLE 12.0 PG IMPROVING RESILIENCY 13.0 PG FINANCIAL SUSTAINABILITY 14.0 PG GRI CONTENT INDEX 77 ANNUAL > Wiggins Ozone Plant Replacement > Detail Design and Construction of the Wiggins Ozone Upgrade: In Progress. > Completion expected end of March > Mpophomeni WWTW Serves umgungundlovu District Municipality and umngeni Local Municipality. The infrastructure development comprises a 6 Ml/d Wastewater Treatment Works and a 6 km bulk sewer outfall pipeline. > The preliminary design of the works is complete and design for sewer outfall scheduled for 2017/2018. > Following this the project will move to construction phase that is planned for completion by 2020/2021. > Trustfeeds WWTW Serves umgungundlovu District Municipality and ilembe District Municipality. The infrastructure development comprises a 1 Ml/d Wastewater Treatment works, 4.5 km bulk sewer outfall pipeline and a 1.5 km gravel access road. > Planning and design were complete at the end of. > Construction of the bulk sewer and gravel access road will be completed in 2017/2018. > Construction of the Wastewater Treatment works will be completed in 2019/2020. > Elysium Desalination Plant Serves Umdoni Local Municipality within the Ugu District Municipality and is planned to supplement the potable water supply produced by the Mtwalume Water Treatment Plant which provides potable water access for over inhabitants in Bazley, Elysium, Ifafa, parts of Kelso and umtwalume along the coast and inland rural areas of Mathulini and kwaqologolo. The Elysium Desalination Plant is a greenfield development that is in the planning stage. The proposed works will supply between 2.5 to 10 Ml/d to augment the Mtwalume Water Treatment Works. > Mhlabatshane BWSS (Phase 2) Mzimkhulu River Abstraction Serves Ugu District Municipality and will reach and provide potable water access for over inhabitants in ten tribal authority areas: Bhekani, Nhlangwini (west), KwaCele 1, Hlubi, Mabhaleni (west), KwaCeleK, Frankland, Qwabe P, Shabeni, and KwaMadladla. The bulk infrastructure will comprise of an abstraction works on the Mzimkhulu River, pump station and pipeline to deliver water to the Mhlabatshane WTW, and upgrade of the Water Treatment Works from 4 Ml/d to 8 Ml/d. > Phase 1 - commissioning of the Bulk Water Supply Scheme - was completed in 2014/2015. > Planning of Phase 2 is now complete and the project has progressed to the detailed design stage for implementation thereafter. > Maphumulo BWSS Serves ilembe District Municipality, which includes KwaMaphumulo, Ndwedwe, and KwaDukuza Local Municipalities, and will serve people in Maqumbi, Ashville, Maphumulo, Masibambisane, KwaSizabantu and Ngcebo supply areas. Phase 1 comprises imvutshane River abstraction, 6 Ml/d WTW, potable water pipelines, booster pump stations and reservoirs. Phase 2 comprises construction of the imvutshane Dam. > Phase 1 was commissioned in 2012/2013. > Phase 2, the construction of imvutshane Dam was completed in 2014/2015. > Phase 3, the appointment of engineering design consultant for the upgrade of WTW, to 12 Ml/d, detailed planning for the upgrade of the raw water and booster pump stations and relocation of a package plant from Hazelmere WTW to Maphumulo WTW, were completed during 2015/2016. > Phase 4, the inter-basin transfer from the Hlimbitwa River into imvutshane Dam, detailed feasibility investigation, which entails the Hlimbitwa River weir location and transfer infrastructure, commenced in 2015/2016. > South Coast Pipeline Phase 2B Serves Ugu District Municipality mid-south coast area, which includes Pennington, Kelso, Malangeni and Shayamoya. The pipeline is designed to supply 16.7 Ml/d of which 10 Ml/d will supply the Hibberdene area, under a different phase of the South Coast Pipeline. > Phase 2B comprises an 800 mm diameter 8.1 km steel pipeline from Scottburgh South to Pennington and a further 0.7 km 355 mm diameter pipeline to Malangeni Reservoir. > The project is currently at procurement stage with signing of construction contracts expected by end of November > Construction is scheduled to commence in January 2018 and completion by December > Greater Mpofana BWSS Serves umgungundlovu District Municipality. > Rosetta Water Treatment Works (WTW): Construction of 20 Ml/d Rosetta Water Treatment Works at Rosetta adjacent to the newly constructed Spring Grove Dam. Design completed in Construction started in 1 August 2016, the planned completion date is October > Reservoirs: Construction of 5 Ml/d and 12 Ml/d reservoirs feeding Nottingham Road and Bruntville reservoirs respectively were completed in July Commissioning of these reservoirs is in progress. > Nottingham Road Pipeline: The construction of an 8 km 650 mm diameter steel pipeline from Rosetta WTW to the newly constructed Nottingham Road Reservoir. The construction of this pipeline was completed in June 2016.
80 78 ANNUAL 1.0 PG PG 9-17 ORGANISATIONAL 3.0 PG MINISTER S FOREWORD 4.0 PG ACCOUNTING AUTHORITY S 5.0 PG CHIEF EXECUTIVE S 6.0 PG CORPORATE GOVERNANCE 7.0 PG STAKEHOLDER UNDERSTANDING AND SUPPORT > Bruntville Pipeline: The Construction of a 13 km 650 mm diameter steel pipeline from Rosetta WTW to Bruntville Reservoir, all pipes have been procured and delivered to site. The signing of the contract for the appointment of the pipelay contractor is nearing completion. Construction is scheduled to start in September 2016 and the anticipated completion date is November > umkhomazi Water Project Serves ethekwini Metropolitan Municipality. The umwp-1 includes the Smithfield Dam on the umkhomazi River, a raw water tunnel from Smithfield Dam to the Baynesfield region, the Langa Balancing Dam at Baynesfield, a raw water pipeline from the tunnel outlet to a water treatment works (WTW) at Baynesfield, potable water reservoir at Baynesfield and a potable water pipeline from Baynesfield to Umlaas Road where it would tie into Umgeni Water s existing 57 Pipeline. The detailed feasibility studies for the umwp-1 are presently being undertaken in the following module: > Module 1 Raw Water Module by DWS. > Module 2 Environmental Impact Assessment by DWS and UW. > Module 3 Potable Water Module by UW. > Phase 2 of the umwp (umwp-2) will include the Impendle Dam located upstream of the Smithfield Dam on the umkhomazi River, a second raw water tunnel and raw water pipeline, an increase in WTW capacity and potable water storage and a second potable water pipeline. > Lower umkhomazi BWSS Serves the etthekwini Metropolitan Municipality and Ugu District Municipality. The Lower umkhomazi Bulk Water Supply System (LUBWSS) is the recommended augmentation option for the existing Upper and Middle South Coast Supply area, which is currently supplied by water from local rivers and dams and augmented by the Mgeni System. The planned supply area to be augmented by the LUBWSS, are the coastal areas of ethekwini and Ugu Municipalities from Amanzimtoti to Hibberdene connected to the South Coast Pipeline. > Ngwadini Abstraction Works, Ngwadini Dam, Goodenough Abstraction Works including pipelines, high lift raw water pump stations and raw water reservoir: Detail Feasibility and Preliminary design were completed by September 2016 and the detail design planned completion date is August > Water Treatment Plant (100 Ml/d upgradable to 150 Ml/d) and reservoir near Quarry including portable water pipeline: the detail design planned completion date is September 2018 and the commissioning is planned for August > The detailed feasibility and preliminary design of the preferred scheme has been completed and project will move into detailed design stage. > Nungwane Raw Water Aqueduct Serves ethekwini Metropolitan Municipality, along the coastal strip from South of Durban to upper South Coast. The construction of the raw water pipeline entails the 13.5 km 450 mm diameter pipeline with associated works from Nungwane Dam to Amanzimtoti Water Treatment Works. > Construction of the Nungwane Raw water pipeline will continue during 2017/2018. > Completion expected by March Economic Empowerment Management Approach Umgeni Water s approach to empowerment is guided by enabling legislation, including the Constitution of South Africa, the Preferential Procurement Policy Framework Act and Regulations and the Broad-Based Black Economic Empowerment Act. A focussed approach is followed, including: > Facilitating access of B-BBEE compliant suppliers to the entity s procurement activities; > Ensuring that previously disadvantaged individuals achieve full participation and involvement in businesses that support Umgeni Water in the supply of water services; > Developing or establishing new, sustainable business with black entrepreneurs, through the procurement process; > Encouraging establishment of value adding joint ventures between traditional and emerging suppliers, giving the latter access to technology, skills and knowledge; and > Contributing to skills development and job creation through the employment of targeted labour. Contract Participation Goals Umgeni Water continued to implement its B-BBEE initiatives through the continued implementation of Contract Participation Goals (CPGs). CPGs facilitate meaningful economic opportunities to targeted enterprises by requiring tenderers to allocate a certain percentage of the scope of work and value to targeted enterprises. Performance with Contract Participation Goals (CPG) Targets in CPG targets set for were 35% for construction contracts and professional services projects (and 14% for Black Women-Owned Businesses).
81 8.0 PG PERFORMANCE AGAINST SHAREHOLDER COMPACT 9.0 PG CREATING VALUE 10.0 PG CONSERVING OUR NATURAL RESOURCES 11.0 PG ENABLING OUR PEOPLE 12.0 PG IMPROVING RESILIENCY 13.0 PG FINANCIAL SUSTAINABILITY 14.0 PG GRI CONTENT INDEX 79 ANNUAL Thirty-six (36) contracts were awarded during the 12-month reporting period to 30 June An average of 36% CPG was achieved with a total CPG award value of R148.8 million. Of the total CPG R41.1 million (28%) was awarded to Black Women-Owned businesses. R2.2 billion worth of contracts has been awarded to Black Owned Businesses since the start of the CPG initiative in The entity strives for continuous improvement and is in the process of improving its systems for the implementation of CPGs to improve alignment with regulatory amendments and strategy. Figure 9.9: Contract Participation Goals (Rm) % for the reporting period was achieved. The calculation of this percentage is based on the B-BBEE levels of the companies that have been awarded work by Umgeni Water, which includes other SOEs. If the spend with non-discretionary spend is excluded, the B-BBEE spend recognition level exceeds 100%. Seven (7) new entrants were added to the database, of which, five (5) have been awarded work. Monitoring B-BBEE/CPG implementation at Umgeni Water Monitoring B-BBEE / CPG implementation of awarded contracts is undertaken in order to confirm that: > Contractors are engaging the targeted enterprises as per contracts; > Targeted enterprises are performing the scope as per contract; and > Payments due to targeted enterprises are processed at the correct rates and at agreed timeframes CPG awarded (Rm) B-BBEE Spend Performance Companies have been classified and registered on a supplier database, according to their progress in achieving Broad-Based Black Economic Empowerment. The B-BBEE spend target of Skills Development and Job Creation Infrastructure construction jobs are targeted at the poorest members of society and employs unskilled workers. These temporary jobs enable skills to be developed and utilised at a local community level and result in a meaningful flow of income to these communities. In the reporting period, Umgeni Water created a total of temporary jobs through its CAPEX Programme. A total of R27.7m (R39.7 million in 2016) was paid in wages to local labour. Figure 9.10: CAPEX Jobs CAPEX Jobs Wages Paid (Rm)
82 80 ANNUAL 1.0 PG PG 9-17 ORGANISATIONAL 3.0 PG MINISTER S FOREWORD 4.0 PG ACCOUNTING AUTHORITY S 5.0 PG CHIEF EXECUTIVE S 6.0 PG CORPORATE GOVERNANCE 7.0 PG STAKEHOLDER UNDERSTANDING AND SUPPORT 9.5 Community Outreach and Corporate Social Investment (CSI) Management Approach The entity s Corporate Social Investment (CSI) programme supports socio-economic development initiatives to improve community livelihoods and is driven through an approved CSI Policy. This ensures a co-ordinated approach in implementation of CSI initiatives, which are clustered and prioritised in terms of the following categories: > Education and Training; > Job Creation; > Public Health, Community Development and Support; > Environmental Conservation; and > Arts, culture and sport. Umgeni Water also strives to help create a society that is aware of water as a finite and scarce resource. To this end the entity develops and implements integrated water education and awareness programmes that drive home key water concepts to influence behavioural change. Education and awareness programmes strive to instil sound values that will complement and ensure long-term sustainability of the water services that are provided. Programme content and themes are regularly reviewed to assess suitability and address current issues facing the region. Content targeted includes, the water cycle and source-tap-source view of the water value chain, water use, water treatment, water conservation, water quality, sanitation and the water, health and environment nexus. In the reporting period 136 water classroom lessons were delivered from these sites reaching seventy-seven (77) institutions and participants. Schools and Community Outreach Programmes: The Schools Outreach Programme in the year ensured that learners who could not access Umgeni Water s facilities were reached through presentations made at schools, through roadshows and campaigns undertaken during special day events. In the reporting year, the entity continued to raise awareness on water scarcity and the importance of water conservation. Drought and water conservation campaigns were part of Umgeni Water s community outreach programmes, rolled out at various platforms and communities. Other Educational Programmes implemented in the year include: > Over twenty (20) events commemorating National Arbour Day and Water Week events at more than fifty (50) schools, reaching over learners; > Facilitation of the MiniSASS programme, a river health programme initiative, for schools in the Mpophomeni area, Howick (National Water Week); > World Wetland Week Exhibitions at all adopted schools and at Edendale Mall, Pietermaritzburg reaching over 200 participants; > A Careers Expo for high schools in the Edendale area, Pietermaritzburg; > A dam safety awareness campaign conducted at Henley Dam in Msunduzi Local Municipality targeting schools and communities living near the dam; > A river clean-up campaign at umzinto in collaboration with Ugu District Municipality; and > A beach clean-up at Blythedale Beach with local schools and community during International Coastal Clean-up Day. Programmes target rural and urban-based schools and communities and a wide range of learner levels. Suitable educational materials and mechanisms to facilitate communication are identified and implemented often in partnership with other sector stakeholders. Water Education and Community Outreach Water, environment, health education and awareness were delivered through three (3) target programmes during the reporting period: > On site water classrooms programme; > Adopt-A-School Programme; and > Schools and Community Outreach Programmes. Onsite Water Classrooms Programme: The water classroom programmes provide learning opportunities for learners of all age groups. Umgeni Water impacts knowledge of the water purification process and environmental issues impacting these processes. Umgeni Water has three (3) accessible water education classroom facilities at major water and wastewater treatment works, namely at Durban Heights WTW, Howick WWTW and Midmar WTW. Water classroom presentations are followed by tours of the works where learners get to see the practicality of the treatment processes. Educator workshops on drought awareness were conducted for educators coming from twenty (20) rural schools within ilembe District Municipality and ethekwini Metropolitan Municipality. Water scarcity and the importance of water conservation were emphasised across various water education platforms. Institutional and Social Development (ISD) Community engagement is also a critical success factor for successful implementation of capital infrastructure projects and is approached in a manner that ensures there is community contribution to resolution of issues affecting them. Each project presents unique issues or opportunities and required targeted interventions. Umgeni Water institutional and social development facilitators play a key role in this process. As a result of successful management of these engagements, a foundation of trust has been built with community stakeholders. Communities are also being continuously engaged on risks associated with servitude encroachments. Umgeni Water s experience is that all stakeholders are willing to work together in the interest of providing sustainable water supply access to communities.
83 8.0 PG PERFORMANCE AGAINST SHAREHOLDER COMPACT 9.0 PG CREATING VALUE 10.0 PG CONSERVING OUR NATURAL RESOURCES 11.0 PG ENABLING OUR PEOPLE 12.0 PG IMPROVING RESILIENCY 13.0 PG FINANCIAL SUSTAINABILITY 14.0 PG GRI CONTENT INDEX 81 ANNUAL During the reporting period successful negotiations were concluded for land access with the relevant traditional authorities and landowners for the Mshwathi, Nungwane and Vulindlela projects. Project awareness was conducted for communities directly impacted by the projects. The establishment of Project Steering Committees (PSC s) was critical in ensuring stability, community participation and inclusion in decision making. Umgeni Water worked well to address challenges experienced for the Mpofana Bulk Water Supply project by facilitating workshops with the community representatives. Umgeni Water provides employment to communities during construction. This process is managed by employment of a community liaison officer who works with the contractor to facilitate recruitment and selection of local labour in accordance with recruitment guidelines developed by Umgeni Water. Umgeni Water minimised negative impacts of projects by applying appropriate interventions and good labour practice. No major project stoppages were experienced during this reporting period and on-going positive relationships were maintained. Adopt-A-School Programme: Umgeni Water s adopt-aschool programme focuses on vulnerable schools that do not have proper access to water, sanitation and environmental education resources. Twenty (20) schools were adopted as part of this programme. Initiatives at the target schools comprise facilitating the development of school environmental management plans, creating linkages with relevant departments to facilitate development of library resource centres, creating food gardens and providing access to mainstream environmental programmes and competitions. Environmental Education materials were developed and distributed and conveyed the target themes including eradication of alien weeds, biodiversity, wetlands, water conservation, waste management and dam safety. Environmental Management action plans were developed and implemented in partnership with adopted schools, to foster environmental stewardship in communities. Corporate Social Investment (CSI) Programme Umgeni Water implemented the following Corporate Social Investment (CSI) programmes in the year: - Joseph Baynes Child and youth Care centre in Msunduzi Local Municipality, which received baby care products for over thirty (30) infants; - Melokuhle crèche in umgungudlovu District Municipality, which received play facilities; - Ekukhanyeni Primary School in ethekwini Metropolitan Municipality, which received school uniforms and appliances; - Slangspruit Primary School in Msunduzi Local Municipality which received school uniforms; - Zamimpilo Orphanage in umgungudlovu District Municipality which received food parcels and furniture; and - Eastwood Primary and neighbouring schools in Msunduzi Local Municipality, which received food parcels. > Public Health and Community development initiatives completed in the year included: - Inyaninga Primary School, for which funds were allocated towards refurbishment and electrification of three (3) classrooms and purchase of five (5) computers for the school s resource centre; - Sponsorship of a community centre to provide meals for over 200 school children a day residing in informal settlements in Umlazi U Section; - Rehabilitation of a local spring for irrigation of communal gardens in Willowfontein, Pietermaritzburg; and - Six (6) months supply of sanitary towels for over 200 girls distributed across eight (8) Umgeni Water Adopted Schools in Harry Gwala, ilembe, Ugu and umgungundlovu District Municipalities. > Youth empowerment initiative, included: - Assistance provided to a group of eight (8) youth to establish a cooperative and to gain skills in business management. The cooperative is progressively expanding its services in order to sustain itself in future. > Sports and Culture initiative, included: - Funds allocated towards development of twenty (20) young local canoeists of the Lembethe Canoe Club, Nagle Dam Area, to be used for the purchase of canoeing equipment and entrance fees to major canoeing competitions. CSI spend for these initiatives is shown in Figure Figure 9.11: CSI Projects Spend (R thousands) > Umgeni Water contributed towards social improvement projects in celebration of Mandela Day by contributing towards 360 charitable initiatives to commemorate the late president s social improvement ideologies. Multiple beneficiaries received sponsorship, namely: - Zamuthule Primary School in Mngeni Local Municipality, where three (3) classrooms were painted; - Ethembeni Place of Hope orphanage in Mngeni Local Municipality, where a vegetable garden was established and a meal for over seventy (70) children provided; Education & Training 406 Job Creation 350 Public Health, Community Development & Support 200 Arts, Culture & Sport 350 Environmental Conservation Planned Initiatives Reactive Initiatives


84 82 ANNUAL 1.0 PG PG 9-17 ORGANISATIONAL 3.0 PG MINISTER S FOREWORD 4.0 PG ACCOUNTING AUTHORITY S 5.0 PG CHIEF EXECUTIVE S 6.0 PG CORPORATE GOVERNANCE 7.0 PG STAKEHOLDER UNDERSTANDING AND SUPPORT participants in total were reached through 136 classes held at water treatment and wastewater treatment works NAGLE DAM
85 8.0 PG PERFORMANCE AGAINST SHAREHOLDER COMPACT 9.0 PG CREATING VALUE 10.0 PG CONSERVING OUR NATURAL RESOURCES 11.0 PG ENABLING OUR PEOPLE 12.0 PG IMPROVING RESILIENCY 13.0 PG FINANCIAL SUSTAINABILITY 14.0 PG GRI CONTENT INDEX 83 ANNUAL 10.0 Conserving our Natural Resources 10.1 Environmental Sustainability, including Water Resources Adequacy Management Approach Adequate supplies of raw water resources are paramount to Umgeni Water, which, together with reliable sources of energy, chemicals for water treatment and other resources are crucial for sustainability of the water business. The entity therefore is steadfast in protecting, conserving and efficiently using and sustaining these resources. Environmental management programmes and plans are embedded in all components of the water business lifecycle, namely, during planning, construction, operation and decommissioning. Umgeni Water has classified its environmental management programmes as Corporate, Operational or Integrated Environmental Management: > Corporate Environmental Management focuses on aligning the business activities to environmental sustainability and promoting a shift towards the state of a green economy. > Operational Environmental Management focuses on ensuring compliance with applicable environmental legislation and regulations and ensuring the entity avoids and or minimises environmental impacts from business activities. > Integrated Environmental Management focuses on identification, mitigation and implementation of management plans for potential environmental impacts associated with infrastructure developments. Umgeni Water, as a public water services entity in South Africa, complies with all mandatory environmental disclosure requirements. Notwithstanding this, the entity continues to improve alignment of environmental indicators with other national and internationally accepted indicator disclosure requirements, including the Global Reporting Initiative (GRI) and King III Report on Corporate Governance, in terms of materiality and relevance. Relevant aspects include: materials, including chemicals and water resources, energy efficiency, greenhouse gas emissions, carbon footprint mapping, biodiversity and waste management, amongst others. Water Resources Adequacy Umgeni Waters core business function is to treat and supply bulk potable water a business that is highly dependent on the availability of sustainable water resources. The reconciliation between water resource availability and water demand is therefore of primary importance to the entity and forms an integral part of the infrastructure planning process. Understanding what water resources are available to the entity, both current and future resources and what factors affect the assurance level of these resources, is crucial to balancing supply with customer demand and maintaining supply sustainability into the future. Umgeni Water sources water primarily from fourteen (14) impoundments (includes weir/run of river abstractions) on three (3) major water resource systems, namely, the Mgeni System (Mooi and Mgeni rivers), the North Coast System (umdloti, imvutshane, uthukela and umvoti rivers) and the South Coast System (Nungwane, Mzimayi, umuziwezinto and Mhlabatshane rivers). Total water withdrawal by source is shown in Figure 10.1.
86 84 ANNUAL 1.0 PG PG 9-17 ORGANISATIONAL 3.0 PG MINISTER S FOREWORD 4.0 PG ACCOUNTING AUTHORITY S 5.0 PG CHIEF EXECUTIVE S 6.0 PG CORPORATE GOVERNANCE 7.0 PG STAKEHOLDER UNDERSTANDING AND SUPPORT Figure 10.1: Water Withdrawal by Source (million m 3 ) Mooi-Mgeni System North Coast System Total Withdrawal Ixopo Dam South Coast System In the year, progress was made with the following water resource infrastructure developments: > imvutshane Dam (UW) was commissioned and reached full supply capacity in April > umkhomazi Water Project (DWS and UW) feasibility study is complete. > Hazelmere Dam raising (DWS) construction is in progress. > Construction of the Mshwathi Bulk Water Supply Scheme is under way and the first phase of the project should be commissioned in 2017/2018. > Lower Thukela Bulk Water Supply Scheme (UW) construction was completed in 2016 and commissioning of the plant took place in Supply to customers is planned to commence in 2017/2018. > Lower umkhomazi Bulk Water Supply Scheme (UW) feasibility study is complete. Detailed design to commence in 2017/2018. > East Coast Desalination Plant detailed feasibility study (completed in 2015). Climate Change and Water Resources The natural climate is the principal driver of water availability whether surface or groundwater. The impacts of potential climate change are therefore crucial to the business of Umgeni Water and need to inform infrastructure planning and design, particularly given the significant costs and long planning period required for major infrastructure investments such as dams, pipelines, structures, buildings and transport infrastructure. In alignment with the National Climate Change Response Strategy, the main response to climate change is coherent planning of water resources, as well as developing water resilience. Umgeni Water has largely been proactive in considering the potential impacts of climate change on water resources and has incorporated projections into its planning processes. The results of recent studies indicate that the majority of the climate models project an increase in runoff in the catchments along the east coast of South Africa. Most models show very high impacts, likely to be accompanied by significant increases in flooding risk, whilst a few models project an increase in dry conditions, likely to be accompanied by drought risk. Umgeni Water is planning to update the above study in 2017/2018 by investigating potential impacts of climate change on future water supply using outputs from recent Global Circulation Models (GCMs) as inputs to appropriate hydrological models. The project will use climate scenarios from the most recent IPCC (International Panel on Climate Change) accredited GCMS, including the World Climate Research Programme sponsored Coordinated Regional Climate Downscaling Experiment (CORDEX). Umgeni Water is piloting a reuse plant at its Darvill Wastewater Treatment Works. The 2 Ml/d direct reuse demonstration plant consists of a conventional water treatment works to provide high pressure wash water followed by an advanced treatment process plant. Umgeni Water has recently upgraded its Water Resources Decision Support System with improved functionality in terms of the data capture system, calculation and validation scripts as well as the dashboard manager. The project was completed in February 2017 and is the precursor to the development of a flood forecasting and early warning system which will be a partnership between Umgeni Water, the South African National Biodiversity Institute (SANBI) and umgungundlovu District Municipality. The project is aimed at developing an adaptation strategy to reduce the vulnerability and minimise the impacts of future flood events on the infrastructure and communities residing in close proximity to river systems within the municipality. The output, expected in 2019, will provide a real-time flood forecasting and early warning system to alert communities of impending flood events. Wastewater Reuse Umgeni Water is piloting a reuse plant at its Darvill Wastewater Treatment Works. The 2 Ml/d direct reuse demonstration plant consists of a conventional water treatment works to provide high pressure wash water followed by an advanced treatment process plant. Construction of the works was completed during the reporting period and is scheduled for commissioning early in 2018.
87 8.0 PG PERFORMANCE AGAINST SHAREHOLDER COMPACT 9.0 PG CREATING VALUE 10.0 PG CONSERVING OUR NATURAL RESOURCES 11.0 PG ENABLING OUR PEOPLE 12.0 PG IMPROVING RESILIENCY 13.0 PG FINANCIAL SUSTAINABILITY 14.0 PG GRI CONTENT INDEX 85 ANNUAL Raw Water Quality The status of raw water quality per supply source/catchment is shown in Table 10.1 and Figure Water quality risks associated with these supply resources arise from the presence of feedlots in some catchment areas, the presence of wastewater treatment works upstream of some impoundments, sewer reticulation problems in some towns and seasonal changes, (including rainfall/ storm events and impoundment stratification). Water quality variables associated with these include: algal blooms and aquatic weed problems associated with eutrophication, chemical contamination (including high concentrations of iron and manganese), elevated turbidity and suspended solids levels, faecal contamination, with concomitant pathogen risk and other erosion runoff contamination. Umgeni Water has set resource quality objectives for water treatment abstraction purposes and will continue to use these as the basis for setting alert level triggers to safeguard public health and optimise water treatment costs. Table 10.1: Resource Water Quality SYSTEM CATCHMENT IMPOUNDMENT ABSTRACTION WATER QUALITY STATUS AND TRENDS POOR RAW WATER QUALITY Mooi- Mgeni Mooi, umgeni Spring Grove - - Filling Excellent Excellent - Mearns weir Good Good Good Good Good Midmar Good Good Good Excellent Excellent - Albert Falls Good Good Good Good Good - Nagle Moderate Moderate Good Good Excellent - North Coast South Coast Inanda Moderate Moderate Moderate Moderate Moderate Elevated nutrient and total organic carbon concentrations, as well as elevated algal counts. umdloti Hazelmere Good Excellent Moderate Poor Good Occasional nutrient inputs from the catchment that resulted in elevated algal counts in this impoundment. umvoti imvutshane umvoti uthukela inungwane, ilovu umzimayi umhlabatshane River Abstraction River and Dam Abstraction River Abstraction Nungwane Dam E.J Smith Dam Mhlabatshane Dam Moderate Good Good Moderate Good Occasional nutrient inputs from the catchment. - Good Good Moderate Unsatisfactory Occasional elevated turbidity and ammonia concentration arising from organic degradation during the initial filling of the dam. - Poor Poor Moderate Poor High turbidity and total organic carbon inputs from the catchment arising from poor agricultural practices. Moderate Moderate Good Good Good Occasional nutrient inputs from the catchment that resulted in elevated algal counts in this impoundment. Poor - Poor - Poor - Moderate - Poor Satisfactory Elevated E. coli, iron, total organic carbon and turbidity associated with several major rainfall events and sewer problems. umzinto Dam Inflow and River Abstraction Moderate Moderate Moderate Good Good Occasional elevated E. coli counts due to several major rainfall events in the catchment. umtamvuna Ludeke Good Occasional nutrient and turbidity inputs from the catchment. umthwalume ixobho River Abstraction Home Farm Dam Moderate Moderate Moderate Good Good Occasional elevated turbidity arising from rain events in the catchment. Poor Poor Poor Poor Poor Eutrophication due to sewer inputs from Ixopo Town and catchment. Note: The water quality in most impoundments has been influenced by the severe drought conditions experienced in this geographical region. This has resulted in limited runoff, very low river levels (proportionally more rivers affected by sewer problems or treated effluent discharges) and also reduced dam volumes. Lower dam volumes have resulted in a decrease in the dilution factor and reduced assimilative capacity. In some cases, management and selection of some dam abstractions have been affected, resulting in poorer quality water being abstracted at some water treatment works.

88 86 ANNUAL 1.0 PG PG 9-17 ORGANISATIONAL 3.0 PG MINISTER S FOREWORD 4.0 PG ACCOUNTING AUTHORITY S 5.0 PG CHIEF EXECUTIVE S 6.0 PG CORPORATE GOVERNANCE 7.0 PG STAKEHOLDER UNDERSTANDING AND SUPPORT Figure 10.2: Water quality status of water resources per supply source/catchment % Full Spring Grove Dam Gross Capacity 139 million m 3 Mooi River System % Full Mearns Dam Gross Capacity 5.1 million m 3 uthukela River 0 0 Jul Aug Sep Oct Nov Dec Jan Feb Mar Apr May Jun Jul Aug Sep Oct Nov Dec Jan Feb Mar Apr May Jun umgeni River Mooi-Mgeni Transfer % Full 80 Midmar Dam Gross Capacity 235 million m 3 % Full 40 Albert Falls Dam Gross Capacity 290 million m 3 80 % Full Nagle Dam - Upper and Main Basin Upper and Main Basin Sites Gross Capacity 25 million m Jul Aug Sep Oct Nov Dec Jan Feb Mar Apr May Jun Jul Aug Sep Oct Nov Dec Jan Feb Mar Apr May Jun Jul Aug Sep Oct Nov Dec Jan Feb Mar Apr May Jun % Full Inanda Dam - Upper and Main Basin Upper and Main Basin Sites Gross Capacity 252 million m 3 umgeni River % Full Home Farm Dam - Ixopo Dam Gross Capacity 0.6 million m 3 % Full Hazelmere Dam Gross Capacity 18 million m 3 % Full Jul Mhlabatshane Dam Gross Capacity 2.5 million m 3 Aug Sep Oct Nov Dec Jan Feb Mar Apr May Jun % Full Jul EJ Smith Dam Gross Capacity 0.9 million m 3 Aug Sep Oct Nov Dec Jan Feb Mar Apr May Jun % Full Jul Nungwane Dam Gross Capacity 2.2 million m 3 Aug Sep Oct Nov Dec Jan Feb Mar Apr May Jun umzumbe River umzimayi River % Full imvutshane Dam Gross Capacity 3.1 million m 3 % Full Ludeke Dam Gross Capacity 14.9 million m 3 % Full umzinto Dam Gross Capacity 0.4 million m 3 Jul Aug Sep Oct Nov Dec Jan Feb Mar Apr May Jun Jul Aug Sep Oct Nov Dec Jan Feb Mar Apr May Jun Jul Aug Sep Oct Nov Dec Jan Feb Mar Apr May Jun Jul Aug Sep Oct Nov Dec Jan Feb Mar Apr May Jun Jul Aug Sep Oct Nov Dec Jan Feb Mar Apr May Jun Jul Aug Sep Oct Nov Dec Jan Feb Mar Apr May Jun umgeni River umkhomazi River umdloti River ilovu River umvoti River umtamvuna River umzinto River Excellent Good Satisfactory Poor Unsatisfactory * River and dam water quality is based on the revised Umgeni Water Quality Index. This Index is calculated using the following determinands: E. coli, Iron, Manganese, Turbidity, Conductivity, Nitrate, Total Phosphorus (TP), Soluble Reactive Phosphorus (SRP), Total Organic Carbon (TOC), Biotic Index scores, algal numbers, Chlorophyll a, Taste and Odour and Algal Toxins.
89 8.0 PG PERFORMANCE AGAINST SHAREHOLDER COMPACT 9.0 PG CREATING VALUE 10.0 PG CONSERVING OUR NATURAL RESOURCES 11.0 PG ENABLING OUR PEOPLE 12.0 PG IMPROVING RESILIENCY 13.0 PG FINANCIAL SUSTAINABILITY 14.0 PG GRI CONTENT INDEX 87 ANNUAL Water quality management plans include: > Monitoring the quality of raw water resources to assess quality for potable water treatment; > Assessing risks associated with negative trends in eutrophication, chemical contamination, pathogens and suspended solids and progress toward achieving raw water quality objectives; > Engaging in catchment management activities to influence resource quality and quantity objectives that will balance environmental objectives and safeguarding consumer health; and > Improving the quality of waste discharges from operational sites. The Department of Water and Sanitation (DWS) is kept continuously apprised of the quality, trends and potential risks associated with raw water supply resources. DWS, as the custodian of South Africa s water resources will continue to ensure there is long-term sustainability of water resources. Water Loss Management Umgeni Water strives to use the water abstracted from resources assiduously. Water balancing and water loss management measures are in place per treatment system. The total water loss level is low, at 2.29% and has been maintained below the entity s target level of 5% over the years. (Figure 10.3). Umgeni Water has implemented various initiatives to optimise the use of water treatment chemicals. These include: > Chemical selection process. Technical testing of chemical effectiveness for each treatment plant is conducted based on the regulatory requirements. This process prevents excessive chemical use which leads to increased operational costs and unsustainable use of natural resources; > Water treatment process evaluation audits, which identifies areas of improvement in terms of process and operational efficiency; > Monitoring and reviewing seasonal variation of the water column / dam levels, to optimise raw water quality; > Participating in catchment management activities and forums, and contributing to the information base, including water quality. This influences decisions for sustainable catchment land use activities and development; and > Monthly chemical optimisation audits to ensure that optimal use of treatment chemicals is maintained and to facilitate a prompt response should a problem be identified through the monthly sampling. Figure 10.4: Chemical Usage and Efficiency Trends Figure 10.3: Water Loss (%) Chemical usage in million kg Chemical usage (kg) per cubic metre of product Figure 10.5: Electricity Usage and Efficiency Trends Materials Usage and Efficiency Water is the most significant input materials for Umgeni Water, as described in the previous section, followed by energy, which is discussed below. In addition, Umgeni Water has a high reliance on water treatment chemical resources and is therefore committed to improving the usage efficiency thereof. Chemicals Usage and Efficiency The chemical usage trend is shown in Figure Electricity Usage in million Kilowatt hour (kwh) kwh per cubic metre product
90 88 ANNUAL 1.0 PG PG 9-17 ORGANISATIONAL 3.0 PG MINISTER S FOREWORD 4.0 PG ACCOUNTING AUTHORITY S 5.0 PG CHIEF EXECUTIVE S 6.0 PG CORPORATE GOVERNANCE 7.0 PG STAKEHOLDER UNDERSTANDING AND SUPPORT Energy Usage, Carbon Footprint and Emissions Reduction Initiatives Total electricity usage for the reporting year was 128 million KWh. Electricity usage and efficiency trends are shown in Figure (approximately 99%), which is one of the main inputs to water and wastewater treatment processes. The carbon footprint trend over the years is shown in Figure 10.6 and Table This decrease is associated with reduction in raw and potable water pumping in the year. Umgeni Water s direct CO 2 emissions contributions emanate from vehicles, boats, generators and other fuels. Indirect CO 2 emissions are largely due to electricity usage and to a lesser extent, flights and waste generation. The entity s carbon footprint is predominantly due to electricity consumption Figure 10.6: CO 2 Equivalents (Tonnes) Table 10.2: CO 2 Equivalents (tonnes) CO 2 EQUIVALENTS (TONNES) PER ACTIVITY Electricity Travel: Car Travel: Air Waste Other fuel TOTAL Energy management, including carbon off-setting initiatives include: > Continuing work on a strategy for energy conservation and demand management for new infrastructure - pipelines, pump stations and reservoirs. - A draft energy and demand management strategy for new infrastructure focusing on new pipelines and pump stations was prepared during the reporting period. It is intended to finalise the strategy in 2017/2018. > Continuing work on the entity s Green Building Initiative. - Further elaboration is provided under the next heading. > Implementing the Darvill Wastewater Treatment Works wetland construction project. > Implementing the Darvill Wastewater Treatment Works Co-generation project. > On-going replacement of old light fittings with more energy efficient ones. > On-going tree planting initiatives.
91 8.0 PG PERFORMANCE AGAINST SHAREHOLDER COMPACT 9.0 PG CREATING VALUE 10.0 PG CONSERVING OUR NATURAL RESOURCES 11.0 PG ENABLING OUR PEOPLE 12.0 PG IMPROVING RESILIENCY 13.0 PG FINANCIAL SUSTAINABILITY 14.0 PG GRI CONTENT INDEX 89 ANNUAL Green Building Initiative Green building or green construction takes place when there is mindful and deliberate inclusion of resource-efficiency processes into the building or construction life-cycle, i.e. from planning to design, construction, operation, maintenance, renovation to final decommissioning. The need for green building has risen in importance in South Africa as the country increasingly faces shortages in energy and water amongst other key resources. Umgeni Water s approach to the Green Building includes: > Carrying out a Green Building Assessment using the Green Buildings Council of SA (GBCSA) Existing Building Performance tool as a framework for a selection of Umgeni Water sites; > Developing Green Building strategies that can be integrated into the Existing Building Energy Water Performance (EWP) benchmark tool; > Assessing energy efficiency, water efficiency, materials efficiency, waste and toxicity reduction, indoor Environmental Quality (IEQ), operations and maintenance optimisation, and emissions; and > Developing, selecting, funding and financing value-adding initiatives/interventions. During the reporting period, one (1) of the buildings assessed against the GBCSA Existing Building Performance Tool Version 1 obtained a One Star status, on the journey to a better, greener building. Biodiversity Management umngeni Ecological Infrastructure Partnership (UEIP) The UEIP is a joint partnership committed to the management and harnessing of the potential eco-system resources in the Mgeni River catchment. Umgeni Water, as a signatory of this partnership, has been involved in various projects which the UEIP has implemented, supplying valuable experience, information and analytical water quality data. This information has been utilised to create awareness on the issues relating to land use, community based water supply and water quality monitoring. Progress with this initiative is shown below and will continue into /2016 > Role of the Lions River Wetland, highlighting soil conditions, vegetation and water quality. > Green Fund Ecological Infrastructure Investment Project, which focuses on the Upper umngeni, Mpendle, Lions and Karkloof catchments, which look at long-term, cost effective ecological service delivery, human settlements and commercial agriculture. > Midmar-Mpophomeni working-group, raising funds to rehabilitate and restore the Mpophomeni wetland. > Successful Enviro-Champs Project. > Solid waste collection and private sector engagement. > The Green Fund Ecological Infrastructure Investment Project continued. Biodiversity Offsets During the reporting period, Umgeni Water researched the possibility of the implementing biodiversity offsets. Biodiversity offsets are interventions specifically implemented to counterbalance the adverse environmental impacts of land-use change, resource use, discharge, emission or other activity at one location that is implemented at another location to deliver a net environmental benefit. Progress with this research is shown below. Work is on-going and research will continue into /2016 > Biodiversity assessment of Umgeni Water infrastructure was completed. > All sites were considered in terms of the Ezemvelo Wildlife (MinSet Plan and Biodiversity Sector Plans), which highlighted areas of concern that are considered threatened or endangered. > Biodiversity Offsets: Umgeni Water as-built infrastructure was assessed to determine if the infrastructure was within biomes considered threatened or endangered in terms of the Ezemvelo Wildlife (MinSet Plan and Biodiversity Sector Plans). > This highlighted areas that require the implementation of net environmental benefit at another location which is considered either threatened or endangered.
92 90 ANNUAL 1.0 PG PG 9-17 ORGANISATIONAL 3.0 PG MINISTER S FOREWORD 4.0 PG ACCOUNTING AUTHORITY S 5.0 PG CHIEF EXECUTIVE S 6.0 PG CORPORATE GOVERNANCE 7.0 PG STAKEHOLDER UNDERSTANDING AND SUPPORT Alien Aquatic Weed Management Well managed and sustainable water resources are critical to Umgeni Water s core responsibility of supplying sustainable potable water supply. Alien aquatic weeds introduced into various water resources pose significant risk to water quality and quantity. The primary threats are posed by Water Hyacinth (Eichhornia crassipes), Water Lettuce (Pistia stratiotes) and Kariba Weed (Salvinia molesta). These free-floating aquatic plants are extremely difficult to control in eutrophic water bodies as these exponentially grow and invade the riverine environment. Progress with this initiative is shown below and will continue into /2016 > Closer cooperation with a multi-stakeholder group, the Alien Weed Working-Group. > Release of bio-control in several river systems. > Monitoring and assessment of the weed status. > Improved response time. > A reduction of cost of control was achieved. > Maintain cooperation with a multi-stakeholder group, the Alien Weed Working-group. > Problems due to budget constraints and lack of trained staff meant limited control was achieved. > Monitoring and assessment of the weed status continued. > Release of bio-control in several river systems. Msinsi Holdings Land and Sustainable Resource management Msinsi Holdings SOC Ltd., a wholly-owned subsidiary of Umgeni Water is mandated to manage the land and biodiversity of the areas around the dams owned or managed by Umgeni Water in a manner that balances the divergent factors of local community development, provision of recreational facilities for the public and water resources/biodiversity protection. These reserves are located at: > Spring Grove Dam; > Albert Falls Dam; > Nagle Dam; > Inanda Dam; > Hazelmere Dam; and > Shongweni Dam. poaching, which has been a significant threat to the reserve wildlife, were put in place. Security patrols are conducted as per a patrol plan in order to identify and mitigate security risks to the reserves, including ensuring reserve fence lines are in good condition. Three (3) rhinoceroses were lost through poaching during the year under review. Mitigation measures include controlled rhino dehorning. In addition, collaboration with other stakeholders is being undertaken in order to strengthen security measures for the game reserves. A comprehensive game reserve security plan will be finalised during 2017/18. Msinsi Holdings continues to be seen as a significant player in the conservation and tourism sector in KwaZulu-Natal and the state-owned company will continue to ensure that ecosystem services provided by these water bodies and surrounding environments continue to be sustainably managed. Detailed management plans for each of the reserves, in line with industry best practice, have been completed and form the basis for all operations in the reserves. In the past year, Msinsi has been successful in protecting the habitats and ensuring an ecologically sustainable and protected water environment through implementing its resource management plans, which focused on: > The management of the game and species according to the carrying capacity of each reserve; > Local community development; > Recreation for the public; > Grassland management; > Control of pollution inside the purchase areas; and > Removal of alien invasive plants, both terrestrial and aquatic. The ecological balance was effectively managed during this period through the implementation of Reserve Management Plans. In particular, carrying capacity was managed to ensure sustainability of wildlife populations and measures to mitigate Stakeholder engagement successfully created value for Msinsi s operations and the communities at large during this reporting period. As a result, there was no interruption of Msinsi s operations as a result of community instability in the neighbouring areas. Msinsi continued with the implementation of planned CSI initiatives targeting surrounding communities. Ten (10) initiatives were implemented which included sponsorships for a senior citizen s club, a career exhibition for local schools and a sports tournament. Msinsi continued providing environmental education targeting surrounding communities. Twenty-nine (29) environmental education initiatives in areas of water conservation, environmental awareness and commemoration of environmental special days were implemented learners, forty-six (46) learning institutions and two (2) youth organisations were reached through this programme during the year under review.
93 8.0 PG PERFORMANCE AGAINST SHAREHOLDER COMPACT 9.0 PG CREATING VALUE 10.0 PG CONSERVING OUR NATURAL RESOURCES 11.0 PG ENABLING OUR PEOPLE 12.0 PG IMPROVING RESILIENCY 13.0 PG FINANCIAL SUSTAINABILITY 14.0 PG GRI CONTENT INDEX 91 ANNUAL Sourcing labour within the communities around Msinsi operations, created job opportunities for the communities with a total of 436 temporary jobs created during the reporting period. Figure 10.8: Per Cent Waste Recycled 4.32% A total of thirty-one (31) learners recruited from the communities were enrolled in the Learnership Programme of Accommodation Services, NQF Level % Continuous engagement with the Amakhosi in the area of Shongweni has been crucial towards achieving the successful handover of Shongweni Dam and Game Reserve to the community following the transfer of that land from Umgeni Water to Zwelibomvu Community Trust. Msinsi will continue to implement programmes that benefit communities in the area. Waste Management Waste management studies in progress include: > Waste recycling; > Classification of Water Treatment Works Residues; > Classification of the Wastewater Treatment Works Sludge; and > Assessment of Management Options for Water and Wastewater Treatment Works Sludge. During the reporting period, the entity focused on recycling. Three-in-one Recycling and War on Waste (WOW) bins were placed at the strategic locations to encourage waste separation at source and a recycling campaign was conducted to educate staff on the importance of recycling and correct procedures for waste separation. 0.44% 0.16% Environmental performance of Operational sites 0.37% Annual environmental audits are undertaken at operational sites, the objectives of which are: > To assess whether the site is complying with all applicable environmental legislation and regulations; > To assess internal policy and procedural compliance in relational to environmental management; > To assess the status of energy consumption, waste management and biodiversity management at the site and alignment with corporate environmental sustainability initiatives; and > To recommend mitigation measures to address areas of non-conformance. The total waste produced during the reporting period is kg per mil m % of this waste was recycled. Trends in waste management are shown in Figures 10.7 and Figure 10.7: Waste Produced In the reporting period, environmental audits were undertaken at water treatment works, wastewater treatment works, dams, workshops and regional offices. The main findings (Figure 10.9) were: > Poor housekeeping; > Inadequate waste management in relation to waste separation, storage and implementation of waste recycling measures; > Contamination of the surrounding environment due to concrete and oil spillages that were not cleared; > Soil erosion; > Non-compliance with permit requirements; and > Wastage of non-renewable resource and water leakage General Waste (kg per million cubic metres) Hazardous Waste (kg per million cubic metres) Total
94 92 ANNUAL 1.0 PG PG 9-17 ORGANISATIONAL 3.0 PG MINISTER S FOREWORD 4.0 PG ACCOUNTING AUTHORITY S 5.0 PG CHIEF EXECUTIVE S 6.0 PG CORPORATE GOVERNANCE 7.0 PG STAKEHOLDER UNDERSTANDING AND SUPPORT Environmental performance was generally good. Most findings had risks ranging from minor to moderate. Mitigation measures will be implemented to ensure continuous improvement of environmental management at sites. Figure 10.9: Environmental Management Findings from Audits Spillages Waste Management Alien Infestation Housekeeping Water Leakages Soil Erosion Permit Requirements 2014/ /2016 Environmental Incidents There were forty-five (45) environmental incidents recorded for the year, compared to thirty-one (31) in the prior year (Figure 10.10). Umgeni Water has, in the recent past, acquired additional water and wastewater treatment works for which, systems will progressively be put in place to improve performance. Figure 10.10: Environmental Incidents Integrated Environmental Management The entity has sixteen (16) projects in planning and design phases that are being managed through the Integrated Environmental Management System. This is in accordance with the provisions of the Environmental Impact Assessment Regulations of the National Environmental Management Act (NEMA), which stipulates that projects that trigger listed activities as stipulated in the regulations are required to obtain an environmental authorisation (EA), prior to any construction activities occurring The process of obtaining an EA can be either through a basic assessment (BA) process or a scoping and full environmental impact assessment process (EIA). The status of some key Bulk Infrastructure projects is shown in Table Table 10.3: Environmental Authorisation Status for Key Bulk Infrastructure Projects PROJECT NAME umkhomazi Water Project Phase 1 Lower umkhomazi BWSS Elysium Desalination Project umshwathi BWSS Phase 4 Mhlabatshane Pipeline and Plant Upgrade South Coast Phase 2A Nungwane Raw Water Pipeline: Pipe Supply EA STATUS REQUIREMENTS EIA application in progress EIA application in progress EIA application in progress EIA application in progress BA application in progress EA obtained EA obtained


95 8.0 PG PERFORMANCE AGAINST SHAREHOLDER COMPACT 9.0 PG CREATING VALUE 10.0 PG CONSERVING OUR NATURAL RESOURCES 11.0 PG ENABLING OUR PEOPLE 12.0 PG IMPROVING RESILIENCY 13.0 PG FINANCIAL SUSTAINABILITY 14.0 PG GRI CONTENT INDEX 93 ANNUAL Where project developments do not trigger listed activities as defined in the Act, environmental screening is undertaken and project specific Environmental Management Plans are developed. This ensures that all the potential environmental impacts emanating from project implementation are eliminated or minimised to acceptable levels. Eight (8) projects are currently in the construction phase and are monitored for compliance against the Environmental Management Plans, requirements of the EA, by independent external Environmental Control Officers, internal Environmental Site Officers, Environmental Officers and Environmental Scientists. Overall, environmental performance has been satisfactory with the following minor challenges of which, mitigation procedures were recommended and implemented: > Improper top soil storage leading to heaps exceeding acceptable height as per regulation; > Hydrocarbon spill containment procedures not followed or properly implemented leading to ground and surface water pollution; > Weed infestations in construction and stockpile areas; > Improper solid waste management of construction surplus material and domestic waste leading to poor housekeeping; and > Poor storm water management leading to soil erosion. Despite the above-mentioned environmental impact challenges, good environmental practice will continue to be pursued and all activities will diligently be conducted in an environmentally sustainable manner. > Outstanding rehabilitation of disturbed areas causing erosion and land degradation; AMANZIMTOTI WTW


96 94 ANNUAL 1.0 PG PG 9-17 ORGANISATIONAL 3.0 PG MINISTER S FOREWORD 4.0 PG ACCOUNTING AUTHORITY S 5.0 PG CHIEF EXECUTIVE S 6.0 PG CORPORATE GOVERNANCE 7.0 PG STAKEHOLDER UNDERSTANDING AND SUPPORT 69 Apprentices and Artisans were Developed in trades including: mechanical engineering, electrical engineering and instrumentation fi elds ARTISANS' GRADUATION CEREMONY
97 8.0 PG PERFORMANCE AGAINST SHAREHOLDER COMPACT 9.0 PG CREATING VALUE 10.0 PG CONSERVING OUR NATURAL RESOURCES 11.0 PG ENABLING OUR PEOPLE 12.0 PG IMPROVING RESILIENCY 13.0 PG FINANCIAL SUSTAINABILITY 14.0 PG GRI CONTENT INDEX 95 ANNUAL 11.0 Enabling our People 11.1 Leadership and Employee Development MANAGEMENT APPROACH Umgeni Water promotes and encourages ethical behaviour and decision-making by all employees, board members and stakeholders. This is facilitated through a Code of Ethics. During the reporting period, the Ethics Committee monitored and assessed the following activities of Umgeni Water: Labour and employment matters, including: > Human capital and workforce matters: recruitment and selection, succession and coaching, health and safety, HIV awareness, wellness programmes, disciplinary and dispute resolution processes, training and development. Social and economic development This includes Umgeni Water s standing in terms of the goals and purposes of: > The ten (10) principles set out in the United Nations Global Compact Principles and OECD recommendations regarding corruption, including human rights, child and forced labour, environment, anti-corruption, bribery, extortion and transparency; > The Employment Equity Act No. 55 of 1998; and > The Broad-Based Black Economic Empowerment Act No. 53 of Good corporate citizenship, including: > Promotion of equality, prevention of unfair discrimination and measures to address corruption; > Corporate social contribution and development of the communities in which Umgeni Water conducts its business; and > Impartial/objective sponsorship, donations and charitable giving. The environment, health and public safety, including: > Impact of Umgeni Water s activities, products and services. Consumer relationships, including: > Umgeni Water s policies and records relating to advertising, public relations and compliance with consumer protection laws. LABOUR PRACTICES AND DECENT WORK The entity s goals and human resources needs are mutual, compatible and strongly inter-dependent and Human Resources policies seek to ensure a competent, motivated and engaged workforce. EMPLOYMENT The workforce profile is shown in Table 11.1 and Figure > The entity seeks to maintain a workforce that enables it to deliver quality services to all stakeholders. > All employees are based in KwaZulu-Natal and within commuting distance from all operational sites. > All full time and fixed term contract employees are provided with several benefits, including: membership of provident fund or retirement fund, housing allowance and medical aid. > All female employees are entitled to maternity leave. During the reporting period, twenty (20) female employees qualified for 100% maternity leave benefits and 98% returned to work after their leave and 2% are still on leave. SUCCESSION, MENTORING AND COACHING Succession, mentoring and coaching of employees is crucial to enable the entity to create a pool of competencies to meet current and future needs. This is facilitated through sound policies and plans that embrace: > Scarce, Core and Critical positions, including positions critical for retention of institutional memory; > Profiling of potential retirees (60 65 years of age) occupying scarce and critical positions;
98 96 ANNUAL 1.0 PG PG 9-17 ORGANISATIONAL 3.0 PG MINISTER S FOREWORD 4.0 PG ACCOUNTING AUTHORITY S 5.0 PG CHIEF EXECUTIVE S 6.0 PG CORPORATE GOVERNANCE 7.0 PG STAKEHOLDER UNDERSTANDING AND SUPPORT > Documenting competencies identified for key positions for compilation of job profiles; > Preparing individuals to assume higher levels of responsibility in key and strategic positions; and > Developing a skills database of Employees, Learners, Apprenticeships and other Trainees, which provides an informed pool from which to identify successors. Mentorship Agreements and Talent Review Questionnaires are being drawn up. Table 11.1: Workforce by Employment Type/Category, Race and Gender is Shown for the Permanent Establishment for (a) Parent Company and (b) Wholly-Owned Subsidiary. (a) Umgeni Water (Permanent Establishment) OCCUPATIONAL CATEGORY TOTAL MALE FEMALE AFRICAN COLOURED INDIAN WHITE AFRICAN COLOURED INDIAN WHITE Top management Senior management Professionally qualified and experienced specialists and mid-management Skilled technical and academically qualified workers, junior management, supervisors, foremen, and superintendents Semi-skilled and discretionary decision-making Unskilled and defined decision-making Total (b) Msinsi Holdings SOC Ltd. (Permanent Establishment) OCCUPATIONAL CATEGORY TOTAL MALE FEMALE AFRICAN COLOURED INDIAN WHITE AFRICAN COLOURED INDIAN WHITE Top management Senior management Professionally qualified and experienced specialists and mid-management Skilled technical and academically qualified workers, junior management, supervisors, foremen, and superintendents Semi-skilled and discretionary decision-making Unskilled and defined decision-making Total Figure 11.1: Employment in Showing (a) Category, (b) Race, (c) Gender, (d) Age and (e) Disability (a) Employment Status (Parent) by Category 44% Top Management Senior Management Professionally qualified and experienced specialists and mid-management 22% Skilled Technical and academically qualified workers, junior management, supervisors, foremen and superintendents Semi-skilled and discretionary decision-making Unskilled and defined decision-making 26% 4% 3% 0.6%
99 8.0 PG PERFORMANCE AGAINST SHAREHOLDER COMPACT 9.0 PG CREATING VALUE 10.0 PG CONSERVING OUR NATURAL RESOURCES 11.0 PG ENABLING OUR PEOPLE 12.0 PG IMPROVING RESILIENCY 13.0 PG FINANCIAL SUSTAINABILITY 14.0 PG GRI CONTENT INDEX 97 ANNUAL b) Employment Status (Parent) by Race c) Employment Status (Parent) by Gender 78% 66% 2% 34% 5% 15% Indian African Male Female Coloured White (d) Age Profile (Parent) 27% 30% 26% 11% 1% 4% (e) Employee Disability Profile (Parent) 99% 1% Table 11.2: Summary of Staff Numbers as at 30 June 2017 STAFF NUMBERS TOTAL Parent permanent 880 Msinsi permanent 116 Group permanent 996 Group fixed term contracts 154 Group Total RECRUITMENT AND TURNOVER In the reporting period the entity recruited one hundred and thirty three (133) employees, comprising: Total Employees Total with Disability > Fifty-one (51) permanent employees; > Twenty-four (24) contract employees; and > Fifty-eight (58) graduates, apprentices, interns and in-service trainees.
100 98 ANNUAL 1.0 PG PG 9-17 ORGANISATIONAL 3.0 PG MINISTER S FOREWORD 4.0 PG ACCOUNTING AUTHORITY S 5.0 PG CHIEF EXECUTIVE S 6.0 PG CORPORATE GOVERNANCE 7.0 PG STAKEHOLDER UNDERSTANDING AND SUPPORT Turnover was fifty-six (56) including: > Twenty-four (24) resignations; > Eleven (11) natural deaths; > Fourteen (14) early retirements; > Five (5) dismissals; and > Two (2) medical boardings. The entity s turnover percentage for the year is 2.8% and is below the industry benchmark of 8%. LABOUR/MANAGEMENT RELATIONS The rights and well-being of all employees are safe-guarded and protected through alignment of corporate policies with relevant legislation and regulations. Specifically with its union, NEHAWU, the entity has in place a Collective Agreement that is maintained. Currently fifty-nine per cent (59%) of the total workforce are members of the union of which fifty-four per cent (54%) are within the collective bargaining unit. Quarterly Union-Management meetings were held in the reporting period, excluding special meetings that were held to provide more timely feedback on important issues. The collective agreement serves as the minimum terms of engagement, as the entity is committed to information sharing and to providing reasonable response at all times to organised labour regarding any significant operational changes that affect employees. During the engagement sessions, management actively engaged labour regarding concerns raised and sought to achieve resolution of issues without any stand-offs. OCCUPATIONAL HEALTH AND SAFETY Umgeni water believes that achievement of its strategic SHEQ objectives and goals depends on its very important resource which is people. It is for this reason that the entity has always concentrated its efforts in improving the working environment, through proactive identification of hazards, management of risks and continuous monitoring of plans aimed at minimising/ mitigating the risk. > Implemented focused initiatives, activities and programmes to reduce vehicle incidents; > Held annual Safety Imbizos for all operational regions to ensure employee and leadership participation in improving SHEQ performance as well as behaviour towards safety; > Improved its contractor management programmes to align its service providers/stakeholders to Umgeni Water SHEQ requirements, thus ensuring delivering of quality service; and > Introduced a new initiative where for the first time an Annual Fire Competition was held in partnership with local fire department, to up-skill internal fire teams to better respond and handle emergency situations. One of the measures adopted by Umgeni Water in measuring its safety performance is the Disabling Injury Frequency Rate (DIFR). For the reporting period the recorded corporate DIFR was 0.05 against a target of 0.5 (Figure 11.2). The entity s occupational health programmes are aligned to Occupational Health and Safety Act and standards and assist employees and the entity with the following: > Provision of health education; > Provision of guidance and counselling; > Management of Employee Assistance Programme; > Management of HIV/ AIDS pandemic; > Primary health care including minor ailments treatment and referrals where necessary; > Workplace observation and intervention if circumstances become hazardous to health; and > Medical Surveillance Programmes are conducted annually to screen employees exposed to hazardous environments and ultimately ensuring a safe workforce. Figure 11.2: Disabling Injury Frequency Rate (DIFR) Upper DIFR Limit 0.5 SHEQ performance continues to improve and this can be attributed to its embedding in all organisational processes. The level of leadership participation and employee commitment is a key factor contributing to continuous improvement in performance of the SHEQ system The organisation is aligned to the ISO 14001:2004 standard, and annual internal audits are conducted against the requirements of this standard. SHEQ management systems were further audited by SABS as scheduled. The outcome for the entity s operations was maintenance of ISO 9001: 2008 certification during the surveillance audit and maintenance of the OHSAS 18001: 2007 certification after a re-certification audit. Over and above these achievements, the entity: > Continued to internally conduct integrated management system audits; Calculation of disabling incident frequency rate (DIFR) is as follows: The total number of fatal injury cases, permanent disability cases, lost workday cases, restricted workday cases, health fatality cases, irreversible diagnosed disease cases and reversible diagnosed cases, times , divided by the number of rolling man-hours worked over the exposure period.
101 8.0 PG PERFORMANCE AGAINST SHAREHOLDER COMPACT 9.0 PG CREATING VALUE 10.0 PG CONSERVING OUR NATURAL RESOURCES 11.0 PG ENABLING OUR PEOPLE 12.0 PG IMPROVING RESILIENCY 13.0 PG FINANCIAL SUSTAINABILITY 14.0 PG GRI CONTENT INDEX 99 ANNUAL SKILLS DEVELOPMENT Continued skills development is essential and enables employees to excel in their individual and organisational roles and functions and deliver on the entity s strategy. Umgeni Water annually compiles and submits a Workplace Skills Plan to EWSETA, which identifies the skills needs of the entity and ensures skills training and development is effective. The skills development programmes include: > Employee Training and Development; > Assisted Education Programme; > Learnership and apprenticeship Programmes; > Bursary programme; and > Graduate Trainee and Internship Programmes. Figure 11.3 (a): Training Hours by Gender Progress with each of these is detailed in the sections that follow. Female Male Total Training and Development Figure 11.3 (b): Training Spend (Rm) Training categorised by gender and by employee category are shown in Figure 11.3 (a) and Table 11.3 and show that all categories of employees were exposed to training with a total of hours spent in Training and Development Training Speed (Rm) Table 11.3: Training Hours by Occupational Level, Gender and per Employee in OCCUPATIONAL LEVELS TOTAL EMPLOYEES TRAINED TOTAL FEMALE TRAINING HOURS FEMALE TOTAL MALE TRAINING HOURS MALE TOTAL HOUR PER CATEGORY Top management Senior management Professionally qualified and experienced specialists and mid-management Skilled technical and academically qualified workers, junior management, supervisors, foreman and superintendents Semi-skilled and discretionary decision-making Unskilled and defined decision-making Non-permanent Total
102 100 ANNUAL 1.0 PG PG 9-17 ORGANISATIONAL 3.0 PG MINISTER S FOREWORD 4.0 PG ACCOUNTING AUTHORITY S 5.0 PG CHIEF EXECUTIVE S 6.0 PG CORPORATE GOVERNANCE 7.0 PG STAKEHOLDER UNDERSTANDING AND SUPPORT Leadership, Learnership and Apprenticeships Umgeni Water partnered with the University of KwaZulu- Natal to develop and implement programmes for leadership and management development. A Senior Management Development Programme (SMDP) was implemented during the reporting period with a total of twenty (20) Senior Managers successfully completing this programme. The programme consisted of five (5) block sessions and included an international module. The Learnerships and Apprenticeships Programme in the year provided training, development and exposure to both internal and external candidates. Fifty-eight (58) Apprentices were recruited into the following trades: Mechanical Engineering, Electrical Engineering, Boiler-making, Motor/Diesel Mechanical and Instrumentation. The Apprentices completed the second phase in April 2017 and are currently receiving workplace training at respective Umgeni Water workshops. EWSETA confirmed that all the entity s Apprentices are registered as Apprentices, which is one of the trade test application pre-requisites. There are currently eleven (11) Artisan Trainees who passed their trade tests and were employed within the entity over a two-year period as artisan trainees: Three (3) are in Electrical Engineering, two (2) in Instrumentation, three (3) in Boiler-making, two in (2) Mechanical Fitting and one in (1) Motor Mechanics. Umgeni Water assessed the skills and competency levels of internal personnel against requirements of Regulation 17 of the Water Services Act for Blue Drop and Green Drop certification and developed a multi-year training plan to fill the skills and competency gaps. The internal positions include Superintendent, Process and Quality Technicians, Senior Operator, Operator and Process Controller positions. In the reporting period, a total of 256 Process Controllers were enrolled in either the Learnership Programme or in N3 Water and Waste Treatment and various courses in Water and Wastewater Treatment. Assisted Education Sixty-seven (67) of the entity s employees are on an Assisted Education Programme, of which, thirty-two per cent (32%) are enrolled in programmes that are directly targeting critical and scarce skills. Umgeni Water Young Professionals The Umgeni Water Young Professionals (UWYP) forum, established in 2014, is a solutions-oriented platform set up to cultivate professional development, leadership and social responsibility in the entity s young workforce. The membership of the forum consists of employees under the age of 35. Forum membership as at 30 June 2017 was 174. The forum targets creation of an enabling environment for professional growth of young professionals through affiliation and registration with their respective professional bodies. The forum further encourages active community participation and creation of a professional and social network amongst young professionals within the water sector for empowerment, and sharing of resource and information. In the year under review, the forum continued in its quest of motivating and inspiring the entity s young professionals to grow professionally and be active social citizens by organising and participating in various conferences, seminars and technical tours, both local and international. Five (5) Umgeni Water Young Professionals had the opportunity to travel to China to attend a seminar on Small Hydropower and Sustainable Development of Rural Communities for officials and African Countries. One (1) Umgeni Water Young Professional was successful in obtaining the DST Hitachi Scholarship training offered in Japan. The objective of the programme is to enhance the capacity of South African engineers in the areas of water
103 8.0 PG PERFORMANCE AGAINST SHAREHOLDER COMPACT 9.0 PG CREATING VALUE 10.0 PG CONSERVING OUR NATURAL RESOURCES 11.0 PG ENABLING OUR PEOPLE 12.0 PG IMPROVING RESILIENCY 13.0 PG FINANCIAL SUSTAINABILITY 14.0 PG GRI CONTENT INDEX 101 ANNUAL and sanitation treatment and service in support of South Africa s social infrastructure development programme. professional fields and thirty-one (31) in-service trainees receiving experiential training. The UWYP continued to grow in stature as a sociallyresponsible forum by conducting career guidance seminars in rural schools in the province. One (1) such seminar was successfully conducted during, where more than 200 learners were assisted with online applications to various institutions of higher learning. Umgeni Water also partnered with the Msunduzi Mayoral Office for the Take a Girl Child to Work initiative, where twenty (20) girls from six (6) schools in Pietermaritzburg were introduced to the engineering field. The learners were given the opportunity to engage with engineering professionals from Umgeni Water to gain more insight on what it means to be an engineer. The Umgeni Water Toastmasters Programme, under the ambit of Toastmasters International, continued to grow from strength to strength in equipping Umgeni Water employees, particularly, Young Professionals, to be effective communicators and leaders. Since its introduction within the entity in 2016, a total of sixty-two (62) employees have been developed through this programme. The Toastmasters Programme continues to be a resounding success in enabling its members to become effective communicators and leaders. As a result of this, enrolment figures are expected to rise as more employees seek to be participants and ultimately beneficiaries of this development programme. In the reporting year, thirty-four (34) Young Professionals (YPs) completed the entry-level Competent Communicator programme by September 2016, with a further thirty-six (36) employees (comprising 24 YPs and 12 non-yp) recruited into the programme. Bursar, Graduate and In-service Trainee Programmes Umgeni Water s Graduate Trainee Programme is aligned to guidelines provided by professional registration bodies. In the reporting period, the entity had a total of forty-one (41) graduates enrolled in engineering, science and other required The entity also has a one-year internship programme that provides work experience to unemployed graduates. Ten (10) interns were contracted in the reporting year to work in multidisciplinary fields across the organisation. Umgeni Water is funding twelve (12) bursary students through the Umgeni Bursary Scheme with students enrolled at various universities in disciplines of Civil Engineering, Mechanical Engineering, Electrical Engineering, Chemistry, Microbiology and Finance. Umgeni Water, in partnership with National Treasury, continued to implement the graduate development programme of engineers, technologists, process support and technicians with specific emphasis on meeting the skills shortages in municipalities in the province. Forty-three (43) graduates, fourteen (14) female and twentynine (29) male, were developed under the National Treasury Graduate Development Programme. All have submitted final engineering reports to the Engineering Council of South Africa for assessment and certification. PRE-RETIREMENT TRAINING Pre-retirement training is conducted annually, targeting employees in the age group fifty-five (55) to sixty-five (65). In addition, information is regularly provided to all employees to raise awareness of the importance of retirement planning and increase knowledge regarding sustainable management of retirement fund benefits. KEY MEMBERSHIPS AND ASSOCIATIONS Umgeni Water employees subscribe to a wide range of memberships and associations (Table 11.4). These straddle governance and risk, water, science and engineering, natural resources, social impact management, business, finance and accounting, and occupational health and safety, amongst others. The memberships ensure employees keep abreast in fields of expertise and participate in sector knowledge sharing.
104 102 ANNUAL 1.0 PG PG 9-17 ORGANISATIONAL 3.0 PG MINISTER S FOREWORD 4.0 PG ACCOUNTING AUTHORITY S 5.0 PG CHIEF EXECUTIVE S 6.0 PG CORPORATE GOVERNANCE 7.0 PG STAKEHOLDER UNDERSTANDING AND SUPPORT Table 11.4: Key Membership and Associations CATEGORY Governance and Risk Financial and Business Product Quality, Infrastructure Stability, Research, Innovation, Science and Technology Community and Environmental Sustainability, Science and Technology Employee and Leadership Development, Operational Resiliency, Operational Optimisation MEMBERSHIPS Institute of Directors in Southern Africa (IoDSA) Institute of Risk Management South Africa (IRMSA) Ethics Institute of South Africa (EthicsSA) Institute of Internal Auditors (IIA) Information Systems Audit and Control Association (ISACA) South African Institute of Chartered Accountants (SAICA) Association of Corporate Treasurers of Southern Africa (ACTSA) Chartered Institute of Management Accountants (CIMA) South African Institute of Professional Accountants (SAIPA) National Business Initiative (NBI) Durban Chamber of Commerce and Industry (DCCI) Pietermaritzburg Chamber of Business (PCB) Water Institute of Southern Africa (WISA) South African Association of Water Utilities (SAAWU) International Desalinisation Association South African Institute of Agricultural Engineers South African Institute of Mechanical Engineers International Association of Hydrological Sciences American Water Works Association (AWWA) International Water Association (IWA) Engineering Council of South Africa (ECSA) South African Institute of Civil Engineers (SAICE) Construction Industry Development Board (CIDB) South African Institute of Chemical Engineers (SAIChE) Project Management Institute South African Council for Planners South African Planning Institute South African National Committee on Large Dams (SANCOLD) The Association of SA Quantity Surveyors Concrete Society of Southern Africa NPC South African Council for the Project and Construction Management Professions (SACPCMP) The Southern African Institute of Mining and Metallurgy (SAIMM) South African Geomatics Council American Chemical Society (ACS) International Association for Impact Assessment (IAIAsa) South African Council for Natural Scientific Professions (SACNASP) Institute of Waste Management Institute of Information Technology Professional of South Africa (IITPSA) South African National Standards Association (SABS) South African Institute of Draughting Electrical Contractors' Association NACE International South African Right of Way Association (SARWA) Institute of Safety Management. Fire Protection Association of South Africa South African Board of People Practice (SABPP) South African Nursing Council (SANC) South African Reward Association (SARA) South African Society of Occupational Health Nursing Practitioners (SASHON) Chartered Institute for Purchasing and Supply (CIPS) State Owned Entities Procurement Forum (SOEPF) Society of South African Archivists (SASA) Library and Information Association of South Africa (LIASA) South African Institute of Occupational Safety and Health (SAIOSH) Toastmasters International
105 8.0 PG PERFORMANCE AGAINST SHAREHOLDER COMPACT 9.0 PG CREATING VALUE 10.0 PG CONSERVING OUR NATURAL RESOURCES 11.0 PG ENABLING OUR PEOPLE 12.0 PG IMPROVING RESILIENCY 13.0 PG FINANCIAL SUSTAINABILITY 14.0 PG GRI CONTENT INDEX 103 ANNUAL PERFORMANCE, ALIGNMENT TO STRATEGY AND REMUNERATION Umgeni Water continues to successfully implement a three-component performance management system in the organisation. The system ensures that all employees have conceptual knowledge and understanding of the role and purpose of their jobs with line of sight to the entity s strategy and performance objectives and targets. The Board of Umgeni Water assesses the entity s performance against pre-determined objectives on a quarterly and annual basis, whilst formal employee performance assessments are undertaken twice a year. The performance management process at Umgeni Water is development orientated, intended to cultivate effective human resources management and career development. As a result, appraisals are constructively used to provide feedback and coaching to individual employees concerning their job performance. Performance is linked to remuneration in that performance bonuses are paid subject to all of the following requirements being met: > The entity s balanced scorecard targets have been substantially met as set out in the shareholder compact with the Minister of Water and Sanitation; > The divisional balance scorecard targets have been met as per divisional plans; > The individual performance targets have been met as per individual performance contracts; and > The entity can afford to pay performance bonuses. Through this structured performance management system, Umgeni Water ensures implementation of its strategic goals through skilled, competent, motivated and engaged employees, whilst recognising and rewarding good performance. DIVERSITY AND EQUAL OPPORTUNITY Umgeni Water s workforce by employment type/category, race and gender is shown in Table 11.1 and Figure The organisation annually submits an Employment Equity Plan to the Department of Labour and prepares quarterly equity reports to track the status of its workforce diversity against its plan. Umgeni Water does not discriminate between men and women in terms of remuneration. HUMAN RIGHTS Investment and procurement practices Umgeni Water is an entity of state that is committed to a system of acquisition of goods and services that is fair, equitable, transparent, competitive and cost effective and promotes the objectives of Broad-Based Black Economic Empowerment. Awareness continues to be built amongst the entity s employees through requesting mandatory disclosures of interests in support of fair, equitable, transparent and competitive procurement practices. Performance with participation goals set for the reporting period may be found in the economic empowerment chapter of this annual report. The entity remains confident that it is contributing to effective economic transformation that will benefit the sector as a whole. Child and Forced Labour Umgeni Water, as a state-owned entity, subscribes fully to National Legislation which ensures a healthy and safe work environment for its employees. The entity s Human Resources Policies comply and are in line with the Labour Relations Act (Act 66 of 1995), Basic Conditions of Employment Act (Act 75 of 1997) and their relevant Codes of Good Practice. The entity is also aligned to the United Nations Global Compact Principles and OECD recommendations in this regard. Umgeni Water does not practise child and forced labour. Non-Discrimination During the year, zero (0) incidents of discrimination were reported. Indigenous rights Umgeni Water subscribes fully to the Bill of Rights in terms of the Constitution of the Republic of South Africa (Act 108 of 1996). During the year, there were zero (0) reported incidents of violation of rights of indigenous people in any aspect of the organisation s business. Human Rights Remediation Zero (0) grievances related to human rights issues/contraventions were filed.


106 104 ANNUAL 1.0 PG PG 9-17 ORGANISATIONAL 3.0 PG MINISTER S FOREWORD 4.0 PG ACCOUNTING AUTHORITY S 5.0 PG CHIEF EXECUTIVE S 6.0 PG CORPORATE GOVERNANCE 7.0 PG STAKEHOLDER UNDERSTANDING AND SUPPORT 12 bursary students are being funded by Umgeni Water through the Umgeni Bursary Scheme MIDMAR
107 8.0 PG PERFORMANCE AGAINST SHAREHOLDER COMPACT 9.0 PG CREATING VALUE 10.0 PG CONSERVING OUR NATURAL RESOURCES 11.0 PG ENABLING OUR PEOPLE 12.0 PG IMPROVING RESILIENCY 13.0 PG FINANCIAL SUSTAINABILITY 14.0 PG GRI CONTENT INDEX 105 ANNUAL 12.0 Improving Resiliency 12.1 Operational Optimisation ISO Accredited Laboratory Services Assuring Water Quality Four modern ISO/IEC accredited laboratories make up the entity s Laboratory Services. These are Chemistry, Microbiology, Hydrobiology and Soil Chemistry Testing, all with a longestablished reputation of meeting international standards. Highly skilled and dedicated scientists, technicians, and laboratory support staff, utilising modern analytical techniques enable this facility to provide a world-class service, 365 days a year. During the year, the laboratory supported core business activities through: > Providing assurance that the entity produces potable water which complies with drinking water standards; > Assuring that treated effluent complies with wastewater and effluent discharge limits; > Assuring, via the above, public health protection from waterborne diseases and water-related health impacts; > Undertaking research and development and generation of scientific data for new infrastructure developments; > Supporting/auditing water treatment for process selection and optimisation; and > Undertaking catchment and river health monitoring to assess the status of water resources and quality of raw water supply. Water samples from the entire supply system (catchment to consumer) are collected by a team of dedicated sampling officers on a daily basis throughout Umgeni Water s operational area, and are assessed in terms of its physical, chemical and microbiological characteristics. The analytical results are produced within specified times that forms part of a Service Level Agreements with end users. Supported by LabWare Laboratory Information Management System (LIMS), water quality results are captured, validated, stored and reported. In addition, direct access is provided to external users via the Electronic Water Quality Management System (ewqms), the Blue Drop System (BDS) and the Green Drop System (GDS). Early warnings and alerts are provided to stakeholders immediately when a breach of quality standards is detected. An incident management protocol is followed, to contain and remedy the breach. The laboratory generates to analyses per month. Over analyses were generated in. In addition to assuring the quality of bulk water produced, the Laboratory Services provides water testing and sampling services to municipalities and various private sector clients. This valuable service supports and assists municipalities to improve their Blue and Green Drop compliance. During this financial year, the Resource Quality Information Services (RQIS) of the Department of Water and Sanitation contracted the Umgeni Water Laboratory Services to identify and enumerate algal samples from the National Eutrophication Monitoring Programme (NEMP), owing to the entity's expertise in this complex area. Many South African impoundments exhibit high nutrient enrichment (eutrophication) with consequent problems, including toxic algal blooms. However, many impoundments do not have regular eutrophication monitoring programmes, and the main aim of the NEMP is to fulfil this requirement for the more than 80 impoundments in South Africa. Umgeni Water Laboratory Services received approximately samples from these impoundments through DWS.
108 106 ANNUAL 1.0 PG PG 9-17 ORGANISATIONAL 3.0 PG MINISTER S FOREWORD 4.0 PG ACCOUNTING AUTHORITY S 5.0 PG CHIEF EXECUTIVE S 6.0 PG CORPORATE GOVERNANCE 7.0 PG STAKEHOLDER UNDERSTANDING AND SUPPORT Research, Development, and Innovation Umgeni Water recognises the importance of investing in Research, Development, and Innovation. The key objectives of its research programme include: > Addressing challenges of the water sector, including supporting economic growth and improving the quality of life; > Creating new water knowledge and finding technical solutions for better planning and water management leading to sustainable development; > Optimising operational processes and reducing costs; > Investigating new technology and improving water quality compliance; > Reducing demand through innovation; > Increasing water availability from exploring non-traditional sources of supply and re-use; > Protecting ecological infrastructure and biodiversity from the harmful effects of pollution; > Adapting to climate change; > Increasing competitiveness; > Protecting water resources, and reducing non-revenue water; > Providing research training and intellectual capital development; and > Aligning research programmes with the broader national policies and plans. Umgeni Water undertakes research with various sector partners, including the University of KwaZulu-Natal (UKZN) and Water Research Commission and has also established links with other academic institutions both nationally and internationally, and continues to collaborate with researchers worldwide. In 2011, the Umgeni Water Chair for Water Resources Management was established at UKZN to expand and complement its internal research programme. Specific aims of the Chair are to: > Establish mutually beneficial projects in teaching, research and technical services; > Building on existing projects and implementing new ones; > Making use of complementary skills and pursuing opportunities of a strategic nature locally, nationally, and internationally; > Explore beneficial opportunities to provide research projects to postgraduate students; > Supervise research projects; > Develop project proposals and research programmes; and > Seek ways in which there can be closer collaboration in research and development on technological and socioeconomic projects. The partnership with UKZN has proven hugely successful. Postgraduate students undertaking studies in water resources management and related fields were the main beneficiaries. In 2016, ten (10) students graduated with research degrees (seven MSc degrees, and three BSc Hons degrees). There were also six (6) journal publications. To date, over twenty (20) research projects are being undertaken by postgraduate students through the Chair for Water Resources Management. These straddle: water quality and land-use management, hydrology, community, water quality monitoring, wetlands, pollution control, alien plant management, water and wastewater treatment processes, sludge management and ecology. A large component of research is undertaken by subject matter specialists internally within the entity. Steady progress has been noted on a number of high priority projects as per Table Table 12.1: Research Projects Undertaken Internally Within Umgeni Water RESEARCH TITLE Determination of residual polymeric coagulants in potable water using gold nanoparticles. Development of an ELISA method for determination of endocrine disrupting compounds in wastewater. Durban Heights WTW filter investigations. Darvill WWTW process investigations and modelling. Disinfection for rural water systems. ** WRC K5/2361/3: Establishing the current practice and prospective management strategies for water treatment residues handling, disposal and re-use in South Africa. ** WRC K5/2396/3: evaluation and selection of an appropriate automatic coagulant dose control system for conventional water treatment plants. Laboratory based co-digestion of Fats, Oils and Grease (FOGs) with primary sludge. ** Completed projects OBJECTIVE To develop and validate a novel method for detecting low levels of polymers in water. To develop and validate a novel method for the detection and quantification of endocrine disrupting compounds in wastewater. To investigate problems related to poor filter performance including the identification and evaluation of practical, sustainable and cost-effective solutions. To optimise the simulation model for Darvill which will assist in the monitoring of the process, prediction of process performance and in the upgrade of the plant. The Aim is to investigate a novel disinfectant system especially designed for small water treatment systems. The disinfection system will be monitored and used as a model for new disinfection systems to be installed in the area. To give a clear direction on future strategies for WTR management and provide guidance on the cost and economy of scale applicable to each process, as well as suitability for recycling/reuse and recommend actions and changes needed to optimise and secure recycling opportunities. To determine appropriate methods for automatic coagulant dose control and investigate the use of a mathematical model based on historical plant data to control coagulant dose. To investigate the digestibility of fats, oils and grease with primary sludge under laboratory conditions. To develop a feeding regime guideline to inform optimal FOGs loading rates for Darvill digesters.
109 8.0 PG PERFORMANCE AGAINST SHAREHOLDER COMPACT 9.0 PG CREATING VALUE 10.0 PG CONSERVING OUR NATURAL RESOURCES 11.0 PG ENABLING OUR PEOPLE 12.0 PG IMPROVING RESILIENCY 13.0 PG FINANCIAL SUSTAINABILITY 14.0 PG GRI CONTENT INDEX 107 ANNUAL Assurance Through Robust Information and Communications Technology Systems The implementation of the SAP Enterprise Resource Planning (ERP) system continued to be a significant entity-wide focus during the reporting period. Umgeni Water's core business processes includes responding to customer and stakeholder requirements, effectively scheduling operations, managing and maintaining assets, managing projects, procurement and inventory records, enabling human resources and managing financial data, amongst many other business processes. During the reporting period the entity set itself targets to complete the Final Preparation stage, Cutover / Go-Live with the new system and put in place Post-Go-Live Support. The ERP system is set up to drive huge improvements in our operational efficiency and effectiveness, including: > Assisting in better defining and reviewing business processes; > Ensuring business processes are complied with throughout the process value chain; > Planning of workloads based on existing orders and forecasts, such as asset maintenance; > Providing tools to ensure the entity can provide a high level of service to customers; > Protecting critical business data through well-defined roles and security access; and > Translating data into decision-making information for all levels of stakeholders. As at 30 June 2017, the entity successfully completed the Final Preparation stage and Cutover / went Live with 90% of the components of the new system. Plans to resolve outstanding SAP project elements will be finalised and implemented in the new year. In addition, 95% of Post-Go-Live support was implemented as planned and planning for on-going sustainable support will be finalised in the new year. The successful implementation of SAP during the reporting period will ensure the entity is well positioned for its current future business as a leading water entity. Figure 12.1: Schematic of SAP ERP System Implemented by Umgeni Water in. R PRODUCTION PLANNING GOVERNANCE, RISK & COMPLIANCE R IS-UTILITIES HUMAN CAPITAL MANAGEMENT SAP ERP System PLANT MAINTENANCE R c FINANCE MacBook Pro water meter SALES & DISTRIBUTION APPROVED PROJECT SYSTEMS QUALITY MANAGEMENT MATERIALS MANAGEMENT
110 108 ANNUAL 1.0 PG PG 9-17 ORGANISATIONAL 3.0 PG MINISTER S FOREWORD 4.0 PG ACCOUNTING AUTHORITY S 5.0 PG CHIEF EXECUTIVE S 6.0 PG CORPORATE GOVERNANCE 7.0 PG STAKEHOLDER UNDERSTANDING AND SUPPORT 12.2 Risk Management Risk management at Umgeni Water is guided by an Integrated Risk Management Framework which is aligned to strategy, thereby ensuring a focused and directed process of risk management in the entity. The risk appetite and tolerance framework is reviewed and approved on an annual basis. The entity s strategic risks are shown in Table 12.2 and show the link to strategic perspectives, objectives and outcomes, as well as indicate how the risks have been treated/mitigated. Of a total of ten (10) strategic risks, one (1) strategic risk is rated as a High risk and is being mitigated as shown below. Table 12.2: Strategic Risks as at 30 June 2017 RISK # RISK NAME, SCORE AND STATUS CAUSE, CONTEXT AND TREATMENT MAIN STRATEGIC, PERSPECTIVE, OBJECTIVES AND OUTCOMES IMPACTED 1 Short-term water resources availability. > Overall response effectiveness: Poor 40%. > Severity: Significant: 300. > Probability: 100% Virtually certain and/ or already occurred. Risk Owner: GM Engineering and Scientific Services. SCORE 300 HIGH Cause and Context: Dam levels are such that there is a threat of nonsupply if mitigation measures are not put in place. (Restrictions, emergency schemes). Treatment Approach: On-going short-term water resources and demand management initiatives. Implementation of appropriate operating rules. Water rationing implemented as per the target percentage for applicable systems. Collaboration and partnerships to pool efforts, such as Joint Operating Committees. Customer and Stakeholder Perspective: SO1: Increase services and customers. SO2: Increase customer and stakeholder value. Organisational Capacity Perspective: SO8: Increase water resources sustainability. Outcomes: Water Resources Adequacy. Customer Satisfaction. Stakeholder Understanding and Support. Community and Environmental Sustainability. Risk Appetite and Tolerance > Outside Appetite > Outside Tolerance 2 Stability of integrated systems. > Overall response effectiveness: Reasonable 60%. > Severity: Moderate-High: 40. > Probability: 80% likely and/or could occur within 1 year. > Risk Owner: GM Corporate Services. SCORE 32 LOW Risk Appetite and Tolerance > Outside Appetite > Outside Tolerance Cause and Context: The Enterprise Resource Planning software does not optimise business as envisaged; mainly in consolidated reporting. Change management processes not addressing the culture changes emanating from the implementation of integrated systems, exacerbated by inadequate training & go-live support. Outstanding project items not delivered, including untested DRP and automated fail-over of production environment. Treatment Approach: Implementation of business warehouse and business intelligence consolidated reporting. Additional training. Support and maintenance of the system and system controls. Financial Perspective: SO4: Increase financial sustainability. Process Perspective: SO6: Improve service delivery systems. Organisational Capacity Perspective SO9: Increase skills and competency. Outcomes Operational Optimisation Operational Resiliency Leadership and Employee Development Financial Viability.
111 8.0 PG PERFORMANCE AGAINST SHAREHOLDER COMPACT 9.0 PG CREATING VALUE 10.0 PG CONSERVING OUR NATURAL RESOURCES 11.0 PG ENABLING OUR PEOPLE 12.0 PG IMPROVING RESILIENCY 13.0 PG FINANCIAL SUSTAINABILITY 14.0 PG GRI CONTENT INDEX 109 ANNUAL Table 12.2: Strategic Risks as at 30 June continued RISK # RISK NAME, SCORE AND STATUS CAUSE, CONTEXT AND TREATMENT MAIN STRATEGIC, PERSPECTIVE, OBJECTIVES AND OUTCOMES IMPACTED 3 Long-term water resources availability. > Overall response effectiveness: Reasonable 55%. > Severity: Moderate-High: 40. > Probability: 50% fairly poor and/ or could possibly occur within 2 years. > Risk Owner: GM Engineering & Scientific Services. SCORE Risk Appetite and Tolerance > Outside Appetite > Within Tolerance 4 Ability to adequately fund infrastructure investment. > Overall response effectiveness: Reasonable 60%. > Severity: Moderate-Low: 20. > Probability: 80% likely and/or could occur within 1 year. > Risk Owner: GM Engineering and Scientific Services. SCORE 20 LOW 16 LOW Risk Appetite and Tolerance > Outside Appetite > Within Tolerance Cause and Context: Customers will not be guaranteed 99% assurance of supply in the Mgeni System and 98% assurance of supply in the South Coast System as required, due to demand being higher than the yield within the next 5 years. Delay in the ministerial approval for the implementation of the Mkhomazi water project increases the risk of non-supply and the need for restrictions. Treatment Approach: Integrated planning and implementation for medium and long-term augmentation of systems with stakeholders. Water conservation and demand management initiatives. Review of water resources mix including reuse and desalination. Timely completion of target water resources projects including: Mgeni system: Completion of the umkhomazi Water Project is projected for North Coast system: Completion of the Lower Thukela Bulk Water Supply Scheme. South Coast system: Delay in implementation of the Lower umkhomazi BWSS. Construction expected to start in Cause and Context: Inability to secure required project grant funding and/or timing of receipt not aligned to funding requirements. Budgetary pressure resulting in fiscal constraints and rising cost of capital. Funding constraints imposed by borrowing limits & loan covenants. Disagreement of tariff by customer resulting in it being reduced could result in infrastructure not being implemented as planned. Alignment and prioritization of the infrastructure plan. Pressure to implement rural development projects without commensurate grant funding. Timeous approval to build infrastructure. Implementation of non-viable infrastructure resulting in inadequate return on investment. Mismatch between volume in customer's original request and actual off-take- the latter being either larger or smaller volumes. (Misaligned integrated planning between UW and the municipalities resulting in municipalities demanding more water from UW than they can distribute to the end-user, or alternatively utilising less water since their off-take infrastructure has not been completed as originally planned. Treatment Approach: Scenario planning using the tariff model to simulate scenarios (CAPEX acceleration, increase in cost and lower sales volumes, non-receipt of grant funding as per base case assumptions) and the effect on the tariff increase, operating cashflows, optimal debt level and covenants. Customer and Stakeholder Perspective: SO1: Increase services and customers. SO2: Increase customer and stakeholder value. Organisational Capacity Perspective: SO8: Increase water resources sustainability. Outcomes: Water Resources Adequacy. Customer Satisfaction. Stakeholder Understanding and Support. Community and Environmental Sustainability. Customer and Stakeholder Perspective: SO1: Increase services and customers. SO2: Increase customer and stakeholder value. Organisational Capacity Perspective: SO7: Improve and increase infrastructure assets. Outcomes Infrastructure Stability. Product Quality. Customer Satisfaction. Stakeholder Understanding and Support. Community and Environmental Sustainability. Planning meetings with the customers to ensure alignment of infrastructure plans. Internal meetings to ensure that the CAPEX plan addresses the customers needs and is in accordance with the organisational quality standards and affordability.
112 110 ANNUAL 1.0 PG PG 9-17 ORGANISATIONAL 3.0 PG MINISTER S FOREWORD 4.0 PG ACCOUNTING AUTHORITY S 5.0 PG CHIEF EXECUTIVE S 6.0 PG CORPORATE GOVERNANCE 7.0 PG STAKEHOLDER UNDERSTANDING AND SUPPORT Table 12.2: Strategic Risks as at 30 June continued RISK # RISK NAME, SCORE AND STATUS CAUSE, CONTEXT AND TREATMENT MAIN STRATEGIC, PERSPECTIVE, OBJECTIVES AND OUTCOMES IMPACTED 5 Performance of bulk wastewater infrastructure assets. > Overall response effectiveness: Good 75%. > Severity: Moderate-Low: 20. > Probability: 80% likely and/or could occur within 1 year. > Risk Owner: GM Operations. SCORE Risk Appetite and Tolerance > Outside Appetite > Within Tolerance 6 Sustainable Tariff > Overall response effectiveness: Good 70%. > Severity: Moderate-Low: 20. > Probability: 65% Even probability and/or could occur within 1-2 years. > Risk Owner: GM Finance. SCORE Risk Appetite and Tolerance > Outside Appetite > Within Tolerance 7 Breach of materiality and significance framework. > Overall response effectiveness: Good 80%. > Severity: Minor-Low: 5. > Probability: 80% likely &/or could occur within 1 year. > Risk Owner: GM Finance. SCORE 16 LOW 13 LOW 4.0 LOW Risk Appetite and Tolerance > Outside Appetite > Within Tolerance Cause and Context: Influent quality-illegal discharges from industries and storm water infiltration. Capacity and technology constraints, resulting in non-compliance with effluent discharge requirements. Unanticipated complexity of the Darvill upgrade project has led to project delays. Treatment Approach: Initiatives planned and implemented at each WWTW and critical refurbishment and upgrades of major works included and implemented as part of capital programme by target dates. Cause and Context: constraints on ability to charge a tariff that will ensure financial viability of Umgeni Water and protection of operating cashflows in view of low sales volumes resulting from the drought & higher than inflation input costs (major cost drivers). High energy cost impacted by changes in operating rules. Current raw water tariff pricing strategy and capital unit charge. High CAPEX investments with low returns and high impairment costs. Surpluses earned are not retained. Currently not all customers are breaking-even, significant cross subsidisation from Umgeni system. Treatment Approach: Strategic customer engagement on underlying assumptions for annual tariff review including the annual capital programme. Scenario planning using the tariff model to simulate scenarios (CAPEX acceleration, increase in cost and lower sales volumes, non-receipt of grant funding as per base case assumptions) and the effect on the tariff increase, operating cashflows, optimal debt level and covenants. Cause and Context: Incurring irregular, fruitless and wasteful expenditure as a result of lack of understanding and adherence to Supply Chain Management policies and procedures and other quantitative and qualitative aspects as identified in the entity's materiality and significance framework. Treatment Approach: Supply Chain Management policies and procedures reviewed, simplified and linked to legislation. Bid Committee oversight and assurance of compliance through on-going assessment of control effectiveness. Ongoing review and alignment of internal controls and systems. Customer and Stakeholder Perspective: SO2: Increase customer and stakeholder value. Organisational Capacity Perspective: SO7: Improve and increase infrastructure assets. Outcomes Infrastructure Stability Product Quality Customer Satisfaction Stakeholder Understanding and Support Community and Environmental Sustainability. Customer and Stakeholder Perspective: SO1: Increase services and customers. SO2: Increase customer and stakeholder value. Financial Perspective: SO4: Increase financial sustainability. Organisational Capacity Perspective: SO7: Improve and increase infrastructure assets. Outcomes: Financial Viability. Infrastructure Stability. Customer Satisfaction. Stakeholder Understanding and Support. Community and Environmental Sustainability. Customer and Stakeholder Perspective: SO2: Increase customer and stakeholder value. Financial Perspective: SO4: Increase financial sustainability. Process Perspective: SO6: Improve service delivery systems. Outcomes: Financial Viability. Stakeholder Understanding and Support. Operational optimisation. Operational resiliency.
113 8.0 PG PERFORMANCE AGAINST SHAREHOLDER COMPACT 9.0 PG CREATING VALUE 10.0 PG CONSERVING OUR NATURAL RESOURCES 11.0 PG ENABLING OUR PEOPLE 12.0 PG IMPROVING RESILIENCY 13.0 PG FINANCIAL SUSTAINABILITY 14.0 PG GRI CONTENT INDEX 111 ANNUAL Table 12.2: Strategic Risks as at 30 June continued RISK # RISK NAME, SCORE AND STATUS CAUSE, CONTEXT AND TREATMENT MAIN STRATEGIC, PERSPECTIVE, OBJECTIVES AND OUTCOMES IMPACTED 8 Protection and safeguarding of assets. > Overall response effectiveness: Reasonable 65%. > Severity: Minor-Low: 5. > Probability: 65% even probability and/or could occur within 1-2 years. > Risk Owner: GM Corporate Services. SCORE Risk Appetite and Tolerance > Outside Appetite > Within Tolerance 9 Ability to deliver projects on time and within budget. > Overall response effectiveness: Good 70%. > Severity: Minor-Low: 5. > Probability: 50% fairly poor and/or could possibly occur within 2 years. > Risk Owner: GM Engineering and Scientific Services. SCORE Risk Appetite and Tolerance > Within Appetite > Within Tolerance 10 Performance of bulk potable water infrastructure assets. > Overall Response Effectiveness: Excellent 95%. > Severity: Negligible: 1. > Probability: 35% doubtful and/or unlikely to occur within next 2 years. > Risk Owner: GM Operations. SCORE 3.0 LOW 3.0 LOW 1 LOW Risk Appetite and Tolerance > Within Appetite > Within Tolerance Cause and Context: Illegal settlements and unauthorised construction on properties and servitudes. Potential land claims on existing registered and servitudes to be acquired. Umgeni Water s right of access limited. General encroachment and impact on assets. Remote locations are difficult to secure or monitor resulting in an increase in theft and vandalism with damage to third party property and injury to staff. Service delivery protests affecting site accessibility and damage to infrastructure. Treatment Approach: Implementation of servitude management procedure. Safety and security measures to protect staff and public. Innovative solutions implemented for reduction in theft and vandalism of infrastructure and improvement in the internal control environment for ICTrelated assets. Properties and servitudes maintained and monitored. Disposal of property no longer in use. Cause and Context: Actual cost and delivery time of projects may significantly differ from approved plans. The variation may lead to undesirable impacts such as reputational damage and financial costs. Limited CPG validation in terms of technical, geographical match and financial capacity. Treatment Approach: Continued effective engineering, procurement and construction management (EPCM) process alignment within the specified time-frames. Cause and Context: Process failures, capacity and technology constraints at water treatment plants resulting in final water noncompliance with potable water standard. Treatment Approach: Initiatives planned and implemented at each WTW and critical refurbishment and upgrades of works included and implemented as part of asset programme. Customer and Stakeholder Perspective: SO2: Increase customer and stakeholder value. Organisational Capacity Perspective: SO7: Improve and increase infrastructure assets. Outcomes Infrastructure Stability. Stakeholder Understanding and Support. Community and Environmental Sustainability. Customer and Stakeholder Perspective: SO1: Increase services and customers. SO2: Increase customer and stakeholder value. Organisational Capacity Perspective: SO7: Improve and increase infrastructure assets. Outcomes Infrastructure Stability. Product Quality. Customer Satisfaction. Stakeholder Understanding and Support. Community and Environmental Sustainability. Customer and Stakeholder Perspective: SO2: Increase customer and stakeholder value. Organisational Capacity Perspective: SO7: Improve and increase infrastructure assets. Outcomes: Infrastructure Stability. Product Quality. Customer Satisfaction. Stakeholder Understanding and Support. Community and Environmental Sustainability. Financial risks are detailed in the Annual Financial Statement section of this Annual Report. Mitigated Risks Mitigated risks refer to risks that have been treated to an acceptable level with continual monitoring by Internal Audit to ensure the controls in place are still effective and efficient. There were no strategic risks mitigated. Emerging Risks The entity regularly reviews the internal and external landscapes with a view to identifying emerging risks. Climate change remains on the radar as an emerging strategic risk and divisional emerging risks are constantly monitored e.g. Cyber Security risk.


114 112 ANNUAL 1.0 PG PG 9-17 ORGANISATIONAL 3.0 PG MINISTER S FOREWORD 4.0 PG ACCOUNTING AUTHORITY S 5.0 PG CHIEF EXECUTIVE S 6.0 PG CORPORATE GOVERNANCE 7.0 PG STAKEHOLDER UNDERSTANDING AND SUPPORT hours spent on employee skills development IMVUTSHANE DAM
115 8.0 PG PERFORMANCE AGAINST SHAREHOLDER COMPACT 9.0 PG CREATING VALUE 10.0 PG CONSERVING OUR NATURAL RESOURCES 11.0 PG ENABLING OUR PEOPLE 12.0 PG IMPROVING RESILIENCY 13.0 PG FINANCIAL SUSTAINABILITY 14.0 PG GRI CONTENT INDEX 113 ANNUAL Financial Viability Umgeni Water maintained positive results in the year due to continued sound financial management: Revenue (Group) generated was Surplus for the year (Group) was Balance sheet reserves were R2.5 billion R746 MILLION R6.8 billion In 2017 In 2017 In Financial Review 13.1 Introduction The 2017 financial year has had both challenges and successes. The operating environment continued to put a strain on the organisation as the drought continued. However, Umgeni Water has continued with good operating performance by managing factors within its control. The organisation had a successful SAP implementation during the year which went live in March All major organisational business processes are now managed in SAP. Operating profits were 8% lower at R593m (2016: R645m), while gross profit margins reduced by a further 3% and profits for the year declined by 4%. These were as a direct result of the drought which has impacted negatively on both the sales volumes and some of the direct operating costs. Some of the capital expenditure has been delayed in order to defer raising new debt and manage costs so as not to risk any breaches in loan covenants. To this end the prioritisation of capital expenditure is a key focus area for the organisation. Umgeni Water measures its financial performance in terms of its achievement against financial indicators which are aligned to the organisation s strategic objectives and are included in the key performance indicators section of the annual report, page 57 to 63.
116 114 ANNUAL 1.0 PG PG 9-17 ORGANISATIONAL 3.0 PG MINISTER S FOREWORD 4.0 PG ACCOUNTING AUTHORITY S 5.0 PG CHIEF EXECUTIVE S 6.0 PG CORPORATE GOVERNANCE 7.0 PG STAKEHOLDER UNDERSTANDING AND SUPPORT 13.2 Operating Performance Overview of operating performance Year on year changes of group operating performance Bulk water revenue grew by 3% as a result of the combined impact of a 9% bulk water tariff increase and a 6% reduction in sales volumes, whilst the direct operating costs increased by 13% driven primarily by the main cost drivers. The 25% increase in wastewater is due to new operating and maintenance contracts to manage wastewater treatment works on behalf of some of our customers, some of which came into effect in the prior year and were fully operational in the current year. Other operating and administrative expenses were up by 6%. Impairments on property, plant and equipment were lower in the current year at R42m (2016: R133m). Net finance income has increased by 12% mainly due to higher interest income earned on funds invested due to delays in the capital expenditure programme Movement 2016 R m % R m Revenue Water Wastewater Section Cost of sales (1 179) 13 (1 040) Water (937) 9 (856) Wastewater (88) 17 (75) Section 30 (154) 41 (109) Gross profit GP% 53% (3%) 56% Other income 32 (14) 37 Other operating and administration expenses (770) 6 (729) Profit from operations 593 (8) 645 Net fi nance income Share of profit from associate Profit before tax 746 (4) 781 Revenue (R'm) Gross profit % % 54% 53% 56% 53%
117 8.0 PG PERFORMANCE AGAINST SHAREHOLDER COMPACT 9.0 PG CREATING VALUE 10.0 PG CONSERVING OUR NATURAL RESOURCES 11.0 PG ENABLING OUR PEOPLE 12.0 PG IMPROVING RESILIENCY 13.0 PG FINANCIAL SUSTAINABILITY 14.0 PG GRI CONTENT INDEX 115 ANNUAL 13.2 Operating Performance (continued) Overview of operating performance (continued) Year on year changes of group operating performance (continued) Total costs (excluding finance costs) (R'm) Profit for the year (R'm) Main cost drivers Other costs Return on assets 15.57% 13.18% 11.45% 8.43% 7.04% Main cost drivers included in cost of sales The main cost drivers for direct operating costs are chemicals, energy, maintenance, raw water and staff costs which account for 72% (2016: 72%) of cost of sales. Cost of sales increased by 13% year on year as a result of increases in the main cost drivers. Energy costs were up by 14% as pumping continued throughout the year to assist with alleviating the drought, whilst the average energy tariff increase for the year was 9%. Staff costs grew by 12%, as a result of the average salary increases of 8% for the year and additional contract staff to support new business and the SAP ERP implemented in March Raw water costs increased by 9%. The average raw water tariff increase was 12%, whilst volumes extracted from the Mgeni system which is the main source of supply were 8% lower as restrictions remained in place in this system for the year under review. Maintenance costs increased by 13% due to renewals undertaken at some of the major plants to ensure these assets are maintained at a standard that continues to ensure the required quantity and quality of product can be delivered. Chemical costs increased by 21% primarily due to increased usage as a result of additional treatment required for poor quality raw water influenced to a major extent by the drought. The average price increase for chemicals was 4% for the year.
118 116 ANNUAL 1.0 PG PG 9-17 ORGANISATIONAL 3.0 PG MINISTER S FOREWORD 4.0 PG ACCOUNTING AUTHORITY S 5.0 PG CHIEF EXECUTIVE S 6.0 PG CORPORATE GOVERNANCE 7.0 PG STAKEHOLDER UNDERSTANDING AND SUPPORT 13.2 Operating Performance (continued) Overview of operating performance (continued) Main cost drivers included in cost of sales (continued) Chemicals (R'm) Energy (R'm) R R0.51 R0.10 R0.09 R0.11 R R R0.28 R0.38 R Chemicals Bulk water chemicals cost per kl Energy Bulk water energy cost per kl Maintenance (R'm) Direct staff costs (R'm) 137 R R R R R R R R R R Maintenance Bulk water maintenance cost per kl Direct staff costs Bulk water direct staff costs cost per kl Raw water (R'm) R0.38 R0.43 R0.35 R0.38 R Raw water Raw water cost per kl
119 8.0 PG PERFORMANCE AGAINST SHAREHOLDER COMPACT 9.0 PG CREATING VALUE 10.0 PG CONSERVING OUR NATURAL RESOURCES 11.0 PG ENABLING OUR PEOPLE 12.0 PG IMPROVING RESILIENCY 13.0 PG FINANCIAL SUSTAINABILITY 14.0 PG GRI CONTENT INDEX 117 ANNUAL 13.2 Operating Performance (continued) Overview of operating performance (continued) Other operating and administration expenses and net finance income Other operating and administration costs increased by 6%. Impairments on property, plant and equipment were lower at R42m (2016: R133m), while indirect staff costs were up by 24% as a result of incentive bonuses provided for in line with the approved policy in terms of the retention mechanisms in place as well as the settlement reached with the Chief Executive which was accrued for at year end. Net finance income increased by 12%. Interest income on investments was 13% higher at R150m (2016: R133m) while finance costs after borrowing costs capitalised were R1m (2016: R1m). Borrowing costs capitalised to qualifying assets totalled R211m (2016: R142m). Other operating & admin costs (R'm) Net finance income (R'm) Bulk water sales volume analysis Bulk water sales volumes reduced by a further 5.9% in the current year as the drought continued to put a strain on the main Mgeni system which provides approximately 90% of the water supply. The positive volume growth for customers in the northern regions is due to the lifting of restrictions in the Hazelmere system in the current year. Water sold (kl'm)
120 118 ANNUAL 1.0 PG PG 9-17 ORGANISATIONAL 3.0 PG MINISTER S FOREWORD 4.0 PG ACCOUNTING AUTHORITY S 5.0 PG CHIEF EXECUTIVE S 6.0 PG CORPORATE GOVERNANCE 7.0 PG STAKEHOLDER UNDERSTANDING AND SUPPORT 13.2 Operating Performance (continued) Bulk water sales volume analysis (continued) Volume by customer and % change kl'000 % kl'000 % kl'000 % kl'000 % kl'000 % ethekwini MM % % % (3.4%) (6.6%) Other customers % % % % (4.1%) Msunduzi LM (0.4%) % % (0.6%) (10.6%) umgungundlovu DM % % (0.1%) % (4.8%) Sembcorp Siza Water (3.0%) % (6.9%) (24.8%) % Ugu DM % % % % % ilembe DM % % (5.1%) (23.3%) % Harry Gwala DM % 862 (7.9%) 837 (2.9%) 661 (21.0%) % Other 138 (95.8%) % 146 (8.9%) 130 (9.5%) 119 (8.5%) Total % % % (2.4%) (5.9%) Bulk water cost per kilolitre (kl) The average cost of bulk water per kl increased by 12.6%, primarily due to the increases in the main cost drivers included in cost of sales and lower sales volumes. Cost per kl of bulk water (R.c) Direct Indirect-other Indirect-asset impairments Net finance income 13.3 Bulk Water Tariff The average Umgeni Water bulk water tariff increase for was 9% and the bulk water tariff increase for the next financial year, effective 1 July 2017, has been approved at 15% after taking into consideration the impact of the drought and the operating cash flows required to repay debt.
121 8.0 PG PERFORMANCE AGAINST SHAREHOLDER COMPACT 9.0 PG CREATING VALUE 10.0 PG CONSERVING OUR NATURAL RESOURCES 11.0 PG ENABLING OUR PEOPLE 12.0 PG IMPROVING RESILIENCY 13.0 PG FINANCIAL SUSTAINABILITY 14.0 PG GRI CONTENT INDEX 119 ANNUAL 13.3 Bulk Water Tariff (continued) Average tariff per kl (R.c) Cash Flow Analysis Operating cash flows were R812m (2016: R1 141m) a 29% reduction year on year as a result of the lower sales volumes as well as increased working capital requirements. Cash used in investing activities totalled R799m (2016: R1 751m) mainly due to the investment in infrastructure as R1 126m (2016: R1 978m) was spent on capital projects and R371m (2016: R280m) grant funding was received for development projects. Cash used in financing activities was R32m (2016: R617m) which consisted of R79m (2016: R78m) loan repayments and R110m (2016: R5m) net interest paid whilst investments reduced by R156m. The operating cash after scheduled repayment of debt was not sufficient to fund investing activities requirements, thus investments were utilised to fund the shortfall required for capital expenditure. Cashflow from operations (R'm) Cash flows from operations vs cash used in investing activities (R'm) Investing Activities Cashflow from operations
122 120 ANNUAL 1.0 PG PG 9-17 ORGANISATIONAL 3.0 PG MINISTER S FOREWORD 4.0 PG ACCOUNTING AUTHORITY S 5.0 PG CHIEF EXECUTIVE S 6.0 PG CORPORATE GOVERNANCE 7.0 PG STAKEHOLDER UNDERSTANDING AND SUPPORT 13.5 Capital Projects The capital expenditure programme is based on Umgeni Water s infrastructure master plan which is aligned to the KZN provincial and local strategic priorities and is estimated at R6 127m for the next 5 years as per the Corporate Business Plan for The capital expenditure commitments for the next five years will be funded through a combination of available cash investments, operating cash flows, R647m from regional bulk infrastructure grants and new debt in For further details on the funding requirements, refer to section Capital expenditure During the year capital expenditure including intangible assets totalled R1 172m (2016: R2 034m). Details of major projects are included in the infrastructure section of the annual report on page 74. Umgeni Water had a successful SAP implementation during March 2017 which has resulted in all major business processes being streamlined and managed in a single ERP with a fully integrated approach for all modules implemented. Capital expenditure - Group (R'm) Budget 2018 Expansion & augmentation Rural Development Upgrade & rehabilitation Movables Development projects In response to customer water demands and the need to eliminate water service delivery backlogs, a specific allocation of R837m for development projects has been made for the period 2018 to Due to their developmental nature, there is a need for government support via subsidy or grant funding for part of the social component of the development projects which cannot be recovered through the existing tariff structure. The social component carried by Umgeni Water is reflected in the statement of profit and loss as impairments. These impairments are recognised during the construction period and reflected in work in progress on a progressive basis. Developmental projects funding & impairments June 2017 Total Projected cost Projected funding split Regional bulk infrastructure grant funding UW funding Total project Cost June Impairment 2017 Impairment Project System R'000 R'000 R'000 R'000 % R'000 Impendle Upper Umgeni % 386 0% 100% Greater Mpofana Phase 1 Mooi % % 50% Lower Thukela Bulk Water Supply Phase 1 Lower Thukela % - 55% 45% umshwathi Bulk Water Supply Scheme (Wartburg Phase 1-3) Wartburg System % - 97% 3% TOTAL % 43% * Total project cost include interest and escalation Impairments on development infrastructure commissioned and included under buildings and infrastructure totalled R3m (2016: R95m). Further details on impairments are included in note 9 of the financial statements.
123 8.0 PG PERFORMANCE AGAINST SHAREHOLDER COMPACT 9.0 PG CREATING VALUE 10.0 PG CONSERVING OUR NATURAL RESOURCES 11.0 PG ENABLING OUR PEOPLE 12.0 PG IMPROVING RESILIENCY 13.0 PG FINANCIAL SUSTAINABILITY 14.0 PG GRI CONTENT INDEX 121 ANNUAL 13.5 Capital Projects (continued) Development projects (continued) Capital expenditure on development projects and grant funding (R'm) Capital expenditure Grant funding Projected The projected capital expenditure is per the approved 2018 business plan, whilst the projected grant funding is per the latest approved RBIG funding schedule received from the Department of Water and Sanitation in June Investments Financial investments decreased by 6% from R1 915m in 2016 to R1 797m in the current year. Investments were utilised to fund the capital expenditure shortfall not met by operating cash flows and grant funding received. It is anticipated that investments will further decrease in the short to medium-term to fund the organisations capital expenditure programme. Investments (R'm) Other Liquidity buffer 13.7 Debt Management Debt Management is a key focus area at Umgeni Water and is integral to the delivery of sustainable financial business solutions. Umgeni Water targets a debt: equity ratio of 0.67 and an interest rate structure of 70% fixed and 30% variable. The debt: equity ratio improved by 15% to 0.29 (2016: 0.34) while the interest rate structure is 86% fixed and 14% variable (2016: 85% fixed and 15% variable). The high fixed rate structure is as a result of the two bonds in issue (UG21 and UG26) which comprise 79% of the total interest bearing liabilities. The gross weighted average cost of capital was 10.59% (2016: 10.53%) at the end of June. During the year R79m collectively was repaid towards the DBSA and EIB loans.
124 122 ANNUAL 1.0 PG PG 9-17 ORGANISATIONAL 3.0 PG MINISTER S FOREWORD 4.0 PG ACCOUNTING AUTHORITY S 5.0 PG CHIEF EXECUTIVE S 6.0 PG CORPORATE GOVERNANCE 7.0 PG STAKEHOLDER UNDERSTANDING AND SUPPORT 13.7 Debt Management (continued) R m R m Debt Long-term Short-term Total Debt (Decrease)/Increase in debt (78) 857 Debt: Equity (ratio) Debt: Assets (ratio) Funding requirements Umgeni Water will continue to fund its operating and capital expenditure requirements in the most cost effective way while diversifying its sources of funding. Umgeni Water s funding sources encompass: > Issuing through its DMTN programme which has an authorised amount of R4 000m: > new bonds for long-term funding requirements; > commercial paper and other short-term notes for short to medium term needs; > utilising development funding (including grant funding); and > Bank loans. As per the Corporate Business Plan for 2018 the detailed cash flow forecasts have been prepared for the next five years, taking into account the group s R6 127m planned capital expenditure (unescalated) and is detailed in the table that follows: Financial year Short-term Medium-term Long-term R m R m R m R m R m Operational cash fl ows Capex (Escalated) (1 500) (1 660) (1 293) (1 360) (1 577) Net operating cash (shortfall) after capex (368) (341) Capex-grants: confi rmed Net fi nancing activities 161 (346) (302) (638) (211) Annual funding requirements 130 (525) (14) (310) 86 The funding requirements in the short to medium term will be funded via the utilisation of existing financial investments and new debt in Further details of the various sources of funding available to Umgeni Water can be found in note 30 of the financial statements.
125 8.0 PG PERFORMANCE AGAINST SHAREHOLDER COMPACT 9.0 PG CREATING VALUE 10.0 PG CONSERVING OUR NATURAL RESOURCES 11.0 PG ENABLING OUR PEOPLE 12.0 PG IMPROVING RESILIENCY 13.0 PG FINANCIAL SUSTAINABILITY 14.0 PG GRI CONTENT INDEX 123 ANNUAL 13.7 Debt Management (continued) Borrowing limits The borrowing limits for the period 2016 to 2019 have been approved by the Minister of Water and Sanitation with the concurrence of the Minister of Finance. The borrowing limit is applicable to the value of gross borrowings, collateral & guarantees exposure and may not exceed the approved limits. The conditional limits may be availed by motivation to National Treasury. Total Amount Conditional Unconditional R m R m R m Utilisation of the borrowing limit as at 30 June 2017 was as follows: R'm Actual gross borrowings Collateral and guarantees 1 Total actual borrowings Borrowing limit Underutilisation 598 Debt & borrowing limits (R'm) Debt Borrowing limits Projected borrowing level Umgeni Water expects to remain within the approved borrowing limits for the 5 year projected period 2018 to 2022 and will closely monitor the borrowing levels and capital expenditure costs in line with the approved borrowing limits. Project borrowing level (R'm)
126 124 ANNUAL 1.0 PG PG 9-17 ORGANISATIONAL 3.0 PG MINISTER S FOREWORD 4.0 PG ACCOUNTING AUTHORITY S 5.0 PG CHIEF EXECUTIVE S 6.0 PG CORPORATE GOVERNANCE 7.0 PG STAKEHOLDER UNDERSTANDING AND SUPPORT 13.7 Debt Management (continued) Credit ratings Fitch Ratings agency re-affirmed Umgeni Water's long-term and senior unsecured ratings at AA+ and short-term rating at F1+ in July The affirmation reflects stability in Umgeni Water's stand-alone profile due to cost effective tariffs and relatively stable funds from operations. There was also positive pronouncement from Standard and Poor's during the recalibration of the nation and regional scale mapping table, resulting in Umgeni Water national scale rating being AAA for long-term and AA- short-term Retirement Benefit Obligations Defined benefit pension plan In terms of IAS19, the group s retirement benefit plan is in an under-funded position of R172m (2016: R203m) and in terms of the approved accounting policy the full amount has been recognised in the statement of financial position in order to account for this liability. Further details are disclosed in note 26 to the financial statements. Retirement Medical Aid This scheme is currently unfunded and the group has recognised its full past service liability in the statement of financial position at the actuarial valuation of R397m (2016: R390m) Financial Risks As in most companies, Umgeni Water is faced with financial risks that need to be effectively managed in order to ensure that any negative impact on the group s financial performance and position is minimised. The major risks to the organisation and the mitigating strategies are analysed in note 30 on financial risk management to the financial statements and the Corporate Risk Management Section of the annual report on page 108 to Future Prospects The strategy going forward will be to ensure financial resilience as the drought continues to put a strain on financial resources with a specific focus on managing costs to ensure that debt covenants are not breached. To this end capex projects will continue to be prioritised in accordance with assurance of water supply and there will be continued increased efforts to secure grant funding.
127 8.0 PG PERFORMANCE AGAINST SHAREHOLDER COMPACT 9.0 PG CREATING VALUE 10.0 PG CONSERVING OUR NATURAL RESOURCES 11.0 PG ENABLING OUR PEOPLE 12.0 PG IMPROVING RESILIENCY 13.0 PG FINANCIAL SUSTAINABILITY 14.0 PG GRI CONTENT INDEX 125 ANNUAL Group five-year key performance indicators Movement Performance criteria/indicators Total revenue (R'm) % Profi t from operations/revenue (11.11%) Total expenditure/revenue % Cost of sales/revenue % Capex spend (R'm) (including intangibles) (42.38%) Bulk water business segment Treated water volume sold (kl'000) (5.93%) Raw water volume sold (kl'000) (1.75%) Total water sold (kl'000) (5.92%) Bulk water tariff 1 (Rc/kl) % Bulk water tariff 2 (Rc/kl) % WRC levy (Rc/kl) % Total bulk cost/volume sold (Rc/kl) (1) % kl'000 sold per employee (1) (9.85%) Operating risk indicators Working ratio % Operating costs (excl depreciation and amortisation) divided by revenue Rate of return on assets 7.04% 8.43% 11.45% 13.18% 15.57% (1.39%) Profi t from operations divided by assets (excl investments) Gross profi t margin ratio 53.02% 56.22% 57.25% 53.05% 54.43% (3.20%) Debtors collection period (days) after provision for doubtful debts Trade and other receivables (excl VAT; grant funding and advance invoicing) divided by revenue x 365 Financial risk indicators Current ratio % Current assets divided by current liabilities Interest cover before interest capitalised (37.78%) Profi t from operations divided by fi nance costs before interest capitalised Debt: equity ratio (14.71%) Total interest-bearing debt divided by capital and reserves Debt: asset ratio (9.52%) Total interest-bearing debt divided by total assets (1) These indicators have been calculated using treated water volumes only.
128 126 ANNUAL 1.0 PG PG 9-17 ORGANISATIONAL 3.0 PG MINISTER S FOREWORD 4.0 PG ACCOUNTING AUTHORITY S 5.0 PG CHIEF EXECUTIVE S 6.0 PG CORPORATE GOVERNANCE 7.0 PG STAKEHOLDER UNDERSTANDING AND SUPPORT Group five-year key performance indicators (continued) R 000 R 000 R 000 R 000 R 000 Financial position Capital and reserves Net debt ( ) ( ) ( ) Assets excluding investments Total interest-bearing debt Total investments Total assets Financial performance Revenue Cost of sales ( ) ( ) ( ) ( ) ( ) Gross Profit Other income Other operating and administration expenses ( ) ( ) ( ) ( ) ( ) Profit from operations Net fi nance income Share of profi t from associate Profit before taxation Taxation (101) (65) Profit for the year Cash flow Net cash from operating activities Net cash used in investing activities ( ) ( ) ( ) ( ) ( ) Net cash (utilised) generated ( ) ( ) Net cash (used in) from fi nancing activities (32 035) (57 805) ( ) Net decrease (increase) for the year (5 952) (5 240) (25 082) Net cash generated (utilised) (13 067) (82 887) ( )
129 8.0 PG PERFORMANCE AGAINST SHAREHOLDER COMPACT 9.0 PG CREATING VALUE 10.0 PG CONSERVING OUR NATURAL RESOURCES 11.0 PG ENABLING OUR PEOPLE 12.0 PG IMPROVING RESILIENCY 13.0 PG FINANCIAL SUSTAINABILITY 14.0 PG GRI CONTENT INDEX 127 ANNUAL Value added statement R 000 R 000 R 000 R 000 R 000 Gross revenue Paid to suppliers for materials and services ( ) ( ) ( ) ( ) ( ) Value added Income from investments Total wealth created Salaries, wages and other benefits Providers of debt capital Depreciation Profi t for the year Total wealth distributed Profit for the year (44%) Profit for the year (49%) Salaries, wages and other benefits (45%) Salaries, wages and other benefits (41%) Providers of debt capital (0%) Providers of debt capital (0%) Depreciation (11%) Depreciation (10%) Employee statistics Movement Number of employees as at year-end % Gross revenue per employee (R'000) % Value added per employee (R'000) % Wealth created per employee (R'000) %
130 128 ANNUAL 1.0 PG PG 9-17 ORGANISATIONAL 3.0 PG MINISTER S FOREWORD 4.0 PG ACCOUNTING AUTHORITY S 5.0 PG CHIEF EXECUTIVE S 6.0 PG CORPORATE GOVERNANCE 7.0 PG STAKEHOLDER UNDERSTANDING AND SUPPORT Statement of Accounting Authority Responsibilities and Approval of the Financial Statements The Accounting Authority is responsible for the integrity and preparation and fair presentation of the annual financial statements of Umgeni Water and its subsidiaries (the group). The Accounting Authority is required by the Public Finance Management Act No.1 of 1999 to keep full and proper records of the financial affairs of the group and its performance against predetermined objectives at the end of the year. The financial statements set out in this report have been prepared in accordance with International Financial Reporting Standards (IFRS) as approved by National Treasury in terms of section 79 of the Public Finance Management (Act No.1 of 1999), as amended, and in the manner required by the Water Services (Act No. 108 of 1997). The preparation of financial statements in conformity with IFRS requires management to consistently apply appropriate accounting policies, supported by reasonable and prudent judgements and estimates. The financials have been prepared on a going concern basis under the supervision of the Acting Chief Financial Officer, Marsha Phillips CA (SA). The Accounting Authority is also responsible for the oversight of the group s system of internal controls. To enable the directors to meet their responsibilities, the Board sets standards and management implement systems of internal control aimed at reducing the risk of error or loss in a cost-effective manner. These standards include policies, procedures, proper division of responsibilities within a clearly defined framework and effective accounting procedures to ensure an acceptable level of risk. Both management and internal audit monitor controls and actions are taken to correct deficiencies as they are identified. The focus of risk management in the group is on identifying, assessing, managing and monitoring all known forms of risk across the group. While operating risks cannot be fully eliminated, the group strives to minimise these risks by ensuring that appropriate infrastructure, controls, systems and ethical behavior are applied and managed within predetermined procedures and constraints. The external auditor is responsible for independently auditing and expressing an independent opinion on the financial statements in accordance with International Standards on Auditing, the Public Audit (Act No. 25 of 2004), Public Finance Management Act No.1 of 1999 and the Companies (Act No. 71 of 2008). The entity s external auditor, Auditor-General of South Africa, has audited the financial statements after having been provided unrestricted access to all financial records and related data. The Accounting Authority believes that all representations made to the external auditor during the audit were valid, appropriate and complete. Nothing significant has come to the attention of the Accounting Authority to indicate that any material breakdown in the functioning of controls, procedures and systems has occurred during the year under review. The Accounting Authority is of the opinion, based on the information and explanations given by management, the internal auditors and the external auditors, that the systems of internal control provide reasonable assurance that the financial records may be relied on for the preparation of the consolidated financial statements and that accountability for assets and liabilities is maintained. The Audit Committee has evaluated Umgeni Water and the group s financial statements and has recommended its approval to the Accounting Authority. The Audit Committee s approval is set out on page 129. The Accounting Authority has reviewed the group s forecast financial performance for the year to 30 June 2018 as well as the longer term business plans and, in light of this review and the current financial position, he is satisfied that the group has access to adequate resources to continue as a going concern for the foreseeable future. In the opinion of the Accounting Authority, based on the information available to date, the financial statements fairly present the financial position of Umgeni Water and the group as at 30 June 2017 and the results of its operations and cash flow information for the year then ended. Approval of Financial Statements The financial statements set out on pages 135 to 196 were approved by the Accounting Authority on 20 September Approved by Mr. T Hlongwa CA (SA) Acting Chief Executive
131 8.0 PG PERFORMANCE AGAINST SHAREHOLDER COMPACT 9.0 PG CREATING VALUE 10.0 PG CONSERVING OUR NATURAL RESOURCES 11.0 PG ENABLING OUR PEOPLE 12.0 PG IMPROVING RESILIENCY 13.0 PG FINANCIAL SUSTAINABILITY 14.0 PG GRI CONTENT INDEX 129 ANNUAL Report of the Audit Committee Report of the Audit Committee in terms of regulation 27.1 of the Public Finance Management Act No. 1 of 1999, as amended The Audit Committee reports that it has adopted appropriate formal terms of reference as its audit committee charter, has regulated its affairs in compliance with this charter, and has discharged all of its responsibilities contained therein. In the conduct of its duties, the Audit Committee has, inter alia, reviewed the following: > Internal control, risk management and compliance with legal and regulatory provisions: > The effectiveness of the internal control systems; > the risk areas of the entity s operations covered in the scope of internal and external audits; > the effectiveness of the system of and process of risk management including the following specific risks: > financial reporting; > internal financial controls; > fraud risks relating to financial reporting; and > information technology risks relating to financial reporting; and > the effectiveness of the entity s compliance with legal and regulatory provisions. > Financial information and finance function: > The adequacy, reliability and accuracy of financial information provided by management and other users of such information; and > the experience, expertise and resources of the finance function. > Internal and external audit: > Accounting and auditing concerns identified as a result of internal and external audits; > the effectiveness of internal audit; > the activities of internal audit, including its annual work programme, co-ordination with the external auditor, the reports of significant investigations and the responses of management to specific recommendations; and > the independence and objectivity of the external auditor. The Audit Committee is of the opinion, based on the information and explanations given by management and internal audit and discussions with the independent external auditors on the result of their audits, that: > The internal accounting controls are adequate to ensure that the financial records may be relied upon for preparing the financial statements, and accountability for assets and liabilities is maintained; > the expertise, resources and experience of the finance function are adequate; > the system and process of risk management and compliance processes are adequate; > the effectiveness of the combined assurance function is adequate and the internal audit charter was approved by the audit committee; and > is satisfied with the independence and objectivity of the external auditors. Nothing significant has come to the attention of the Audit Committee to indicate that any material breakdown in the functioning of these controls, procedures and systems has occurred during the year under review. The Audit Committee is satisfied that the financial statements are based on appropriate accounting policies, supported by reasonable and prudent judgments and estimates. In line with the principles of combined assurance as outlined in King III report on corporate governance, Umgeni Water has developed a combined assurance model which provides a co-ordinated approach to all assurance activities. The Audit Committee has evaluated the financial statements of Umgeni Water and the group for the year ended 30 June 2017 and, based on the information provided to the Audit Committee, considers that they comply, in all material respects, with the requirements of the Public Finance Management Act No. 1 of 1999, as amended, and International Financial Reporting Standards. The Audit Committee concurs with the Accounting Authority that the adoption of the going concern premise in the preparation of the financial statements is appropriate. The Audit Committee has therefore recommended, at their meeting held on 12 September 2017, the adoption of the financial statements by the Accounting Authority. Dr. B Mkhize Audit Committee Chair 12 September 2017
132 130 ANNUAL 1.0 PG PG 9-17 ORGANISATIONAL 3.0 PG MINISTER S FOREWORD 4.0 PG ACCOUNTING AUTHORITY S 5.0 PG CHIEF EXECUTIVE S 6.0 PG CORPORATE GOVERNANCE 7.0 PG STAKEHOLDER UNDERSTANDING AND SUPPORT Report of the Auditor-General Report of the Auditor-General to Parliament on Umgeni Water Report on the audit of the consolidated and separate financial statements Opinion 1. I have audited the consolidated and separate financial statements of Umgeni Water set out on pages 135 to 196, which comprise the consolidated and separate statements of financial position as at 30 June 2017, the consolidated and separate statements of profit or loss and other comprehensive income, statements of changes in equity and statements of cash flows for the year then ended, as well as the notes to the consolidated and separate financial statements, including a summary of significant accounting policies. 2. In my opinion, the consolidated and separate financial statements present fairly, in all material respects, the consolidated and separate financial position of Umgeni Water as at 30 June 2017, and its financial performance and cash flows for the year then ended in accordance with the International Financial Reporting Standards (IFRS) applicable and the requirements of the Public Finance Management Act of South Africa (Act 1 of 1999) (PFMA) and the Companies Act of South Africa, 2008 (Act 71 of 2008) (Companies Act). Basis for opinion 3. I conducted my audit in accordance with the International Standards on Auditing (ISAs). My responsibilities under those standards are further described in the auditor-general s responsibilities for the audit of the consolidated and separate financial statements section of my report. 4. I am independent of the entity in accordance with the International Ethics Standards Board for Accountants Code of ethics for professional accountants (IESBA code) and the ethical requirements that are relevant to my audit in South Africa. I have fulfilled my other ethical responsibilities in accordance with these requirements and the IESBA code. 5. I believe that the audit evidence I have obtained is sufficient and appropriate to provide a basis for my opinion. Key audit matters 6. Key audit matters are those matters that, in my professional judgement, were of most significance in my audit of the consolidated and separate financial statements for the current period. These matters were addressed in the context of my audit of the consolidated and separate financial statements as a whole, and in forming my opinion on them, I do not provide a separate opinion on these matters. Key audit matter How the matter was addressed in the audit Impairment of capital work in progress The impairment of capital work in progress of R39.14 million in note 9 of the consolidated and separate financial statements is considered significant for Umgeni Water and its subsidiaries. Significant judgements and assumptions are applied by management to determine the appropriate value of capital work in progress based on the value in use of each appropriate cash-generating unit. The value in use calculation requires judgements and key assumptions to determine the following: > Future sales volumes; > Future cash flows; and > Discount rates. Accordingly, the impairment of capital work in progress is considered a key audit matter. My audit procedures included considering the appropriateness of the judgements and assumptions applied by management to the determination of the impairment of capital work in progress in terms of the requirements of International Accounting Standard 36: Impairment of assets (IAS 36). My audit procedures focused on the significant inputs used by management in their calculation. I obtained an understanding and tested the operating effectiveness of relevant internal controls over the determination of impairments and I was satisfied with the results thereof. I assessed the appropriateness of the model and assumptions made by management that impacted the calculation. I found management's model and assumptions to be reasonable and consistent with my expectations. I recalculated the impairment for capital work in progress for a sample of cash generating units utilising the same assumptions used by management and determined that management's estimate to be within a reasonable range to my expectations.
133 8.0 PG PERFORMANCE AGAINST SHAREHOLDER COMPACT 9.0 PG CREATING VALUE 10.0 PG CONSERVING OUR NATURAL RESOURCES 11.0 PG ENABLING OUR PEOPLE 12.0 PG IMPROVING RESILIENCY 13.0 PG FINANCIAL SUSTAINABILITY 14.0 PG GRI CONTENT INDEX 131 ANNUAL Report of the Auditor-General (continued) Report of the Auditor-General to Parliament on Umgeni Water (continued) Report on the audit of the consolidated and separate financial statements (continued) Key audit matters (continued) Key audit matter (continued) How the matter was addressed in the audit (continued) Information technology (IT) system and controls The entity implemented SAP, a new integrated accounting and reporting system during the year. The implementation of the SAP system required significant audit attention and was considered a significant audit risk due to an inherent risk of the potential loss of integrity of key financial data and the possible breakdown in IT dependent controls within business cycles. Accordingly, this was considered a key audit matter. I examined the entity s overall IT governance framework and key policies and procedures on programme development, systems security, programme access and general IT operations. In addition, aspects of security relating to access management and segregation of duties were also tested. In combination with my IT specialist auditors, I tested the data migration from the previous IT system to the new SAP system and when required, assessed and tested compensating controls to ensure that critical business processes continued post implementation, using substantially accurate data. In instances where SAP implementation issues impacting on significant financial statements items were still being resolved, I obtained audit evidence by alternative means. Based on the procedures performed, I was satisfied with the existing status of the implementation of SAP as relates to my audit of the current year financial statements. Emphasis of matter 7. I draw attention to the matter below. My opinion is not modified in respect of this matter. Legislative Changes Consolidation of Water Boards 8. As disclosed in note 32 to the consolidated and separate financial statements, the Executive Authority of Umgeni Water has initiated a process of establishing a single water board in KwaZulu-Natal to amalgamate the work that is currently being done by the water boards. Responsibilities of the accounting authority responsible for the consolidated and separate financial statements 9. The board members of Umgeni Water, which constitutes the accounting authority, are responsible for the preparation and fair presentation of the consolidated and separate financial statements in accordance with the IFRS and the requirements of the PFMA and the Companies Act, and for such internal control as the accounting authority determines is necessary to enable the preparation of consolidated and separate financial statements that are free from material misstatement, whether due to fraud or error. 10. In preparing the consolidated and separate financial statements, the accounting authority is responsible for assessing Umgeni Water s ability to continue as a going concern, disclosing, as applicable, matters relating to going concern and using the going concern basis of accounting unless the accounting authority intends to liquidate the entity or cease operations, or has no realistic alternative but to do so. Auditor-General s responsibilities for the audit of the consolidated and separate financial statements 11. My objectives are to obtain reasonable assurance about whether the consolidated and separate financial statements as a whole are free from material misstatement, whether due to fraud or error and to issue an auditor s report that includes my opinion. Reasonable assurance is a high level of assurance, but is not a guarantee that an audit conducted in accordance with the International Standards on Auditing (ISAs) will always detect a material misstatement when it exists. Misstatements can arise from fraud or error and are considered material if, individually or in the aggregate, they could reasonably be expected to influence the economic decisions of users taken on the basis of these consolidated and separate financial statements. 12. A further description of my responsibilities for the audit of the consolidated and separate financial statements is included in the annexure to the auditor s report.
134 132 ANNUAL 1.0 PG PG 9-17 ORGANISATIONAL 3.0 PG MINISTER S FOREWORD 4.0 PG ACCOUNTING AUTHORITY S 5.0 PG CHIEF EXECUTIVE S 6.0 PG CORPORATE GOVERNANCE 7.0 PG STAKEHOLDER UNDERSTANDING AND SUPPORT Report of the Auditor-General (continued) Introduction and scope 13. In accordance with the Public Audit Act of South Africa, 2004 (Act 25 of 2004) (PAA) and the general notice issued in terms thereof, I have a responsibility to report material findings on the reported performance information against predetermined objectives presented in the annual performance report. I performed procedures to identify findings but not to gather evidence to express assurance. 14. My procedures address the reported performance information, which must be based on the approved performance planning documents of the entity. I have not evaluated the completeness and appropriateness of the performance indicators included in the planning documents. My procedures also did not extend to any disclosures or assertions relating to planned performance strategies and information in respect of future periods that may be included as part of the reported performance information. Accordingly, my findings do not extend to these matters. 15. I evaluated the usefulness and reliability of the reported performance information in accordance with the criteria developed from the performance management and reporting framework, as defined in the general notice, for the following selected objectives presented in the annual performance report of the entity for the year ended 30 June 2017: Objectives Strategic objective 2: Increase customer and stakeholder value Strategic objective 3: Increase mobilisation of funds 60 Strategic objective 4: Increase fi nancial sustainability 60 Strategic objective 5: Improve fi nancial ratios 61 Strategic objective 7: Improve and increase infrastructure assets 62 Strategic objective 8: Increase water resources sustainability Pages in annual performance report 16. I performed procedures to determine whether the reported performance information was properly presented and whether performance was consistent with the approved performance planning documents. I performed further procedures to determine whether the indicators and related targets were measurable and relevant, and assessed the reliability of the reported performance information to determine whether it was valid, accurate and complete. 17. I did not identify any material findings on the usefulness and reliability of the reported performance information for the objectives tabulated in paragraph 15 of my report. Other matter 18. I draw attention to the matter below. Achievement of planned targets 19. The annual performance report on pages 57 to 63 includes information on the achievement of planned targets for the year and explanations are also provided for the under achievement of a significant number of targets. Report on audit of compliance with legislation Introduction and scope 20. In accordance with the PAA and the general notice issued in terms thereof, I have a responsibility to report material findings on the compliance of the entity with specific matters in key legislation. I performed procedures to identify findings but not to gather evidence to express assurance. 21. The material finding in respect of the compliance criteria for the applicable subject matter is as follows: Expenditure management 22. Effective steps were not taken to prevent fruitless and wasteful expenditure disclosed in note 29 to the consolidated and separate financial statements, in contravention of section 51(1)(b)(ii) of the PFMA. This was the result of a payment to the outgoing chief executive in terms of a settlement agreement, which included the payment of his remuneration in respect of his extended employment contract for the period 20 August 2017 to 19 August 2019.
135 8.0 PG PERFORMANCE AGAINST SHAREHOLDER COMPACT 9.0 PG CREATING VALUE 10.0 PG CONSERVING OUR NATURAL RESOURCES 11.0 PG ENABLING OUR PEOPLE 12.0 PG IMPROVING RESILIENCY 13.0 PG FINANCIAL SUSTAINABILITY 14.0 PG GRI CONTENT INDEX 133 ANNUAL Report of the Auditor-General (continued) Other information 23. The accounting authority of Umgeni Water is responsible for the other information. The other information comprises the information included in the annual report which includes the accounting authority s report the audit committee s report and the remuneration report. The other information does not include the consolidated and separate financial statements, the auditor s report and those selected objectives presented in the annual performance report that have been specifically reported on in the auditor s report. 24. My opinion on the consolidated and separate financial statements and findings on the reported performance information and compliance with legislation do not cover the other information and I do not express an audit opinion or any form of assurance conclusion thereon. 25. In connection with my audit, my responsibility is to read the other information and, in doing so, consider whether the other information is materially inconsistent with the consolidated and separate financial statements and the selected objectives presented in the annual performance report, or my knowledge obtained in the audit, or otherwise appears to be materially misstated. If, based on the work I have performed on the other information obtained prior to the date of this auditor s report, I conclude that there is a material misstatement of this other information, I am required to report that fact. I have nothing to report in this regard. Internal control deficiency 26. I considered internal control relevant to my audit of the consolidated and separate financial statements, reported performance information and compliance with applicable legislation; however, my objective was not to express any form of assurance thereon. The matter reported below is limited to the significant internal control deficiency that resulted in the finding on the compliance with legislation included in the report. Leadership 27. The accounting authority did not adequately ensure compliance with the PFMA in terms of its fiduciary responsibility to prevent fruitless and wasteful expenditure. Other reports 28. I draw attention to the following engagements conducted by various parties that had, or could have, an impact on the matters reported in the entity s consolidated and separate financial statements, reported performance information, compliance with applicable legislation and other related matters. These reports did not form part of my opinion on the consolidated and separate financial statements or my findings on the reported performance information or compliance with legislation. Audit Related Services and Special Audits 29. I performed agreed upon procedures in terms of International Standard on Related Services (ISRS) 4400 and the report was issued to the Department of Water and Sanitation in respect of the expenses incurred by Umgeni Water on the Working-for- Water Natural Resource Management Project, for the period 1 April 2016 to 31 March I performed a review engagement of the interim financial information of Umgeni Water, in terms of International Standard on Review Engagements (ISRE) 2410, for the six-month period ended 31 December 2016, and issued an unqualified review conclusion. Investigations 31. Investigations are in progress based on allegations of procurement and other irregularities. Pietermaritzburg 03 October 2017
136 134 ANNUAL 1.0 PG PG 9-17 ORGANISATIONAL 3.0 PG MINISTER S FOREWORD 4.0 PG ACCOUNTING AUTHORITY S 5.0 PG CHIEF EXECUTIVE S 6.0 PG CORPORATE GOVERNANCE 7.0 PG STAKEHOLDER UNDERSTANDING AND SUPPORT Report of the Auditor-General (continued) Annexure Auditor-General s responsibility for the audit 1. As part of an audit in accordance with the ISAs, I exercise professional judgement and maintain professional scepticism throughout my audit of the consolidated and separate financial statements, the procedures performed on reported performance information for selected objectives and on the entity s compliance with respect to the selected subject matters. Consolidated and separate financial statements 2. In addition to my responsibility for the audit of the consolidated and separate financial statements as described in the auditor s report, I also: > identify and assess the risks of material misstatement of the consolidated and separate financial statements whether due to fraud or error, design and perform audit procedures responsive to those risks, and obtain audit evidence that is sufficient and appropriate to provide a basis for my opinion. The risk of not detecting a material misstatement resulting from fraud is higher than for one resulting from error, as fraud may involve collusion, forgery, intentional omissions, misrepresentations, or the override of internal control. > obtain an understanding of internal control relevant to the audit in order to design audit procedures that are appropriate in the circumstances, but not for the purpose of expressing an opinion on the effectiveness of the entity s internal control. > evaluate the appropriateness of accounting policies used and the reasonableness of accounting estimates and related disclosures made by the board members, which constitutes the accounting authority. > conclude on the appropriateness of the accounting authority s use of the going concern basis of accounting in the preparation of the consolidated and separate financial statements. I also conclude, based on the audit evidence obtained, whether a material uncertainty exists related to events or conditions that may cast significant doubt on the Umgeni Water and its subsidiaries ability to continue as a going concern. If I conclude that a material uncertainty exists, I am required to draw attention in my auditor s report to the related disclosures in the financial statements about the material uncertainty or, if such disclosures are inadequate, to modify the opinion on the financial statements. My conclusions are based on the information available to me at the date of the auditor s report. However, future events or conditions may cause the entity to cease operating as a going concern. > evaluate the overall presentation, structure and content of the consolidated and separate financial statements, including the disclosures, and whether the consolidated and separate financial statements represent the underlying transactions and events in a manner that achieves fair presentation. > obtain sufficient appropriate audit evidence regarding the financial information of the entity s or business activities within the group to express an opinion on the consolidated and separate financial statements. I am responsible for the direction, supervision and performance of the group audit. I remain solely responsible for my audit opinion. Communication with those charged with governance 3. I communicate with the accounting authority regarding, among other matters, the planned scope and timing of the audit and significant audit findings, including any significant deficiencies in internal control that I identify during my audit. 4. I also confirm to the accounting authority that I have complied with relevant ethical requirements regarding independence, and communicate all relationships and other matters that may reasonably be thought to have a bearing on my independence and where applicable, related safeguards.
137 8.0 PG PERFORMANCE AGAINST SHAREHOLDER COMPACT 9.0 PG CREATING VALUE 10.0 PG CONSERVING OUR NATURAL RESOURCES 11.0 PG ENABLING OUR PEOPLE 12.0 PG IMPROVING RESILIENCY 13.0 PG FINANCIAL SUSTAINABILITY 14.0 PG GRI CONTENT INDEX 135 ANNUAL Accounting Authority Report In terms of the Public Finance Management (Act No. 1 of 1999), as amended, the Board of Umgeni Water is the accounting authority. The contracting period of the Board had expired as at 30 June 2017 and as at the date of approval of the financial statements the Executive Authority was still in the process of appointing a new Board. This report is the Report of the Accounting Authority, the Acting Chief Executive, as appointed by the Minister of Water and Sanitation. Nature of business Umgeni Water is a state owned business enterprise, established in 1974 to supply potable water in bulk to municipalities within its operational area. Umgeni Water defines its activities in line with the Water Services (Act No. 108 of 1997). The primary activities in terms of section 29 of the Act is to provide water services (water supply and sanitation services) to other water services institutions within its area of operation. In terms of section 30 of the Water Services Act, Umgeni Water also engages in other services that complement bulk water service delivery such as laboratory services, water quality monitoring, environmental management and other support services to water services institutions in order to promote co-operation in the provision of water services. Compliance with legislation The financial statements are prepared in accordance with International Financial Reporting Standards, approved by National Treasury in terms of section 79 of the Public Finance Management (Act No. 1 of 1999), as amended, and the following relevant statutes: > Water Services (Act No. 108 of 1997); > Public Finance Management (Act No. 1 of 1999), as amended (PFMA); and > Public Audit (Act No. 25 of 2004). Umgeni Water is not required and has not fully complied with the provisions of the Companies (Act No. 71 of 2008), as amended. The organisation has, however, incorporated aspects of the Act that relate to the accounting records, financial statements and other ancillary matters which may have an impact on the annual financial statements. Corporate governance and risk management The Board supports the Code of Governance Principles as set out in King III. The organisation s policies, procedures and processes are continuously reviewed to align with King III and the Board provides the required oversight and is pleased with the commitment that prevails at all spheres of the organisation in as far as compliance with King III is concerned. Where the organisation has not complied with a certain principle of King III, a rational reason and explanation for such deviation exists and is provided when required. The Board is responsible for monitoring the risk management process. For further details on corporate governance and risk management refer to the section on corporate governance detailed on pages 35 to 41. Share Capital and directors interests The entity has no share capital and therefore no director has any equity interest in the organisation. Directorate The Board as constituted during the reporting period is set out on pages 42 to 45 of the annual report. Members of the Board and Executive Committee s emoluments are disclosed in the remuneration report on pages 139 to 140 in terms of regulation 28.1 of the PFMA. Company Secretary and registered address The Company Secretary is Mr. Sbusiso Madonsela, appointed on 1 January The registered address of the Company Secretary and that of the registered office during the current financial year are as follows: Business address Postal address 310 Burger Street PO Box 9 Pietermaritzburg Pietermaritzburg Auditors The Auditor-General of South Africa will continue to conduct external audit services to Umgeni Water for the next financial year.
138 136 ANNUAL 1.0 PG PG 9-17 ORGANISATIONAL 3.0 PG MINISTER S FOREWORD 4.0 PG ACCOUNTING AUTHORITY S 5.0 PG CHIEF EXECUTIVE S 6.0 PG CORPORATE GOVERNANCE 7.0 PG STAKEHOLDER UNDERSTANDING AND SUPPORT Accounting Authority Report (continued) Pricing Policy Section 34 of the Water Services (Act No. 108 of 1997) states that the water tariff must allow for the following: > repayment and servicing of debt; > recovery of capital, operational and maintenance costs; > reasonable provision for depreciation of assets; > recovery of costs associated with the repayment of capital from revenues (including subsidies) over time; and > reasonable provision for future capital requirements and expansion. Thus in setting its pricing policy Umgeni Water has committed to the following underlying principles: > the promotion of the efficient and sustainable use of water; > the equitable access to water supply services, whereby the basic water service should be affordable; and > the solvency and sound financial management of Umgeni Water. In implementing the pricing policy Umgeni Water uses a 30 year tariff model which is based on the cash flow methodology underpinned by a financially viable tariff. As a result of this cash flow methodology the organisation is able to manage its debt level which is the ultimate output of this model. The annual tariff review process is carried out in terms of the requirements of Section 42 of the Municipal Finance Management (Act No. 56 of 2003) and Circular 23 issued by National Treasury. This process encompasses the principle of consultation and transparency and aims to assist Umgeni Water s stakeholders with their long-term planning. Umgeni Water bulk water tariff increase for 2017/2018 effective 1 July 2017 has been approved at 15.0% for all Water Service Authorities after taking into account the drought which has continued over the last two years. The directors, after full analysis of its projected cash flows, are of the opinion that the tariff for 2017/2018 is appropriate and will not adversely affect Umgeni Water s gearing levels or its financial sustainability. Price per kilolitre Bulk Tariff 1: Water Service Authorities Base tariff R4.593 R4.951 R5.397 Tariff increase R0.358 R0.446 R0.810 Umgeni Water bulk tariff R4.951 R5.397 R6.207 % increase 7.8% 9.0% 15.0% Capital unit charge Spring Grove dam R0.458 R0.484 R0.518 umkhomazi bulk water supply charge - R0.108 R0.124 New Tariff R5.409 R5.989 R6.849 % increase 7.8% 10.7% 14.4% Bulk Tariff 2: ethekwini Metropolitan Municipality Base tariff R4.502 R4.853 R5.290 Tariff increase R0.351 R0.437 R0.794 Umgeni Water bulk tariff R4.853 R5.290 R6.084 % increase 7.8% 9.0% 15.0% Capital unit charge Spring Grove dam R0.458 R0.484 R0.518 umkhomazi Scheme bulk water supply charge - R0.106 R0.122 New Tariff R5.311 R5.880 R6.724 % increase 7.8% 10.7% 14.4% Bulk Tariff 3: Sembcorp Siza Water Base tariff R4.633 R6.518 R7.105 Tariff increase R1.885 R0.587 R1.066 Umgeni Water bulk tariff R6.518 R7.105 R8.171 % increase 40.7% 9.0% 15.0% Capital unit charge Spring Grove Dam R0.458 R0.484 R0.518 umkhomazi Scheme bulk water supply charge - R0.142 R0.163 New Tariff R6.976 R7.731 R8.852 % increase 37.9% 10.8% 14.5%
139 8.0 PG PERFORMANCE AGAINST SHAREHOLDER COMPACT 9.0 PG CREATING VALUE 10.0 PG CONSERVING OUR NATURAL RESOURCES 11.0 PG ENABLING OUR PEOPLE 12.0 PG IMPROVING RESILIENCY 13.0 PG FINANCIAL SUSTAINABILITY 14.0 PG GRI CONTENT INDEX 137 ANNUAL Accounting Authority Report (continued) Financial performance The group achieved a profit for the year of R746m (2016: R781m). The 4% decrease year on year is primarily attributable to the lower sales volumes as a result of the drought and increased cost of sales resulting from the main cost drivers also to some extent influenced by the drought as the quality of raw water was poor and pumping continued throughout the year to assist with assurance of potable water supply within the areas of operation. Impairments to property, plant and equipment totalled R42m (2016: R133m). Impairments to existing assets included in buildings and infrastructure was R3m (2016: R95m) and impairments to capital work in progress was R39m (2016: R38m). The impairments during the current and prior years relate primarily to development infrastructure and reflect the social component carried by Umgeni Water. Refer to note 9 of the financial statements for further details on impairments. Operating cash flows were R812m (2016: R1 141m), a reduction of 29% year on year as a result of the lower sales volumes combined with increased working capital requirements. This was not sufficient after the repayment of debts to fund the capital expenditure in the current year and as a result the shortfall was funded through the utilisation of investments of R156m and grant funding of R371m from the Department of Water and Sanitation for development projects in progress. Capital expenditure on property, plant and equipment totalled to R1 125m in the current year, a 43% reduction from R1 978m in the prior year. Expenditure on intangible assets (software) totalled to R46m (2016: R56m). The group s capital commitments are set out in note 9.3 of the financial statements and the funding thereof is discussed in the financial review on page 120. Loan covenants remain un-breached at financial year end and Umgeni Water remained within its approved borrowing limits of R2 550m. Full details of the financial results of the group and company are set out in the financial statements and summarised in the financial review on pages 113 to 124. Subsidiary and associate companies Umgeni Water is the sole shareholder of Umgeni Water Services SOC Limited and Msinsi Holdings SOC Limited. There were no changes to subsidiary and associate companies during the year. Further details are set out in note 12 of the financial statements. Events after the reporting period No material events have taken place in the affairs of the group between the end of the financial year and the date of this report. Going concern The directors, having considered all the relevant information, have satisfied themselves that the group is in a sound financial position and that it has adequate access to sufficient borrowing facilities to meet its foreseeable cash requirements. There are adequate resources to continue operating for the foreseeable future and it is therefore appropriate to adopt the going concern basis in preparing the financial statements. The Executive Authority of Umgeni Water has initiated a process towards the establishment of a single provincial water board in KwaZulu-Natal. As at the end of the reporting year, this process was still underway and is planned to culminate in a merger between Umgeni Water and Mhlathuze Water. This process was initially envisaged to be concluded during the financial year, however due to a number of strategic steps that need to be taken to inform the final decision making process (which includes parliamentary processes, legislative processes and financial commitments confirmed for National Treasury) this was not achieved.
140 138 ANNUAL 1.0 PG PG 9-17 ORGANISATIONAL 3.0 PG MINISTER S FOREWORD 4.0 PG ACCOUNTING AUTHORITY S 5.0 PG CHIEF EXECUTIVE S 6.0 PG CORPORATE GOVERNANCE 7.0 PG STAKEHOLDER UNDERSTANDING AND SUPPORT Accounting Authority Report (continued) The move to amalgamate the two water boards is not isolated from other initiatives that government is engaged in to ensure the sustainability of water supply to the province. The accounting authority has no reason to believe that this process will negatively affect the going concern position of the entity during the 2017/2018 financial year, but albeit that it will create growth opportunities for the merged entity (once all conditional processes have been achieved) with a clear mandate from the Executive Authority. Information Required by the Public Finance Management Act No.1 Of 1999, As Amended Materiality framework In terms of Section of the regulations of the PFMA, for the purposes of materiality and significance, the accounting authority has developed and agreed a framework of acceptable levels of materiality and significance established at 0.5% of gross revenue which equates to R13m (2016: R12m). Management also apply a qualitative aspect to all errors found. Fruitless and wasteful expenditure Fruitless and wasteful expenditure incurred for the year was R5.2m (2016: R0.007m) which arose as a result of a settlement agreement entered into with the Chief Executive. Further details are set out in note 29 of the financail statements. Irregular expenditure Irregular expenditure totalling R9.8m (2016: R0.4m) arose primarily as a result of non-compliance to the supply chain management policy and was subsequently condoned as valid expenditure incurred in support of the business requirements. Management has instituted preventative and corrective measures as considered appropriate to improve controls and processes. Further details are set out in note 28 of the financial statements. Fraud and financial misconduct There were no instances of fraud; corruption and financial misconduct in the current financial year. All allegations reported through the hotline were duly investigated as per the Hotline Protocol and none led to fraud nor financial misconduct. Performance against financial targets (Parent only) The performance of Umgeni Water against the key financial indicators as agreed in the shareholders compact is illustrated on page 59 to 63 of the annual report.
141 8.0 PG PERFORMANCE AGAINST SHAREHOLDER COMPACT 9.0 PG CREATING VALUE 10.0 PG CONSERVING OUR NATURAL RESOURCES 11.0 PG ENABLING OUR PEOPLE 12.0 PG IMPROVING RESILIENCY 13.0 PG FINANCIAL SUSTAINABILITY 14.0 PG GRI CONTENT INDEX 139 ANNUAL Remuneration Report Remuneration Committee The Human Resources and Remuneration Committee assisted the Board during the year in applying: (a) the policy set by the Department of Water and Sanitation for the remuneration of the directors and the Chief Executive (CE); and (b) the remuneration policy approved by the Board for the Executives (General Managers (GM's)). Remuneration Structure The remuneration structure of EXCO is comprised of the following components: > Guaranteed amount: The guaranteed amount comprises a fixed cash portion and compulsory benefits such as medical aid and retirement. > Short-term incentive bonus: The short-term incentive bonus rewards the achievement of individual predetermined performance objectives and targets. > Long-term incentive bonus: The long-term incentive bonus is designed to attract, retain and reward the Chief Executive, General Managers and Senior Managers at grade level 4 for meeting the organisational objectives set by the shareholder. Directors' and Executives' Emoluments Fees for services/ salary Allowances and Bonuses Expense allowances Retirement contributions 2017 Total 2016 Total R 000 R 000 R 000 R 000 R 000 R 000 Non-Executive Board Members Ms. N Afolayan N Mr. GDJ Atkinson N Ms. NB Chamane N Ms. TMV Dube N Mr. VG Gounden N Mr. A Mahlalutye (Chairman) N Ms. ZB Mathenjwa N Mr. T Nkhahle N Mr. VG Reddy N Ms. TC Shezi N Mr. IAS Vally N Mr. T Zulu N Total Non-Executive Board Members Executive Board Member Mr. C Gamede (CE) N Total - Parent Msinsi Holdings SOC Ltd. Non-Executive Board Members Total Subsidiaries Total Group Exco Members Mr. M Cele Mr. S Gillham Mr. T Hlongwa Ms. M Moleko Total Exco
142 140 ANNUAL 1.0 PG PG 9-17 ORGANISATIONAL 3.0 PG MINISTER S FOREWORD 4.0 PG ACCOUNTING AUTHORITY S 5.0 PG CHIEF EXECUTIVE S 6.0 PG CORPORATE GOVERNANCE 7.0 PG STAKEHOLDER UNDERSTANDING AND SUPPORT Remuneration Report (continued) Long-term Incentive Bonus The Board has set performance conditions in line with Umgeni Water's shareholder compact over a five-year performance period which covers financial and non-financial targets. In terms of the Umgeni Water Performance Management Policy, the long-term incentive bonus, based on variable pay, is payable to the Chief Executive, General Managers and Senior Managers when the following conditions are met: > The employee has fulfilled the full term of his/her employment contract for the five year period; and > The employee has achieved a level of performance above 75%, in terms of the performance management scoring process, for the full term of the performance period in terms of the policy. The distributable audited surplus is calculated at 20% of the audited surplus after consideration of loan covenant levels. The available variable pay for long-term incentive bonuses is then calculated at the maximum of 25% of the distributable audited surplus. Conditions met were approved by the Board in September 2016, as a result the following long-term incentive bonuses have accrued to Executives: Name Designation Opening Balance 1 July 2016 Accrued 2017 Sub-total 30 June 2017 Utilised 2017 Total provided 30 June 2017 R 000 R 000 R 000 R 000 R 000 Mr. C Gamede N2 Chief Executive (7 644) - Mr. S Gillham N3 GM Engineering (7 337) - Mr. T Hlongwa GM Finance Ms. M Moleko GM Corp Service Mr. M Cele GM Operations Long-term incentive bonus provided (14 981) Service contract period of Executives Executives Designation Date first appointed by the Board Date last re-elected Date due for re-election Mr. C Gamede Chief Executive 20 August 2012 n/a n/a N2 Mr. M Cele GM Operations 03 November 2014 n/a 02 November 2019 Mr. S Gillham GM Engineering and Scientific Services 01 February 2012 n/a 01 February 2019 N3 Mr. T Hlongwa GM Finance 01 July 2013 n/a 01 July 2018 Ms. M Moleko GM Corporate Service 01 January 2014 n/a 01 January 2019 Umgeni Water Executives are also directors in the wholly owned subsidiaries of Umgeni Water. No remuneration was received by the directors from the subsidiaries for the services rendered in the current and prior year. Details of the Directorship are as follows: Subsidiary Executives Executives Designation Date first appointed by the Board Msinsi Holdings SOC Limited Umgeni Water Services SOC Limited Mr. C Gamede N4 Non-Executive Director 16 April 2014 X Mr. S Gillham Non-Executive Director 15 March 2012 X Mr. T Hlongwa Non-Executive Director 16 April 2014 N5 Ms. M Moleko Non-Executive Director 16 April 2014 X N1: Term ended 30 June N2: The Board entered into a settlement agreement with the CE who exited his contract of employment on 30 th June The amount disclosed under fees for services/salary includes R5.2m accrued in terms of the settlement agreement. Allowances and bonuses comprise of R7.6m long-term incentive accrued in terms of the settlement agreement. N3: Contract ended 01 February 2017 and extended for two years to 31 January Long-term Incentive paid at end of contract R7.3m included under allowances and bonuses. N4: Resigned from Msinsi Holding SOC Limited as at 1 July N5: Appointment date for both Msinsi Holdings SOC Limited and Umgeni Water Services SOC Limited.
143 8.0 PG PERFORMANCE AGAINST SHAREHOLDER COMPACT 9.0 PG CREATING VALUE 10.0 PG CONSERVING OUR NATURAL RESOURCES 11.0 PG ENABLING OUR PEOPLE 12.0 PG IMPROVING RESILIENCY 13.0 PG FINANCIAL SUSTAINABILITY 14.0 PG GRI CONTENT INDEX 141 ANNUAL Statements of Profit and Loss For the year ended 30 June 2017 Group Parent Note R 000 R 000 R 000 R 000 Revenue Cost of sales ( ) ( ) ( ) ( ) Changes in water inventory 823 (698) 823 (698) Chemicals (62 516) (51 742) (62 516) (51 742) Depreciation ( ) ( ) ( ) ( ) Energy ( ) ( ) ( ) ( ) Maintenance ( ) ( ) ( ) ( ) Raw water ( ) ( ) ( ) ( ) Section 30 activities ( ) ( ) ( ) ( ) Staff costs ( ) ( ) ( ) ( ) Other direct operating expenses (45 531) (48 994) (45 531) (48 994) Gross profit Other income Other operating and administration expenses ( ) ( ) ( ) ( ) Profit from operations Net finance income Interest income Finance costs 8 (1 399) (1 185) (1 355) (1 161) Share of profi t from associate Profit before taxation Taxation 6.2 (101) (65) - - Profit for the year Statements of Other Comprehensive Income For the year ended 30 June 2017 Group Parent R 000 R 000 R 000 R 000 Profi t for the year Other comprehensive income: Items that will not be reclassified to profit and loss: Remeasurement of gains and losses - retirement plans (36 540) (36 540) Total other comprehensive income for the year
144 142 ANNUAL 1.0 PG PG 9-17 ORGANISATIONAL 3.0 PG MINISTER S FOREWORD 4.0 PG ACCOUNTING AUTHORITY S 5.0 PG CHIEF EXECUTIVE S 6.0 PG CORPORATE GOVERNANCE 7.0 PG STAKEHOLDER UNDERSTANDING AND SUPPORT Statements of Financial Position For the year ended 30 June 2017 Group Parent Note R 000 R 000 R 000 R 000 ASSETS Non-current assets Property, plant and equipment Intangible assets Biological assets Subsidiaries and associates Investments Other fi nancial assets Current assets Investments Inventories Trade and other receivables Interest receivable Bank and cash Total assets EQUITY AND LIABILITIES Capital and reserves Capital OCI Reserve (11 350) ( ) (11 350) ( ) Accumulated profit Non-current liabilities Long-term debt Other non-current liabilities Provisions Post-retirement benefit obligations Current liabilities Short-term debt Provisions Accounts payable Interest payable Total equity and liabilities
145 8.0 PG PERFORMANCE AGAINST SHAREHOLDER COMPACT 9.0 PG CREATING VALUE 10.0 PG CONSERVING OUR NATURAL RESOURCES 11.0 PG ENABLING OUR PEOPLE 12.0 PG IMPROVING RESILIENCY 13.0 PG FINANCIAL SUSTAINABILITY 14.0 PG GRI CONTENT INDEX 143 ANNUAL Statements of Changes in Equity For the year ended 30 June 2017 Group - Attributable to equity holders of the parent Capital OCI Reserve Accumulated profit Total R 000 R 000 R 000 R 000 Balance as at 30 June (68 282) Movement for the year Total comprehensive income - (36 540) Profi t for the year Other comprehensive income - (36 540) - (36 540) Balance as at 30 June ( ) Movement for the year Total comprehensive income Profi t for the year Other comprehensive income Balance as at 30 June (11 350) Capital OCI Reserve Parent Accumulated profit Total R 000 R 000 R 000 R 000 Balance as at 30 June (68 282) Movement for the year Total comprehensive income - (36 540) Profi t for the year Other comprehensive income - (36 540) - (36 540) Balance as at 30 June ( ) Movement for the year Total comprehensive income Profi t for the year Other comprehensive income Balance as at 30 June (11 350)
146 144 ANNUAL 1.0 PG PG 9-17 ORGANISATIONAL 3.0 PG MINISTER S FOREWORD 4.0 PG ACCOUNTING AUTHORITY S 5.0 PG CHIEF EXECUTIVE S 6.0 PG CORPORATE GOVERNANCE 7.0 PG STAKEHOLDER UNDERSTANDING AND SUPPORT Statements of Cash Flows For the year ended 30 June 2017 Group Parent Note R 000 R 000 R 000 R 000 OPERATING ACTIVITIES Cash receipts from customers Cash paid to suppliers and employees ( ) ( ) ( ) ( ) Net cash from operating activities INVESTING ACTIVITIES Proceeds on disposals of assets Receipt of grants Additions to property, plant and equipment 9 ( ) ( ) ( ) ( ) Additions to intangible assets 10 (46 240) (55 707) (45 917) (55 647) Additions to biological assets 11 - (510) - - Proceeds on disposal of biological assets Decrease/(increase) of investments in subsidiaries (11 555) Net cash used in investing activities ( ) ( ) ( ) ( ) FINANCING ACTIVITIES Long-term borrowings raised Long-term borrowings repaid 20 (78 619) (78 434) (78 619) (78 434) Decrease/(increase) in investments ( ) ( ) Interest received Finance costs paid ( ) ( ) ( ) ( ) Net cash (used in) from financing activities (32 035) (32 162) CASH AND CASH EQUIVALENTS Net (decrease)/increase for the year (18 968) (3 486) At beginning of year At end of year
147 8.0 PG PERFORMANCE AGAINST SHAREHOLDER COMPACT 9.0 PG CREATING VALUE 10.0 PG CONSERVING OUR NATURAL RESOURCES 11.0 PG ENABLING OUR PEOPLE 12.0 PG IMPROVING RESILIENCY 13.0 PG FINANCIAL SUSTAINABILITY 14.0 PG GRI CONTENT INDEX 145 ANNUAL Notes to the Consolidated Financial Statements For the year ended 30 June General Information Umgeni Water is a water board established in terms of Section 28 of the Water Services Act, (Act 108 of 1997) and a national government business entity as per Schedule 3B of the Public Finance Management Act (Act 1 of 1999), as amended, domiciled in South Africa. The address of its registered office and principal place of business and principal activities of the organisation are described in the Directors Report. The consolidated financial statements comprise that of the entity and its subsidiaries (collectively the group and individually group entities ). The accounting policies are applicable to both the group and parent entity except were otherwise stated. The following principal accounting policies were applied by the group for the year ended 30 June Basis of Preparation and Measurement Statement of Compliance The consolidated financial statements are prepared in accordance with International Financial Reporting Standards (IFRSs) and interpretations of those standards, as issued by the International Accounting Standards Board (the IASB), the Public Finance Management Act (Act 1 of 1999), as amended (PFMA) and the Companies Act (Act 71 of 2008). In terms of section 79 of the PFMA, National Treasury has issued an approval authorising the use of IFRS as the accounting reporting framework. Basis of Preparation of Financial Results The consolidated financial statements are prepared using the historic cost basis except for the following items in the statement of financial position: > Biological assets are measured at fair value less costs to sell; and > The defined benefit plan obligation and post-retirement healthcare obligation are measured at the projected unit credit method. The consolidated financial statements are prepared on the going concern basis using the accrual basis of accounting except for cash flow information. Except as otherwise disclosed, these accounting policies are consistent with those applied in all periods presented in these consolidated financial statements. Current and Non-Current Classification of Assets and Liabilities Current assets are assets that are expected to be realised in the entity's normal operating cycle, held primarily for the purpose of trading, expected to be realised within 12 months after the reporting period or the asset is cash or cash equivalent unless the asset is restricted from being exchanged or used to settle a liability for at least 12 months after reporting date. All other assets are non-current. Current liabilities are those liabilities expected to be settled within the entity's normal operating cycle, held for purpose of trading, due to be settled within 12 months for which the entity does not have an unconditional right to defer settlement beyond 12 months. Other liabilities are non-current. Functional and Presentation Currency These consolidated financials are presented in Rands, which is the group s functional and presentation currency. All financial information presented in Rands has been rounded to the nearest thousand. Use of Estimates and Judgements Critical Judgments in Applying the Group s Accounting Policies The preparation of the consolidated financial statements in conformity with IFRSs requires management to make judgments, estimates and assumptions that affect the reported amounts of assets, liabilities, income and expenses. Actual results may differ from these estimates.
148 146 ANNUAL 1.0 PG PG 9-17 ORGANISATIONAL 3.0 PG MINISTER S FOREWORD 4.0 PG ACCOUNTING AUTHORITY S 5.0 PG CHIEF EXECUTIVE S 6.0 PG CORPORATE GOVERNANCE 7.0 PG STAKEHOLDER UNDERSTANDING AND SUPPORT Notes to the Consolidated Financial Statements (continued) For the year ended 30 June Basis of Preparation and Measurement (continued) Critical Judgments in Applying the Group s Accounting Policies (continued) Estimates and underlying assumptions are reviewed on an ongoing basis. Revisions to accounting estimates are recognised in the period in which the estimates are revised and in any future periods affected. There were no significant judgments in the process of applying the group s accounting policies. Key Sources of Estimation Uncertainty Value-in-use calculations for impairment of property, plant and equipment The recoverable amount of development infrastructure is determined based on value-in-use calculations. Key assumptions relating to these valuations include the discount rate (gross weighted average cost of capital), cash flows and sales volume demand per scheme. Future cash flows are extrapolated over the useful life of the assets to reflect the long-term plan for the group using the growth rates as projected by the economic indicators (CPI, PPI, energy). Management determines the expected performance of these assets based on the sales volume demands and the operating cost structure aligned to the system from which water will be drawn. Refer to note 9 for further details on impairments of property, plant and equipment. Residual values and useful lives of property, plant and equipment Property, plant and equipment are depreciated over its useful life taking into account residual values, where appropriate. Assessments of useful lives and residual values are performed annually after considering factors such as technological innovation, maintenance programmes, relevant market information, manner of recovery and management consideration. In assessing residual values, the group considers the remaining life of the asset, its projected disposal value and future market conditions. Refer to note 9. Fair value of biological assets The carrying amounts of biological assets are recognised at fair value. The fair values of game were determined with reference to market prices as at 30 June Refer to note 11 for further detail on biological assets. Defined benefit plans The key assumptions relating to the defined benefit plan sensitivity analysis are disclosed in note 26. No further key assumptions concerning the future and other key sources of estimation uncertainty at the reporting date exist, that management may have assessed as having a significant risk of causing material adjustment to the carrying amounts of the assets and liabilities within the next financial year. Standards, Interpretations and Amendments to Published Standards that are not yet Effective The following new standards, interpretations and amendments to existing standards which are relevant to the group but not yet effective, have not been adopted in the current year: IFRS 9 Financial Instruments - Classification and Measurement Effective 1 January 2018 IFRS 9 addresses the initial measurement and classification of financial assets and financial liabilities, and replaces the relevant sections of IAS 39 Financial instruments: Recognition and measurement. IFRS 9 retains but simplifies the mixed measurement model and establishes two primary measurement categories for financial assets: Amortised cost and fair value. The basis of classification depends on the entity s business model and the contractual cash flow characteristics of the financial asset. Under IFRS 9,
149 8.0 PG PERFORMANCE AGAINST SHAREHOLDER COMPACT 9.0 PG CREATING VALUE 10.0 PG CONSERVING OUR NATURAL RESOURCES 11.0 PG ENABLING OUR PEOPLE 12.0 PG IMPROVING RESILIENCY 13.0 PG FINANCIAL SUSTAINABILITY 14.0 PG GRI CONTENT INDEX 147 ANNUAL Notes to the Consolidated Financial Statements (continued) For the year ended 30 June Basis of Preparation and Measurement (continued) Standards, Interpretations and Amendments to Published Standards that are not yet Effective (continued) IFRS 9 Financial Instruments - Classification and Measurement Effective 1 January 2018 (continued) the classification and measurement requirements for financial liabilities are the same as per IAS 39, except for two aspects. The first aspect relates to fair value changes for financial liabilities (other than financial guarantees and loan commitments) designated at fair value through profit or loss, that are attributable to the changes in the credit risk of the liability. The second aspect relates to derivative liabilities that are linked to and must be settled by delivery of an unquoted equity instrument whose fair value cannot be reliably measured. IFRS 9 has also been amended to include the derecognition requirements from IAS 39. These requirements have remained unchanged but additional disclosure requirements relating to the disclosure of transfers of financial assets have been included in IFRS 7. The group has assessed it s financial assets and financial liabilities against IFRS 9. The financial assets currently classified under loans and receivables and held-to-maturity financial assets will be classified as financial assets held at amortised cost under IFRS 9. The group does not expect the adoption of IFRS9 to have a significant impact on total assets and total liabilities. IFRS 15 Revenue from Contracts with Customers Effective 1 January 2018 IFRS 15 Revenue from Contracts with Customers replaces IAS 11 Construction Contracts, IAS 18 Revenue and related interpretations. IFRS 15 specifies the accounting treatment for all revenue arising from contracts with customers. It applies to all entities that enter into contracts to provide goods or services to their customers, unless the contracts are in the scope of other IFRSs, such as IAS 17 Leases. The underlying principle is that an entity will recognise revenue to depict the transfer of goods or services to customers at an amount that the entity expects to be entitled to in exchange for those goods or services. Extensive disclosures will be required under this standard. The group does not expect the adoption of the standard to have a significant impact on total revenue. IFRS 16 Leases Effective 1 January 2019 IFRS 16 replaces IAS 17 Leases, IFRIC 4 Determining Whether an Arrangement Contains a Lease. IFRS 16 primarily affects lessees who must account for all leases in a single model on the balance sheet where the lease term exceeds 12 months, unless the underlying asset is of low value. A lessee is required to recognize a Right of Use Asset representing its right to use the underlying leased asset and a liability representing its obligation to make lease payments. Lessees will be required to separately recognize the interest expense on the lease liability and depreciation expense on the right of use asset. Lessor accounting substantially remains unchanged from the previous requirements in IAS 17. The new standard requires lessors and lessees to make more extensive disclosures than previously required under IAS 17. The group does not expect the adoption of the standard to have a significant impact as the leases held by the group which are not material. Adoption of New and Revised Standards During the current year there were no amendments to or new and revised standards which are relevant to the group. Improvements to IFRS A number of standards have been amended as part of the IASB annual improvement project. The group is in the process of considering the relevant amendments to the standards and determining the financial impact on the group.
150 148 ANNUAL 1.0 PG PG 9-17 ORGANISATIONAL 3.0 PG MINISTER S FOREWORD 4.0 PG ACCOUNTING AUTHORITY S 5.0 PG CHIEF EXECUTIVE S 6.0 PG CORPORATE GOVERNANCE 7.0 PG STAKEHOLDER UNDERSTANDING AND SUPPORT Notes to the Consolidated Financial Statements (continued) For the year ended 30 June Summary of Significant Accounting Policies Basis of Consolidation of Financial Results The consolidated financial statements reflect the financial results of the group. All financial results are consolidated with similar items on a line by line basis except for investments in associates, which are included in the group s results as set out below. Elimination of Inter-Company Transactions Inter-company transactions, balances and unrealised gains and losses between entities are eliminated on consolidation. To the extent that a loss on a transaction provides evidence of a reduction in the net realisable value of current assets or an impairment loss of a non-current asset, that loss is charged to the statement of profit and loss. In respect of associates, unrealised gains and losses are eliminated to the extent of the group s interest in these entities. Unrealised gains and losses arising from transactions with associates are eliminated against the investment in the associate. Business Combinations A business may comprise an entity, group of entities or an unincorporated operation including its operating assets and associated liabilities. Business combinations are accounted for using the acquisition method which is the date on which control is transferred to the group. On acquisition date, fair values are attributed to the identifiable assets, liabilities and contingent liabilities. Fair value of all identifiable assets and liabilities included in the business combination are determined by reference to market values of those similar items, where available, or by discounting expected future cash flows using the discount rate to present values. The consideration transferred is the fair value of the group s contribution to the business combination in the form of assets transferred, liabilities assumed or contingent consideration at the acquisition date. Transaction costs directly attributable to the acquisition are charged to the statement of profit and loss except if related to the issue of debt or equity securities. A non-controlling interest at acquisition date is determined as the non-controlling shareholders proportionate share of the fair value of the net identifiable assets of the entity acquired. On acquisition date goodwill is recognised when the consideration transferred and the recognised amount of the non-controlling interests exceeds the fair value of the net identifiable assets of the entity acquired. Goodwill is tested at each reporting date for impairment. To the extent that the fair value of the net identifiable assets of the entity acquired exceeds the consideration transferred and the recognised amount of non-controlling interests, the excess is recognised in the statement of profit and loss on acquisition date. When an acquisition is achieved in stages (step acquisition), the identifiable assets and liabilities are recognised at their full fair value when control is obtained, and any adjustment to fair values related to these assets and liabilities previously held as an equity interest is recognised in the statement of other comprehensive income or statement of profit and loss as appropriate. When there is a change in the interest in a subsidiary after control is obtained, that does not result in a loss in control, the difference between the fair value of the consideration transferred and the amount by which the non-controlling interest is adjusted is recognised directly in the statement of changes in equity. When the group loses control of a subsidiary it derecognises the assets and liabilities and related equity components of the former subsidiary. Any gain or loss is recognised in profit or loss. Any investment retained in the former subsidiary is measured at its fair value at the date when control is lost. The profit or loss realised on disposal or termination of an entity is calculated after taking into account the carrying value of any related goodwill.
151 8.0 PG PERFORMANCE AGAINST SHAREHOLDER COMPACT 9.0 PG CREATING VALUE 10.0 PG CONSERVING OUR NATURAL RESOURCES 11.0 PG ENABLING OUR PEOPLE 12.0 PG IMPROVING RESILIENCY 13.0 PG FINANCIAL SUSTAINABILITY 14.0 PG GRI CONTENT INDEX 149 ANNUAL Notes to the Consolidated Financial Statements (continued) For the year ended 30 June Summary of Significant Accounting Policies (continued) Subsidiaries Subsidiaries are defined as those companies in which the group, either directly or indirectly, has: > More than one half of the voting rights; > the right to appoint more than half of the Board of directors; or > otherwise has the power to control the financial and operating activities of the entity. The group has two subsidiaries which are wholly owned and further details are included in note 12 of the financial statements. The assets, liabilities, income, expenses and cash flows of subsidiaries are consolidated from the date of acquisition, being the date on which the group obtains control, and continue to be consolidated until the date that such control ceases. Control is achieved when the group is exposed, or has rights, to variable returns from its involvement with the investee and has the ability to affect those returns through its power over the investee. Specifically, the group controls an investee if and only if the group has: > Power over the investee (i.e. existing rights that give it the current ability to direct the relevant activities of the investee); > exposure, or rights, to variable returns from its involvement with the investee; and > the ability to use its power over the investee to affect its returns. When the group has less than a majority of the voting or similar rights of an investee, the group considers all relevant facts and circumstances in assessing whether it has power over an investee, including: > The contractual arrangement with the other vote holders of the investee; > rights arising from other contractual arrangements; and > the group s voting rights and potential voting rights. The group re-assesses whether or not it controls an investee if facts and circumstances indicate that there are changes to one or more of the three elements of control. Consolidation of a subsidiary begins when the group obtains control over the subsidiary and ceases when the group loses control of the subsidiary. Where necessary, adjustments are made to the financial statements of subsidiaries to bring the accounting policies used in line with those used by the group. All material inter-company balances and transactions are eliminated. In the parent financial statements, the parent accounts for investments in subsidiaries at cost. Associates An associate is an entity over which the group has significant influence and that is neither a subsidiary nor a joint venture. Significant influence is the power to participate in the financial and operating policy decisions of the investee but is not control or joint control over those policies. The group has an associate via its subsidiary Umgeni Water Services SOC Ltd. Further details on the associate are included in note 12 of the financial statements. The financial results of associates are included in the group s results according to the equity method from acquisition date until disposal date. Under the equity method, the investment in associate is initially recognised at cost and the carrying amount is increased or decreased to recognise the group s share of profit or loss of the associate after the acquisition date. The group s share of profits or losses and other comprehensive income are recognised in the statement of profit and loss as equity accounted earnings. Distributions received from associates reduce the carrying amount of the investment. All cumulative postacquisition movements in other comprehensive income of associates are adjusted against the carrying amount of the investment. When the group s share of losses in associate equals or exceeds its interest in those associates; the group does not recognise further losses, unless the group has incurred a legal or constructive obligation or made payments on behalf of those associates. Goodwill relating to associates forms part of the carrying value of those associates.
152 150 ANNUAL 1.0 PG PG 9-17 ORGANISATIONAL 3.0 PG MINISTER S FOREWORD 4.0 PG ACCOUNTING AUTHORITY S 5.0 PG CHIEF EXECUTIVE S 6.0 PG CORPORATE GOVERNANCE 7.0 PG STAKEHOLDER UNDERSTANDING AND SUPPORT Notes to the Consolidated Financial Statements (continued) For the year ended 30 June Summary of Significant Accounting Policies (continued) Associates (continued) The total carrying value of each associate is evaluated annually, as a single asset, for impairment or when conditions indicate that a decline in fair value below the carrying amount is other than temporary. If impaired, the carrying value of the group s share of the underlying assets of associates is written down to its estimated recoverable amount in accordance with the accounting policy on impairment and charged to the statement of profit and loss as part of equity accounted earnings of that associate. When significant influence over an associate is lost, the group measures any investment retained in the former associate at fair value, with any consequential gain or loss recognised in profit or loss. Where the reporting date of an associate differs from that of the group, adjustments are made to the associate s most recent audited financial results for material transactions and events that occur since then to the reporting date of the group. Where a group entity transacts with an associate of the group, unrealised profits and losses are eliminated to the extent of the group s interest in the relevant associate. In the parent financial statements, the parent accounts for investments in associates at cost. Operating Segments and Segment Reporting The group has two reportable segments: > The primary segment as defined by section 29 of the Water Services Act No. 108 of 1997; and > other activities as defined by Section 30 of the Water Services Act No. 108 of Segment results that are reported include items directly attributable to the segment as well as those that can be allocated on a reasonable basis. Unallocated items comprise mainly corporate assets, head office expenses, assets and liabilities. Property, Plant & Equipment Property, plant and equipment are stated at cost less accumulated depreciation and accumulated impairment losses. Land is not depreciated. Costs include expenditure that is directly attributable to the acquisition of the asset. Works under construction are stated at cost less accumulated impairment losses and grant funding. Cost includes the cost of materials, direct labour, allocated portion of direct project overheads and any costs incurred which is directly attributable to bringing it to its present location and condition. Work-in-progress is commissioned on date of significant completion net of grant funding in accordance with the accounting policy on grant funding. Servitudes are considered an integral part of the asset and are essential to the operation of the asset and therefore forms part of the cost of the relevant asset. Borrowing costs are capitalised on qualifying assets in accordance with the relevant accounting policy on finance costs. When property, plant and equipment comprise major components with different useful lives, these components are accounted for as separate items. Expenditure incurred to replace or modify a significant component of plant is capitalised and any remaining carrying amount of the component replaced is written off in the statement of profit and loss. All other expenditure are charged to the statement of profit and loss. Subsequent expenditure is only capitalized if it is probable that the future economic benefits associated with the expenditure will flow to the group.
153 8.0 PG PERFORMANCE AGAINST SHAREHOLDER COMPACT 9.0 PG CREATING VALUE 10.0 PG CONSERVING OUR NATURAL RESOURCES 11.0 PG ENABLING OUR PEOPLE 12.0 PG IMPROVING RESILIENCY 13.0 PG FINANCIAL SUSTAINABILITY 14.0 PG GRI CONTENT INDEX 151 ANNUAL Notes to the Consolidated Financial Statements (continued) For the year ended 30 June Summary of Significant Accounting Policies (continued) Property, Plant & Equipment (continued) The carrying amount of property plant and equipment will be derecognised on disposal or when no future economic benefits are expected from its use. The gain or loss arising on the disposal or retirement of an item of property, plant and equipment is determined as the difference between the sales proceeds and the carrying amount of the asset and is recognised in the statement of profit and loss. Property, plant and equipment are depreciated to its estimated residual values on a straight line basis over its expected useful life. The depreciation methods, estimated remaining useful lives and residual values are reviewed at least annually and adjusted prospectively if appropriate. Asset Category Estimated Useful Life (Years) Estimated Residual Value Buildings and infrastructure Buildings 40 2% Dams and weirs 45 90% Pipelines % Pump stations %-60% Reservoirs and intake works 45 2% Tunnels 45 90% Water treatment works %-70% Wastewater treatment works %-70% Roads % Fences and gates 15 2% Temporary and timber structures 25 2% Equipment and vehicles Plant and equipment, furniture and fittings 5 10% Vehicles 5 10% Computers % ERP Hardware 5 10% ERP Software 5 10% Leases Classification Leases are classified as finance leases whenever the terms of the lease transfer substantially all the risks and rewards of ownership to the lessee. All other leases are classified as operating leases. Operating lease Rental income from operating leases with fixed escalation clauses is recognised on a straight-line basis over the term of the relevant lease. Initial direct costs incurred in negotiating and arranging an operating lease are added to the carrying amount of the leased asset and recognised on a straight line basis over the lease term.
154 152 ANNUAL 1.0 PG PG 9-17 ORGANISATIONAL 3.0 PG MINISTER S FOREWORD 4.0 PG ACCOUNTING AUTHORITY S 5.0 PG CHIEF EXECUTIVE S 6.0 PG CORPORATE GOVERNANCE 7.0 PG STAKEHOLDER UNDERSTANDING AND SUPPORT Notes to the Consolidated Financial Statements (continued) For the year ended 30 June Summary of Significant Accounting Policies (continued) Leases (continued) In The Capacity Of A Lessee Operating lease Rentals payable under operating leases with fixed escalation clauses are charged to income on a straight-line basis over the term of the relevant lease. Benefits received and receivable as an incentive to enter into an operating lease are also spread on a straight-line basis over the lease term. Intangible Assets (Other Than Goodwill) Research And Development Research expenditure is charged to the statement of profit and loss when incurred. Development expenditure relating to the production of new or substantially improved products is capitalised if the following conditions are met: > it is technically feasible to complete the intangible asset so that it will be available for use or sale; > management intends to complete the intangible asset and use or sell it; > there is an ability to use or sell the intangible asset; > it can be demonstrated how the intangible asset will generate probable future economic benefits; > adequate technical, financial and other resources to complete the development and to use or sell; > the intangible assets are available; and > the expenditure attributable to the intangible asset during its development can be measured reliably. Research and development costs that do not meet the criteria are recognised in profit and loss. Development costs previously recognised as an expense are not recognised as an asset in a subsequent period. Intangible assets are amortised from the time it s ready for use over a straight line basis over its useful life. Software Software is carried at cost less accumulated amortisation and impairment. Internally developed and packaged software and the direct costs associated with the development and installation thereof are capitalised and recognised as intangible assets. Software is amortised in full on a straight-line basis as follows: > customised software 5 years; and > shelf software 2 years. Costs associated with research and development of computer software programmes are recognised as an expense as they are incurred. Development costs are capitalised if it meets the criteria for capitalising development expenditure. Costs relating to the acquisition of licenses are treated as an expense in the period in which the license is acquired. The useful lives of intangible assets are reviewed annually and adjusted prospectively if appropriate. Gains or losses arising from derecognition of an intangible asset are measured as the difference between the net disposal proceeds and the carrying amount and are recognised in the statement of profit and loss when the asset is derecognised. Biological Assets Game stock and plantations are measured at their fair value less estimated point-of-sale costs. The fair value of biological assets is determined annually based on market prices of similar age, genies, and genetic merit after considering its highest and best use. All changes in fair values are recognised in the statement of profit and loss in the period in which they arise.
155 8.0 PG PERFORMANCE AGAINST SHAREHOLDER COMPACT 9.0 PG CREATING VALUE 10.0 PG CONSERVING OUR NATURAL RESOURCES 11.0 PG ENABLING OUR PEOPLE 12.0 PG IMPROVING RESILIENCY 13.0 PG FINANCIAL SUSTAINABILITY 14.0 PG GRI CONTENT INDEX 153 ANNUAL Notes to the Consolidated Financial Statements (continued) For the year ended 30 June Summary of Significant Accounting Policies (continued) Impairment of Non-Financial Assets At each reporting date, the group reviews the carrying amounts of its non-financial assets other than inventories and deferred tax to determine whether there is any indication that the carrying value may not be recoverable and whether those assets have suffered an impairment loss. If any such indication exists, the recoverable amount of the asset is estimated in order to determine the extent of the impairment loss, if any. Where the asset does not generate cash flows that are independent from other assets, the group estimates the recoverable amount of the cash-generating unit to which the asset belongs. An intangible asset with an indefinite useful life is tested for impairment annually and whenever there is an indication that the asset may be impaired. Recoverable amount is the higher of fair value less costs to sell and value-in-use. A fair value measurement of a non-financial asset takes into account a market participant s ability to generate economic benefits by using the asset in its highest and best use or by selling it to another market participant that would use the asset in its highest and best use. In assessing value-in-use, the estimated future cash flows are discounted to their present value using a pre-tax discount rate that reflects current market assessments of the time value of money and the risks specific to the asset for which the estimates of future cash flows have not been adjusted. If the recoverable amount of an asset, or cash-generating unit, is estimated to be less than its carrying amount, the carrying amount of the asset or cash-generating unit, is reduced to its recoverable amount. An impairment loss is recognised as an expense immediately, unless the relevant asset is carried at a revalued amount, in which case the impairment loss is treated as a revaluation decrease. Where an impairment loss, other than for goodwill, subsequently reverses, the carrying amount of the asset or cash-generating unit is increased to the revised estimate of its recoverable amount, not exceeding the carrying amount that would have been determined had no impairment loss been recognised for the asset or cash generating unit, in prior years. A reversal of an impairment loss is recognised as income immediately, unless the relevant asset is carried at a revalued amount, in which case the reversal of the impairment loss is treated as a revaluation increase. Inventories Inventories are stated at the lower of the weighted average cost and net realisable value. Obsolete, redundant and slow-moving inventories are identified and written down to the estimated net realisable value. Net realisable value is the estimate of the selling price in the ordinary course of business, less the estimated costs of completion, selling and distribution expenses. Umgeni Water Capital and Grant Funding Capital grants for infrastructure received by Umgeni Water are reflected against property, plant and equipment. The grant is recognised in profit or loss over the remaining useful life of the depreciable asset as a reduced depreciation expense. Government grants towards staff re-training are recognised as income over the periods necessary to match them with the related costs and are deducted in reporting the related expense. Employee Benefits Retirement Benefit Costs -Provident Fund Contributions to the defined contribution retirement benefit plan for the provident fund are recognised as an expense when employees have rendered service entitling them to the contributions.
156 154 ANNUAL 1.0 PG PG 9-17 ORGANISATIONAL 3.0 PG MINISTER S FOREWORD 4.0 PG ACCOUNTING AUTHORITY S 5.0 PG CHIEF EXECUTIVE S 6.0 PG CORPORATE GOVERNANCE 7.0 PG STAKEHOLDER UNDERSTANDING AND SUPPORT Notes to the Consolidated Financial Statements (continued) For the year ended 30 June Summary of Significant Accounting Policies (continued) Employee Benefits (continued) Retirement Benefit Costs - Pension Fund For the defined benefit retirement benefit plans, the cost of providing benefits is determined using the projected unit credit method, with actuarial valuations being carried out at the end of each reporting period. Actuarial gains and losses are recognised immediately in other comprehensive income in accordance with IAS 19 revised. Past service cost is recognised immediately to the extent that the benefits are already vested, and otherwise is amortised on a straight line basis over the average period until the benefit becomes vested. The retirement benefit obligation recognised in the statement of financial position represents the present value of the defined benefit obligation as adjusted for unrecognised past service cost, and as reduced by the fair value of plan assets. Any asset resulting from this calculation is limited to the present value of available funds and reductions in future contributions to the plan. Other Retirement Benefits Post-retirement healthcare benefits are provided to certain of the group s retirees. The cost of providing benefits is determined using the projected unit credit method with actuarial valuations being carried out at the end of each reporting period. Actuarial gains and losses are recognised immediately in other comprehensive income in accordance with IAS 19 revised. Short-Term Employee Benefits Short-term employee benefits are those that are due to be settled within twelve months after the end of the period in which the services have been rendered. Short-term employee benefits include salaries, bonuses, allowances and other fringe benefits. Short-term employee benefit obligations are measured on an undiscounted basis and are expensed as the related service is provided. Remuneration of employees is charged to the statement of profit and loss. The group recognises a liability for leave and performance bonuses which is included in provisions and accrues for other short-term employee benefits if the group has a present legal or constructive obligation to pay the amount and the obligation can be estimated reliably. Provisions Provisions are recognised when the group has a present legal or constructive obligation as a result of a past event and it is probable that this will result in an outflow of economic benefits that can be reliably estimated. Financial Assets The group classifies its financial assets into the following categories: > Held-to-maturity financial assets; and > loans and receivables. The classification depends on the nature and purpose of the financial assets and is determined at the time of initial recognition. Management re-evaluates such designation at least at each reporting date. Financial assets are recognised on transaction date when the group becomes party to the contracts and thus obtains rights to receive economic benefits and are derecognised when those rights no longer exist. Financial assets are stated initially on transaction date at fair value including transaction costs.
157 8.0 PG PERFORMANCE AGAINST SHAREHOLDER COMPACT 9.0 PG CREATING VALUE 10.0 PG CONSERVING OUR NATURAL RESOURCES 11.0 PG ENABLING OUR PEOPLE 12.0 PG IMPROVING RESILIENCY 13.0 PG FINANCIAL SUSTAINABILITY 14.0 PG GRI CONTENT INDEX 155 ANNUAL Notes to the Consolidated Financial Statements (continued) For the year ended 30 June Summary of Significant Accounting Policies (continued) Financial Assets (continued) Held-To-Maturity Assets Held-to-maturity financial assets and loans and receivables are subsequently stated at amortised cost using the effective interest rate method. Amortised cost is calculated by taking into account any discount or premium on acquisition date and fees or costs that are an integral part of the effective interest rate. The effective interest rate amortisation is included in interest income in statement of profit and loss. Loans and Receivables Trade and other receivables Trade and other receivables are initially measured at fair value plus any directly attributable transaction costs. Subsequent to initial recognition these are measured at amortised cost using the effective interest method less any impairment losses. Cash and cash equivalents Cash and cash equivalents comprise cash on hand. Cash and cash equivalents are measured at amortised cost which is deemed to be fair value. Impairment of Financial Assets Financial assets are assessed for indicators of impairment at each reporting date. Financial assets are impaired where there is objective evidence that, as a result of one or more events that occurred after the initial recognition of the financial asset, the estimated future cash flows of the investment have been impacted. For financial assets carried at amortised cost, the amount of the impairment is the difference between the asset s carrying amount and the present value of estimated future cash flows, discounted at the original effective interest rate. The carrying amount of the financial asset is reduced by the impairment loss directly for all financial assets with the exception of trade receivables where the carrying amount is reduced through the use of a doubtful debts allowance account. When a trade receivable is uncollectable, it is written off against the allowance account. Subsequent recoveries of amounts previously written off are credited to profit or loss. Changes in the carrying amount of the allowance account are recognised in profit or loss. If, in a subsequent period, the amount of the impairment loss decreases and the decrease can be related objectively to an event occurring after the impairment was recognised, the previously recognised impairment loss is reversed through profit and loss to the extent that the carrying amount of the investment at the date the impairment is reversed does not exceed what the amortised cost would have been had the impairment not been recognised. Derecognition of Financial Assets The entity derecognises a financial asset only when: > The contractual rights to the cash flows from the asset expire; or > It transfers the financial asset and substantially all the risks and rewards of ownership of the asset to another entity; or > Retains the contractual rights to receive the cash flows of the financial asset, but assumes a contractual obligation to pay the cash flows to one or more recipients in an arrangement. Financial Liabilities Financial liabilities are initially recognised at the transaction date when the group becomes party to a contract, at fair value, net of transaction costs incurred and are subsequently stated at amortised cost. Premiums or discounts arising from the difference between the fair value of financial liabilities raised and the amount repayable at maturity date are charged to the statement of profit and loss as finance costs based on the effective interest rate method.
158 156 ANNUAL 1.0 PG PG 9-17 ORGANISATIONAL 3.0 PG MINISTER S FOREWORD 4.0 PG ACCOUNTING AUTHORITY S 5.0 PG CHIEF EXECUTIVE S 6.0 PG CORPORATE GOVERNANCE 7.0 PG STAKEHOLDER UNDERSTANDING AND SUPPORT Notes to the Consolidated Financial Statements (continued) For the year ended 30 June Summary of Significant Accounting Policies (continued) Financial Liabilities (continued) Trade and other payables Trade payables are not interest bearing and are stated at their nominal value. Derecognition Of Financial Liabilities The group derecognises financial liabilities when, and only when, the group s obligations are discharged, cancelled or they expire. Effective Interest Method The effective interest method is a method of calculating the amortised cost of a financial asset or financial liability and of allocating interest income or expense over the relevant period. The effective interest rate is the rate that exactly discounts estimated future cash receipts or cash payments (including all fees on points paid or received that form an integral part of the effective interest rate, transaction costs and other premiums or discounts) through the expected life of the financial asset or financial liability, or, where appropriate, a shorter period. Offset Financial assets and financial liabilities are only offset if there is a currently enforceable legal right to offset and there is an intention either to settle on a net basis or to realise the asset and settle the liability simultaneously. Fair Value of Financial Instruments not Measured at Fair Value A number of the group s financial instruments require the disclosure of fair value even though these assets are not measured at fair value. When determining the fair value of the asset or liability for disclosure purposes the group uses observable market data as far as possible. Fair values are categorised into different levels in the fair value hierarchy based on inputs used in the valuation techniques as follows: Level 1: quoted prices (unadjusted) in active markets for identical assets or liabilities; Level 2: inputs other than quoted prices included in level 1 that are observable for the asset or liability either directly (i.e. prices) or indirectly (i.e. derived from prices); and Level 3: inputs for the assets and liabilities that are not based on observable market data (unobservable inputs). Revenue The group recognises revenue when the amount of revenue can be reliably measured and it is probable that economic benefits will flow to the entity. Revenue is measured at the fair value of the consideration received or receivable net of discounts and value added taxation. Revenue is recognised as follows: Sale of goods Revenue from the sale of goods is recognised when significant risks and rewards of ownership have passed and the collectability of the related receivable is reasonably assured. Sale of goods consists of potable bulk water sales to customers and treatment of wastewater. Potable bulk water revenue is recognised at the point of metering to the customer. Rendering of services Revenue from services is recognised in the period in which these are rendered. Revenue from services consist of other services that complement bulk water service provision such as laboratory services, water quality monitoring, operating and maintenance contracts and acting as an implementing agent for any sphere of government for projects related to water service delivery.
159 8.0 PG PERFORMANCE AGAINST SHAREHOLDER COMPACT 9.0 PG CREATING VALUE 10.0 PG CONSERVING OUR NATURAL RESOURCES 11.0 PG ENABLING OUR PEOPLE 12.0 PG IMPROVING RESILIENCY 13.0 PG FINANCIAL SUSTAINABILITY 14.0 PG GRI CONTENT INDEX 157 ANNUAL Notes to the Consolidated Financial Statements (continued) For the year ended 30 June Summary of Significant Accounting Policies (continued) Revenue (continued) Rendering of services (continued) Rendering of services from acting as an implementing agent is recognised by reference to the stage of completion of the specific transaction assessed on the basis of the actual service provided as a proportion of the total services to be provided. This revenue includes the initial amount agreed in the contract plus any variations in contract work to the extent that they will result in revenue and can be measured reliably. As soon as the outcome of a contract can be estimated reliably, revenue and costs are recognised in profit or loss by reference to the stage of completion of the contract. When an outcome of a contract cannot be estimated reliably, revenue is recognised only to the extent of contract costs incurred that are likely to be recoverable. An expected loss on a contract is recognised immediately in profit or loss. Other revenue Other revenue is recognised when the significant risks and rewards of ownership are transferred to the purchaser and the amount of revenue can be measured reliably. Cost of Sales Cost of sales includes the costs of raw water and all other direct operating costs associated with the production processes. The costs directly attributable to sales for other activities, as defined in Section 30 of the Water Services Act (Act 108 0f 1997), are disclosed as cost of sales. All other costs are considered to be administration expenses. Taxation Umgeni Water and Msinsi Holdings SOC Ltd. are tax-exempt entities in terms of Section 10 (1) (t) (ix) of the Income Taxation Act and therefore the policy is only in respect of its subsidiary, Umgeni Water Services SOC Ltd. and associates. The income tax charge represents the tax currently payable and deferred tax. Current tax The tax currently payable is based on taxable income for the year. Taxable income differs from profit as reported in the statement of profit and loss because it excludes items of income or expense that are taxable or deductible in other years and it further excludes items that are never taxable or deductible. The group s liability for current tax is calculated using tax rates that have been enacted or substantively enacted by the reporting date. Deferred tax Deferred tax is the tax expected to be payable or recoverable on temporary differences between the carrying amounts of assets and liabilities in the financial statements and the corresponding tax bases used in the computation of taxable income, and is accounted for using the liability method. Deferred tax liabilities are generally recognised for all taxable temporary differences and deferred tax assets are recognised to the extent that it is probable that taxable profits will be available against which deductible temporary differences can be utilised. No deferred tax is recognised if the temporary difference arises from goodwill or from the initial recognition (other than in a business combination) of other assets and liabilities in a transaction that affects neither the tax profit nor the accounting profit. The carrying amount of deferred tax assets is reviewed at each reporting date and reduced to the extent that it is no longer probable that sufficient taxable profits will be available to allow all or part of the asset to be recovered. Deferred tax assets and liabilities are offset when there is a legally enforceable right to set off current tax assets against current tax liabilities and when they relate to income taxes levied by the same taxation authority and the entity intends to settle its current tax assets and liabilities on a net basis.
160 158 ANNUAL 1.0 PG PG 9-17 ORGANISATIONAL 3.0 PG MINISTER S FOREWORD 4.0 PG ACCOUNTING AUTHORITY S 5.0 PG CHIEF EXECUTIVE S 6.0 PG CORPORATE GOVERNANCE 7.0 PG STAKEHOLDER UNDERSTANDING AND SUPPORT Notes to the Consolidated Financial Statements (continued) For the year ended 30 June Summary of Significant Accounting Policies (continued) Interest Income Interest income is accrued on a time basis, by reference to the principal outstanding and at the effective interest rate applicable, which is the rate that exactly discounts estimated future cash receipts through the expected life of the financial asset to that asset s net carrying amount. Finance Costs Finance costs directly attributable to the acquisition, construction or production of qualifying assets, which are assets that necessarily take a substantial period of time to get ready for their intended use or sale, are added to the cost of those assets, until such time as the assets are substantially ready for their intended use or sale. Investment income earned on the temporary investment of specific borrowings pending their expenditure on qualifying assets is deducted from the borrowing cost eligible for capitalisation to those assets. All other borrowing costs are reflected in the statement of profit and loss in the period in which they are incurred. 3. Operating Segments and Segment Reporting Umgeni Water has two reportable segments: (i) The primary segment as defined by section 29 of the Water Services Act No. 108 of 1997 which is made up of bulk water and wastewater treatment. (ii) Other activities as defined by Section 30 of the Water Services Act No. 108 of This business segment consists of non-regulated activities which are mainly defined as services that complement bulk water service provision such as laboratory services, water quality monitoring, environmental management and where Umgeni Water acts as an implementing agent for any sphere of government for projects related to water service delivery. Segment results that are reported include items directly attributable to the segment as well as those that can be allocated on a reasonable basis. Additional information on the major customers per segment are included in note 16.
161 8.0 PG PERFORMANCE AGAINST SHAREHOLDER COMPACT 9.0 PG CREATING VALUE 10.0 PG CONSERVING OUR NATURAL RESOURCES 11.0 PG ENABLING OUR PEOPLE 12.0 PG IMPROVING RESILIENCY 13.0 PG FINANCIAL SUSTAINABILITY 14.0 PG GRI CONTENT INDEX 159 ANNUAL Notes to the Consolidated Financial Statements (continued) For the year ended 30 June Operating Segments and Segment Reporting (continued) Primary activities Bulk water Waste water Group Other activities Total kl 000 kl 000 kl 000 kl 000 For the year ended 30 June 2017 Treated water volume sold Raw water volume sold R 000 R 000 R 000 R 000 Revenue Cost of sales ( ) (88 182) ( ) ( ) Changes in water inventory Chemicals (57 294) (5 222) - (62 516) Depreciation ( ) (2 263) - ( ) Energy ( ) (18 492) - ( ) Maintenance ( ) (17 191) (2 138) ( ) Raw water ( ) - - ( ) Section 30 activities - - ( ) ( ) Staff costs ( ) (30 405) (452) ( ) Other direct operating expenses (30 713) (14 609) (209) (45 531) Gross profit Other income Other operating and administration expenses ( ) (15 542) (78 990) ( ) Profit from operations (52 135) Interest income Finance costs (1 290) (66) (43) (1 399) Share of profi t from associate Profit before tax (47 013) Taxation (101) (101) Profit for the year (47 114) Capital expenditure Segment assets Interest in associate Investments Unallocated Consolidated total assets Segment liabilities Unallocated Consolidated total liabilities
162 160 ANNUAL 1.0 PG PG 9-17 ORGANISATIONAL 3.0 PG MINISTER S FOREWORD 4.0 PG ACCOUNTING AUTHORITY S 5.0 PG CHIEF EXECUTIVE S 6.0 PG CORPORATE GOVERNANCE 7.0 PG STAKEHOLDER UNDERSTANDING AND SUPPORT Notes to the Consolidated Financial Statements (continued) For the year ended 30 June Operating Segments and Segment Reporting (continued) Primary activities Bulk water Waste water Group Other activities Total kl 000 kl 000 kl 000 kl 000 For the year ended 30 June 2016 Treated water volume sold Raw water volume sold R 000 R 000 R 000 R 000 Revenue Cost of sales ( ) (75 308) ( ) ( ) Changes in water inventory (698) - - (698) Chemicals (47 024) (4 718) - (51 742) Depreciation ( ) (3 005) - ( ) Energy ( ) (18 139) - ( ) Maintenance ( ) (17 271) (723) ( ) Raw water ( ) - - ( ) Section 30 activities - - ( ) ( ) Staff costs ( ) (23 978) (241) ( ) Other direct operating expenses (40 781) (8 197) (16) (48 994) Gross profit Other income Other operating and administration expenses ( ) (12 557) (24 113) ( ) Profit from operations (2 320) Interest income Finance costs (446) (715) (24) (1 185) Share of profi t from associate Profit before tax Taxation (65) (65) Profit for the year Capital expenditure Segment assets Interest in associate Investments Unallocated Consolidated total assets Segment liabilities Unallocated Consolidated total liabilities
163 8.0 PG PERFORMANCE AGAINST SHAREHOLDER COMPACT 9.0 PG CREATING VALUE 10.0 PG CONSERVING OUR NATURAL RESOURCES 11.0 PG ENABLING OUR PEOPLE 12.0 PG IMPROVING RESILIENCY 13.0 PG FINANCIAL SUSTAINABILITY 14.0 PG GRI CONTENT INDEX 161 ANNUAL Notes to the Consolidated Financial Statements (continued) For the year ended 30 June Revenue Group Parent R 000 R 000 R 000 R 000 Sale of goods Water sales Wastewater Rendering of services - Other activities Water Infrastructure Scientifi c and environmental Operating and Maintenance Other Included in revenues arising from water sales are revenues of approximately R1 582m (2016: R1 554m) from sales to the group's largest customer. (Refer to note 27) Total revenue Other Income Sundry income Rental income Total other income Sundry income comprises primarily: Operational grants, insurance proceeds and penalties on contracts.
164 162 ANNUAL 1.0 PG PG 9-17 ORGANISATIONAL 3.0 PG MINISTER S FOREWORD 4.0 PG ACCOUNTING AUTHORITY S 5.0 PG CHIEF EXECUTIVE S 6.0 PG CORPORATE GOVERNANCE 7.0 PG STAKEHOLDER UNDERSTANDING AND SUPPORT Notes to the Consolidated Financial Statements (continued) For the year ended 30 June Profit from Operations Group Parent R 000 R 000 R 000 R 000 Profi t from operations is stated after taking the following items into account: Asset impairments and write-offs Buildings & infrastructure impairments (refer to note 9) Buildings & infrastructure write-offs (refer to note 9) Capital work-in-progress impairments (refer to note 9) Other asset impairments and write-offs Amortisation Right of use agreement (refer to note 14) Intangible assets (refer to note 10) Auditors remuneration Audit fees - current year Audit fees - prior year under (over) provision 351 (196) 351 (196) Board members' emoluments (refer to pg 139) Depreciation Buildings and infrastructure (refer to note 9) Equipment and vehicles (refer to note 9) Doubtful debts provision Fair value adjustment of biological assets (refer to note 11) 788 (691) - - Impairment (Impairment reversal) on investment in subsidiary (915) Legal fees Maintenance Direct costs Indirect costs Operating lease payments (Profi t)/loss on disposal of property, plant and equipment (1 026) (1 026) (Profi t)/loss on disposal of biological assets (327) Retirement benefi ts Post retirement medical aid (refer to note 26.3) Pension - defi ned benefi t (refer to note 26.2) Salaries and other staff costs Direct Indirect Maintenance No. No. No. No. Number of employees at 30 June Permanent Fixed term contracts Total number of employees
165 8.0 PG PERFORMANCE AGAINST SHAREHOLDER COMPACT 9.0 PG CREATING VALUE 10.0 PG CONSERVING OUR NATURAL RESOURCES 11.0 PG ENABLING OUR PEOPLE 12.0 PG IMPROVING RESILIENCY 13.0 PG FINANCIAL SUSTAINABILITY 14.0 PG GRI CONTENT INDEX 163 ANNUAL Notes to the Consolidated Financial Statements (continued) For the year ended 30 June Taxation Group Parent R 000 R 000 R 000 R 000 Taxation arose from a 100% owned subsidiary Umgeni Water Services SOC Ltd. Taxation expense Reconciliation of taxation Accounting profi t Permanent differences (4 945) (4 365) - - Dividend received (4 995) (4 427) - - Disallowed expenses Taxable income Taxation expense Interest Income Interest received - investments Interest received - other fi nancial assets (refer to note 14) Interest received - other Total interest income Finance Costs Bank overdrafts and other Bonds Loans Less: borrowing costs capitalised (refer to note 9) ( ) ( ) ( ) ( ) Interest was capitalised to work-in-progress at the gross weighted average cost of capital of 10.59% (2016: 10.53%). Total finance costs
166 164 ANNUAL 1.0 PG PG 9-17 ORGANISATIONAL 3.0 PG MINISTER S FOREWORD 4.0 PG ACCOUNTING AUTHORITY S 5.0 PG CHIEF EXECUTIVE S 6.0 PG CORPORATE GOVERNANCE 7.0 PG STAKEHOLDER UNDERSTANDING AND SUPPORT Notes to the Consolidated Financial Statements (continued) For the year ended 30 June Property, Plant and Equipment Land Buildings and infrastructure Equipment and vehicles Capital work in progress Total parent Subsidiaries Group R 000 R 000 R 000 R 000 R 000 R 000 R 000 Year ended 30 June 2017 Carrying Amount 1 July Cost Accumulated impairments - ( ) - (99 322) ( ) - ( ) Accumulated grant funding - ( ) - ( ) ( ) - ( ) Accumulated depreciation - ( ) ( ) - ( ) (12 641) ( ) Additions Grant funding ( ) ( ) - ( ) Borrowing costs capitalised Disposals/Asset write-offs - - (1 839) (14 148) (15 987) - (15 987) Cost - - (4 047) (14 148) (18 195) - (18 195) Accumulated depreciation Transfers - 42 (47) - (5) - (5) Cost - 9 (63) - (54) - (54) Accumulated depreciation Depreciation charge - ( ) (33 408) ( ) (3 451) ( ) Impairment (2 741) (39 144) (41 885) (41 885) Commissioning ( ) Cost ( ) Accumulated grant funding Accumulated impairment Total property, plant and equipment Cost Accumulated impairments - ( ) - ( ) ( ) - ( ) Accumulated grant funding - ( ) - ( ) ( ) - ( ) Accumulated depreciation - ( ) ( ) - ( ) (16 092) ( ) Total property, plant and equipment
167 8.0 PG PERFORMANCE AGAINST SHAREHOLDER COMPACT 9.0 PG CREATING VALUE 10.0 PG CONSERVING OUR NATURAL RESOURCES 11.0 PG ENABLING OUR PEOPLE 12.0 PG IMPROVING RESILIENCY 13.0 PG FINANCIAL SUSTAINABILITY 14.0 PG GRI CONTENT INDEX 165 ANNUAL Notes to the Consolidated Financial Statements (continued) For the year ended 30 June Property, Plant and Equipment (continued) Land Buildings and infrastructure Equipment and vehicles Capital work in progress Total parent Subsidiaries Group R 000 R 000 R 000 R 000 R 000 R 000 R 000 Year ended 30 June 2016 Carrying Amount 1 July Cost Accumulated impairments - ( ) - (91 121) ( ) - ( ) Accumulated grant funding - ( ) - ( ) ( ) - ( ) Accumulated depreciation - ( ) (99 089) - ( ) (10 560) ( ) Additions Grant funding ( ) ( ) - ( ) Borrowing costs capitalised Disposals/Asset write-offs - (5 584) (1 623) - (7 207) - (7 207) Cost - (18 614) (13 342) - (31 956) - (31 956) Accumulated depreciation Depreciation charge - ( ) (25 926) - ( ) (2 081) ( ) - Impairment - (94 755) - (38 126) ( ) - ( ) Commissioning ( ) Cost ( ) Accumulated grant funding - ( ) Accumulated impairment - (29 924) Total property, plant and equipment Cost Accumulated impairments - ( ) - (99 322) ( ) - ( ) Accumulated grant funding - ( ) - ( ) ( ) - ( ) Accumulated depreciation - ( ) ( ) - ( ) (12 641) ( ) Total property, plant and equipment
168 166 ANNUAL 1.0 PG PG 9-17 ORGANISATIONAL 3.0 PG MINISTER S FOREWORD 4.0 PG ACCOUNTING AUTHORITY S 5.0 PG CHIEF EXECUTIVE S 6.0 PG CORPORATE GOVERNANCE 7.0 PG STAKEHOLDER UNDERSTANDING AND SUPPORT Notes to the Consolidated Financial Statements (continued) For the year ended 30 June Property, Plant and Equipment (continued) Infrastructure consists of: pipelines, dams, weirs, reservoirs, tunnels, pump stations, sludge plants, wastewater treatment works and water treatment works. Equipment and vehicles consists of: motor vehicles, computer hardware and furniture and fittings. The subsidiaries property, plant and equipment is all classified as equipment and vehicles. A schedule of land and buildings is available for inspection at the registered office of Umgeni Water. The group has an agreement with its major customer to operate and maintain the South Coast Booster pump station with the option for the customer to acquire the pump station at the end of it useful life of 14 years. The pump station has a carrying amount of R74m and is used by the customer to guarantee supply to a portion of its operational areas. The impairment losses arose from projects relating to rural development infrastructure where the recoverable amount is less than the carrying amount. The recoverable amount is the estimated value in use using the weighted average cost of capital as at 30 June 10.59% (2016: 9.46%). It was not possible to determine fair value less costs to sell as there was no basis for making a reliable estimate of the amount obtainable from the sale of these assets in an arms length transaction between knowledgeable and willing parties. The impairment losses to work-in-progress were calculated as a pro-rata impairment based on the final projected impairment value. Accumulated Impairment 30 June 2016 Impairment expense 30 June 2017 Accumulated Impairment 30 June 2017 Summary of impairments R 000 R 000 R 000 Buildings & infrastructure Greater Eston 731 (159) 572 Richmond (346) Piepline Progressive Impairment 2016 Progressive Impairment 2017 Accumulated Impairment 30 June 2016 Impairment expense 30 June 2017 Accumulated Impairment 30 June 2017 % % R 000 R 000 R 000 Work in progress Greater Mpofana (Phase 1) 15% 46% Impendle BWSS 74% 100%
169 8.0 PG PERFORMANCE AGAINST SHAREHOLDER COMPACT 9.0 PG CREATING VALUE 10.0 PG CONSERVING OUR NATURAL RESOURCES 11.0 PG ENABLING OUR PEOPLE 12.0 PG IMPROVING RESILIENCY 13.0 PG FINANCIAL SUSTAINABILITY 14.0 PG GRI CONTENT INDEX 167 ANNUAL Notes to the Consolidated Financial Statements (continued) For the year ended 30 June Capital Commitments Group Parent R 000 R 000 R 000 R 000 Commitments in respect of capital expenditure for the expansion, augmentation and upgrades of pipelines and water works: - contracted for but not provided for in the financial statements authorised but not contracted for Total capital commitments Estimated capital expenditure to be incurred as follows: - Within one year Two to fi ve years More than five years The proposed capital expenditure will be financed through internally generated funds, borrowings and grants. 10. Intangible Assets Intangible Asset Work in progress Parent Total Subsidiary Group R 000 R 000 R 000 R 000 R 000 As at 30 June 2017 SOFTWARE Carrying Amount value 1 July Cost Accumulated amortisation (31 931) - (31 932) (197) (32 129) Additions Commissioning ( ) Amortisation (8 805) - (8 805) (298) (9 103) Total intangible assets Cost Accumulated amortisation (40 736) - (40 736) (494) (41 231) Total
170 168 ANNUAL 1.0 PG PG 9-17 ORGANISATIONAL 3.0 PG MINISTER S FOREWORD 4.0 PG ACCOUNTING AUTHORITY S 5.0 PG CHIEF EXECUTIVE S 6.0 PG CORPORATE GOVERNANCE 7.0 PG STAKEHOLDER UNDERSTANDING AND SUPPORT Notes to the Consolidated Financial Statements (continued) For the year ended 30 June Intangible Assets (continued) Intangible Asset Work in progress Parent Total Subsidiary Group R 000 R 000 R 000 R 000 R 000 As at 30 June 2016 SOFTWARE Carrying Amount value 1 July Cost Accumulated amortisation (27 896) - (27 896) (11) (27 907) Additions Amortisation (4 036) - (4 036) (186) (4 222) Total intangible assets Cost Accumulated amortisation (31 931) - (31 932) (197) (32 129) Total intangible assets Biological Assets Group Parent R 000 R 000 R 000 R Game Opening carrying amount Additions Disposals (457) (1 023) - - Write off of animals poached (940) Fair value adjustment (788) The carrying amount was based on an estimated 492 (2016: 539) game, the most signifi cant categories being Buffalo, White Rhino and Zebra. The fair values of game are based on market related prices and is therefore classifi ed as level 2 fair values in terms of IFRS 13. These assets are not restricted nor is it pledged as security. Total biological assets
171 8.0 PG PERFORMANCE AGAINST SHAREHOLDER COMPACT 9.0 PG CREATING VALUE 10.0 PG CONSERVING OUR NATURAL RESOURCES 11.0 PG ENABLING OUR PEOPLE 12.0 PG IMPROVING RESILIENCY 13.0 PG FINANCIAL SUSTAINABILITY 14.0 PG GRI CONTENT INDEX 169 ANNUAL Notes to the Consolidated Financial Statements (continued) For the year ended 30 June Subsidiaries and Associates Group Parent R 000 R 000 R 000 R Investments in Subsidiaries and Associates Cost Accumulated impairment - - (30 000) (23 576) Share of post-acquisition reserves Loans to (From) Subsidiaries and Associates Msinsi Holdings SOC Limited Umgeni Water Services SOC Limited The loan with Umgeni Water Services has no set date for repayment and bears no interest. The loan with Msinsi Holdings SOC Limited is unsecured and bears interest at 7.35% per annum. The loan is expected to be paid by Total subsidiaries and associates Investments in Subsidiaries Proportion of ownership interest Proportion of voting power held Subsidiary Principal activity Place of incorporation % % % % Umgeni Water Services SOC Limited Water services RSA Msinsi Holdings SOC Limited Land and environmental management RSA The above entities remained subsidiaries throughout the year. During the year Umgeni Water impaired its investment in Msinsi SOC Limited by R6 424m as it is expected to be in a net loss position in the next 5 years. The impairment amount was based on value- in- use calculations using the projected operating cashflows of Msinisi and the weighted average cost of capital as at 30 June 2017 of 10.59%. Umgeni Water continues to provide financial support to Msinsi Holdings SOC Limited to ensure that the company continues to trade in the foreseeable future without any disruption in its business. Msinsi SOC Limited has an investment of 16.67% in Powaprops 31 (Proprietary) Limited. The investment has been fully impaired in Investments in associate of Umgeni Water Services SOC Limited Proportion of ownership interest Proportion of voting power held Associate Principal activity Place of incorporation % % % % Durban Water Recycling (Pty) Limited Water recycling RSA
172 170 ANNUAL 1.0 PG PG 9-17 ORGANISATIONAL 3.0 PG MINISTER S FOREWORD 4.0 PG ACCOUNTING AUTHORITY S 5.0 PG CHIEF EXECUTIVE S 6.0 PG CORPORATE GOVERNANCE 7.0 PG STAKEHOLDER UNDERSTANDING AND SUPPORT Notes to the Consolidated Financial Statements (continued) For the year ended 30 June Subsidiaries and Associates (continued) Umgeni Water Services SOC Limited has significant infl uence over Durban Water Recycling (Pty) Limited through the exercise of voting power rights due to representation on the Board of Directors and is thus accounted for as an associate. Durban Water Recycling (Pty) Limited's financial year end is 31 December. There have been no material transactions or events since then to the reporting date of the group except for total dividends of R27m declared by the Board of Durban Water Recycling on 19 May Carrying amount Directors' valuation R 000 R 000 R 000 R 000 Investments in associate of Umgeni Water Services (SOC) Limited Durban Water Recycling (Pty) Limited Investments held by Msinsi Holdings (SOC) Limited Powaprops 31 (Pty) Limited Net Investment R 000 R 000 Summarised financial information of associates: Total non-current assets of associates Total non-current liabilities of associates Total current assets of associates Total current liabilities of associates Total capital and reserves Total revenue of associates Share of profi t for the year of associates Investments Group Parent R 000 R 000 R 000 R Long-term Investments Held-to-maturity Loans and receivables Held-to-maturity investments represents the sinking fund redemption asset that matures in March 2021 for the UG21. Refer to note 30 fi nancial risk management and fi nancial instruments for maturity profi le and fair value of the long-term investments. Loans receivables represents money market funded investments.
173 8.0 PG PERFORMANCE AGAINST SHAREHOLDER COMPACT 9.0 PG CREATING VALUE 10.0 PG CONSERVING OUR NATURAL RESOURCES 11.0 PG ENABLING OUR PEOPLE 12.0 PG IMPROVING RESILIENCY 13.0 PG FINANCIAL SUSTAINABILITY 14.0 PG GRI CONTENT INDEX 171 ANNUAL Notes to the Consolidated Financial Statements (continued) For the year ended 30 June Investments (continued) Group Parent R 000 R 000 R 000 R Short-term Investments Loans and receivables Refer to note 30 financial risk management and fi nancial instruments for interest rates and maturity profile of investments. The carrying amount of investments approximates its fair value. Total investments Analysis of Held-to-Maturity Financial Assets Opening Balance Receipt of capital and interest Closing Balance Other Financial Assets Opening balance Amortisation (2 754) (2 694) (2 754) (2 694) Interest income The fi nancial asset is in respect of an agreement with a customer being granted the right of use of the 57 pipeline. It is amortised over 9 years from May 2010 at an interest rate associated with the related funding of the asset. Total other financial assets Inventories Stores Pipe inventories Maintenance spares Chemicals Miscellaneous Water Inventory Water inventory consists of closing inventory of raw and treated water Total inventories
174 172 ANNUAL 1.0 PG PG 9-17 ORGANISATIONAL 3.0 PG MINISTER S FOREWORD 4.0 PG ACCOUNTING AUTHORITY S 5.0 PG CHIEF EXECUTIVE S 6.0 PG CORPORATE GOVERNANCE 7.0 PG STAKEHOLDER UNDERSTANDING AND SUPPORT Notes to the Consolidated Financial Statements (continued) For the year ended 30 June Trade and Other Receivables Group Parent R 000 R 000 R 000 R 000 Trade receivables Less: provision for doubtful debts (66 429) (31 678) (66 429) (31 678) Opening Balance (31 678) (22 964) (31 678) (22 964) Written off during the year Provided for during the year (47 206) (8 748) (47 206) (8 748) Sub-total trade receivables Sundry debtors Less: provision for doubtful debts (16) (16) - - Sub-total sundry debtors Total trade and other receivables Trade debtors comprise bulk water and wastewater sales to municipalities of which ethekwini Metrpolitian Municipality and Msunduzi Local Municipality comprise a significant proportion - 87% (2016:84%) Trade debtors are granted credit terms of 30 days from date of invoice to settle outstanding debts. The average credit period, at financial year-end, is 41 Days (2016: 41 days) Amount Due Provision Total 2017 Total 2016 R 000 R 000 R 000 R 000 Customer ethekwini Metropolitan Municipality ilembe District Municipality (26 380) Msunduzi Local Municipality Ugu District Municipality umgungundlovu District Municipality Harry Gwala District Municipality (2 040) Sembcorp Siza Water (12 231) Other bulk customers 267 (92) Trade receivables - primary activities (40 743) Trade receivables - secondary activities (25 686) Total trade receivables (66 429) Trade and other receivables are classified as loans and receivables and the carrying amount approximates fair value. A further analysis of financial risk relating to trade receivables is included in note 30.
175 8.0 PG PERFORMANCE AGAINST SHAREHOLDER COMPACT 9.0 PG CREATING VALUE 10.0 PG CONSERVING OUR NATURAL RESOURCES 11.0 PG ENABLING OUR PEOPLE 12.0 PG IMPROVING RESILIENCY 13.0 PG FINANCIAL SUSTAINABILITY 14.0 PG GRI CONTENT INDEX 173 ANNUAL Notes to the Consolidated Financial Statements (continued) For the year ended 30 June Interest Receivable Group Parent R 000 R 000 R 000 R 000 Interest and premiums have been accrued for where investments have earned interest, but have not been received at year-end Interest and premium receivable relating to investments are classified as loans and receivables, the carrying amount approximates fair value. Total interest receivable Bank and Cash Cash and cash equivalents consist of: Bank and cash on hand The carrying amount of bank and cash is held at amortised cost and approximates its fair value. The group's outstanding guarantees are disclosed under note 25. Total bank and cash Reconciliation of Profit for the Year to Net Cash Generated from Operating Activities Profi t for the year Interest income ( ) ( ) ( ) ( ) Finance costs Adjusted for non-cash items: Fair value adjustment of biological assets 788 (691) - - (Profi t)/loss on disposal of biological assets (1 013) Impairment of investment in subsidiary (915) Asset impairments and write-offs Amortisation - financial assets Amortisation - amount owing to customer (3 572) (3 572) (3 572) (3 572) Amortisation - intangible asset Depreciation (Profi t)/loss on disposal of property, plant and equipment (1 026) (1 026) Increase in provisions and non-current liabilities Increase in doubtful debts provision Income Tax expense Share of profit from associate (4 995) (4 427) - - Tax paid (105) Operating surplus before working capital changes Working capital changes ( ) ( ) Increase in accounts receivable (67 804) (53 110) (65 425) (56 145) (Decrease)/increase in accounts payable ( ) ( ) Increase in inventory (1 014) (2 653) (1 014) (2 653) Net cash from operating activities
176 174 ANNUAL 1.0 PG PG 9-17 ORGANISATIONAL 3.0 PG MINISTER S FOREWORD 4.0 PG ACCOUNTING AUTHORITY S 5.0 PG CHIEF EXECUTIVE S 6.0 PG CORPORATE GOVERNANCE 7.0 PG STAKEHOLDER UNDERSTANDING AND SUPPORT Notes to the Consolidated Financial Statements (continued) For the year ended 30 June Capital Group Parent R 000 R 000 R 000 R 000 Capital consists primarily of contributions made by the Department of Water and Sanitation Total capital Debt Long-term Short-term Debt consists of interest bearing liabilities. Bonds are held at cost whilst bank loans and foreign loans are at amortised cost and are unsecured. Total debt Analysis of Debt Held at Amortised Cost Weighted average interest rate as at 30 June 2017 Bank loans Fixed rate 5.00% Variable 9.62% Bonds UG21 - Fixed rate 10.70% UG26 - Fixed rate 11.31% Foreign loans Fixed rate 9.08% Variable 8.42% Other Total debt Refer to note 30 fi nancial risk management and fi nancial instruments for maturity profi le and fair value of debt. Reconciliation of movement in debt for the year Balance at the beginning of the year Loans repaid (78 664) (78 434) (78 618) (78 434) Loans raised Balance at the end of the year
177 8.0 PG PERFORMANCE AGAINST SHAREHOLDER COMPACT 9.0 PG CREATING VALUE 10.0 PG CONSERVING OUR NATURAL RESOURCES 11.0 PG ENABLING OUR PEOPLE 12.0 PG IMPROVING RESILIENCY 13.0 PG FINANCIAL SUSTAINABILITY 14.0 PG GRI CONTENT INDEX 175 ANNUAL Notes to the Consolidated Financial Statements (continued) For the year ended 30 June Other Non-Current Liabilities Group Parent R 000 R 000 R 000 R 000 Amounts received in advance Amount received in advance relates to umkhomazi Bulk Water supply charge for bulk infrastructure which will be amortised to revenue over the life of the asset. Total other non-current liabilities Provisions Leave pay Legal claims Bonus Sub-total current provisions Noncurrent Incentive bonus provision Total 2017 Total 2016 R 000 R 000 R 000 R 000 R 000 R 000 R 000 Group Opening balance Provided during the year Utilised during the year (8 533) (2 279) (60 053) (70 866) (7 337) (78 203) (73 013) Closing balance Parent Opening balance Provided during the year Utilised during the year (7 457) (2 279) (57 343) (67 079) (7 337) (74 416) (72 421) Closing balance The leave pay provision is based on the number of days leave due to employees at financial year end and their cost to company per day. Legal claims provisions are raised to the extent that it is probable Umgeni Water will be required to honour obligations. Legal claims consist of employment and supply matters, finalisation of which is expected within the next fi nancial year. The provision for bonus is raised to recognise the performance of employees, which is payable to employees at the Board's discretion in line with the Performance Management Scheme. The non-current incentive bonus provision is raised in terms of Umgeni Water's performance policy and is based on a five year performance period. Refer to the remuneration report on pages for further detail. All provisions are raised in the ordinary course of business and no material unutilised provisions were written back.
178 176 ANNUAL 1.0 PG PG 9-17 ORGANISATIONAL 3.0 PG MINISTER S FOREWORD 4.0 PG ACCOUNTING AUTHORITY S 5.0 PG CHIEF EXECUTIVE S 6.0 PG CORPORATE GOVERNANCE 7.0 PG STAKEHOLDER UNDERSTANDING AND SUPPORT Notes to the Consolidated Financial Statements (continued) For the year ended 30 June Accounts Payable Group Parent R 000 R 000 R 000 R 000 Trade accounts payable Accruals Amounts due to related parties: Water purchases accrual - DWS Sundry creditors Section 30 customer advances Current portion of non current liabilities SARS Trade accounts payable and accruals comprise amounts outstanding for trade purchases. Section 30 advances comprise amounts received from customers in advance in terms of the contractual agreements and relate primarily to implementing agent agreements. Trade and other payables are carried at amortised cost and the carrying amount approximates fair value. These are normally settled within 30 days from date of statement. Total accounts payable Operating Lease Arrangements At the reporting date, the group had no outstanding commitments under non-cancellable operating leases. The group as the lessor - rental income The group owns a number of properties, where an insignificant portion of the property is rented out. The rental income of R3.0m (2016: R3.7m) was earned. Rentals are received from staff and tele-communications companies. At the reporting date, the group had contracted with tenants for the following future minimum lease payments year years > 5 years Total operating lease arrangements
179 8.0 PG PERFORMANCE AGAINST SHAREHOLDER COMPACT 9.0 PG CREATING VALUE 10.0 PG CONSERVING OUR NATURAL RESOURCES 11.0 PG ENABLING OUR PEOPLE 12.0 PG IMPROVING RESILIENCY 13.0 PG FINANCIAL SUSTAINABILITY 14.0 PG GRI CONTENT INDEX 177 ANNUAL Notes to the Consolidated Financial Statements (continued) For the year ended 30 June Contingent Liabilities Group Parent R 000 R 000 R 000 R 000 SARS During the current financial year Umgeni Water received an assessment of R19m from SARS on Input VAT claimed on a bad debt write off relating to the reticulation debtors which were handed over to Msundizi Local Municipality. The matter is undergoing appeal and pending the outcome of the Dispute Resolution process Guarantees Guarantees have been given by certain financial institutions in respect of payments to utility service providers Total contingent liabilities Post-Retirement Benefit Obligations All the Umgeni Water retirement benefit plans are governed by the Pension Funds Act (No. 24 of 1956) of South Africa. All full-time employees are compelled to belong to either the defined benefi t or the defi ned contribution plan. Group & Parent R 000 R 000 Summary of net liabilities for post-retirement benefit obligations: Defi ned benefi t plan (refer note 26.2) Post-retirement healthcare benefits (refer note 26.3) Total post-retirement benefit obligations Defined Benefit Contribution Group Parent R 000 R 000 R 000 R 000 The total cost charged to income represents the group's portion of the contribution payable to this scheme. At reporting date all amounts due and payable to this scheme had been paid
180 178 ANNUAL 1.0 PG PG 9-17 ORGANISATIONAL 3.0 PG MINISTER S FOREWORD 4.0 PG ACCOUNTING AUTHORITY S 5.0 PG CHIEF EXECUTIVE S 6.0 PG CORPORATE GOVERNANCE 7.0 PG STAKEHOLDER UNDERSTANDING AND SUPPORT Notes to the Consolidated Financial Statements (continued) For the year ended 30 June Post-Retirement Benefit Obligations (continued) 26.2 Defined Benefit Plan Group & Parent The Umgeni Water Retirement Fund was established on 1 December 1985 and was closed to new members with effect from 6 February The scheme is funded and actuarially valued every year. The effective date of the most recent valuation is 30 June The assets of the Umgeni Water Retirement Fund are held separately from those of the entity in a trustee administered fund, registered in terms of the Pension Funds Act, (Act 24 of 1956). The fair value of the plan is arrived at after considering the following: Key assumptions used in the actuarial valuation were as follows: Discount rate 9.90% 9.60% 9.40% Expected rate of salary increases 7.90% 8.20% 8.00% Future pension increase 4.60% 4.80% 4.67% R 000 R 000 R 000 Amounts recognised in profi t/loss in respect of the defi ned benefi t plan are as follows: Current service cost Interest on obligation Expected return on plan assets (72 454) (69 163) (61 947) Total included in staff costs in statement of profit and loss Amounts recognised in other comprehensive income in respect of the defined benefi t plan are as follows: Net actuarial (gain) loss (64 111) Total included in statement of other comprehensive income (64 111) The amount included in the statement of fi nancial position arising from the group's obligation in respect of its defined benefi t plan is as follows: Present value of funded defi ned benefi t obligation Fair value of plan assets ( ) ( ) ( ) Net liability in statement of financial position
181 8.0 PG PERFORMANCE AGAINST SHAREHOLDER COMPACT 9.0 PG CREATING VALUE 10.0 PG CONSERVING OUR NATURAL RESOURCES 11.0 PG ENABLING OUR PEOPLE 12.0 PG IMPROVING RESILIENCY 13.0 PG FINANCIAL SUSTAINABILITY 14.0 PG GRI CONTENT INDEX 179 ANNUAL Notes to the Consolidated Financial Statements (continued) For the year ended 30 June Post-Retirement Benefit Obligations (continued) 26.2 Defined Benefit Plan (continued) Group & Parent R 000 R 000 R 000 Movement in the net liability recognised in the statement of financial position is as follows: Net liability at the beginning of the year Net expense recognised in the statement of profit and loss Net expense (income) recognised in the statement of other comprehensive income (64 111) Company contributions (24 846) (32 190) (35 232) Net liability at end of year Movements in the defi ned benefi t obligation for the year: Defi ned benefi t obligation at beginning of the year Current service cost Member contributions Interest cost Actuarial (gain) loss ( ) (24 450) Benefi ts paid (36 114) (36 749) (36 202) Risk premiums (3 943) (4 970) (6 151) Expenses (1 289) (1 184) (1 277) Defined benefit obligation at end of year Movements in the present value of plan assets in the current period were as follows: Fair value of plan assets at beginning of year Interest on plan assets Member contributions Employer contributions Actuarial gain (52 010) (44 727) Benefi ts paid (36 114) (36 749) (36 202) Risk premiums (3 943) (4 970) (6 151) Expenses (1 289) (1 184) (1 277) Fair value of plan assets at end of year Actual Return on Assets
182 180 ANNUAL 1.0 PG PG 9-17 ORGANISATIONAL 3.0 PG MINISTER S FOREWORD 4.0 PG ACCOUNTING AUTHORITY S 5.0 PG CHIEF EXECUTIVE S 6.0 PG CORPORATE GOVERNANCE 7.0 PG STAKEHOLDER UNDERSTANDING AND SUPPORT Notes to the Consolidated Financial Statements (continued) For the year ended 30 June Post-Retirement Benefit Obligations (continued) 26.2 Defined Benefit Plan (continued) Group & Parent % % % Key assumptions used in the actuarial valuation were as follows: The major categories of plan assets and the expected rate of returns at the end of the reporting period are as follows: Cash 11.01% 12.37% 15.24% Equity 37.27% 40.49% 38.01% Bonds 20.33% 18.49% 14.44% Property 5.81% 4.21% 6.82% International 24.33% 23.49% 23.97% Other 1.25% 0.95% 1.52% Total % % % Percentages refl ected in 2017 are based on June 2017 asset composition. The group expects to make a contribution of R24m to the defi ned benefi t plan during the next fi nancial year. An analysis of the impact of changes in the underlying assumptions used in the actuarial valuation are presented in the table that follows: Accrued Liability Sensitivity Factor Central Assumption Increase Decrease % R 000 % R 000 1% change in discount rate 9.60% (14.20%) ( ) 17.90% % change in infl ation rates 7.20% 14.90% (12.40%) ( ) 1% change in salary increase rate 8.20% 9.20% (8.10%) (76 144)
183 8.0 PG PERFORMANCE AGAINST SHAREHOLDER COMPACT 9.0 PG CREATING VALUE 10.0 PG CONSERVING OUR NATURAL RESOURCES 11.0 PG ENABLING OUR PEOPLE 12.0 PG IMPROVING RESILIENCY 13.0 PG FINANCIAL SUSTAINABILITY 14.0 PG GRI CONTENT INDEX 181 ANNUAL Notes to the Consolidated Financial Statements (continued) For the year ended 30 June Post-Retirement Benefit Obligations (continued) 26.3 Post-Retirement Healthcare Benefits The scheme is unfunded and the group has recognised its full past service liability. Actuarial valuations are done annually. The effective date of the most recent valuation is 30 June Employees who joined Umgeni Water after 28 February 2002 cannot elect to join this scheme. Group & Parent Key assumptions used in the actuarial valuation were as follows: % % % Discount rate 10.90% 9.80% 9.40% Expected rate of increase in medical indices 10.00% 9.40% 9.00% R 000 R 000 R 000 Amounts recognised in profit and loss in respect of the post-retirement healthcare costs are as follows: Current service cost Interest on obligation Total included in staff costs in statement of profit and loss Amounts recognised in other comprehensive income in respect of the post-retirement healthcare costs are as follows: Actuarial (gain) loss (29 361) (8 341) Total included in statement of other comprehensive income (29 361) (8 341) The amount included in the statement of financial position arising from the group's obligation in respect of its post-retirement healthcare obligations is as follows: Opening balance Net expense recognised in the statement of profit and loss Company contributions (10 155) (8 520) (6 763) Net (income) expense recognised in the statement of other comprehensive income (29 361) (8 341) Liability at end of year Movements in the post-retirement healthcare obligation in the current period were as follows: Projected benefi t obligation at beginning of year Current service cost Interest cost Actuarial (gain) loss (29 361) (8 341) Employer contributions (10 155) (8 520) (6 763) Projected benefit obligation at end of year The group expects to make a contribution of R10.2m to the post retirement medical aid during the next financial year.
184 182 ANNUAL 1.0 PG PG 9-17 ORGANISATIONAL 3.0 PG MINISTER S FOREWORD 4.0 PG ACCOUNTING AUTHORITY S 5.0 PG CHIEF EXECUTIVE S 6.0 PG CORPORATE GOVERNANCE 7.0 PG STAKEHOLDER UNDERSTANDING AND SUPPORT Notes to the Consolidated Financial Statements (continued) For the year ended 30 June Post-Retirement Benefit Obligations (continued) 26.3 Post-Retirement Healthcare Benefits (continued) An analysis of the impact of changes in the underlying assumptions used in the actuarial valuation are presented in the table below: Accrued Liability Sensitivity Factor Central Assumption Increase Decrease % R 000 % R 000 1% change in medical aid inflation rates 10.00% 18.00% (14.40%) (57 213) 1 year change in expected retirement age 60 years (3.70%) (14 786) 3.80% % change in discount rate 10.90% (14.10%) (56 196) 18.0% The information presented above is as per the latest valuation, which was performed on 30 June The risks faced by the company as a result of the post-employment retirement benefits obligation are as follows: > Infl ation: the risk that future CPI Infl ation is higher than expected and uncontrolled; > longevity: the risk that pensioners live longer than expected and thus their pension benefit is payable for longer than expected; > open-ended, long-term liability: the risk that the liability may be volatile in the future and uncertain; > future changes in legislation: the risk that changes to legislation with respect to the post-employment liability may increase the liability for the company; > future changes in the tax environment: the risk that changes in the tax legislation governing employee benefits may increase the liability for the company; > perceived inequality by non eligible employees: the risk of dissatisfaction of employees who are non eligible for a post-employment healthcare subsidy; and > administration: administration of this liability poses a burden to the company. 27. Related Parties The group is wholly owned by its shareholder, the Department of Water and Sanitation. Umgeni Water is a schedule 3B public entity in terms of the Public Finance Management Act. Government related parties include national departments (including the shareholder), constitutional institutions (schedule 1 of the Public Finance Management Act), public entities (schedule 2 and 3 of the Public Finance management Act) and local government (including municipalities). The list of public entities in the national sphere of government is provided by National Treasury on its website It also provides the names of subsidiaries of the public entities. Related parties also comprise subsidiaries of Umgeni Water, and associates of the group and post retirement benefi t plans for the benefi t of the employees. For disclosures regarding the post retirement benefi t plan, refer to note 26. Related parties also includes key management personnel of Umgeni Water or its shareholder and close family members of the related parties. Key management personnel for Umgeni Water include the group's Board of directors and the executive management (EXCO) and their remuneration is disclosed in the remuneration report pages IAS 24 Related Party disclosures provides government related entities an exemption which eliminates the requirements to disclose information that is costly to gather and of less value to users. The group applies the exemption in respect of its relationship with government related entities at national and local levels of government. All related party transactions are carried within normal trade conditions. The following transactions were carried out with related parties.
185 8.0 PG PERFORMANCE AGAINST SHAREHOLDER COMPACT 9.0 PG CREATING VALUE 10.0 PG CONSERVING OUR NATURAL RESOURCES 11.0 PG ENABLING OUR PEOPLE 12.0 PG IMPROVING RESILIENCY 13.0 PG FINANCIAL SUSTAINABILITY 14.0 PG GRI CONTENT INDEX 183 ANNUAL Notes to the Consolidated Financial Statements (continued) For the year ended 30 June Related Parties (continued) Group Parent R 000 R 000 R 000 R 000 Revenue: Sale of goods and services Bulk water and wastewater Local government (includes municipalities)* Revenue: Section 30 Local government (includes municipalities) National Department Cost of sales Raw water purchases National Department Section 30 Local government (includes municipalities) National Department Other operating and administration expenses Subsidiaries and associates Interest income Subsidiaries and associates Work-in-progress: Grant funding for rural development projects National Department Loans to (from) entities: Subsidiaries and associates Investments in subsidiaries Subsidiaries and associates Other payables Subsidiaries and associates Revenue in advance: Local government and municipalities Raw water purchases accrual Right of use agreement Local government (includes municipalities) Revenue in advance Local government (includes municipalities) * Included in local government is sales to the group's largest customer of R1 582m (2016: R1 554m)
186 184 ANNUAL 1.0 PG PG 9-17 ORGANISATIONAL 3.0 PG MINISTER S FOREWORD 4.0 PG ACCOUNTING AUTHORITY S 5.0 PG CHIEF EXECUTIVE S 6.0 PG CORPORATE GOVERNANCE 7.0 PG STAKEHOLDER UNDERSTANDING AND SUPPORT Notes to the Consolidated Financial Statements (continued) For the year ended 30 June Irregular Expenditure Group Parent R 000 R 000 R 000 R 000 Opening balance 1 July Add: irregular expenditure relating to current year Add: prior year irregular expenditure identified in current year Less: amounts condoned by appropriate authority (379) (356) (379) (356) Less: amounts awaiting condonement (10 982) - (9 394) - Closing balance 30 June Details of irregular expenditure - current and prior year: All incidents relate to expenditure which arose as a result of non compliance to the supply chain management policy. Disciplinary steps/criminal proceedings were not instituted as the expenditure was incurred in support of the business requirements. Details of irregular expenditure condoned Incident Supply chain management policy not adhered to. Condoned by (condoning authority) Bid Adjudication Committee in terms of the irregular expenditure procedure. 29. Fruitless and Wasteful Expenditure Opening balance 1 July Fruitless and wasteful expenditure relating to current year Less: amounts condoned by appropriate authority (2) (4) - - Less: amounts transferred to receivable - (3) - - Less: amounts awaiting condonment (5 230) - (5 226) - Closing balance 30 June Analysis of fruitless and wasteful expenditure Remuneration from 20 th August 2017 to 19 th August th August 2017 to 19 th August th August 2018 to 19 th August Interest paid Total fruitless and wasteful expenditure Details of fruitless & wasteful expenditure current year: Incident Remuneration paid in terms of a settlement agreement. Details The Board entered into a settlement agreement with the Chief Executive as at 30 June 2017, which included the settlement of remuneration to the contract extension period to August 2019.
187 8.0 PG PERFORMANCE AGAINST SHAREHOLDER COMPACT 9.0 PG CREATING VALUE 10.0 PG CONSERVING OUR NATURAL RESOURCES 11.0 PG ENABLING OUR PEOPLE 12.0 PG IMPROVING RESILIENCY 13.0 PG FINANCIAL SUSTAINABILITY 14.0 PG GRI CONTENT INDEX 185 ANNUAL Notes to the Consolidated Financial Statements (continued) For the year ended 30 June Financial Risk Management and Financial Instruments Group Parent R 000 R 000 R 000 R Capital Management Capital and reserves is consistent with the prior year and consists of: Capital Accumulated profi t Other comprehensive income (11 350) ( ) (11 350) ( ) Total Total interest bearing debt Debt Management Debt management strategies Umgeni Water's treasury strategy focuses on solvency and debt management through the cash flow tariff model, after taking into account the long-term business plans, water demand curves, and future capital expenditure. The liability curve and debt redemption is then actively managed: (a) By targeting an optimal debt level; (b) by asset liability matching, through a redemption strategy framework which pro-actively manages liquidity and refinancing risk associated with large debt maturities such as bonds; (c) within approved borrowing limits; and (d) by maintaining an external credit rating. (a) Optimal debt level Umgeni Water strives to be within an optimal debt level by not exceeding a gearing ratio of 0.67 and maintains a target debt interest rate structure of 70% fi xed and 30% fl oating which aims to minimise volatility of both the tariff and statement of profi t and loss. Group Parent R 000 R 000 R 000 R 000 Gross Debt (Refer note 20) Interest Rate Structure Fixed 86% 85% 86% 85% Floating 14% 15% 14% 15% Gearing Ratio
188 186 ANNUAL 1.0 PG PG 9-17 ORGANISATIONAL 3.0 PG MINISTER S FOREWORD 4.0 PG ACCOUNTING AUTHORITY S 5.0 PG CHIEF EXECUTIVE S 6.0 PG CORPORATE GOVERNANCE 7.0 PG STAKEHOLDER UNDERSTANDING AND SUPPORT Notes to the Consolidated Financial Statements (continued) For the year ended 30 June Financial Risk Management and Financial Instruments (continued) Debt Management (continued) (b) Asset and liability management Asset and liability matching focuses on two components: > The fi rst being the matching of maturity dates of fi nancial assets and liabilities whereby fi nancial assets will be used to repay debt on its maturity. This will typically be applied in a redemption strategy. > The second component is whereby surplus cash (cash after operating expenditure and interest cost) is matched to debt redemption or specifi c funding requirements. Taking the business environment and market conditions into account, the following framework is used in managing the redemption portfolio build-up over the years preceding the redemption of the bond. Prior to redemption, the entity must have provided for at least: > 10% of the capital value required in the year of redemption; > 40% provided for 2 years before redemption; > 75% provided for 1 year before maturity; and > the balance of 25% is funded during the year of maturity. (c) Managing debt within approved borrowing limits The borrowing limits for Umgeni Water for the period 2016 to 2019 are as follows: R 000 R 000 R 000 R 000 Borrowing Limit Unconditional Conditional Total Group & Parent R 000 R 000 Utilisation of borrowing limits Borrowing limit Gross borrowings (refer to note 20) ( ) ( ) Collateral and guarantees (refer to note 25) (822) (1 925) Unutilised borrowing limits (d) Maintaining an external credit rating The ability of Umgeni Water to raise debt at competitive interest rates is significantly dependant on the external credit rating issued by a Ratings Agency. The credit rating is maintained through protection of operating cashflows by anticipating adverse market and business conditions and continuous monitoring of strategies devised to counteract the adverse market conditions. Umgeni Water s national credit ratings are as follows: Long-term rating Short-term rating Rating Agency Review date Standard & Poors 09 August 2017 zaaaa zaaa- FitchRatings 13 July 2017 AA+(zaf) F1+(zaf)
189 8.0 PG PERFORMANCE AGAINST SHAREHOLDER COMPACT 9.0 PG CREATING VALUE 10.0 PG CONSERVING OUR NATURAL RESOURCES 11.0 PG ENABLING OUR PEOPLE 12.0 PG IMPROVING RESILIENCY 13.0 PG FINANCIAL SUSTAINABILITY 14.0 PG GRI CONTENT INDEX 187 ANNUAL Notes to the Consolidated Financial Statements (continued) For the year ended 30 June Financial Risk Management and Financial Instruments (continued) Financial Risk Management Umgeni Water s exposure to risk, its objectives, policies and processes for managing the risk and the methods used to measure it have been consistently applied in the years presented, unless otherwise stated. The Corporate Treasury function provides services to the business, co-ordinates access to domestic financial markets, monitors and manages the fi nancial risks relating to the operations of Umgeni Water through the short, medium and long-term funding strategy, and highlights the risk implications of various fi nancial transactions. The use of fi nancial derivatives is governed by Umgeni Water s policies approved by the Board of directors, which provide written principles on foreign exchange risk, interest rate risk, credit risk, and the investment of excess liquidity. Compliance with policies and exposure limits is reviewed by the internal auditors on a continuous basis. Umgeni Water does not enter into or trade financial instruments, including derivative financial instruments, for speculative purposes. The principal fi nancial risks to which Umgeni Water is exposed as a result of its fi nancial instruments are: > Credit risk (which includes counterparty risk); > liquidity risk; and > market risk (interest rate risk) Credit Risk Credit risk is the risk of financial loss to the group if a customer or other counterparty to a fi nancial instrument fails to meet its contractual obligations. Credit risk arises principally from the group's receivables and investment securities. Credit risk concentration will result in Umgeni Water being exposed to counter party failure. This has the potential to impact on the organisation's ability to remain within its optimal debt level. Exposure to credit risk The carrying amount of fi nancial assets represents the maximum credit exposure. The maximum exposure to credit risk at the reporting date was as follows: Group Parent R 000 R 000 R 000 R 000 A) Investments B) Trade and other receivables (excluding provision for bad debts) C) Cash and cash equivalents (excluding petty cash) a) Investments According to its Investment Policy Umgeni Water will manage credit risk by: > Conducting transactions only with counter parties and issuers who satisfy soundly based and acceptable assessment processes, and only after formal limits have been set; > same-day settlement limits will be set wherever possible and/or strict settlement procedures set and adhered to; and > continuous monitoring of the credit quality of counterparties. Concentration of credit risk is managed by setting credit limits at counterparty-specific level. The credit limit calculation is based on 5% of shareholders funds but subject to a maximum limit of R1 000m as approved by the Board, and limited to parties where 5% of shareholders funds exceeds R100m. The group limits its exposure to credit risk by investing only with counterparties with a long-term rating of A and short-term rating of F1 and better. Utilisation of the credit limit is measured in terms of risk weighting except in the case of zero coupon bonds where credit limit utilisation is based on current market value. Given the credit ratings of counterparties, management does not expect any counterparty to fail to meet its obligations and hence no investment has been impaired, during the current and prior years. Maximum credit risk exposure to Umgeni Water: The table below shows Umgeni Water's credit exposure to the approved counterparties in context of the credit limits assigned to each counterparty and the carrying value of the investment placed with each counterparty. The credit ratings reflected are as at reporting date and in terms of the Fitch rating agency definitions.
190 188 ANNUAL 1.0 PG PG 9-17 ORGANISATIONAL 3.0 PG MINISTER S FOREWORD 4.0 PG ACCOUNTING AUTHORITY S 5.0 PG CHIEF EXECUTIVE S 6.0 PG CORPORATE GOVERNANCE 7.0 PG STAKEHOLDER UNDERSTANDING AND SUPPORT Notes to the Consolidated Financial Statements (continued) For the year ended 30 June Financial Risk Management and Financial Instruments (continued) Financial Risk Management (continued) Credit Risk (continued) Financial Instruments Group & Parent Counterparty FitchRatings Credit Limit R 000 R 000 R 000 Held-to-maturity Nedbank Limited A/A Loans and receivables ABSA Bank Limited A/A First Rand Bank Limited A/A Standard Bank of South Africa Limited A/A Nedbank Limited A/A Investec Limited A/A Nedgroup Money Market Fund Limited AA Investec Money Market Fund Limited AA Stanlib Money Market Fund Limited AA Corporation for Public Deposits Government Guarantee Total b) Trade and other receivables The management of credit risk in relation to trade and other receivables is summarised as follows: > Umgeni Water aims to minimise loss caused by default of customers through specific policies and procedures; and > compliance with these policies and procedures are the responsibility of the Chief Financial Officer and Financial Manager. Monitoring of compliance with these policies is carried out by internal audit. All known risks are required to be fully disclosed and accounted for and are provided for as doubtful debts. In monitoring customer credit risk, customers are grouped according to their credit characteristics, including whether they are bulk or commercial customers, their aging profile and existence of previous fi nancial diffi culties. The average credit period allowed is 30 days from invoice date. Interest is charged at prime rate on debtors over 30 days from date of invoice. Trade receivables over 30 days are provided for based on estimated irrecoverable amounts from the sale, determined by reference to past default experience. Monitoring exposure Umgeni Water monitors exposures on an on-going basis utilising various reporting tools and flagging potential risks which are reported to National Treasury in terms of Section 41 of the Municipal Finance Management Act. The following reports are used to monitor credit risk: > Age analysis reports; and > status report for significant overdue debtors. The maximum exposure to credit risk for trade and other receivables at the reporting date by type of counter party is as follows:
191 8.0 PG PERFORMANCE AGAINST SHAREHOLDER COMPACT 9.0 PG CREATING VALUE 10.0 PG CONSERVING OUR NATURAL RESOURCES 11.0 PG ENABLING OUR PEOPLE 12.0 PG IMPROVING RESILIENCY 13.0 PG FINANCIAL SUSTAINABILITY 14.0 PG GRI CONTENT INDEX 189 ANNUAL Notes to the Consolidated Financial Statements (continued) For the year ended 30 June Financial Risk Management and Financial Instruments (continued) Financial Risk Management (continued) Credit Risk (continued) Group Parent R 000 R 000 R 000 R 000 Gross Amounts (excluding provision for bad debts) Bulk Wastewater Other activities Total amounts (excluding provision for bad debts) The group's most significant customer accounts for R196m of the trade and receivables carrying amount at 30 June (2016:R152m) Impairment Losses Refer to note 16 for impairment of trade and other receivables. Group & Parent R 000 R 000 There were no financial assets past due or impaired and whose terms have been renegotiated. - - Analysis of the ageing of financial assets (trade receivables) which are past due but have not been impaired: days days days days The group believes that the unimpaired amounts that are past due by more than 30 days are still recoverable, based on historic payment behaviour and analysis of customer credit risk. Cash and Cash Equivalents The group held cash and cash equivalents of R25m at 30 June 2017 (2016: R38m) of the following which represents the maximum credit exposure on these assets.
192 190 ANNUAL 1.0 PG PG 9-17 ORGANISATIONAL 3.0 PG MINISTER S FOREWORD 4.0 PG ACCOUNTING AUTHORITY S 5.0 PG CHIEF EXECUTIVE S 6.0 PG CORPORATE GOVERNANCE 7.0 PG STAKEHOLDER UNDERSTANDING AND SUPPORT Notes to the Consolidated Financial Statements (continued) For the year ended 30 June Financial Risk Management and Financial Instruments (continued) Financial Risk Management (continued) Credit Risk (continued) Group Parent Counterparty Rating R 000 R 000 R 000 R 000 Cash First Rand Bank Limited A/A ABSA Bank Limited A/A Total The remaining balance of 51 (2016: 51) for the Group and 23 (2016: 26) for the parent represents petty cash in Rands per thousand for which there is no credit risk attached. Guarantees At 30 June 2017 the group had R0.8m (2016:R1.9m) of guarantees outstanding and this represents the maximum exposure to the Group. Collateral At 30 June 2017 the group has no collateral held as security Liquidity Risk Liquidity risk is the risk that the group will encounter difficulty in meeting the obligations associated with its fi nancial liabilities that are settled by delivering cash or another financial asset. The group's approach to managing liquidity is to ensure, as far as possible, that it will always have sufficient liquidity to meet its liabilities when due, under both normal and stressed conditions, without incurring unacceptable losses or risking damage to the group's reputation. Mitigation approach To mitigate liquidity risk, Umgeni Water: > Monitors the level of expected cash inflows on trade and other receivables together with the expected cash outfl ows on trade and other payables; > has short-term funding facilities to meet on-going cash requirements for which facility options are in place with four banks (FNB, Standard, ABSA, Nedbank); > has a Domestic Medium Term Note (DMTN) Programme has been established allowing for longer dated debt such as bonds to be issued with relative ease; > has provided for a R200m cash buffer investment to cater for a delay in payments by its customers; > has a redemption strategy framework, which provides guidelines for managing the risks associated with refinancing large debt maturities; and > has borrowing limits approved by National Treasury Liquidity risk inherent in contractual cash flows The following table details the group's expected maturity for its financial assets. The tables below have been drawn up based on the undiscounted contractual maturities of the financial assets including interest that will be earned on those assets except where the Umgeni Water anticipates that the cash flow will occur in a different period.
193 8.0 PG PERFORMANCE AGAINST SHAREHOLDER COMPACT 9.0 PG CREATING VALUE 10.0 PG CONSERVING OUR NATURAL RESOURCES 11.0 PG ENABLING OUR PEOPLE 12.0 PG IMPROVING RESILIENCY 13.0 PG FINANCIAL SUSTAINABILITY 14.0 PG GRI CONTENT INDEX 191 ANNUAL Notes to the Consolidated Financial Statements (continued) For the year ended 30 June Financial Risk Management and Financial Instruments (continued) Financial Risk Management (continued) Liquidity Risk (continued) Liquidity risk inherent in contractual cash flows (continued) Weighted average effective interest rate < 1 month 1-3 months Group 3 months-1 year 1-5 years >5 years Total R 000 R 000 R 000 R 000 R 000 R 000 R 000 Financial Assets 2017 Fixed interest rate instruments* 9.21% (5 241) (10 483) (47 172) Variable interest rate instruments 7.90% Trade and other Receivables n/a Total Fixed interest rate instruments 9.21% (5 241) (10 483) (47 172) Variable interest rate instruments 7.91% Trade and other Receivables n/a Total * Negative up to 1 year due to the reverse annuity which matures in 2021 to meet the redemption requirements for the UG21 Bond. The group and parent fi gures remain the same with the exception of parent trade and other receivables maturity of 1-3 months of R (2016: R ) and 3 months -1 year R in Rands per thousand for the current year. The following tables summarises Umgeni Water s remaining contractual maturity for its non-derivative financial liabilities. The tables have been drawn up based on the undiscounted cash flows of fi nancial liabilities based on the earliest date on which Umgeni Water can be required to pay. The table includes both interest and principal cash flows which may differ from the carrying values of the liabilities at the reporting date.
194 192 ANNUAL 1.0 PG PG 9-17 ORGANISATIONAL 3.0 PG MINISTER S FOREWORD 4.0 PG ACCOUNTING AUTHORITY S 5.0 PG CHIEF EXECUTIVE S 6.0 PG CORPORATE GOVERNANCE 7.0 PG STAKEHOLDER UNDERSTANDING AND SUPPORT Notes to the Consolidated Financial Statements (continued) For the year ended 30 June Financial Risk Management and Financial Instruments (continued) Financial Risk Management (continued) Liquidity Risk (continued) Liquidity risk inherent in contractual cash flows (continued) Weighted average effective interest rate < 1 month 1-3 months Group 3 months-1 year 1-5 years >5 years Total R 000 R 000 R 000 R 000 R 000 R 000 R 000 Financial Liabilities 2017 Fixed interest rate instruments 10.84% Variable interest rate instruments 8.91% Trade and other payables n/a Total Fixed interest rate instruments 10.81% Variable interest rate instruments 9.00% Trade and other payables n/a Total The group and parent fi gures remain the same with the exception of parent trade and other payables maturity of <1 month R98 519, 3 months - 1 year of R (2016:R ) and 3 months-1 year R in Rands per thousand Primary source of funding and unused facilities The primary source of funding to meet Umgeni Water's requirements are revenue, cash inflows from maturing fi nancial assets purchased, debt issued in the market and other loans. The following sources of funding are available to Umgeni Water to meet its short, medium and long-term funding requirements and will supplement the primary liquidity sources under stress conditions: (a) Domestic Medium Term Note Programme (DMTN) Umgeni Water has established a Domestic Medium Term Note Programme to issue bonds to meet long-term capital expenditure funding requirements. The programme has an authorised amount of R4 000m, and is a useful funding tool in terms of the following: > Refi nancing the duration of the stock of debt; > refi nancing the fi xed to fl oating ratio of the debt book; > meeting short-term liquidity requirements; and > fi lling gaps in the debt maturity profi le. The UG21 was issued at a total nominal value of R600m on 02 March 2010 at a fixed rate of 10.70% and the UG26 was issued at a total nominal value of R935m at a fixed rate of 11.31% on 09 March 2016, both under the DMTN Programme. The unutilised portion of the programme as at the 30 June 2017 is R2 465m.
195 8.0 PG PERFORMANCE AGAINST SHAREHOLDER COMPACT 9.0 PG CREATING VALUE 10.0 PG CONSERVING OUR NATURAL RESOURCES 11.0 PG ENABLING OUR PEOPLE 12.0 PG IMPROVING RESILIENCY 13.0 PG FINANCIAL SUSTAINABILITY 14.0 PG GRI CONTENT INDEX 193 ANNUAL Notes to the Consolidated Financial Statements (continued) For the year ended 30 June Financial Risk Management and Financial Instruments (continued) Financial Risk Management (continued) Liquidity Risk (continued) Primary source of funding and unused facilities (continued) Group & Parent Committed Uncommitted R 000 R 000 (b) General banking facilities Umgeni Water has the following committed and uncommitted bank facilities available: Type of facility Working capital facility General Banking facility (c) Bank Loans This method of funding allows Umgeni Water to refinance short-term debt into longer-term debt with the view of achieving greater asset/liability matching Interest rate risk Interest rate risk is the risk that changes in interest rates cause a reduction/increase in net profit for Umgeni Water. Umgeni Water is exposed to interest rate risk as funds are borrowed at both fixed and fl oating interest rates. Borrowings issued at fl oating interest rates exposes Umgeni Water to cashflow interest rate risk. Mitigation approach The risk is managed by maintaining an appropriate mix between fixed and fl oating rate borrowings: 70% fi xed to 30% fl oating interest rate profi le. Recommended Ratio Group & Parent R 000 R 000 Ratio of fixed to floating interest rate Fixed 70% 86% 85% Floating 30% 14% 15%
196 194 ANNUAL 1.0 PG PG 9-17 ORGANISATIONAL 3.0 PG MINISTER S FOREWORD 4.0 PG ACCOUNTING AUTHORITY S 5.0 PG CHIEF EXECUTIVE S 6.0 PG CORPORATE GOVERNANCE 7.0 PG STAKEHOLDER UNDERSTANDING AND SUPPORT Notes to the Consolidated Financial Statements (continued) For the year ended 30 June Financial Risk Management and Financial Instruments (continued) Financial Risk Management (continued) Interest rate risk (continued) Group Parent R 000 R 000 R 000 R 000 At reporting date the interest rate profile of the group's interest bearing financial instruments is as follows: Fixed rate instruments Financial assets Financial liabilities ( ) ( ) ( ) ( ) Net position ( ) ( ) ( ) ( ) Variable rate instruments Financial assets Financial liabilities ( ) ( ) ( ) ( ) Net Position Sensitivity Analysis A sensitivity analysis to a change in interest rates has been performed based on the exposure to interest rates for both derivatives and non-derivative instruments at the reporting date. For floating rate liabilities and investments, the analysis is prepared assuming the amount of liability and investment outstanding at the reporting date was outstanding for the whole year. A 50 basis point increase or decrease is used when reporting interest rate risk internally to key management personnel and represents management s assessment of the reasonable possible change in interest rates. The sensitivity analysis assumes that all other variables remain constant and has been prepared on the same basis for the prior year. If interest rates had been 50 basis points higher/lower and all other variables were held constant, the group's profit for the year ended 30 June 2017 would decrease/increase by R2.2m (2016: R1.9m) Accounting Classifications and Fair Values The following tables show the carrying values and the fair value of financial assets and liabilities, including the fair value hierarchy. It does not include fair value information for financial assets and liabilities not measured at fair value if the carrying amount is a reasonable approximation of the fair value.
197 8.0 PG PERFORMANCE AGAINST SHAREHOLDER COMPACT 9.0 PG CREATING VALUE 10.0 PG CONSERVING OUR NATURAL RESOURCES 11.0 PG ENABLING OUR PEOPLE 12.0 PG IMPROVING RESILIENCY 13.0 PG FINANCIAL SUSTAINABILITY 14.0 PG GRI CONTENT INDEX 195 ANNUAL Notes to the Consolidated Financial Statements (continued) For the year ended 30 June Financial Risk Management and Financial Instruments (continued) Accounting Classifications and Fair Values (continued) Group Parent R 000 R 000 R 000 R 000 CARRYING VALUES CATEGORIES OF FINANCIAL INSTRUMENTS Financial Assets Held-to-maturity Loans and receivables Other investments Trade and other receivables Interest and premium receivable Cash and cash equivalents Financial Liabilities Held at amortised cost Long and short-term debt Other non current liabilities Accounts payable Interest payable Except as detailed below, the directors' consider the carrying values of the financial assets and fi nancial liabilities recorded at amortised cost in the fi nancial statements to be a reasonable approximation of their fair values. Fair Value Hierarchy Level Group Parent R 000 R 000 R 000 R 000 FAIR VALUES CATEGORIES OF FINANCIAL INSTRUMENTS Held-to-maturity financial assets Level Long and short-term debt Level 2 ( ) ( ) Financial Instrument Valuation Technique Signifi cant unobservable inputs Held-to-maturity financial assets Long-term and short-term debt Discounted cashflow analysis using prices from observable current market transactions for similar instruments. Discounted cashflow analysis using prices from observable current market transactions for similar instruments. N/A N/A
198 196 ANNUAL 1.0 PG PG 9-17 ORGANISATIONAL 3.0 PG MINISTER S FOREWORD 4.0 PG ACCOUNTING AUTHORITY S 5.0 PG CHIEF EXECUTIVE S 6.0 PG CORPORATE GOVERNANCE 7.0 PG STAKEHOLDER UNDERSTANDING AND SUPPORT 31. Subsequent events No other material event has occurred between the accounting date and the date of this report. 32. Going concern The directors, having considered all the relevant information, have satisfied themselves that the group is in a sound financial position and that it has adequate access to sufficient borrowing facilities to meet its foreseeable cash requirements. There are adequate resources to continue operating for the foreseeable future and it is therefore appropriate to adopt the going concern basis in preparing the financial statements. The Executive Authority of Umgeni Water has initiated a process towards the establishment of a single provincial water board in KwaZulu-Natal. As at the end of the reporting year, this process was still underway and is planned to culminate in a merger between Umgeni Water and Mhlathuze Water. This process was initially envisaged to be concluded during the financial year, however due to a number of strategic steps that need to be taken to inform the final decision making process (which includes parliamentary processes, legislative processes and financial commitments confirmed for National Treasury) this was not achieved. The move to amalgamate the two water boards is not isolated from other initiatives that government is engaged in to ensure the sustainability of water supply to the province. The accounting authority has no reason to believe that this process will negatively affect the going concern position of the entity during the 2017/2018 financial year, but albeit that it will create growth opportunities for the merged entity (once all conditional processes have been achieved) with a clear mandate from the Executive Authority.

199 8.0 PG PERFORMANCE AGAINST SHAREHOLDER COMPACT 9.0 PG CREATING VALUE 10.0 PG CONSERVING OUR NATURAL RESOURCES 11.0 PG ENABLING OUR PEOPLE 12.0 PG IMPROVING RESILIENCY 13.0 PG FINANCIAL SUSTAINABILITY 14.0 PG GRI CONTENT INDEX 197 ANNUAL NAGLE DAM


200 198 ANNUAL 1.0 PG PG 9-17 ORGANISATIONAL 3.0 PG MINISTER S FOREWORD 4.0 PG ACCOUNTING AUTHORITY S 5.0 PG CHIEF EXECUTIVE S 6.0 PG CORPORATE GOVERNANCE 7.0 PG STAKEHOLDER UNDERSTANDING AND SUPPORT R1 163 million total Capex Spend (Parent), of which R503 million went towards projects for rural development. UMGENI RIVER
201 8.0 PG PERFORMANCE AGAINST SHAREHOLDER COMPACT 9.0 PG CREATING VALUE 10.0 PG CONSERVING OUR NATURAL RESOURCES 11.0 PG ENABLING OUR PEOPLE 12.0 PG IMPROVING RESILIENCY 13.0 PG FINANCIAL SUSTAINABILITY 14.0 PG GRI CONTENT INDEX 199 ANNUAL 14.0 GRI Content Index Strategy and Profile Disclosures STRATEGY AND ANALYSIS (2 INDICATORS). PG. # G4-1. Statement from the most senior decision maker. 22 G4-2. Description of key impacts, risks and opportunities. 24 ORGANISATIONAL (10 INDICATORS). PG. # G4-3. Name of organisation. 9 G4-4. Primary brands, products and/or services. 9 G4-5. Location of organisation s headquarters. 7 G4-6. Number of countries where the organisation operates G4-7. Nature of ownership and legal form G4-8. Markets served by the organisation (including geographic breakdown, sectors served and types of customers/beneficiaries) G4-9. Scale of the reporting organisation G4-10. Total number of employees by employment contract and gender. 97 G4-11. Percentage of total employees covered by collective bargaining agreements. 98 G4-12. Description of the organisation s supply chain. 103 G4-13. Significant changes during the reporting period regarding the organisation s size, structure, ownership or its supply chain. 12 G4-14. Report of whether, and how, the precautionary approach or principle is addressed by the organisation. 22 G4-15. List of externally developed economic, environmental, and social charters, principles, or other initiatives to 7 which the organisation subscribes or endorses. G4-16. Membership of associations in which the organisation has positions in governance bodies, participates in projects or communities, provides funding beyond routine membership dues or views membership as strategic. 102 IDENTIFIED MATERIAL ASPECTS AND BOUNDARIES (3 INDICATORS). PG. # G4-1.7 List of all entities included in the organisation s consolidated financial statements or equivalent documents. G4-18. Explanation of the process of defining report content and the aspect boundaries. 7 G4-19. List of all material aspects identified in the process for defining report content. 7 7
202 200 ANNUAL 1.0 PG PG 9-17 ORGANISATIONAL 3.0 PG MINISTER S FOREWORD 4.0 PG ACCOUNTING AUTHORITY S 5.0 PG CHIEF EXECUTIVE S 6.0 PG CORPORATE GOVERNANCE 7.0 PG STAKEHOLDER UNDERSTANDING AND SUPPORT Strategy and Profile Disclosures...continued STAKEHOLDER ENGAGEMENT (4 INDICATORS) PG. # G4-24. List of stakeholder groups engaged by the organisation. 51 G4-25. Basis for identification and selection of stakeholder with whom to engage. 51 G4-26. G4-27. Report the organisation s approach to stakeholder engagement, including frequency of engagement by type and by stakeholder group, and an indication of whether any of the engagement was undertaken specifically, as part of the report preparation process. Key topics and concerns that have been raised through stakeholder engagements, and how the organisation has responded to those key topics and concerns, including through its reporting. Report the stakeholder groups that raised each of the key topics and concerns (6 INDICATORS). PG. # G4-28. Reporting period for information provided. 7 G4-29. Date of most recent previous report. 7 G4-30. Reporting cycle. 7 G4-31. Contact point for questions regarding the report or its contents. 7 G4-32. Report an in accordance option that the organisation has chosen. 7 G4-33. Assurance Policy and current practice with regard to seeking external assurance for the report, if not included in an assurance report, explain the scope and basis of any external assurance provided. Also explain the relationship between the organisation and the assurance provider. 7 GOVERNANCE (21 INDICATORS). PG. # G4-34. Governance structure of the organisation, including committees under the highest governance body and 35 responsibilities in decision-making on economic, environmental and social impacts. G4-35. Process for delegating authority for economic, environmental and social topics from the highest 41 governance body to senior executives and other employees. G4-36. Report whether the organisation has appointed an executive-level position or positions with responsibility 35 for economic, environmental and social topics, and whether post holders report directly to the highest governance body. G4-37. Processes for consultation between stakeholders and the highest governance body on economic, 35 environmental and social topics. If consultation is delegated, describe to whom and feedback processes to the highest governance body. G4-38. Composition of the highest governance body by independence, tenure on the governance body, number 35 and nature of other significant positions and commitments, gender, membership of under-represented social groups, competences, and stakeholder representation. G4-39. Report whether the Chair of the highest governance body is also an executive officer (and, if so, his/her 35 function within the organisation s management and the reasons for this arrangement). G4-40. Nomination and selection processes for the highest governance body and its committees and the criteria 35 used for nominating and selecting the highest governance body members including where, and how, diversity, independence experience and expertise are considered, and the extent of involvement of stakeholders, including shareholders. G4-41. Processes in place for the highest governance body to ensure conflicts of interest are avoided and managed. 35 G4-42. The highest governance body s and senior executives roles in the development, approval and updating 35 of the organisation s purpose, value or mission statements, strategies, policies, and goals related to economic, environmental and social impacts. G4-43. Measures taken to develop and enhance the highest governance body s collective knowledge of economic, environmental and social topics. 35
203 8.0 PG PERFORMANCE AGAINST SHAREHOLDER COMPACT 9.0 PG CREATING VALUE 10.0 PG CONSERVING OUR NATURAL RESOURCES 11.0 PG ENABLING OUR PEOPLE 12.0 PG IMPROVING RESILIENCY 13.0 PG FINANCIAL SUSTAINABILITY 14.0 PG GRI CONTENT INDEX 201 ANNUAL Strategy and Profile Disclosures...continued GOVERNANCE (21 INDICATORS)....continued PG. # G4-44. Processes in place for evaluation of the highest governance body s performance with respect to 36 governance of economic, environmental and social topics. Report whether such evaluation is independent or not, and its frequency. Report whether such evaluation is a self-assessment. G4-45. The highest governance body s role in identification and management of economic, environmental and 36 social impacts, risks and opportunities. Include the highest governance body s role in the implementation of due diligence processes. G4-46. The highest governance body s role in reviewing the effectiveness of the organisation s risk management 36 processes for economic, environmental and social topics. G4-47. The frequency of the highest governance body s review of economic, environmental and social impacts, 36 risks and opportunities. G4-48. Report the highest committee or position that formally reviews and approves the organisation s 36 sustainability report and ensures that all material aspects are covered. G4-49. Report the process for communicating critical concerns to the highest governance body. 36 G4-50. Report the nature and total number of critical concerns that were communicated to the highest 36 governance body and the mechanism(s) used to address and resolve them. G4-51. Remuneration policies for the highest governance body and senior executives. 88 and 140 G4-52. Report the process for determining remuneration. Report whether remuneration consultants are involved 36 and 139 in determining remuneration and whether they are independent of management. Report any other relationships which the remuneration consultants have with the organisation. G4-53. Report how stakeholders views are sought and taken into account regarding remuneration, including the 36 and 139 results of votes on remuneration policies and proposals, if applicable. G4-54. Report the ratio of the annual total compensation of the organisation s highest-paid individual in each country of significant operations to the medial annual total compensation for all employees (excluding the highest-paid individual) in the same country. G4-55. Report the ratio of percentage increase in annual total compensation for the organisation s highestpaid individual in each country of significant operations to the medial annual total compensation for all employees (excluding the highest-paid individual) in the same country. 139 ETHICS AND INTEGRITY. PG. # G4-56. G4-57. G4-58. Description of the organisation s values, principles, standards and norms of behaviour, such as codes of conduct and codes of ethics. Internal and external mechanisms for seeking advice on ethical and lawful behaviour, and matters related to organisational integrity, such as helplines or advice lines. Internal and external mechanisms for reporting concerns about unethical or unlawful behaviour, and matters related to organisational integrity, such as escalation through line management, whistleblowing mechanisms or hotlines DISCLOSURES ON MANAGEMENT APPROACH. PG. # G4-DMA. Report why the aspect is material. Report the impacts that make this aspect material. 7 G4-DMA. Report how the organisation manages the material aspect or its impacts. 7 G4-DMA. Report the evaluation of the management approach, including the mechanisms for evaluating the effectiveness of the management approach; results of the evaluation of the management approach and any related adjustments to the management approach. 7
204 202 ANNUAL 1.0 PG PG 9-17 ORGANISATIONAL 3.0 PG MINISTER S FOREWORD 4.0 PG ACCOUNTING AUTHORITY S 5.0 PG CHIEF EXECUTIVE S 6.0 PG CORPORATE GOVERNANCE 7.0 PG STAKEHOLDER UNDERSTANDING AND SUPPORT Economic Indicators ECONOMIC PERFORMANCE, INCLUDING MARKET PRESENCE AND INDIRECT ECONOMIC ASPECTS. PG. # G4-EC1. G4-EC2. Direct economic value generated and distributed, including revenues, operating costs, employee compensation, donations and other community investments, retained earnings, and payments to capital providers and governments. Financial implications and other risks and opportunities for the organisation s activities due to climate change. G4-EC3. Coverage of the organisation s defined benefit plan obligations. 177 G4-EC4. Financial assistance received from government. 120 G4-EC5. Ratios of standard entry level wage compared to local minimum wage at significant locations of operation. - G4-EC6. Proportion of senior management hired form the local community at locations of significant operation. 95 G4-EC7. Development and impact of infrastructure investments and services supported. 78 G4-EC8. Significant indirect economic impacts, including the extent of impacts. 78 G4-EC9. Proportion of spending on local suppliers at significant locations of operation and 137 Environmental Indicators ENVIRONMENTAL PERFORMANCE, INCLUDING MATERIALS, ENERGY, WATER, BIODIVERSITY, EMISSIONS, EFFLUENT & WASTE, COMPLIANCE AND TRANSPORT. PG. # G4-EN1. Materials used by weight or volume. 84 G4-EN2. Percentage of materials used that are recycled input materials. 91 G4-EN3. Energy consumption within the organisation. 87 G4-EN6. Reduction of energy consumption. 87 G4-EN7. Reductions in energy requirements of products and services. 87 G4-EN8. Total water withdrawal by source. 84 G4-EN9. Water sources significantly affected by withdrawal of water. 85 G4-EN10. Percentage and total volume of water recycled and reused. 84 and 87 G4-EN11. Operational sites owned, leased, managed in, or adjacent to, protected areas and areas outside of high biodiversity value outside protected areas. 90 G4-EN12. Description of significant impacts of activities, products, and services on biodiversity in protected areas and areas of high biodiversity value outside protected areas. G4-EN13. Habitats protected or restored G4-EN15. Direct Greenhouse gas (GHG) Emissions (Scope 1). 88 G4-EN16. Energy indirect Greenhouse (GHG) Emissions (Scope 2). 88 G4-EN17. Other indirect Greenhouse (GHG) Emissions (Scope 3). 88 G4-EN18. Greenhouse (GHG) Emissions intensity. 88 G4-EN19. Reduction of Greenhouse (GHG) Emissions. 88 G4-EN22. Total water discharge by quality and destination. 67 G4-EN23. Total weight of waste by type and disposal method. 91 G4-EN24. Total number and volume of significant spills. 92 G4-EN26. Identity, size, protected status, and biodiversity value of water bodies and related habitats significantly affected by the organisation s discharges or water and runoff. 70 and 85 G4-EN27. Extent of impact mitigation of environmental impacts or products and services. 92 G4-EN30. Significant environmental impacts of transporting products and other goods and materials used for the 88 organization's operations, and transporting members of the workforce. G4-EN31. Total environmental protection expenditures and investments by type. 88 G4-EN32. Percentage of new suppliers that were screened using environmental criteria G4-EN34. Number of total grievances about environmental impacts filed, addressed, and resolved through formal grievance mechanisms
205 8.0 PG PERFORMANCE AGAINST SHAREHOLDER COMPACT 9.0 PG CREATING VALUE 10.0 PG CONSERVING OUR NATURAL RESOURCES 11.0 PG ENABLING OUR PEOPLE 12.0 PG IMPROVING RESILIENCY 13.0 PG FINANCIAL SUSTAINABILITY 14.0 PG GRI CONTENT INDEX 203 ANNUAL Social Indicators Labour Practices and Decent Work LABOUR PERFORMANCE, INCLUDING EMPLOYMENT, LABOUR/MANAGEMENT RELATIONS, OCCUPATIONAL HEALTH & SAFETY, TRAINING & EDUCATION, AND DIVERSITY & EQUAL OPPORTUNITY. PG. # G4-LA1. Total number and rates of new employee hires and employee turnover by age group, gender and region. 97 G4-LA2. Benefits provided to full-time employees that are not provided to temporary or part-time employees, 95 by significant locations of operation. G4-LA3. Return to work and retention rates after parental leave, by gender. 95 G4-LA4. Minimum notice periods regarding operational changes, including whether these are specified in 52 collective agreements. G4-LA5. G4-LA6. Percentage of total workforce represented in formal joint management-worker health and safety committees that help monitor and advise on occupational health and safety programs. Types of injury and rates of injury, occupational diseases, lost days, and absenteeism, and number of work-related fatalities by region and by gender. G4-LA7. Workers with high incidence or high risk of diseases related to their occupation. 98 G4-LA8. Health and safety topics covered in formal agreements with trade unions. 98 G4-LA9. Average hours of training per year, per employee, by gender, and by employee category. 99 G4-LA10. Programs for skills management and lifelong learning that support the continued employability of employees and assist them in managing career endings. 101 G4-LA11. G4-LA12. G4-LA13. Percentage of employees receiving regular performance and career development reviews, by gender and by employee category. Composition of governance bodies and breakdown of employees per category according to gender, age group, minority group membership, and other indicators of diversity. Ratio of basic salary and remuneration of women to men by employee category, by significant locations of operation. G4-LA14. Percentage of new suppliers that were screened using labour practices criteria. 103 G4-LA15. Significant actual and potential negative impacts for labour practices in the supply chain and actions taken. 103 G4-LA16. Number of grievances about labour practices filed, addressed, and resolved through formal grievance mechanisms and 96 - Social Indicators Human Rights HUMAN RIGHTS PERFORMANCE, INCLUDING STRATEGY & MANAGEMENT, NON-DISCRIMINATION, FREEDOM OF ASSOCIATION, CHILD LABOUR AND FORCED LABOUR. PG. # G4-HR1. G4-HR2. Percentage and total number of significant investment agreements and contracts that include clauses incorporating human rights concerns or that have undergone human rights screening. Total hours of employee training on policies and procedures concerning aspects of human rights that are relevant to operations, including the percentage of employees trained. G4-HR3. Total number on incidents of discrimination and corrective action taken. 103 G4-HR4. Operations and suppliers identified in which the right to exercise freedom of association and collective 103 bargaining may be violated or at significant risk, and actions taken to support these rights. G4-HR5. G4-HR6. G4-HR9. Operations and suppliers identified as having significant risk for incidents of child labour and measures taken to contribute to the effective abolition of child labour. Operations and suppliers identified as having significant risk, for incidents of forced or compulsory labour and measures to contribute to the elimination of all forms of forced or compulsory labour. Total number and percentage of operations that have been subject to human rights reviews or impact assessments. G4-HR10. Percentage of new suppliers that have been screened using human rights criteria. 103 G4-HR11. Significant actual and potential negative human rights impacts in the supply chain and actions taken. 103 G4-HR12. Number of grievances related to human rights filed, addressed, and resolved through formal grievance mechanisms
206 204 ANNUAL 1.0 PG PG 9-17 ORGANISATIONAL 3.0 PG MINISTER S FOREWORD 4.0 PG ACCOUNTING AUTHORITY S 5.0 PG CHIEF EXECUTIVE S 6.0 PG CORPORATE GOVERNANCE 7.0 PG STAKEHOLDER UNDERSTANDING AND SUPPORT Social Indicators Society SOCIETY PERFORMANCE, INCLUDING COMMUNITY, CORRUPTION, PUBLIC POLICY AND COMPLIANCE. PG. # G4-SO1. Percentage of operations with implemented local community engagement, impact assessments and 83 development programmes. G4-SO3. Total number and percentage of operations assessed for risks related to corruption and the significant 38 and 91 risks identified. G4-SO4. Communication and training on anti-corruption policies and procedures. 38 and 91 G4-SO5. Confirmed incidents of corruption and actions taken. 38 and 91 G4-SO8. Monetary value of significant fines and total number of non-monetary sanctions for non-compliance 38 and 91 with laws and regulations. G4-SO9. Percentage of new suppliers that were screened using criteria for impacts on society. 103 G4-SO10. Significant actual and potential negative impacts on society in the supply chain and actions taken. 103 G4-SO11. Number of grievances about impacts on society filed, addressed, and resolved through formal grievance mechanisms. 103 Social Indicators Product Responsibility PRODUCT RESPONSIBILITY, INCLUDING CUSTOMER HEALTH & SAFETY, PRODUCTS & SERVICES, MARKETING & COMMUNICATION AND CUSTOMER PRIVACY. PG. # G4-PR1. Percentage of significant product and service categories for which health and safety impacts are 65 assessed for improvements. G4-PR2. Total number of incidents of non-compliance with regulations and voluntary codes concerning health 65 and safety impacts of products and services during their life cycle, by type of outcomes. G4-PR3. Type of product and service information required by the organisation s procedures for product and 65 service information, and percentage of significant products and service categories subject to such information requirements. G4-PR4. Total number of incidents of non-compliance with regulations and voluntary codes concerning product 65 and service information and labelling, by type of outcomes. G4-PR5. Results of surveys measuring customer satisfaction. 68

207 NAGLE DAM JCA 2246


208
Back to Basics Programme MILE 2017
 Back to Basics Programme MILE 2017 Background to B2B The Back to Basics Presentation will cover the following aspects : Background to B2B Programme Priorities of the Programme Quarterly M&E Process Municipal
Financial Review. 1. Introduction. 2. Financial performance
 Financial Review 1. Introduction The financial year under review was characterised by the global financial crisis and the economic downturn in the local economy. At Umgeni Water the focus during this period
PROGRESS WITH THE NATIONAL INFRASTRUCTURE MAINTENANCE STRATEGY
 PROGRESS WITH THE NATIONAL INFRASTRUCTURE MAINTENANCE STRATEGY Kevin Wall CSIR, P.O. Box 395, Pretoria, 0001; Cell: 082-4593618, Email: kwall@csir.co.za ABSTRACT The National Infrastructure Maintenance
Ola Busari. Acting CEO, TCTA. 18 April 2018
 Ola Busari Acting CEO, TCTA 1 18 April 2018 Strategic Overview Pre-determined Objectives Current TCTA Directives Balanced Scorecard Budget Funding Program Discussion & Clarifications 2 3 Vision To be the
Terms of Reference Development of the City of Tshwane Sustainability Financing Mechanism Strategy
 Terms of Reference Development of the City of Tshwane Sustainability Financing Mechanism Strategy 1. ABOUT THE SACN The South African Cities Network (SACN) as established in 2002, is a network of the nine
The Presidency Department of Performance Monitoring and Evaluation
 The Presidency Department of Performance Monitoring and Evaluation Briefing to the Standing Committee on Appropriations on the Strategic Plan and Annual Performance Plan for the 2012/13 financial year
Strategic Asset Management Policy
 Strategic Asset Management Policy Submission Date: 2018-04-24 Approved by: Council Approval Date: 2018-04-24 Effective Date: 2018-04-24 Resolution Number: Enter policy number. Next Revision Due: Enter
FINANCIAL STATUS OF MUNICIPALITIES IN KWAZULU NATAL
 FINANCIAL STATUS OF MUNICIPALITIES IN KWAZULU NATAL KwaZulu-Natal Provincial Treasury Presentation to Select Committee on Finance - Parliament of the Republic of South Africa WEDNESDAY, 30 TH MAY 2007
CODES OF GOOD PRACTICE FOR THE SOUTH AFRICAN MINERALS INDUSTRY
 (15 June 2017 to date) MINERAL AND PETROLEUM RESOURCES DEVELOPMENT ACT 28 OF 2002 (Gazette No. 23922, Notice No. 1273 dated 10 October 2002. Commencement date: 1 May 2004 [Proc. No. R25, Gazette No. 26264])
Flood Risk Management Planning in Scotland: Arrangements for February 2012
 Flood Risk Management Planning in Scotland: Arrangements for 2012 2016 February 2012 Flood Risk Management (Scotland) Act 2009 1 Contents Forewords 1. Introduction to this document... 5 2. Sustainable
RELATIONSHIP BETWEEN THE BUDGET AND THE IDP 28 FEBRUARY 2017
 RELATIONSHIP BETWEEN THE BUDGET AND THE IDP 28 FEBRUARY 2017 1 Contents Introduction Legislative Requirements Inc. MSCOA Why MSCOA Local Government Accountability Cycle Budget Process and linkage to IDP
KwaZulu-Natal Provincial Treasury
 KwaZulu-Natal Provincial Treasury UTHUNGULU DISTRICT: SOCIO-ECONOMIC PROFILE 8.1 Demographics The KwaZulu-Natal Province has both, a growing and maturing population, presenting opportunities and challenges
Suggested elements for the post-2015 framework for disaster risk reduction
 United Nations General Assembly Distr.: General 16 June 2014 A/CONF.224/PC(I)/6 Original: English Third United Nations World Conference on Disaster Risk Reduction Preparatory Committee First session Geneva,
CITY OF JOHANNESBURG METROPOLITAN MUNICIPALITY GROUP RISK AND ASSURANCE SERVICES GROUP RISK MANAGEMENT POLICY
 CITY OF JOHANNESBURG METROPOLITAN MUNICIPALITY Effective Date 1 July 2015 TABLE OF CONTENTS 1. POLICY STATEMENT... 3 2. POLICY CONTEXT... 4 3. PURPOSE... 5 4. POLICY SCOPE AND APPLICATION... 6 5. RISK
Changing Approaches to Financing and Financial Management in the South African Local Government Sector
 868 Changing Approaches to Financing and Financial Management in the South African Local Government Sector D Sing School of Public Administration & Development Management, University of Natal ABSTRACT
Ensuring The Effective Participation Of Each Sphere Of Government In The Processes And Structures That Determine Intergovernmental Fiscal Arrangements
 Ensuring The Effective Participation Of Each Sphere Of Government In The Processes And Structures That Determine Intergovernmental Fiscal Arrangements Jackie Manche, Chief Executive Officer, Independent
That the report from the Director of Finance regarding the Strategic Asset Management Policy, dated June 20, 2018, be received; and
 Staff Report To: From: Mayor and Council Jeff Schmidt, Director of Finance Date: June 20, 2018 Subject: Strategic Asset Management Policy Report Highlights Provincial regulation (O.Reg. 588/17 - Asset
An Overview of the City of Newcastle and the Challenges facing the Achievement of Intermediary City Status. Zimbali, Fairmont Hotel - KwaDukuza
 An Overview of the City of Newcastle and the Challenges facing the Achievement of Intermediary City Status United Cities and Local Governments(UCLG) Intermediary Cities Learning Exchange Programme Zimbali,
COMMUNICATION FROM THE COMMISSION TO THE EUROPEAN PARLIAMENT, THE COUNCIL, THE EUROPEAN ECONOMIC AND SOCIAL COMMITTEE AND THE COMMITTEE OF THE REGIONS
 EUROPEAN COMMISSION Brussels, 13.10.2011 COM(2011) 638 final COMMUNICATION FROM THE COMMISSION TO THE EUROPEAN PARLIAMENT, THE COUNCIL, THE EUROPEAN ECONOMIC AND SOCIAL COMMITTEE AND THE COMMITTEE OF THE
Budget 2015 and capital plan. August 2015
 Budget 2015 and capital plan August 2015 Contents The imperative for municipal infrastructure investment... 3 Municipal priorities for 2015 provincial budget... 7 Diverse municipalities need diverse revenues...
CLIMATE FINANCE OPPORTUNITIES FOR ENHANCED LOCAL ACTION
 CLIMATE FINANCE OPPORTUNITIES FOR ENHANCED LOCAL ACTION V-LED AFRICA WORKSHOP: LOCALISING CLIMATE FINANCE AND ACTION 23-25 APRIL 2018, IRENE, SOUTH AFRICA 1 CC expenditure will absorb ~ 70% of domestic
China s 12 th Five Year Plan
 China s 12 th Five Year Plan Hongbin Cai Guanghua School of Management Peking Unviersity 2011/12/21 1 Background of the Plan Theme and objectives of the Plan Specific Initiatives of the Plan Implications
The UNOPS Budget Estimates, Executive Board September 2013
 The UNOPS Budget Estimates, 2014-2015 Executive Board September 2013 1 Key results of 2012 Benchmarks and standards Content UNOPS strategic plan 2014-2017 UNOPS budget estimates 2014-2015 Review of the
Economic and Social Council
 United Nations Economic and Social Council Distr.: Limited 1 December 2015 Original: English For decision United Nations Children s Fund Executive Board First regular session 2016 2-4 February 2016 Item
Executive Board Annual Session Rome, May 2015 POLICY ISSUES ENTERPRISE RISK For approval MANAGEMENT POLICY WFP/EB.A/2015/5-B
 Executive Board Annual Session Rome, 25 28 May 2015 POLICY ISSUES Agenda item 5 For approval ENTERPRISE RISK MANAGEMENT POLICY E Distribution: GENERAL WFP/EB.A/2015/5-B 10 April 2015 ORIGINAL: ENGLISH
STRATEGIC PLAN AND BUDGET 2013 TO 2016 MUNICIPAL DEMARCATION BOARD
 STRATEGIC PLAN AND BUDGET 2013 TO 2016 MUNICIPAL DEMARCATION BOARD BRIEFING TO THE PORTFOLIO COMMITTEE ON COOPERATIVE GOVERNANCE AND TRADITIONAL AFFAIRS 19 MARCH 2013 DELEGATION Mr LJ Mahlangu Chairperson:
AGSA Strategic plan and budget SCoAG engagement 17 November 2017
 AGSA Strategic plan and budget 2018-2021 SCoAG engagement 17 November 2017 Reputation promise The Auditor-General of South Africa has a constitutional mandate and, as the Supreme Audit Institution (SAI)
BUILDING SUSTAINABLE FUNDING PARTNERSHIPS towards an all inclusive housing funding model for South Africa
 BUILDING SUSTAINABLE FUNDING PARTNERSHIPS towards an all inclusive housing funding model for South Africa Presented by Kutoane Kutoane CEO Gauteng Partnership Fund Date: 17 th September 2012 BACKGROUND
In Confidence. Office of the Minister for Regional Economic Development. Chair, Cabinet THE PROVINCIAL GROWTH FUND. Purpose
 In Confidence Office of the Minister for Regional Economic Development Chair, Cabinet THE PROVINCIAL GROWTH FUND Purpose This paper sets the broad parameters for the Provincial Growth Fund. This will enable
1. INTRODUCTION 2. OVERVIEW OF POLICY PRIORITIES FOR 2016/17
 REPORT OF THE PORTFOLIO COMMITTEE ON COOPERATIVE GOVERNANCE AND TRADITIONAL AFFAIRS ON THE ANNUAL PERFORMANCE PLAN AND BUDGET VOTE 4 OF THE DEPARTMENT OF COOPERATIVE GOVERNANCE AND TRADITIONAL AFFAIRS
Policy Implementation for Enhancing Community. Resilience in Malawi
 Volume 10 Issue 1 May 2014 Status of Policy Implementation for Enhancing Community Resilience in Malawi Policy Brief ECRP and DISCOVER Disclaimer This policy brief has been financed by United Kingdom (UK)
OECD GUIDELINES ON INSURER GOVERNANCE
 OECD GUIDELINES ON INSURER GOVERNANCE Edition 2017 OECD Guidelines on Insurer Governance 2017 Edition FOREWORD Foreword As financial institutions whose business is the acceptance and management of risk,
Presentation of the TCTA Strategy for 2012 to 2013
 Presentation of the TCTA Strategy for 2012 to 2013 Date: 8 May 2012 Time: 09:30 11 Agenda Overview Directives Expanded roles Budgets 2012/13 Financial transform Highlights empower Overview 33 Purpose of
NATIONAL DEVELOPMENT AGENCY PRESENTATION by Anthony Bouwer
 NATIONAL DEVELOPMENT AGENCY PRESENTATION by Anthony Bouwer 04 1 WHO IS NDA? The National Development Agency is an organization, created by Government through an Act of Parliament- Act 108 of 1998. The
Palu, Indonesia. Local progress report on the implementation of the Hyogo Framework for Action ( )
") Palu, Indonesia Local progress report on the implementation of the Hyogo Framework for Action (2013-2014) Name of focal point: Yusniar Nurdin Organization: BNPB Title/Position: Technical Support Consultant
Palu, Indonesia Local progress report on the implementation of the Hyogo Framework for Action (2013-2014) Name of focal point: Yusniar Nurdin Organization: BNPB Title/Position: Technical Support Consultant
MATRIX OF STRATEGIC VISION AND ACTIONS TO SUPPORT SUSTAINABLE CITIES
 Urban mission and overall strategy objectives: To promote sustainable cities and towns that fulfill the promise of development for their inhabitants in particular, by improving the lives of the poor and
PRESENTATION TO THE SELECT COMMITTEE ON PUBLIC SERVICES DPW STRATEGIC PLAN AND BUDGET FOR 2012/13 15 MAY 2012
 PRESENTATION TO THE SELECT COMMITTEE ON PUBLIC SERVICES DPW STRATEGIC PLAN AND BUDGET FOR 2012/13 15 MAY 2012 TABLE OF CONTENTS MINISTER S FOREWORD PART A: STRATEGIC OVERVIEW INTRODUCTION AND STRATEGIC
CLIMATE CHANGE SPENDING IN ETHIOPIA
 CLIMATE CHANGE SPENDING IN ETHIOPIA Recommendations to bridge the funding gap for climate financing in Ethiopia Civil Society and government representatives attending the round table discussion on Ethiopia
Composition of the intergovernmental system Alignment between functional and fiscal assignments
 . Disaster Management Amendment Bill: National Treasury inputs National Assembly: Portfolio Committee on Cooperative Governance and Traditional Affairs (CoGTA) x 20 May 2015 Outline Composition of the
OECD-WWC-Netherlands Roundtable on Financing Water Inaugural meeting April 2017, Paris. Discussion Highlights and Roadmap for Future Work
 OECD-WWC-Netherlands Roundtable on Financing Water Inaugural meeting 12-13 April 2017, Paris Discussion Highlights and Roadmap for Future Work The inaugural meeting of the Roundtable on Financing Water
Reproduced by Sabinet Online in terms of Government Printer s Copyright Authority No dated 02 February 1998 CONTENTS INHOUD GOVERNMENT NOTICE
 2 No. 32167 GOVERNMENT GAZETTE, 29 APRIL 2009 No. CONTENTS INHOUD Page No. Gazette No. GOVERNMENT NOTICE Minerals and Energy, Department of Government Notice 446 Mineral and Petroleum Resources Development
GOVERNANCE FRAMEWORK FOR
 December, 2011 GOVERNANCE FRAMEWORK FOR THE STRATEGIC CLIMATE FUND Adopted November 2008 and amended December 2011 Table of Contents A. Introduction B. Purpose and Objectives C. SCF Programs D. Governance
Building a Better Tomorrow
 Building a Better Tomorrow Investing in Ontario s Infrastructure to Deliver Real, Positive Change A Discussion Paper on Infrastructure Financing and Procurement February 2004 2 BUILDING A BETTER TOMORROW
T H E NA I RO B I C A L L TO A C T I O N F O R C L O S I N G T H E I M P L E M E N TA T I O N G A P I N H E A LT H P RO M O T I O N
 T H E NA I RO B I C A L L TO A C T I O N F O R C L O S I N G T H E I M P L E M E N TA T I O N G A P I N H E A LT H P RO M O T I O N 1. INTRODUCTION PURPOSE The Nairobi Call to Action identifies key strategies
THE REPUBLIC OF MALA WI
 THE REPUBLIC OF MALA WI STATEMENT BY HONOURABLE CECILIA E. CHAZAMA, MINISTER OF CIVIC EDUCATION, CULTURE AND COMMUNITY DEVELOPMENT ON PROGRESS ON IMPLEMENTATION OF SUSTAINABLE DEVELOPMENT GOALS IN MALAWI
Strategic Plan The Department of Finance
 Strategic Plan 2014-2017 The Department of Finance Department of Finance 2009-10 Annual Report 1 Department of Finance P.O. Box 8700, Confederation Building St. John s, NL A1B 4J6 Telephone: 709.729.2950
REGIONAL EVALUATION FRAMEWORK 1.0 INTRODUCTION 2.0 PURPOSE 3.0 DEFINITIONS. Edmonton Metropolitan Region Planning Toolkit
 Edmonton Metropolitan Region Planning Toolkit Re-imagine. Plan. Build. Edmonton Metropolitan Region Growth Plan 1.0 INTRODUCTION On October 26, 2017, the Government of Alberta approved the Edmonton Metropolitan
DOCUMENT OF THE EUROPEAN BANK FOR RECONSTRUCTION AND DEVELOPMENT STRATEGY FOR ALBANIA
 DOCUMENT OF THE EUROPEAN BANK FOR RECONSTRUCTION AND DEVELOPMENT STRATEGY FOR ALBANIA REPORT ON THE INVITATION TO THE PUBLIC TO COMMENT 1. Overview of the public consultation process The objective of this
PRESENTATION TO PORTFOLIO COMMITTEE ON HUMAN SETTLEMENTS OCTOBER 2017 INTEGRATED ANNUAL REPORT 2017
 PRESENTATION TO PORTFOLIO COMMITTEE ON HUMAN SETTLEMENTS OCTOBER 2017 INTEGRATED ANNUAL REPORT 2017 2 0 CONTENTS NHFC Overview Business Model Corporate Governance & Risk Management Business Performance
GOVERNANCE FRAMEWORK FOR THE CLEAN TECHNOLOGY FUND
 June 2014 GOVERNANCE FRAMEWORK FOR THE CLEAN TECHNOLOGY FUND Adopted November 2008 and amended June 2014 Table of Contents A. Introduction B. Purpose and Objectives C. Types of Investment D. Financing
EAST AFRICAN COMMUNITY. CHALLENGES AND OPPORTUNITIES OF CLIMATE CHANGE: Post COP19 Perspective of East African Civil Society Organizations
 EAST AFRICAN COMMUNITY CHALLENGES AND OPPORTUNITIES OF CLIMATE CHANGE: Post COP19 Perspective of East African Civil Society Organizations EAC Climate Change Policy Framework 5 th December 2013 Arusha,
AU SMALL FINANCE BANK LIMITED CSR POLICY APRIL, 2017
 AU SMALL FINANCE BANK LIMITED CSR POLICY APRIL, 2017 Contents 1. Introduction... 2 2. Objectives of the Policy... 3 3. Applicability... 4 5. CSR Principles followed by the Bank... 6 6. Implementation of
Community-Based SME For Road Maintenance
 Community-Based SME For Road Maintenance Insights from the W.B and IADB-Peruvian Rural Roads maintenance contracts Project & Poverty Reduction Presented by Jacob Greenstein (EGAT) Scope of Presentation
REPORT OF THE PORTFOLIO COMMITTEE ON ARTS AND CULTURE ON BUDGET VOTE 37: DEPARTMENT OF ARTS AND CULTURE, DATED 14 MAY 2015
 REPORT OF THE PORTFOLIO COMMITTEE ON ARTS AND CULTURE ON BUDGET VOTE 37: DEPARTMENT OF ARTS AND CULTURE, DATED 14 MAY 2015 The Portfolio Committee on Arts and Culture, having considered the 2015/16 budget
Democratic Socialist Republic of Sri Lanka. Smallholder Agribusiness Partnerships (SAP) Programme. Negotiated financing agreement
 Programme. Negotiated financing agreement") Document: EB 2017/120/R.13/Sup.1 Agenda: 9(b)(iii) Date: 8 April 2017 Distribution: Public Original: English E Democratic Socialist Republic of Sri Lanka Smallholder Agribusiness Partnerships (SAP) Programme
Document: EB 2017/120/R.13/Sup.1 Agenda: 9(b)(iii) Date: 8 April 2017 Distribution: Public Original: English E Democratic Socialist Republic of Sri Lanka Smallholder Agribusiness Partnerships (SAP) Programme
People s Republic of China: Study on Natural Resource Asset Appraisal and Management System for the National Key Ecological Function Zones
 Technical Assistance Report Project Number: 50004-001 Policy and Advisory Technical Assistance (PATA) October 2016 People s Republic of China: Study on Natural Resource Asset Appraisal and Management System
GROWTH OF SA S ROAD INFRASTRUCTURE: WHAT TO EXPECT
 GROWTH OF SA S ROAD INFRASTRUCTURE: WHAT TO EXPECT SOUTH AFRICAN FORUM OF CIVIL ENGINEERING CONTRACTORS LR 2/6/3/138 SKHUMBUZO MACOZOMA CHIEF EXECUTIVE OFFICER SANRAL IN ORDER TO DEFINE A FUTURE IT MUST
United Nations Fund for Recovery Reconstruction and Development in Darfur (UNDF)
") United Nations Fund for Recovery Reconstruction and Development in Darfur (UNDF) Terms of Reference 29 March 2013 1 Contents I. Introduction... 3 II. Purpose, Scope and Principles of the UNDF... 4 III.
United Nations Fund for Recovery Reconstruction and Development in Darfur (UNDF) Terms of Reference 29 March 2013 1 Contents I. Introduction... 3 II. Purpose, Scope and Principles of the UNDF... 4 III.
Prof C C Mjojo (Project Leader) Fundani Computer Systems (PTY) LTD Process Innovation Technology Consulting
 Fundani Computer Systems (PTY) LTD Process Innovation Technology Consulting") Prof C C Mjojo (Project Leader) Fundani Computer Systems (PTY) LTD mjojo@fundani.com Hierarchy of Indicators in PSOs Policy Goals Strategic Objectives Programs Actions A policy initiative might derive
Prof C C Mjojo (Project Leader) Fundani Computer Systems (PTY) LTD mjojo@fundani.com Hierarchy of Indicators in PSOs Policy Goals Strategic Objectives Programs Actions A policy initiative might derive
NOT PROTECTIVELY MARKED. Public SPA Board Meeting Date Tuesday 19 December 2017 City Suite, Apex City Quay, Dundee
 Meeting Public SPA Board Meeting Date Tuesday Location City Suite, Apex City Quay, Dundee Title of Paper British Transport Police (BTP) Integration Update Item Number 7.2 Presented By Tom McMahon Recommendation
First Nations. Background. Transforming the Fiscal Relationship. Strengthening First Nations economies
 First Nations Background While economic crisis and austerity measures have become the focus of Canadian politics over the last few years, First Nations have experienced a prolonged state of crisis since
Programmatic approach to funding proposals
 Meeting of the Board 28 30 June 2016 Songdo, Incheon, Republic of Korea Provisional agenda Item 12(g) GCF/B.13/18 20 June 2016 Programmatic approach to funding proposals Summary This document builds on
GCF Readiness Programme Fiji
 GCF Readiness Programme Fiji In Fiji, The Programme will target two important aspects of the GCF approach, access to funds and private sector engagement. In this context the Programme focuses on a range
Report of the Portfolio Committee on Rural Development and Land Reform on Budget Vote 39: Rural Development and Land Reform, dated 20 April 2016
 Report of the Portfolio Committee on Rural Development and Land Reform on Budget Vote 39: Rural Development and Land Reform, dated 20 April 2016 The Portfolio Committee on Rural Development and Land Reform,
Summary of Submitted 2015 Budget From Rates
 London & Middlesex Housing Corporation Summary of Submitted 2015 Budget From Rates Service Expense 2014 2015 Revised Budget Draft Budget Non Tax Revenue Net Tax Supported Expense Non Tax Revenue Increase
Introduction to EDD Annual Performance Plan
 2014/15 Introduction to EDD Annual Performance Plan June 2014 1 The EDD mandate EDD established in 2009 Core mandates: Identify priorities for job creation, inclusive growth and industrialisation Support
Portfolio Committee on Public Service and Administration as well as Planning Monitoring and Evaluation
 Portfolio Committee on Public Service and Administration as well as Planning Monitoring and Evaluation REPORT ON BUDGET VOTE 8: DEPARTMENT OF PLANNING, MONITORING AND EVALUATION 1. BACKGROUND The Portfolio
Introduction. The Assessment consists of: A checklist of best, good and leading practices A rating system to rank your company s current practices.
 ESG / CSR / Sustainability Governance and Management Assessment By Coro Strandberg President, Strandberg Consulting www.corostrandberg.com September 2017 Introduction This ESG / CSR / Sustainability Governance
The DAC s main findings and recommendations. Extract from: OECD Development Co-operation Peer Reviews
 The DAC s main findings and recommendations Extract from: OECD Development Co-operation Peer Reviews Luxembourg 2017 Luxembourg has strengthened its development co-operation programme The committee concluded
IMESA. Johan van den Berg (Strategic and Integrated Planning) Dr Danie Wium (Industry Leader, Government) Aurecon
 Dr Danie Wium (Industry Leader, Government) Aurecon") Johan van den Berg (Strategic and Integrated Planning) Dr Danie Wium (Industry Leader, Government) Aurecon ABSTRACT The Consolidated Infrastructure Plan (CIP) is an initiative of the City growth needs.
Johan van den Berg (Strategic and Integrated Planning) Dr Danie Wium (Industry Leader, Government) Aurecon ABSTRACT The Consolidated Infrastructure Plan (CIP) is an initiative of the City growth needs.
PRISM Supervisory Commentary 2018
 PRISM Supervisory Commentary 2018 March 2018 Page 2 PRISM Supervisory Commentary 2018 Central Bank of Ireland Table of Contents 1. Foreword... 3 2. Executive Summary... 4 3. Background... 8 4. Overview
Clarion Housing Group Value for Money Statement 2017
 Clarion Housing Group Value for Money Statement 2017 Value for Money Highlights Value for Money Highlights Clarion Housing Group is a business for social purpose. First and foremost we are a social landlord
The Bhutan COUNTRY BRIEF
 The Bhutan COUNTRY BRIEF The Country Briefs were prepared by governments ahead of the SWA 2019 Sector Ministers Meeting. They are a snap-shot of the country s current state in terms of water, sanitation
Water Regulation and Pricing RSA EXPERIENCE
 Water Regulation and Pricing RSA EXPERIENCE Presenter: Avril Halstead Chief Director, National Treasury 26 June 2014 Outline Water Sector Value Chain Financial framework Framework for economic regulation
Report of the Portfolio Committee on Rural Development and Land Reform on Budget Vote 39: Rural Development and Land Reform, dated 20 April 2016
 Report of the Portfolio Committee on Rural Development and Land Reform on Budget Vote 39: Rural Development and Land Reform, dated 20 April 2016 The Portfolio Committee on Rural Development and Land Reform,
An Inclusive and Data-Rich Approach to Infrastructure Development
 Network-Level Analysis An Inclusive and Data-Rich Approach to Infrastructure Development By Israr Ahmad and John Murray The state of a community s capital infrastructure is inextricably linked with its
Solidar EU Training Academy. Valentina Caimi Policy and Advocacy Adviser. European Semester Social Investment Social innovation
 Solidar EU Training Academy Valentina Caimi Policy and Advocacy Adviser European Semester Social Investment Social innovation Who we are The largest platform of European rights and value-based NGOs working
The UN Global Compact-Accenture CEO Study on Sustainability Global Insights with Special Focus: ASG (Austria, Switzerland and Germany)
") The UN Global Compact-Accenture CEO Study on Sustainability 2013 Global Insights with Special Focus: ASG (Austria, Switzerland and Germany) September 2013 Background and context: study participants The
The UN Global Compact-Accenture CEO Study on Sustainability 2013 Global Insights with Special Focus: ASG (Austria, Switzerland and Germany) September 2013 Background and context: study participants The
Establishment of a Self- Sustaining Environmental Investment Service in the East Asian Seas Region
 Project Proposal: Establishment of a Self- Sustaining Environmental Investment Service in the East Asian Seas Region by the GEF/UNDP/IMO Regional Programme on Partnerships in Environmental management for
FINAL EVALUATION VIE/033. Climate Adapted Local Development and Innovation Project
 FINAL EVALUATION VIE/033 Climate Adapted Local Development and Innovation Project PROJECT SUMMARY DATA Country Long project title Short project title LuxDev Code Vietnam Climate Adapted Local Development
MINISTRY OF FINANCE AND ECONOMIC AFFAIRS
 MINISTRY OF FINANCE AND ECONOMIC AFFAIRS Contents 1. PREAMBLE 4 2. THE POLICY OBJECTIVES 5 3. DEFINITION OF PPP 5 4. BENEFITS OF PPP 6 5. KEY GUIDING PRINCIPLES 7 6. SCOPE AND APPLICATION OF PPP PROJECTS
Rakesh Mohan: Ownership and governance in private sector banks in India
 Rakesh Mohan: Ownership and governance in private sector banks in India Address by Dr Rakesh Mohan, Deputy Governor of the Reserve Bank of India, at the Conference on Ownership and Governance in Private
EPWP INCENTIVE GRANT MANUAL
 EPWP Incentive Grant Manual 2009/10 EPWP INCENTIVE GRANT MANUAL FROM THE NATIONAL DEPARTMENT OF PUBLIC WORKS FOR THE IMPLEMENTATION OF THE EPWP INCENTIVE GRANT BY IMPLEMENTING PUBLIC BODIES Version 1 May
Special Meeting of Council. 1.1 Strategic Decision Making; Council Priorities, Core Service Review and 2013 Service-Based Budget Process
 City of Saint John Common Council Meeting Wednesday, July 18, 2012 Special Meeting of Council 1. Call to Order Prayer 9:30 a.m. Council Chamber 1.1 Strategic Decision Making; Council Priorities, Core Service
ACP-EU JOINT PARLIAMENTARY ASSEMBLY
 ACP-EU JOINT PARLIAMENTARY ASSEMBLY RESOLUTION 1 ACP-EU 100.300/08/fin on aid effectiveness and defining official development assistance The ACP-EU Joint Parliamentary Assembly, meeting in Port Moresby
Organisation strategy for Sweden s cooperation with the Green Climate Fund for
 Organisation strategy for Sweden s cooperation with the Green Climate Fund for 2016 2018 Appendix to Government Decision 22 June 2016 (UD2016/11355/GA) Organisation strategy for Sweden s cooperation with
QUEENSLAND GOVERNMENT RELEASES STATE INFRASTRUCTURE PLAN
 QUEENSLAND GOVERNMENT RELEASES STATE INFRASTRUCTURE PLAN After a three-year hiatus, the 2016 State Infrastructure Plan (SIP) is welcomed by the Infrastructure Association of Queensland (IAQ) as an enabler
Northwest Territories Housing Corporation
 Northwest Territories Housing Corporation Public Housing and Homeownership Programs February 2008 Office of the Auditor General of Canada Bureau du vérificateur général du Canada All of the audit work
Media Press Release. Topic: Special Economic Zones and Building Manufacturing in KZN
 1 ac Media Press Release Date: 7 th November 2014 Topic: Special Economic Zones and Building Manufacturing in KZN Venue: Dube TradePort, Latitude Conference Centre, 29º South, 7 Umsinsi Junction, La Mercy,
COUNCIL OF THE EUROPEAN UNION. Brussels, 15 May /07 DEVGEN 89 ACP 94 RELEX 347
 COUNCIL OF THE EUROPEAN UNION Brussels, 15 May 2007 9558/07 DEVGEN 89 ACP 94 RELEX 347 NOTE from : General Secretariat on : 15 May 2007 No. prev. doc. : 9090/07 Subject : EU Code of Conduct on Complementarity
Canada s New Infrastructure Plan Phase 2 Programming/Funding SUBMISSION TO INFRASTRUCTURE CANADA FROM THE UNION OF BC MUNICIPALITIES
 Canada s New Infrastructure Plan Phase 2 Programming/Funding SUBMISSION TO INFRASTRUCTURE CANADA FROM THE UNION OF BC MUNICIPALITIES September, 2016 INTRODUCTION The Union of British Columbia Municipalities
with the National Rural Support Programme (NRSP) for the Islamic Republic of Pakistan 13 November 2015 NDA Strengthening & Country Programming
 for the Islamic Republic of Pakistan 13 November 2015 NDA Strengthening & Country Programming") with the National Rural Support Programme (NRSP) for the Islamic Republic of Pakistan 13 November 2015 NDA Strengthening & Country Programming READINESS AND PREPARATORY SUPPORT PROPOSAL PAGE 1 OF 10 Country
with the National Rural Support Programme (NRSP) for the Islamic Republic of Pakistan 13 November 2015 NDA Strengthening & Country Programming READINESS AND PREPARATORY SUPPORT PROPOSAL PAGE 1 OF 10 Country
Zeti Akhtar Aziz: Strategic positioning in a changing environment
 Zeti Akhtar Aziz: Strategic positioning in a changing environment Keynote address by Dr Zeti Akhtar Aziz, Governor of the Central Bank of Malaysia, at the 2006 Dialogue Session with Insurers and Takaful
Stakeholder perspective. Financial perspective
 ORGANISATIONAL PERFORMANCE ORGANISATIONAL PERFORMANCE Performance against predeined objectives The Rural Housing Loan Fund uses the balanced scorecard method as its strategic planning tool. We provide
Treasury Board of Canada Secretariat. Performance Report. For the period ending March 31, 2005
 Treasury Board of Canada Secretariat Performance Report For the period ending March 31, 2005 Reg Alcock President of the Treasury Board and Minister responsible for the Canadian Wheat Board Departmental
Township of Perry Strategic Asset Management Policy
 Township of Perry Strategic Asset Management Policy Purpose: The strategic asset management policy is to establish consistent standards and guidelines for management of the Township s assets. The policy
GOVERNANCE FRAMEWORK FOR THE CLEAN TECHNOLOGY FUND. November, 2008
 GOVERNANCE FRAMEWORK FOR THE CLEAN TECHNOLOGY FUND November, 2008 Table of Contents A. Introduction B. Purpose and Objectives C. Types of Investment D. Financing under the CTF E. Country Access to the
MUNICIPAL FISCAL POWERS AND FUNCTIONS BILL
 REPUBLIC OF SOUTH AFRICA MUNICIPAL FISCAL POWERS AND FUNCTIONS BILL (As amended by the Portfolio Committee on Finance (National Assembly)) (The English text is the offıcial text of the Bill) (MINISTER
ASSURANCE & ADVISORY RENEWABLE ENERGY ACCOUNTING & TAX COMPANY PROFILE
 ASSURANCE & ADVISORY RENEWABLE ENERGY ACCOUNTING & TAX COMPANY PROFILE WhoInvestment Holdings (Pty) Ltd NIH is a 100% black owned Consulting and Investment Company. The company consists of three business
EU FUNDING PROGRAMMES IN THE FIELD OF DEVELOPMENT AID
 EU FUNDING PROGRAMMES IN THE FIELD OF DEVELOPMENT AID EU FORDERUNG FUR MIGRANTEN ORGANISATIONEN UND TRAGER DER PARTICIPATIONS UND INTEGRATIONS ARBEIT IN BERLIN MOVE GLOBAL 25 October 2014, Berlin About