Community Vulnerability Assessment Report
|
|
|
- Scott Bond
- 6 years ago
- Views:
Transcription
1 Community Vulnerability Assessment Report Final Draft Submitted by: Mr. Kushtrim Shaipi, IQ Consulting June 12, 2013 This is the final deliverable of the CVA research commissioned by UNDP Kosovo in 2013 with contract number: RFP The report has been prepared by the Consortium as per the Terms of Reference for this project. The views and opinions expressed in this report are those of the author and do not necessarily reflects those of UNDP or other UN agencies. The report is also attached the statistical report for all variables cross-tabulated by ethnicity. Page 1 of 86
2 TABLE OF CONTENTS TABLE OF CONTENTS... 2 TABLE OF FIGURES... 3 ACKNOWLEDGEMENTS... 4 ABBREVIATIONS EXECUTIVE SUMMARY BACKGROUND Project Objectives Methodology and Sampling Sampling Pilot Survey Field Work Data Input and Processing Data Analysis FINDINGS General Demographic Overview and Access to Basic Services Health Security Economic Security Personal and Community Level Security Environment Security CONCLUSIONS AND RECOMMENDATIONS BIBLIOGRAPHY ANNEX 1: CVA Questionnaire ANNEX 2: Terms of Reference for the Assignment... 3 ANNEX 3: Interviewer s Manual Page 2 of 86
3 TABLE OF FIGURES Figure 1. Population Characteristics: Source ECMI Figure 2. Ethnic composition of respondents by municipality Figure 3. Employment Status by Ethnicity Figure 4. Employment Status by Municipality Figure 5. Reading by gender Figure 6. Completed education by ethnicity for household members above 18 years of age Figure 7. Reasons for not attending kindergarten, schooling or further training by ethnicity and for household members below the age of Figure 8. Type of housing as it appears from outside (%) Figure 9. Approximate distance of the household from family medicine center, hospital and pharmacy Figure 10. Approximate distance of the household from the primary school Figure 11. What is the primary language spoken in your household Figure 12. What is the second language spoken in your household 18 Figure 13. Does the Family have a doctor they can visit in cases of need? Figure 15. Will you be offered health services in case of need? Figure 16. Difficulties in purchasing the pharmaceuticals Figure 17. Most common health problems reported by the head of the household Figure 18. Reasons behind not visiting the doctor (when having health issues) Figure 19. Overall health of family members for the whole sample Figure 20. Reported health status for the family members by ethnicity Figure 21. Figure - Presence of chronic disease by municipality Figure 22. Percentage of chronic illnesses present among all households Figure 23. Reasons for not vaccinating on regular basis the children under 14 for all by ethnicity Figure 24. Average monthly of incomes of the households from all sources as reported by the head of households 26 Figure 25. Average income from various sources received within April 2013, by ethnicity Figure 26. Change in the income levels as compared to same month of previous year Figure 27. Financial situation by ethnicity Figure 28. Difficulties in buying food by ethnicity Figure 29. Difficulties in paying for food by municipality Figure 30. Difficulties in paying Energy by ethnicity Figure 31. Distributions of household expenditures by ethnicity in the previous month Figure 32. Average expenditures of the households during last month by category of spending Figure 33. Average spending for education within one year by ethnicity Figure 34. Level of concern that someone might drive the household out of the shelter Figure 35. Average of index for home appliances compared by ethnicity Figure 36. Figure - Basic living conditions within houses Figure 37. Index of level of security averages based on ethnicity Figure 38. First ranked security issue ranked by ethnicity Figure 39. Index score on stereotypes toward RAE community 9 items Figure 40. Average score on index of favorable treatment Figure 41. Source of Drinking water in the family Figure 42. Quality and quantity of the water Figure 43. Evaluation of air quality by ethnicity Figure 44. Evaluation of soil quality by ethnicity Figure 45. Evaluation of presence of toxic substances Figure 46. Difficulties in covering education expenses by ethnicity Page 3 of 86
4 ACKNOWLEDGEMENTS The Consortium would like to express its gratitude for the support received by the project staffs, both in guidance when preparing the research instruments and the support offered in the field, without which this project would have been very difficult to implement. The Project Team would also like to acknowledge the contribution of all UN agencies in Kosovo which have provided their valuable input in the improvement of the research instruments and the finalization of deliverables. The Consortium would also like to thank the Kosovo RAE Women s activists for assistance in the coordination of field work, as their contribution has been crucial in completing the field work for this project. The Project Team would also like to acknowledge the readiness of Municipal Officials and UN Municipal Coordinators for their readiness to assist in project activities. Page 4 of 86
5 CONTRIBUTORS TO THE REPORT Mr. Kushtrim SHAIPI, Team Leader and Co Author of CVA Report Ms. Laura Berisha, Co-Author of CVA Report Mr. Aliriza Arenliu, Statistical Analyst Page 5 of 86
6 ABBREVIATIONS CSW Center for Social Work DI - Democratization Index ECI - Economic Confidence Index EULEX - EU Rule of Law Mission in Kosovo FHC Family Health Center ICO - International Civilian Office KFOR - NATO - Kosovo Forces KP - Kosovo Police KPT - Kosovo Pension Savings Trust KSF - Kosovo Security Force OSCE - Organization for Security and Cooperation in Kosovo PAK - Privatization Agency of Kosovo PI - Participation Index RAE - Roma, Ashkali, Egyptian UNDP - United Nations Development Program UNKT UN Kosovo Team UNICEF United Nations Organization for Children Page 6 of 86
7 1. EXECUTIVE SUMMARY This report summarizes the key findings of the UNDP 2013 Community Vulnerability Assessment carried out in the period April-May While some data have been obtained at individual members level, most of the data presented in this report refer to household as the main analysis unit. The degree of vulnerability is determined by the unit's exposure to risk and its ability to cope with or withstand stressful situations 1. More specifically, the factors that determine a condition of vulnerability can be grouped into two types: External factors: transitory, seasonal or chronic shocks and changes. These factors essentially constitute factors of risk. 2 Internal factors: factors tied to the characteristics of the household or individual, their general living conditions and the internal dynamics of the household that limit its ability to avoid becoming "food insecure" and influence its ability to be resilient against the above external factors. Such factors described here can be classified as the household's characteristics. In short, the ability to capitalize upon their assets (internal factors) (human, social, natural, physical and financial capital) for survival purposes, and the influence that these assets face from external factors, such as structural (policies, legislation, cultural norms, market conditions) or transitory "shocks" (seasonal changes, shocks), provide for an in-depth understanding of vulnerability of the communities in Obiliq/Obilic and Fushe Kosove/Kosovo Polje. The communities surveyed during the CVA assessment display different types and intensities of vulnerabilities and risks they face. Often both the prevalence and intensity of vulnerability and risk are associated with ethnicity, which appears to be clearly the most influential demographic variable in the CVA 2013 survey. The differences in results obtained from male and female respondents (main interviewees in the household) are in most cases statistically insignificant. This however does not mean that women are not more vulnerable than men in the society. As evidenced across all parameters and indicators of vulnerability collected for each individual member of the households, women scored lower than men, although in most parameters the difference is little. Health Security. This dimension was thoroughly analyzed for the purpose of the CVA and the results obtained concerning this aspect show several risks that are associated to the current situation in the households interviewed. While the distance to health facilities is relatively short and physical access to service providers is assessed to be easy, the ability to treat diseases (due to high cost of treatment particularly for chronic illness) is significantly lower. One of the most concerning aspects pertains to vaccination, whereby 14.2% report only partial vaccination of household members aged fourteen or younger, and an additional 2.7% which report that their family members under the age of fourteen have not received any immunization. The most concerning reason provided for non-vaccination is the inability to get vaccination free of charge, despite the legal provisions foreseeing free immunization for all. Prevalence of chronic illnesses among family members is also not considered to be a major risk for with the households interviewed. Among the most frequent types of chronic illness and conditions, households report high blood pressure and other cardiovascular diseases as the most often encountered ones. Economic Security This dimension in the Human Security Multi-Sectorality and Externalities Framework appears to be the biggest vulnerability that the communities surveyed are faced with. The communities included in the CVA face 1 Food and Agriculture Organization. Vulnerability and Risk Assessment Methodologies Available at: ftp://ftp.fao.org/osd/cpf/tools/b2-vulnertability%20and%20risk%20analysis/vulnerability%20assessment%20methodologies.doc 2 Ibid. Page 7 of 86
8 immediate risks to their wellbeing that have high probability of occurrence. Given the high percentage that cost of utilities accounts for in the household budgets, any electricity price increases, would seriously impact the households reporting lowest income levels in the survey. High unemployment, dependency on social assistance schemes, and high cost of basic food supplies and utilities makes the majority of households in the communities surveyed dependable on instable/extra ordinary income coming mainly from remittances or some other form of cash transfers. The vast majority of households interviewed report to spend the biggest part of their household budgets on food, basic supplies and utility payments. Regarding overall income levels reported at the household level, Ashkali community appears to be the most vulnerable with an average income of only EUR/month, while at the same time, the Albanian households report to be the least vulnerable with an average income of EUR/month. When this income is analyzed in terms of the source and type of income received by households, the Ashkali community again surfaces as the most vulnerable one, with an average of only EUR/month coming from employment, and the least vulnerable households are those within the Albanian community with an average of EUR/month from this source of income. The low percentage of households having savings accounts, particularly among Roma community (11.6%) is another indicator of high economic/financial vulnerability of the communities in the two municipalities as it reveals the inability of households to withstand potential external shocks. Food security appears to be a serious risk identified by the CVA 2013 survey particularly among the Roma households whereby on average they report to spend 90% of their total household budgets on food. Given the inflation trends, as well as continuous increase of prices due to global markets fluctuations (i.e. oil prices), this risk posses an immediate threat to the communities and is directly linked to the survival of the households. The high percentage of persons reporting difficulties to currently supply food and basic supplies for their families is an indicator of the alarming situation in the field. Personal Security Physical security and safety of communities is considered not to be an issue of concern for the respondents included in the CVA. The sense of security and protection is displayed by all communities. Community Security. The highest challenge to the security of communities across all ethnicities is group/community security. Security and protection is a responsibility of the local level government and the KP and should be addressed through these structures. Political Security is ensured by the highest legal document in Kosovo-its constitution. This document has been often considered as one of the most progressive documents of its kind, ensuring high degree of representation and participation of ethnic communities and providing for warranties to the right of representation. Environmental Security for the communities in Fushe Kosove/Kosovo Polje and Obiliq/Obilic municipalities is concerning. As it is mainly affected by large (national) processes, for addressing of which some steps have already been taken, the environmental risk factors are expected to decrease both in intensity and prevalence. The worst environment indicator assessed by respondents was the presence of toxic substances. Page 8 of 86
9 2. BACKGROUND The research subject to this report has been undertaken as part of the UN Agencies implemented project Building a Better Future for Citizens of Fushë Kosovë/Kosovo Polje and Obiliq/ Obilić, the main aim of which is to empower and fully mobilize all communities in these two municipalities by providing support to the most vulnerable among the Roma, Ashkali, Egyptians, Albanian and Serb communities, as well as IDPs and other groups who experience multiple dimensions of human insecurity and are at risk of social exclusion. The objective of the planned interventions is to decrease the vulnerability and human security risks that these communities face. By using the Human Security Multi-Sectorality and Externalities Framework as a strategic tool that supports relevance and coherence among interventions, the project contributes to improving the living conditions of concerned communities, promotes a tolerant and multi-ethnic climate, self-reliance, participation, protection, as well as access to education, health, and sustainable livelihoods. The research subject to this report has been carried out by using this analysis framework. The research maps the insecurities based on actual vulnerabilities and capacities, establishes priorities through vulnerability and capacity analysis, and identifies the root-causes of insecurities and their inter-linkages. As the project emphasizes the social and environmental challenges (both of which feed into the health assessments) in the communities, the data provided herein is useful for assessing the linkages between social determinants and environmental inequality Project Objectives The Community Vulnerability Assessment (CVA) is meant to serve as a tool to support multi-stakeholder planning of the strategies and responses needed to address multidimensional challenges related to inequality, poverty, and social exclusion in the two target municipalities. Social exclusion in this context is understood as a result of multiple and mutually reinforcing deprivations in the main Human Security dimensions: Economic, Food, Health, Environmental, Personal, Community and Political. The Community Vulnerability Assessment follows the Human Security Analytical Framework to Needs/Vulnerabilities and Capacity Analysis. According to the Human Security Analytical Framework to Needs/Vulnerabilities and Capacity Analysis, the goals of the analysis, mapping and planning phase are to: (i) Collectively identify the needs/vulnerabilities and the capacities of the affected communities and develop project priorities in consultation with the affected communities; (ii) Identify the root causes of insecurities and their inter-linkages across sectors, and establish comprehensive responses that generate positive externalities for the affected communities. (iii) Ensure coherence on the goals and the allocation of responsibilities among the various actors; and (IV) include short, medium, and long-term strategies. 3 In line with these goals, the CVA has been designed to provide reliable quantitative and qualitative baseline data on key indicators related to social and environmental vulnerability and exclusion in the selected municipalities. The CVA provides data that could be matched with contextual information and validated by qualitative information that were gathered from the Municipality institutions. The CVA data allows for an estimation of the risk of social exclusion (based on the Human Security individual vulnerability criteria), and an understanding of the contextual drivers of poverty and exclusion. Based on the CVA data, inter-linkages and dynamics among the various threats, vulnerabilities and capacities could be identified Methodology and Sampling The research methodology applied included both secondary and primary data collection. The secondary data research was carried out through the review of all relevant and publicly available sources. In addition, during the 3 Ibid 4 As per the Terms of Reference for the project Page 9 of 86
10 preliminary research phase, the research team also met with the local authorities and discussed with them both the contents of the survey as well as the sample distribution of respondents. It should be noted that qualitative component of the research was only used during the interpretation of results and in support of the findings provided by the survey Sampling In line with the terms of reference for this survey, the consortium carried out face-to-face interviews with over 2,000 households in the municipalities of Obiliq/Obilic and Fushe Kosove/Kosovo Polje with over 9,000 entries for individual household members. The sample within each municipality was also segregated into drilling points, which were settlements. The basis for the sampling for this research has been the population statistics for the two municipalities. Number of Community Members in Fushe Kosove Year Albanian Serbian Roma Ashkali Egyptian Bosniac Turk Other ,439 1, , Number of Community Members in Obilic Year Albanian Serbian Roma Ashkali Egyptian Bosniac Turk Other ,125 3, Figure 1. Population Characteristics: Source ECMI 5 In terms of ethnicity, it should be noted that because of the large sub-sample of non-majority communities, all RAE and Serbian households that were willing to participate in the survey have been included in the research. The interviews were carried out in accordance with interview protocol 6 developed for the purpose of ensuring uniformity across the survey, and which contained detailed information about the interview procedures and selection of respondents. Once in assigned settlements, interviewers selected randomly the households in which the survey was carried out by using every third house starting on the right from the Starting Point 7 in the settlement Pilot Survey Once the questionnaire was optimized through coordinated feedback collection from all UN Agencies, the project team tested it in the field through a trial/mock survey with 20 respondents. This process served the purpose of checking the questionnaire for adequacy and understandability on the part of respondents Field Work During the course of the research, the consortium applied its standard rigorous management procedures that it applies in all of its researches, while at the same time accommodating the specific aspects of this research exercise within this framework. Before the field work began, the field work team (both surveyors and field controllers) were trained about both the contents of the questionnaire and the specifics of the research sample, as well as, the overall logic of the research. The training included both the theoretical/content related section and the practical exercise (surveyors practiced the interview with one-another). The survey process was administered under close supervision of the Project Manager and the Quality Control Manager, under the field monitoring from the Field Controllers. Over 10% of all interviews carried out were monitored by controllers. IQ Consulting engaged a total of 26 field staffs for administering the CVA survey. Surveyors in the field had a specific interview sample broken down by territory/geography, and other stratification criteria indicated above. These individual interview schedules were the grounds for monitoring their performance by the field controllers. The second aspect of monitoring was also carried out by field controllers whereby they screened each questionnaire for quality and whether they have been completed successfully. Each week, the field controllers submitted completed questionnaires to the office and admin staffs who were in charge of data input of in the electronic database. 5 ECMI. The Ethno-political Map of Kosovo. 6 See Annex for copy of Interview Protocol 7 The starting point was defined as the most important building in the settlement (i.e. hospital, school, municipal building, masque, etc.. Page 10 of 86
11 Data Input and Processing The database in SPSS format used for data input and processing was identical to the questionnaire used in the field. The database has variable names and value labels in English and was also accompanied by a code-book for tabulation of results. In order to ensure that the quality of data input is maintained at highest levels, the database will be designed as such that it encompasses several quality assurance mechanisms: Data was entered in six different computers, and was merged into one after all questionnaires had been entered. Database processing was done once all data were input in the database. The core group staffs processed/cleaned the database for errors and ran basic screening of responses obtained in the field. The system developed for this quality check is that of assigning unique numbers to each questionnaire, hence making every answer traceable, if needed so. Database processing/cleaning focused on two dimensions, namely, identifying data input errors, as well as logical errors in the questionnaires. Each problematic/improbable response will be eliminated from the final research results and report, hence, providing for an overview of valid research data Data Analysis The analysis of the data was done by the consortium staffs both in terms of reliability and in terms of possible technical errors. The populated and cleaned database was analyzed carefully by experienced experts proposed for this exercise. The analysis aside from the general overview of results was also done through cross-tabulation of variables to provide a more in-depth overview of results and give meaning to the data collected. In order to generate detailed analysis of results both at household level and individual members within households, the SPSS database was transposed to allow for such analysis. The transposed database was used to generate the results presented in this report. Page 11 of 86
12 3. FINDINGS This section of the report represents the findings obtained only from the household heads and the individual members segregated into dimensions of the Human Security Multi-Sectorality and Externalities Framework. As such it represents their perceptions and opinions of the household characteristics. The aggregated data from this section of the interviews have been analyzed and tested for statistical relevance. The risks levels are assessed based on their perceptions expressed during the face to face interviews as well as, the observations in the field General Demographic Overview and Access to Basic Services A total of 2,010 successful interviews were conducted for the purpose of the Community Vulnerability Assessment of which 43.6% (859 households) were done in Obiliq/Obilic, 56.4% (1,151 households) in Fushë Kosovë/ Kosovo Polje. The settlements in which the CVA was carried out included urban and rural settlements which varied in terms of the majority ethnic community inhabiting the immediate areas. All settlements dominantly inhabited by ethnic minority communities in the two municipalities were covered by the CVA. The detailed ethnic composition of the sample is provided in the Figure 2 below. Figure 2. Ethnic composition of respondents by municipality Men and boys in the households surveyed account for 51.7% (n=4,918 persons) of the sample whereas women and girls represent 48.3% (n=4,597) of the sample, in total resulting with 9,569 survey entries. In terms of ethnicity, the majority of households in the sample are of Albanian ethnicity (60.3%), followed by Ashkali 18.6%, Roma 12.4%, Serb 6.6%, Egyptian 1.9% and 0.1% by Gorani and Bosnian households. Due to low number of Gorani and Bosnian respondents in the total sample the further analysis will not include these two ethnicities. The age structure of the interviewed households is the same as the one in the last population census 8, whereby the percentage of children under the age of 15 in the sample is 30.5% of the total number of individual household members. From total of 9,569 cases entered in the database the average age resulted to be with SD= Entries for Male members of the family had an average age of with a standard deviation of SD= The entries for Female members of the family on the other hand, had an average age of with a standard deviation of SD= According to the Population census 2011, Fushe Kosove/Kosovo Polje has 28.7%, and Obilic/Obiliq has 29.7% of persons under the age of 15. Available at: Page 12 of 86
13 Almost one quarter of the family members had personal ID, Birth Certificate and Passport. Similarly one quarter of the family members reported having only birth certificate, and 28.2% report having birth certificate and ID. In terms of ethnicity, Albanians report highest percentages of persons being equipped with all three documents (31.8%), followed by Ashkali with 12.5%, Egyptians 9.7%, Roma 8.7% and only 1% by the Serb households. The low percentage of Serbian respondents having all three documents is believed to be directly linked with the low level of integration of the Serbian community in the institutional life in Kosovo. As far as age composition of respondents is concerned, only 46 children under the age of 15 are reported not to have birth certificates. 19 persons aged also report not to have birth certificates. The vast majority or 71% of all family members of the households interviewed have been born in hospitals and 25.5% of them were born at home with no proper professional help. In addition, 3.3% of household members are born outside hospitals but with the help of a professional nurse. When tested this parameter alongside age, it is found that the persons born in hospitals have lower average age (21.1 years), as compared to those born at home without supervision from medical specialists (45.2 years). Albanians, Ashkali and Roma reported in similar percentages births at home ranging from 24% of Roma to 28% of Albanians who have been born without proper attention from healthcare professionals. Ashkali households with 12.2% and Serb households 6.1% reported lower percentages of births at home. The highest level of unemployment was reported by Serb household family members with 42.6% being unemployed, followed by Roma 41.9%, than by Ashkali 40.3%, Egyptian 27.8% and with lowest percentage reported by Albanians (23.7%). Highest level of employment again was reported by Albanian households with 25.2%, followed by Serb household family members (14.3) and the lowest level of employment was reported by the Ashkali households with employment level of only 3%. Below, the table represents the employment status by ethnicity. Ethnicity Unemployed Responsible Student/school Retired Employed for house full time Serb 42.60% 11.70% 19.10% 9.20% 14.30% Roma 41.90% 23.60% 20% 5.10% 7% Ashkali 40.30% 25.30% 25.40% 1.50% 3% Egyptian 27.80% 23.80% 32.50% 3.20% 9.50% Albanian 23.70% 13.70% 27.80% 6.80% 25.20% Figure 3. Employment Status by Ethnicity In terms of geographic distribution of the respondents by employment status, the two municipalities record similar trends. While the results obtained regarding most of the categories vary in decimal values between the two municipalities, Obiliq/Obilic records 3% more students as compared to F.Kosove/K.Polje. On the other hand F.Kosove/K.Polje records 2% higher unemployment than Obiliq/Obilic. Below, the employment status by municipality is presented in a table format. Municipality Unemployed Responsib le for house full time School/St udent Retired Employed Employed but in maternity leave or leave Helping family farm Can't work due to illness Oth er Obiliq/Obilic 28% 16% 28% 6% 19% 1% 1% 1% 0% F.Kosove/K.Polje 30% 16% 25% 6% 19% 1% 0% 1% 1% Figure 4. Employment Status by Municipality In terms of gender, women report significantly lower levels of employment whereby only 18% report to be employed, as compared to 40% of men. On the other hand, the percentage of women responsible for full time house work is Page 13 of 86

14 much higher (17%) than that of men (2%). 38% of men consider themselves unemployed as compared to 30% of women who report the same. Illiteracy is another major risk factor for the communities and individual household members within the communities face. This risk gains weight particularly given the worrying trends of increased rates of school dropouts in the past few years. 86% of the family members for which data was gathered are able to read whereas 14% of them were reported to be illiterate. Households from Ashkali communities reported highest percentage of not being able to read 30.5%, followed by Roma 24.9%, than by Egyptian households with 21.3%. The lowest percentage of members not being able to read was observed among Serb households with only 3.7%. The gender aspect in terms of literacy of family members was also considered and the statistical analysis indicates that women are reported to score 5% worse than men regarding illiteracy. Figure 5. Reading by gender If compared by municipality, 89% of respondents from Obiliq/Obilic confirm being able to read as opposed to 85% of respondents from F. Kosove/K. Polje who report the same. While the reasons behind this situation remain unknown, higher education trends are also confirmed by the question on employment status, where in Obiliq/Obilic 3% more respondents report to be in school/ studying. The most common education level within the survey group is that of technical/professional school graduates (27.6%) followed by the group with completed primary education (21.9%). University graduates and those with graduate education account for 11.8% of family members, while high school graduates account for 11.1% of the sample. Statistical analysis of results indicates that significant frequency differences are found between men and women in terms of formal education level completed. Women reported lower percentages of those with completed high school and university and post-university education as compared to men. Ethnicity also appears to be related to the highest education level completed by family members. The survey, however, does not provide for conclusive evidence to what are the reasons behind the ethnicity bias regarding education level. The table below provides the overview of education level within ethnic communities. no formal education grade grade unfinished grade 5-8 finished High school unfinished Professional/ technical school High school Higher education 2 years University unfinished University and further education Roma 17.7% 14.1% 4.1% 39.0% 2.2% 10.4% 6.1% 1.9% 3.2% 1.3% Albanian 3.2% 4.2%.3% 17.5% 2.3% 32.7% 12.5% 3.1% 8.0% 15.9% Page 14 of 86
15 Ashkali 22.1% 21.2%.1% 39.7% 5.8% 6.1% 1.7%.8% 1.5% 1.0% Egyptian 10.1% 19.0% 0.0% 41.8% 12.7% 5.1% 2.5% 2.5% 1.3% 5.1% Serb 1.4% 2.9% 1.2% 6.0% 1.7% 47.1% 19.8% 3.8% 8.1% 8.1% Figure 6. Completed education by ethnicity for household members above 18 years of age Taking into consideration that education is a life-long process in this analysis we included all household members above age of three. All household members above three years were asked whether they are currently enrolled in formal education (at all levels). Those of age 22 and younger not being enrolled in school also were asked to provide for reasons for non-attending school. Illness as the main reason was mentioned most often by Albanian household members as the factor limiting the ability to attend school with 29.2% of respondents providing it. Similarly, 31.3% of Serb households provide the same reason for not attending school. Financial reasons were the most common reasons provided for not continuing education for the Egyptian households members (76.5%). Ethnicity Illness To costly Need to work Couldn t pass the entrance exam Thought that has enough education Problem with language Marriage Was mistreated by other pupils Distan ce from school Security issues Lack of person al docs Other Roma 8.8% 55.8% 1.4% 3.4% 10.9% 1.4% 10.2% 1.4% 0.0% 2.0%.7% 4.1% Albanian 29.2% 13.5% 6.4% 1.8% 8.8% 0.0% 5.8%.6% 1.8% 0.0% 0.0% 32.2% Ashkali 2.4% 48.2% 3.0% 4.8% 7.7%.6% 13.7% 2.4%.6%.6% 0.0% 16.1% Egyptian 0.0% 76.5% 0.0% 0.0% 0.0% 0.0% 11.8% 0.0% 0.0% 0.0% 0.0% 11.8% Serb 31.3% 37.5% 0.0% 0.0% 6.3% 0.0% 0.0% 0.0% 0.0% 0.0% 0.0% 25.0% Figure 7. Reasons for not attending kindergarten, schooling or further training by ethnicity and for household members below the age of 22 Mistreatment at school (by either schoolmates or teachers) is not among the key factors influencing the dropouts within the non-majority communities in the two municipalities. Higher percentage of mistreatment by schoolmates was observed for household members from Ashkali community with 10.6%, followed by Egyptians with 9.1% and than for Roma with 6.8%. Lower levels were reported from Albanian households with 2.7% and from Serb households with 1.8%. Location of the dwelling and the overall conditions and infrastructure in the communities was also assessed during this exercise. The external assessment of living conditions and shelter has been carried out by interviewers through observations during the interview visits. Over 35% of households visited represent new houses in good conditions. An additional 36% of households were described as old, but in good condition. 17.4% of respondents in the sample were interviewed in apartment buildings. Less than 10% of households live in shelters that interviewers have described as bad living conditions. Within what could be categorized as inappropriate shelter, the biggest category of shelters is described as Damaged house with lack of hygienic conditions (7.4%), followed by Accommodation for IDPs (1.2%). The situation with living conditions has been presented in the Figure 8, below. Page 15 of 86
 The second aspect that the survey inquired about with regards to the situation in which the communities live is that of access to basic services.")
16 Figure 8. Type of housing as it appears from outside (%) The second aspect that the survey inquired about with regards to the situation in which the communities live is that of access to basic services. The first parameter that was used to generate this overview is that of the physical distance to the location where services are offered. To this end, the closest Family Health Center (FHC) is less than 1 km away for almost 55% of respondents. Around 29% of households live in 1 km 3 km distance from FHCs, with an additional 12% reporting to live 3 km - 5 km from the nearest such institution. Only 3.3% of respondents have indicated a distance to FHC 5 km 10 km, and even smaller percentage (1.9%) live further than 10 km from the nearest FHC. Given the size of these municipalities and their distance to the capital, access to health services is not a serious risk for the communities. The secondary and tertiary health services are even more distant to obtain by the communities where the research has been carried out. Hospitals are at less than 1 km distance for only 4.6% of respondents. An additional 9.4% report to be living 1km 3 km away from hospitals and 6.4% report distances between 3 km 5 km. The vast majority of households (around 73%) live further than 5km from the nearest hospital. Access to medicine (pharmacies) appears to be significantly better than that to more advanced healthcare services. 65% of respondents report to have pharmacies within 3 km radius of their households. It should be noted that only 9.5% of respondents indicate distances larger than 10 km to the nearest pharmacy. Comparative perspective of access to healthcare services and facilities is presented in Figure 9. Figure 9. Approximate distance of the household from family medicine center, hospital and pharmacy Page 16 of 86
17 The second type of services to which access was assessed is that of social services. Following the declaration of independence in 2008, and the subsequent decentralization process envisaged as part of the process, the only public provider of social services (Centers of Social Work-CSW) were put under the umbrella of municipal authorities 9. Since then, various reports and analysis have evidenced drawbacks in both the quality and quantity of supply of social services. Depending on the specific location of the dwelling and the respondents distance assessment, different responses were provided regarding the distance from CSW. 17% of respondents report distances less than 1 km from the nearest Center for Social Work. Slightly over than 30% of respondents report distances from 1 km - 3 km from the nearest CSW, while almost 17% of respondents claim to live between 3 km 5 km away from such centers. For 21% of respondents CSW is more than 5 km away. The distance per se cannot be considered a problem for the communities living in Fushe Kosove/Kosovo Polje and Obiliq/Obilic, but if the range of services offered by centers for social work 10 is taken into account, the impact coming from the distance to the nearest service providers in the most vulnerable communities can be significant. To this end, a more feasible and cost effective solution to addressing this vulnerability may come in establishing mobile units for service delivery at the location of the household. In the past CSWs have even reported limited ability to travel in some cases even because of low transportation budgets. Another important service that is also compulsory to be received according to the Kosovo laws is that of basic education. 60% of respondents interviewed for the purpose of this research, report to live less than 1 km away from nearest primary school facility with an additional 22.8% of respondents reporting to live between 1 km - 3 km. An additional 1.9% of respondents interviewed indicate 3 km 5 km distance from the nearest primary education institution. 1.2% of respondents claim to live 5 km -10 km away from the nearest school. 2.3% of households interviewed reported more than 10 km distance from the nearest elementary school. As per the basic education regulations currently enforced, children who live 4 km distant from elementary school are supposed to be provided subsidized transportation to school. 11 However, the definition of the level of support for the subsidized transportation is vague and left up to the willingness of municipalities and availability of funding at their disposal. Earlier in 2013, media reported some Prishtina Municipality villages protesting against the change of municipality contractor as the new provider had worsened the quality of service and increased the walking distance for children. Assuming that other municipalities may face similar if not bigger challenges than the capital, which has significantly bigger budget than most of the municipalities, maintaining regular transportation for all children may still not be fully affordable for a fair part of Kosovo municipalities. While this research does not provide for evidence of non-performance of the transportation services in Fushe Kosove/Kosovo Polje and Obiliq/Obilic, this risk needs to be closely monitored as if it occurs it can be detrimental to the education of children needing it. Given the worrying dropout rates particularly among the young girls, worsening of this external factor can seriously impact the overall enrollment of students in school for the households living in larger distances from schools. The responses to this aspect are provided in the Figure 10 below. 9 Community Development Fund and Kosovo Foundation for Open Society. Capacity Assessment Report for Provision of Social Services at Municipal Level: Pilot Assessment in Gjakova and Shtime. April Centers for social work are involved in a broad range of areas and services: Family Counseling Services, Child Protection Services, Domestic Violence, Social Assistance Administration, some pension schemes, and many more. 11 Article 5 of the Law on Pre-University Education states: In favor of regular enrollment and in order to prevent school drop outs, municipality organizes safe and efficient transportation for pupils in compulsory education. Municipality may request payment, but also can offer for free school transportation for: pupils that live within coverage area, but that are within the distance of four kilometers from school, except for pupils with special needs; and pupils that live outside the coverage area. Document available at: Page 17 of 86
18 Figure 10. Approximate distance of the household from the primary school Another dimension of communities analyzed comes in terms of languages spoken at home. Kosovo legislation provides for a five percent threshold as a qualifying quota for obtaining services in native language. 78.9% of respondents indicate that Albanian is the Primary language spoken in the household. 9.4% of respondents have indicated Roma as the primary language spoken in the household with an additional 9.1% of them stating Serbian as their primary language through which they communicate at home. Moreover, 36.8% of the interviewed households reported that they speak second language in their household. The most often second language spoken was Albanian with 17.4% of households reporting it. 12,2% report Serbian as the second language, followed by less than 1% of households listing Roma, Bosnian and Turkish languages as second spoken languages at home. The official data of MEST indicates that in Fushe Kosove/Kosovo Polje, during the academic year , a total of 5,700 pupils were enrolled at basic education level. Of this number, 532 are Ashkali, 37 are Egyptian and only 4 of Roma ethnic origin 12. A similar situation is found in Obiliq/Obilic Municipality where out of the total 3,667 pupils enrolled in basic education, only 117 are reported to be Ashkali 13. Given that most of the Ashkali and Egyptian households have reported Albanian as the main language spoken at home, the language barrier does not pose a barrier for the biggest part of the households interviewed. Reponses pertaining to the primary and secondary languages spoken are presented in the figures 11 and 12 below. Figure 11. What is the primary language spoken in your household Figure 12. What is the second language spoken in your household 12 Available at: 13 Ibid. Page 18 of 86
 and the ethnicity cross-tabulations represent the ethnic belonging reported")

19 3.2. Health Security Health is the first thematic sectors to be covered in this report. The information in this section has been obtained both from household heads and the individual family members (score cards) and the ethnicity cross-tabulations represent the ethnic belonging reported by the household head. Households access to a doctor if facing health difficulties was initially assessed from a generalized viewpoint. 34.2% of the households interviewed reported that they have a doctor whom they can visit in case they need one and 64.4% of households reported that they don't have such access. When this health dimension is analyzed alongside ethnic lines, it is found that most of the Albanians (75.8%) in the sample have answered that they do not have a doctor they can visit when they need, followed by Ashkali respondents (82.1%), and Egyptians (69.7%). Contrary to this, almost all Serb respondents (99.4%) have answered that they have a doctor they can visit followed by Roma with 62.4%. Unlike it may be assumed, the majority population reports to have least coverage with health advice in case of need. The full picture of responses is presented in Figure 13. Figure 13. Does the Family have a doctor they can visit in cases of need? Another question in the CVA requested the heads of households to state whether they trust the health protection system in Kosovo. Asked whether they believe they will receive health services in case of need, 55. 3% stated yes, 34 % stated partially depending from the need, and 10.7% stated partially, depending from the member of the family. When analyzed across ethnic lines, the Albanian respondents report to feel the least safe concerning health protection. Only 48.5% of Albanian respondents have answered the question positively as compared to Egyptian (55.9%), Ashkali (55.4%), Roma (62.9%) and 84.2% of Serbs interviewed who have answered with Yes to this question. Such composition of responses indicates that minority communities do not perceive that they will be denied public health services on the grounds of ethnicity. Below, Figure 14 and 15, present the responses obtained to this question visually. Ethnicity Yes Partially, depends from the need Roma 62.9% 25.7% 11.4% Albanian 48.5% 40.9% 10.6% Bosnian 50% 50% Ashkali 55.4% 29.4% 15.2% Egyptian 55.9% 29.4% 15.2% Serb 84.2% 14.1% 1.7% Goran 100% Partially, depends from the member of the family Figure 14. Will you be offered health services in case of need? Figure 14. Table Safety concerning health protection by ethnicity Page 19 of 86

20 Another aspect of the assessment of the health risks is that of the ability to purchase medicines/pharmaceuticals in the last twelve months. Concerning this aspect, 44.4% of respondents stated that they had difficulties to buy medicines in the last year, whereas 55.6% stated not to have had difficulties in affording medicine. In terms of ethnicity, Albanian respondents in the sample represent the group with the least reported difficulties concerning affordability of medicines with only 27% of respondents confirming the difficulties as compared to 80% of the Roma in the sample, 77.7% of Ashkali and 75% of Egyptian households (see figure below). Given the high impact this risk has on the household, and little or no protection that the vulnerable groups receive from public institutions (often, essential medicines provided for free by Ministry of Health are not available in public health institutions) it should be paid particular attention. Furthermore, given the fact that if no treatment is taken (for most of the health conditions), diagnosis of the problem (supposed to be available because of the responses obtained regarding access to health services) is not sufficient. The results obtained regarding the affordability of medicine indicate that RAE communities in Fushe Kosove/Kosovo Polje and Obiliq/Obilic are the most vulnerable communities pertaining to this risk. Figure 15. Difficulties in purchasing the pharmaceuticals Another dimension of the health risk assessment is the prevalence of health issues and conditions suffered by household members. In terms of most common health issues mentioned by the head of the households, flue was the most common problem with 53.2% respondents indicating it, followed by catching a cold 27.2%, other health problems (11.3%), knee or back pain (4.4%) and even a lower percentage of those reporting other health concerns. Given the composition of responses obtained, the health issues encountered by members of households interviewed in most part are related to light problems and conditions such as flue and cold (jointly account for 80.4%). If these responses are analyzed against those obtained regarding the affordability of medicine, the magnitude of the risk to the health of communities is not of high intensity. Responses on the most common health conditions reported by the family heads are presented in Figure Page 20 of 86
21 Figure 16. Most common health problems reported by the head of the household The question related to most common health problems and concerns was followed by another question on whether those problems are accompanied by a visit to a doctor to which 84.2% of respondents answered positively and 15.8% answered that they didn't visit a doctor. In terms of ethnicity, the highest level of negative answers was provided by Roma 22.3%, Ashkali 20.9% and Egyptian 18.8% households. In order to more closely observe the phenomenon and assess the health risk more accurately, the respondents answering this question negatively, were requested to provide the reasons for not visiting a doctor in the case of health conditions. The most common reasons provided as justification for not visiting a doctor in cases of health conditions and concerns, was that they couldn't afford such visits financially (51.4%), followed by 21.8% who stated that they waited for the health conditions to pass naturally, followed by 7.3% stating that they didn't know any doctor. Of all the responses obtained the most vulnerable category of households is that not being able to afford the basic health services. Figure 17. Reasons behind not visiting the doctor (when having health issues) The health situation with the households covered in the research appears not be a serious risk for the individual members of households interviewed. Overall, health condition of all family members in the sample was rated as very good by 62% of respondents, followed by those rating it as good (25.2%). An additional 7% of households rate Page 21 of 86
22 their health condition as satisfactory with only 4.3% and 1.1% rating it as bad and very bad respectively. The Figure 19 below shows the responses obtained for individual members in the households interviewed. Figure 18. Overall health of family members for the whole sample When tested against age parameter, it is found that the average age of those that reporting very good and good health conditions is lower as compared to the average age of those reporting satisfactory, bad and very bad overall health situation. This finding implies that older members of households encounter more health concerns than the members younger in age and that age bias to the health risk should be taken into account when designing public health policies. In terms of ethnicity, the highest percentage of family members that reported very good health status were from Egyptian households (71.2%), followed by Ashkali households (67.8%), and Albanian households with 62%. The percentage of Serb households reporting very good health situation is 61.8% and the least percentage of such responses among all ethnic communities is with Roma households (53.5%). The highest percentage of those reporting their family members having very bad health are also among Egyptian households (2.8%), followed by Ashkali households with 2.1% and by Roma households with 1.9%. Ethnicity Very good Good Satisfactory Bad Very bad Egyptian 71.2% 9.0% 6.2% 10.7% 2.8% Ashkali 67.8% 18.0% 5.0% 7.1% 2.1% Albanian 62.0% 27.2% 6.8% 3.3%.7% Serb 61.8% 23.5% 11.7% 2.4%.5% Roma 53.5% 31.1% 8.9% 4.6% 1.9% Figure 19. Reported health status for the family members by ethnicity In terms of gender, overall, male household members were rated with better health status as compared to women. The Chi square analysis yielded significant frequency difference for the reported health status between genders [χ 2 (4, 8959) = 15.3, p<.004)]. Another health indicator measured through the CVA is the prevalence of chronic illnesses among households members covered in the sample. Overall, the households from Egyptian (17.9%), Roma (16.6%) and Ashkali (14.1%) communities reported higher prevalence of chronic illness among their family members as compared to Albanian (12.7%) and Serb (10.5%) household. The chi square analysis across ethnicity resulted with significant frequency distribution [χ 2 (7,8058)= 21.5, p<.003)] for presence and non presence of chronic illness among family members of households of different ethnicities. In terms of geographic distribution, higher percentage of those that reported chronic diseases amongst the family members were observed in Obiliq/Obilic Municipality with 14.1% as compared to 12.1% reported in Fushe Page 22 of 86
![Kosove/Kosovo Polje. The frequency distribution between municipalities was significant and statistically relevant with Chi Square [χ 2 (1, 8160)= 5.09, p<.025)].](/docs-images/74/69944413/images/23-3.jpg "Given the presence of the coal-fueled power plants in Obiliq/Obilic, which represents one of the most concerning environmental hot-spots in Kosovo, the higher presence of chronic illnesses in")
23 Kosove/Kosovo Polje. The frequency distribution between municipalities was significant and statistically relevant with Chi Square [χ 2 (1, 8160)= 5.09, p<.025)]. Given the presence of the coal-fueled power plants in Obiliq/Obilic, which represents one of the most concerning environmental hot-spots in Kosovo, the higher presence of chronic illnesses in Obiliq/Obilic is to be expected. Figure 20. Figure - Presence of chronic disease by municipality The most common chronic illness reported was high blood pressure with 45.2% of the total number of answers obtained, followed by other cardiovascular diseases representing 10.4% of responses, bronchitis (4%), ulcer (3.8%), eye problems (3.2%) and with even lower reported frequency of manifestation of other chronic diseases. Figure 21. Percentage of chronic illnesses present among all households The data collected regarding vaccination indicates that 83% of the family members younger than 14 years of age are vaccinated whereas 2.7% of the family members did not receive any type of immunization. In terms of ethnicity, the lowest level of vaccination is reported with Roma Community households (5.8% not receiving any type of immunization), while the highest of immunization is reported by Albanian Households who state Page 23 of 86
24 that only 0.5% of household members younger than 14 that did not receive any type of vaccination 14. When asked to provide the reasons for not vaccinating family members 50% of them stated that they forgot the obligation to vaccinate the children, 16.2% stated that they couldn't get the vaccines for free, 15.9% stated that vaccination is not important, 11.1% stated that they didn't have access to health care services, and an additional 6.7% of respondents provided other reasons. When these responses are further analyzed along the ethnicity parameter, it appears that the Egyptian respondents report the highest percentage of those not having access to such services (40%) followed by the significantly lower percentage of Ashkali (15.2%) who claim not to have access to these services. The highest percentage of those stating they could not get the immunization free of charge is among the Albanian households with 22.1% of those not having vaccinated their children report as the reason for not doing so. Ethnicity Vaccinatio n is not important Forgot the obligation to vaccinate Doesn't have access to health services Couldn't get free of charge vaccination Other Albanian (n=77) 19.5% 46.8% 6.5% 22.1% 5.2% Ashkali (n=92) 17.4% 39.1% 15.2% 21.7% 6.5% Roma (n=117) 14.5% 55.6% 8.5% 12.0% 9.4% Egyptian (n=5) 0.0% 60.0% 40.0% 0.0% 0.0% Serb (n=2) 0.0% 100.0% 0.0% 0.0% 0.0% Figure 22. Reasons for not vaccinating on regular basis the children under 14 for all by ethnicity 14 Chi square analysis resulted with significant frequency differences among ethnicities in terms of regularity of vaccines for the family members younger than 14 at [χ2 (12,4158)= , p<.001)] Page 24 of 86
25 3.3. Economic Security This dimension in the Human Security Multi-Sectorality and Externalities Framework appears to be the biggest vulnerability that the communities surveyed are faced with. The communities included in the CVA face immediate risks to their wellbeing that have high probability of occurrence. High unemployment, dependency on social assistance schemes, and high cost of basic food supplies and utilities makes a large part of households surveyed dependable on instable / extraordinary income coming mainly from remittances or some other form of cash transfers. The vast majority of households interviewed report to spend the biggest part of their household budgets on food, basic supplies and utility payments. The accumulated debt for some public utilities that some respondents report, is also an indicator of the critical situation households are in. Given the high percentage that cost of utilities accounts for in the household budgets, any electricity price increases, would seriously impact the households reporting the lowest income levels. The Serb (44.4%) and Roma (41.1%) households reported in highest percentages of accumulated debt for utilities, as compared to households from other ethnic communities and their debt towards utility providers. Water supply and electricity bills are the main costs that the households report to have unpaid debt for. The households from Egyptian (12%) and Ashkali (10.9%) communities reported the lowest level of debt regarding water supply. The burden and difficulties in paying debt for public utilities is also confirmed by some reported cases of acquiring loans to pay for debts for either water supply or electricity. This represents a risk of high vulnerability with high likelihood of occurrence given the financial situation of the households included in this survey. If the expected increase in energy prices is taken into account, the impact of such decision on these categories of households would be detrimental. A concrete plan of action for subsidizing the cost increase for the most vulnerable categories should be sought as the increase electricity costs would impact the most vulnerable households across all ethnicities. Regarding income levels, Ashkali community appears to be the most vulnerable with an average income of only EUR/month, while at the same time, the Albanian community households report to be the least vulnerable with an average income of EUR/month. When this income is analyzed in terms of the source and type of income received by households, the Ashkali community again surfaces as the most vulnerable one, with an average of only EUR/month coming from employment, and the least vulnerable households are those within the Albanian community with an average of EUR/month from this source of income. Different sources of income within the definition of cash transfers 15 were also required to be indicated in value by the heads of households. These sources include salaries, social assistance transfers, and other incomes and from the relatives living abroad. The income reported from salaries ranged from 5.00 Euros 5, Euros with average of M= Euros. Social transfers ranged from Euros 1, Euros and with average of M= The average monetary values for all categories of income received during the last month before the survey are reported in the Figure The question asked was What is the amount of income (or transfers) that your family has received during the last month? The interviews were carried out in May, Page 25 of 86
26 Figure 23. Average monthly 16 of incomes of the households from all sources as reported by the head of households One way Anova was run to compare the mean differences of the income sources while controlling the ethnicity variable. As observed from the Figure 25 below, on average the Albanian households reported higher averages in all sources of income compared to other ethnic groups. Mean comparison revealed significant mean differences for the incomes from the salaries among ethnicities, for social transfers, for incomes from the other activities among ethnicities and for incomes from relatives from abroad. When analyzing the source of income it is interesting to note that 25.2% of respondents interviewed report to cultivate vegetables, fruits, milk or dairy products, eggs or meat and meat products for household consumption whereas 74.8% do not report such activity. The average income from salaries as a source of livelihood for the households was reported to be set at Euros for Albanian respondents during the last month before the interview (April 2013), Euros for Egyptian respondents, Euros for Serbian respondents, and the lowest average income level from salaries is reported by Roma respondents with Euros for the same period. Such composition of results indicates that the Albanian respondents in the sample are employed in higher paid jobs than the other communities. When compared against the education level of respondents, the results indicate that the higher payment levels can also be linked to the overall higher education levels of Albanian population in the two municipalities as reported by the heads of households. The ethnic Albanian households report higher income values across all categories of income received during the month of April The ethnic overview of average values of income from different sources is presented in Figure The question asked was What is the amount of income (or transfers) that your family has received during the last month? The interviews were carried out in May, Page 26 of 86
27 Figure 24. Average income from various sources received within April 2013, by ethnicity Ashkali (3%) and Roma (7%) report the lowest levels of employment. Least vulnerable appear Albanian community households where 25.2% of family members are employed on average. Vulnerability of the Ashkali community households is also confirmed by the type of employment reported, where only 1.8% and 7.3% of the Ashkali households report full-time employment in public and private sector respectively. On this dimension, the least vulnerable community appears to be the Albanian one with 42.7% employed in public and 28.5% in the private sector on full-time basis. Low levels of formal employment can in the long run have detrimental effect on the overall vulnerability of communities, as in its absence, people are deprived of their legal rights that they enjoy under the applicable law in Kosovo 17. There is no difference in geographic distribution of responses and households in both municipalities report 61% of formal employment among those that are employed. Social assistance scheme represents the only institutional mechanism for addressing the risk of poverty. The most vulnerable community regarding the impact from social transfers appear to be Ashkali community households where social transfer account for a larger percentage of their total income as compared to other communities. Social assistance scheme in Kosovo is, among other, conditioned by socio-demographic factors of the household, namely, having a child younger than 5 years of age or elderly above the age of As such, the exclusion of families from social assistance can be abrupt leaving some households without one of their main sources of income. The respondents were also asked whether their incomes for the last month were at similar levels, have downsized or have increased, as compared to the last three months of the past year. The vast majority of household heads reported that the incomes were similar to previous year (81.6%), followed by 11.8% of households reporting increase of income as compared to previous years and 6.7% reported to have less income compared to previous months. The responses obtained give a very clear illustration of the difficulty of breaking the cycle of poverty and increasing the income levels for vulnerable households. Despite the numerous government and non-government interventions and programs aimed to alleviate the situation with regards to income generation particularly among the most vulnerable groups, there is very little effect reported on the ground. Their disadvantaged situation with regards to education, and the low chances of improvement in the near future, puts the majority of the households surveyed at continuous risk of worsening of their financial situation. Usually having one major source of income for the entire family, if for some 17 An example of the chain effect can be identified with health insurance scheme (expected to start in the short-term future), pension, paid leave, and other related benefits of formal employment. 18 See Law 2013/15 on Social Assistance Scheme available at: Page 27 of 86

28 reason the source is discontinued, the income levels of households drop abruptly and have considerable impact on the households financial situation. While 11.8% of respondents report increased levels of income as compared to previous periods, 6.7% of respondents indicate deterioration with regards to their income levels. The last category is particularly important to take into consideration as they represent the most vulnerable category of households in terms of income. Figure 25. Change in the income levels as compared to same month of previous year Aside from the progression/regression in terms of income levels, the household heads were also asked to evaluate their overall financial situation. On this topics, 25.3% of the households reported that they have major financial difficulties (including problems securing food), 35.3% reported some difficulties especially in payment of utilities, whereas 36.8% reported they do not have any major financial difficulties. Viewed alongside ethnic lines, it can be noted that households within the Albanian community report the highest percentage of responses no significant financial problems (50%), followed by almost 40% of K-Serb respondents interviewed who report the same. The third highest percentage within ethnic groups that report no major financial difficulties is within the Egyptian community (26%), with the fourth and fifth place being reported by Roma (14%) and Ashkali (12%). The significant differences within the ethnic communities sub-samples are also revealed by the Chi Square analysis where members of communities from Egyptian, Roma, and Ashkali reported significantly higher percentages of households having difficulties in purchasing food items. As it can also be noted in the Figure 27, Roma households represent the most vulnerable group in terms of financial situation, as 66% of the respondents within this sub-group, report difficulties in satisfying the needs for food and basic supplies, followed by Ashkali sub-group with 48% of households within this ethnic community in the two municipalities. The lowest percentages of households reporting difficulties in affording food and basic supplies are reported by the K-Serbian households interviewed. Figure 26. Financial situation by ethnicity Page 28 of 86

29 The household heads were also requested to provide specific information on the category of expenses they have difficulties covering. The following section of the results presents the findings on whether the households have difficulties covering the expenses for food, water, energy, clothing, transportation and schooling the findings are presented for each issue separated and compared by ethnicity. Statistical analysis across ethnic lines indicates that households from the Roma, Ashkali and Egyptian communities provided more yes responses as compared to Albanian and Serb households across all categories. Supply of food for the family is problematic for 77% of Roma, 63% of Ashkali, 61% of Egyptian households as opposed to 32% of households within Albanian and Serbian communities. Figure 27. Difficulties in buying food by ethnicity If analyzed across municipal distribution, Municipality of Obiliq/Obilic appears to report greater vulnerability in terms of satisfying the food needs of the households, as compared to F.Kosove/K.Polje. A total of 45% of households in Obiliq/Obilic as compared to 39% of them in F.Kosove/K.Polje report to face difficulties in covering food consumption costs of their members. Figure 28. Difficulties in paying for food by municipality. The situation pertaining to the difficulty of paying water bills follow a same pattern with that of food supply. For this category, similarly to food, chi square analysis revealed significant differences within ethnic communities, whereby households from the Roma, Ashkali and Egyptian communities reported higher percentages of those answering the question positively as compared to Albanian and Serb households. A similar situation is portrayed also with regards to energy, schooling costs for children, whereby statistical tests indicate the higher level of vulnerability of Roma, Ashkali and Egyptian communities. Nevertheless, as compared to the previous categories of expenses, the percentage of households reporting difficulties in covering energy expenses within the Albanian and Serbian subgroups is higher in comparison to categories discussed above. Responses are presented visually in Figure Page 29 of 86

30 Figure 29. Difficulties in paying Energy by ethnicity The composition of answers with regards to difficulties in covering transportation costs show a slight difference in distribution within ethnic communities as compared to the patterns compared to food, water and energy items. Chi square analysis revealed significant differences where households from the Roma, Serb and Ashkali communities reported difficulties in higher percentages as compared to Albanian and Egyptian households. A similar situation with that of transportation is found also concerning schooling costs % of Roma households report to have difficulties in covering schooling costs for household members, hence marking the highest percentage from all communities. The lowest percentage within ethnic communities to report difficulties in paying for schooling costs is within Egyptian community (32.1%) and within Albanian community (32.9%). In order to accurately assess the situation with regards to the real weight that different categories of expenses represent for households, the heads of households were requested to provide an approximate distribution of household budget for the previous month. The vast majority of them (75.3%) reported that the largest expenditure in their household s budget during April 2013, is dedicated to satisfying the households food needs, followed by the cost for energy (17%). The households from the Roma community reported highest level of expenditures on food compared to other ethnicities. Ashkali, Albanian and Egyptian households all reported averages higher than 75% of their total April 2013 budget that they dedicate to satisfying the food needs of the households. The second biggest expenditure for most of the households interviewed was expenditures on energy. Given the anticipated increases in the price of energy in the coming years, the second largest expenditure category may become impossible to afford for a considerable portion of the households interviewed. The distribution of expenditures by categories and ethnicity is presented in table below. Ethnicity Food Water Energy Clothing Transport Education Roma 90.0% 1.3% 6.3% 1.3% 0.0% 1.3% Ashkali 77.8% 2.8% 13.9% 2.8% 0.0% 2.8% Albanian 77.2% 1.7% 17.2% 2.8%.4%.7% Egyptian 75.0% 25.0% 0.0% 0.0% 0.0% 0.0% Serb 55.2% 9.9% 23.8%.6% 7.2% 3.3% Figure 30. Distributions of household expenditures by ethnicity in the previous month 20 Aside from asking about the percentages that different expenditure categories represent for their overall family budget, the assessment also inquired about monetary value of those categories. The highest financial burden to the households interviewed comes from food expenditures. The average spending of households for this category of 19 Textbooks, supplies, transportation if any, housing, and all associated costs. 20 The question was asked How much money has your family approximately spent during the last month in the following articles? The survey took place in May Page 30 of 86
31 expenses is EUR. Utilities with an average of EUR per month represent the second biggest category of expenses encountered by the households. Clothing and Transportation come as third and fourth most expensive categories of expenditures with EUR and EUR respectively. Alcohol and cigarettes rate slightly lower than transportation with an average of EUR per month. Pharmaceuticals / health issues, sanitary products and social events are the categories to which the households dedicate least part of their budget with EUR, EUR and EUR per month respectively. Figure 31. Average expenditures of the households during last month 21 by category of spending When analyzed alongside ethnic variable, some categories of expenses indicate significant differences between households of different ethnicity. Serb households resulted with lowest average spending on food with EUR per month, while the Albanian households scored the highest with EUR per month. Statistical testing (One Way Anova) resulted with significant mean difference of monthly expenditures for food between households of different communities. Albanian and Serb households reported slightly higher averages in cigarette and alcohol expenditures of the household EUR and EUR on average per month as compared to households from the other communities. Households from Ashkali community reported higher averages of monthly expenditures on clothing as compared to households of other ethnicities with EUR, while the lowest spending for clothing as an expenditures category were reported by Egyptian households with an average of EUR per month. Households from Albanian community reported higher averages of monthly expenditures on utilities (67.20 EUR), followed by Serb households with average of EUR. The lowest spending reported on utilities comes from Roma households with an average of EUR per month. The reported expenditures also represent a perfect match with the sources of energy used for heating and cooking reported by households, which represent the largest energy consumption need for the household. One of the budget expenditures categories specifically inquired about is education. The question regarding the expenditures for education was framed to inquire about how much the families spent in total for school payments, school book, and other education materials, clothes, transport and accommodation. The highest averages spent in education-related costs were reported by the Albanian households with average of EUR for the last year, while the lowest average was reported by Ashkali households with average of EUR spent on education during the last year. This information can indicate both that Albanian households have more funding available to invest in education and it can also reflect the higher perceived importance as compared to Ashkali households. The CVA does not provide for conclusive evidence to this end, however, the gap between the two indicates that the current education gap between communities can be expected to remain the same or increase further in the future. 21 All interviews were carried out in May Page 31 of 86
32 The full information about the education as spending category as reported by the heads of the households by ethnicity is presented below. Ethnicity Range Mean in euro SD Roma (n-=73) Euros 2, Euros Albanian (n=692) 5.00 Euros 10, Euros Ashkali (n=44) Euros 1, Euros Egyptian (n=4) Euros 1, Euros Serb (n=35) Euros -1, Euros Figure 32. Average spending for education within one year by ethnicity Entrepreneurship seems to be not a very favorite approach to pursue higher incomes. While there is evidenced economic activity among the most low income categories (most often in collecting recyclable materials), there is very little or no formal business activity. Only 8.6% of the households reported that one of their family members have tried to start a business during the last year. Out of this percentage, 44.4% reported that their business was still registered, 41.6% that the business was never registered and 14% of respondents state that the business was not registered any longer. In terms of ethnicity, it is interesting to note that the Serbian households report the highest percentage of start-up businesses attempted by their household members in the last year with 20% of households providing this answer within this ethnic community. In terms of type of businesses started, 32% of respondents indicate trade, followed by those reporting agriculture activities (18.7%), while service and construction types of businesses were reported by 14.2% and 10.3% respectively. The level of usage of bank services is also an indicator of vulnerability of the households as it also directly implies the access to finances for the households. Different types of bank product or services also signify the type of financial activity on the part of the households. Furthermore, some products are also an indication of employment, property ownership and at least two employed persons serving as guarantors before the bank 22. The first product inquired about is that of savings account. It should be noted that possession of savings account requires two basic pre-conditions, income surplus after covering the expenditures of the household, and willingness to save. But at the same time, possession of savings accounts also implies stability, greater financial safety net, even in cases when temporary unemployed. In the long run, possession of savings account implies greater chance of property ownership, quality education and other potential commodities for the household. The majority of Albanian households (55.4%) reported that they have saving accounts, while the lowest rates were observed among Roma households. Egyptian and Ashkali households reported in higher percentage that they have saving accounts compared to Serb households. In the absence of own savings accounts and/or inability to save, households become vulnerable from any unplanned event/risk. When asked to indicate a source they would turn to for urgent repairs in the house if needed, the vast majority of respondents indicate friends and family as the first source. Given that vulnerability is present across all communities and in both municipalities, the availability of this safety net represented by friends and family is not certain. While the safety net may exist as a social structure, the ability of the close ones to aid in case of need may also be very limited. Lack of savings accounts indicates very low ability of the part of households to absorb shocks that may arise for them on their own and make them dependent from outside factors. The second bank product inquired about in the assessment is that of debit cards. The majority of Albanian households (71.6%) reported that they have debit card accounts, followed by Egyptian households (21.4%), the Serb households (18.2%), Roma with 17.2% of households that have debit cards and lastly by Ashkali 6.3% who mark the lowest rate of possession for debit cards. As debit card accounts are a pre-condition for any other banking product (aside from savings), it should be taken as a solid indicator of limited access to finances that is noted above. The 22 Commercial banks in Kosovo require most or all of the criteria noted above for issuing any loans or other types of borrowing products. Page 32 of 86
33 rationale behind such interpretation of this result is the fact that without having a current account in a bank, obtaining other services and products is virtually impossible. Another banking product which was considered as indicative of the households financial situation is the loans. Having or not having loans, aside from indicating the level of social and financial stability (employment, property, etc), it also is an indicator of the level of debt within the communities. To this end, a total of 28.7% of the households interviewed reported having a loan whereas 66.7% negated using this bank product. In terms of ethnicity of the households, Serb households reported the highest percentage of loan possession (35.3%), followed by Albanian households with 34.7% and Roma 20.4%. Significantly lower level of loan possession is reported by Ashkali and Egyptian households who report 12.4% and 6.3% respectively. The vast majority of respondents reporting to have loans (84.1%) state to have acquired them through commercial banks. The second most popular source for acquiring loans reported by households with 7% is friends and family. Other sources have been reported by 4.9% of respondents followed by Microfinance Institutions with 3.4% of borrowers in the survey. Only 3 families reported borrowing money from non-formal lenders. The households responding positively to having loans were also requested to provide information on the size of their loans and the size of monthly payments to repay it. The average size of loan for 473 households reporting to have loans was 4, Euros with a range of loans reported from Euros 120, Euros. The monthly payments for the loans averaged at Euros and a range of monthly payments from Euros 3, Euros. In terms of ethnicity, it appears that Albanian households have larger loans with an average value of 5, Euro and lowest size of loans is reported by Egyptian households with an average of 1, Euros. One Way Anova test on the average size of loans showed significant mean differences among the ethnicities. In order to get a more complete overview of the households needs in terms of financing, the households confirming to have loans were also asked to state the reasons for acquiring it. The most common reason for acquiring loans as reported by the respondents is improvement of living conditions (house reconstruction), a reason provided by 60.5% of the households currently having loans. It should be noted that only around 6% of respondents have used the borrowed money to finance income generation activities, with all other reasons being related to consumption or covering for living expenses or unexpected occurrences. The fact that 13% of confirmed borrowers have indicated family matters (deaths, illness, wedding, etc) as the reason for acquiring loans, testifies to the vulnerability of all communities with regards to addressing urgent situations. The quality of living and economic security of communities was also assessed by taking into account shelter security and housing costs for the households interviewed. The majority of households interviewed for the purpose of this assessment (91.7%) report to own the shelter (house/apartment) where they live, 3% reported that the house/apartment is owned by the extended family. Slightly over 3.2% of respondents indicate living in state property with all other categories of shelter being selected by less than 1% of the total number of respondents. Furthermore, from total of 1,731 valid cases only 7.6% (n=131) of households reported that they pay rent and 92.4% (n=1,600) claim to live rent free. In terms of ethnicity, the Albanian community households reported the highest percentage of those paying rent (9.1%), followed by Egyptian community households with 6.9%. The Roma households that pay rent represent 5.3% of the total number of Roma in the sample, followed by even lower percentages of Ashkali households (5.2%) and the lowest percentage on rent payment was reported by Serb households with 4.2%. Of those currently paying rent, only 5.7% are very concerned that someone might drive them out of the existing shelter. An additional 2.2% of the respondents state to be concerned, and 2.5% concerned to certain extend. The vast majority of respondents (85.5%) state not to be concerned with this aspect. As it can be seen in the figure below, risk of losing shelter as expressed by the level of concern expressed by respondents is moderate and it affects a small number of households within the sample. Page 33 of 86
 the ethnic distribution of responses regarding the possession of specific home appliances in their houses.")
34 Figure 33. Level of concern that someone might drive the household out of the shelter Possession of equipment, furniture and appliances was the second aspect of assessing the quality of living. The following section of results presents (in percentages) the ethnic distribution of responses regarding the possession of specific home appliances in their houses. Given the fact that the survey required about eighteen different sets of appliances and household possessions, the analysis of scores has been done on the basis of an index developed for this purpose. The index range is from 0 18 appliances which were covered in the survey. The same index was compared by the ethnicity of the households and as seen from figure below the Albanian households resulted with higher averages compared to others, with the lowest average observed among Roma households. The results obtained show significant statistical relevance when tested for ethnicity variable. Figure 34. Average of index for home appliances compared by ethnicity In terms of the basic conditions of the housing, and access to public utilities, 15% of the households reported that they don't have a toilet inside the house, 8% reported that they don't have bathrooms inside the house, 7.7% reported that they don't have shower inside, 6.4% reported not connected to sewage and 3.1% not connected to the electricity. Lack of access to these basic conditions within their households, represents a major risk for the households reporting it. Page 34 of 86

35 Figure 35. Figure - Basic living conditions within houses Page 35 of 86

36 3.4. Personal and Community Level Security Personal security is essential to all other aspects of security elaborated upon. It is the basic pre-condition for achievement of all other forms of security and the long-term wellbeing of vulnerable communities. For assessing the most common threats to personal security, the team applied seven likert-type questions that jointly attempted to measure the level of security, all seven items had range of response from 1 to 5 from strongly disagree to strongly agree. In the sections below, higher scores indicate higher security and lower scores are indicative of lower perception of security. All heads of households were asked to rate the following statements: The neighborhood/village/ settlement is reasonably safe to walk without fear of harm from anyone at all times; The Kosovo police is reliable and protects people regardless of their ethnicity; I feel confident to call KP and report harm or fear of harm; The courts take decisions without prejudice and impartially from ethnicity, race, religion, etc.; I feel safe talking in my mother tongue when waiting in line for receiving service or product; I feel safe to go and work with people of other ethnicity; Children (in my household) are safe to go to school, or play outdoors without fear of harassment or abuse. The minimum score was 7 which meant low level of security and maximum score of 35 which meant high level of security. The results show that highest scores for the index were scored from the heads of family from the Albanian households with 30.14, followed by Egyptians head of households 28.02, than by Ashkali 27.37, Roma with and lowest level of index of security were scores by Serb households with Anova mean comparison for ethnicity for the security index resulted with significant mean differences for the ethnicity variable. Below these results are presented into detail. Figure 36. Index of level of security averages based on ethnicity Another security dimension assessed is the perception on the most problematic security issues in their community. Security and protection of marginalized groups is considered by most of the respondents in the sample as the top security concern. All ethnic communities except for Ashkali, and Egyptian ones have indicated this challenge as the most important one. The two communities have chosen public safety in the evening as their top security threat. Public safety at night manifests itself considerably also as the second or third priority, indicating importance across the entire sample. The table below presents the top security issues. Second and third priority issues also follow a similar pattern of distribution of responses. Ethnicity Security and protection of marginalized groups Safety in traffic Public safety in the evening Ensuring transportation (securing free transportation) Illicit substanc es Arms Radical religious groups Prostitution and human trafficking Roma 57.4% 14.2% 13.2% 7.6% 2.0% 2.5% 2.0% 0.0% Albanian 34.7% 24.1% 23.6% 5.6% 5.7% 2.5%.5% 2.2% Ashkali 28.3% 33.5% 29.8% 2.6% 4.2%.5%.5% 0.0% Egyptian 27.8% 11.1% 44.4% 11.1% 0.0% 5.6% 0.0% 0.0% Page 36 of 86

37 Serb 75.4% 17.4% 7.2% 0.0% 0.0% 0.0% 0.0% 0.0% Figure 37. First ranked security issue ranked by ethnicity Discrimination and prejudice were also measured as part of the CVA. There was a set of questions related to certain categories of individuals that the household heads would not like to have living in the neighborhood. This section confirms unfriendly attitude towards different social groups. There is clear dislike towards having other groups, by the respondents interviewed. The majority of respondents would not prefer having other ethnic communities living in the neighborhood, divorcees, rehabilitated convicts, single mothers, or gay persons. The composition of these answers is very indicative of conservative mindset and more rigid moral norms system that is quite limiting for persons belonging to any of the groups listed above. In general, personal security is at satisfactory level, whereby even households from Serbian community, which in the past has been the most skeptic one concerning personal security, displays high level of confidence and is free of fear for their own and/or their households security. Community safety and security remains the most important security challenge noted by all ethnicities. This type of security in Kosovo is offered by the local authorities, who after the decentralization process are responsible for appointing local commanders of the Kosovo Police. As such security concerns with regards to community level security should be addressed at the local level. In order to assess the level of presence of stereotypes toward the RAE community and address them effectively, nine statements were presented to the respondents for their evaluation. The ranking of statements was done on a scale 1 3, where 1 = are not at all justifiable, 2 justifiable and 3 totally justifiable. Minimum score was 9 and maximum score 27. Higher scores indicate higher stereotypes toward RAE community. The statements used for measuring stereotypes were: [ ] are happy and enjoy life; prefer individual freedom instead of success in life; are dirty/not clean; appreciate family and kids; are lazy; steal; abuse the system; can get away with some actions with which others cannot; are very different, therefore cannot adapt in society. Figure 38. Index score on stereotypes toward RAE community 9 items Another set of four questions were asked to respondents, with the aim of exploring the acceptability of favorable treatments (affirmative action) for several hypothetical situations: additional support for a child in school if he/she does not speak instruction language/language of teaching in school; scholarships for children who come from poor families; specification in the law for the number of students accepted in high schools and universities from the discriminated groups (quote on education of discriminated groups); specification in the law for the minimal number of employed from the discriminated groups, employed in the public sector (quote on public employment of discriminated Page 37 of 86
 compared to Roma with 3.89, Albanian with 3.66, Egyptian 2.3 and Ashkali with 2.13. Figure 39.")
38 groups). The rating scale of favorability was 0-5 where 0 = completely unacceptable and 5 = very acceptable. Thus minimum score achieved was 0 and maximum score was 5. Serb respondents resulted with higher average scores on favorable treatment index (4.38) compared to Roma with 3.89, Albanian with 3.66, Egyptian 2.3 and Ashkali with Figure 39. Average score on index of favorable treatment Political security and freedom of association is a right guaranteed by the Kosovo Constitution. The ethnic minorities are further ensured their rights in the basic legal document through representation quotas both in civil service and elected bodies (legislative branch of government). Communities can and do utilize the right of political representation and are free of harassment when doing so. Page 38 of 86
39 3.5. Environment Security This section addresses the last category of risks of the vulnerability assessment framework, that of clean environment to live. Climate related risks do not represent threats to the communities included in the household, unless subject to major rainfalls or other major events, in which case communities could be affected by potential floods. This risk however, given the past track record of precipitation is not likely to occur. One of the most concerning environmental aspects in both municipalities is the coal-fueled power plant in Obiliq/Obilic. Kosova A power plant is considered to be one of the biggest pollutants in Kosovo and is scheduled for decommissioning in Aside from the air pollution, which is highly influenced by the power plant, reclamation of ash dumping grounds, disposal of toxic waste accumulated in past gasification processes in the power plant, also represent serious environmental issues that need to be addressed. The only more serious attempt to address the environmental concerns related to electricity generation has been undertaken by the World Bank who through its Cleanup and Land Reclamation Project has largely succeeded in addressing the environmental legacy issues related to open dumping of ashes on land 23. According to the World Bank Environmental Assessment for Kosovo, the air emissions from the power plants are much higher than the European Commission (EC) Directive for Large Combustion Plants allow (table 2.1), though the Particulate Matter emissions from Kosovo B are a factor 3-6 times lower than those of Kosovo A 24. In order to accurately assess the environmental vulnerability of communities, the CVA evaluated the perceptions of households about the environmental parameters within the soil, air, water sources as well as exposure to pollutants that are hazardous to the environment and human health. The first parameter to be inquired about was the quality of drinking water, as the main source of disease, if polluted from the environmental factors. To this end, Egyptian households reported the highest percentage of high-quality safe water coming from water supply systems (75.7%). This percentage of responses is not surprising given the fact that most of the Egyptian community households live in urban areas where the coverage with public water supply system is higher. The Albanian households appear to be mostly risked from water sources as they report the lowest percentages of households being supplied by tap water in their homes with only 42% of households having access to public water systems. The Albanian households heads report the highest percentages of those using wells for supply of water (15.9%) as well as the highest percentage of respondents that buy water (17.4%). Ethnicity Pipes within the apartment Pipes till yard Public water Well Water from natural source Buys water Other Roma 67.9% 20.2% 4.6% 6.0% 0.0%.9%.5% Albanian 42.2% 19.1% 1.3% 15.9%.7% 17.4% 2.4% Egyptian 75.8% 12.1% 3.0% 0.0% 0.0% 0.0% 6.1% Serb 70.7% 4.9% 1.1% 20.1% 0.0% 3.3% 0.0% Figure 40. Source of Drinking water in the family However, if analyzed into more depth, most of the households across all ethnic communities display dissatisfaction with either the quantity or the quality of water they use at home. Within sub groups, Serbian and Ashkali households display the largest percentages of respondents that are unhappy with both the quality and quantity of water supply with over 63% of respondents reporting it. Smaller but still significant percentages of respondents within all ethnic communities are not happy with the quantity of supply, whereas they have no remarks on the quality of supply. 23 Project information available at: DF/ISR0Disclosabl pdf 24 Study available free of charge at: Page 39 of 86

40 Figure 41. Quality and quantity of the water When asked specifically to rate the quality of water supply in their households, the most dissatisfied appear to be the Serbian households who have rated it on average with 2.0 on a total scale of 5. Given the sources of water indicated in the section above, and lack of coverage of public water supply in some Serbian inhabited areas, the results are to be expected. The most satisfied households with the quality of water are within the Albanian and Ashkali communities where the average score given is Such score places the average satisfaction level with the Albanian and Ashkali Communities with the quality of water to neither good nor bad level. The following section presents the average results of the evaluation of air, soil, water and presence of toxic materials by ethnicity. The respondents could respond from 1 = very bad to 5 = very good. The responses obtained are presented chronologically. Roma respondents have given the worst average values rating the quality of air from all communities with an average value of responses at The main reason for this is believed to be that there were more Roma households in Obiliq/Obilic Municipality that were included in the interview, hence, contributing to the lower scores due to slightly worse situation pertaining to quality of air in this municipality. The analysis along geographic lines indicates higher values in Fushe Kosove/Kosovo Polje than in Obiliq/Obilic, but the difference between the two is not very big. The causes of this are believed to be twofold. Firstly, most of the territory of both municipalities is affected by the Power plants in Obiliq/Obilic, particularly when favored by wind masses and there is little difference between the air quality in Obiliq/Obilic and Fushe Kosove/Kosovo Polje. Second to this, the latest investments in installing electro-filters in Kosovo A plant, has significantly improved the quality of air and lowered the presence of particles. This improvement is noted in the responses of the Obiliq/Obilic households who do not rate the overall quality of air very poorly. The recent improvements in the air quality were also noted by the municipal officials met during the visits for field work. Page 40 of 86


41 Figure 42. Evaluation of air quality by ethnicity The perceptions of respondents about the quality of soil in their immediate environment are more positive than their outlook on the quality of air. The Roma sub-group has provided lowest average scores to the quality of soil. The main reason affecting the scores in this sub-group is believed to be the considerable population size living in Plementin settlement where contamination of soil is much higher. Figure 43. Evaluation of soil quality by ethnicity Assessment of the situation pertaining to the presence of toxic substances indicates grimmest outlook of the households interviewed as compared to all environment indicators discussed in this section. The worse assessment comes from Roma households, which for reasons elaborated above, have scored lower than other communities. However even within the Roma sub-group presence of toxic substances is rated worse of all parameters asked for. Ashkali community household appear to be the most satisfied with regards to the presence of toxic waste. Given the concentration of Ashkali community in urbanized settlements, the more positive outlook is to be expected. Page 41 of 86

42 Figure 44. Evaluation of presence of toxic substances Page 42 of 86
43 4. CONCLUSIONS AND RECOMMENDATIONS The most relevant risk to be addressed is that of economic/financial security. Given the low levels of employment and formal participation in the economy. Sustainable job creation is the only long-term solution for decreasing the vulnerability for the households interviewed. Income generation appears to be key to reducing risks across all other parameters. Health and education related risks are also associated with financial implications (cost of schooling and or treatment), hence addressing this risk inevitably lead to the alleviation of other risk factors. Given the low education levels particularly among the Roma, Ashkali and Egyptian communities, the outlook for their employment is not very favorable. Given that there is already economic (though informal) activity in the recycling sector, more efforts should be made to formalize the engagement in this sector. The arguments in favor of formalizing employment, is that such step would also contribute to the increased access to finances from commercial banks. The financial/economic vulnerability for the communities analyzed comes from two aspects, insecure, instable, insufficient supply of income and the ever increasing cost of food, supplies and utility costs. The pressure from these two aspects on the communities is the most concerning financial risk for municipalities of Fushe Kosove /Kosovo Polje and Obiliq/Obilic. These two risks can be addressed only through increased formal participation in economic activity, through which aside from financial gains, social security benefits are also obtained. The most concerning aspect that makes the economic/financial risk the most pressing one is the inability of the communities surveyed to absorb potential shocks due to the lack of savings. Within the health dimension, two aspects appear to be more problematic, one pertaining to the affordability of treatment and medicine, and the other pertains to immunization. Poor financial situation is also an obstacle to visiting doctors and specialists for routine check-ups. Aside from the affordability aspect and its dependency, both risks require intervention at the central level in order to be addressed. In addition to improved supply of medicine from the list of essential medicine approved by MoH, campaigns for immunization should also be carried out continuously. With regards to immunization, creative solutions to remind parents of immunization dates should be sought. Negligence of dates appears to be an important factor for non-immunization. The supply with standard vaccines in all FHC free of charge should also be improved. Personal and collective security appears to be assessed differently by respondents in the survey. While at the personal level, respondents appear to be generally satisfied with the level of security in the settlement they live in, the ratings of collective rights for the marginalized groups are quite lower. To this end, municipal authorities in cooperation with local police forces should combine efforts in creating a friendlier environment for members of nonmajority communities. The increased presence of KP in the field would directly improve the sense of security for communities. At the political level, representation of all communities in local government institutions is essential of creating a shared ownership and trust in the system. Within the environment dimension the most poorly rated indicator was that regarding the presence of toxic substances in the immediate environment. To this end, ongoing monitoring of concentration of toxic materials should be done and health parameters of the local population measured periodically to ensure that the lives of citizens are not endangered. The measurements should be done by specialized agencies with the necessary know-how and equipment to carry out the monitoring process in ongoing basis. In terms of concrete interventions, decommissioning of the Kosova A power plant which is anticipated to occur in 2017, will improve all environmental parameters significantly. When combined with ash removal processes and removal of toxic waste from past gasification processes, the environment risk is expected to be reduced. Economic risk is also closely linked to education risks namely, affordability of education for the most vulnerable. In terms of education, the most frequent reason provided among the Roma, Ashkali and Egyptian communities for all persons under 22 years of age not attending formal education was financial difficulties in covering the costs associated with it. If analyzed into detail across the ethnicity variable, Roma (74%) report the highest percentage of Page 43 of 86
 followed by Serbian (47%) and Egyptian households (41%) who report the")
44 households reporting to have difficulties in covering the education costs of the households. Ashkali households report the second highest percentage of households having difficulties in covering educations costs (50%) followed by Serbian (47%) and Egyptian households (41%) who report the same difficulty. The lowest percentage of households experiencing difficulties in covering education costs is reported by Albanian households, whereby 35% of households within this group report to face this challenge. Below detailed overview is provided regarding the ethnic distribution of responses. Figure 45. Difficulties in covering education expenses by ethnicity To this end, aside from the arranged transportation, which is a legal obligation for municipalities, scholarship schemes should be established to prevent dropouts from school, particularly among the Roma, Ashkali, and Egyptian communities. The scholarships/programs should cover all levels of education as the difficulty of covering for costs associated with it proportionally increase with the level of education. Although not evidenced in this assessment to be a major risk factor affecting the enrollment in schooling for the communities, language aspect should be given particular attention. Supplementary language classes should be offered for pupils with problems in learning due to language barriers should such phenomena be identified. This recommendation is the most financially affordable one, as given the small number of students from some ethnic communities makes it impossible to offer education in all languages of the communities. Page 44 of 86
45 BIBLIOGRAPHY UN Trust Fund for Human Security. Human Security in Theory and Practice: Application of the Human Security Concept and the United Nations Trust Fund for Human Security Meeting of the OECD Council at Ministerial Level. Paris. OECD Strategy on Development May OECD Green Growth Studies. Putting Green Growth at the Heart of Development Management/oecd/development/putting-green-growth-at-the-heart-of-development_ en. Geeta Nanda, Kimberly Switlick and Elizabeth Lule. The World Bank: NHP Discussion Papers. Accelerating Progress towards Achieving the MDG to Improve Maternal Health: A Collection of Promising Approaches. April Gayatri Koolwal Dominique van de Walle. The World Bank. Policy Research Working Paper: Access to Water, Women s Work and Child Outcomes Craig Burnside and David Dollar. World Bank Policy Research Working Paper Aid, Policies, and Growth: Revisiting the Evidence. March UNDP. Second Millennium Development Goals Report for Kosovo pdf UNDP. Human Development Report 2013: The Rise of the South: Human Progress in a Diverse World. Kosovo Statistics Agency. Kosovo Population and Housing Census 2011: Final Results. European Centre for Minority Issues Kosovo. The Ethno-Political Map of Kosovo. Riinvest Institute. Education and Economic Development of Kosova Riinvest Institute. Improving the Kosovo Serbian Business Community Involvement In Economic Activities In Kosovo Supin Wongbusarakum and Christy Loper. Indicators to assess community level social vulnerability to climate change: An addendum to SocMon and SEM Pasifika regional socioeconomic monitoring guidelines Catherine Balsis, Marcia Greenberg, and Liz McKeon. USAID. Building Diversity: An Action plan for Integrating Gender, Youth and Ethnicity into USAID/Kosovo Program. May, USAID/Kosovo Strategic Plan May, Environmental Threats and Opportunities Assessment (ETOA). August USAID & Riinvest Institute. Labour Market and Unemployment in Kosova. USAID Kosovo. Assessment of Economic Conditions and Possible Development Projects in Northern Kosovo Page 45 of 86
46 MDC. Community Based Vulnerability Assessment: A Guide to Engaging Communities in Understanding Social and Physical Vulnerability to Disasters Page 46 of 86
47 ANNEX 1: CVA Questionnaire Questionnaire, Final Version Part I Management Section M-1 ID# of Respondent M-2 Date of interviewing conclusion: M-3 ID# of Interviewer: M-4 Interview concluded with: 1. first home visit, 2. second home visit, or 3. third home visit? M-5 Municipality M-6 Neighborhood M-7 Type of environment the family lives in 1. Capital city 3. Urban 5. Unregulated region 2. Regional Center 4. Rural M-8 External evaluation of the family house 1. New Apartment block 2. New house in good condition 3. Old house in relatively good condition 4. Destroyed or unhealthy house 5. Accommodation for refugees (camp/adapted building) 6. Other (specify).. M-9 What is the prevailing ethnic identity in the neighborhood the family lives in? 1. Roma 6. Serbian 2. Albanian 7. Turkish 3. Bosnian 8. Goran 4. Ashkali 98. Other (specify). 5. Egyptian M-10 What is the approximate distance of the household following? (Closest option) Less than 1 km 1-3 km 3-5 km 5-10 km More than 10 km a) Primary medical center (ambulance) b) General Physician c) Polyclinic d) Hospital e) Pharmacy f) CSW Page 47 of 86
48 g) Primary education institution UNDP CVA Report 2013 M-11 Code of Supervisor: M-12 Note of interviewing timescale: (interviews that take more than 99 min, note 99) Good morning/good day/good evening, I am and I work for IQ Consulting, which is contracted by the United Nations Development Program (UNDP). We are undertaking a research with vulnerable communities in Fushe Kosove/Kosovo Polje and Obiliq/Obilic, the purpose of which is to understand the conditions of the peoples lives in order to make future plans in Kosovo. The information you will give is confidential. You or your household members will not be identified by name or address in any of the reports we plan to write. Part II Questionnaire on house level Questions are directed to the family head Section 1: Household Profile Q-1a What is the first/main language you speak at home? Q-1b What other languages you use at home? Q-1a Q-1b One answer Up to 3 answers Roma language 1 1 Albanian 2 2 Bosniac language 3 3 Serbian language 4 4 Turkish 5 5 Other (specify) Refused/Does not know INTERVIEWER, FILL IN DEMOGRAPHIC PROFILE (CHART A) FOR EACH FAMILY MEMBER INTERVIEWER, FILL IN EDUCATION PROFILE (CHART B) FOR EACH FAMILY MEMBER Page 2 of 86
49 List number of family members (WRITE FAMILY HEAD WITH 1) A. Chart of Demographic Profile (to be filled in for all family members) UNDP CVA Report 2013 A-1 First name of family member (for internal identification purposes) A-2 Gender Only one answer 1. Male 2.Female A-3 Age. How old was he/she on the last birthday? (In years) (Note years on the left column, IF LESS THAN ONE, note months on the right column) Years Months A-4 Relation with head of family Only one answer 1. Head of family 2. Spouse 3.Father /Mother 4. Nephew/Niece 5. Brother s or sister s child 6. Daughter/Son 7. Father-in- Law/Mother-in-Law 8. Sister/Brother 9. Sister-in- Law/Brother-in-Law 10. Other relation 11.Non-family relation A-5 Civil Status Only one answer 1. Married 2. Divorced 3. Separated 4. Widowed 5. Free cohabitation 6. Single if 1-4 Go to A- 6 if 5-6 go to A- 7 A-6 In what year was he/she married? (first time if there were more marriages) A-7 Ethnicity Only one answer 1. Roma 2. Albanian 3. Bosnian 4. Ashkali 5. Egyptian 6. Serbian 7. Turkish 8. Goran 98. Other (specify) A-8 Where was he/she born? Only one answer 1. Kosovo 2. Serbia 3.Montenegro 4. BiH 5. Croatia 6. Slovenia 7. Macedonia A-9 Does he/she have the following documents? Only one answer 1. Birth certificate 2. ID card 3. Passport 4. None of the above 5. All of the above R/DK A-10 How was he/she born? Only one answer 1. In the hospital 2. Outside the hospital or assisted by a professional nurse 3. Outside the hospital and assisted nonprofessionally (at home) 4. other 99. R/DK A-11 Employment status Only one answer 1. Unemployed 2. Housewife/responsible for daily supplies and maintenance of the house 3. Student or in training 4. Retired 5. Working as employee, selfemployed, employer 6. Employed, but temporarily on birth leave or other leave 7. Employed in the family farm or business 8. Cannot work due to longterm disease or disability 9.Other 99. R/DK 98. Other (specify) A household members is a person who lives with the family more than 3 months a year, sharing the money with other family members and eating at least one meal per day together with other family members. Exceptions for shorter periods of time: workers and students dormitory, military institutions, freed from prison, babies, new couples, etc. Page 1 of 86
50 B. Chart of Education Profile (to be filled by all family members from 3 years of age and above) LIST CODE (From Chart A) SAVE THE CODE FOR EACH INTERVIEWED PERSON! B-1 Can the family member write and read? Only one answer 1. Yes 2. No 99. R/DK B-2 What is his/her highest obtained certificate/diploma? Only one answer 1. None, (elementary level unfinished) 2. Primary level (1-4) 3. Upper elementary level unfinished 4. Upper elementary level (5-8) 5.Secondary school unfinished 6. Vocational professional school/technical/arts 7. Gymnasium 8. Associatte (2 years) 9. Unfinished university 10. University and post university 11. Special school for persons with special needs B-3 How many years of school has he/she completed? Years B-4 Is the family member attending kindergarden, preprimary, school or training? Only one answer 1. Yes Go to B-6 2. No If from 3 to 22 years of age, go to B-5, (otherwise continue with the next member in this chart) 99. R/DK B-5 (FOR FAMILY MEMBERS OF AGE 3-22) What is the main reason he/she does not attend school now/interrupted in this level of school? (ONLY ONE ANSWER) 1. Illness 2. High costs of school (payments, transport, books, etc.) 3. Need to work/has found a job 4. Has not passed the entry exam or has failed in the previous level 5. Has finished a level of schooling does not need to attend education any longer/further 6. Problems with language 7. Marriage 8. Has been bullied or abused by other students in school 9. Distance from school 10. Concerns regarding security 11. Lack of personal documents 98. Other (specify) B-6 What type of education institution does he/she attend? Only one answer 1. State/ Public 2. Private 3. Religious 4. Technical or professional training 5. Other all of the above Go to B-8 Go to B R/DK B-7 Reason for attending the special school Only one answer 1. The child has mental disability 2. The child has physical disability 3. The family is very poor and cannot feed the child 4. The child will have a secure life (clothes, food and accomodation) 5. The school program is easier (the child will understand easier: he/she has had problems with schooling) 98. Other, specify 99. R/DK 99. R/DK Page 2 of 86
51 LIST CODE (from Chart A) SAVE CODE FOR EACH INTERVIEWED PERSON! B-8a What is the ethnic identity of his/her class friends? Only one answer 1. Most of them have the same ethnic identity as he/she 2. Most of them have another ethnic identity 3. Mixed 99. R/DK B-8b What is the ethnic identity of his/her school friends? Only one answer 1. Most of them have the same ethnic identity as he/she 2. Most of them have another ethnic identity 3. Mixed 99. R/DK B-9 How regular is his/her attendance at school or kindergarden Only one answer 1. Every day 2. Absent once per week 3. Absent more than 4 days per month 4. 4 days per month 99. R/DK B-10 How far from the house is the school OR or kindergarden he/she attends? Only one answer 1. Less than 1 km 2. From 1 to 3 km 3. From 3 to 5 km 4. From 5 to 10 km 5. More than 10 km 99. R/DK B-11 How does he/she usually go to school/ or kindergarden? Only one answer 1. Walks 2. Bycicle 3. Bus/mini-bus 4. Car 98. Other 99. R/DK B-12 Has he/she ever been abused by other students in school during the last year? Only one answer 1. Yes 2. No 99. R/DK Page 3 of 86
52 Section 2: Health UNDP CVA Report 2013 Q-2a Does the family have a doctor they can visit in cases of need? 1. Yes 2. No 99. Refused/Does not know Q-2b Do you feel safe concerning health protection do you believe you will receive service in cases of need? 1. Yes 2. Partially, depending on type of need 3. Partially, depending on household member who has the need 99. Refused/Does not know Q-3 Have there been cases during the last 12 months when your family could not afford medicine prescribed by the doctor for any of your family members? 1. Yes 2. No 99. Refused/Does not know Q-4 What is the most serious illness that any of your family members has suffered during the last 12 months? ONLY ONE ANSWER 1. Cold 8. Lice 2. Flu 9. Psychological problems 3. Back/ knee pain 10. Pneumonia 4. Injuries 11. Tuberculosis 5. Hepatitis 12. Scabies 6. Diarrhea 98. Other (specify).. 7. Poisoning 99. R/DK Q-5 Has he/she visited a doctor? 1. Yes Go to Chart C 2. No Go to Q R/DK Q-6 What has been the main reason for not visiting a doctor? ONLY ONE ANSWER OPEN ANSWER, WHERE THE INTERVIEWER CODES THE CLOSEST ANSWER 1. We could not afford to pay (very expensive) 2. Long line of waiting for treatment/check-up 3. Could not take leave from work 4. Could not go for family reasons (had to take care of the child/elderly/other family members) 5. Very far, I had no means of arriving there 6. Was afraid of the doctor/hospital/check-up/treatment 7. I wanted to wait and let itself heal up 8. I did not know any good doctor/specialist 9. I asked for help from other people (for example: alternative treatment) 10. The healthcare providers/professionals refused to treat me 98. Other 99. R/DK INTERVIEWER, FILL IN HEALTH PROFILE (CHART C) FOR EACH FAMILY MEMBER Page 1 of 86
53 C. Chart of Health Profile (to be filled by all family members) UNDP CVA Report 2013 LIST CODE (from Chart A) SAVE CODE FOR EACH INTERVIEWED PERSON! C-1 How would you rate his/her health condition in general? Only one answer 1.Very good 2. Good 3. Satisfactory 4. Bad 5. Very bad 99. R/DK C-2 Does he/she have any chronic disease? 1. Yes Go to C-3 2. No Go to C R/DK C-3 Which chronic illness does he/she suffer from? (only one answer the heaviest) 1. High blood pressure 2. Ulcer (stomach ulcer) 3. Bronchitis 4. Arthritis 5. Diabetes 6. Other heart diseases 7.. Other gastritic illnesses 8. Other skin diseases 9. Other diseases related to ailments 10. Other illnesses related to sight and hearing 11. Cancer 98. Other 99. R/DK C-4 How many days of everyday activitiy (work) did he/she miss due to an illness during the last 12 months? (any disease, not only chronic) (Days) C-5 Do you think he/she has received all standard vaccinations? (ASK IF THE MEMBER IS UP TO 14 YEARS OF AGE) 1. Yes, all END OF CHART C 2. Yes, some of them 3. Has not received vaccines Go to C R/DK C-6 Why hasn t he/she received all vaccines? (ONLY ONE ANSWER OPEN ANSWER, WHERE THE INTERVIEWER CODES THE CLOSEST ANSWER THE FIRST THAT IS MENTIONED) 1. Vaccination is not important 2. Has not been reminded of the vaccination obligation 3. Does not have access to health services 4. No free of charge vaccination available in the area 98. Other (specify) 99. R/DK Page 1 of 86
54 Section 3: Employment, unemployment and generation of money Q-7 During the year does your family cultivate and produce any of the following items consumption: Yes No R/DK Q-7a. If yes, indicate the portion that went for sale (as opposed to own consumption) % a) Vegetables b) Fruits c) Milk and dairy products d) Eggs e) Meat and meat products Q-8a. What is the amount of income (or transfers) that your family has received during the last Month? [amount in EUR] Q-8b Please tell me, what was the amount, approximately, for each of these income for the last 12 months (or transfers)? a) Salaries from employment EUR b) Social transfers EUR c) Income from other work activities EUR d) Assistance received from friends or family living outside Kosovo EUR Explanations for the interviewer: a) All types of salaries, income, bonuses, the income of all family members from business or any other work activity b) (Pensions, disability pensions, state transfers for children, including benefitions of vacation and pregnancy and children assistance; benefits of assistance for the poor and those local. Stipends and scholarships c) (income from sale of house products or other agricultural products, sale or mortgage of other personal things, or accumulated secondary materials; Money from non-formal personal activities, such as, gambling, begging, fortunetelling, etc. Q-8c Compared to the same months of the previous year, the income/transfers received during the last month is? 1. Almost similar to other months 2. More than previous months 3.Less than previous months 99. R/DK Q-9 How does your household; overall, get along in financial terms on a scale form 1 to 3(read out options for 1 to 3): 1. No relevant financial problems 2. Some difficulties (late payment of bills) 3. Severe impact on household and the life of household members(no money for food or basic items) Q-10 Does your household have problems to afford paying for: 1. Food Yes No R/DK 2. Water Yes No R/DK 3. Energy Yes No R/DK 4. Clothing Yes No R/DK 5. Transport Yes No R/DK 6. Education Yes No R/DK Page 1 of 86
55 Q-11 What is the household need that consumes the highest budget? (repeat 1 to 6 above) Q-12 What is the household need that most often cut if there is no money (repeat 1 to 6 above)? Q-13 Has any of your family members attempted to start his/her own business? 1. Yes Go to Q No Go to Q R/DK (INTERVIEWER: personal business includes any money-making activity more ore less full time, formal or informal, with the condition that the person is not an employee of someone else) Q-14 Has/is this business registered? 1. Yes still registered 2. Was registered but not anymore 3. No, was never registered 99. R/DK Q-15 In which economic sector does/did this business operate? ONLY ONE ANSWER OPEN ANSWER, WHERE THE INTERVIEWER CODES THE CLOSEST ANSWER Industry or mining 8. Public Services 2. Construction 9. Science and Education 3. Transport 10. Culture and arts 4. Trade 11. Health 5. Agriculture and forestry 12. Finance 6. Communication 13. Field of police and security 7. Other entertainment services (tourism, restaurants 98. Other,specify Cafes etc.) 99. R/DK Q-16 WHAT HAPPENED WITH THE BUSINESS? ONLY ONE ANSWER OPEN ANSWER, WHERE THE INTERVIEWER CODES THE CLOSEST ANSWER It has grown and developed 2. It has remained the same, hasn t grown nor shrunk 3. It has not been going well 4. It was sold to someone outside the family 5. It did not go well and had to be closed 98. Other (specify) R/DK Q-17 Does your family use any of the following banking services? Yes No R/DK a. Savings account b. Debit/payment card c. Timed deposit Page 2 of 86
56 d. Money transfers Q-18a Does your family have a loan or has it borrowed money? 1. Yes Go to Q-18b 2. No Go to Chart D 99. Refused Go to Chart D Q-18b If yes, where from? (more than one answer all that are mentioned) 1. Commercial Bank 2. Microfinancial Institution 3. Friends and family 4. Informal lender 98. Other (specify). 99. R/DK Q-19a What is the total amount of loans/borrowings you have currently? amount in EUR R/DK Q-19b How much do you have to pay monthly to return the load? amount in EUR R/DK Q-20 What was the purpose of the biggest loan/borrowing that you have currently? ONLY ONE ANSWER OPEN ANSWER, WHERE THE INTERVIEWER CODES THE CLOSEST ANSWER Activities generating income 2. House renovation (construction) 3. Purchase of consumption articles 4. Family reasons (death, marriage, urgent medical costs) 98. Other (specify) 99. Refused/Does not know INTERVIEWER:PLEASE, FILL IN THE CHART ON EMPLOYMENT (CHART D) FOR EACH FAMILY MEMBER, FROM THE AGE OF 10 AND ABOVE Page 3 of 86
57 KODI I RRADHITJES (nga Karta A) RUAJENI KODIN PËR ÇDO TË INTERVISTUAR! UNDP CVA Report 2013 D. Chart on Employment Profile (to be filled for all family members from the age of 10 and above) D-1 During the last month, has he/she earned any income from any source, as cash or nonmonetary means, apart from the amount he/she has acquired from other members as petty cash? 1. Yes Go to D-2a 2. No Go to D-9 if aged this is the end of Chart D D-2a From what source he/she earned the MOST during the last month? (use code box) Code D-2b Has he/she paid/contributed to the pension fund? (ASK THOSE WHO ARE THE SOURCE OF THE INCOME from 1 to 5 in D-2a) 1. Yes 2. No 99. R/DK D-3a What SECOND SOURCE has he/she had during the last month? (Second biggest source of income) (Use code box) Code D-3b (Has he/she paid/contributed to the pension fund? ASK THOSE WHO ARE THE SOURCE OF THE INCOME from 1 to 5 in D-3a) 1. Yes 2. No 99. R/DK D-4 What is the total amount he/she has earned from ALL personal income sources during the last month? [EUR] D-5 What is his/her formal position in the current job? 1. Works full time 2. Works part time 3. On and off work 4. On vacation/ill 5. Seasonal work 99. R/DK No job, go to D9 D-6 What type of contract does he/she have? 1. An unlimited period, permanent contract 2.A fixed contract of less than 12 months 3. A fixed contract of more than 12 months 4. Practicing and training (Center for Employment/Social Work, Government s program for employment) 5. Without contract/oral agreement D-7 In what field of economy has he/she worked last month? (if on vacation or ill, ask for usual work) (Use code box) Code D-8 What was his/her profession last month? (Use code box) Code 98. Other Page 1 of 86
58 LIST CODE (from Chart A) SAVE CODE FOR EACH INTERVIEWED PERSON! D-9 for how long has he/she been unemployed? (in years; if never employed, Code 888) D-10 Is he/she registered with employment services in any capacity? 1. Yes 2. No 99. R/DK D-11 Has he/she attempted to find work or establish a business during the last 4 weeks? 1. Yes Go to D No Go to D-13 UNDP CVA Report 2013 D-12. What additional activities has he/she undertaken to find work? MORE THAN ONE (MAX. 3) SPONTANEOUS ANSWER, INTERVIEWER CODES THE CLOSEST ANSWER 1. Has contracted privat agencies for employment 2. Applied in a public institution/private company 3. Has approached friends, family or other contacts 4. Has announced or replied to a newspaper or internet ad 5. Has been checking newspaper or internet ads 6. Has undergone a test or exam or is subjected to an interview 7. Has sold land or building or equipment to start up his/her business 8. Has requested permission, license or financial source to start up his/her business 9. Is expecting results of a job application 10. Is expecting a call from the Public Employment Office. 11. Has waited the results from a recruitment competition in the private sector 98. Other D-13. Has he/she looked for a job? SOLE CODE SPONTANEOUS ANSWER, INTERVIEWER CODES THE CLOSEST ANSWE 1.Will start a new job within the next 3 months 2. Waiting to be called again to work for the same employer 3. Waiting for the appropriate season 4. On and off work 5. Is tired of looking,thinks there are no jobs available 6. Is attending university/another education institution 7. Has retired 8. Housewife/housemen/full-time (24 hour) caretaker of another family member 9. On maternity leave 10. Has not been looking because of an illness or disability 11. Working on a farm or family business (unpaid family worker) 98. Other 99. R/DK 99. R/DK Page 2 of 86
59 Codes for questions D-2a & D-3a 1. Regular salary from state work/municipal or company/state enterprise 2. Regular pay from work in a company or private organization 3. Per diem from on-and-off work in institutions or state companies 4. Per diem from on-and-off in companies or private organizations 5. Income from personal business (trade, construction, sale of personal agricultural items, etc.) 6. Pension, including disability benefits, illness and benefitions for veterans 7. Unemployment benefits 8. Child support, birth benefitions, parent payments 98. Other (specify) 99. Refused/Does not know Codes for questions D-7 1. Heavy industry or mining 9. Education and science 2. Construction 10. Culture and art 3. Transport 11. Health 4. Trade 12. Non-governmental sector 5. Agriculture and Forestry 13. Finance 6. Communications 14. Field of security 7. Hospitality services 15. Other commercial services (tourism services, (e.g.hairdressers) restaurants, cafes etc.) 8. Public services 98.Other, (specify) Codes for questions D-8 1. Owner of self business 8. Semi-qualified worker 2. Enterprise manager, 9. Unqualified worker Division 10. Military 3. Proffesional 11. Civil servant (teacher, police officer) 5. Office worker 12. Farmer 6. Technician 13. Worker without land 7. Qualified worker 98. Other (specify) 99. Refused/Does not know Page 3 of 86
60 Section 4: Levels of the standard of living and economic security Q-21 a How big in square meters is the space you live in currently? (write exact m2) Q-21 b How many rooms do you have? (write exact no.of rooms) Q-22 Who is the owner of the place you live in? ONLY ONE ANSWER (can be a perception) 1. My family/family member 2. My relatives 3. Property of someone else (no relation to family) 4. Municipality/State 5. Collective center/camp 6. Unknown property 98. Other (specify). 99. Refused/Does not know Q-23a Do you pay or do you have to pay rent for the apartment/hause/space you live in? 1. Yes Go to Q-24b 2. No Go to Q R/DK Q-23b How much is the rent per month? [write exact amount in EUR] 99. Refused/Does not know Q-24 Please tell me, from the scale of 1 to 5, how concerned are you that someone might drive you out of the apartment ( 1 not concerned at all, and 5 very concerned)? 1 I am not concerned at all, to 5 very concerned R/DK Q-25 I will read you a list of household appliances and items. Could you tell me whether your family possesses these items, does not have it/them because there is no need, or does not have it/them because it cannot afford it/them? Yes No need Cannot afford R/DK a. Radio b. Refrigerator c. Stove d. TV e. Telephone f. Bicycle g. Motor Bike h. Car i. CD player j. Computer Page 1 of 86
61 k. Internet access l. Satelite antenna m. Mobile telephone n. Washing machine o. Bed for each member, including babies p. more than 30 books q. electricity generator Q-26 Does the apartment you live in have? Yes No R/DK a. Kitchen inside b. Toilet in the apartment c. Bathroom d. Sewage system e. Shower or bath inside the house f. Electricity supply Q-27a What do you cook with in your family? ONLY ONE ANSWER Q-27b How do you usually heat your house? ONLY ONE ANSWER Q-27a Cooking Q-27b Heating Gas Bottle 1 1 Supply with gas pipes 2 2 Electricity 3 3 Coal 4 4 Wood 5 5 Other (specify) 6 6 Oil 7 7 Supply with central heating 8 8 Refused/Does not know Q-28 How much money has your family approximately spent during the last month in the following articles a. Food [amount in EUR] b. Alcohol and cigarettes [amount in EUR] c. Clothes (including shoes) [amount in EUR] d. House bills (rent and public services) telephone, water, electricity) [amount in EUR] e. Medicine and health care services [amount in EUR] f. Daily items for house, e.i.: hygiene, sanitary products, etc. [amount in EUR] g. Transport [amount in EUR] h. Social events, Cafes, etc. [amount in EUR] Q-29 Compared to previous months of last year, the money your family has spent during the last month has been? 1. Almost similar to other months 2. More than other months Page 2 of 86
62 3. Less than other months 99. R/DK UNDP CVA Report 2013 Q-30 How much money has your family spent in education during the last year? In total, including school payments/tuitition fees, school books, stationery, clothes, transport, and accommodation if there was such? [amount in EUR] Q-31 Do you have debts/large payments for a.) Water supply? b.) Electricity supply? c.) Other house services, example: heating, telephone payments, etc. d.) Mortgage e.) Loan for house equipment or furniture (consumption loan) f.) Rent Q-31_1 Do you have a debt? 1. Yes Go to Q-29_2 2. No Go to next item 1. Yes Go to Q-31_2 2. No Go to next item 1. Yes Go to Q-31_2 2. No Go to next item 1. Yes Go to Q-31_2 2. No Go to next item 1. Yes Go to Q-31_2 2. No Go to Q Yes Go to Q-31_2 2. No Go to 32 Q-31_2 For how many months? months months months months months months Q-31_3 What is the amount that you owe for this? [EUR] [EUR] [EUR] [EUR] [EUR] [EUR] Q-32 During the last month, has anyone from your family fallen ill due to famine because you could not afford to buy enough food for them? ONLY ONE ANSWER 1. Never 2. Once 3. A few times (2-3) 4. Many times (4 and more times) 99. Refused/Does not know Q-33 In which of these situations do you feel you are treated with prejudice? MORE THAN ONE ANSWER. NOTE WITH The respondent does not want to disclose a) Health care 0 b) Education (Public schools) 0 c) Workpalce 0 d) Employment office 0 Page 3 of 86
63 e) Court system/police 0 f) Social services 0 g) Shops/restaurants 0 h) Public transport 0 i) Banks/Insurance companies 0 j) Owner/Local housing office 0 k) Close relation 0 l) Unknown person in public place 0 m) Other (specify) 0 None of the above 99 Section 5: Perceived Levels of security Q-34 How would you rate the following statements regarding safety and security in your dwelling? Statement I strongly agree I agree Neither agree nor dissagre e a) The neighborhood/village/ settlement is reasonably safe to walk without fear of harm from anyone at all times b) The Kosovo police is reliable and protects people regardless of their ethnicity c) I feel confident to call KP and report harm or fear of harm d) The courts take decisions without prejudice and impartially from ethnicity, race, religion, etc. e) I feel safe talking in my mother tongue when waiting in line for receiving service or product f) I feel safe to go and work with people of other ethnicity I disagree I strongly dissagree Don t know / Refuse Page 4 of 86
64 g) Children (in my household) are safe to go to school, or play outdoors without fear of harassment or abuse UNDP CVA Report Q-35 Which of the following represents the issues of highest importance for the security in your community/dwelling? Please rank top 3 priorities. Issue: Ranking: 1. Physical security / protection of marginalized groups 2. Traffick security (signs, signaling, sidewalk) 3. Public safety at night (public lights in streets) 4. Travel safety (free transportation for more remote areas, especially after dark) 5. Illicit substances (illegal drugs/narkotics) 6. Weapons/guns 7. Radical religious groups 8. Illegal prostitution and trafficking 9. Other, specify Q-36 Which of the following people would you NOT like to have as your neighbors? MULTIPLE RESPONSE; MARK WITH Category of people R/DK Family / relatives 99 Work colleagues 99 Romas* 99 Ashkali* 99 Egyptians* 99 Serbs* 99 Albanians* 99 People from other communities living in Kosovo 99 People with a different religion 99 Drug addicts 99 Homosexuals 99 Divorced 99 Unmarried couples living together 99 People living with HIV 99 Immigrants/foreign workers 99 Page 5 of 86
65 Police officers 99 Former convicts 99 * if asking for the same ethnicity as stated in A-6 add other in front Section 6: Environment Q-37a Which of the following sources is the main water source supply for your family? ONLY ONE ANSWER 1. Water tube supply inside the apartment 2. Water tube supply in the yard 3. Public pipe 4. Covered well 5. Surface water from the source 6. Rain water 7. Cisterns/Trucks 8. Buys fabricated water 98. Other (specify) R/DK Q-37b Is the water supply provided to your household adequate regarding quality and quantity? 1.Adequate quantity and quality 2. Adequate quantity but quality is inadequate 3. Adequate quality but quantity is inadequate 99. R/DK Q 38 How would you rate the following aspects of the environment around your dwelling/ settlement/ village? Environmental aspect Very good Good Neural Bad Very bad Don t know / Refuse a) Quality of air (smell, dust, dirt) b) Quality of land (pollution, vicinity to landfills, sewage, etc) c) Quality of water (public water supply, well, cisterns, etc.) d) Presence of dangerous (poisonous/toxic) substances Part III Questionnaire for individuals grown up (18+), selected randomly from the family members (18+) method of closest birthday with the day of the interview (From Chart A of Demographic Profile) Page 6 of 86
66 Q-0 Code of Individual from Chart A Q-1 Think of a situation which requires for example, for you to find money for urgent home repairs for you to find money for urgent home repairs. Who would you rely on in such a situation? Please, mention first three possibilities that come to your mind. MULTIPLE SPONTANEOUS ANSWERS interviewer does not read possibilities, but codes answers in the below list with 1,2 and 3 for the first choice, second and third respectively. a) a friend b) a family member/relative c) employer d) a rich person in the community e) institution for social assistance f) a bank g) a microfinancial institution h) Local NGO i) no one Possibilities Does not mention any of the above possibilities 99 Q-2 I will mention some institutions. For each, could you tell me which one has helped you improve your life? (Read and code answer for each column): Hepful Neutral Not R/DK helpful a) Church/Religious leaders b) Community leaders c) Media (print/tv/radio internet) d) Syndicates e) Police f) Education institutions g) Central government (in the capital city) h) Local government (in your municipality) i) Political parties j) Parliament k) Large companies l) Women organizations m) Charity or humanitarian organizations n) The European Union o) The United Nations Page 7 of 86
67 Q-3 Below is a list of situations which reflect inclusion and participation of various groups in society. Please tell me for each of them how important they are for Roma/Ashkali/Egyptian to be equal members of society. [For communities use Roma, Ashkali or Egyptian according to ethnicity described in question A-7; for non-rae sample use RAE] Situation description Very Important Not R/DK important important a) To have a minister from the communities [RAE] b) To have a mayor or deputy mayor [RAE] in the municipality where a large number of RAE live c) To have a large number of [RAE] who have finished university d) [RAE] to serve as police officers e) [RAE] to work as doctors f) [RAE] to work as teachers g) [RAE] to work in the public administration h) All children [RAE] to finish at least elementary education i) [RAE] to have same income as the majority of population j) [RAE] to have the same lifestyle as the majority of population k) Boys from the majority of population to marry [RAE] girls l) Girls from the majority of population to marry [RAE] boys m) [RAE] to learn fluently the official language n) [RAE] to reside in settlements where the majority of populations resides Q- 4 What do you think is a satisfactory level of education attainment for a child? (to be answered also by persons who have no children) AN ANSWER FOR EACH: GIRL AND BOY Level of education a) Boy b) Girl 1. Low elementary (1-4) 2. High elementary (5-8) 3.Highprofessional school/technical/arts/medicine 4. General high school (Gymnasium) 5. Associate (2 years) university 6. University or higher 10. Special school for disabled 99. R/DK Q-5 Below is a number of statements which reflect specific opinions and stereotypes for [ ]. Tell us please which ones you consider justifiable and which not [for communities use Roma, Ashkali, or Egyptian according to ethnicity described in question A-7;for non-rae sample, use RAE] Statement Not at all Justifiable Totally R/DK justifiable justifiable a) [ ] are happy and enjoy life Page 8 of 86
68 b) [ ] prefer individual freedom instead of success in life c) [ ] are dirty/not clean d) [ ] appreciate family and kids e) [ ] are lazy f) [ ] steal g) [ ] abuse the system h) [ ] can get away with some actions with which others cannot i) [ ] are very different, therefore cannot adapt in society Q-6 How acceptable do you think are the following favorable treatments: Treatments Acceptable Unacceptabl R/DK e a) additional support for a child in school if he/she does not speak instruction language/language of teaching in school b) scholarships for children who come from poor families c) financing someone with the purpose of employing a person from the discriminated groups d) specification in the law for the number of students accepted in high schools and universities from the discriminated groups (quote on education of discriminated groups) e) specification in the law for the minimal number of employed from the discriminated groups, employed in the public sector (quote on public employment of discriminated groups) Q-7 In what age approximately you think it is fair to (to be answered by man and woman): (Code 888 for never, code 99 for R/DK) a) Stop schooling b) Start work to earn money d) Start sexual life e) Get married f) Have children g) Move out of parents house Q-14_1 Age for women Q-14_2 Age for men Q-8 Which of the following is the way through which your personal situation would improve? MULTIPLE ANSWERS (MAX. 3) 1. Get a job in agriculture 2. Get a job in industry 3. Get a job in the services or trade sector 4. Increase my education level 5. Get financial support from state institutions 6. Get financial support from international organizations 7. Get financial support from relatives living abroad Page 9 of 86
69 8. Go abroad to work 9. Go abroad to study 10. Satisfied with my personal situation; I have no need to improve it 98. Other (specify) R/DK INTERVIEWER, PLEASE WRITE TIMESCALE OF THE INTERVIEW, M-16 TOP OF THE QUESTIONAIRE Read concluding Statement: "Thank you for your participation in the research. Do you have any questions? In the coming days my supervisor might contact you to verify the quality of my work and answer any questions you might have regarding the interview. In order to assist him/her to do this, can you give us your phone number?" Information of the interviewed person: Name: Address: Tel. No. Certification of interviewer: "I declare I have concluded this interview in accordance with the instructions given to me by " Name: Signature: Date: Part I MANAGEMENT SECTION M-13 Interviewer: Code number of people present during the interview, including yourself and the person interviewed: M-14 Interviewer (Only for sub-sample RAE): According to your opinion what group does the respondent belong to? 1. Roma 2. Albanian 3. Bosnian 4. Ashkali 5. Egyptian 6. Serbian 7. Turkish 8. Goran 98. Other (specify). Page 10 of 86
70 M-15 Interviewer: Please list the following aspects from 1 as Very Bad, to 5 as Very Good. a) Quality of information b) Mood during the interview c) Interior of the house-property d) Exterior (and surrounding) To be completed by the Supervisor: M-16 Interview, part of Back Check/Control 1. Yes 2. No M-17 Method of Back-check/Control 1. Direct supervision during the interview 2. Direct Back-check from the supervisor 3. Back-check with telephone from the supervisor of head of office 4. It is not part of back-check Page 2 of 86
71 ANNEX 2: Terms of Reference for the Assignment Building a better future for citizens of Fushë Kosovë/Kosovo Polje and Obiliq/Obilić: Participation, Protection, and multi-ethnic Partnerships for improved education, health and sustainable livelihoods Community Vulnerability Assessment (CVA) Duration: 12 weeks Expected Starting Date: As soon as possible Duty Station: Kosovo Background: Through the joint5 project Building a better future for citizens of Fushë Kosovë/Kosovo Polje and Obiliq/Obilić, the UN Kosovo Team (UNKT) aims to empower and fully mobilize all communities in the municipalities of Fushe Kosove/Kosovo Polje and Obiliq/Obilić by providing support to the most vulnerable among the Roma, Ashkali, Egyptians, Albanian and Serb communities, as well as IDPs and other groups who experience multiple dimensions of human insecurity and are at risk of social exclusion. The objective of the planned interventions is to decrease the vulnerability and human security risks that these communities face. By using the Human Security Multi-Sectorality and Externalities Framework as a strategic tool that supports relevance and coherence among interventions, the project contributes to improving the living conditions of concerned communities, promotes a tolerant and multi-ethnic climate, self-reliance, participation, protection, as well as access to education, health, and sustainable livelihoods. The project focuses on multiple critical human security challenges (economic, health, environmental, and community security) by using three main entry-points: (i) Stimulating livelihood opportunities for those least able to participate in the labour market (with a focus on those most at risk of labour market exclusion among vulnerable groups, such as RAE, youth and women), by promoting work-readiness, learning skills and improved social protection; (ii) Improving the health prospects of those most at risk from environmental and lifestyle hazards in two of Kosovo s most polluted and poorest municipalities; (iii) Providing immediate benefits to communities (such as support to livelihood generation) which will be balanced with longer-term preventative measures in health, education and participatory decision making to ensure sustainability through capacity-development, partnership, and ownership. The multi-ethnic context in which the project operates (see Table 1) is characterized by socio-economic indicators that point in the direction of fragile human development, with recurrent insecurity and the need to promote more equity and sustainability in the results. Page 3 of 86

72 Kosovo institutions have made a commitment to the promotion and protection of the rights of communities offering them new opportunities for improved governance and institutional arrangements, also through the process of decentralization. The UNKT supports this overall effort. Furthermore, together with participating UN agencies, the project enhances municipal competencies through internal and external communication, coordination, and intermunicipal partnerships among target municipalities. The tools and approaches developed through this project can be transferred to other areas where there is UNKT presence and where focus on human security needs to be enhanced. In this context, the UNKT intends to commission a Community Vulnerability Assessment (CVA), in order to develop broad and relevant baseline data about environmental and social vulnerability and exclusion in Fushe Kosove/Kosovo Polje and Obiliq/Obilić. As the project emphasizes the social and environmental challenges (both of which feed into the health assessments) in the communities, the data would be extremely useful for assessing the linkages between social determinants and environmental inequality. Moreover, the provision of reliable baseline information will support the articulation of a detailed Monitoring and Evaluation Framework for the project, guide implementation, and facilitate the impact assessment of other future interventions in these communities. 1. Overall Objective of the Community Vulnerability Assessment The Community Vulnerability Assessment (CVA) is meant to serve as a tool to support multi-stakeholder planning of the strategies and responses needed to address multidimensional challenges related to inequality, poverty, and social exclusion in the two target municipalities. Social exclusion in this context is understood as a result of multiple and mutually reinforcing deprivations in the main Human Security dimensions: Economic, Food, Health, Environmental, Personal, Community and Political. Social exclusion limits the opportunities of individuals to exercise the full range of their choices and thereby constraints their access to rights. The Community Vulnerability Assessment will follow the Human Security Analytical Framework to Needs/Vulnerabilities and Capacity Analysis. It will map insecurities based on actual vulnerabilities and capacities, establish priorities through vulnerability and capacity analysis, and identify the root-causes of insecurities and their inter-linkages. According to the Human Security Analytical Framework to Needs/Vulnerabilities and Capacity Analysis, the goals of the analysis, mapping and planning phase are to: (i) Collectively identify the needs/vulnerabilities and the capacities of the affected communities and develop project priorities in consultation with the affected communities; (ii) Identify the root causes of insecurities and their inter-linkages across sectors, and establish comprehensive responses that generate positive externalities for the affected communities. (iii) Ensure coherence on the goals and the allocation of responsibilities among the various actors; and (iv) Include short, medium, and long-term strategies. Page 4 of 86
73 In line with these goals, a CVA needs to be designed to provide reliable quantitative and qualitative base-line data on key indicators related to social and environmental vulnerability and exclusion in the selected municipalities. The CVA will provide data that can be matched with contextual information and validated by qualitative information that will be gathered from the Municipality institutions. The CVA data will allow an estimation of the risk of social exclusion (based on the Human Security individual vulnerability criteria), and an understanding of the contextual drivers of poverty and exclusion. Based on the mapping, the inter-linkages and dynamics among the various threats, vulnerabilities and capacities are identified. Page 5 of 86
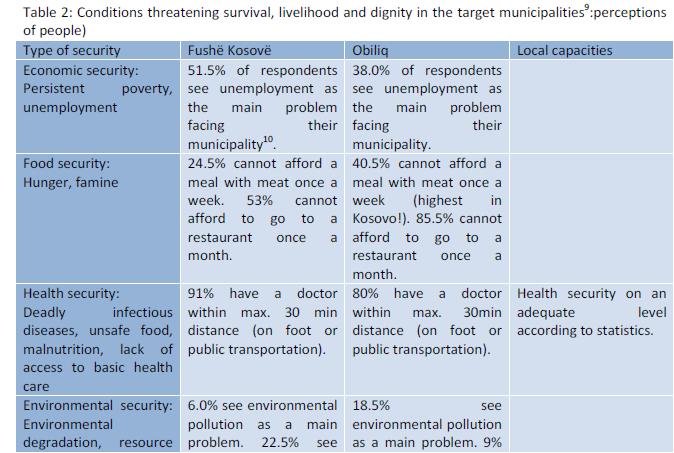
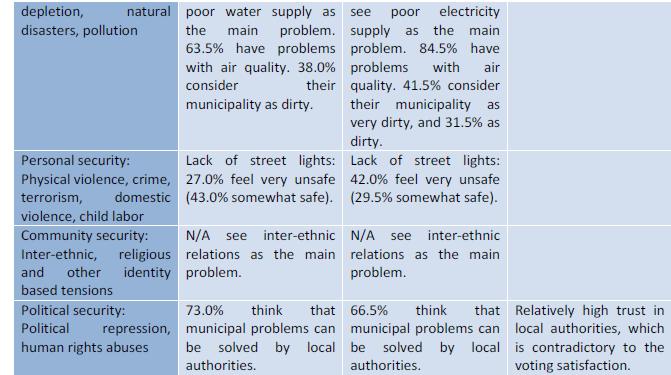
74 Page 6 of 86

75 2. Methodology for the Community Vulnerability Assessment The methodology for the CVA shall consist of a combination of different tools and approaches, including desk research, focus groups, and surveys. Steps in the CVA could include: 1) Interviews/survey with residents, focus groups and review of existing analysis (such as Kosovo Mosaic 2012) in each community to prepare a narrative of how they interpret their situation with regard to each dimension of Human Security; 2) Based on the narratives, preparation of a vulnerability analysis framework (needs/capabilities) 3) Based on steps 1) and 2) above, select some useful and reliable indicators and variables. Indicators and variables should be identified to measure exposure, sensitivity and adaptive capacity aspects of vulnerability. These indicators and variables should be considered useful and reliable by both communities and institutions as they are built from the narratives developed with them At a minimum, the CVA should provide information on the following variables and parameters: Page 7 of 86

76 The Community Vulnerability Assessment will target individuals most at risk of social exclusion. The primary units of analysis and the units of observation are the households and local institutions. Page 8 of 86
77 The Community Vulnerability Assessment survey will be based on face-to-face interviews (a specifically designed questionnaire to be elaborated along with other survey and administrative data collected by relevant institutions. A local, Kosovo-based company will be contracted to develop the questionnaire and conduct entire Community Vulnerability Assessment survey. The WHO Program on Environmental Exposures and Risks will directly contribute to the development and design of the questionnaire with a set of questions that will be incorporated by the selected company for this assignment CVA survey instrument The Community Vulnerability Assessment will cover the Fushe Kosove/Kosovo Polje and Obiliq/Obilić municipal areas. The survey instrument will build on the Human Security Analytical Framework to Needs/Vulnerabilities and Capacity Analysis Sampling methodology The selected company should propose a relevant sampling methodology ensuring a representative sample for each municipality. Individuals will be sampled (at a minimum 1,000 per each municipality) but data shall be collected at household level using the respondents as the mean to enter the household. Health data should be collected for each household member 2.3. Pilot survey After the draft version of the questionnaire has been assembled, and translated into local languages, it will be tested in the field. A pilot Community Vulnerability Assessment should be conducted in order to test the questionnaires. Approximately, 30 pilot interviews should be conducted. Based on the results of the pilot survey, in collaboration with UNKT, the final version of the survey questionnaires will be prepared Field work The contracted company shall ensure that sufficient number of interviewers and supervisors are being involved in the survey for conducting the field work in a timely manner and demonstrating a high level of quality. In order to ensure the high quality of the collected data, field work control will be conducted. Quality control Report will include back-check by control with at least 20% of interviews in order to check whether interviews took place according to standards. The contracted company will provide the UNKT Program Coordinator and UNKT Program Technical team with the materials and the field work control report Data processing The selected company will be responsible for data entry and data processing (preferably through SPSS or SPSScompatible software). The contracting company will produce output statistical tables as defined by UNKT Project Coordinator and UNKT Project Technical team Analysis of the data and elaborating of the final report Analysis of the findings of the CVA will be done by highly qualified team of experts representing all relevant fields of expertise together with the UNKT Agency members. In this respect, the Community Vulnerability Assessment final report will provide reliable quantitative and qualitative base-line data on key indicators related to social vulnerability and exclusion in the selected Municipalities along with multidimensional analysis of social exclusion. Page 9 of 86
78 2.7. Future Use of Data The completed dataset will be the property of UNKT. The contracted company may not use the data for their own purposes, nor license the data to be used by others, without the written consent of UNKT. 3. Deliverables The contracting company will deliver the following (all deliverables provided in electronic and paper copies): 1. Final Community Vulnerability Assessment questionnaire in electronic form (English, Albanian and Serbian language) 2. Complete dataset (in electronic format only)on CD in SPSS software. 3. Quality control Report will include back-check report-20% of response 4. Technical report (Frequency distributions, tables and graphs) with stratified data based on age, gender, ethnicity, education, employment, etc (see Table 3). 5. Separate Municipal profile reports with divided data sets, stratified data based on age, gender, ethnicity, education, employment, etc (see Table 3). 6. Report on conducted activities, including the report on field work quality control 7. The overall final combined technical and narrative report describing the process and results of the conducted research, 4. Schedule The work should proceed along the following schedule within the 3-month period: Week 1 (after signing the contract): completion of the questionnaire in its source version; completion of sampling design Week 2: translating the questionnaire into the relevant local languages including modification and fine-tuning of the versions in different languages; ; preparation of the pilot testing Week 3: Pilot testing of the survey questionnaire; final modifications of the questionnaire; printing of the modified questionnaires; Weeks 4-8: data gathering (questionnaires, sample groups, interviews) Week 9: data processing (entry, cleanup, logical checks) Week 10: focus groups and collection of qualitative information Week 11-12: final submission of deliverables 5. Eligibility Criteria The contracted company is required to have: Demonstrated experience with similar multi-dimensional surveys Previous successful experience in implementing of at least Kosovo wide/region wide surveys A well-developed and actively maintained network of highly qualified interviewers across Kosovo A well-functioning system of field work control (good performance previously demonstrated) Good record in working with vulnerable groups, including RAE communities The data collection team should have proven experience in successful conduction of similar surveys Page 10 of 86
79 Proven experience of personnel in development of survey questionnaires, Sampling methodology and data processing Demonstrated ability to operate in English, Albanian and Serbian languages Team Leader (TL) Masters degree in social science or relevant field The TL must have expertise and experience in statistical systems The TL must have strong skills of overseeing and monitoring similar surveys with the aim of achieving the maximum quality of outputs, through provision of: c) Quality control of field work d) Quality check of data entry and analyses Proven experience of report writing in English Request for Proposals: For applications to this RFP, the applying organization should submit two separate offers, one for Technical Proposal and one for Price. Technical Offer should include the following documents: 1. Expertise of institution/ organization The brief background of the organization, not more than 1 page. 2. Proposed Work Plan and Approach A proposal of the work-plan for the conducting one survey and writing the report. Work-plan should include: Process of sampling Process of conducting the survey, Quality check, Data entry and analyses Preliminary report writing Work plan should indicate the activity, input, and dates for corresponding activity (timeline). 3. Personnel The proposed team names and CV s of candidates for the team and their position within the team are required. Price Offer should be in the separate envelope and should indicate the budget for the entire project. Offers should be delivered in two separate enclosed envelopes to UNDP Kosovo Office by the 23rd of January Payment and Contact: The successful company/organization will enter into an institutional contract with UNDP Kosovo and be paid according to the terms of contract and agree upon price. All offers should be quoted in Euros. Page 11 of 86
80 ANNEX 3: Interviewer s Manual Introduction You have been selected as one of the interviewers for implementing the Community Vulnerability Assessment in Kosovo. This survey will provide UNDP with information about the vulnerability of communities in municipalities of Fushe Kosove/Kosovo Polje and Obilic/Obiliq. Survey Description Topics covered Given that welfare is broken down into different dimensions, the survey includes several topics that need to be investigated upon. The topics include information about expenses, property ownership, education, health, environment, security, employment and discrimination. Furthermore, each of the individual aspects of welfare of a household cannot be understood properly without being put into the overall framework for analysis. This information can only be obtained by household members through interviews at their home.. The survey includes several sections: Section 1: Household profile (Demographics) o Card A: Demographic Profile o Card B: Education Profile Section 2: Health o Card C: Health Profile Section 3: Employment, Unemployment and income generation. o Card D: Employment Profile Section 4: Standard of living and economic security The part for Individuals Section 5: Perceived level of Security Section 6: Environment Implementing Agency Community Vulnerability Assessment was commissioned by UNDP in Kosovo and is being implemented by IQ Consulting. The survey will be carried out in Fushe Kosove/Kosovo Polje and Obiliq/Obilic. The research sample includes 2,000 households (1,000 in each municipality). According to ethnicity, the sample is stratified as follows: Fushë Kosovë/Kosovo Polje Albanian (400 households) RAE (450 households) Page 12 of 86
81 Serb (150 households) Obiliq/Obilic Albanian (400 households) RAE (450 households) Serb (150 households) The survey should be completed in a two-week period. You are one of the 26 interviewers that will carry out the field work. Your work will be monitored in the field by the Field Controller. The additional role of the Field Controller is to assist you in resolving problems that can be potentially encountered during field work. Research Sample Inclusion in the survey You and your colleagues will be working in pre-determined zones during the field work. Households suitable for inclusion in the survey include all people living in private, urban or rural zones. Within the selected households, you are to collect information about all their members in the questionnaire sections that require doing so. However, please bear in mind that some of the questions in the survey need to be completed only by some of the members of the family (depending on the age and gender). Overall, it is the Household head, supported by other members of the household that needs to provide the answers at the household level. Exclusion from survey Respondents that are NOT to be included in the survey are the following: All persons living outside the pre-determined zones (be that urban or rural) All persons living in non-private settlements (i.e. hospitals, prisons, military barracks). Selection rules A Household can be a person that lives alone or a group of persons with or without kinship ties that live as one unit (meaning: they share or rely on a joint budget). A standard definition of a household is A group of persons living together, that pool their income and eat at least one meal together on daily basis. In most cases, the person not living in the household at the time when the interview is conducted is not considered as a household member. This category of persons includes all persons formerly living in the household, but who have left it without an intent to return (i.e. Transferred after getting married, transferred to another location to find work, etc.) It is important to note that household members are not necessarily linked to one-another through kinship and/or marriage. Furthermore, not everyone that are linked to one-another and live in the same settlement should be considered as one single household. Two brothers that may live in the same settlement with their wives and children, may or may not represent one household, depending whether they share budgets. If they are not, they should be considered as two separate households. Page 13 of 86

82 You should differentiate between a family and a household. The first refers to a social relation, blood connection, and marriage. The latter (in our case) is used to identify an economic unit. Although families and households are often the same thing, it is not always like that. You need to be careful and use the given criteria to determine membership in the households. The Household Head is the person considered by the other members as their head. Usually, the Head provides for the biggest source of income and is the main decision-maker in the household, but you need to accept the decision of household members on who is their leader. There should be only ONE household head. If more than one individual within a household pretends that he/she is the head, or when members disagree on who is the Head of the Household, there is great likelihood that the unit represents more than one household. After determining who is the household head, you can proceed with determining the household members. It is important to note that individuals living in the household for more than three months and live together with other members under the guidance/leadership of the Head, are to be considered as members of the household, even if they are not family-related. Nevertheless, servants or workers, as well as tenants, (persons paying rent to live in the house) should not be considered as members of the household if they have share costs of living with other households. Selection of the Households Always write down the number of the house where the interview is carried out. (If you were supposed to interview the fifth household, but you were only able to interview the eighth, write down 8th). Determining starting point. The main entry point in the neighborhood/settlement. The starting point remains the same even when you return to the community/neighborhood for the second time. Moving around the isolated communities/settlements, and those situated in the suburbs of concentrated neighborhoods. Step 1: Find a starting point, the correct side of the street and the direction in which you are supposed to continue. Orient yourself in the street besides the first house facing the interview zone. Choose the side of the street on your right and walk towards the end of the street. Step 2: Find the first door to knock. This will be the third house/apartment. Start count from the starting point. Every house that is not more than 20 meters from the street is included in the count. Those further than 20 meters should not be considered as being in the same street. Fig. 1 If a house has more than one entries, you will Page 14 of 86

. Fig. 2 Fig. 3 Step 3: Proceeding with identifying the other households.")
 and continue with the right hand side rule.")

83 use the one that is in the main street. If there is no such entry, you will use the one on your right hand side. In the case of apartment buildings, one apartment is counted as one household. Go to the top floor of the building. Go to the apartment closest to the stairs in your right hand side that will be apartment 1. Find the third apartment by moving counterclockwise in the floor. Always start the count from the stairs (even in cases when you use elevator). Fig. 2 Fig. 3 Step 3: Proceeding with identifying the other households. Continue counting the households on your right hand side. If you reach an intersection, turn right, stay on the right hand side and continue numbering. It can occur that you will return to the starting point. In such case, continue to Moon Street (see illustration) and continue with the right hand side rule. If you have exhausted all possibilities and still need households, go to the starting point, but this time, change the every third house rule. So that other households can be interviewed. Do not turn left or go to the left hand side of the street. There is only one exception to this rule: dead-end streets, (dead-end streets are also streets that go outside towns, or those that cross the boundaries between town and suburbs). In such cases proceed as instructed in the illustration. When you exit the dead-end street, continue on your right. Moving around communities, informal and isolated settlements In Page 15 of 86
ANNEX 1: Data Sources and Methodology
 ANNEX 1: Data Sources and Methodology A. Data Sources: The analysis in this report relies on data from three household surveys that were carried out in Serbia and Montenegro in 2003. 1. Serbia Living Standards
2018 NATIONAL PLATFORM ON ROMA INTEGRATION MONTENEGRO
 European Union Roma Integration 2020 is co-funded by: 2018 NATIONAL PLATFORM ON ROMA INTEGRATION MONTENEGRO 30 May 2018, Podgorica :: POLICY RECOMMENDATIONS :: INTRODUCTION The third National Platform
THE WELFARE MONITORING SURVEY SUMMARY
 THE WELFARE MONITORING SURVEY SUMMARY 2015 United Nations Children s Fund (UNICEF) November, 2016 UNICEF 9, Eristavi str. 9, UN House 0179, Tbilisi, Georgia Tel: 995 32 2 23 23 88, 2 25 11 30 e-mail:
ESPRI Hempstead- needs assessment survey
 ESPRI Hempstead- needs assessment survey February 14, 2018 ESPRI HEMPSTEAD- NEEDS ASSESSMENT SURVEY - FEBRUARY 14, 2018 1 Contents I. Introduction.....2 II. Executive Summary... 3 III. Methodology... 4
Hüsnü M. Özyeğin Foundation Rural Development Program
 Hüsnü M. Özyeğin Foundation Rural Development Program Bitlis Kavar Pilot Final Impact Evaluation Report (2008-2013) Date: March 5, 2014 Prepared for Hüsnü M. Özyeğin Foundation by Development Analytics
Human Development Indices and Indicators: 2018 Statistical Update. Dominica
 Human Development Indices and Indicators: 2018 Statistical Update Briefing note for countries on the 2018 Statistical Update Introduction Dominica This briefing note is organized into ten sections. The
Human Development Indices and Indicators: 2018 Statistical Update. Nigeria
 Human Development Indices and Indicators: 2018 Statistical Update Briefing note for countries on the 2018 Statistical Update Introduction Nigeria This briefing note is organized into ten sections. The
CONTENT ANNEX... 1 CONTENT... 2 ANNEX A TABLES... 6 HOW TO READ SMMRI TABLES DEMOGRAPHY...
 ANNEX Content CONTENT ANNEX... 1 CONTENT... 2 ANNEX A TABLES... 6 HOW TO READ SMMRI TABLES... 7 1 DEMOGRAPHY... 8 DEMOGRAPHIC CHARACTERISTICS OF CITIZENS... 8 Table 1.1 Structure of Citizens by Age, 2003...
Evaluation of the Uganda Social Assistance Grants For Empowerment (SAGE) Programme. What s going on?
 Programme. What s going on?") Evaluation of the Uganda Social Assistance Grants For Empowerment (SAGE) Programme What s going on? 8 February 2012 Contents The SAGE programme Objectives of the evaluation Evaluation methodology 2 The
Evaluation of the Uganda Social Assistance Grants For Empowerment (SAGE) Programme What s going on? 8 February 2012 Contents The SAGE programme Objectives of the evaluation Evaluation methodology 2 The
Human Development Indices and Indicators: 2018 Statistical Update. Russian Federation
 Human Development Indices and Indicators: 2018 Statistical Update Briefing note for countries on the 2018 Statistical Update Introduction This briefing note is organized into ten sections. The first section
Human Development Indices and Indicators: 2018 Statistical Update. Brazil
 Human Development Indices and Indicators: 2018 Statistical Update Briefing note for countries on the 2018 Statistical Update Introduction Brazil This briefing note is organized into ten sections. The first
Human Development Indices and Indicators: 2018 Statistical Update. Costa Rica
 Human Development Indices and Indicators: 2018 Statistical Update Briefing note for countries on the 2018 Statistical Update Introduction This briefing note is organized into ten sections. The first section
Human Development Indices and Indicators: 2018 Statistical Update. Switzerland
 Human Development Indices and Indicators: 2018 Statistical Update Briefing note for countries on the 2018 Statistical Update Introduction Switzerland This briefing note is organized into ten sections.
Human Development Indices and Indicators: 2018 Statistical Update. Congo
 Human Development Indices and Indicators: 2018 Statistical Update Briefing note for countries on the 2018 Statistical Update Introduction Congo This briefing note is organized into ten sections. The first
Human Development Indices and Indicators: 2018 Statistical Update. Argentina
 Human Development Indices and Indicators: 2018 Statistical Update Briefing note for countries on the 2018 Statistical Update Introduction Argentina This briefing note is organized into ten sections. The
Human Development Indices and Indicators: 2018 Statistical Update. Turkey
 Human Development Indices and Indicators: 2018 Statistical Update Briefing note for countries on the 2018 Statistical Update Introduction Turkey This briefing note is organized into ten sections. The first
Human Development Indices and Indicators: 2018 Statistical Update. Belgium
 Human Development Indices and Indicators: 2018 Statistical Update Briefing note for countries on the 2018 Statistical Update Introduction Belgium This briefing note is organized into ten sections. The
Human Development Indices and Indicators: 2018 Statistical Update. Peru
 Human Development Indices and Indicators: 2018 Statistical Update Briefing note for countries on the 2018 Statistical Update Introduction Peru This briefing note is organized into ten sections. The first
Human Development Indices and Indicators: 2018 Statistical Update. Uzbekistan
 Human Development Indices and Indicators: 2018 Statistical Update Briefing note for countries on the 2018 Statistical Update Introduction Uzbekistan This briefing note is organized into ten sections. The
Serbia. Country coverage and the methodology of the Statistical Annex of the 2015 HDR
 Human Development Report 2015 Work for human development Briefing note for countries on the 2015 Human Development Report Serbia Introduction The 2015 Human Development Report (HDR) Work for Human Development
Montenegro. Country coverage and the methodology of the Statistical Annex of the 2015 HDR
 Human Development Report 2015 Work for human development Briefing note for countries on the 2015 Human Development Report Montenegro Introduction The 2015 Human Development Report (HDR) Work for Human
Eswatini (Kingdom of)
") Human Development Indices and Indicators: 2018 Statistical Update Briefing note for countries on the 2018 Statistical Update Introduction (Kingdom This briefing note is organized into ten sections. The
Human Development Indices and Indicators: 2018 Statistical Update Briefing note for countries on the 2018 Statistical Update Introduction (Kingdom This briefing note is organized into ten sections. The
Human Development Indices and Indicators: 2018 Statistical Update. Paraguay
 Human Development Indices and Indicators: 2018 Statistical Update Briefing note for countries on the 2018 Statistical Update Introduction Paraguay This briefing note is organized into ten sections. The
NATIONAL SOCIAL REPORT Estonia
 NATIONAL SOCIAL REPORT 2014 Estonia Table of contents Introduction... 3 A decisive impact on the eradication of poverty and social exclusion... 3 Recent reforms in social inclusion policies... 4 People
Implementing the SDGs: A Global Perspective. Nik Sekhran Director, Sustainable Development Bureau for Policy and Programme Support, October 2016
 Implementing the SDGs: A Global Perspective Nik Sekhran Director, Sustainable Development Bureau for Policy and Programme Support, October 2016 SITUATION ANALYSIS State of the World today Poverty and Inequality
Fighting Hunger Worldwide. Emergency Social Safety Net. Post-Distribution Monitoring Report Round 1. ESSN Post-Distribution Monitoring Round 1 ( )
") Emergency Social Safety Net Post-Distribution Monitoring Report Round 1 ESSN Post-Distribution Monitoring Round 1 ( ) Table of Contents 1. Introduction 3 2. Approach, methodology and Data 3 2.1. Method
Emergency Social Safety Net Post-Distribution Monitoring Report Round 1 ESSN Post-Distribution Monitoring Round 1 ( ) Table of Contents 1. Introduction 3 2. Approach, methodology and Data 3 2.1. Method
How s Life in Brazil?
 How s Life in Brazil? November 2017 The figure below shows Brazil s relative strengths and weaknesses in well-being, with reference both to the OECD average and to the average outcomes of the OECD partner
Briefing note for countries on the 2015 Human Development Report. Lesotho
 Human Development Report 2015 Work for human development Briefing note for countries on the 2015 Human Development Report Lesotho Introduction The 2015 Human Development Report (HDR) Work for Human Development
Poverty and Inequality in the Countries of the Commonwealth of Independent States
 22 June 2016 UNITED NATIONS ECONOMIC COMMISSION FOR EUROPE CONFERENCE OF EUROPEAN STATISTICIANS Seminar on poverty measurement 12-13 July 2016, Geneva, Switzerland Item 6: Linkages between poverty, inequality
Tracking Government Investments for Nutrition at Country Level Patrizia Fracassi, Clara Picanyol, 03 rd July 2014
 Tracking Government Investments for Nutrition at Country Level Patrizia Fracassi, Clara Picanyol, 03 rd July 2014 1. Introduction Having reliable data is essential to policy makers to prioritise, to plan,
Oman. Country coverage and the methodology of the Statistical Annex of the 2015 HDR
 Human Development Report 2015 Work for human development Briefing note for countries on the 2015 Human Development Report Oman Introduction The 2015 Human Development Report (HDR) Work for Human Development
BASELINE SURVEY OF MINORITY CONCENTRATION DISTRICT. Executive Summary of Leh District (Jammu and Kashmir)
") BASELINE SURVEY OF MINORITY CONCENTRATION DISTRICT Background: Executive Summary of Leh District (Jammu and Kashmir) The Ministry of Minority Affairs (GOI) has identified 90 minority concentrated backward
BASELINE SURVEY OF MINORITY CONCENTRATION DISTRICT Background: Executive Summary of Leh District (Jammu and Kashmir) The Ministry of Minority Affairs (GOI) has identified 90 minority concentrated backward
AT KAARVAN CRAFTS FOUNDATION INSTITUTES - BAHAWALPUR & GUJRANWALA
 IMPACT EVALUATION STUDY PSDF s Funded Skills For Employability 16, (April 16 - June 16) AT KAARVAN CRAFTS FOUNDATION INSTITUTES - BAHAWALPUR & GUJRANWALA INTRODUCTION The Monitoring, Evaluation and Research
Monitoring Poverty in rural Nicaragua through the Community Based Monitoring System: A SDGs and MPI report.
 Monitoring Poverty in rural Nicaragua through the Community Based Monitoring System: A SDGs and MPI report. Milagros Romero NITLAPAN CENTRAL AMERICAN UNIVERSITY UCA June 12, 2018 2018 PEP Annual Conference,
OPERATIONAL PROGRAMME under THE FUND FOR EUROPEAN AID TO THE MOST DEPRIVED
 OPERATIONAL PROGRAMME under THE FUND FOR EUROPEAN AID TO THE MOST DEPRIVED 2014-2020 1. IDENTIFICATION (max. 200 characters) The purpose of this section is to identify only the programme concerned. It
Management response to the recommendations deriving from the evaluation of the Mali country portfolio ( )
") Executive Board Second regular session Rome, 26 29 November 2018 Distribution: General Date: 23 October 2018 Original: English Agenda item 7 WFP/EB.2/2018/7-C/Add.1 Evaluation reports For consideration
Executive Board Second regular session Rome, 26 29 November 2018 Distribution: General Date: 23 October 2018 Original: English Agenda item 7 WFP/EB.2/2018/7-C/Add.1 Evaluation reports For consideration
Educational and Health Status of Scheduled Tribes of Solabham Village in G. Madugula Mandal of Visakhapatnam District, Andhra Pradesh
 Educational and Health Status of Scheduled Tribes of Solabham Village in G. Madugula Mandal of Visakhapatnam District, Andhra Pradesh D. PULLA RAO Department of Economics, Andhra University, Visakhapatnam
Overview of PADR process
 SECTION 3 Overview of PADR process PADR is a methodology for use at community level. It involves active engagement, with the community, in a process to explore the risks they face and the factors contributing
Appendix 2 Basic Check List
 Below is a basic checklist of most of the representative indicators used for understanding the conditions and degree of poverty in a country. The concept of poverty and the approaches towards poverty vary
ASIAN DEVELOPMENT BANK
 ASIAN DEVELOPMENT BANK TAR:INO 34147 TECHNICAL ASSISTANCE (Cofinanced by the Government of the United Kingdom) TO THE REPUBLIC OF INDONESIA FOR INTEGRATION OF POVERTY CONSIDERATIONS IN DECENTRALIZED EDUCATION
CONSUMPTION POVERTY IN THE REPUBLIC OF KOSOVO April 2017
 CONSUMPTION POVERTY IN THE REPUBLIC OF KOSOVO 2012-2015 April 2017 The World Bank Europe and Central Asia Region Poverty Reduction and Economic Management Unit www.worldbank.org Kosovo Agency of Statistics
Roma Integration 2020
 Roma Integration 2020 is co-funded by the European Union Roma Integration 2020 Reference number: 018-018 Terms of Reference: Title: Contracting Authority: RCC Department: Reporting to: Application Deadline:
Uzbekistan Towards 2030:
 Uzbekistan Towards 23: A New Social Protection Model for a Changing Economy and Society Uzbekistan Towards 23: A New Social Protection Model for a Changing Economy and Society The study is financed by
Time-use by age and gender: the case of Serbia
 Distr.: General May 1 English Economic Commission for Europe Conference of European Statisticians Work Session on Gender Statistics Vilnius, Lithuania 1-3 June 1 Item of the provisional agenda (Work-life
The Health in Wealth. Brenna Sloan
 The Health in Wealth Brenna Sloan 1 It is unfortunate that the value of being healthy is often not realized until an individual (himself or herself) or someone close to them has their health compromised.
How s Life in Colombia?
 How s Life in Colombia? November 2017 The figure below shows Colombia s relative strengths and weaknesses in well-being, with reference to both the OECD average and the average outcomes of OECD partner
The Report of Transnational Survey Concerning on Expectations and Visions of Elderly Care Among People Ranging in Age from 50 to 59 Years
 The Report of Transnational Survey Concerning on Expectations and Visions of Elderly Care Among People Ranging in Age from 50 to 59 Years Finland, the Netherlands, Poland and Hungary 28.1.2004 Toward Active
Preliminary data for the Well-being Index showed an annual growth of 3.8% for 2017
 7 November 2018 Well-being Index - Preliminary data for the Well-being Index showed an annual growth of 3.8% for The Portuguese Well-being Index has positively progressed between and and declined in. It
(1) PROJECT COORDINATOR (2) SENIOR EXPERT RESILIENCE
 PROJECT COORDINATOR (2) SENIOR EXPERT RESILIENCE") TERMS OF REFERENCE bx (1) PROJECT COORDINATOR (2) SENIOR EXPERT RESILIENCE INCEPTION PHASE OF UNICEF RESILIENCE PROJECT IN SOMALIA This TOR is to support the process of hiring a consultant for the project
TERMS OF REFERENCE bx (1) PROJECT COORDINATOR (2) SENIOR EXPERT RESILIENCE INCEPTION PHASE OF UNICEF RESILIENCE PROJECT IN SOMALIA This TOR is to support the process of hiring a consultant for the project
28 September 2018, Sarajevo
 European Union Roma Integration 2020 is co-funded by: 2018 NATIONAL PLATFORM ON ROMA INTEGRATION BOSNIA AND HERZEGOVINA 28 September 2018, Sarajevo :: POLICY RECOMMENDATIONS :: INTRODUCTION The third National
INSTITUTO NACIONAL DE ESTADÍSTICA. Descriptive study of poverty in Spain Results based on the Living Conditions Survey 2004
 INSTITUTO NACIONAL DE ESTADÍSTICA Descriptive study of poverty in Spain Results based on the Living Conditions Survey 2004 Index Foreward... 1 Poverty in Spain... 2 1. Incidences of poverty... 3 1.1.
International Workshop on Sustainable Development Goals (SDG) Indicators Beijing, China June 2018
 Indicators Beijing, China June 2018") International Workshop on Sustainable Development Goals (SDG) Beijing, China 26-28 June 2018 CASE STUDIES AND COUNTRY EXAMPLES: USING HOUSEHOLD SURVEY DATA FOR SDG MONITORING IN MALAYSIA NORISAN MOHD ASPAR
International Workshop on Sustainable Development Goals (SDG) Beijing, China 26-28 June 2018 CASE STUDIES AND COUNTRY EXAMPLES: USING HOUSEHOLD SURVEY DATA FOR SDG MONITORING IN MALAYSIA NORISAN MOHD ASPAR
The European Semester: A health inequalities perspective
 The European Semester: A health inequalities perspective Will the 2017 European Semester process contribute to improving health equity? EuroHealthNet s 2017 analysis of the European Semester This publication
Marche Region. Ex Ante Evaluation report. Executive summary. Roma, June 2015
 Marche Region 2014-2020 COMMITTENTE RDP for Marche Ex Ante Evaluation report Roma, June 2015 Executive summary EXECUTIVE SUMMARY Introduction The Ex Ante Evaluation (EAE) of the Rural Development Programme
Hungary. 1. Overview
 2015 Annual National Social Report - Report on the reform measures and policy initiatives designed and implemented in the period from June 2014 to April 2015 Hungary 1. Overview After the parliamentary
Characteristics of Eligible Households at Baseline
 Malawi Social Cash Transfer Programme Impact Evaluation: Introduction The Government of Malawi s (GoM s) Social Cash Transfer Programme (SCTP) is an unconditional cash transfer programme targeted to ultra-poor,
RESULTS OF THE KOSOVO 2015 LABOUR FORCE SURVEY JUNE Public Disclosure Authorized. Public Disclosure Authorized. Public Disclosure Authorized
 Public Disclosure Authorized Public Disclosure Authorized Public Disclosure Authorized Public Disclosure Authorized RESULTS OF THE KOSOVO 2015 LABOUR FORCE SURVEY JUNE 2016 Kosovo Agency of Statistics
Working conditions in Zanzibar
 Introduction National context Methodology Survey findings Policy considerations References Wyattville Road, Loughlinstown, Dublin 18, Ireland. - Tel: (+353 1) 204 31 00 - Fax: 282 42 09 / 282 64 56 email:
2011 Research Financial Stress
 Executive Summary An estimated 60% of illness is directly or indirectly caused by financial stress, costing most large and medium sized companies millions of dollars per year in health care expenses. The
How s Life in Costa Rica?
 How s Life in Costa Rica? November 2017 The figure below shows Costa Rica s relative strengths and weaknesses in well-being with reference to both the OECD average and the average of the OECD partner countries
Liberal Party of New Brunswick Response to Provincial Election 2014 Questionnaire for Political Parties
 Liberal Party of New Brunswick Response to Provincial Election 2014 Questionnaire for Political Parties Submitted to: New Brunswick Common Front for Social Justice Inc. On behalf of the Liberal Party of
Content. 05 May Memorandum. Ministry of Health and Social Affairs Sweden. Strategic Social Reporting 2015 Sweden
 Memorandum 05 May 2015 Ministry of Health and Social Affairs Sweden Strategic Social Reporting 2015 Sweden Content 1. Introduction... 2 2. Delivering on the Europe 2020 objective to combat poverty and
9. Country profile: Central African Republic
 9. Country profile: Central African Republic 1. Development profile Despite its ample supply of natural resources including gold, diamonds, timber, uranium and fertile soil economic development in the
Terms of Reference. Impact Assessment Study of
 Terms of Reference For Impact Assessment Study of Partnership in Climate Services for Resilient Agriculture in India (PCSRA) ToR No: ABC122019XYZ Dated: 31-1-2019 Partnership in Climate Services for Resilient
New Multidimensional Poverty Measurements and Economic Performance in Ethiopia
 New Multidimensional Poverty Measurements and Economic Performance in Ethiopia 1. Introduction By Teshome Adugna(PhD) 1 September 1, 2010 During the last five decades, different approaches have been used
Explanatory note on the 2014 Human Development Report composite indices. Ukraine. HDI values and rank changes in the 2014 Human Development Report
 Human Development Report 2014 Sustaining Human Progress: Reducing Vulnerabilities and Building Resilience Explanatory note on the 2014 Human Development Report composite indices Ukraine HDI values and
BROAD DEMOGRAPHIC TRENDS IN LDCs
 BROAD DEMOGRAPHIC TRENDS IN LDCs DEMOGRAPHIC CHANGES are CHALLENGES and OPPORTUNITIES for DEVELOPMENT. DEMOGRAPHIC CHALLENGES are DEVELOPMENT CHALLENGES. This year, world population will reach 7 BILLION,
A guide to understanding, getting and using health insurance. The. Health Insurance
 A guide to understanding, getting and using health insurance The Health Insurance THE ABC S OF HEALTH INSURANCE: WHY IS HEALTH INSURANCE IMPORTANT? Even if you are in GOOD HEALTH, you will need to use
Council of the European Union Brussels, 23 September 2015 (OR. en)
") Council of the European Union Brussels, 23 September 2015 (OR. en) 12079/15 SOC 520 EMPL 341 ECOFIN 722 POLG 139 NOTE From: To: Subject: The Social Protection Committee Permanent Representatives Committee
Council of the European Union Brussels, 23 September 2015 (OR. en) 12079/15 SOC 520 EMPL 341 ECOFIN 722 POLG 139 NOTE From: To: Subject: The Social Protection Committee Permanent Representatives Committee
Ask Afrika 2010 Making financial markets work for the poor
 Ask Afrika 2010 Making financial markets work for the poor Give a man a fish Ask Afrika 2010 Making financial markets work for the poor 2 Ask Afrika 2010 Making financial markets work for the poor 3 Ask
Module 4: Earnings, Inequality, and Labour Market Segmentation Gender Inequalities and Wage Gaps
 Module 4: Earnings, Inequality, and Labour Market Segmentation Gender Inequalities and Wage Gaps Anushree Sinha Email: asinha@ncaer.org Sarnet Labour Economics Training For Young Scholars 1-13 December
STEP 7. Before starting Step 7, you will have
 STEP 7 Gap analysis Handing out mosquito nets in Bubulo village, Uganda Photo credit: Geoff Sayer/Oxfam Step 7 completes the gap-analysis strand. It should produce a final estimate of the total shortfall
Life saving integrated food security and livelihoods support for IDPs and vulnerable host communities affected by conflict and drought in Ayod County.
 HSSD19-FSC-153004-1 Life saving integrated food security and livelihoods support for IDPs and vulnerable host communities affected by conflict and drought in Ayod County. Last updated by Justus Vundi on
P R E S S R E L E A S E Risk of poverty
 HELLENIC REPUBLIC HELLENIC STATISTICAL AUTHORITY Piraeus, 23 / 6 / 2017 P R E S S R E L E A S E Risk of poverty 2016 SURVEY ON INCOME AND LIVING CONDITIONS (Income reference period 2015) The Hellenic Statistical
Perceptions on gender equality, gender-based violence, lived poverty and basic freedoms
 WWW.AFROBAROMETER.ORG Perceptions on gender equality, gender-based violence, lived poverty and basic freedoms 12 February 2015 Institute for Public Policy Research At a Glance Perceptions of gender equality
Healthcare and Health Insurance Choices: How Consumers Decide
 Healthcare and Health Insurance Choices: How Consumers Decide CONSUMER SURVEY FALL 2016 Despite the growing importance of healthcare consumerism, relatively little is known about consumer attitudes and
Citizens Health Care Working Group. Greenville, Mississippi Listening Sessions. April 18, Final Report
 Citizens Health Care Working Group Greenville, Mississippi Listening Sessions Final Report Greenville, Mississippi Listening Sessions Introduction Two listening sessions were held in Greenville, MS, on.
Poverty in Afghanistan
 Poverty in Afghanistan Socio-economic, demographic and geographic aspects of poverty from the NRVA 2007-08 Prepared by: Dean Jolliffe, Silvia Redaelli, and Andy Kotikula, World Bank, for the 7 th meeting
Population Age, Sex, and Race Language Employment Households, Income, and Poverty. Date last updated: Refresh cycle:
 Demographics Section Demographics Date last updated: Refresh cycle: Demographics are the statistical data of a population. Age, income, education, sex and race are all examples of demographic characteristics.
Calibrating the 2018 Social Progress Index to the Sustainable Development Goals
 Calibrating the 2018 Social Progress Index to the Sustainable Development Goals Methodology Note Social Progress Imperative is supporting implementation of the Sustainable Development Goals (SDGs) around
MEASURING WHAT MATTERS TO PEOPLE. Martine Durand OECD Chief Statistician and Director of Statistics
 MEASURING WHAT MATTERS TO PEOPLE Martine Durand OECD Chief Statistician and Director of Statistics Statistics Flanders Trustworthy numbers for a strong democracy Brussels, 13 December 2017 The OECD Better
An Evaluation of Rural Social Service Programme of the Government of Bangladesh
 An Evaluation of Rural Social Service Programme of the Government of Bangladesh M Harunur Rashid Bhuyan Sharifa Begum S M Zahedul Islam Chowdhury Maruf Ahmed December 6, 2017 Introduction Outline of the
Terms of Reference (ToR)
") Terms of Reference (ToR) Mid -Term Evaluations of the Two Programmes: UNDP Support to Deepening Democracy and Accountable Governance in Rwanda (DDAG) and Promoting Access to Justice, Human Rights and Peace
Terms of Reference (ToR) Mid -Term Evaluations of the Two Programmes: UNDP Support to Deepening Democracy and Accountable Governance in Rwanda (DDAG) and Promoting Access to Justice, Human Rights and Peace
Terms of Reference for a Special Service Agreement- Individual Contract International Consultant
 Terms of Reference for a Special Service Agreement- Individual Contract International Consultant Position Title: Location: Duration: Start Date: Reporting to: Urbanization and child welfare: Evidence from
Copies can be obtained from the:
 Published by the Stationery Office, Dublin, Ireland. Copies can be obtained from the: Central Statistics Office, Information Section, Skehard Road, Cork, Government Publications Sales Office, Sun Alliance
Education and Employment Status of Dalit women
 Volume: ; No: ; November-0. pp -. ISSN: -39 Education and Employment Status of Dalit women S.Thaiyalnayaki PhD Research Scholar, Department of Economics, Annamalai University, Annamalai Nagar, India. Abstract
E Distribution: GENERAL. Executive Board Second Regular Session. Rome, October September 2007 ORIGINAL: ENGLISH
 Executive Board Second Regular Session Rome, 22 26 October 2007! E Distribution: GENERAL 11 September 2007 ORIGINAL: ENGLISH Cost (United States dollars) Current budget Increase Revised budget WFP food
Explanatory note on the 2014 Human Development Report composite indices. Argentina. HDI values and rank changes in the 2014 Human Development Report
 Human Development Report 2014 Sustaining Human Progress: Reducing Vulnerabilities and Building Resilience Explanatory note on the 2014 Human Development Report composite indices Argentina HDI values and
2 nd INDEPENDENT EXTERNAL EVALUATION of the EUROPEAN UNION AGENCY FOR FUNDAMENTAL RIGHTS (FRA)
") 2 nd INDEPENDENT EXTERNAL EVALUATION of the EUROPEAN UNION AGENCY FOR FUNDAMENTAL RIGHTS (FRA) TECHNICAL SPECIFICATIONS 15 July 2016 1 1) Title of the contract The title of the contract is 2nd External
2 nd INDEPENDENT EXTERNAL EVALUATION of the EUROPEAN UNION AGENCY FOR FUNDAMENTAL RIGHTS (FRA) TECHNICAL SPECIFICATIONS 15 July 2016 1 1) Title of the contract The title of the contract is 2nd External
COMMON CAUSE CAMPAIGN FINANCE SURVEY JANUARY 2014
 COMMON CAUSE CAMPAIGN FINANCE SURVEY JANUARY 2014 JANUARY 2014 PAGE 2 TABLE OF CONTENTS I. INTRODUCTION... 3 METHODOLOGY... 4 EXECUTIVE SUMMARY... 5 II. SUMMARY OF RESULTS... 17 III. DEMOGRAPHICS... 35
By Dr. Lassina Konate, Dr. Prosper Somda, Dr. Michel Koné, Dr. Omer Combary, SamandoulougouRasmata, M. Kabore/Ouedraogo Jeannette
 Strengthening Social Protection in the Informal Sector through CBMS: Case of the Communes of Diébougou (Province of Bougouriba), Koper (Province of Ioba) and To (Province of Sissili) By Dr. Lassina Konate,
Sixth Annual Nationwide TCHS Consumers Healthcare Survey: Stressed Out: Americans and Healthcare
 Sixth Annual Nationwide TCHS Consumers Healthcare Survey: Stressed Out: Americans and Healthcare October 2018 Table of Contents About the Transamerica Center for Health Studies Page 3 About the Survey
Hawala cash transfers for food assistance and livelihood protection
 Afghanistan Hawala cash transfers for food assistance and livelihood protection EUROPEAN COMMISSION Humanitarian Aid and Civil Protection In response to repeated flooding, ACF implemented a cash-based
How s Life in South Africa?
 How s Life in South Africa? November 2017 The figure below shows South Africa s relative strengths and weaknesses in well-being, with reference to both the OECD average and the average outcomes of the
Q&A THE MALAWI SOCIAL CASH TRANSFER PILOT
 Q&A THE MALAWI SOCIAL CASH TRANSFER PILOT 2> HOW DO YOU DEFINE SOCIAL PROTECTION? Social protection constitutes of policies and practices that protect and promote the livelihoods and welfare of the poorest
2014 CAHPS Child Medicaid with CCC Member Satisfaction Survey
 2014 CAHPS Child Medicaid with CCC Member Satisfaction Survey Oklahoma Health Care Authority members covered by the Children's Health Insurance Programs (CHIP) June 2014 Table of Contents Executive Summary........................................................
Protec on Risk Analysis
 Protec on Risk Analysis Associated with food distribu on North Waziristan Agency IDPs response October, 2014 This document has been produced and released by the Vulnerability Analysis and Mapping (VAM)
Motivation. Research Question
 Motivation Poverty is undeniably complex, to the extent that even a concrete definition of poverty is elusive; working definitions span from the type holistic view of poverty used by Amartya Sen to narrowly
General public survey after the introduction of the euro in Slovenia. Analytical Report
 1 Flash EB N o 20 Euro Introduction in Slovenia, Citizen Survey Flash Eurobarometer European Commission General public survey after the introduction of the euro in Slovenia Analytical Report Fieldwork:
Explanatory note on the 2014 Human Development Report composite indices. Brazil. HDI values and rank changes in the 2014 Human Development Report
 Human Development Report 2014 Sustaining Human Progress: Reducing Vulnerabilities and Building Resilience Explanatory note on the 2014 Human Development Report composite indices Brazil HDI values and rank