Relative income distribution in six European countries: market and disposable income
|
|
|
- Aubrey Houston
- 6 years ago
- Views:
Transcription
1 Working Paper Series Department of Economics University of Verona Relative income distribution in six European countries: market and disposable income Ilaria Petrarca, Roberto Ricciuti WP Number: 2 January 2015 ISSN: (paper), (online)
2 Relative income distribution in six European countries: market and disposable income* Ilaria Petrarca a Roberto Ricciuti b Abstract The relationship between income inequality and polarization is an empirical fact: a change in equality might occur together with a change in polarization. At the same time, polarization might emerge while inequality remains constant. The outcome of this process entails relevant information about the evolution of the income distribution. We exploit the LIS micro-data to perform a relative distribution analysis for six European countries. Our aim is to describe how both the market and the disposable income distributions evolved over time. The results indicate that polarization increased in all the considered countries, being the largest in the United Kingdom and the smallest in Italy. At the beginning of the period the relative polarization of disposable income is lower than the one for market income. Over time, however, this pattern is reversed. Nonetheless, in all the countries downgrading prevails over upgrading: the relevance of the middle-class getting poorer is larger than the one of the middle-class getting richer. Keywords: Income distribution, polarization, inequality, relative distribution methods. JEL codes: C14, D31, D63, I32. * This research was funded by the research program "Inequality and economic crises" within the project Economic Crises and the Quality of Democracies in Europe (PRIN project 2010WKTTJP_005) and represents the background paper of the University of Verona research unit. The authors thank Ben Jann for sharing the reldist Stata package and the LIS Staff for the technical support. a Department of Economics, University of Verona. Vicolo Campofiore 2, Verona, Italy. ilaria.petrarca@univr.it. b Corresponding author. University of Verona, CESifo and Esid. Vicolo Campofiore 2, Verona, Italy. roberto.ricciuti@univr.it. 1
3 1. Introduction We apply the relative distribution analysis (Handcock and Morris, 1999), a non-parametric approach to visualize and analyze differences in distributions, to compare a set of country income time series with a reference distribution, set to the most recent available information, that is By doing so, we observe how the pattern of polarization changes over time, namely if the past distributions were more or less polarized than the most recent one and decompose the "growth effect" from the "distributional effect" (Kakwani, 1993; Bourgouignon, 2003; 2004). We use the Luxembourg Income Study Database (LIS), which represents the most complete source of harmonized income information across countries and over time (Smeeding et al.,1985; Atkinson and Brandolini, 2001). The present analysis, therefore, significantly contributes to the current debate on income inequality and polarization mainly by providing results updated to 2010, that is the last LIS available survey data. A second contribution is the analysis of the extent to which the government, through the welfare state design, affects the pattern of polarization. Following the literature (Milanovic, 2000; Scervini, 2012) we construct two measures of income, namely ex-ante (market) and expost (disposable) income, which differ because the latter includes taxation and transfers. Given that the LIS dataset has been restructured in 2011 and the old definitions of income do not apply mechanically to the new ones, this step updates the existing income series. The nature of the data, namely the specification of gross or net income deriving from the national sources, allows us to calculate disposable income in all the countries, but market income only in those countries for which data on gross income is available. Furthermore, as a third element of innovation of this paper, we consider both "monetary" and "monetary plus nonmonetary" (that we label "total") sources of income, while the scholars so far employed only "monetary plus non-monetary" disposable income (Scervini, 2012). Our main result is that past income polarization was than in In particular, we observe a slow convergence starting from the 1980s. At the beginning of the period the relative polarization of disposable income is lower than the one for market income: disposable income polarization was slightly lower than its level in 2010, while market income polarization was much smaller than its level in Over time, however, this pattern is reversed in those countries for which we have available data to compute both ex-ante and ex-post income. Hence, disposable income polarization significantly decrease from its level in 2010, whereas market income polarization increases and converges to its level in This evidence suggests an increasing effectiveness of the equalizing role of the welfare state, and a jump in disposable income polarization in This fact is consistent with the governmental response 1 The most recent updated dataset is "France 2010", uploaded on the LIS website on November 26 th, Source: 2
4 to the Great Recession, which may have altered the equalizing aim of public finance instruments to face the economic downturn. Furthermore, in all the countries downgrading prevails over upgrading: the relevance of the middle-class getting poorer is larger than the one of the middle-class getting richer. Finally, the contribution of the lower tail of the distribution is always stronger than the one of the upper tail, again suggesting downgrading prevailing over upgrading. The paper is organized as follows: Section 2 reviews the related literature, Section 3 describes the data and the methodology. Section 4 and Section 5 illustrate the results obtained by using respectively only the monetary and also the non-monetary income. Conclusions are drawn in Section Literature Both income polarization and income inequality reflect the degree of alienation that individuals and groups feel from one another. Nonetheless, the concept of polarization is enriched with the dimension of within-group identity (Duclos et al., 2004). Beside the phenomenon of the groups' separation, special emphasis is devoted to their clustering. The notion that alienation must be complemented by a sense of identification is the milestone of the identification-alienation framework (Esteban and Ray, 1994), which is currently predominant in the literature. While income polarization is negatively correlated with economic growth, the impact of inequality is not statistically significant (Brzezinski, 2013). Recent investigations of any shortrun impact of income distribution on economic performance during the recent Great Recession failed to reach unambiguous conclusions (Agingen and Guger, 2013; Hellenbrandt, 2014). The correlation, therefore, seems to emerge in the long-run. This view is consistent with the longrun evolution of the middle-class consensus, which is commonly associated to better economic prospects (Easterly, 2001; Pressman, 2007). A closer look at today's polarization, therefore, might say something about the future economic potential of a country. The scholars developed several measures of income polarizations that differ according to the grouping scheme applied to the income distribution. They are commonly divided into two main families. Specifically, the first one approaches the separation/clustering dilemma with arbitrary numbers of groupings (Esteban and Ray, 1994; Duclos, Esteban and Ray 2004, 2012; Reynal-Querol, 2002), while the latter sets the median income as a divide between only twogroups (Foster and Wolfson, 2010; Wolfson, 1994; Wang and Tsui, 2000). Cross-country applications of such measures provide partially contrasting results. While the Wolfson (1994) polarization measure draws a pattern of increasing income polarization (together with inequality) during the period (Seshanna and Decornez, 2003), the ER measure 3
5 (Esteban et al., 1999) describes a curvilinear trajectory where a polarization increase is followed by a decrease in the most recent years (Duro, 2005). The limit of the use of an index lies in the loss of information regarding the income distribution. Some scholars proposed the application of distributional measures to illustrate how income distribution evolves over time. The change in the location of the curve, named "growth effect", might hide a variation in the shape, labeled "distributional effect" (Kakwani, 1993; Bourgouignon, 2003; 2004). One of the most commonly used methodologies in this field is the "relative distance" (Morris et al., 1994, 1995; Handcock and Morris, 1998) that we will implement in the empirical analyses. The literature that studies inequality and polarization in the six countries that we consider suggests the presence of income polarization. The United Kingdom experienced the most severe inequality upswing observed since 1967 across the OECD countries (Alderson and Nielsen, 2002). The extended index of polarization introduced by Esteban et al. (2006) indicates a boom of polarization in 1986, followed by a stable pattern. Alderson et al. (2005) and Alderson and Doran (2005) apply distributional methods to the British income distribution over time. Alderson et al. (2005) analyze the period and find a marked polarization: the middle class declines and both the top and the bottom of the income distribution simultaneously grow. While downgrading is more pronounced in Alderson et al. (2005), Alderson and Doran (2005) find that upgrading preceded downgrading in the period On the other hand, Germany experienced a modest decline in inequality (Alderson et al., 2005) and the extended index of polarization is stable over time, showing a slight reduction in the decade (Esteban et al., 2006; Grabka and Frick 2008; Schmidt, 2002). The distributional analysis suggests the presence of a convergence pattern from the bottom to the center of the income distribution during the period (Alderson et al., 2005), with downgrading dominating upgrading in the period (Alderson and Doran, 2005). A similar convergence pattern is reported for France from 1979 to 1994 (Alderson et al., 2005) but with a difference: inequality only modestly declined. This evidence is explained with the relative growth of the 10 th decile: while the poorer were escaping poverty, the richer were getting richer. Polarization in Italy is shaped by the downgrading of lower incomes acting against the location effect due to economic growth over time (Alderson et al., 2005; Massari et al., 2009; 2011). The net result is that "while households at the top of the distribution held on their positions and began to experience an upgrading of their incomes only in recent years, households at the poorest deciles lost ground" (Massari, 2009, page 14). Alderson and Doran (2005) generalize the phenomenon of a middle class hollowing out also to transition countries. Poland, in particular, shows a modest increase in inequality and a mild 4
6 degree of polarization. In the years , when most of the structural reforms were implemented, upgrading preceded downgrading. Gradin (2000) suggests a more detailed approach by specifying sub-populations. The main intuition is that inside a partition of the income distribution it is interesting to look at polarization within the partition only for those households with similar characteristics. His analysis of Spanish expenditures over the years (Gradin, 2002) reveals the presence of a more complex picture: within each income partition the educational level drives polarization more than socio-economic variables. It is worth noting that all the cited works measure inequality and polarization of disposable income, therefore their results refer to measures of income after taxation and transfers. However, redistribution policies affect polarization. In particular, they should be able to smooth the curve and lower the local maximum points in order to achieve more equal distributions. The role of the welfare state is a relevant determinant of the income distribution during the Great Recession (Hellenbrandt, 2014) and it would be interesting to check how much polarization is affected by the government intervention. The empirical literature of political economy focusing on the median voter theorem (Milanovic, 2000; Scervini, 2012) is, to the best of our knowledge, the only one discussing both ex-ante (market) and ex-post income (disposable) series and their Gini coefficients. Despite their failure to unambiguously support the theorem, they both show a decreasing strength of the middle class. Since this branch of the literature is the empirical starting point for our work, a more detailed discussion of the methodological approach at measuring both ex-ante and ex-post income is provided in the Appendix A. 3. Data and methodology We use the Luxembourg Income Study Database (hereafter LIS) which includes both household and personal microdata for a large number of high- and middle-income countries. The potential of LIS rests in the availability of information in an harmonized shape covering several decades. Nonetheless, one must note that the LIS microdata are based on country surveys and do not include the same units over time. Hence, they cannot be used for longitudinal analysis, but they still provide a rich source of information for comparing results across multiple time points because of the harmonization process carried out by the LIS. The limitations refer to the nature of secondary data, which make them available depending upon the original source, that is the institution that conducted the survey (e.g. the UK Data Archive, the Polish Central Statistical Office, the Bank of Italy, and so on). In particular, some surveys report gross income, that is before taxes and mandatory employee social contributions 5
7 are deducted. Other sources measure income after deductions, that is net income. The type of the dataset, either gross or net, determines the possibility to compute both ex-ante and ex-post income (gross dataset) or only ex-post income (net dataset). We follow the specification of market income in Milanovic (2000, page 373): "Factor income is defined as pre-transfer and pre-tax income, and includes wages, income from self-employment, income from ownership of physical and financial capital, and gifts. Factor income P includes, in addition, public pensions. The reason for including pensions along with the usual factor incomes is that pensions are specific transfers that do not respond to current contingencies, and are not paid with the objective of redistributing income. Pensions are, of course, deferred wages, with some redistribution component. By treating pensions as factor income, we can better focus on other social transfers such as unemployment benefits, family allowances, and social assistance that have a clearer redistributive function. Gross income is equal to factor income plus all government cash transfers. Disposable income is equal to gross income minus direct personal taxes and mandatory employee contributions". While the literature usually employs total amounts (Scervini, 2012), we separately compute income using only monetary amounts or total amounts. The details of the computation are provided in Appendix A. A graphical comparison between the Gini index computed using our approach with those presented in Scervini (2012) is shown in Appendix B. In general, we find a good match between the two series, both for ex-ante and ex-post income, therefore we are confident in the comparability of our series with the existing ones. To compare the series over time we must deflate the LIS income variables, 2 and convert the older currencies into the 2010 one. 3 The relative distribution is a non-parametric approach to perform distributional analysis of group differences (Bernhardt et al and1995; Handcock and Morris 1998, 1999). It has been widely adopted in the literature and recently applied also to less developed countries (e.g. Nigeria, see Clementi et al., 2014). For a comprehensive description of the methodology please refer to Handcock and Morris (1999); in this Section we present a short illustration of the intuition behind the methodology, which we tailor on our application. Let Y0 be income (either ex-post or ex-ante income) in the reference group, that we set to the year We choose 2010 because it is the year of the latest available survey in all the six countries we consider. Let Yt be income in the comparison group, where t is the year of the 2 We use the GDP deflator on: The real value is computed as the ratio between the nominal value and the GDP deflator. Since the source reports deflators based on 2005 and we are interested in those based on 2010, we apply the deflator base change: ti2010= 2005I2010/2005It where t is the year under consideration. 3 Except for the United Kingdom, in fact, all the six countries changed currency over time. Germany, France, Spain and Italy moved to Euro in 2002; Poland introduced the "new zloty" in 1995, following the dramatic devaluation of its national currency, the "old zloty". 6

8 comparable survey. 4 The relative distribution is "the ratio of the fraction of households in the baseline year to the fraction of households in the comparison year in each decile of the distribution of income" (Alderson et al., 2005). First, one must derive the density function of the relative data: g(r) = f(f0-1 (r))/f(ft -1 (r)) [1] where F0(Y) is the cumulative distribution function of Y0, Ft(Y) is the cumulative distribution function of Yt, fo() and ft() are the density functions of Yt and Y0, and r ranges from 0 to 1. To give an interpretation, the relative density at percentile p of Y0 is the distance between fo() and ft(). Such a distance is based on the fact that the distribution in 2010 shifted leftward or rightward after an overall increase or decrease of income. The most plausible case is a rightward shift motivated by economic growth. This component is named "location effect". The distance, however, might also depend on the curvature of the distribution that might emphasize or smooth some peaks along the percentiles. The peaks captures polarization, and this component is named "shape effect". The two effects are obtained by applying a decomposition to the relative distance and their product results in the "overall effect". Graph 1 depicts the wage distribution by gender in Jann (2008). 5 The red curve is for women, the blue one is for men. As we can see, the distribution from x=0 to x=50 is lower for men that for women: among the lowest earners there are more women than men. Graph 1. Wage PDF overlays Source: Jann (2008) 4 Specifically: United Kingdom t=(1969, 1974, 1979, 1986, 1991, 1994, 1995, 1999, 2004, 2007); Germany t=(1973, 1978, 1981, 1983, 1984, 1989, 1994, 2000, 2004, 2007); France t=(1978, 1984, 1989, 1994, 2000, 2005; 2010); Spain t=(1980, 1985, 1990, 1995, 2000, 2004, 2007); Italy t=(1985, 1987,1989, 1991, 1993,1995, 1998, 2000, 2004, 2008); Poland t=(1986, 1992, 1995, 1999, 2004, 2007). 5 Data are from the Swiss Labor Force Survey by the Swiss Federal Statistical Office, and refer to

9 The relative distribution is built by setting the proportion of units of the reference group, that is men, equal to one for each quintile of the distribution. The relative distribution is illustrated in the panel ''overall'' of Graph 2. The red curve is the women's relative distribution, and the dotted blue lines delimit its confidence interval. The ''overall'' panel tell us that, as an example, the proportion of units in the comparison group falling in the very poorest quantile of the distribution was larger than in the reference group. The ratio was about 3.5: there were a number of very poor women 3.5 times larger than in the number of very poor men. The central panel considers only the fact that men earn more than women at every point of the distribution; in Graph 1 this is shown by the blue line being always on the right side of the red line. If the shape of the distribution is assumed to remain unchanged, we observe once again a number of poorest unit that is larger for women than for men. The ratio decreases up to 2.5, bit still suggests a relevant importance of the location effect. The "shape" panel on the right, on the other hand, illustrates the effect of a change in the curvature of the distributions assuming to overlay the curves in Graph 1. The ratio of the very poorest units is about 1.5, suggesting a smaller importance of the shape effect with respect to the location effect. Graph 2. Relative PDF: location and shape effect Source: Jann (2008) We perform the relative distribution analysis using LISSY - Stata 12.1, 6 with the package reldist (Jann, 2008). This procedure computes the decomposition of the overall effect into location and shape, and provides summary measures for the relative distribution, i.e. the 6 Source: 8
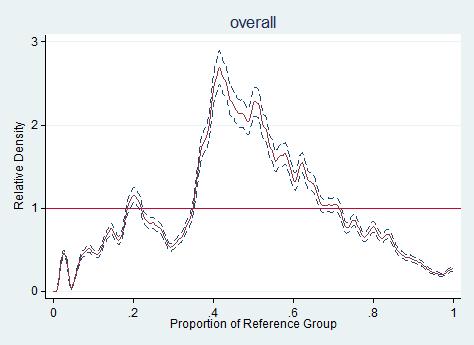
10 relative polarization index (RP). The index is evaluated at the median, lower and upper percentiles of the distribution. The coefficients are labeled respectively MRP, LRP and URP:, = , = 8 0.5, = [2] 1 [3] 1 [4] A positive MRP is interpreted as evidence of a median comparison distribution more polarized than the median reference distribution. In our analysis, it means that the median distribution at time t is more polarized than in The interpretations of the LRP and URP are similar, but they refer respectively to the below-the-median and the above-the-median parts of the distribution. The RP coefficients provide a more synthetic description of the relative distribution analysis than the graphs. For sake of completeness, however, we performed also the graphical analysis. Due to the double nature of our income variable, the number of countries and the length of the time considered period, the number of figures is hard to manage in the main text, hence, the full graphical analysis is reported in Appendix C.1 for monetary income and Appendix C.2 for total income. 4. Relative distribution analysis by country: monetary income In this Section we present the results of the relative distance analysis using only monetary sources of income. Each country sub-section includes a short commentary of the results and a table reporting inference of the relative polarization indexes. The coefficient of the RP index is presented together with the standard error (SE) and the confidence interval. A list of the Graphs associated to each year, setting 2010 as a reference, are provided in Appendix C. For each income variable, for each country and for each considered year t, there are three figures. In each panel the red line drawn at y=1 is the reference distribution referring to the year The blue line represents the relative distance, being the dotted blue lines the boundaries of the confidence interval. The three graphs illustrate the shape, the location component, and the overall relative distance, respectively. The shape effect depicts the relative distance obtained by superimposing the probability distribution functions, keeping fixed the position of the distribution and focusing on the differences in the shape. The location effect, on the other hand, illustrates the effect of a shift leftward or rightward of the income distribution, keeping the curvature fixed. Since the graphs tell the same story in a different way, for sake of conciseness we focus the comments on the RP indexes. 9
11 Before moving to the country sub-sections, it is worth pointing out that we develop the relative distance analysis for market income and disposable income separately. This means that when we comment on the RE index we cannot derive direct conclusions about the effectiveness of the welfare state, as we are not comparing the two types of income. The time evolution of the RP index, however, indicates a convergence/divergence pattern of income with respect to its 2010 level, which is fixed. Hence, it provides us information about the time increase/decrease of income polarization. 4.1 The United Kingdom The LIS datasets for the UK cover the period since 1969 until If we look at the Relative Polarization (RP) indexes associated with market income, we observe that until 1995 there is a negative MRP showing relative convergence towards the 2010 level of the median portion of the distribution. After 1995 the MRP switches to a positive sign, suggesting a relative increase in the tails, therefore more polarization than in While the LRP shows a similar pattern, the URP converges less and less. It is noteworthy to signal the year 1991, where the highest deciles converge less than before (URP=-0.193) and the lowest deciles show polarization (LRP=0.036). If we look at the disposable income RP, we observe that until 2004 all the three indexes are negative. The coefficient of the LRP is the largest, meaning that convergence to the level of polarization of 2010 occurs mainly in the lowest deciles through downgrading. In 2007 the distributions show RP indexes positive but close to zero, therefore it is slightly more polarized than in The year 1991 is no longer a deviant one: the indexes still indicate convergence, although it seems to be weaker than both in 1986 and in We observe a pattern over time of decreasing effectiveness of the welfare state. In particular, the gap between the current polarization level converges over time to the reference 2010 level for disposable income. As for market income, the current polarization level converges over time to the reference 2010 level until 1995; after that year it shows a larger polarization level. At the beginning of the period, the MRP was larger for market income than for disposable income. In 1991 the relative polarization for disposable income becomes smaller than that for market income. Finally, since 1999 disposable income is less polarized than in 2010 and market income is more polarized than in This pattern is consistent with the results of Brandolini and Smeeding (2009) who document a drop in the equalizing effect of taxes and transfers from the early 1980s, which is reversed in the late 1990s. It is worth noting that 1990 was the introductory year of the shortly-lived poll tax (formally named ''Community Charge''). The pool tax set a single flat-rate per-capita tax on every adult, whose rate was decided by the local authority. Many scholars argue that the poll tax increased 10
12 inequality. In terms of our analysis, this type of regressive tax either shifts the curve leftwards and changes its shape. According to the RP indexes, the degree of market income polarization dramatically increased (77%), but the RP for disposable income increased less (38%). If the increased polarization of market income is commonly related to technological change and market force in place after the economic crisis (Hills, 1998: 16), these figures suggest that the welfare state acted as a buffer. In contrast, we observe a relatively more polarized disposable income than market income for the survey years 1994 and Since the population income in the mid-90s was less polarized than in 2010, the redistribution effort of the government maybe transferred resources to the poorest population incentivizing the extension of the middle class and making it richer, but exacerbating the tails of the distribution - the poorest and the richest. Hills (1998) reports that after the Thatcher government the extent of means-tested benefits as the Income Support (the national minimum income benefit) and Family Credit (wage supplementation) increased and boosted welfare expenditure. This policy came together with a remarkable increase in taxation during the Major Cabinet. The Graphs for ex-ante income in the United Kingdom reported in Appendix C.1 draw a reduction of the middle class and a clustering of households around the 10 th decile of the distribution. The Graphs in Appendix C.2, on the contrary, indicate more or less the same share of ex-post median income households than in 2010, but much more poors and much less riches than in Income polarization kept increasing since 1997 until 2007, being market income even more polarized than in Disposable income remained less or equally polarized than in 2010, failing to indicate a larger effectiveness of the New Labour welfare policies with respect to the post- Thatcher ones. 11
13 Table 1. Relative Polarization Index, United Kingdom (reference year 2010, obs.) Comparison year Ex-ante income # Obs. Ex-post income Index Coef. SE Confidence interval Index Coef. SE Confidence interval 1969 MRP ,756 MRP LRP LRP URP URP MRP ,974 MRP LRP LRP URP URP MRP ,314 MRP LRP LRP URP URP MRP ,330 MRP LRP LRP URP URP MRP ,089 MRP LRP LRP URP URP MRP ,821 MRP LRP LRP URP URP MRP ,586 MRP LRP LRP URP URP MRP ,010 MRP LRP LRP URP URP MRP ,232 MRP LRP LRP URP URP MRP ,926 MRP LRP LRP URP URP Note: MRP stands for median polarization index; LRP and URP stand for lower and upper polarization index. Bootstrap SE (50 replications), Confidence interval at the 95% level 12
14 4.2 Germany The LIS datasets for Germany span from 1973 through If we look at the RP indexes we observe the same changes in both ex-ante and ex-post income, because the coefficients move in the same direction. Despite this similarity and the fact that until 2004 they both are less polarized than 2010, one must note that disposable income appears to be relatively more polarized than market income. If we take a look at the RP index we observe a fluctuating pattern of polarization until the survey year The available data after the year 1984 show that polarization increases until Interestingly, there seems not to be any breakpoint around the year of the reunification, that is Nonetheless, the main driver of the time pattern of polarization depends upon the contribution of the lower tail, which is associated to the phenomenon of downgrading. It is well known that reunification led to a GDP loss for Germany (Abadie et al., 2014), but the extent of redistribution from the West to the East is not evident in the analysis of the LIS microdata. From 2004 to 2007 market income polarization is larger than in 2010, while disposable income is smaller. Interestingly, while in the most recent years the lower tail is more polarized than in 2010, the upper tail is less polarized and median polarization is very close to the 2010 level. All in all, these figures suggest that in Germany downgrading seems to be predominant over upgrading. This result is consistent with Biewen and Juhasz (2012) that explain most of the inequality increase in Germany with changes in employment outcomes, market returns, and the tax system. The Hartz reforms in the mid 2000s in fact increased the flexibility of the labor market to fight unemployment. If unemployment has decreased, inequality has grown (Fredriksen, 2012), due to the generation of low-wage sectors and the rise in earnings at the top of the distribution. The abolishment of wealth taxes in 1997, moreover, triggered the upgrading pattern of the upper quantiles. 13
15 Table 2. Relative Polarization Index, Germany (reference year 2010, obs.) Comparison year Ex-ante income # Obs. Ex-post income Index Coef. SE Confidence interval Index Coef. SE Confidence interval 1973 MRP MRP LRP LRP URP URP MRP MRP LRP LRP URP URP MRP MRP LRP LRP URP URP MRP MRP LRP LRP URP URP MRP MRP LRP LRP URP URP MRP MRP LRP LRP URP URP MRP MRP LRP LRP URP URP MRP MRP LRP LRP URP URP MRP MRP LRP LRP URP URP MRP MRP LRP LRP URP URP Note: MRP stands for median polarization index; LRP and URP stand for lower and upper polarization index. Bootstrap SE (50 replications), Confidence interval at the 95% level 14
16 4.3 France We consider the LIS datasets for France, ranging from 1978 until The nature of the dataset is heterogeneous: in 1978 it is gross, until 2010 it is mixed. The LIS reports that: "the French data have a hybrid structure between NET and GROSS, incomes are reported NET of contributions and GROSS of taxes" and "[fr10] The French data were received net of contributions and gross of income taxes which are paid in France at the end of the fiscal year. However, we had information on the income taxes paid for the previous fiscal year that were used as a proxy for the income taxes for the income reference year". 7 As a consequence, we can compute only disposable income. If we look at the RP indexes for disposable income, we observe that polarization is always lower than in Specifically, it follows a non monotonic pattern: it decreases in the 1980s, and increases afterwards. The contribution of the lower tail, despite its erratic pattern in the early years, is always stronger than the contribution of the upper one, as indicated by the larger magnitude of the LRP with respect to the URP. Notably, in 1984 and in 1989 the upper median part of the ex-post income distribution shows the lowest level of polarization in the period under consideration, suggesting the presence of downgrading in the mid-1980s. In the considered period the French welfare system, framed in the state-led economic policy ('dirigisme') exacerbates socio-economic problems as unemployment and social exclusion. Despite no fundamental welfare reform were implemented, in the 1980s social expenditure increased rapidly, mainly because of social contributions (Palier 2001). In the early 1990s sector-specific changes were made, by introducing new welfare instruments. In particular, the 1990 Finance Act introduced the Generalized Social Contribution (GSC), which is a tax to fund some welfare services that is paid by the residents in France and not only by income earners. The aim of the GSC was to spread the burden of social contribution among a largest share of the population, and it is the most relevant change occurred in the early 1990s. It is hard to associate the pattern of ex-post income polarization to GSC, but we suppose that the redistribution that it put into place increased the tails of the income distribution by hinging relatively more on median income contributors. 7 Source: 15
17 Table 3. Relative Polarization Index, France (reference year 2010, obs.) Comparison year # Obs. Ex-post income Index Coef. SE Confidence interval MRP LRP URP MRP LRP URP MRP LRP URP MRP LRP URP MRP LRP URP MRP LRP URP Note: MRP stands for median polarization index; LRP and URP stand for lower and upper polarization index. Bootstrap SE (50 replications), Confidence interval at the 95% level 4.4 Spain The LIS datasets for Spain starts in The nature of the datasets is net for the years , gross for the years 2007 and The LIS reports that: "taxes and contributions [are] not captured." 8 Hence, we perform a relative distribution analysis only using the disposable income for the period and also market income for If we look at the indexes associated to ex-post income, we observe that compared with the survey year 2010, the distribution converges in polarization. This pattern is clear since the beginning of the series and it presents a sharp increase between 1990 and 1995, a period of economic crises. The Spanish welfare state after the late 1990s has been able to keep polarization more or less constant until Politically, both Christian Democrats and Socialist governments ruled during this period. Deep reforms of some welfare provisions have been rejected by popular protest, as for the unemployment benefit retrenchment proposed in 2002, or the austerity measures to face the Great Recession in By looking at the LRP and the URP we see that while the density of the poorest deciles converges to the level of 2010, the richest deciles show a larger density than in Finally, the middle class is stable just below the median. The contribution of the upper tail to 8 Source: 16
18 convergence is more important than the contribution of the lower tail, which indicates the predominance of downgrading over upgrading. In 2007, the survey year for which we can compute also ex-ante income, we observe that the distribution is slightly more polarized than the 2010 one. The associated coefficient, however, is close to zero and consistently with previous evidence, it is determined by mainly the contribution of the polarization of the lower tail. Table 4. Relative Polarization Index, Spain (reference year 2010, obs.) Comparison year # Obs. Ex-post income Index Coef. SE Confidence interval MRP LRP URP MRP LRP URP MRP LRP URP MRP LRP URP MRP LRP URP MRP LRP URP Ex-post income Ex-ante income MRP MRP LRP LRP URP URP Note: MRP stands for median polarization index; LRP and URP stand for lower and upper polarization index. Bootstrap SE (50 replications), Confidence interval at the 95% level 4.5 Italy The LIS datasets collect Italian data since In the period they are net ("taxes and contributions [are] not captured"), while for the years they are mixed ("total income account for full taxes and contributions, subcomponents do not"). 9 If we look at the indexes associated to ex-post income, we observe that compared with the 2010 the distribution shows an erratic polarization pattern over time. In the 1980s the very poor deciles have less households than in 2010, the density of the intermediate deciles 9 Source: 17
19 decreases below the level of 2010, and there are more rich households. In the second half of the 1990s the poor households increase with respect to the 2010 distribution. In the years 2000s the number of the poorest households decreases but those around the 20 th percentile increase. All in all, the magnitude of the coefficients, always closer to zero, indicates a very small impact of changes in polarization with respect to the other countries. The lack of information about the pattern of market income polarization, we cannot say nothing on the effectiveness of the welfare state. Table 5. Relative Polarization Index, Italy (reference year 2010, obs.) Comparison year # Obs. Ex-post income Index Coef. SE Confidence interval MRP LRP URP MRP LRP URP MRP LRP URP MRP LRP URP MRP LRP URP MRP LRP URP MRP LRP URP MRP LRP URP MRP LRP URP MRP LRP URP Note: MRP stands for median polarization index; LRP and URP stand for lower and upper polarization index. Bootstrap SE (50 replications), Confidence interval at the 95% level. 4.6 Poland We consider the LIS datasets for Poland since The datasets are net ("taxes and contributions [are] not captured"), in 1995 it is mixed ("total income account for full taxes and contributions, subcomponents do not") and after 1999 they are gross. We perform a 18
20 relative distribution analysis only using the disposable income for the period and also market income for the period If we look at the indexes associated to ex-post and ex-ante income, we observe that compared with the 2010 the distribution it is less polarized since the survey year 1992, with a major contribution of the lower tail. The figures decrease over time, therefore polarization increases since around 1992, which is a pattern consistent with the transition to capitalism that the country experienced since the late 1980s. Notably, in 1986 the distribution of ex-post income was more polarized with a major contribution of the lower tail. It is worth noting that the RP index for disposable income is very close to 1, suggesting full polarization. Such an extreme result requires a proper motivation; a careful inspection of the data indicates the presence of a significant share of non-monetary sources of income in Poland, which is not the case for the other countries. We believe that this exclusion affects the fit of the ex-ante income measurement: omitting non-monetary income generates a distortion in the RP computation. Hence, for ex-ante income in Poland we feel more confident in relying on the results of the next Section that includes also non-monetary amounts of income. Table 6. Relative Polarization Index, Poland (reference year 2010, obs.) Comparison year # Obs. Ex-post income Ex-ante income Index Coef. SE MRP LRP URP MRP LRP URP MRP LRP URP Confidence interval Index Coef. SE Confidence interval MRP MRP LRP LRP URP URP MRP MRP LRP LRP URP URP MRP MRP LRP LRP URP URP Note: MRP stands for median polarization index; LRP and URP stand for lower and upper polarization index. Bootstrap SE (50 replications), Confidence interval at the 95% level. Estimates excluding hm_other. 10 Since the 1986 deflator is not available, we applied the 1990 one in
21 5. Relative distribution analysis by country: monetary plus non-monetary amounts In this Section we replicate the analysis of Section 4 by including in the income definition both monetary and non-monetary amounts. 11 This step highlights the relevance of in-kind transfers, which are mostly relevant in Poland, especially in the form of transfers. All the countries show RP indexes consistent with those presented in Section 3, both in the signs and the standard errors. The differences between the coefficients, when different from zero, are very small. The cross-country pattern of polarization does not present significant changes in all the countries and helps correcting the distortion of the RP calculated on ex-post income in Poland, confirming the general trend: an increasing income polarization characterized by the phenomenon of downgrading of the middle class. 11 Technically, in the Stata codes we specify the H- prefix of the variables instead of the HM- one, referring to Household and not Household Monetary amounts. 20
22 5.1 The United Kingdom Table 7. Relative Polarization Index, the United Kingdom (reference year 2010, obs.) Ex-ante Ex-post years Index Coef. SE Conf. interval Conf. interval N comparison Index Coef. SE Conf. interval Conf. interval 1969 MRP ,756 MRP LRP LRP URP URP MRP ,974 MRP LRP LRP URP URP MRP ,314 MRP LRP LRP URP URP MRP ,330 MRP LRP LRP URP URP MRP ,089 MRP LRP LRP URP URP MRP ,821 MRP LRP LRP URP URP MRP ,586 MRP LRP LRP URP URP MRP ,010 MRP LRP LRP URP URP MRP ,232 MRP LRP LRP URP URP MRP ,926 MRP LRP LRP URP URP Note: MRP stands for median polarization index; LRP and URP stand for lower and upper polarization index. Bootstrap SE (50 replications), Confidence interval at the 95% level. 21
23 5.2 Germany Table 8. Relative Polarization Index, Germany (reference year 2010, obs.) Comparison year Ex-ante income # Obs. Ex-post income Index Coef. SE Confidence Index Coef. SE Confidence interval 1973 MRP MRP LRP LRP URP URP MRP MRP LRP LRP URP URP MRP MRP LRP LRP URP URP MRP MRP LRP LRP URP URP MRP MRP LRP LRP URP URP MRP MRP LRP LRP URP URP MRP MRP LRP LRP URP URP MRP MRP LRP LRP URP URP MRP MRP LRP LRP URP URP MRP MRP LRP LRP URP URP Note: MRP stands for median polarization index; LRP and URP stand for lower and upper polarization index. Bootstrap SE (50 replications), Confidence interval at the 95% level. 22
24 5.3 France Table 9. Relative Polarization Index, France (reference year 2010, obs.) Mone + non mon Ex-post income Comparison year # Obs. Index Coef. SE Confidence interval MRP LRP URP MRP LRP URP MRP LRP URP MRP LRP URP MRP LRP URP MRP LRP URP Note: MRP stands for median polarization index; LRP and URP stand for lower and upper polarization index. Bootstrap SE (50 replications), Confidence interval at the 95% level. 23
25 5.4 Spain Table 10. Relative Polarization Index, Spain (reference year 2010, obs.) Mon + non mon Comparison year Ex-post income # Obs. Index Coef. SE Confidence interval MRP LRP URP MRP LRP URP MRP LRP URP MRP LRP URP MRP LRP URP MRP LRP URP Ex-post income Ex-ante income MRP MRP LRP LRP URP URP Note: MRP stands for median polarization index; LRP and URP stand for lower and upper polarization index. Bootstrap SE (50 replications), Confidence interval at the 95% level. 24
26 5.5 Italy Table 11. Relative Polarization Index, Italy (reference year 2010, obs.) Mon+non mon Ex-post income Comparison year # Obs. Index Coef. SE Confidence interval MRP LRP URP MRP LRP URP MRP LRP URP MRP LRP URP MRP LRP URP MRP LRP URP MRP LRP URP MRP LRP URP MRP LRP URP MRP LRP URP Note: MRP stands for median polarization index; LRP and URP stand for lower and upper polarization index. Bootstrap SE (50 replications), Confidence interval at the 95% level. 25
27 5.6 Poland Table 12. Relative Polarization Index, Poland (reference year 2010, obs.) Comparison year # Obs. Ex-post income Ex-ante income Index Coef. SE MRP LRP URP MRP LRP URP MRP LRP URP Confidence interval Index Coef. SE Confidence interval MRP MRP LRP LRP URP URP MRP MRP LRP LRP URP URP MRP MRP LRP LRP URP URP Note: MRP stands for median polarization index; LRP and URP stand for lower and upper polarization index. Bootstrap SE (50 replications), Confidence interval at the 95% level. 26
28 6. Summary and conclusions This paper analyzed the pattern of income polarization in six European countries, i.e. United Kingdom, Germany, France, Spain, Italy and Poland. We applied the relative distribution analysis (Handcock and Morris, 1998), a non-parametric approach to visualize and analyze differences in distributions, and compare the data with a reference year set to the most recent available information, that is Despite its descriptive nature, this paper contributes to the literature by computing both exante and ex-post income using the updated LIS database containing information until Beyond the extension of the existing income series, this work considers both monetary and monetary plus non-monetary sources of income, which make a difference in Poland. Our main result is that, compared to 2010, market income polarization was lower in the past. In particular, we observe a slow convergence to highest levels of polarization beginning in the 1980s. The degree of relative polarization of disposable income is always lower than the one of market income. The welfare state, as expected, acts as a smoother of the distribution and improves equality. Nonetheless, the pattern is generally pointing to a larger degree of polarization in all the countries except for Italy, where we observe a fluctuating pattern close to null relative polarization. Finally, in all the countries downgrading prevails over upgrading: the relevance of the middle-class getting poorer is larger than the one of the middle-class getting richer. The effectiveness of the welfare state in mitigating polarization is hard to evaluate, but if we look at the pattern of relative polarization in both ex-ante and ex-post income, which is possible for the United Kingdom and Germany, we observe some interesting pattern. In fact, over time income polarization increases but disposable income polarization grows more slowly, making us claim for a time increasing effectiveness of the equalizing role of the welfare state. 27
29 References Abadie, A., Diamond, A., & Hainmueller, J. (2014). Comparative politics and the synthetic control method. American Journal of Political Science, forthcoming Aiginger, K., and Guger, A Stylized facts on the interaction between income distribution and the Great Recession. Economics Discussion Papers n Alderson, A. S., and Doran K How has income inequality grown? The reshaping of the income distribution in LIS countries. In: a paper prepared for presentation at the conference on Inequality and the Status of the Middle Class: lessons from the Luxembourg Income Study, Luxembourg. Alderson, A. S., and Nielsen F Globalization and the Great U-turn: Income Inequality Trends in 16 OECD Countries. American Journal of Sociology 107: Alderson, A. S., Beckfield J., and Nielsen F Exactly How Has Income Inequality Changed? Patterns of Distributional Change in Core Societies. International Journal of Comparative Sociology 46: Atkinson, A. B., and Brandolini, A Promise and pitfalls in the use of "secondary" data-sets: Income inequality in OECD countries as a case study. Journal of economic literature, Bernhardt, A., Morris, M., and Handcock, M. S Economic Inequality: New Methods for New Trends. American Sociological Review 59: Bernhardt, A., Morris, M., and Handcock, M. S Women's gains or men's losses? A closer look at the shrinking gender gap in earnings. American journal of sociology Biewen, M., and Juhasz, A Understanding Rising Income Inequality in Germany, 1999/ /2006. Review of Income and Wealth, 58(4), Bourguignon, F The growth elasticity of poverty reduction: explaining heterogeneity across countries and time periods. In: Eicher, T. and Turnovsky, S. (Eds.) Inequality and growth: Theory and policy implications, MIT Press. Bourguignon, F The poverty-growth-inequality triangle. World Bank. Brandolini, A. and Smeeding T.M Income Inequality in richer and OECD countries. In Salverda, W., Nolan, B. and Smeeding, T.M. (eds.) The Oxford Handbook of Economic Inequality, Oxford University Press, Oxford UK. Brzezinski, M Income polarization and economic growth. National Bank of Poland Working Paper 147. Clementi, F., Dabalen, A. L., Molini, V., and Schettino, F Economic Polarization: The Dark Side of Nigeria. In: IFW Centenary Conference Fair and Sustainable Prosperity in the Global Economy, Kiel, Germany. 28
30 Duclos, J.-Y., Esteban, J., and Ray, D Polarization: concepts, measurement, Estimation. Econometrica, 72(6): Esteban, J., Mayoral, L., and Ray, D Ethnicity and conflict: An empirical study. The American Economic Review 102(4): Duro, J.A Another look to income polarization across countries. Journal of Policy Modeling 27(9): Easterly, W The middle class consensus and economic development. Journal of economic growth 6(4): Esteban, J., and Ray, D Linking conflict to inequality and polarization. The American Economic Review 101(4): Esteban, J., and Ray, D On the measurement of polarization. Econometrica, 62(4): Esteban, J., Gradín, C., and Ray, D An extension of a measure of polarization, with an application to the income distribution of five OECD countries. The Journal of Economic Inequality 5(1): Esteban, J., and Ray, D Conflict and distribution. Journal of Economic Theory, 87(2): Foster, J. E., and Wolfson, M. C Polarization and the decline of the middle class: Canada and the US. The Journal of Economic Inequality 8(2): Fredriksen, K.B Inequality in the European Union. OECD Economic Department Working Papers no OECD, Paris. Grabka, M. M., and Frick, J. R The Shrinking German Middle Class: Signs of Long-Term Polarization in Disposable Income? Weekly Report 4(4): Gradín, C Polarization by sub-populations in Spain. Review of Income and Wealth, 46(4): Gradín, C Polarization and inequality in Spain: Journal of Income Distribution 11(1): Handcock, M. S., and Morris, M Relative distribution methods. Sociological Methodology 28(1): Handcock, M. S., and Morris, M Relative Distribution Methods in the Social Sciences. New York: Springer-Verlag. Hellebrandt, T Income inequality developments in the great recession. Policy Brief Number PB14-3. Peterson Institute for International Economics. Hills, J Thatcherism, New Labour and the welfare state. LSE mimeo, London. Jann, B Relative distribution methods in Stata. 6th German Stata Users. 29
31 Kakwani, N Poverty and economic growth with application to Côte d'ivoire. Review of Income and Wealth 39(2): Luxembourg Income Study Database (LIS), (multiple countries; microdata accessed from July 2014 to December 2014). Luxembourg: LIS. Massari, R Is income becoming more polarized in Italy? A closer look with a distributional approach. La Sapienza University, mimeo. Massari, R., Pittau M. G., and Zelli R A dwindling middle class? Italian evidence in the 2000s. Journal of Economic Inequality, 7(4): Massari, R., Pittau M. G., and Zelli R Do Spatial Price Indices Reshuffle the Italian Income Distribution? Modern Economy 2: Milanovic, B The median-voter hypothesis, income inequality, and income redistribution: an empirical test with the required data. European Journal of Political Economy 16(3): Pressman, S The decline of the middle class: an international perspective. Journal of Economic Issues: Reynal-Querol, M Ethnicity, political systems, and civil wars. Journal of Conflict Resolution 46(1): Scervini, F Empirics of the median voter: democracy, redistribution and the role of the middle class. The Journal of Economic Inequality 10(4): Schmidt, A Statistical measurement of income polarization: a cross-national comparison, presented at Berlin 10th International conference on panel data. Seshanna, S., and Decornez, S Income polarization and inequality across countries: an empirical study. Journal of Policy Modeling 25(4): Smeeding, T. M., Schmauss, G., and Allegrezza, S An Introduction to LIS. Luxembourg Income Study. Wang, Y., and Tsui, K Polarization orderings and new classes of polarization indices. Journal of Public Economic Theory 2(3): Wolfson, M. C When inequalities diverge. The American Economic Review,
32 Appendix A. Ex-ante and ex-post income distribution: measurement issues Using LIS notation in the "Definition of summary income variables", we can sum the income variables in Milanovic (2000) as: [A1] GROSS FI P = FI+SOCTRANS [A2] DISPOSABLE FI P = MI+PRIVATI+V36+SOCTRANS-PAYROLL-V11 where FI P = MI+PRIVATI+V36+V19 and FI=MI+PRIVATI+V36. Scervini (2012) builds on Milanovic (2000) and defines "market income, or ex-ante income, as the sum of earnings from any source of income and pensions, and disposable income, or ex-post income, as the sum of market income plus all the social transfers, minus all income taxes and pension contributions. [...] Using LIS notation in the "Definition of summary income variables": market income=mi+privati+v19, analogous to factor P income in Milanovic (2000), disposable income=mi+privati+soctrans-payroll-v11, where V11 are income taxes" (pages ). To sum up, it is exactly as in Milanovic (2000): [A3] Y M =FI P = MI+PRIVATI+V19+V36 (note: V36 not defined but included) [A4] Y D = MI+PRIVATI(+V36)+SOCTRANS-PAYROLL-V11 In 2011 the LIS database has been restructured, and the current data have been aggregated under different labels. Specifically, part of old MI is now already moved to transfers. we checked the documents available on the lisdatacenter.org website to match the old version variables with the new ones. A perfect match is hard to find. The LIS defines disposable household income as: [A5] DHI=HI-HXIT where HI=HIL+HIC+HIT, HIL+HIC=FACTOR, HITS=SOCRED, HITP=PRIVRED, PENSION=HITSIL+HITSUP+HITSAP+HICVIP. We therefore computed a measure of disposable income to match the disposable household income provided by the LIS, labeled DHI: [A6] DHI~Y d =FACTOR+PRIVRED+SOCRED+V36-PAYROLL-TAXES =HMIL+HMIC+HMIT +HM_OTHER-HMXIT We verified the similarity of the series through a set of descriptive statistics. 31
33 Pensions are included into HMITS (social security transfers). HMIT=HMITP+HMITS+e, where e is a residual. Therefore, we use the aggregate HMIT instead of the two components separately. We then start from Y D to obtain a measure of market income. [A7] Y m =FACTOR+PRIVRED+PENSION+V36 = Y d +HMXIT-HIT+ITSUPO+ITSUPS+ITSAPO+ITSAPS Once computed ex-ante and ex-post income, that we label respectively Y m and Y d, we divide for the square root of the household size to obtain individual income: [A8] Y *i =Y i /N 0.5 where i=(m, d) and N=NHHMEM B. Comparison with the Gini indexes of Scervini (2012) We can compute only disposable income Y d for countries with NET dataset. We can compute both for 169 datasets (+62.5% observations with respect to Scervini, 2012). Specifically, there are 157 gross datasets, 12 mixed and 63 net 12. The following Graphs show the match between our Gini series and the Scervini (2012) one. Table B1. List of countries Country id Country id Belgium 1 Netherlands 13 Brazil 2 Norway 14 Canada 3 Poland 15 Czech Republic 4 Romania 16 Denmark 5 Slovak Republic 17 Finland 6 South Korea 18 France 7 Sweden 19 Germany 8 Switzerland 20 Guatemala 9 Taiwan 21 Ireland 10 United Kingdom 22 Israel 11 United States 23 Luxembourg 12 Netherlands Here we perform a comparison with Scervini (2012) series, but we could compare our GINIs also with alltheginis dataset (Milanovic, 2014) and the Standardized World Income Inequality Database (Solt, 2014). This exercise is left for future research. 32
34 The discrepancy in DHI and Y D is larger for Sweden and Norway (beginning of the series). Since DHI is the benchmark disposable income computed by LIS, we suppose that the discrepancy derives from the fact that the new classification does not compare with the old one. The discrepancy in the series of market income is larger for the same countries plus Belgium, Netherlands and Poland. Some descriptive statistics regarding the pension variables and hmic (those who do not have a non-monetary value) confirm that hm*=h*, e.g. hmic=hic. Nonetheless, note that IL non-monetary >0 in Norway at the beginning of the series and IT non-monetary>0 in Poland (therefore it is better to use total amounts for Norway and Poland). We do not report any anomaly in the descriptive statistics for Belgium, Netherlands and Sweden. Finally, we report that there are some missing datasets present in the Scervini (2012) series but unavailable in the updated version of LIS. They are: France 1979, Netherlands 1991, 1994 and United States For more information see 33
35 Table B2. Market income Gini index year S_Gini YM Gini YM Note. Own elaboration from LIs data. S_Gini YM is the Scervini (2012) series, Gini YM is our series. 34
36 Table B3. Disposable income Gini index year S_Gini YD Gini YD Note. Own elaboration from LIs data. S_Gini YD is the Scervini (2012) series, Gini YD is our series. 35
37 Table B4. Disposable income Gini index, LIS DHI year S_Gini YD Gini DHI Note. Own elaboration from LIs data. S_Gini YM is the Scervini (2012) series, Gini DHI is disposable income available from LIS. 36
38 README For each income variable, for each country and for each considered year t, there are three figures. In each panel the red line drawn at y=1 is the reference distribution referring to the year The blue line represent the relative distance, being the dotted blue lines the boundaries of the confidence interval. The three graphs illustrate respectively the shape, the location component, and the overall relative distance. The shape effect depicts the relative distance obtained by superimposing the probability distribution functions, keeping fixed the position of the distribution and focusing on the differences in the shape. The location effect, on the other hand, illustrates the effect of a shift leftward or rightward of the income distribution, keeping the curvature fixed. Since the graphs tell the same story in a different way, for sake of conciseness we focus the comments on the RP indexes. 37


39 APPENDIX C1: RELATIVE DISTRIBUTION GRAPHS, EX-ANTE INCOME C1.1 United Kingdom

40
41
42

43
44
45
46
47
48

49 C1.2 Germany

50
51

52
53
54


55
56
57
58
59 C1.3 Spain
60 C1.4 Poland
61
62
63 APPENDIX C2: RELATIVE DISTRIBUTION GRAPHS, EX POST INCOME C2.1 United Kingdom
64
65
66
67
68
69
70
71
72
73 C2.2. Germany
74
75
76

77
78
79
80

81
82
83 C2.3 France
84
85
86
87
88
89 C2.4 Spain

90
91
92

93
INCOME DISTRIBUTION AND INEQUALITY IN LUXEMBOURG AND THE NEIGHBOURING COUNTRIES,
 INCOME DISTRIBUTION AND INEQUALITY IN LUXEMBOURG AND THE NEIGHBOURING COUNTRIES, 1995-2013 by Conchita d Ambrosio and Marta Barazzetta, University of Luxembourg * The opinions expressed and arguments employed
Income Polarization in Brazil, : A Distributional Analysis Using PNAD Data
 Income Polarization in Brazil, 2001 2011: A Distributional Analysis Using PNAD Data F. Clementi 1 and F. Schettino 2 1 Department of Political Science, Communication and International Relations, University
An Analysis of Public and Private Sector Earnings in Ireland
 An Analysis of Public and Private Sector Earnings in Ireland 2008-2013 Prepared in collaboration with publicpolicy.ie by: Justin Doran, Nóirín McCarthy, Marie O Connor; School of Economics, University
Basic income as a policy option: Technical Background Note Illustrating costs and distributional implications for selected countries
 May 2017 Basic income as a policy option: Technical Background Note Illustrating costs and distributional implications for selected countries May 2017 The concept of a Basic Income (BI), an unconditional
Potential Output in Denmark
 43 Potential Output in Denmark Asger Lau Andersen and Morten Hedegaard Rasmussen, Economics 1 INTRODUCTION AND SUMMARY The concepts of potential output and output gap are among the most widely used concepts
Income and Wealth Inequality in OECD Countries
 DOI: 1.17/s1273-16-1946-8 Verteilung -Vergleich Horacio Levy and Inequality in Countries The has longstanding experience in research on income inequality, with studies dating back to the 197s. Since 8
The Use of Accounting Information to Estimate Indicators of Customer and Supplier Payment Periods
 The Use of Accounting Information to Estimate Indicators of Customer and Supplier Payment Periods Conference Uses of Central Balance Sheet Data Offices Information IFC / ECCBSO / CBRT Özdere-Izmir, September
It is now commonly accepted that earnings inequality
 What Is Happening to Earnings Inequality in Canada in the 1990s? Garnett Picot Business and Labour Market Analysis Division Statistics Canada* It is now commonly accepted that earnings inequality that
METHODOLOGICAL ISSUES IN POVERTY RESEARCH
 METHODOLOGICAL ISSUES IN POVERTY RESEARCH IMPACT OF CHOICE OF EQUIVALENCE SCALE ON INCOME INEQUALITY AND ON POVERTY MEASURES* Ödön ÉLTETÕ Éva HAVASI Review of Sociology Vol. 8 (2002) 2, 137 148 Central
Incomes Across the Distribution Dataset
 Incomes Across the Distribution Dataset Stefan Thewissen,BrianNolan, and Max Roser April 2016 1Introduction How widely are the benefits of economic growth shared in advanced societies? Are the gains only
2.5. Income inequality in France
 2.5 Income inequality in France Information in this chapter is based on Income Inequality in France, 1900 2014: Evidence from Distributional National Accounts (DINA), by Bertrand Garbinti, Jonathan Goupille-Lebret
Online Appendix from Bönke, Corneo and Lüthen Lifetime Earnings Inequality in Germany
 Online Appendix from Bönke, Corneo and Lüthen Lifetime Earnings Inequality in Germany Contents Appendix I: Data... 2 I.1 Earnings concept... 2 I.2 Imputation of top-coded earnings... 5 I.3 Correction of
Dual Income Polarization by Age Groups in Korea:
 Dual Income Polarization by Age Groups in Korea: 1990 2014 Byung In Lim 1, Sung Tai Kim 2 and Myoungkyu Kim 3 Abstract This study aims to find the income polarization trends by dividing households into
Household Income Distribution and Working Time Patterns. An International Comparison
 Household Income Distribution and Working Time Patterns. An International Comparison September 1998 D. Anxo & L. Flood Centre for European Labour Market Studies Department of Economics Göteborg University.
Applying Generalized Pareto Curves to Inequality Analysis
 Applying Generalized Pareto Curves to Inequality Analysis By THOMAS BLANCHET, BERTRAND GARBINTI, JONATHAN GOUPILLE-LEBRET AND CLARA MARTÍNEZ- TOLEDANO* *Blanchet: Paris School of Economics, 48 boulevard
Striking it Richer: The Evolution of Top Incomes in the United States (Updated with 2009 and 2010 estimates)
") Striking it Richer: The Evolution of Top Incomes in the United States (Updated with 2009 and 2010 estimates) Emmanuel Saez March 2, 2012 What s new for recent years? Great Recession 2007-2009 During the
Striking it Richer: The Evolution of Top Incomes in the United States (Updated with 2009 and 2010 estimates) Emmanuel Saez March 2, 2012 What s new for recent years? Great Recession 2007-2009 During the
EMPLOYMENT EARNINGS INEQUALITY IN IRELAND 2006 TO 2010
 EMPLOYMENT EARNINGS INEQUALITY IN IRELAND 2006 TO 2010 Prepared in collaboration with publicpolicy.ie by: Nóirín McCarthy, Marie O Connor, Meadhbh Sherman and Declan Jordan School of Economics, University
Growth and Productivity in Belgium
 Federal Planning Bureau Kunstlaan/Avenue des Arts 47-49, 1000 Brussels http://www.plan.be WORKING PAPER 5-07 Growth and Productivity in Belgium March 2007 Bernadette Biatour, bbi@plan.b Jeroen Fiers, jef@plan.
ANNEX 3. The ins and outs of the Baltic unemployment rates
 ANNEX 3. The ins and outs of the Baltic unemployment rates Introduction 3 The unemployment rate in the Baltic States is volatile. During the last recession the trough-to-peak increase in the unemployment
INCOME DISTRIBUTION DATA REVIEW POLAND
 INCOME DISTRIBUTION DATA REVIEW POLAND 1. Available data sources used for reporting on income inequality and poverty 1.1. OECD reporting: OECD income distribution and poverty indicators for Poland are
Budgetary challenges posed by ageing populations:
 ECONOMIC POLICY COMMITTEE Brussels, 24 October, 2001 EPC/ECFIN/630-EN final Budgetary challenges posed by ageing populations: the impact on public spending on pensions, health and long-term care for the
Ireland's Income Distribution
 Ireland's Income Distribution Micheál L. Collins Introduction Judged in an international context, Ireland is a high income country. The 2014 United Nations Human Development Report ranks Ireland as having
Household Income and Asset Distribution in Korea
 Household Income and Asset Distribution in Korea Sang-ho Nam Research Fellow, KIHASA Introduction This study bases its analysis of household and asset distribution on the Household Finances and Welfare
Trends in Income Inequality in Ireland
 Trends in Income Inequality in Ireland Brian Nolan CPA, March 06 What Happened to Income Inequality? Key issue: what happened to the income distribution in the economic boom Widely thought that inequality
SENSITIVITY OF THE INDEX OF ECONOMIC WELL-BEING TO DIFFERENT MEASURES OF POVERTY: LICO VS LIM
 August 2015 151 Slater Street, Suite 710 Ottawa, Ontario K1P 5H3 Tel: 613-233-8891 Fax: 613-233-8250 csls@csls.ca CENTRE FOR THE STUDY OF LIVING STANDARDS SENSITIVITY OF THE INDEX OF ECONOMIC WELL-BEING
The Gertler-Gilchrist Evidence on Small and Large Firm Sales
 The Gertler-Gilchrist Evidence on Small and Large Firm Sales VV Chari, LJ Christiano and P Kehoe January 2, 27 In this note, we examine the findings of Gertler and Gilchrist, ( Monetary Policy, Business
INCOME DISTRIBUTION AND POVERTY IN THE OECD AREA: TRENDS AND DRIVING FORCES
 OECD Economic Studies No. 34, 22/I INCOME DISTRIBUTION AND POVERTY IN THE OECD AREA: TRENDS AND DRIVING FORCES Michael Förster and Mark Pearson TABLE OF CONTENTS Introduction... 8 Main trends in the distribution
Income Inequality in Korea,
 Income Inequality in Korea, 1958-2013. Minki Hong Korea Labor Institute 1. Introduction This paper studies the top income shares from 1958 to 2013 in Korea using tax return. 2. Data and Methodology In
Maurizio Franzini and Mario Planta
 Maurizio Franzini and Mario Planta 2 premises: 1. Inequality is a burning issue for economic, ethical and political reasons (Sen, Stiglitz, Piketty and many others ) 2. Inequality is today a more complex
Wealth inequality in the euro area
 Wealth inequality in the euro area Results of the Household Finance and Consumption Surveys 2010 and 2014 Aurel Schubert 23 June 2017 The views expressed are those of the speaker and not necessarily those
Trends and episodes of income distribution change in Hungary
 CEPS-Intereconomics-ZBW conference Inequality in Europe: What Can Be Done? What Should Be Done? Friday, 11 October 13 Trends and episodes of income distribution change in Hungary István György Tóth Tárki
The Distributions of Income and Consumption. Risk: Evidence from Norwegian Registry Data
 The Distributions of Income and Consumption Risk: Evidence from Norwegian Registry Data Elin Halvorsen Hans A. Holter Serdar Ozkan Kjetil Storesletten February 15, 217 Preliminary Extended Abstract Version
Effects of taxes and benefits on UK household income: financial year ending 2017
 Statistical bulletin Effects of taxes and benefits on UK household income: financial year ending 2017 Analysis of how household incomes in the UK are affected by direct and indirect taxes and benefits
Global population projections by the United Nations John Wilmoth, Population Association of America, San Diego, 30 April Revised 5 July 2015
 Global population projections by the United Nations John Wilmoth, Population Association of America, San Diego, 30 April 2015 Revised 5 July 2015 [Slide 1] Let me begin by thanking Wolfgang Lutz for reaching
The Use of Accounting Information to Estimate Indicators of Customer and Supplier Payment Periods
 The Use of Accounting Information to Estimate Indicators of Customer and Supplier Payment Periods Pierrette Heuse David Vivet Dominik Elgg Timm Körting Luis Ángel Maza Antonio Lorente Adrien Boileau François
A Comparative Analysis of Subsidy Reforms in the Middle East and North Africa Region
 Policy Research Working Paper 7755 WPS7755 A Comparative Analysis of Subsidy Reforms in the Middle East and North Africa Region Abdelkrim Araar Paolo Verme Public Disclosure Authorized Public Disclosure
GENERAL GOVERNMENT REVENUE IN CERTAIN EUROPEAN UNION COUNTRIES
 Annals of the University of Petroşani, Economics, 10(2), 2010, 307-314 307 GENERAL GOVERNMENT REVENUE IN CERTAIN EUROPEAN UNION COUNTRIES CORINA ŞERBAN (BOICEANU), IOAN TALPOŞ * ABSTRACT: The paper presents
Income inequality and redistribution: What is the real role of taxation in Spain?
 Income inequality and redistribution: What is the real role of taxation in Spain? Jorge Onrubia Fernández Universidad Complutense de Madrid, FEDEA y GEN Valencia, June 19, 2015 Inequality in a Recessionary
Economic Inequality in Portugal: A Picture in the Beginnings of the 21st century
 MPRA Munich Personal RePEc Archive Economic Inequality in Portugal: A Picture in the Beginnings of the 21st century Santiago Budria University of Madeira and CEEAplA 2007 Online at http://mpra.ub.uni-muenchen.de/1784/
The 2008 Statistics on Income, Poverty, and Health Insurance Coverage by Gary Burtless THE BROOKINGS INSTITUTION
 The 2008 Statistics on Income, Poverty, and Health Insurance Coverage by Gary Burtless THE BROOKINGS INSTITUTION September 10, 2009 Last year was the first year but it will not be the worst year of a recession.
The Elephant Curve of Global Inequality and Growth *
 The Elephant Curve of Global Inequality and Growth * Facundo Alvaredo (Paris School of Economics, and Conicet); Lucas Chancel (Paris School of Economics and Iddri Sciences Po); Thomas Piketty (Paris School
Income inequality and the growth of redistributive spending in the U.S. states: Is there a link?
 Draft Version: May 27, 2017 Word Count: 3128 words. SUPPLEMENTARY ONLINE MATERIAL: Income inequality and the growth of redistributive spending in the U.S. states: Is there a link? Appendix 1 Bayesian posterior
The median voter hypothesis, income inequality and income redistribution: An empirical test with the required data.
 1 The median voter hypothesis, income inequality and income redistribution: An empirical test with the required data Branko Milanovic* Abstract World Bank, Development Research Group, Washington D.C. 20433
TOP INCOMES IN THE UNITED STATES AND CANADA OVER THE TWENTIETH CENTURY
 TOP INCOMES IN THE UNITED STATES AND CANADA OVER THE TWENTIETH CENTURY Emmanuel Saez University of California, Berkeley Abstract This paper presents top income shares series for the United States and Canada
Explaining Dualism in a Gender Perspective: Gender, Class and the Crisis
 Explaining Dualism in a Gender Perspective: Gender, Class and the Crisis Marcella Corsi, Sapienza University of Rome marcella.corsi@uniroma1.it Abstract In the economic literature, several scholars have
Tax Burden, Tax Mix and Economic Growth in OECD Countries
 Tax Burden, Tax Mix and Economic Growth in OECD Countries PAOLA PROFETA RICCARDO PUGLISI SIMONA SCABROSETTI June 30, 2015 FIRST DRAFT, PLEASE DO NOT QUOTE WITHOUT THE AUTHORS PERMISSION Abstract Focusing
Economic Life Cycle Deficit and Intergenerational Transfers in Italy: An Analysis Using National Transfer Accounts Methodology
 Economic Life Cycle Deficit and Intergenerational Transfers in Italy: An Analysis Using National Transfer Accounts Methodology Marina Zannella, Graziella Caselli Department of Statistical Sciences, Sapienza
between Income and Life Expectancy
 National Insurance Institute of Israel The Association between Income and Life Expectancy The Israeli Case Abstract Team leaders Prof. Eytan Sheshinski Prof. Daniel Gottlieb Senior Fellow, Israel Democracy
Can pro-growth policies lift all boats? An analysis based on household disposable incomes
 Can pro-growth policies lift all boats? An analysis based on household disposable incomes Orsetta Causa, Alain De Serres & Nicolas Ruiz OECD - Economics Department Motivation Factors distribution and the
Global economic inequality: New evidence from the World Inequality Report
 WID.WORLD THE SOURCE FOR GLOBAL INEQUALITY DATA Global economic inequality: New evidence from the World Inequality Report Lucas Chancel General coordinator, World Inequality Report Co-director, World Inequality
Introduction to De Economist Special Issue Retirement and Employment Opportunities for Older Workers
 De Economist (2013) 161:219 223 DOI 10.1007/s10645-013-9214-4 Introduction to De Economist Special Issue Retirement and Employment Opportunities for Older Workers Pierre Koning Received: 10 July 2013 /
Motivation and questions to be addressed
 REDISTRIBUTION, INEQUALITY, AND GROWTH Jonathan D. Ostry* Research Department, IMF IMF-Hitotsubashi Seminar on Inequality Tokyo, Japan March 12, 15 *The views expressed in this presentation are those of
Characteristics of the euro area business cycle in the 1990s
 Characteristics of the euro area business cycle in the 1990s As part of its monetary policy strategy, the ECB regularly monitors the development of a wide range of indicators and assesses their implications
The Effects of Increasing the Early Retirement Age on Social Security Claims and Job Exits
 The Effects of Increasing the Early Retirement Age on Social Security Claims and Job Exits Day Manoli UCLA Andrea Weber University of Mannheim February 29, 2012 Abstract This paper presents empirical evidence
Distributive Impact of Low-Income Support Measures in Japan
 Open Journal of Social Sciences, 2016, 4, 13-26 http://www.scirp.org/journal/jss ISSN Online: 2327-5960 ISSN Print: 2327-5952 Distributive Impact of Low-Income Support Measures in Japan Tetsuo Fukawa 1,2,3
Economics 448: Lecture 14 Measures of Inequality
 Economics 448: Measures of Inequality 6 March 2014 1 2 The context Economic inequality: Preliminary observations 3 Inequality Economic growth affects the level of income, wealth, well being. Also want
WEALTH INEQUALITY AND HOUSEHOLD STRUCTURE: US VS. SPAIN. Olympia Bover
 WEALTH INEQUALITY AND HOUSEHOLD STRUCTURE: US VS. SPAIN Olympia Bover 1 Introduction and summary Dierences in wealth distribution across developed countries are large (eg share held by top 1%: 15 to 35%)
Growth, Inequality, and Social Welfare: Cross-Country Evidence
 Growth, Inequality, and Social Welfare 1 Growth, Inequality, and Social Welfare: Cross-Country Evidence David Dollar, Tatjana Kleineberg, and Aart Kraay Brookings Institution; Yale University; The World
Is there a decoupling between soft and hard data? The relationship between GDP growth and the ESI
 Fifth joint EU/OECD workshop on business and consumer surveys Brussels, 17 18 November 2011 Is there a decoupling between soft and hard data? The relationship between GDP growth and the ESI Olivier BIAU
17 January 2019 Japan Laurence Boone OECD Chief Economist
 Fiscal challenges and inclusive growth in ageing societies 17 January 219 Japan Laurence Boone OECD Chief Economist G2 populations are ageing rapidly Expected life expectancy at age 65 198 215 26 Japan
HOUSEHOLDS INDEBTEDNESS: A MICROECONOMIC ANALYSIS BASED ON THE RESULTS OF THE HOUSEHOLDS FINANCIAL AND CONSUMPTION SURVEY*
 HOUSEHOLDS INDEBTEDNESS: A MICROECONOMIC ANALYSIS BASED ON THE RESULTS OF THE HOUSEHOLDS FINANCIAL AND CONSUMPTION SURVEY* Sónia Costa** Luísa Farinha** 133 Abstract The analysis of the Portuguese households
ECON 1100 Global Economics (Fall 2013) The Distribution Function of Government portions for Exam 3
 The Distribution Function of Government portions for Exam 3") ECON Global Economics (Fall 23) The Distribution Function of Government portions for Exam 3 Relevant Readings from the Required Textbooks: Economics Chapter 2, Income Distribution and Poverty Problems
ECON Global Economics (Fall 23) The Distribution Function of Government portions for Exam 3 Relevant Readings from the Required Textbooks: Economics Chapter 2, Income Distribution and Poverty Problems
Trends in Income and Expenditure Inequality in the 1980s and 1990s
 National Centre for Social and Economic Modelling University of Canberra Trends in Income and Expenditure Inequality in the 1980s and 1990s Ann Harding and Harry Greenwell Paper Presented to the 30 th
INCOME DISTRIBUTION DATA REVIEW - IRELAND
 INCOME DISTRIBUTION DATA REVIEW - IRELAND 1. Available data sources used for reporting on income inequality and poverty 1.1 OECD Reportings The OECD have been using two types of data sources for income
The Long Term Evolution of Female Human Capital
 The Long Term Evolution of Female Human Capital Audra Bowlus and Chris Robinson University of Western Ontario Presentation at Craig Riddell s Festschrift UBC, September 2016 Introduction and Motivation
Can pro-growth policies lift all boats? An analysis based on household disposable incomes
 Can pro-growth policies lift all boats? An analysis based on household disposable incomes Orsetta Causa, Alain De Serres, Mikkel Hermansen & Nicolas Ruiz OECD - Economics Department Motivation Factors
Online Appendix: Revisiting the German Wage Structure
 Online Appendix: Revisiting the German Wage Structure Christian Dustmann Johannes Ludsteck Uta Schönberg This Version: July 2008 This appendix consists of three parts. Section 1 compares alternative methods
Income and Non-Income Inequality in Post- Apartheid South Africa: What are the Drivers and Possible Policy Interventions?
 Income and Non-Income Inequality in Post- Apartheid South Africa: What are the Drivers and Possible Policy Interventions? Haroon Bhorat Carlene van der Westhuizen Toughedah Jacobs Haroon.Bhorat@uct.ac.za
Topic 11: Measuring Inequality and Poverty
 Topic 11: Measuring Inequality and Poverty Economic well-being (utility) is distributed unequally across the population because income and wealth are distributed unequally. Inequality is measured by the
Online Appendix. Long-term Changes in Married Couples Labor Supply and Taxes: Evidence from the US and Europe Since the 1980s
 Online Appendix Long-term Changes in Married Couples Labor Supply and Taxes: Evidence from the US and Europe Since the 1980s Alexander Bick Arizona State University Nicola Fuchs-Schündeln Goethe University
Journal of Insurance and Financial Management, Vol. 1, Issue 4 (2016)
") Journal of Insurance and Financial Management, Vol. 1, Issue 4 (2016) 68-131 An Investigation of the Structural Characteristics of the Indian IT Sector and the Capital Goods Sector An Application of the
Journal of Insurance and Financial Management, Vol. 1, Issue 4 (2016) 68-131 An Investigation of the Structural Characteristics of the Indian IT Sector and the Capital Goods Sector An Application of the
Comparing Estimates of Family Income in the Panel Study of Income Dynamics and the March Current Population Survey,
 Comparing Estimates of Family Income in the Panel Study of Income Dynamics and the March Current Population Survey, 1968-1999. Elena Gouskova and Robert F. Schoeni Institute for Social Research University
Impact of the Capital Requirements Regulation (CRR) on the access to finance for business and long-term investments Executive Summary
 on the access to finance for business and long-term investments Executive Summary") Impact of the Capital Requirements Regulation (CRR) on the access to finance for business and long-term investments Executive Summary Prepared by The information and views set out in this study are those
Impact of the Capital Requirements Regulation (CRR) on the access to finance for business and long-term investments Executive Summary Prepared by The information and views set out in this study are those
The Gender Earnings Gap: Evidence from the UK
 Fiscal Studies (1996) vol. 17, no. 2, pp. 1-36 The Gender Earnings Gap: Evidence from the UK SUSAN HARKNESS 1 I. INTRODUCTION Rising female labour-force participation has been one of the most striking
Macroeconomics Review Course LECTURE NOTES
 Macroeconomics Review Course LECTURE NOTES Lorenzo Ferrari frrlnz01@uniroma2.it August 11, 2018 Disclaimer: These notes are for exclusive use of the students of the Macroeconomics Review Course, M.Sc.
Supplement September Towards a better measurement of welfare and inequalities. September 2014 I 1
 Supplement September 214 Towards a better measurement of welfare and inequalities September 214 I 1 Social Europe This supplement to the Quarterly Review provides in-depth analysis of recent labour market
Labor force participation of the elderly in Japan
 Labor force participation of the elderly in Japan Takashi Oshio, Institute for Economics Research, Hitotsubashi University Emiko Usui, Institute for Economics Research, Hitotsubashi University Satoshi
The economic impact of increasing the National Minimum Wage and National Living Wage to 10 per hour
 The economic impact of increasing the National Minimum Wage and National Living Wage to 10 per hour A report for Unite by Howard Reed (Director, Landman Economics) June 2018 Acknowledgements This research
Online Appendix to: The Composition Effects of Tax-Based Consolidations on Income Inequality. June 19, 2017
 Online Appendix to: The Composition Effects of Tax-Based Consolidations on Income Inequality June 19, 2017 1 Table of contents 1 Robustness checks on baseline regression... 1 2 Robustness checks on composition
Eleni Karagiannaki. The empirical relationship between income poverty and income inequality in rich and middle income countries
 Understanding the Links between Inequalities and Poverty (LIP) Eleni Karagiannaki The empirical relationship between income poverty and income inequality in rich and middle income countries CApaper 206
Striking it Richer: The Evolution of Top Incomes in the United States (Updated with 2017 preliminary estimates)
") Striking it Richer: The Evolution of Top Incomes in the United States (Updated with 2017 preliminary estimates) Emmanuel Saez, UC Berkeley October 13, 2018 What s new for recent years? 2016-2017: Robust
Striking it Richer: The Evolution of Top Incomes in the United States (Updated with 2017 preliminary estimates) Emmanuel Saez, UC Berkeley October 13, 2018 What s new for recent years? 2016-2017: Robust
Does the Phillips curve hold for consumer survey data? 1
 EUROPEAN COMMISSION DIRECTORATE GENERAL ECONOMIC AND FINANCIAL AFFAIRS Policy strategy and co-ordination Economic situation, forecasts, business and consumer surveys Does the Phillips curve hold for consumer
University of Victoria. Economics 325 Public Economics SOLUTIONS
 University of Victoria Economics 325 Public Economics SOLUTIONS Martin Farnham Problem Set #5 Note: Answer each question as clearly and concisely as possible. Use of diagrams, where appropriate, is strongly
Heterogeneity in Returns to Wealth and the Measurement of Wealth Inequality 1
 Heterogeneity in Returns to Wealth and the Measurement of Wealth Inequality 1 Andreas Fagereng (Statistics Norway) Luigi Guiso (EIEF) Davide Malacrino (Stanford University) Luigi Pistaferri (Stanford University
AIM-AP. Accurate Income Measurement for the Assessment of Public Policies. Citizens and Governance in a Knowledge-based Society
 Project no: 028412 AIM-AP Accurate Income Measurement for the Assessment of Public Policies Specific Targeted Research or Innovation Project Citizens and Governance in a Knowledge-based Society Deliverable
1 Income Inequality in the US
 1 Income Inequality in the US We started this course with a study of growth; Y = AK N 1 more of A; K; and N give more Y: But who gets the increased Y? Main question: if the size of the national cake Y
Regional convergence in Spain:
 ECONOMIC BULLETIN 3/2017 ANALYTICAL ARTIES Regional convergence in Spain: 1980 2015 Sergio Puente 19 September 2017 This article aims to analyse the process of per capita income convergence between the
Women Leading UK Employment Boom
 Briefing Paper Feb 2018 Women Leading UK Employment Boom Published by The Institute for New Economic Thinking, University of Oxford Women Leading UK Employment Boom Summary Matteo Richiardi a, Brian Nolan
Effects of Tax-Based Saving Incentives on Contribution Behavior: Lessons from the Introduction of the Riester Scheme in Germany
 Modern Economy, 2016, 7, 1198-1222 http://www.scirp.org/journal/me ISSN Online: 2152-7261 ISSN Print: 2152-7245 Effects of Tax-Based Saving Incentives on Contribution Behavior: Lessons from the Introduction
Private non-financial sector indebtedness: where do we stand?
 HCSF/217/1-2-1 15 e séance Private non-financial sector indebtedness: where do we stand? The French private non-financial sector (households and firms) indebtedness registered a steady increase since the
INCOME INEQUALITY AND OTHER FORMS OF INEQUALITY. Sandip Sarkar & Balwant Singh Mehta. Institute for Human Development New Delhi
 INCOME INEQUALITY AND OTHER FORMS OF INEQUALITY Sandip Sarkar & Balwant Singh Mehta Institute for Human Development New Delhi 1 WHAT IS INEQUALITY Inequality is multidimensional, if expressed between individuals,
Socio-economic Series Changes in Household Net Worth in Canada:
 research highlight October 2010 Socio-economic Series 10-018 Changes in Household Net Worth in Canada: 1990-2009 introduction For many households, buying a home is the largest single purchase they will
Research Report No. 69 UPDATING POVERTY AND INEQUALITY ESTIMATES: 2005 PANORA SOCIAL POLICY AND DEVELOPMENT CENTRE
 Research Report No. 69 UPDATING POVERTY AND INEQUALITY ESTIMATES: 2005 PANORA SOCIAL POLICY AND DEVELOPMENT CENTRE Research Report No. 69 UPDATING POVERTY AND INEQUALITY ESTIMATES: 2005 PANORAMA Haroon
Trends in Retirement and in Working at Older Ages
 Pensions at a Glance 211 Retirement-income Systems in OECD and G2 Countries OECD 211 I PART I Chapter 2 Trends in Retirement and in Working at Older Ages This chapter examines labour-market behaviour of
Cyclical Changes in Short-Run Earnings Mobility in Canada, 1982 to 1996
 Cyclical Changes in Short-Run Earnings Mobility in Canada, 1982 to 1996 Charles M. Beach and Ross Finnie 1 Introduction This paper uses longitudinal income tax-based data for Canada to examine the cyclical
Inequality, poverty and the crisis in Greece
 Inequality, poverty and the crisis in Greece Manos Matsaganis & Chrysa Leventi Department of International and European Economics Athens University of Economics and Business ETUI Monthly Forum Brussels
Six-Year Income Tax Revenue Forecast FY
 Six-Year Income Tax Revenue Forecast FY 2017-2022 Prepared for the Prepared by the Economics Center February 2017 1 TABLE OF CONTENTS EXECUTIVE SUMMARY... i INTRODUCTION... 1 Tax Revenue Trends... 1 AGGREGATE
PNPM Incidence of Benefit Study:
 PNPM Incidence of Benefit Study: Overview findings from the Household Social Economic Survey 2012 (SUSETI) Background PNPM-Rural programs for public infrastructure and access to credit have attempted to
9. Real business cycles in a two period economy
 9. Real business cycles in a two period economy Index: 9. Real business cycles in a two period economy... 9. Introduction... 9. The Representative Agent Two Period Production Economy... 9.. The representative
The 30 years between 1977 and 2007
 Economic & Labour Market Review Vol 2 No 12 December 28 FEATURE Francis Jones, Daniel Annan and Saef Shah The distribution of household income 1977 to 26/7 SUMMARY This article describes how the distribution