COSUMNES COMMUNITY SERVICES DISTRICT
|
|
|
- Hester Barker
- 5 years ago
- Views:
Transcription
1
2
3 COSUMNES COMMUNITY SERVICES DISTRICT STATE OF CALIFORNIA The is the Local Government Provider of Fire & Emergency Services and Parks & Recreation Services COMPREHENSIVE ANNUAL FINANCIAL REPORT FOR THE FISCAL YEAR ENDED JUNE 30, 2015 Prepared by: Jeff Ramos, General Manager
4
5 Table of Contents INTRODUCTORY SECTION Table of Contents... i Letter of Transmittal... iii List of Principal Officials... viii Organization Chart... ix GFOA Certificate of Achievement... x FINANCIAL SECTION Independent Auditors Report... 1 Management s Discussion and Analysis... 3 Basic Financial Statements: Government-Wide Financial Statements: Statement of Net Position Statement of Activities and Changes in Net Position Fund Financial Statements: Balance Sheet Reconciliation of the Governmental Funds Balance Sheet to the Government-Wide Statement of Net Position Statement of Revenues, Expenditures and Changes in Fund Balances Reconciliation of the Governmental Funds Statement of Revenues, Expenditures and Changes in Fund Balances to the Government-Wide Statement of Activities and Changes in Net Position Notes to Basic Financial Statements Required Supplementary Information: Pension Plans (Unaudited) OPEB Plan Schedule of Funding Progress of (Unaudited) Budgetary Basis of Accounting Statement of Revenues, Expenditures and Changes in Fund Balances Budget and Actual Non-GAAP Budgetary Basis General Fund Statement of Revenues, Expenditures and Changes in Fund Balances Budget and Actual Non-GAAP Budgetary Basis Landscape and Lighting Special Revenue Fund Supplementary Information: Combining and Individual Fund Statements: Non-Major Governmental Funds: Combining Balance Sheet Combining Statement of Revenues, Expenditures and Changes in Fund Balances Page i
6 Table of Contents, Continued FINANCIAL SECTION, Continued Page Supplementary Information, Continued: General Fund Schedules: Schedule of Revenues Schedule of Expenditures Schedule of Expenditures and Other Financing Uses Compared to Budget Landscape and Lighting Special Revenue Fund Schedules: Balance Sheet Schedules by Benefit Zone Schedule of Revenues, Expenditures and Changes in Fund Balances by Benefit Zone Schedule of Revenues, Expenditures and Changes in Fund Balances by Benefit Zone Budget and Actual Capital Assets Used in the Operation of Governmental Funds: Comparative Schedules of Capital Assets by Source Schedule of Capital Assets by Function and Activity Schedule of Changes in Capital Assets by Function and Activity STATISTICAL SECTION (Unaudited) Statistical Section Narrative Net Position by Component Changes in Net Position Fund Balances of Governmental Funds Changes in Fund Balances of Governmental Funds Direct and Overlapping Property Tax Rates Principal Property Tax Payers Property Tax Levies and Collections Assessed Value and Estimated Actual Value of Taxable Property Ratios of Outstanding Debt by Type Direct and Overlapping Debt Legal Debt Margin Pledged-Revenue Coverage Demographic and Economic Statistics Principal Employers Full-Time District Employees by Function/Program Operating Indicators by Function/program Capital Asset Statistics by Function/Program ii
7
8
 for the fiscal year ended June 30, 2015, is hereby submitted.")
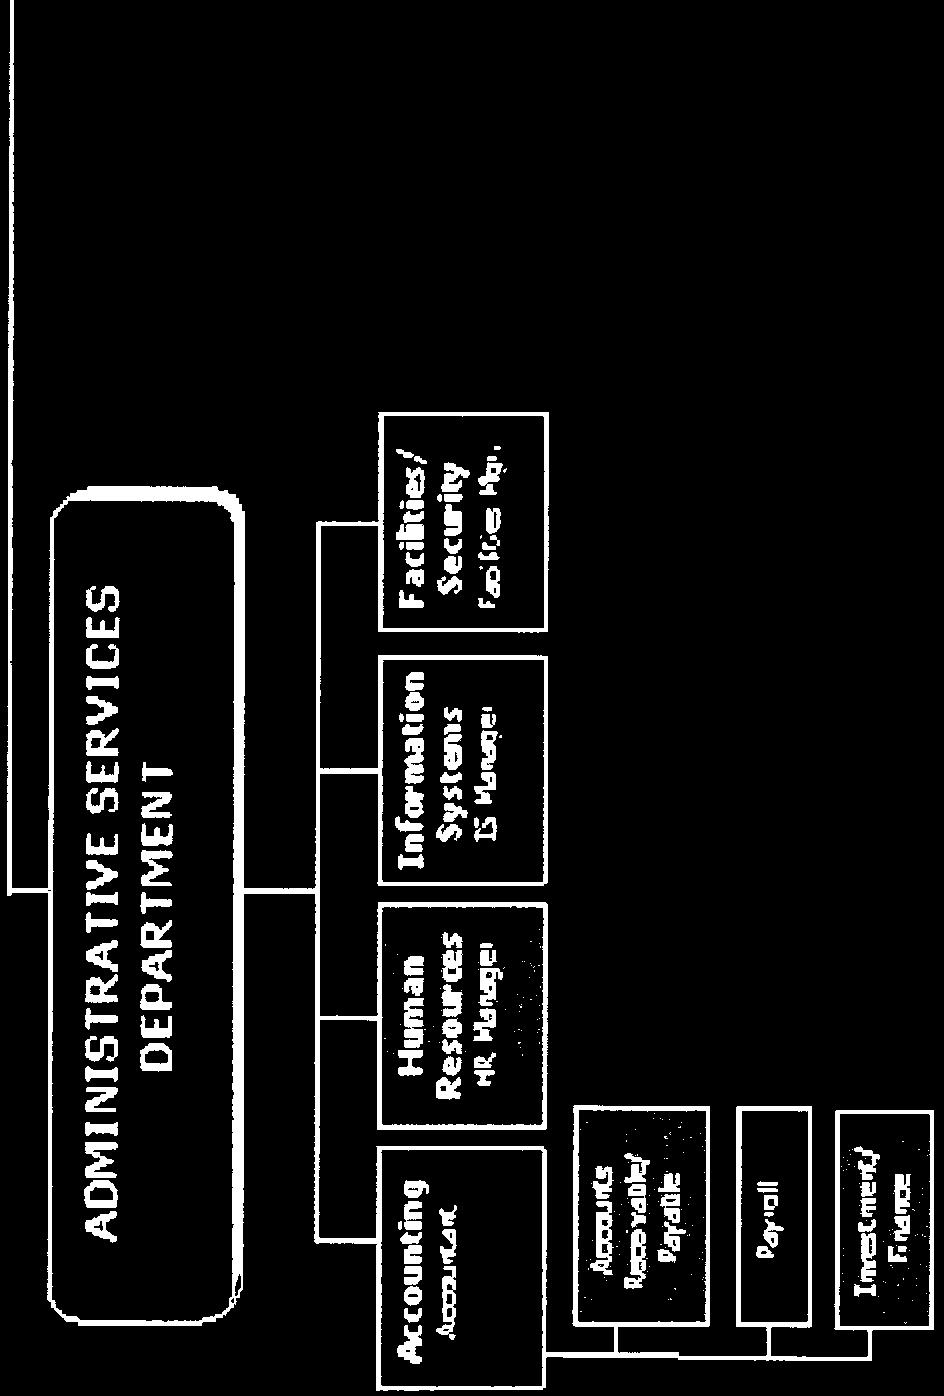
9 ADMINISTRATIVE SERVICES DEPARTMENT COMMUNICATIONS DIVISION 9355 East Stockton Blvd. Elk Grove, CA (916) Fax (916) December 30, 2015 Honorable Board of Directors The Comprehensive Annual Financial Report of the (District) for the fiscal year ended June 30, 2015, is hereby submitted. State law requires that every general-purpose local government publish within six months of the close of each fiscal year a complete set of audited financial statements. This report is published to fulfill that requirement for the fiscal year ended June 30, Management assumes full responsibility for the completeness and reliability of the information contained in this report, based upon a comprehensive framework of internal control that it has established for this purpose. Because the cost of internal control should not exceed anticipated benefits, the objective is to provide reasonable, rather than absolute, assurance that the financial statements are free of any material misstatements. The District s accounting records for governmental funds are maintained on the modified accrual basis of accounting. This essentially involves the recording of revenues when they become measurable and available and the recording of expenditures when goods and services are received and the related liability incurred. Badawi and Associates, Certified Public Accountants, have issued an unmodified ( clean ) opinion on the s financial statements for the fiscal year ended June 30, The independent auditor s report is located at the front of the financial section of this report. Management s discussion and analysis (MD&A) immediately follows the independent auditor s report and provides a narrative introduction, overview, and analysis of the basic financial statements. MD&A complement this letter of transmittal and should be read in conjunction with it. Profile of the Government The District is a political subdivision of the State of California. The Elk Grove Community Services District was established under Government Code Sections and 56439(c) on July 1, 1985, by a reorganization resulting in the dissolution of the Elk Grove Fire Protection District and the Elk Grove Recreation and Park District. In 2006, a reorganization of the Elk Grove CSD and the Galt Fire Protection District resulted in the creation of the. This change expanded the delivery of CSD fire protection and emergency medical services from the Elk Grove Region to the City of Galt and additional unincorporated areas in south Sacramento County. The governing body of the District is a five-member Board of Directors elected at large to four year staggered terms. Day-to-day operations are overseen by the District s General Manager. iii
10 The District provides fire protection services including fire suppression, fire prevention, inspection, plan checking and public education programs and provides emergency medical services, ambulance transport, advanced life support and rescue services and; in addition, provides parks, recreation facilities and programs. The District consists of approximately 157 square miles with a population of about 184,564; operates eight fire stations, one fire training facility and ninety-three parks (two undeveloped) and employs two hundred fifty-six full-time and over one hundred part-time staff. The District Wide Landscape & Lighting Assessment District, which was organized under the Landscaping and Lighting Act of 1972, operates within the District to fund some capital and all maintenance and operations of parks and is governed by the same Board of Directors. All parcels of land in the District Wide Landscape & Lighting Assessment District are assessed at varying rates depending upon established benefit zones. The Elk Grove Community Services District Foundation (the Foundation) was established on March 21, 1996 for the purpose of protecting lives through fire prevention educational programs, financially assisting residents who cannot afford to participate in recreational activities and beautifying the community of Elk Grove. On April 4, 1997, the Foundation was recognized as exempt under Section 501(c) (3) of the Internal Revenue Code. In June 2008, the Foundation was reorganized into an active community foundation. The name of the Foundation was changed to Cosumnes Legacy Foundation; the existing elected and appointed directors resigned their positions and seven (7) community members were appointed as Foundation Directors with two and three-year staggered terms. The Foundation is a legally separate component unit that is reported as a non-major governmental fund within the basic financial statements. The Elk Grove Community Services District Public Facilities Acquisition Corporation (the Corporation) was established in March 2006 to facilitate financing the acquisition of capital assets of the District. The Corporation s Board is comprised of the members of the District s Board of Directors. The Corporation does not have any assets or liabilities. Its activities have been blended with the appropriate District funds. No separate financial statements are issued for the Corporation. As required by the laws of the State of California, the District prepares and legally adopts a final operating budget on or before August 30 of each fiscal year. Each District department is required to submit their annual budget requests for the ensuing year. The General Manager reviews each request and a budget is presented to the Board of Directors. This budget reflects, as nearly as possible, the estimated revenues and expenditures for the upcoming year. The budget is made available for public inspection through a public notice. On the dates stated in the notice, the Board of Directors conducts public hearings on the budget and at the conclusion of the hearings makes a final determination thereon. Annual budgets are adopted for the General Fund, Capital Projects Fund, Debt Service Fund, and Landscape and Lighting Special Revenue Fund. Until the adoption of the final budget, operations are governed by the adopted preliminary budget approved by the Board prior to June 30th. The final budget serves as an approved plan for operational control and performance evaluation. The level of budgetary control (that is, the level at which expenditures cannot legally exceed the appropriated amount) is established at the object level of all budgetary units except for fixed assets, which are controlled on the sub-object level. The expenditure portion of the budget is enacted into law through the passage of an appropriation resolution. This resolution constitutes maximum iv
11 spending authorization for the fiscal year. It cannot be exceeded except by amendment of the budget by the Board of Directors. During , amendments were made to the final adopted budget. The budget data reflected in this comprehensive annual financial report includes the effect of all approved budget amendments. Monthly comparison of actual-to-budgeted revenues and expenditures identify significant variances that may require the District to take corrective action. Local Economy The Cosumnes CSD local economies is improving, and as the population continues to grow and as political leaders are focused on bringing business and commerce to the region, the demand for housing emerges. Further, in Sacramento County, an annual 10,400 wages and salary jobs were created, representing a growth rate of 2.4% for the year. This is the fourth annual increase for Sacramento County since before the recession of The unemployment -rate improved as well, falling from 6.9% in 2014 to 5.8% in The primary funding source of District operations is property taxes. Other revenue sources include recreation fees, ambulance fees, development impact fees and various other charges for services. Property tax revenues have increased by approximately 10% from the prior year but the current recovery has already lasted a year longer than the historic average despite soft U.S. economic growth, therefore the District is projecting an average annual growth in property tax revenues of 4% for next fiscal year. 20,000,000 15,000,000 Total Assessed Value 10,000,000 5,000, /01 06/07 08/09 10/11 12/13 14/15 The residential real estate market from a sales volume standpoint appears to be headed towards a more normal pattern, as home and condo sales are up 23 percent and the median sales price is up 7.1% in June of 2015 compared to the prior year. The District is estimating that property tax revenues will increase 4% in Fiscal Year compared to FY due to projected home appreciation between 1 to 5%, modest local development, a projected increase in wage and salary jobs and a decrease in unemployment. The District Wide Landscape & Lighting Assessment fees account for approximately 21% of total revenues of the District. These fees are levied on parcels within the various benefit zones to provide funds for the maintenance, repair, replacement, services, utilities and capital improvements associated with the parks, landscape medians and corridors, parkways, Camden Lake, open space of any nature, trail systems and other recreation facilities, amenities and appurtenances within the v
12 District s parks thereto owned by the District which are designated for inclusion within the Assessment District. Long-term financial planning Elk Grove is expected to rebound in commercial, industrial, and residential growth during the next five to ten years. With approval of the Laguna Ridge specific plan, the Lent Ranch and South East Area specific plans, the District's largely undeveloped areas are well positioned for future growth. Commercial/industrial construction is anticipated to continue with the development of a regional shopping mall. It is the challenge of this District to maintain the high level of service that our residents and business leaders have come to expect from the District. One step in meeting these challenges is the annual review and update of the District s goals and strategies and Capital Improvement Plans. These Capital Improvement Plans provide an overview of the timing of future District facilities and corresponding revenue sources for development. This document, along with the annual budget, is the foundation upon which the District will build to meet the growing needs of the community. Relevant financial policies The District's unrestricted cash and investments are maintained in the State of California Local Agency Investment Fund (the Fund) and a separately managed investment portfolio. The State Treasurer is responsible for managing the investment of the Fund s resources. The Fund's investment policy is to maintain a high credit quality, short duration portfolio to provide participants with safety of principal, liquidity, public trust and a market average rate of return. The Fund s portfolio at June 30, 2015 was invested in U.S. Treasury and Government Agency investments (67%), certificate of deposit (20%), time deposits (9%), and commercial paper (4%). The average yield on investments during fiscal year was.28%. At June 30, 2015, the District s separate investment portfolio of approximately $23 million was invested 38% in certificates of deposit, 57% in corporate notes and bonds and 5% in a money market account. All investments are rated AAA/A-1+ by Standard & Poors. Maturities range from 1 month to 48 months. The average yield on investments during fiscal year was.90%. The District is a member of the Special District Risk Management Authority, a joint powers agency comprised of California special districts and agencies that provides general liability, automobile and property insurance coverage for the District. The limits of liability range between $400,000 and $350 million per occurrence annually. This policy covers real and personal property of the District. The District participates in the Northern California Special Districts Insurance Authority (NCSDIA), a public entity risk pool of special districts within Northern California, for workers compensation. The District pays an annual premium to NCSDIA that includes its pro-rata share of excess insurance premiums, charges for the pooled risk, claims adjusting and legal costs, and administrative and other costs to operate the NCSDIA. vi


13
14 COSUMNES COMMUNITY SERVICES DISTRICT LIST OF PRINCIPAL OFFICIALS Board of Directors (Elected) Gil Albiani Michelle Orrock Rod Brewer Guy Rutter Rich Lozano President Vice-President Member Member Member Officials (Appointed) Jeff Ramos General Manager/Chief Operating Officer Tracey Hansen Fire Chief Bob Roessler Parks and Recreation Department Administrator viii


15 ix

16 x
17
18
19 INDEPENDENT AUDITORS REPORT To the Board of Directors of the Elk Grove, California We have audited the accompanying financial statements of the governmental activities, each major fund, and the aggregate remaining fund information of the, California (District), as of and for the year ended June 30, 2015, and the related notes to the financial statements, which collectively comprise the District s basic financial statements as listed in the table of contents. Management s Responsibility for the Financial Statements Management is responsible for the preparation and fair presentation of these financial statements in accordance with accounting principles generally accepted in the United States of America; this includes the design, implementation, and maintenance of internal control relevant to the preparation and fair presentation of financial statements that are free from material misstatement, whether due to fraud or error. Auditor s Responsibility Our responsibility is to express opinions on these financial statements based on our audit. We conducted our audit in accordance with auditing standards generally accepted in the United States of America. Those standards require that we plan and perform the audit to obtain reasonable assurance about whether the financial statements are free from material misstatement. An audit involves performing procedures to obtain audit evidence about the amounts and disclosures in the financial statements. The procedures selected depend on the auditor s judgment, including the assessment of the risks of material misstatement of the financial statements, whether due to fraud or error. In making those risk assessments, the auditor considers internal control relevant to the entity s preparation and fair presentation of the financial statements in order to design audit procedures that are appropriate in the circumstances, but not for the purpose of expressing an opinion on the effectiveness of the entity s internal control. Accordingly, we express no such opinion. An audit also includes evaluating the appropriateness of accounting policies used and the reasonableness of significant accounting estimates made by management, as well as evaluating the overall presentation of the financial statements. We believe that the audit evidence we have obtained is sufficient and appropriate to provide a basis for our audit opinions. Opinions In our opinion, the financial statements referred to above present fairly, in all material respects, the respective financial position of the governmental activities, each major fund, and the aggregate remaining fund information of the District, as of June 30, 2015, and the respective changes in financial position thereof for the year then ended in accordance with accounting principles generally accepted in the United States of America. Address: 180 Grand Avenue, Suite 1500 Oakland, CA Phone: Fax:
20 To the Board of Directors of the Elk Grove, California Page 2 Other Matters Required Supplementary Information Accounting principles generally accepted in the United States of America require that the management s discussion and analysis, pension information, the OPEB schedule of funding progress, and budgetary comparison information on pages 3 14 and be presented to supplement the basic financial statements. Such information, although not a part of the basic financial statements, is required by the Governmental Accounting Standards Board, who considers it to be an essential part of financial reporting for placing the basic financial statements in an appropriate operational, economic, or historical context. We have applied certain limited procedures to the required supplementary information in accordance with auditing standards generally accepted in the United States of America, which consisted of inquiries of management about the methods of preparing the information and comparing the information for consistency with management s responses to our inquiries, the basic financial statements, and other knowledge we obtained during our audit of the basic financial statements. We do not express an opinion or provide any assurance on the information because the limited procedures do not provide us with sufficient evidence to express an opinion or provide any assurance. Other Information Our audit was conducted for the purpose of forming opinions on the financial statements that collectively comprise the District s basic financial statements. The introductory section, combining and individual nonmajor fund financial statements, other supplementary schedules on pages 72 to 103 and statistical section are presented for purposes of additional analysis and are not a required part of the basic financial statements. The combining, individual nonmajor fund financial statements, and other supplementary schedules on pages 72 to 103 are the responsibility of management and were derived from and relate directly to the underlying accounting and other records used to prepare the basic financial statements. Such information has been subjected to the auditing procedures applied in the audit of the basic financial statements and certain additional procedures, including comparing and reconciling such information directly to the underlying accounting and other records used to prepare the basic financial statements or to the basic financial statements themselves, and other additional procedures in accordance with auditing standards generally accepted in the United States of America. In our opinion, the combining and individual nonmajor fund financial statements, and other supplementary schedules on pages 72 to 103 are fairly stated, in all material respects, in relation to the basic financial statements as a whole. The introductory and statistical sections have not been subjected to the auditing procedures applied in the audit of the basic financial statements and, accordingly, we do not express an opinion or provide any assurance on them. Badawi & Associates, CPAs Oakland, California December 30, 2015
21 COSUMNES COMMUNITY SERVICES DISTRICT MANAGEMENT S DISCUSSION AND ANALYSIS FOR THE YEAR ENDED JUNE 30, 2015 As management of the (District), we offer readers of the District s financial statements this narrative overview and analysis of the financial activities of the District for the fiscal year ended June 30, We encourage readers to consider the information presented here in conjunction with additional information that we have furnished in our letter of transmittal, which can be found on pages iii-viii of this report. FINANCIAL HIGHLIGHTS The assets of the exceeded its liabilities at the close of the and fiscal years by $174,852,978 and $216,585,890 (net position), respectively. Of this amount, $44,349,631 and $42,341,817 is restricted for specific purposes (restricted net position), and $184,981,570 and $184,272,953 is net investment in capital assets. The decrease in net position is mainly due to the implementation of Statement No. 68, Accounting and Financial Reporting for Pensions. This decrease is discussed further on pages 11 and 12 of this report. For FY , total District governmental fund revenues, including program and general revenues, were $71.3 million, an increase of $4.7 million from the prior fiscal year and the changes are as follows. The change in revenue in the current year is due to an 11% increase in taxes ($3.6 million), a 6% increase in charges for services ($1.7 million), a 50% increase in intergovernmental ($700 thousand) offset by a 46% decrease in developer fees and contributions ($1.3 million). Total governmental fund expenses were $68.6 million, an increase of $7.4 million from the prior fiscal year. The increase is related to a 8% increase in public protection expenditures ($2.7 million), a 13% increase in recreation and culture expenditures ($2.4 million), a 35% increase in general government expenditures ($1.1 million) and a 83% increase in capital outlay expenditures ($2 million), which was offset by a 20% decrease in debt service expenditures ($700 thousand). For FY , total District governmental fund revenues, including program and general revenues, were $66.6 million, an increase of $5.8 million from the prior fiscal year and the changes are as follows. The change in revenue in the current year is due to an 11% increase in taxes ($3.2 million), an 8% increase in charges for services ($2.2 million), and a 62% increase in developer fees and contributions ($1.1 million). Total governmental fund expenses were $61.2 million, a decrease of $1.5 million from the prior fiscal year. The decrease is related to a 3% decrease in public protection expenditures ($1 million), a 16% decrease in debt service expenditures ($700 thousand), which was offset by a 1% increase in recreation and culture expenditures ($200 thousand). As of June 30, 2015 and 2014, total District s governmental funds reported combined fund balances of $70,882,155 and $59,547,839, respectively, an increase of $11,334,316 and an increase of $7,018,274 in comparison with the prior year. Approximately 37% and 28% of the combined fund balances, $26,108,555 and $16,466,784 is available for spending at the government s discretion (assigned fund balance). At the close of the fiscal year ended June 30, 2015 and 2014, the total fund balance restricted for park and fire station construction, capital projects, landscape and lighting district operations and foundation activities was $44,349,631 and $42,341,817, respectively. 3
22 COSUMNES COMMUNITY SERVICES DISTRICT MANAGEMENT S DISCUSSION AND ANALYSIS FOR THE YEAR ENDED JUNE 30, 2015 The District s total long-term obligations decreased by a net amount of $716,994 during the fiscal year and decreased $1,241,608 during the fiscal year. For FY , the decrease resulted primarily from a $700 thousand principal and interest reduction offset by the acquisition of new leases totaling $1.4 million to purchase Zoll cardiac monitors, remount two ambulances, a Turfstar irrigation control system and several District copiers. For FY , the decrease resulted primarily from a $2.6 million principal reduction offset by the acquisition of new leases totaling $1.4 million to purchase two Pierce Fire Engines, remount three ambulances, a John Deere Tractor and a District copier. OVERVIEW OF THE COMPREHENSIVE ANNUAL FINANCIAL REPORT This Comprehensive Annual Financial Report is in three major parts: 1) Introductory section, which includes the Transmittal Letter and general information, 2) Financial section, The Management s Discussion and Analysis (this part), the Basic Financial Statements, which include the Government-wide and the Fund Financial Statements, along with the notes to these financial statements, Required Supplementary Information, and Combining and Individual Fund Financial Statements and Schedules, and 3) Statistical section. The Basic Financial Statements The Basic Financial Statements consist of the Government-wide Financial Statements and the Fund Financial Statements; these two sets of financial statements provide two different views of the District s financial activities and financial position. The Government-wide Financial Statements The Government-wide Financial Statements provide a broad overview of the District s activities as a whole, and consist of the Statement of Net Position and the Statement of Activities. The Statement of Net Position provides information about the financial position of the District as a whole, including all its capital assets and long-term liabilities on the full accrual basis, similar to that used by corporations. The Statement of Activities provides information about all the District s revenues and all its expenses, also on the full accrual basis, with the emphasis on measuring net revenues or expenses of each of the District s programs. The Statement of Activities explains in detail the change in Net Position for the year. All of the District s activities and amounts in the Statement of Net Position and the Statement of Activities are considered Governmental Activities, as explained below. Government activities All of the District s basic services are considered to be governmental activities, including general government, public protection, and recreation and culture. These services are supported by property taxes, and also by specific program revenues such as recreation fees, ambulance and plan check fees and developer fees. 4
23 COSUMNES COMMUNITY SERVICES DISTRICT MANAGEMENT S DISCUSSION AND ANALYSIS FOR THE YEAR ENDED JUNE 30, 2015 The District s governmental activities include the activities of two separate legal entities, the Cosumnes Legacy Foundation and the Elk Grove Community Services District Public Facilities Acquisition Corporation, because the District is financially accountable for the Foundation and Acquisition Corporation. The Foundation and Acquisition Corporation have been included as an integral part of the primary government. Fund Financial Statements A fund is a group of related accounts that is used to maintain control over resources that have been segregated for specific activities or objectives. The District, like other state and local governments, uses fund accounting to ensure and demonstrate compliance with finance-related legal requirements. All of the funds of the District are governmental funds. Governmental funds. Governmental funds are used to account for essentially the same functions reported as governmental activities in the Government-wide Financial Statements. However, unlike the Government-wide Financial Statements, Governmental Fund Financial Statements focus on near-term inflows and outflows of spendable resources, as well as on balances of spendable resources available at the end of the fiscal year. Such information may be useful in evaluating a government s near-term financing requirements. Because the focus of the Governmental Fund Financial Statements is narrower than that of the Government-wide Financial Statements, it is useful to compare the information presented for governmental funds with similar information presented for governmental activities in the Government-wide Financial Statement. By doing so, readers may better understand the long-term impact of the government s near-term financial decisions. Both the governmental fund balance sheet and the governmental fund statement of revenues, expenditures, and changes in fund balances provide a reconciliation to facilitate this comparison between governmental funds and governmental activities. The Governmental Fund Financial Statements provide detailed information about each of the District s most significant funds, called major funds. The concept of major funds, and the determination of which are major funds, was established by GASB Statement 34 and replaces the concept of combining like funds and presenting them as one total. Instead, each major fund is presented individually, with all non-major funds summarized and presented only in a single column. Subordinate schedules present the detail of these non-major funds. Major funds present the major activities of the District for the year, and may change from year to year as a result of changes in the pattern of the District s activities. For the fiscal year ending June 30, 2015, the District s major funds are as follows: General Fund Landscape and Lighting Special Revenue Fund 5
24 COSUMNES COMMUNITY SERVICES DISTRICT MANAGEMENT S DISCUSSION AND ANALYSIS FOR THE YEAR ENDED JUNE 30, 2015 For the fiscal year ended June 30, 2015, the District adopted annual appropriated budgets for all funds, except for the following: Foundation Special Revenue Fund A budgetary comparison statement has been provided for the General Fund and the Landscape and Lighting Special Revenue Fund. The basic governmental fund financial statements can be found on pages 15 to 22 of this report. Notes to the Financial Statements The notes provide additional information that is essential to a full understanding of the data provided in the Government-wide and Fund Financial Statements. The notes to the financial statements can be found on pages of this report. Required Supplementary Information Supplemental information regarding the funding progress of the District s pension plan can be found on pages of this report. Combining and Individual Fund Financial Statements and Schedules The combining statements referred to earlier in connection with non-major governmental funds are presented immediately following the required supplementary information. Combining and individual fund statements and schedules can be found on pages of this report. GOVERNMENT-WIDE FINANCIAL ANALYSIS As noted earlier, net position may serve over time as a useful indicator of a government s financial position. In the case of the District, assets exceeded liabilities by $174,852,978 at the close of the most recent fiscal year. 6
25 COSUMNES COMMUNITY SERVICES DISTRICT MANAGEMENT S DISCUSSION AND ANALYSIS FOR THE YEAR ENDED JUNE 30, 2015 COSUMNES COMMUNITY SERVICES DISTRICT SUMMARY OF NET POSITION JUNE 30, 2015, 2014 AND 2013 Governmental Activities , as restated 2013 Current and other assets $ 73,248,586 $ 61,892,958 $ 55,436,352 Capital assets 204,243, ,317, ,758,716 Total assets 277,491, ,210, ,195,068 Long-term liabilities outstanding 96,662,022 99,668,813 45,353,536 Other liabilities 2,468,440 2,380,187 2,724,324 Total liabilities 99,229, ,049,000 48,077,860 Net position: Net investment in capital assets 184,981, ,997, ,141,637 Restricted 44,349,631 42,341,817 37,217,297 Unrestricted (54,478,223) (62,177,389) (8,241,726) Total net position $ 174,852,978 $ 164,161,925 $ 213,117,208 The largest portion of the District s net position of $184,981,570 (85 percent) reflects its net investment in capital assets (e.g. land, structures and improvements, equipment and construction in progress); less any related debt used to acquire those assets that are still outstanding. The District uses these capital assets to provide services to citizens; consequently, these assets are not available for future spending. Although the District s investment in its capital assets is reported net of related debt, it should be noted that the resources needed to repay this debt must be provided from other sources, since the capital assets themselves cannot be used to liquidate these liabilities. Another significant portion of the District s net position of $44,349,631 (20 percent) represents resources that are subject to external restrictions on how they may be used. The remaining negative balance of unrestricted net position of $54,478,223 is mainly due to the District recording $49.2 million in pension liability amongst Safety and Miscellaneous employees. 7
26 COSUMNES COMMUNITY SERVICES DISTRICT MANAGEMENT S DISCUSSION AND ANALYSIS FOR THE YEAR ENDED JUNE 30, 2015 At the end of the current fiscal year, the District is able to report positive balance in two of the three categories of net position for the District as a whole, and the District is beginning to replenish reserve fund balance because of the increase in property taxes offset by the increase in deferred inflows of resources from pensions combined with net pension and OPEB liabilities. The District s net position increased by $10,691,053 during the 2014/15 fiscal year, which accounts for 6 percent of total net position. The District s restricted and unrestricted net position increased approximately $9.7 million, combined with an increase in investment in capital assets of approximately $1 million. The increase is due to a 59% increase in assigned fund balance ($9.6 million), a 8% increase in Landscape and Lighting improvements ($2.1 million) and a 19% increase in fire station and equipment ($600 thousand), which was offset by a decrease of 5% in park development ($700 thousand). The District s net position increased by $3,468,682 during the 2013/14 fiscal year, which accounts for 2 percent of total net position. The District s restricted and unrestricted net position increased approximately $3.6 million, which was offset by a decrease in investment in capital assets of approximately $100 thousand. The increase is due to a 14% increase in Landscape and Lighting improvements ($3.2 million) and a 13% increase in park development ($1.5 million), a 15% increase in fire station and equipment ($400 thousand), which was offset by a decrease of 18% in unrestricted ($1.5 million). 8
27 COSUMNES COMMUNITY SERVICES DISTRICT MANAGEMENT S DISCUSSION AND ANALYSIS FOR THE YEAR ENDED JUNE 30, 2015 The table below indicates the changes in net position for governmental activities: COSUMNES COMMUNITY SERVICES DISTRICT STATEMENT OF ACTIVITIES FOR THE YEARS ENDED JUNE 30, 2015, 2014 AND 2013 Governmental Activities REVENUES: Program revenues: Charges for services $ 30,435,796 $ 28,569,906 $ 27,076,107 Operating grants and contributions 113, , ,774 Capital grants and contributions 3,650,142 4,239,631 3,673,497 General revenues: Property taxes 36,173,988 32,626,823 29,456,296 Investment earnings 431, , ,940 Miscellaneous 334, , ,725 TOTAL REVENUES 71,140,142 66,369,854 60,976,339 EXPENSES: Governmental activities: Public protection 31,393,533 37,447,237 40,245,993 Recreation and culture 24,737,509 21,984,207 22,612,070 General government 4,318,047 3,469,728 3,749,754 TOTAL EXPENSES 60,449,089 62,901,172 66,607,817 INCREASE (DECREASE) IN NET POSITION 10,691,053 3,468,682 (5,618,723) Net position at begin of year (as restated) 164,161, ,117, ,735,931 NET POSITION AT END OF YEAR $ 174,852,978 $ 216,585,890 $ 213,117,208 9
28 COSUMNES COMMUNITY SERVICES DISTRICT MANAGEMENT S DISCUSSION AND ANALYSIS FOR THE YEAR ENDED JUNE 30, 2015 Revenues The District s total revenues per the Statement of Activities were $71,140,142 and $66,369,854 for the fiscal years ended June 30, 2015 and 2014, respectively. Property tax revenue of $36,173,988 and $32,626,823 comprised 50.85% and 50.73%, respectively of the total governmental revenues of the District. Charges for services and capital grant and contribution revenue, which is comprised primarily of parkland dedications and fees from developers that is restricted for the construction of parks and fire stations, provided 42.78% and 43.05% and 6.57% and 5.29%, respectively, of the total governmental revenue of the District for the fiscal years ended June 30, 2015 and The increase in property tax revenues reflects the increase in proposition 13 adjustments on existing homes combined with the increase of sales on existing and new home properties and local development. The decrease in capital grant and contribution revenue is primarily due to the decrease in developer fees and contributions in the current year. Expenses Expenses of the District totaled $60,449,089 and $62,901,172 for the fiscal years ended June 30, 2015 and 2014, respectively. Public protection costs represent 51.93% and 59.53%, respectively, of total governmental activities expenses and are the largest single expenditure in the governmental activities. The following table shows the cost of each of the District s major programs and the net cost of the programs for the fiscal year ended June 30, Net cost is the total cost less fees and other direct revenue generated by the activities. The net cost of the public protection, recreation and culture and general government services reflects the financial burden that was placed on the District s taxpayers by each of the programs. Total Cost of services Net Revenue (Cost) of services Public protection $31,393,533 $ (21,091,751) Recreation and culture 24,737,509 (2,827,174) General government 4,318,047 (2,330,560) TOTAL $60,449,089 $ (26,249,485) The net cost to taxpayers for recreation and culture services, excluding developer fees, was $4,327,829. FINANCIAL ANALYSIS OF THE DISTRICT S FUNDS As noted earlier, the District uses fund accounting to ensure and demonstrate compliance with finance-related legal requirements. The fund financial statements focus on individual parts of the District, reporting the District s operations in more detail than the government-wide financial statements. Governmental funds. The focus of the District s governmental funds is to provide information on near-term inflows, outflows and balances of spendable resources. Such information is useful in assessing the District s financing requirements. In particular, unreserved fund balance may serve as a useful measurement of a government s net resources available for spending at the end of the fiscal year. 10
29 COSUMNES COMMUNITY SERVICES DISTRICT MANAGEMENT S DISCUSSION AND ANALYSIS FOR THE YEAR ENDED JUNE 30, 2015 At June 30, 2015 and 2014 the District s governmental funds reported combined fund balances of $70,882,155 and $59,547,839, an increase of $11,334,316 and an increase of $7,018,274, respectively, in comparison with the prior year. The major reason for the increase was the increase of assigned fund balance ($9.6 million) combined with the increase in landscape and lighting reserves ($3.2 million). Approximately 37 and 28 percent of the combined fund balances, $26,108,555 and $16,466,784, respectively, constitutes assigned fund balance, which is available to meet the District s current and future needs. The remainder of fund balance is restricted to indicate that it is not available for new spending because it has been restricted: 1) to reflect amounts set aside for future construction ($16,247,274); 2) to use for specific purpose of the fund ($27,898,816); and 3) to reflect amounts held on behalf of the Cosumnes Legacy Foundation ($203,541). The General Fund is the chief operating fund of the District. At June 30, 2015 and 2014, assigned fund balance of the general fund was $26,108,555 and $16,466,784, respectively, while total fund balance reached $42,563,646 and $33,351,099. The increase in total fund balance of $9,212,547 represents an increase in other financing sources ($9.9 million) offset by a difference in total expenditures over total revenues ($700 thousand). As a measure of the general fund s liquidity, it may be useful to compare both assigned fund balance and total fund balance to total fund expenditures. Assigned fund balance represents 46 percent and 33 percent of total fund expenditures, while total fund balance represents 75 percent and 66 percent of that same amount. The Landscape & Lighting Special Revenue Fund has a total fund balance of $27,898,816 and $25,774,685 at June 30, 2015 and These amounts are restricted for the specific purpose of the fund. Total fund balance increased by $2,124,131 and $3,252,642 for the fiscal year ended June 30, 2015 and The increase is mainly attributable to the revenue produced from the East Franklin zone combined with the Landscape and Lighting assessment increases which are based on the CPI index each year. At June 30, 2015, the Non-major Governmental Funds consist of the Capital Project Fund and the Foundation Special Revenue Fund. Total fund balance at June 30, 2015 is $419,693. Of this amount, $216,152 is restricted for capital projects and $203,541 is restricted for foundation activities. The decrease in fund balance of $2,362 is mainly related to the operating expenditures for the Cosumnes Legacy Foundation utilized within the Foundation Fund. At June 30, 2014, the Non-major Governmental Funds consist of the Capital Project Fund and the Foundation Special Revenue Fund. Total fund balance at June 30, 2014 is $422,055. Of this amount, $217,233 is restricted for capital projects and $204,822 is restricted for foundation activities. The decrease in fund balance of $34,494 is mainly related to the capital outlay expenditures for the Fire Training Facility utilized within the Capital Project Fund. 11
30 COSUMNES COMMUNITY SERVICES DISTRICT MANAGEMENT S DISCUSSION AND ANALYSIS FOR THE YEAR ENDED JUNE 30, 2015 General Fund Budgetary Highlights For the fiscal year ended June 30, 2015, differences between the original budget and the final amended budget reflect increased General Fund expenditures totaling $5,447,140. The increase is due to an increase in public protection expenditures for operational support combined with additional general government expenditures due to a fire within the District Administration building. Actual General Fund revenues were $4,860,322 greater than the final budget. This variance is related to the increase in property taxes, charges for current services, and state aid for public funding. Actual General Fund expenditures were $4,263,345 lower than the final budget, of which approximately $3.7 million represented fire and park development projects which were not completed and/or not started during the fiscal year in addition to lower departmental expenditures. For the fiscal year ended June 30, 2014, differences between the original budget and the final amended budget reflect increased General Fund expenditures totaling $521,600. The increase is due to an increase in public protection expenditures for operational support. Actual General Fund revenues were $7,192,600 greater than the final budget. This variance is related to the increase in property taxes, charges for current services, and homeowner property tax relief and state aid for public funding. Actual General Fund expenditures were $4,416,888 lower than the final budget, of which approximately $2.9 million represented fire and park development projects which were not completed and/or not started during the fiscal year in addition to lower departmental expenditures. CAPITAL ASSET AND LONG-TERM DEBT Capital assets. As of June 30, 2015 and 2014, the Districts investment in capital assets amounted to $204,243,007 and $204,317,967, respectively, net of depreciation. This investment in capital assets includes land, land improvements, structures and improvements, equipment and construction in progress costs for various parkland improvements and fire station construction. COSUMNES COMMUNITY SERVICES DISTRICT CAPITAL ASSETS (net of depreciation) AS OF JUNE 30, 2015, 2014 AND Land $ 87,113,826 85,443,191 85,442,799 Land improvements 64,509,759 64,201,317 63,584,248 Construction in Progress 1,270,681 1,081,776 1,765,596 Structures and improvements 46,832,450 49,417,438 53,010,282 Equipment 4,516,291 4,174,245 1,955,793 Total $ 204,243, ,317, ,758,718 12
31 COSUMNES COMMUNITY SERVICES DISTRICT MANAGEMENT S DISCUSSION AND ANALYSIS FOR THE YEAR ENDED JUNE 30, 2015 The following provides an explanation of significant changes in capital assets for the fiscal year ended June 30, 2015: Land purchase of 6.2 acres of land designated for Derr-Okamoto Phase II. Land improvements completion of Laguna Park improvements, and additional playground amenities at Nottoli Park. Structures and improvements decrease is mainly due to the fire within the Administration building offset by the addition of a fence at Derr-Okamoto Skate Park and HVAC at Wackford Aquatic Community Complex and Laguna Town Hall. Construction in progress increase is mainly related to the burn room at Fire Training Headquarters and George Park. Equipment decrease is mainly due to the fire within the Administration building offset by the purchase of Zoll cardiac monitors, two remounted ambulances, Turfstar irrigation control system and several copiers within the District. The following provides an explanation of significant changes in capital assets for the fiscal year ended June 30, 2014: Land improvements completion of Buscher Park, and the re-build of Lawrence Park. Structures and improvements decrease is mainly due to depreciation for FY which is offset by the completion of Buscher and Lawrence Park and the Laguna Town Hall HVAC replacement. Construction in progress decrease is mainly related to the completion of Buscher and Lawrence Park. Equipment increase is mainly due to the purchase of two Pierce Arrow XT fire engines, three remounted ambulances, and a John Deere Tractor offset with depreciation for FY Additional information on the District s capital assets can be found in Note 3 on page 37 to 38. The District was in the process of reconstructing the District Administration building and constructing a maintenance building at Bartholomew Sports Park at June 30, The total amount committed at June 30, 2015 is $1,910,518. Additional information on the District s commitments can be found in Note 10 on page 56. Long-term debt. At June 30, 2015, the District had long-term debt obligations totaling $19,261,437. District debt issues include $664,100 in Certificates of Participation for the construction of two fire stations and Fire Training Facility land, a note agreement for $84,606 for the financing of the Underwood Park Well, and $18,512,731 in various capital lease obligations for the construction and equipping of a fire station and purchase of equipment and vehicles. The District s total debt decreased by $783,577 (4%) during the current fiscal year mainly due to the principal reduction of $2,060,546 offset by the funding for Zoll cardiac monitors ($886,022), two remounted ambulances ($282,408), a Turfstar irrigation control system ($39,789) and several District copiers ($68,750). Additional information on the District s long-term debt can be found in Note 5 on pages
32 COSUMNES COMMUNITY SERVICES DISTRICT MANAGEMENT S DISCUSSION AND ANALYSIS FOR THE YEAR ENDED JUNE 30, 2015 ECONOMIC OUTLOOK The Cosumnes CSD local economies is improving, and as the population continues to grow and as political leaders are focused on bringing business and commerce to the region, the demand for housing emerges. Further, in Sacramento County, 10,400 wage and salary jobs were created, representing a growth rate of 2.4%. This is the third annual increase for Sacramento County since before the recession of The unemployment rate improved as well, falling from 6.9% in 2014 to 5.8% in The primary funding source of District operations is property taxes. Property tax revenues have increased by approximately 10% from the prior year but the current recovery has already lasted a year longer than the historic average despite soft U.S. economic growth, therefore the District is projecting an average annual growth in property tax revenues of 4% for next fiscal year. The residential real estate market from a sales volume standpoint appears to be headed towards a more normal pattern, as home and condo sales are up 23 percent and the median sales price is up 7.1% in June of 2015 as compared to the prior year. The District is estimating that property tax revenues will increase 4% in Fiscal Year compared to FY due to projected home appreciation between 1 to 5%, modest local development, a projected increase in wage and salary jobs and a decrease in unemployment. It is the challenge of this District to maintain the high level of service that our residents and business leaders have come to expect from the District. One step in meeting these challenges is the annual review and update of the District s goals and strategies and Capital Improvement Plans. These Capital Improvement Plans provide an overview of the timing of future District facilities and corresponding revenue sources for development. This document, along with the annual budget, is the foundation upon which the District will build to meet the growing needs of the community. REQUESTS FOR INFORMATION This Comprehensive Annual Financial Report is intended to provide citizens, taxpayers, investors, and creditors with a general overview of the District s finances. If you have questions about this report or need additional financial information, contact the Cosumnes Community Services District Administrative Services Department, 9355 East Stockton Boulevard, Elk Grove, CA 95624, or visit the District s web page at 14
33 BASIC FINANCIAL STATEMENTS 15
34 This page intentionally left blank. 16
35 Statement of Net Position June 30, 2015 ASSETS Governmental Activities Current assets: Cash and investments $ 61,846,467 Receivables: Accounts 5,500 Interest 45,445 Intergovernmental 1,880,993 Ambulance 1,453,656 Other 4,807,081 Prepaids 398,961 Restricted cash and investments 2,810,483 Total current assets 73,248,586 Noncurrent assets: Capital assets: Not being depreciated 152,894,266 Being depreciated, net 51,348,741 Total capital assets 204,243,007 Total noncurrent assets 204,243,007 Total assets 277,491,593 DEFERRED OUTFLOWS OF RESOURCES Deferred employer pension contributions 5,060,661 Total Deferred outflows of resources 5,060,661 LIABILITIES Current liabilities: Accounts payable and accrued liabilities 1,594,275 Accrued interest payable 271,757 Unearned revenue 701,009 Total current liabilities 2,567,041 Noncurrent liabilities: Long-term liabilities: Due within one year 2,468,440 Due in more than one year 94,193,582 Total noncurrent liabilities 96,662,022 Total liabilities 99,229,063 DEFERRED INFLOWS OF RESOURCES Deferred inflows of resources - pension 8,470,213 Total Deferred inflows of resources 8,470,213 NET POSITION Net Investment in Capital Assets 184,981,570 Restricted for: Park development 12,370,376 Fire station and equipment 3,660,746 Capital projects 216,152 Landscape and lighting improvements 27,898,816 Foundation activities 203,541 Unrestricted (54,478,223) Total net position $ 174,852,978 See accompanying Notes to Basic Financial Statements. 17
36 Statement of Activities For the year ended June 30, 2015 Program Revenues Net (Expense) Indirect Operating Capital Revenue Expense Charges for Grants and Grants and Governmental Functions / Programs Expenses Allocation Services Contributions Contributions Activities Governmental activities: Public protection $ 30,991,966 $ 401,567 $ 8,152,295 $ - $ 2,149,487 $ (21,091,751) Recreation and culture 24,421, ,428 20,399,714 9,966 1,500,655 (2,827,174) General government 4,262,813 55,234 1,883, ,700 - (2,330,560) Interest on long-term debt 773,229 (773,229) Total governmental activities $ 60,449,089 $ - $ 30,435,796 $ 113,666 $ 3,650,142 (26,249,485) General Revenues and Transfers: Taxes: Property taxes 36,173,988 Investment earnings 431,763 Miscellaneous 334,787 Total general revenues and transfers 36,940,538 Change in net position 10,691,053 Net position - beginning of year (as restated) 164,161,925 Net position - end of year $ 174,852,978 See accompanying Notes to Basic Financial Statements. 18
37 Balance Sheet Governmental Funds June 30, 2015 ASSETS Major Funds Landscape and Lighting Non-Major Total General Special Revenue Governmental Governmental Fund Fund Funds Funds Cash and investments $ 33,546,249 $ 28,071,629 $ 228,589 $ 61,846,467 Receivables: Accounts 5, ,500 Interest 22,669 22,776-45,445 Intergovernmental 1,625, ,113-1,880,993 Ambulance 1,453, ,453,656 Other 4,807, ,807,081 Due from other funds 45, , ,728 Advances to other funds 25, ,008 Prepaids 398, ,961 Restricted cash and investments 2,740,511-69,972 2,810,483 Total assets $ 44,670,789 $ 28,349,518 $ 490,015 $ 73,510,322 LIABILITIES, DEFERRED INFLOWS OF RESOURCES AND FUND BALANCES Liabilities: Accounts payable and accrued liabilities $ 1,143,533 $ 450, $ 1,594,275 Due to other funds 191,454-45, ,728 Advances from other funds ,008 25,008 Unearned revenue 701, ,009 Total liabilities 2,035, ,702 70,322 2,557,020 Deferred Inflows of Resources: Unavailable revenues 71, ,147 Fund Balances: Nonspendable 423, ,969 Restricted for: Park development 12,370, ,370,376 Fire station and equipment 3,660, ,660,746 Capital projects , ,152 Specific purpose of the fund - 27,898,816-27,898,816 Foundation activities of the fund , ,541 Assigned 26,108, ,108,555 Total fund balances 42,563,646 27,898, ,693 70,882,155 Total liabilities, deferred inflows of resources, and fund balances $ 44,670,789 $ 28,349,518 $ 490,015 $ 73,510,322 See accompanying Notes to Basic Financial Statements. 19
38 Reconciliation of the Governmental Funds Balance Sheet to the Government-Wide Statement of Net Position June 30, 2015 Total Fund Balances - Total Governmental Funds $ 70,882,155 Amounts reported for governmental activities in the Statement of Net Position are different because: Capital assets used in governmental activities are not current financial resources and are therefore not reported in the funds: - Governmental capital assets 252,736,569 - Less: accumulated depreciation (48,493,562) Total capital assets 204,243,007 Certain revenues in the governmental funds are deferred because they are not collected within the prescribed time period after year-end. Those revenues are recognized on the accrual basis used in the government-wide statements. Those revenues consist of: - Ambulance charges 71,147 Total revenues 71,147 Interest payable on long-term debt did not require current financial resources. Therefore, interest payable was not reported as a liability in Governmental Funds Balance Sheet. (271,757) Employer contributions for pension were recorded as expenditures in the governmental funds. However, in the Government-Wide Financial Statements, these contributions are deferred. 5,060,661 In the Government-Wide Financial Statements, certain differences between actuarial assumptions and actual results for pension are deferred and amortized over a period of time, however these differences do not impact the Governmental Funds Balance Sheet: - Deferred inflows of resources - pension (8,470,213) Long-term liabilities are not due and payable in the current period and are therefore not reported in the funds. Those liabilities consist of: - Loans Payable (84,606) - Certificates of Participation Series (664,100) - Capital lease obligation (18,512,731) - Compensated absences (1,791,002) - Net OBEB obligation (26,448,113) - Net pension liability (49,161,470) Total long-term liabilities (96,662,022) Net Position of Governmental Activities $ 174,852,978 See accompanying Notes to Basic Financial Statements. 20
39 Statement of Revenues, Expenditures and Changes in Fund Balances Governmental Funds For the year ended June 30, 2015 Major Funds Landscape and Lighting Non-Major Total General Special Revenue Governmental Governmental Fund Fund Funds Funds REVENUES: Taxes $ 36,173,988 $ - $ - $ 36,173,988 Charges for current services 14,811,737 14,708,161-29,519,898 Developer fees and contributions 1,500, ,500,655 Intergovernmental 2,149, ,149,487 Donations and contributions 103,700-9, ,666 Use of money and property 1,190, , ,516,902 Miscellaneous 327,797 6, ,787 Total revenues 56,257,887 15,041,512 9,984 71,309,383 EXPENDITURES: Current: Public protection 36,077, ,077,297 Recreation and culture 9,815,700 11,323,523 8,491 21,147,714 General government 4,207,778-1,349 4,209,127 Capital outlay 4,305,760 49, ,355,382 Debt service: Principal 1,841,596 25, ,247 2,060,546 Interest 739,609 1,632 35, ,928 Total expenditures 56,987,740 11,400, ,994 68,626,994 REVENUES OVER (UNDER) EXPENDITURES (729,853) 3,641,252 (229,010) 2,682,389 OTHER FINANCING SOURCES (USES): Proceeds from sale of capital assets 131,650 1, ,147 Issuance of long-term liabilities 1,269,719 7,250-1,276,969 Insurance recovery 7,226,815 14,996-7,241,811 Transfers in 2,841,040 2,642, ,130 5,720,119 Transfers out (1,526,824) (4,183,813) (9,482) (5,720,119) Total other financing sources (uses) 9,942,400 (1,517,121) 226,648 8,651,927 Net change in fund balances 9,212,547 2,124,131 (2,362) 11,334,316 FUND BALANCES: Beginning of year 33,351,099 25,774, ,055 59,547,839 End of year $ 42,563,646 $ 27,898,816 $ 419,693 $ 70,882,155 $ 42,563,646 $ 27,898,816 See accompanying Notes to Basic Financial Statements. 21
40 Reconciliation of the Governmental Funds Statement of Revenues, Expenditures and Changes in Fund Balances to the Government-Wide Statement of Activities For the year ended June 30, 2015 Net Change in Fund Balances - Total Governmental Funds $ 11,334,316 Amounts reported for governmental activities in the Statement of Activities are different because: Governmental funds report capital outlay as expenditures. In the statement of activities, however, the cost of those assets is allocated over their estimated useful lives as depreciation expense. - Capital asset additions 4,353,510 - Depreciation expense (3,833,842) Total governmental funds 519,668 In the statement of activities, only the gain or (loss) on the sale of capital assets is reported, whereas in the governmental funds, proceeds from sales increase financial resources. - Proceeds from sale of assets not recorded on Statement of Activities (133,147) - Loss on disposal of capital assets are not recorded on Governmental Funds (461,481) Long-term debt proceeds provide current financial resources to governmental funds, but issuing debt increases long-term liabilities in the statement of net position. Repayment of principal is an expenditure in the governmental funds, but the repayment reduced longterm liabilities in the statement of net position. - Proceeds from long-term liabilities (1,276,969) - Principal repayments on long-term liabilities 2,060,546 Net of long-term debt proceeds and repayments 783,577 Revenues in the statement of activities that do not provide current financial resources are not reported as revenues in the funds. Amount represent the change in the ambulance receivable. (169,241) OPEB expenses do not require the use of current financial resources, and therefore are not reported as expenditures in governmental funds. (1,123,640) Employer contributions for pension were recorded as expenditures in the governmental funds. However, in the Government-Wide Financial Statements, these contributions are deferred. 5,060,661 Pension expense is recorded as incurred in the Government-Wide Statement of Activities, however pension expense does not require the use of current financial resources, and is not recognized in the governmental funds. (5,207,718) Some expenses reported in the statement of activities do not require the use of current financial resources and therefore are not reported as expenditures in governmental funds. - Change in accrued interest payable 3,699 - Change in compensated absences 84,359 Total non-current expenses 88,058 Change in Net Position of Governmental Activities $ 10,691,053 See accompanying Notes to Basic Financial Statements. 22
41 Notes to Basic Financial Statements For the year ended June 30, SUMMARY OF SIGNIFICANT ACCOUNTING POLICIES The basic financial statements of the District have been prepared in conformity with accounting principles generally accepted in the United States of America as applied to government units. The Governmental Accounting Standards Board (GASB) is the accepted standard setting body for establishing governmental accounting and financial reporting principles. The most significant accounting policies of the District are described below. A. Reporting Entity The Elk Grove Community Services District (the District) was established under Government Code Sections and 56439(c) on July 1, 1985 by a reorganization resulting in the dissolution of the Elk Grove Fire Protection District and the Elk Grove Recreation and Park District. In November 2006, the District and the Galt Fire Protection District merged to become the Cosumnes Community Services District. It is governed by a five member Board of Directors elected to four year staggered terms. The District consists of approximately 157 square miles within the City s of Elk Grove and Galt and unincorporated areas of South Sacramento County with a population of approximately 184,564 residents. The District develops, owns and maintains all park, recreation and fire facilities within its service area. In April 2015, the District and the City of Elk Grove entered into an agreement with a four year term specifying the District and City will jointly develop park and recreation facilities within Laguna Ridge and Southeast Policy Area of the City, and the District will own and maintain the facilities. The fire protection services provided by the District include fire suppression, fire prevention, inspection, plan checking, and public education programs and the District provides emergency medical services, ambulance transport, advanced life support and rescue services and recreation facilities and programs. The District operates eight fire stations, one fire training facility, one golf course, two community centers, five recreation centers, two aquatic complexes, and over 93 parks (2 undeveloped) and employs 256 full-time and over 100 part-time people. The District also leases 87 acres of land within Elk Grove Regional Park from the County of Sacramento under an agreement that expires September 14, Through the exercise of Joint Powers, the District is a member of the Sacramento Regional Fire/EMS Communications Center and the Northern California Special District Insurance Authority. The District makes assessments and provides services under a District Wide Landscape and Lighting Assessment District, which operates under the Landscape and Lighting Act of Under the District Wide Landscape and Lighting Assessment District, areas within the original Elk Grove Community Services District boundary are divided into zones of benefit. All parcels within the original Elk Grove Community Services District boundary are assessed at varying rates depending upon the zone of benefit in which the parcel is located and the costs of installing, repairing, maintaining, and replacing landscape and lighting (including parks) within the benefit zone. The District s reporting entity includes the following blended component units: The Cosumnes Legacy Foundation: The Cosumnes Legacy Foundation (the Foundation) is a non-profit organization which primarily solicits contributions to provide funding for the District to provide the District s constituents charitable services through its programs. The Foundation is a legally separate component unit reported on a blended basis as part of the primary government because its activities mainly benefit the District s constituents. No separate financial statements are issued for the Foundation. 23
42 Notes to Basic Financial Statements, Continued For the year ended June 30, SUMMARY OF SIGNIFICANT ACCOUNTING POLICIES, Continued A. Reporting Entity, Continued Elk Grove Community Services District Public Facilities Acquisition Corporation: The Elk Grove Community Services District Public Facilities Acquisition Corporation (the Corporation) was established in March 2006 to facilitate financing of the acquisition of capital assets by the District. The Corporation s Board is comprised of the members of the District s Board of Directors. The Corporation does not have any assets or liabilities. Its activities have been blended with the appropriate District funds. No separate financial statements are issued for the Corporation. The District has also entered into a lease financing arrangement with the California Special Districts Association Financing Corporation for the purpose of facilitating the financing of capital projects within the District. For financial reporting purposes, the District's proportionate share of debt service payments of the underlying Certificate of Participation debt is reflected in the Debt Service Fund. B. Basis of Accounting and Measurement Focus The accounts of the District are organized on the basis of funds, each of which is considered a separate accounting entity. The operations of each fund are accounted for with a separate set of self-balancing accounts that comprise its assets, liabilities, fund equity, revenues, and expenditures. Governmental resources are allocated to and accounted for in individual funds based upon the purposes for which they are to be spent and the means by which spending activities are controlled. Government-Wide Financial Statements The District s government-wide financial statements include a Statement of Net Position and a Statement of Activities and Changes in Net Position. These statements present summaries of governmental activities for the District accompanied by a total column. These government-wide financial statements are presented on an economic resources measurement focus and the accrual basis of accounting. Accordingly, all of the District s assets and liabilities, including capital assets, as well as infrastructure assets, and long-term liabilities, are included in the accompanying Statement of Net Position. The Statement of Activities and Changes in Net Position presents changes in net position. Under the accrual basis of accounting, revenues are recognized in the period in which they are earned while expenses are recognized in the period in which the liability is incurred. Certain types of transactions are reported as program revenues for the District in three categories: Charges for services Operating grants and contributions Capital grants and contributions 24
43 Notes to Basic Financial Statements, Continued For the year ended June 30, SUMMARY OF SIGNIFICANT ACCOUNTING POLICIES, Continued B. Basis of Accounting and Measurement Focus, Continued Government-Wide Financial Statements, Continued Certain eliminations have been made as prescribed by GASB Statement No. 34 in regards to interfund activities, payables and receivables. All internal balances in the Statement of Net Position have been eliminated. However, interfund services provided and used are not eliminated in the process of consolidation. The following interfund activities have been eliminated: Due to/from other funds Advances to/from other funds Transfers in/out Interfund charges The District applies all applicable GASB pronouncements (including all NCGA Statements and Interpretations currently in effect). Governmental Fund Financial Statements Governmental fund financial statements include a Balance Sheet and a Statement of Revenues, Expenditures and Changes in Fund Balances for all major governmental funds and non-major funds aggregated. An accompanying schedule is presented to reconcile and explain the differences in net position as presented in these statements to the net position presented in the government-wide financial statements. The District has presented all major funds that met the applicable criteria. All governmental funds are accounted for on a spending or current financial resources measurement focus and the modified accrual basis of accounting. Accordingly, only current assets and current liabilities are included on the Balance Sheet. The Statement of Revenues, Expenditures and Changes in Fund Balances presents increases (revenues and other financing sources) and decreases (expenditures and other financing uses) in net current assets. Under the modified accrual basis of accounting, revenues are recognized in the accounting period in which they become both measurable and available to finance expenditures of the current period. Revenues are recorded when received in cash, except that revenues subject to accrual (generally 60 days after year-end) are recognized when due. The primary revenue sources, which have been treated as susceptible to accrual by the District, are property tax and intergovernmental revenues. Expenditures are recorded in the accounting period in which the related fund liability is incurred. Unearned revenues arise when potential revenues do not meet both the measurable and available criteria for recognition in the current period. Unearned revenues also arise when the government receives resources before it has a legal claim to them, as when grant monies are received prior to incurring qualifying expenditures. In subsequent periods, when both revenue recognition criteria are met or when the government has a legal claim to the resources, the unearned revenue is removed from the Governmental Funds Balance Sheet and recognized as revenue. The Reconciliation of the Fund Financial Statements to the Government-Wide Financial Statements is provided to explain the differences created by the integrated approach of GASB Statement No
44 Notes to Basic Financial Statements, Continued For the year ended June 30, SUMMARY OF SIGNIFICANT ACCOUNTING POLICIES, Continued B. Basis of Accounting and Measurement Focus, Continued Governmental Fund Financial Statements, Continued The District reports the following major governmental fund types: The General Fund is the District s primary operating fund. It is used to account for all activities of the general government, except those required to be accounted for in another fund. The Landscape and Lighting Special Revenue Fund is used to account for the proceeds of specific landscape and lighting revenue sources that are legally restricted to expenditures for specific purposes. The transactions of the District Wide Landscape and Lighting Assessment District are recorded by the respective zones of benefit within the Special Revenue Fund. However, the zones of benefit do not represent separate special revenue funds. Additionally the District reports the following fund types: The Capital Projects Fund is used to account for financial resources to be used for the acquisition or construction of major capital facilities, which are financed from the District's Certificate of Participation issues or capital lease financing arrangements. The Debt Service Fund is used to account for the accumulation of resources for, and the payment of, principal and interest on long-term debt. The Foundation Special Revenue Fund is used to account for revenues of the Cosumnes Legacy Foundation (the Foundation), which are legally restricted to expenditures approved by the Foundation board. C. Cash, Cash Equivalents and Investments The District pools its available cash for investment purposes. The District s cash and cash equivalents are considered to be cash on hand, demand deposits, and short-term investments with original maturity of three months or less from date of acquisition. Cash and cash equivalents are combined with investments and displayed as Cash and Investments. Highly liquid market investments with maturities of one year or less at time of purchase are stated at amortized cost. All other investments are stated at fair value. Market value is used as fair value for those securities for which market quotations are readily available. The District participates in an investment pool managed by the State of California titled Local Agency Investment Fund (LAIF) which has invested a portion of the pooled funds in Structured Notes and Asset-backed Securities. LAIF s investments are subject to credit risk with the full faith and credit of the State of California collateralizing these investments. In addition, these Structured Notes and Assetbacked Securities are subject to market risk as to change in interest rates. 26
45 Notes to Basic Financial Statements, Continued For the year ended June 30, SUMMARY OF SIGNIFICANT ACCOUNTING POLICIES, Continued D. Restricted Cash and Investments Certain resources set aside for the repayment of certificates of participation are classified as restricted cash and investments on the balance sheet because their use is limited by applicable debt covenants. In addition, developer fees have been restricted by the City of Elk Grove or County of Sacramento ordinances, or the Quimby Act for park development expenditures and the construction of fire stations. Contributions to the Foundation have been restricted for Foundation activities. E. Interfund Transactions Interfund transactions are reflected as either loans, services provided, reimbursements, or transfers. Activity between funds that are representative of lending/borrowing arrangements outstanding at the end of the fiscal year are referred to as either due to/from funds (i.e., the current portion of interfund loans) or advances to/from other funds (i.e., the noncurrent portion of interfund loans). Advances between funds, reported in the fund financial statements, are classified as nonspendable in applicable governmental funds to indicate that they are not available for appropriation and are not expendable available financial resources. Services provided, deemed to be at market or near market rates, are treated as revenues and expenditures/expenses. Reimbursements are when one fund incurs a cost, charges the appropriate benefiting fund and reduces its related cost as a reimbursement. All other interfund transactions are treated as transfers. F. Capital Assets Capital assets for governmental fund types are not capitalized in the funds used to acquire or construct them. Capital acquisitions are reflected as expenditures in the governmental fund, and the related assets are reported in the government-wide financial statements. Capital assets owned by the District are stated at historical cost or estimated historical cost, if actual historical cost is not available. Contributed capital assets are recorded at their estimated fair market value at the time received. Park improvements completed prior to the year ended June 30, 1995 were recorded at estimated historical cost developed by estimating replacement costs, which were discounted through the use of indices to acquisition dates. Land obtained from developers as donations in substitute of fees are estimated using average assessed values for similar parcels during the year these parcels are acquired. It is the District s policy to not depreciate the base of parks, which includes grading, irrigation systems and landscaping. Capital assets are depreciated using the straight-line method over the following estimated useful lives: Structures and improvements Equipment 3 to 40 years 5 to 15 years It is the District s policy to capitalize all land, structures, improvements and equipment, except assets costing less than $1,500. Costs of assets sold or retired (and related amounts of accumulated depreciation) are eliminated from the accounts in the year of sale or retirement. The proceeds from the sale of capital assets is included in the statement of revenues, expenditures and changes in fund balances of the related fund. The proceeds reported in the governmental fund are eliminated and the gain or loss on sale is reported in the government-wide presentation. 27
46 Notes to Basic Financial Statements, Continued For the year ended June 30, SUMMARY OF SIGNIFICANT ACCOUNTING POLICIES, Continued G. Compensated Absences District employees are granted annual leave in varying amounts based on classification and length of service. Maximum annual leave hours eligible for carry forward to future years is limited to 1.5 times the employee's prior year accrual rate of annual leave, which ranges from 120 hours to 432 hours. Compensated absences are accrued in the government-wide financial statements when earned. A liability for compensated absences is reported in governmental funds only if they have matured, for example, as a result of employee resignations and retirements and is currently payable. Each year's budget includes a provision for the estimated expenditure for the current year. Typically the General Fund is used to liquidate the compensated absence liability. Sick leave is earned by regular, full-time employees. Any sick leave hours not used during the period are carried forward to future years, with no limit as to the number of hours that can be accumulated. Any sick leave hours unused at the time of an employee's retirement are added to the actual period of service when computing retirement benefits. It is the policy of the District not to buy back any accumulated sick leave. Accordingly, no provision for payment of sick leave has been included in the financial statements. H. Property Taxes The County of Sacramento is responsible for the collection and allocation of property taxes. Under California law, property taxes are assessed and collected by the County of Sacramento up to 1% of the full cash value of taxable property, plus other increases approved by the voters and distributed in accordance with statutory formulas. The District recognizes property taxes when the individual installments are due provided they are collected within 60 days after year-end. Secured property taxes are levied on or before the first day of September of each year. They become a lien on real property on March 1 preceding the fiscal year for which taxes are levied. These taxes are paid in two equal installments; the first is due November 1 and delinquent with penalties after December 10; the second is due February 1 and delinquent with penalties after April 10. Secured property taxes, which are delinquent and unpaid as of June 30, are declared to be tax defaulted and are subject to redemption penalties, cost, and interest when paid. If the delinquent taxes are not paid at the end of five years, the property is sold at public auction and the proceeds are used to pay the delinquent amounts due. Any excess is remitted, if claimed, to the taxpayer. Additional tax liens are created when there is a change in ownership of property or upon completion of new construction. Tax bills for these new tax liens are issued throughout the fiscal year and contain various payment and delinquent dates, but are generally due within one year. If the new tax liens are lower, the taxpayer receives a tax refund rather than a tax bill. Unsecured personal property taxes are not a lien against real property. These taxes are due on March 1, and become delinquent, if unpaid on August
47 Notes to Basic Financial Statements, Continued For the year ended June 30, SUMMARY OF SIGNIFICANT ACCOUNTING POLICIES, Continued H. Property Taxes, Continued The County uses the alternative method of property tax apportionment known as the Teeter Plan. Under this method of property tax apportionment, the County purchases the delinquent secured taxes at June 30 of each fiscal year. These taxes are accrued as intergovernmental receivables only if they are received from the County within 60 days after year-end for the governmental funds and are accrued when earned for the government-wide presentation regardless of the timing of the related cash flows. I. Long-term Obligations In the government-wide financial statements long-term debt and other long-term obligations are reported as liabilities in the governmental activities statement of net position. Bond premiums and discounts, as well as issuance costs, are deferred and amortized over the life of the bonds using the effective interest method. Bonds payable are reported net of the applicable bond premium or discount. Issuance costs are reported as deferred charges and are amortized over the life of the related debt. In the fund financial statements, governmental fund types recognize bond premiums and discounts, as well as issuance costs, incurred during the current period. The face amount of the debt issued is reported as other financing sources. Premiums received on debt issuances are reported as other financing sources while discounts on debt issuances are reported as other financing uses. Issuance costs, even if withheld from the actual net proceeds received, are reported as debt service expenditures. J. Net Position / Fund Balance In the Government-Wide Financial Statements, net position are classified in the following categories: Net Investment in Capital Assets This category groups all capital assets, including infrastructure, into one component of net position. Accumulated depreciation and the outstanding balances of debt that are attributable to the acquisition, construction, or improvement of these assets reduce this category. Restricted net position This category presents external restrictions imposed by creditors, grantors, contributors or laws and regulations of other governments and restrictions imposed by law through constitutional provisions or enabling legislation. Additionally, this category presents restrictions placed as established by the District s Board of Directors. Unrestricted net position This category represents the net position of the District, which are not restricted or invested in capital assets net of related debt for any project or other purpose. Fund balances presented in the governmental fund financial statements represent the difference between assets and liabilities. GASB Statement No. 54, Fund Balance Reporting and Governmental Fund Type Definitions, establishes criteria for classifying fund balances into specifically defined classifications and clarifies definitions for governmental funds. 29
48 Notes to Basic Financial Statements, Continued For the year ended June 30, SUMMARY OF SIGNIFICANT ACCOUNTING POLICIES, Continued J. Net Position / Fund Balance The District evaluated each of its funds at June 30, 2015 and classified fund balances into the following five categories: Non-spendable includes fund balance amounts that cannot be spent because they are either (a) not expected to be converted or (b) legally or contractually required to be maintained intact. Restricted includes fund balance amounts that are subject to externally enforceable legal restrictions or constrained for a specific purpose by external parties, constitutional provisions or enabling legislation. Committed includes fund balance amount that can only be used for specific purposes pursuant to constraints imposed by the formal actions of the District s Board of Directors. The District s Board of Directors must take action to allow for removal or change the constraint. Assigned includes fund balance amounts that are intended to be used for specific purposes that are neither considered restricted or committed. The Board of Director approved Board Resolution authorizing the General Manager to assign fund balance. Unassigned includes positive fund balance within the General Fund which has not been classified within the above mentioned categories and negative fund balances in other governmental funds. The District reduces restricted amounts first when expenditures are incurred for purposes for which both restricted and unrestricted (committed, assigned or unassigned) amounts are available. The District reduced committed amounts first, followed by assigned amounts, and then unassigned amounts when expenditures are incurred for purposes for which amount in any of those unrestricted fund balance classifications could be used. Additional information concerning the nature of The District s fund balances pursuant to GASB Statement No. 54 is provided in Note 9 Fund Balance. K. Use of Restricted and Unrestricted Net Position When an expense is incurred for purposes for which both restricted and unrestricted net position are available, the District s policy is to apply restricted net position first. L. Use of Estimates The preparation of financial statements in conformity with accounting principles generally accepted in the United States of America requires management to make estimates and assumptions that affect the reported amounts of assets and liabilities and disclosure of contingent assets and liabilities at the date of the financial statements and the reported amounts of revenues and expenditures during the reporting period. Actual results could differ from those estimates. 30
49 Notes to Basic Financial Statements, Continued For the year ended June 30, SUMMARY OF SIGNIFICANT ACCOUNTING POLICIES, Continued M. Deferred Outflows/Inflows of Resources, Continued In addition to liabilities, the statement of net position or balance sheet will sometimes report a separate section for deferred inflows of resources. This separate financial statement element, deferred inflows of resources, represents an acquisition of net position that applies to a future period(s) and so will not be recognized as an inflow of resources (revenue) until that time. The government reports two items in this category, unavailable revenue and amounts related to changes in the District s net pension liability that are deferred and amortized over a stated period. Unavailable revenue arises only under a modified accrual basis of accounting and accordingly is reported only in the governmental funds balance sheet. The governmental funds report unavailable revenues from one source: grant revenues. These amounts are deferred and will be recognized as an inflow of resources in the period that the amounts become available. Certain changes in the District s net pension liability are required to be deferred and reflected in pension expense over a closed amortization period. The District reported the unamortized net difference between the projected and actual earnings on pension plans as deferred inflows of resources in the government-wide statement of net position. N. Pension For purposes of measuring the net pension liability and deferred outflows/inflows of resources related to pensions, and pension expense, information about the fiduciary net position of the District s California Public Employees Retirement System (CalPERS) plans (Plans) and additions to/deductions from the Plans fiduciary net position have been determined on the same basis as they are reported by CalPERS. For this purpose, benefit payments (including refunds of employee contributions) are recognized when due and payable in accordance with the benefit terms. Investments are reported at fair value. O. New Pronouncements In 2015, the District adopted new accounting standards in order to conform to the following Governmental Accounting Standards Board Statements: GASB Statement No. 68, Accounting and Financial Reporting for Pensions An Amendment of GASB Statement No. 27 This statement improves accounting and financial reporting by state and local governments for pensions. It also improves information provided by state and local governmental employers about financial support for pensions that is provided by other entities. The District restated beginning net position as part of implementation of this statement. 31
50 Notes to Basic Financial Statements, Continued For the year ended June 30, SUMMARY OF SIGNIFICANT ACCOUNTING POLICIES, Continued N. New Pronouncements This Statement establishes standards for measuring and recognizing liabilities, deferred outflows of resources, deferred inflows of resources, and expense/expenditures. For defined benefit pensions, this statement identifies the methods and assumptions that should be used to project benefit payments, discount projected benefit payments to their actuarial present value, and attribute that present value to periods of employee service. Note disclosure and required supplementary information requirements about pensions also are addressed. Distinctions are made regarding the particular requirements for employers based on the number of employers whose employees are provided with pensions through the pension plan and whether pension obligations and pension plan assets are shared. GASB Statement No. 69, Government Combinations and Disposals of Government Operations This statement establishes accounting and financial reporting standards related to government combinations and disposals of government operations. As used in this statement, the term government combinations include a variety of transactions referred to as mergers, acquisitions, and transfers of operations. There was no effect on net position as part of implementation of this standard. GASB Statement No. 71, Pension Transition for the Contributions Made Subsequent to the Measurement Date An Amendment of GASB Statement No. 68 The objective of this statement is to address an issue regarding the application of the transition provisions of Statement No. 68, Accounting and Financial Reporting for Pensions. The issue related to amounts associated with contributions, if any, made by a state or local government employer or nonemployer contributing entity to a defined benefit pension plan after the measurement date of the government s beginning net pension liability. The District restated beginning net position as part of implementation of this standard. 32
51 Notes to Basic Financial Statements, Continued For the year ended June 30, CASH AND INVESTMENTS At June 30, 2015, the District s pooled cash and investments are classified in the accompanying financial statements as follows: Cash and investments $ 61,846,467 Restricted cash and investments 2,810,483 Total cash and investments 64,656,950 Cash and investments as of June 30, 2015 consisted of the following: Deposits with financial institutions 6,904,475 Total cash 6,904,475 U.S. Agency securities: U.S. Treasury Securities 302,258 Government Sponsored Enterprise Securities 175,150 Federal National Mortgage Association Medium Term Notes 544,010 Corporate Notes and Bonds 13,053,765 Certificates of deposit 8,700,078 Money Market Mutual Funds 1,139,821 Investments in Local Agency Investment Fund (LAIF) 33,837,393 Total investments 57,752,475 Total cash and investments $ 64,656,950 Investment policy: Investments are stated at fair value. California statutes authorize special districts to invest idle or surplus funds in a variety of credit instruments as provided for in the California Government Code, Section 53600, Chapter 4 - Financial Affairs. The table below identifies the investment types that are authorized for the District by the California Government Code (or the District s investment policy, where more restrictive) that address interest rate risk, credit risk, and concentration of credit risk. Maximum Maximum Maximum Percentage Investment Authorized Investment Type Maturity of Portfolio* In One Issuer Local agency bonds 5 Years None None U. S. Treasury obligations 5 Years None None U.S. Agency securities 5 Years None None California Local Agency debt 5 Years None None Bankers acceptances 180 Days 40% 30% High grade commercial paper 270 Days 25% 10% Negotiable certificates of deposits 5 Years 30% None Medium term corporate notes 5 Years 30% None Mutual Funds N/A 20% 10% Money Market Mutual Funds N/A 20% 10% Mortgage pass-through securities 5 Years 20% None Collateralized negotiable investments 5 Years None None Repurchase agreements 92 Days 20% None LAIF N/A None None Local government investments pools N/A None None *Excluding amounts held by bond trustees that are not subject to California Government code restrictions. 33
52 Notes to Basic Financial Statements, Continued For the year ended June 30, CASH AND INVESTMENTS, Continued The District complied with the provisions of California Government Code (or the District s investment policy, where more restrictive) pertaining to the types of investments held, institutions in which deposits were made and security requirements. The District will continue to monitor compliance with applicable statues pertaining to public deposits and investments. Investments Authorized by Debt Agreements: Investment of debt proceeds held by bond trustees are governed by provisions of the debt agreements, rather than the general provisions of the California Government Code or the District s investment policy. The table below identifies provisions of the 1998 Certificates of Participation trust agreement that address interest rate risk, credit risk and concentration of credit risk. Maximum Maximum Maximum Percentage Investment Authorized Investment Type Maturity Of Portfolio* In One Issuer State Agency Bonds None None None U.S. Treasury Obligations None None None Government sponsored agency obligations None None None U.S. Government agency obligations None None None Money Market Funds None None None Bankers acceptances 30 Days None None Commercial Paper 270 Days None None Negotiable certificates and times deposits 30 Days None None Repurchase Agreements 270 Days None None Money Market funds None None None LAIF None None None Investment agreements None None None *Excluding amounts held by bond trustee that are not subject to California Government code restrictions. Interest Rate Risk: Interest rate risk is the risk that changes in market interest rates will adversely affect the fair value of an investment. Generally, the longer the maturity of an investment, the greater the sensitivity of its fair value to changes in market interest rates. One of the ways the District manages its exposure to interest rate risk is by purchasing a combination of shorter term and longer term investments and by timing cash flows from maturities so that a portion of the portfolio is maturing or coming close to maturity evenly over time as necessary to provide the cash flow and liquidity needed for operations. The District s investment policy does not contain any provisions limiting interest rate risk other than what is specified in the California Government Code. 34
53 Notes to Basic Financial Statements, Continued For the year ended June 30, CASH AND INVESTMENTS, Continued Information about the sensitivity of the fair values of the District s investments to market interest rate fluctuations is provided by the following table that shows the distribution of the District s investments by maturity: Investment Maturities in Years Fair Less Value Than 1 Year 1-2 years 2-3 years 3 years + U.S. Treasury Securities $ 302,258 $ 227,047 $ 75,211 $ - $ - Government Sponsored Enterprise Securities 175, , Federal National Mortgage Association Medium Term Notes 544,010-12, , ,294 Certificates of Deposit 8,700,078 3,491,268 4,164,953 1,043,857 - Corporate Notes 13,053,765 3,020,219 3,023,214 7,010,332 - Money Market Mutual Funds 1,139,821 1,139, LAIF 33,837,393 33,837, Total $ 57,752,475 $ 41,890,898 $ 7,275,951 $ 8,154,332 $ 431,294 Credit Risk: Generally, credit risk is the risk that an issuer of an investment will not fulfill its obligation to the holder of the investment. This is measured by the assignment of a rating by a nationally recognized statistical rating organization. Presented below is the minimum rating required by (where applicable) the California Government Code or the District s investment policy, and the actual rating as of year end for each investment type. Ratings as of Year End Total AAA AA+ AA- A+ A A- BBB+ Not Rated U.S. Treasury Securities $ 302,258 $ - $ 302,258 $ - $ - $ - $ - $ - $ - Government Sponored Enterprise Securities 175, , Federal National Mortgage Association Medium Term Notes 544,010 98, ,069 Corporate Notes 13,053, ,539 1,000,000 2,919,661 5,133,313 2,043, ,142 - Certificates of Deposit 8,700, ,700,078 Money Market Mutual Funds 1,139, ,341 1,102,480 LAIF 33,837, ,837,393 Total $ 57,752,475 $ 98,941 $ 1,447,947 $ 1,000,000 $ 2,919,661 $ 5,133,313 $ 2,043,110 $ 1,024,483 $ 44,085,020 Concentration of Credit Risk: The investment policy of the District contains no limitations on the amount that can be invested in any one issuer beyond that stipulated by the California Government Code. The following are investments in one issuer (other than mutual funds and external investment pools) that represent 5% or more of total District investments. Issuer Type of Investment Total American Express Corporation Corporate Notes $1,259,213 35
54 Notes to Basic Financial Statements, Continued For the year ended June 30, CASH AND INVESTMENTS, Continued Custodial Credit Risk: Custodial credit risk for deposits is the risk that, in the event of the failure of a depository financial institution, a government will not be able to recover its deposits or will not be able to recover collateral securities that are in the possession of an outside party. The custodial credit risk for investments is the risk that, in the event of the failure of the counterparty (e.g., broker-dealer) to a transaction, a government will not be able to recover the value of its investment or collateral securities that are in the possession of another party. The California Government Code and the District s investment policy do not contain legal or policy requirements that would limit the exposure to custodial credit risk for deposits, other than the following provision for deposits: The California Government Code requires that a financial institution secure deposits made by state or local governmental units by pledging securities in an undivided collateral pool held by a depository regulated under state law (unless so waived by the governmental unit). The market value of the pledged securities in the collateral pool must equal at least 110% of the total amount deposited by the public agencies. California law also allows financial institutions to secure public agency deposits by pledging first trust deed mortgage notes having a value of 150% of the secured public deposits. At June 30, 2015, the carrying amount of the District s deposits was $6,904,475 and the balance in financial institutions was $7,863,492. Of the balance in financial institutions, $1,047,413 was covered by federal depository insurance and $6,816,079 was collateralized as required by State law (Government Code Section 53630), by the pledging financial institution with assets held in a common pool for the District and other governmental agencies, but not in the name of the District. As of June 30, 2015, District investments in the following investment types were held by the same broker-dealer (counterparty) that was used by the District to buy the securities: Type of Investment Total Corporate Notes and Bonds $ 13,053,765 U.S. Agency Securities $ 544,010 Investment in LAIF: The District invests in the California Local Agency Investment Fund (LAIF), a State of California external investment pool. LAIF determines fair value on its investment portfolio based on market quotations for those securities where market quotations are readily available, and on amortized cost or best estimate for those securities where market value is not readily available. The District s investments with LAIF at June 30, 2015 included a portion of the pooled funds invested in structured notes and asset-backed securities. These investments included the following: Structured Notes are debt securities (other than asset-backed securities) whose cash flow characteristics (coupon rate, redemption amount, or stated maturity) depend upon one or more indices and/or that have embedded forwards or options. Asset-Backed Securities, the bulk of which are mortgage-backed securities, entitle their purchasers to receive a share of the cash flows from a pool of assets such as principal and interest repayments from a pool of mortgages (such as CMS) or credit card receivables. 36
55 Notes to Basic Financial Statements, Continued For the year ended June 30, CASH AND INVESTMENTS, Continued As of June , the District had $33,837,393 invested in LAIF, which had invested 2.08% of the pool investment funds in Structured Notes and Asset-Backed Securities compared to 1.86% in fiscal year Fair value of LAIF was calculated by applying a factor of to total investments held by LAIF. The Local Investment Advisory Board (Board) has oversight responsibility for LAIF. The Board consists of five members as designated by State Statute. 3. CAPITAL ASSETS Capital asset activity for the year ended June 30, 2015 was as follows: Balance Balance June 30, 2014 Additions Retirements Transfers June 30, 2015 Capital assets not being depreciated: Land $ 85,443,191 $ 1,670,635 $ - $ - $ 87,113,826 Land improvements 64,201, ,442 64,509,759 Construction in progress 1,081,776 1,056,273 - (867,368) 1,270,681 Total capital assets not being depreciated 150,726,284 2,726,908 - (558,926) 152,894,266 Capital assets being depreciated: Structures and improvements 77,035,619 - (1,127,991) 558,926 76,466,554 Equipment 25,049,626 1,626,602 (1,846,158) - 24,830,070 Total capital assets being depreciated 102,085,245 1,626,602 (2,974,149) 558, ,296,624 Less accumulated depreciation for: Structures and improvements (27,618,181) (2,715,868) 699,945 - (29,634,104) Equipment (20,875,381) (1,117,974) 1,679,576 - (20,313,779) Total accumulated depreciation (48,493,562) (3,833,842) 2,379,521 - (49,947,883) Total capital assets being depreciated, net 53,591,683 (2,207,240) (594,628) 558,926 51,348,741 Capital assets, net $ 204,317,967 $ 519,668 $ (594,628) $ - $ 204,243,007 The District incurred an impairment loss of $594,628 on disposal of a number of items and damage caused by a fire that occurred during the year ended June 30,
56 Notes to Basic Financial Statements, Continued For the year ended June 30, CAPITAL ASSETS, Continued Depreciation was charged to activities as follows: Public Protection $ 1,144,096 Recreation and culture 2,667,257 General government 22,489 Total depreciation expense $ 3,833, INTERFUND TRANSACTIONS Due from other funds Due to other funds Non-Major General Governmental Fund Fund Total General Fund $ - $ 191,454 $ 191,454 Non-Major Governmental Fund 45,274 - $ 45,274 Total $ 45,274 $ 191,454 $ 236,728 These balances resulted from the time lag between the dates that (1) interfund goods and services are provided or reimbursable expenditures occur, (2) transactions are recorded in the accounting system, and (3) payments between funds are made. Advances to other funds Advances from other funds Non-Major Governmental Fund Total General Fund $ 25,008 $ 25,008 Total $ 25,008 $ 25,008 38
57 Notes to Basic Financial Statements, Continued For the year ended June 30, INTERFUND TRANSACTIONS, Continued Advances from the General Fund to the Landscape and Lighting Special Revenue Fund and Non-Major Governmental Funds are to fund operating expenditures not otherwise covered by available resources. Transfers In Major Fund Landscape and Non - Major General Lighting Special Governmental Fund Revenue Fund Fund Total Transfers Out General Fund $ 1,290,694 $ - $ 236,130 $ 1,526,824 Landscape and Lighting Special Revenue Fund 1,540,864 2,642,949-4,183,813 Non - Major Governmental Fund 9, ,482 Total $ 2,841,040 $ 2,642,949 $ 236,130 $ 5,720,119 Transfers are used to (1) pay for overhead expenditures incurred and to assist in paying for capital improvement projects, and (2) move receipts restricted to debt service from the funds collecting the receipts to the debt service fund as debt service payments become due. 5. LONG-TERM LIABILITIES The activities of the District s long-term liabilities during the year ended June 30, 2015 are as follows: Balance July 1, 2014 Balance Due Within (as restated) Additions Reductions June 30, 2015 One Year Loans Payable $ 94,752 $ - $ (10,146) $ 84,606 $ 10,693 Certificates of Participation Series 847,200 - (183,100) 664, ,600 Capital lease obligation 19,103,062 1,276,969 (1,867,300) 18,512,731 1,910,671 Compensated absences 1,875,361 - (84,359) 1,791, ,476 Net OPEB liability 25,324,473 4,545,065 (3,421,425) 26,448,113 - Net pension liability 57,430,772 - (8,269,302) 49,161,470 - Total long-term liabilities $ 104,675,620 $ 5,822,034 $ (13,835,632) $ 96,662,022 $ 2,468,440 Less: amount due within one year (2,171,607) (2,468,440) Amounts due in more than one year $ 102,504,013 $ 94,193,582 39
58 Notes to Basic Financial Statements, Continued For the year ended June 30, LONG-TERM LIABILITIES, Continued Net OPEB liability and net pension liability typically have been liquidated by the General Fund for governmental activities. The certificates of participation and loans payable consist of the following as of June 30, 2015: Loans Payable - Obtained August 15, 2003 and May 1, 2007 in the amount of $3,010,000, and $200,000, respectively, for the partial funding of the acquisition and construction of the Barbara Morse Wackford Aquatic/Community Complex and a fire protection training facility and for the funding of the Underwood Park well. The District has pledged certain legally available revenues from the Landscape and Lighting Special Revenue Fund to secure the $3,010,000 loan. The revenues pledged must exceed 125% of the maximum annual debt service requirements of the loan and all future indebtedness payable from the revenues pledged under the terms of the agreement. Semi-annual interest payments at 4.56% ranging from $3,408 to $40,861 and semi-annual principal payments ranging from $104,211 to $142,579 are due January 15 and July 15 through January 14, 2014 on the $3,010,000 loan and semi-annual interest payments at 5.31% ranging from $252 to $5,310 and semi-annual principal payments ranging from $4,444 to $9,502 are due November 1 and May 1 through May 1, 2022 on the $200,000 loan. The outstanding balances as of June 30, 2015 were $84,606. Certificates of Participation - Issued August 1998 for the acquisition and construction of two fire stations and certain real property for a fire protection training facility. On October 20, 2010 the District entered into lease agreement and site agreement for the refinance of the 1998 Certificates of Participation. Under the terms of the new agreement, the new loan will bear an interest rate of 4.05% and a final maturity of Annual principal payments of $68,400 to $206,700 are due August 1. The outstanding balance as of June 30, 2015 was $664,100. Compensated Absences - Compensated absences are liquidated by the fund that has recorded the liability. The long-term portion of governmental activities compensated absences is liquidated primarily by the General Fund. Payments of principal and interest on the certificates of participation and loan payable are funded by assessments of residents and businesses within the Landscape and Lighting Assessment District. Shortfalls in assessment revenues are funded by General Fund revenues. There was no delinquent assessments receivable at June 30,
59 Notes to Basic Financial Statements, Continued For the year ended June 30, LONG-TERM LIABILITIES, Continued Maturities of long-term liabilities are summarized below. Loans Payable Certificates of Participation Principal Interest Total Principal Interest Total 2016 $ 10,692 $ 4,536 $ 15,228 $ 190,600 $ 23,036 $ 213, ,268 3,962 15, ,400 15, , ,875 3,355 15, ,700 6, , ,514 2,716 15,230 68,400 1,385 69, ,187 2,043 15, ,070 3,963 29, Total debt $ 84,606 $ 20,575 $ 105,181 $ 664,100 $ 46,536 $ 710,636 Capital Lease Obligation - Effective July 1, 2000, the District entered into a lease agreement to finance the construction and equipping of fire station 76. The lease agreement provides for 40 semi-annual payments of $78,777 through July 1, Payments under the agreements include interest at 3.03%. The capital assets acquired under the capital lease agreement consist of a fire station, land and equipment totaling $1,928,763, with accumulated depreciation of $691,188 at June 30, In July 2004, the District entered into a lease agreement to finance the construction of fire station 72. The lease agreement provides for 15 annual payments of $302,772 beginning July 31, 2005 through July 31, Payments include interest at 5.12%. The cost of this fire station was $3,034,122, with accumulated depreciation of $786,726 at June 30, In March 2006, the District entered into a lease agreement to acquire and improve 97 acres of land for a park site. The lease calls for 80 quarterly payments of $70,359 through March 30, Payments include interest at 1.67%. Capital assets acquired under this lease agreement include land and improvements of $4,381,059, with accumulated depreciation of $676,558 at June 30, In July 2006, the District entered into a lease agreement to fund the purchase of a golf course, which is recorded as land in the amount of $5,009,532. The lease agreement provides for 28 quarterly payments of $89,689 through July 2013, with the payments being reset on that date and paid through July 21, Payments include interest at 2.35%. On August 27, 2008, the District entered into a capital lease agreement in the amount of $10,024,366 to finance the construction of a fleet maintenance facility expansion and to refinance the April 1, 2007 lease agreement to expand the training facility. Under the agreement, principal and interest payments of $398,568 are due semi-annually at a fixed interest rate of 5.4% from March 4, 2009 through September 4, There is a no call provision for the first 10 years of the agreement but the loan may be prepaid or refinanced after that time. Capital assets acquired under this lease agreement include land and improvements of $10,000,000, with accumulated depreciation of $769,068 at June 30, On January 3, 2013, the District entered into a capital lease agreement in the amount of $320,004 for the improvement of three ambulances. The lease agreement provides for 60 monthly payments of $5,688 from March 1, 2013 through February 1, Payments include interest at 2.56%. Capital assets acquired under this lease agreement include equipment of $320,004, with accumulated depreciation of $160,005 at June 30,
60 Notes to Basic Financial Statements, Continued For the year ended June 30, LONG-TERM LIABILITIES, Continued On March 25, 2014, the District entered into a capital lease agreement in the amount of $297,741 for three ambulances. The lease agreement provides for 60 monthly payments of $5,330 from April 15, 2014 through March 15, Payments include interest at 2.86%. On December 7, 2013, the District entered into a capital lease agreement in the amount of $1,073,150 for two fire engines. The lease agreement provides for 7 annual payments of $168,392 from December 7, 2013 through July 7, Payments include interest at 1.56%. On November 11, 2014, the District entered into a capital lease agreement in the amount of $886,022 for various cardiac monitors. The lease agreement provides for 4 monthly payments of $191,967 from November 11, 2014 through March 15, Payments include interest at 4.5%. On March 23, 2015, the District entered into a capital lease agreement in the amount of $282,408 for two remounted ambulances and other equipment. The lease agreement provides for 60 monthly payments of $5,046 from April 13, 2015 through March 13, Payments include interest at 2.77%. The District leased equipment and vehicles under numerous capital leases, which have various monthly, annual, and semiannual payments through November, Interest rates range from 3.07% to 11.91%. Capital assets acquired under these capital leases consist of equipment totaling $764,471 with accumulated depreciation of $513,982 at June 30, As of June 30, 2015, future minimum lease payments under capital lease obligations were as follows: Fiscal Year ending June 30, 2016 $ 2,599, ,500, ,456, ,391, ,127, ,433, ,449,497 Total payments 22,960,240 Less amounts representing interest 4,447,509 Net present value of future minimum lease payments $ 18,512, DEFINED BENEFIT PENSION PLAN A. General Information about the Pension Plans Plan Descriptions All qualified permanent and probationary employees are eligible to participate in the District s separate Safety (fire) and Miscellaneous (all other) Plans, agent multiple-employer defined benefit pension plans administered by the California Public Employees Retirement System (CalPERS), which acts as a common investment and administrative agent for its participating member employers. Benefit provisions under the Plans are established by State statute and Local Government resolution. CalPERS issues publicly available reports that include a full description of the pension plans regarding benefit provisions, assumptions and membership information that can be found on the CalPERS website. 42
61 Notes to Basic Financial Statements, Continued For the year ended June 30, DEFINED BENEFIT PENSION PLAN, Continued A. General Information about the Pension Plans, Continued Benefits Provided CalPERS provides service retirement and disability benefits, annual cost of living adjustments and death benefits to plan members, who must be public employees and beneficiaries. Benefits are based on years of credited service, equal to one year of full time employment. Members with five years of total service are eligible to retire at age 50 with statutorily reduced benefits. All members are eligible for non-duty disability benefits after 10 years of service. The death benefit is one of the following: the Basic Death Benefit, the 1957 Survivor Benefit, or the Optional Settlement 2W Death Benefit. The cost of living adjustments for each plan are applied as specified by the Public Employees Retirement Law. The Plans provisions and benefits in effect at June 30, 2015, are summarized as follows: Safety Miscellaneous Benefit vesting schedule 5 years of service 5 years of service Benefit payments monthly for life monthly for life Earliest retirement age Benefit factor for each year of service as a % of annual salary 3% at age % at 55 Required employee contribution rates 9% 8% Required employer contribution rates % % On January 1, 2013, the Public Employee Pension Reform Act (PEPRA) went into effect. This State law applies to employees hired after January 1, 2013 who are new to PERS. These employees are termed PEPRA members and employees that were enrolled in PERS (without significant separation) prior to January 1, 2013 are now referred to as classic members. PEPRA miscellaneous members will be enrolled in a 2% at 62 plan and PEPRA safety members will be enrolled in a 2.7% at 57 plan. PEPRA members will be required to pay half the normal cost of their plans. 43
62 Notes to Basic Financial Statements, Continued For the year ended June 30, DEFINED BENEFIT PENSION PLAN, Continued A. General Information about the Pension Plans, Continued Employees Covered At June 30, 2015, the following employees were covered by the benefit terms for each Plan: Miscellaneous Safety Inactive employees or beneficiaries currently receiving benefits Inactive employees entitled to but not yet receiving benefits Active employees Total Contributions Section 20814(C) of the California Public Employees Retirement Law (PERL) requires that the employer contribution rates for all public employers be determined on an annual basis by the actuary and shall be effective on the July 1 following notice of a change in the rate. Funding contributions for both Plans are determined annually on an actuarial basis as of June 30 by CalPERS. The actuarially determined rate is the estimated amount necessary to finance the costs of benefits earned by employees during the year, with additional amount to finance any unfunded accrued liability. The District is required to contribute the difference between the actuarially determined rate and the contribution rate of employees. For the measurement period ended June 30, 2014 (the measurement date), the average active employee contribution rate is percent of annual pay for the Miscellaneous Plan and percent of annual pay for the Safety Plan, and employer contribution rate is percent of annual payroll for the Miscellaneous Plan and percent of annual payroll for the Safety Plan B. Net Pension Liability The District s net pension liability for each Plan is measured as the total pension liability, less the pension plan s fiduciary net position. The net pension liability of each of the Plans is measured as of June 30, 2014, using an annual actuarial valuation as of June 30, 2013 rolled forward to June 30, 2014 using standard update procedures. A summary of principal assumptions and methods used to determine the net pension liability is shown below. 44
63 Notes to Basic Financial Statements, Continued For the year ended June 30, DEFINED BENEFIT PENSION PLAN, Continued B. Net Pension Liability, Continued Actuarial Assumptions The total pension liabilities in the June 30, 2013 actuarial valuations were determined using the following actuarial assumptions: Miscellaneous Safety Valuation Date June 30, 2013 June 30, 2013 Measurement Date June 30, 2014 June 30, 2014 Actuarial Cost Method Entry-Age Normal Cost Method Actuarial Assumptions: Discount Rate 7.50% 7.50% Inflation 2.75% 2.75% Salary Increases Investment Rate of Return (1) Varies by Entry Age and Service 7.50% 7.50% Derived using CalPERS' Membership Data for all Mortality (2) Funds Post Retirement Benefit Increase Protection Allowance Floor on Purchasing Power applies, 2.75% thereafter (1) Net of pension plan investment and administrative expenses, including inflation. (2) The mortality table used was developed based on CalPERS' specific data. The table includes 20 years of mortality improvements using Society of Actuaries Scale BB. The underlying mortality assumptions and all other actuarial assumptions used in the June 30, 2013 valuation were based on the results of a January 2014 actuarial experience study for the period 1997 to Further details of the Experience Study can found on the CalPERS website. Discount Rate The discount rate used to measure the total pension liability was 7.50% for each Plan. To determine whether the municipal bond rate should be used in the calculation of a discount rate for each plan, CalPERS stress tested plans that would most likely result in a discount rate that would be different from the actuarially assumed discount rate. Based on the testing, none of the tested plans run out of assets. Therefore, the current 7.50 percent discount rate is adequate and the use of the municipal bond rate calculation is not necessary. The long term expected discount rate of 7.50 percent will be applied to all plans in the Public Employees Retirement Fund (PERF). The stress test results are presented in a detailed report that can be obtained from the CalPERS website. 45
64 Notes to Basic Financial Statements, Continued For the year ended June 30, DEFINED BENEFIT PENSION PLAN, Continued B. Net Pension Liability, Continued According to Paragraph 30 of Statement 68, the long-term discount rate should be determined without reduction for pension plan administrative expense. The 7.50 percent investment return assumption used in this accounting valuation is net of administrative expenses. Administrative expenses are assumed to be 15 basis points. An investment return excluding administrative expenses would have been 7.65 percent. Using this lower discount rate has resulted in a slightly higher Total Pension Liability and Net Pension Liability. CalPERS checked the materiality threshold for the difference in calculation and did not find it to be a material difference. CalPERS is scheduled to review all actuarial assumptions as part of its regular Asset Liability Management (ALM) review cycle that is scheduled to be completed in February Any changes to the discount rate will require Board action and proper stakeholder outreach. For these reasons, CalPERS expects to continue using a discount rate net of administrative expenses for GASB 67 and 68 calculations through at least the fiscal year. CalPERS will continue to check the materiality of the difference in calculation until such time as it has changed its methodology. The long-term expected rate of return on pension plan investments was determined using a buildingblock method in which best-estimate ranges of expected future real rates of return (expected returns, net of pension plan investment expense and inflation) are developed for each major asset class. In determining the long-term expected rate of return, CalPERS took into account both short-term and long-term market return expectations as well as the expected pension fund cash flows. Using historical returns of all the funds asset classes, expected compound returns were calculated over the short-term (first 10 years) and the long-term (11-60 years) using a building-block approach. Using the expected nominal returns for both short-term and long-term, the present value of benefits was calculated for each fund. The expected rate of return was set by calculating the single equivalent expected return that arrived at the same present value of benefits for cash flows as the one calculated using both short-term and long-term returns. The expected rate of return was then set equivalent to the single equivalent rate calculated above and rounded down to the nearest one quarter of one percent. 46
65 Notes to Basic Financial Statements, Continued For the year ended June 30, DEFINED BENEFIT PENSION PLAN, Continued B. Net Pension Liability, Continued The table below reflects the long-term expected real rate of return by asset class. The rate of return was calculated using the capital market assumptions applied to determine the discount rate and asset allocation. These rates of return are net of administrative expenses. New Strategic Real Return Real Return Asset Class Allocation Years 1-10(a) Years 11+(b) Global Equity 47.00% 5.25% 5.71% Global Fixed Income 19.00% 0.99% 2.43% Inflation Sensitive 6.00% 0.45% 3.36% Private Equity 12.00% 6.83% 6.95% Real Estate 11.00% 4.50% 5.13% Infrastructure and Forestland 3.00% 4.50% 5.09% Liquidity 2.00% -0.55% -1.05% Total 100% (a) An expected inflation of 2.5% used for this period. (b) An expected inflation of 3.0% used for this period. 47
66 Notes to Basic Financial Statements, Continued For the year ended June 30, DEFINED BENEFIT PENSION PLAN, Continued C. Changes in the Net Pension Liability The changes in the Net Pension Liability for each Plan follow: Miscellaneous Plan: Increase (Decrease) Total Pension Plan Fiduciary Net Pension Liability Net Position Liability/(Asset) Balance at June 30, 2014 (1) $ 32,020,338 $ 22,897,743 $ 9,122,595 Changes in the year: Service cost 1,279,630-1,279,630 Interest on the total pension liability 2,412,110-2,412,110 Differences between actual and expected experience Changes in assumptions Changes in benefit terms Contribution - employer - 971,677 (971,677) Contribution - employee - 569,537 (569,537) Investment income - 4,051,774 (4,051,774) Administrative expenses - (27,778) 27,778 Benefit payments, including refunds of employee contributions (997,382) (997,382) - Net changes 2,694,358 4,567,828 (1,873,470) Balance at June 30, 2015 $ 34,714,696 $ 27,465,571 $ 7,249,125 (1) The fiduciary net position includes receivables for employee service buyback, deficiency reserve, fiduciary self-insurance, and OPEB expense. 48
67 Notes to Basic Financial Statements, Continued For the year ended June 30, DEFINED BENEFIT PENSION PLAN, Continued C. Changes in the Net Pension Liability, Continued Safety Plan: Increase (Decrease) Total Pension Plan Fiduciary Net Pension Liability Net Position Liability/(Asset) Balance at June 30, 2014 (1) $ 129,422,997 $ 81,114,820 $ 48,308,177 Changes in the year: Service cost 4,500,842-4,500,842 Interest on the total pension liability 9,733,321-9,733,321 Differences between actual and expected experience Changes in assumptions Changes in benefit terms Contribution - employer - 4,035,130 (4,035,130) Contribution - employee - 2,137,329 (2,137,329) Net investment income - 14,568,648 (14,568,648) Administrative expenses (111,112) 111,112 Benefit payments, including refunds of employee contributions (3,791,597) (3,791,597) - Net changes 10,442,566 16,838,398 (6,395,832) Balance at June 30, 2015 $ 139,865,563 $ 97,953,218 $ 41,912,345 (1) The fiduciary net position includes receivables for employee service buyback, deficiency reserve, fiduciary self-insurance, and OPEB expense. Sensitivity of the Net Pension Liability to Changes in the Discount Rate The following presents the net pension liability of the District for each Plan, calculated using the discount rate for each Plan, as well as what the District s net pension liability would be if it were calculated using a discount rate that is 1-percentage point lower or 1-percentage point higher than the current rate: Miscellaneous Safety Total 1% Decrease 6.50% 6.50% 6.50% Net Pension Liability $ 12,687,965 $ 63,382,889 76,070,854 Current Discount Rate 7.50% 7.50% 7.50% Net Pension Liability $ 7,249,125 $ 41,912,345 49,161,470 1% Increase 8.50% 8.50% 8.50% Net Pension Liability $ 2,844,445 $ 24,285,261 27,129,706 49
68 Notes to Basic Financial Statements, Continued For the year ended June 30, DEFINED BENEFIT PENSION PLAN, Continued C. Changes in the Net Pension Liability, Continued Pension Plan Fiduciary Net Position Detailed information about each pension plan s fiduciary net position is available in the separately issued CalPERS financial reports. D. Pension Expenses and Deferred Outflows/Inflows of Resources Related to Pensions For the year ended June 30, 2015, the District recognized pension expense of $5,207,718. At June 30, 2015, the District reported deferred outflows of resources and deferred inflows of resources related to pensions from the following sources: Deferred Outflows of Resources Deferred Inflows of Resources Pension contributions subsequent to measurement date $ 5,060,661 $ - Net differences between projected and actual earnings on plan investments - 8,470,213 Total $ 5,060,661 $ 8,470,213 $5,060,661 reported as deferred outflows of resources related to contributions subsequent to the measurement date will be recognized as a reduction of the net pension liability in the year ending June 30, Other amounts reported as deferred outflows of resources and deferred inflows of resources related to pensions will be recognized as pension expense as follows: Year Ending June 30: 2016 $ (2,117,553) 2017 (2,117,553) 2018 (2,117,553) 2019 (2,117,554) E. Payable to Pension Plans As of June 30, 2015, the District reported a payable of $0 for the outstanding amount of contributions to the pension plans required for the year ended June 30,
69 Notes to Basic Financial Statements, Continued For the year ended June 30, OTHER POSTEMPLOYEMENT BENEFITS The District participates in the CalPERS healthcare programs Public Employees Medical and Hospital Care Act (PEHMCA), providing lifetime medical benefits to District full-time employees who retire at age 50 or older with 5 or more years of service. Benefits are also provided to spouses and surviving spouses of eligible retirees. Retires may enroll in any available CalPERS medical plan. The District contributed 100% of the costs. The District currently participates in an OPEB. For fiscal year ended June 30, 2015, there were 75 retirees receiving this benefit and total District costs amounted to $1,260,087. Beginning in the fiscal year , the District pre-funds the Plan through CalPERS OPEB Trust (CERBT) by contributing the District s Annual Required Contribution (ARC) every year. For the fiscal year , the District contributed $3,421,425, including $1,260,087 in benefit payments and a $2,161,338 deposit to CERBT. CERBT is a tax qualified irrevocable trust, organized under Internal Revenue Code (IRC) Section 115, established to prefund OPEB as described in GASB Statement 45. The CERBT issues a publicly available financial report that included financial statements and required supplementary information for the District, not individualizing, but in aggregate with the other CERBT participants. That report may be obtained by contacting CalPERS. The District s annual other post employment benefit (OPEB) cost (expense) is calculated based on the annual required contribution of the employer (ARC), an amount actuarially determined in accordance with the parameters of GASB Statement 45. The ARC represents a level of funding that, if paid on an ongoing basis, is projected to cover normal costs each year and amortize any unfunded actuarial liabilities (or funding excess) over a period not to exceed thirty years. The following table illustrates the District s June 30, 2015 Net OPEB Obligation: Annual required contribution $ 4,695,401 Interest on net OPEB obligation 1,079,015 Amortization of net OPEB obligation (1,229,351) Annual OPEB cost 4,545,065 Payments made (3,421,425) Increase in net OPEB obligation 1,123,640 Net OPEB obligation - beginning of the year 25,324,473 Estimated NET OPEB Obligation June 30, 2014 $ 26,448,113 51
70 Notes to Basic Financial Statements, Continued For the year ended June 30, OTHER POSTEMPLOYEMENT BENEFITS, Continued The District annual OPEB cost, the percentage of annual OPEB cost contributed to the plan, and the net OPEB obligation for the fiscal year ended June 30, 2015 was as follows: Percentage of Annual APC Net OPEB Fiscal Year OPEB Cost Contributed Obligation 6/30/2013 6,540,277 11% 22,226,556 6/30/2014 4,267,288 27% 25,324,473 6/30/2015 4,545,065 75% 26,448,113 Funded Status and Funding Progress As of July 1, 2013, the most recent actuarial valuation date, the plan was 0% funded. The actuarial accrued liability (AAL) for benefits was $48,678,128, and the actuarial value of plan assets was $0, resulting in an unfunded actuarial accrued liability (UAAL) of $48,678,128. The covered payroll (annual payroll of active employees covered by the plan) was $20,364,480 and the ratio of UAAL to the covered payroll was 239.0%. The schedule of funding progress for the postemployment defined benefit plan immediately following the notes to the financial statements presents multi-year trend information about whether the actuarial value of plan assets is increasing or decreasing relative to the actuarial accrued liability for benefits over time. Actuarial valuations of an ongoing plan involve estimates of the value of reported amounts and assumptions about the probability of occurrence of events far into the future. Examples include assumptions about future employment, mortality, and the healthcare cost trend. Amounts determined regarding the funded status of the plan and the annual required contributions of the employer are subject to continual revision as actual results are compared with past expectations and new estimates are made about the future. The Schedule of Funding Progress, presented as Required Supplementary Information following the notes to the financial statements, presents multiyear trend information about whether the actuarial value of plan assets is increasing or decreasing over time relative to the actuarial accrued liabilities for benefits. Since this is the first year of including this information in the financial report, the data presented is limited. Actuarial Methods and Assumptions Projections of benefits for financial reporting purposes are based on the substantive plan (the plan as understood by the employer and the plan members) and include the types of benefits provided at the time of each valuation and the historical pattern of sharing of benefit costs between the employer and plan members to that point. The actuarial methods and assumptions used include techniques that are designed to reduce the effects of short-term volatility in actuarial accrued liabilities and the actuarial value of assets, consistent with the long-term perspective of the calculations. 52
71 Notes to Basic Financial Statements, Continued For the year ended June 30, OTHER POSTEMPLOYEMENT BENEFITS, Continued The District s July 1, 2013 retiree healthcare valuation was prepared using the Entry Age Normal (EAN) actuarial cost method. Under the EAN cost method, the plan s Normal Cost is developed as a level percent of payroll throughout the participants working lifetime. The Actuarial Accrued Liability (AAL) is the cumulative value on the valuation date of prior Normal Cost. For the retirees, the AAL is the present value of all projected benefits. The Unfunded AAL is being amortized as a level dollar closed 30 year basis, as a level percent of payroll with a remaining amortization period at July 1, 2013 of 25 years. GASB 45 requires the interest rate to represent the underlying expected long-term rate of return for the source of funds used to pay benefits. The District has not commenced pre-funding the obligation, this valuation included a 4.25% interest rate rather than 7.75%. Another key assumption is that future healthcare inflation rate used to increase the PEMHCA minimum contribution is expected to increase at 5.5% a year. The rate of increase in per capita health care costs is assumed to increase at 5.5% in the long term and aggregate payroll to increase at 3.25% per annum. The study also used assumptions for the salary merit and longevity increases, and demographic assumptions such as mortality, withdrawal, and disability based on CalPERS Experience Study. Retirement assumption was also based on CalPERS Experience Study of the Miscellaneous Plan 2.5% at 55 years, and Fire Plan 3% at 50 years. 8. RISK MANAGEMENT The District participates in the Northern California Special Districts Insurance Authority (NCSDIA), a public entity risk pool of special districts within Northern California, for workers compensation insurance. Loss contingency reserves established by NCSDIA are funded by contributions from member agencies. The District pays an annual premium to NCSDIA that includes its pro-rata share of excess insurance premiums, charges for the pooled risk, claims adjusting and legal costs, and administrative and other costs to operate the NCSDIA. NCSDIA retains the ability to assess its members' amounts in addition to annual premiums. NCSDIA has never made an additional assessment and is currently fully funded. No provision has been made on these financial statements for liabilities related to possible additional assessments. The District also participates in the Special District Risk Management Authority (SDRMA), a joint powers agency comprised of California special districts, for general, property, automobile, and public officials errors and omissions. Loss contingency reserves established by the SDRMA are funded by contributions from member agencies. The District pays an annual contribution to the SDRMA that includes its pro-rata share of excess insurance premiums, charges for pooled risk, claims adjusting and legal costs, and administrative and other costs to operate the SDRMA. SDRMA provides insurance through the pool up to a certain level, beyond which group purchased commercial excess insurance is obtained. 53
72 Notes to Basic Financial Statements, Continued For the year ended June 30, RISK MANAGEMENT, Continued The District s self-insured retention level and maximum coverage under the NCSDIA and SDRMA are as follows: Pool Commercial Self-Insured Coverage Coverage Retention NCSDIA Workers compensation and employers liability $ 200,000 $ 5,000,000 $ - SDRMA Property - 1,000,000,000 2,000 Boiler and machinery - 100,000,000 1,000 Personal Injury and property damage 600,000 10,000, to 1,000 Uninsured motorists bodily injury 750, Public officials errors and omissions liability 600,000 10,000,000 - Employment benefits and practices liability 600,000 1,000,000 - Employee dishonesty - 400,000 - Public officials personal liability - 500, Trailer and automobile physical damage Replacement Cost
73 Notes to Basic Financial Statements, Continued For the year ended June 30, FUND BALANCE As of June 30, 2015, classifications of fund balance are as follows: Major Governmental Funds Fund Balances Landscaping and Lighting Non-Major Special Revenue Government Total General Fund Funds Government Nonspendable fund balance: Restricted fund balance for: Advances to other funds $ 25,008 $ - $ - $ 25,008 Prepaids 398, ,961 Subtotal 423, ,969 Park Development 12,370, ,370,376 Fire station and equipment 3,660, ,660,746 Capital projects , ,152 Specific purpose of the fund - 27,898,816-27,898,816 Foundation activies of the fund , ,541 Subtotal 16,031,122 27,898, ,693 44,349,631 Assigned fund balance for: Emergency reserve 2,844, ,844,752 Youth facility development 53, ,020 Apparatus replacement 1,467, ,467,524 Laguna town hall capital 40, ,000 BMW complex capital reserve 70, ,550 Park capital facilities 2,767, ,767,357 EG recreation center capital improvement 31, ,000 Fox aquatic capital improvement 20, ,700 Recreational activities 1,721, ,721,964 Public safety activities 8,682, ,682,932 Administrative activities 8,201, ,201,239 Fire capital facilities 7, ,528 Station 75 principal/repayment 10, ,488 Golf capital improvement 15, ,000 Dillard Ranch 98, ,346 HBSP deferred maintenance 43, ,290 Pavillion deferred maintenance 20, ,000 Sport Field Light Replacement Plan 12, ,865 Subtotal 26,108, ,108,555 Total Fund Balances 42,563,646 27,898, ,693 70,882,155 55
74 Notes to Basic Financial Statements, Continued For the year ended June 30, COMMITTMENT AND CONTINGENCIES The District is in the process of performing park land improvements and other projects as of June 30, 2015 as follows: Project Expended to Project Appropriation June 30, 2015 Committed Administration Building $ 1,791,602 $ 81,084 $ 1,710,518 Bartholomew Sports Park Maintenance Building 200, ,000 Total $ 1,991,602 $ 81,084 $ 1,910,518 The District is a party to claims and lawsuits arising in the ordinary course of business. The District s management and legal counsel are of the opinion that the ultimate liability, if any, arising from these claims will not have a material adverse impact on the financial position of the District. 11. PRIOR PERIOD ADJUSTMENT The District recorded prior period adjustments to record the beginning balance of the net pension liability, and to record employer contributions made for pension in fiscal year 2014 as a deferred outflow of resources. Government-wide Statements Net Position, as Prior Period Adjustment Net Position, Previously Deferred Employer Net Pension as Reported Pension Contributions Liability Restated Government-Wide Statements Governmental Activities $ 216,585,890 $ 5,006,807 $ (57,430,772) $ 164,161, SUBSEQUENT EVENTS On July 16, 2015, the District issued Certificates of Participation 2015 Refinancing Project (Certificates of Participation), totaling $9,105,000. The purpose of the Certificates of Participation is to refinance a portion of the unfunded actuarial accrued liability with respect to the obligation of the District to make certain payments to the California Public Employees Retirement System (CalPERS) for both active and retired safety employees and miscellaneous employees of the District, and thereby realize interest savings. 56
75 REQUIRED SUPPLEMENTARY INFORMATION 57
76 Required Supplementary Information For the year ended June 30, DEFINED BENEFIT PENSION PLANS A. Schedule of Changes in Net Pension Liability and Related Ratios During the Measurement Period Miscellaneous Plan Measurement Period (1) TOTAL PENSION LIABILITY Service Cost $ 1,279,630 Interest 2,412,110 Changes of Benefit Terms - Difference Between Expected and Actual Experience - Changes of Assumptions - Benefit Payments, Including Refunds of Employee Contributions (997,382) Net Change in Total Pension Liability 2,694,358 Total Pension Liability - Beginning 32,020,338 Total Pension Liability - Ending (a) $ 34,714,696 PLAN FIDUCIARY NET POSITION Contributions - Employer $ 971,677 Contributions - Employee 569,537 Net Investment Income (2) 4,023,996 Benefit Payments, Including Refunds of Employee Contributions (997,382) Other Changes in Fiduciary Net Position - Net Change in Fiduciary Net Position 4,567,828 Plan Fiduciary Net Position - Beginning 22,897,743 Plan Fiduciary Net Position - Ending (b) $ 27,465,571 Plan Net Position Liability/(Asset) - Ending (a) - (b) $ 7,249,125 Plan Fiduciary Net Position as a Percentage of the Total Pension Liability 79.12% Covered-Employee Payroll $ 7,612,768 Plan Net Pension Liability/(Asset) as a Percentage of Covered-Employee Payroll 95.22% (1) Historical information is required only for measurement periods for which GASB 68 is applicable. (2) Net of administrative expenses. 58
77 Required Supplementary Information For the year ended June 30, DEFINED BENEFIT PENSION PLANS, Continued A. Schedule of Changes in Net Pension Liability and Related Ratios During the Measurement Period, Continued Safety Plan Measurement Period (1) TOTAL PENSION LIABILITY Service Cost $ 4,500,842 Interest 9,733,321 Changes of Benefit Terms - Difference Between Expected and Actual Experience - Changes of Assumptions - Benefit Payments, Including Refunds of Employee Contributions (3,791,597) Net Change in Total Pension Liability 10,442,566 Total Pension Liability - Beginning 129,422,997 Total Pension Liability - Ending (a) $ 139,865,563 PLAN FIDUCIARY NET POSITION Contributions - Employer $ 4,035,130 Contributions - Employee 2,137,329 Net Investment Income (2) 14,457,536 Benefit Payments, Including Refunds of Employee Contributions (3,791,597) Other Changes in Fiduciary Net Position - Net Change in Fiduciary Net Position 16,838,398 Plan Fiduciary Net Position - Beginning 81,114,820 Plan Fiduciary Net Position - Ending (b) $ 97,953,218 Plan Net Position Liability/(Asset) - Ending (a) - (b) $ 41,912,345 Plan Fiduciary Net Position as a Percentage of the Total Pension Liability 70.03% Covered-Employee Payroll $ 18,120,791 Plan Net Pension Liability/(Asset) as a Percentage of Covered-Employee Payroll % (1) Historical information is required only for measurement periods for which GASB 68 is applicable. (2) Net of administrative expenses. Notes to Schedules Benefit Changes: The figures above do not include any liability impact that may have resulted from plan changes which occurred after June 30, This applies for voluntary benefit changes as well as any offers of Two Years Additional Service Credit (a.k.a Golden Handshakes). Changes of Assumptions: There were no changes in assumptions. 59
78 Required Supplementary Information For the year ended June 30, DEFINED BENEFIT PENSION PLANS, Continued B. Schedule of Plan Contributions Miscellaneous Plan Fiscal Year (1) Actuarially determined contribution $ 1,073,403 Contribution in relation to the actuarially determined contributions (1,073,403) Contribution deficiency (excess) $ - Covered-employee payroll $ 8,591,081 Contributions as a percentage of covered-employee payroll 12.49% (1) - Historical information is required only for measurement periods for which GASB 68 is applicable Safety Plan Fiscal Year (1) Actuarially determined contribution $ 3,987,258 Contribution in relation to the actuarially determined contributions (3,987,258) Contribtion deficiency (excess) $ - Covered-employee payroll $ 17,949,636 Contributions as a percentage of covered-employee payroll 22.21% (1) - Historical information is required only for measurement periods for which GASB 68 is applicable 60
79 Required Supplementary Information For the year ended June 30, DEFINED BENEFIT PENSION PLANS, Continued B. Schedule of Plan Contributions, Continued Notes to Schedules The actuarial methods and assumptions used to set the actuarially determined contributions for Fiscal Year were from the June 30, 2012 public agency valuations. Miscellaneous Plan Safety Plan Actuarial cost method Entry Age Normal Entry Age Normal Amortization method Level percentage of payroll Level percentage of payroll Remaining amortization period 26 Years as of valuation date 28 Years as of valuation date Asset valuation method 15-year smoothed market 15-year smoothed market Inflation 2.75% 2.75% Salary increases Varies by Entry Age and Service Varies by Entry Age and Service Payroll Growth 3.00% 3.00% Investment rate of return 7.50%, net of pension plan investment expense, including inflation Retirement age Mortality The probabilities of Retirement are based on the 2010 CalPERS Experience Study for the period from 1997 to The probabilities of mortality are based on the 2010 CalPERS Experience Study for the period from 1997 to Pre-retirement and Post-retirement mortality rates include 5 years of projected mortality improvement using Scale AA published by the Society of Actuaries. 2. OTHER POST EMPLOYMENT PENSION PLAN SCHEDULE OF FUNDING PROGRESS Unfunded Unfunded (Overfunded) Actuarial Entry Age (Overfunded) Liability as Actuarial Actuarial Actuarial Actuarial Percentage of Valuation Asset Accrued Accrued Funded Covered Covered Date* Value Liability Liability Ratio Payroll Payroll 7/1/ ,505,943 39,505, % 24,272, % 7/1/ ,874,483 54,874, % 22,586, % 7/1/ ,678,128 48,678, % 20,364, % *Latest information available. 61
80 Required Supplementary Information, Continued For the year ended June 30, BUDGETARY BASIS OF ACCOUNTING As required by the laws of the State of California, the District prepares and legally adopts a final operating budget on or before September 1 of each fiscal year. Until the adoption of this final budget, operations are governed by the adopted preliminary budget approved by the Board. Annual budgets are adopted for the General Fund and Landscape and Lighting Special Revenue Fund. A formal budget is not developed for the Foundation Special Revenue Fund. Accordingly, comparison of actual results of operations to budgetary data for this fund is not presented. Operating budgets are prepared on the modified accrual basis of accounting. Budgetary control and the legal level of control are at the object level. In addition, legal level of budgetary control for the Landscape and Lighting Special Revenue Fund is at the benefit zone level, which is presented in the Supplementary Information section of this report. Significant amendments, appropriation transfers between objects and transfers from contingencies must be approved by the District s Board of Directors. Supplemental appropriations financed by unanticipated revenues also must be approved by the Board. No significant supplemental appropriations were required during the year ended June 30, The District prepares its annual budget on a basis (budgetary basis) which differs from generally accepted accounting principles (GAAP basis). The budget and all transactions are presented in accordance with the District's method (Non-GAAP budgetary basis) in the Statements of Revenues, Expenditures and Changes in Fund Balances - Budget and Actual - Non-GAAP Budgetary Basis for the Landscape and Lighting Special Revenue Fund to provide a meaningful comparison of actual results with the budget. The main difference between budgetary and GAAP basis is that park land improvements that have been contributed in lieu of developer fees in the Landscape and Lighting Special Revenue Fund are recorded as revenue and capital outlay expenditures on the GAAP basis, but these items are not reflected in the budget. No land improvements were contributed to the District during the year ended June 30, 2015, resulting in there being no difference between the GAAP basis and Non-GAAP Budgetary Basis for the year ended June 30,
81 Schedule of Revenues, Expenditures and Changes in Fund Balances - Budget and Actual General Fund For the year ended June 30, 2015 REVENUES: Variance with Final Budget Budgeted Amounts Positive Original Final Actual (Negative) Taxes $ 34,343,612 $ 36,024,612 $ 36,173,988 $ 149,376 Charges for current services 12,017,258 12,443,438 14,811,737 2,368,299 Developer fees and contributions - - 1,500,655 1,500,655 Intergovernmental 618,862 1,318,862 2,149, ,625 Donations and contributions 90,500 90, ,700 13,200 Use of money and property 1,044,453 1,082,363 1,190, ,160 Miscellaneous 437, , ,797 (109,993) Total revenues 48,552,475 51,397,565 56,257,887 4,860,322 EXPENDITURES: Current: Public protection 33,723,851 36,379,611 36,077, ,314 Recreation and culture 9,858,039 9,858,039 9,815,700 42,339 General government 3,759,723 4,394,403 4,207, ,625 Capital outlay 6,040,247 8,007,947 4,305,760 3,702,187 Debt service: Principal 1,707,207 1,865,207 1,841,596 23,611 Interest 714, , ,609 6,269 Contingencies Total expenditures 55,803,945 61,251,085 56,987,740 4,263,345 REVENUES OVER (UNDER) EXPENDITURES (7,251,470) (9,853,520) (729,853) 9,123,667 OTHER FINANCING SOURCES (USES): Proceeds from sale of capital assets 12,000 12, , ,650 Issuance of long-term liabilities 456,000 1,306,640 1,269,719 (36,921) Insurance recovery - 756,000 7,226,815 6,470,815 Transfers in 2,801,586 3,910,510 2,841,040 (1,069,470) Transfers out (862,373) (1,530,373) (1,526,824) 3,549 Total other financing sources (uses) 2,407,213 4,454,777 9,942,400 5,487,623 Net change in fund balances (4,844,257) (5,398,743) 9,212,547 14,611,290 FUND BALANCES: Beginning of year 33,351,099 33,351,099 33,351,099 - End of year $ 28,506,842 $ 27,952,356 $ 42,563,646 $ 14,611,290 63
82 Schedule of Revenues, Expenditures and Changes in Fund Balances - Budget and Actual Non-GAAP Budgetary Basis Landscape and Lighting District For the year ended June 30, 2015 REVENUES: Variance with Final Budget Budgeted Amounts Positive Original Final Actual (Negative) Charges for current services $ 14,636,041 $ 14,687,841 $ 14,708,161 $ 20,320 Use of money and property 324, , ,361 1,408 Miscellaneous ,990 6,490 Total revenues 14,961,494 15,013,294 15,041,512 28,218 EXPENDITURES: Current: Recreation and culture 12,481,355 12,498,402 11,323,523 1,174,879 Capital outlay 35,300 49,500 49, Debt service - Principal 32,923 32,923 25,703 7,220 Interest 2,726 2,726 1,632 1,094 Total expenditures 12,552,304 12,583,551 11,400,260 1,183,291 REVENUES OVER (UNDER) EXPENDITURES 2,409,190 2,429,743 3,641,252 1,211,509 OTHER FINANCING SOURCES (USES): Proceeds from sale of capital assets - - 1,497 1,497 Issuance of long-term liabilities - 2,350 7,250 4,900 Insurance recovery ,996 14,996 Transfers in 2,926,061 2,924,761 2,642,949 (281,812) Transfers out (3,904,998) (5,141,103) (4,183,813) 957,290 Total other financing sources (uses) (978,937) (2,213,992) (1,517,121) 696,871 Net change in fund balances 1,430, ,751 2,124,131 1,908,380 FUND BALANCES: Beginning of year 25,774,685 25,774,685 25,774,685 - End of year $ 27,204,938 $ 25,990,436 $ 27,898,816 $ 1,908,380 64
83 SUPPLEMENTARY INFORMATION 65
84 This page intentionally left blank. 66
85 NON-MAJOR GOVERNMENTAL FUNDS 67
86 Combining Balance Sheet Non-Major Governmental Funds June 30, 2015 Foundation Total Debt Special Capital Nonmajor Service Revenue Projects Governmental Fund Fund Fund Funds ASSETS Cash and investments $ - $ 228,589 $ - $ 228,589 Restricted cash and investments ,972 69,972 Due from other Funds , ,454 Total assets $ - $ 228,589 $ 261,426 $ 490,015 LIABILITIES, DEFERRED INFLOWS OF RESOURCES, AND FUND BALANCES Liabilities: Accounts payable $ - $ 40 $ - $ 40 Due to other funds ,274 45,274 Advances from other Funds - 25,008 25,008 Total Liabilities $ - $ 25,048 $ 45,274 $ 70,322 Fund Balances: Restricted for: Capital projects , ,152 Foundation activities of the fund - 203, ,541 Total fund balances - 203, , ,693 Total liabilities, deferred inflows of resources, and fund balances $ - $ 228,589 $ 261,426 $ 490,015 68
87 Combining Statement of Revenues, Expenditures and Changes in Fund Balances Non-Major Governmental Funds For the year ended June 30, 2015 Foundation Total Debt Special Capital Nonmajor Service Revenue Projects Governmental Fund Fund Fund Funds REVENUES Donations and contributions $ - $ 9,966 $ - $ 9,966 Use of money and property Total revenues - 9, ,984 EXPENDITURES General government ,099 1,349 Capital outlay Services and supplies: Advertising Membership Office Supplies Food Supplies Professional Services - 5,988-5,988 Recreation Supplies Total Services and supplies - 8,961 1,099 10,060 Debt service: Principal 193, ,247 Interest 35, ,687 Total debt service 228, ,934 Total expenditures 228,934 8,961 1, ,994 REVENUES OVER (UNDER) EXPENDITURES (228,934) 1,005 (1,081) (229,010) OTHER FINANCING SOURCES (USES) Transfers in 228,934 7, ,130 Transfers out - (9,482) - (9,482) Total other financing sources (uses) 228,934 (2,286) - 226,648 Net change in fund balances - (1,281) (1,081) (2,362) FUND BALANCES: Beginning of year - 204, , ,055 End of year $ - $ 203,541 $ 216,152 $ 419,693 69
88 This page intentionally left blank. 70
89 GENERAL FUND To account for resources associated with the general governmental operations which are not required to be accounted for in another fund. 71
90 Schedule of Revenues General Fund June 30, 2015 General Operations Taxes: Current secured $ 34,184,015 Current unsecured 1,402,974 Supplemental property taxes 558,128 Prior unsecured 28,871 Total taxes 36,173,988 Charges for current services: Recreation services charges 5,691,553 Ambulance service fees 8,152,295 Service fees/charges - other 967,889 Total charges for current services 14,811,737 Developer fees and contributions 1,500,655 Total developer fees and contributions 1,500,655 Intergovernmental: Homeowner's property tax relief 446,601 State aid - other miscellaneous programs 1,211,347 Federal aid - public safety 59,512 Aud from other local governments 183,907 RDA passthrough 248,120 Total intergovernmental 2,149,487 Donations and contributions 103,700 Total donations and contributions 103,700 Use of money and property: Interest income 105,384 Building rental/lease 1,085,139 Total use of money and property 1,190,523 Miscellaneous: Other revenue 327,797 Total other revenue 327,797 Total revenues $ 56,257,887 72
91 Schedule of Expenditures General Fund June 30, 2015 Departments Park Administration Public (Recreation (General Protection and Culture) Government) Total Current expenditures: Salaries and employee benefits: Salaries and wages $ 20,998,929 $ 4,658,043 $ 1,871,567 $ 27,528,539 Retirement - employer costs 4,197, , ,207 4,927,403 Group insurance - employer costs 5,663,267 1,092, ,746 7,291,827 Workers' compensation insurance 1,248,244 88,834 43,377 1,380,455 Other 454, ,387 34, ,059 Total salaries and employee benefits 32,561,618 6,475,151 2,714,514 41,751,283 Services and supplies: Automobile services and supplies 172,100 9,198 7, ,678 Books 4,048 1, ,648 Buildings and grounds maintenance 182, ,981 16, ,944 Business conferences 11,798 6,091 2,876 20,765 Chemical supplies - 96,254-96,254 Clothing/personal supplies 159,561 26,607 2, ,442 Communication system service 697, ,856 Education and training 58,784 35,932 8, ,086 Employee transportation 5, ,431 Fire equipment and maintenance 172,048 1, ,082 Equipment rents and leases 35, ,430 66, ,069 Food supplies 12, ,579 1, ,677 Fuel and lubricants 257,693 19,061 19, ,100 Insurance - liability 163,580 66,764 21, ,123 Medical services and supplies 267,054 10, ,656 Memberships 3,307 13,884 8,138 25,329 Miscellaneous 176,444 1,440, ,078 2,352,609 Office supplies 12,791 18,848 27,885 59,524 Professional services 739,772 54, ,644 1,312,894 Radio/electric service and supply 19, ,583 Recreational supplies - 390,737 12, ,990 Taxes and assessments 68-13,437 13,505 Telephone 174,958 85,478 14, ,008 Utilities 187, ,796 14, ,239 Total services and supplies 3,515,679 3,340,549 1,493,264 8,349,492 Total current expenditures 36,077,297 9,815,700 4,207,778 50,100,775 Capital outlay: Land - 1,670,635-1,670,635 Structures and improvements 367, ,448 4,071 1,063,957 Equipment 1,322, ,492 91,113 1,571,168 Total capital outlay 1,690,001 2,520,575 95,184 4,305,760 Debt service: Principal 1,275,781 15, ,875 1,841,596 Interest 580,498 6, , ,609 Total debt service 1,856,279 22, ,445 2,581,205 Total expenditures $ 39,623,577 $ 12,358,756 $ 5,005,407 $ 56,987,740 73
92 Schedule of Expenditures and Other Financing Sources and Uses Compared to Budget - General Fund June 30, 2015 PUBLIC PROTECTION: Public Protection Park Department Variance Variance Final Positive Final Positive Budget Actual (Negative) Budget Actual (Negative) Salaries and benefits $ 32,562,240 $ 32,561,618 $ 622 $ - $ - $ - Service and supplies 3,817,371 3,515, , Total public protection 36,379,611 36,077, , RECREATION AND CULTURE: Salaries and benefits ,514,581 6,475,151 39,430 Costs of sales and services ,343,458 3,340,549 2,909 Total recreation and culture ,858,039 9,815,700 42,339 GENERAL GOVERNMENT: Salaries and benefits Services and supplies Total general government CAPITAL OUTLAY: Land 250, ,000 1,670,650 1,670, Equipment 1,350,237 1,322,563 27, , ,492 (522) Structures and improvements 411, ,438 43,891 4,070, ,448 3,378,393 Total capital outlay 2,011,566 1,690, ,565 5,898,461 2,520,575 3,377,886 LEASES/DEBT PAYMENTS: Debt service 1,857,314 1,856,279 1,035 44,128 22,481 21,647 OTHER FINANCING (SOURCES) AND USES: Proceeds from sale of capital assets (12,000) (131,650) 119, Issuance of long-term liabilities (1,206,000) (1,168,430) (37,570) (70,540) (70,539) (1) Insurance Proceeds - (21,039) 21,039 - (25,000) 25,000 Transfers in (47,317) (60,090) 12,773 (3,608,814) (2,526,571) (1,082,243) Transfers out 213, ,704-1,301,767 1,298,218 3,549 Total other Financing uses (1,051,613) (1,167,505) 115,892 (2,377,587) (1,323,892) (1,053,695) CONTINGENCIES Total general fund 39,196,878 38,456, ,806 13,423,041 11,034,864 2,388,177 $ 5,005,407 $ 56,987,740 $ - $ - $ - 74
93 Administrative Services Total Variance Variance Final Positive Final Positive Budget Actual (Negative) Budget Actual (Negative) $ - $ - $ - $ 32,562,240 $ 32,561,618 $ ,817,371 3,515, , ,379,611 36,077, , ,514,581 6,475,151 39, ,343,458 3,340,549 2, ,858,039 9,815,700 42,339 2,817,481 2,714, ,967 2,817,481 2,714, ,967 1,576,922 1,493,264 83,658 1,576,922 1,493,264 83,658 4,394,403 4,207, ,625 4,394,403 4,207, , ,920,650 1,670, ,015 92,920 91,113 1,807 1,600,127 1,571,168 28,959 5,000 4, ,487,170 1,063,957 3,423,213 97,920 95,184 2,736 8,007,947 4,305,760 3,702, , ,445 7,198 2,611,085 2,581,205 29, (12,000) (131,650) 119,650 (30,100) (30,750) 650 (1,306,640) (1,269,719) (36,921) (756,000) (7,180,776) 6,424,776 (756,000) (7,226,815) 6,470,815 (254,379) (254,379) - (3,910,510) (2,841,040) (1,069,470) 14,902 14,902-1,530,373 1,526,824 3,549 (1,025,577) (7,451,003) 6,425,426 (4,454,777) (9,942,400) 5,487, ,176,389 (2,445,596) 6,621,985 56,796,308 47,045,340 9,750,968 $ - $ - $ - $ - $ - 75
94 This page intentionally left blank. 76
95 LANDSCAPE AND LIGHTING SPECIAL REVENUE FUND To account for specific revenue sources related to the District Wide Landscape and Lighting Assessment District pursuant to the Landscape and Lighting Act of The activities of the Assessment Districts are accounted for under the following zones of benefit, which do not represent separate special revenue funds: Zone 1 - Laguna Zone 2 - Camden Zone 3 - Elk Grove/West Vineyard Zone 4 - West Laguna Zone 5 - Lakeside Zone 6 - Central Elk Grove Zone 8 - Other Rural Areas Zone 9 - Waterman/Park Village Zone 10 - Auto Mall Zone 11 - East Elk Grove Zone 12 - Laguna Stonelake Zone 13 - East Franklin Zone 14 - Camden Park Zone 15 - Vista Creek Zone 16 - Fallbrook Park Lane Zone 17 - City Landscape District Wide 77
96 Balance Sheet Schedules by Benefit Zone Landscaping and Lighting Special Revenue Fund June 30, 2015 Landscape and Lighting Assessment District - Zones of Benefit Zone 3 Elk Grove/ Zone 4 Zone 6 Zone 1 Zone 2 West West Zone 5 Central Laguna Camden Vineyard Laguna Lakeside Elk Grove ASSETS Cash and investments $ 4,601,884 $ 187,447 $ 661,819 $ 1,126,418 $ 1,083,427 $ 233,560 Receivables: Interest 3, Intergovernmental 31,529 1,347 7,121 7,031 5,160 5,015 Total assets $ 4,637,241 $ 188,938 $ 669,592 $ 1,134,344 $ 1,089,477 $ 238,977 LIABILITIES, DEFERRED INFLOWS OF RESOURCES, AND FUND BALANCES Liabilities: Accounts payable and accrued expenditures $ 205,519 $ 2,909 $ 10,674 $ 52,383 $ 8,699 $ 1,799 Total liabilities 205,519 2,909 10,674 52,383 8,699 1,799 Fund Balances: Restricted for: Specific purpose of the fund 4,431, , ,918 1,081,961 1,080, ,178 Total fund balances 4,431, , ,918 1,081,961 1,080, ,178 Total liabilities, deferred inflows of resources, and fund balances $ 4,637,241 $ 188,938 $ 669,592 $ 1,134,344 $ 1,089,477 $ 238,977 78
97 Landscape and Lighting Assessment District - Zones of Benefit Zone 8 Zone 9 Zone 11 Zone 12 Zone 13 Zone 14 Zone 15 Other Rural Waterman/ Zone 10 East Laguna East Camden Vista Areas Park Village Auto Mall Elk Grove Stonelake Franklin Park Creek $ 1,145,070 $ 194,265 $ 150,993 $ 4,004,633 $ 893,277 $ 12,406,442 $ 352,280 $ 68,957 1, , , ,677 2, ,183 4,040 27, $ 1,151,845 $ 196,946 $ 151,461 $ 4,023,905 $ 898,142 $ 12,444,291 $ 353,289 $ 69,181 $ 349 $ 3,691 $ 41 $ 7,340 $ 3,738 $ 22,276 $ - $ , ,340 3,738 22, ,151, , ,420 4,016, ,404 12,422, ,289 69,181 1,151, , ,420 4,016, ,404 12,422, ,289 69,181 $ 1,151,845 $ 196,946 $ 151,461 $ 4,023,905 $ 898,142 $ 12,444,291 $ 353,289 $ 69,181 (Continued) 79
98 Balance Sheet Schedules by Benefit Zone Landscaping and Lighting Special Revenue Fund June 30, 2015 Landscape and Lighting Assessment District - Zones of Benefit Zone 16 Zone 17 Fallbrook City District Park Lane Landscape Wide Total ASSETS Cash and investments $ 355,021 $ 210,729 $ 395,407 $ 28,071,629 Receivables: Interest (1,315) 22,776 Intergovernmental 1, , ,113 Total assets $ 356,336 $ 351,461 $ 394,092 $ 28,349,518 LIABILITIES, DEFERRED INFLOWS OF RESOURCES, AND FUND BALANCES Liabilities: Accounts payable and accrued expenditures $ (80) $ 56,234 $ 75,130 $ 450,702 Total liabilities (80) 56,234 75, ,702 Fund Balances: Restricted for: Specific purpose of the fund 356, , ,962 27,898,816 Total fund balances 356, , ,962 27,898,816 Total liabilities, deferred inflows of resources, and fund balances $ 356,336 $ 351,461 $ 394,092 $ 28,349,518 80
99 This page intentionally left blank. 81
100 Schedule of Revenues, Expenditures and Changes in Fund Balances Landscaping and Lighting Special Revenue Fund June 30, 2015 Landscape and Lighting Assessment District - Zones of Benefit Zone 3 Elk Grove/ Zone 4 Zone 6 Zone 1 Zone 2 West West Zone 5 Central Laguna Camden Vineyard Laguna Lakeside Elk Grove REVENUES: Charges for current services $ 3,757,497 $ 160,540 $ 855,085 $ 838,006 $ 615,023 $ 597,681 Use of money and property 114, ,459 1,832 2, Miscellaneous Total revenues 3,872, , , , , ,773 EXPENDITURES: Current: Recreation and culture 2,427, , , , , ,840 Capital outlay 8, Debt service: Principal Interest Total expenditures 2,435, , , , , ,840 REVENUES OVER (UNDER) EXPENDITURES 1,436,716 10, , , , ,933 OTHER FINANCING SOURCES (USES): Proceeds from sale of capital assets Issuance of long-term liabilities Insurance recovery 14, Transfers in - 32,000 6,042 25,000-1,300 Transfers out (652,481) (42,034) (259,512) (140,194) (105,796) (364,490) Total other financing sources (uses) (638,449) (10,034) (253,470) (114,230) (105,796) (363,190) Net change in fund balances 798, , ,621 88,447 69,743 FUND BALANCES: Beginning of year 3,633, , , , , ,435 End of year $ 4,431,722 $ 186,029 $ 658,918 $ 1,081,961 $ 1,080,778 $ 237,178 $ - $ - $ - $ - 82
101 Landscape and Lighting Assessment District - Zones of Benefit Zone 8 Zone 9 Zone 11 Zone 12 Zone 13 Zone 14 Zone 15 Other Rural Waterman/ Zone 10 East Laguna East Camden Vista Areas Park Village Auto Mall Elk Grove Stonelake Franklin Park Creek $ 676,341 $ 301,395 $ 40,678 $ 1,808,784 $ 481,461 $ 3,306,745 $ 136,127 $ 20,514 1,826 23, ,579 39,771 53, , ,148 40,978 1,818, ,232 3,359, ,708 20,640 22, ,487 2, , ,730 2,137,435 1, , ,487 2, , ,730 2,137,435 1, ,810 67,661 38,710 1,006, ,502 1,222, ,508 20, , , (365,027) (113,527) (14,690) (1,321,902) (152,193) (403,229) (64,350) (6,042) (365,027) (38,177) (14,690) (1,321,902) (152,193) (401,929) (64,350) (6,042) 290,783 29,484 24,020 (315,145) 12, ,478 71,158 14, , , ,400 4,331, ,095 11,601, ,131 55,133 $ 1,151,496 $ 193,255 $ 151,420 $ 4,016,565 $ 894,404 $ 12,422,015 $ 353,289 $ 69,181 $ - $ - $ - $ - $ - $ - (Continued) 83
102 Schedule of Revenues, Expenditures and Changes in Fund Balances Landscaping and Lighting Special Revenue Fund June 30, 2015 Landscape and Lighting Assessment District - Zones of Benefit Zone 16 Zone 17 Fallbrook City District Park Lane Landscape Wide Total REVENUES: Charges for current services $ 124,753 $ 983,264 $ 4,267 $ 14,708,161 Use of money and property , ,361 Miscellaneous - - 6,990 6,990 Total revenues 125, ,968 59,968 15,041,512 EXPENDITURES: Current: Recreation and culture 1, ,760 2,456,121 11,323,523 Capital outlay ,254 49,402 Debt service: Principal ,703 25,703 Interest - - 1,632 1,632 Total expenditures 1, ,760 2,524,710 11,400,260 REVENUES OVER (UNDER) EXPENDITURES 123,840 20,208 (2,464,742) 3,641,252 OTHER FINANCING SOURCES (USES): Proceeds from sale of capital assets - - 1,497 1,497 Issuance of long-term liabilities - - 7,250 7,250 Insurance recovery ,996 Transfers in - - 2,501,957 2,642,949 Transfers out (43,000) (21,768) (113,578) (4,183,813) Total other financing sources (uses) (43,000) (21,768) 2,397,126 (1,517,121) Net change in fund balances 80,840 (1,560) (67,616) 2,124,131 FUND BALANCES: End of year 275, , ,578 25,774,685 End of year $ 356,416 $ 295,227 $ 318,962 $ 27,898,816 $ - $ - $ - (Concluded) 84
103 This page intentionally left blank. 85
104 Schedule of Revenues, Expenditures and Changes in Fund Balances by Benefit Zone - Budget and Actual For the year ended June 30, 2015 Landscape and Lighting Assessment District - Zones of Benefit REVENUES: Zone 1 - Laguna Variance Positive Original Final Budget Actual (Negative) Charges for current services $ 3,752,171 $ 3,752,171 $ 3,757,497 $ 5,326 Donations and contributions Use of money and property 113, , ,642 1,642 Miscellaneous Total revenues $ 3,865,171 $ 3,865,171 3,872,139 $ 6,968 EXPENDITURES: Current: Recreation and culture Salaries and benefits $ 400,199 $ 400,199 $ 366,314 $ 33,885 Services and supplies 2,350,670 2,348,520 2,060, ,559 Capital outlay Equipment 6,000 8,150 8,148 2 Debt service: Principal Interest Total expenditures 2,756,869 2,756,869 2,435, ,446 REVENUES OVER (UNDER) EXPENDITURES 1,108,302 1,108,302 1,436, ,414 OTHER FINANCING SOURCES (USES): Proceeds from sale of capital assets Issuance of long-term liabilities Insurance recovery ,032 14,032 Transfers in Transfers out (956,773) (956,773) (652,481) 304,292 Total other financing sources (uses) (956,773) (956,773) (638,449) 318,324 Net change in fund balances 151, , , ,738 FUND BALANCES: Beginning of year 3,633,455 3,633,455 3,633,455 - End of year $ 3,784,984 $ 3,784,984 $ 4,431,722 $ 646,738 86
105 Landscape and Lighting Assessment District - Zones of Benefit Zone 2 - Camden Zone 3 - Elk Grove/West Vineyard Variance Variance Positive Positive Original Final Budget Actual (Negative) Original Final Budget Actual (Negative) $ 160,308 $ 160,308 $ 160,540 $ 232 $ 847,394 $ 847,394 $ 855,085 $ 7, (2) 29,400 29,400 28,459 (941) $ 160,608 $ 160, ,838 $ 230 $ 876,794 $ 876, ,544 $ 6,750 $ 34,370 $ 34,370 $ 33,551 $ 819 $ 78,100 $ 78,100 $ 76,863 $ 1, , , ,206 17, , , ,004 40, , , ,757 18, , , ,867 41,554 (8,609) (8,309) 10,081 18, , , ,677 48, ,490 70,490 32,000 (38,490) 6,042 6,042 6,042 - (41,824) (42,124) (42,034) 90 (256,296) (259,796) (259,512) ,666 28,366 (10,034) (38,400) (250,254) (253,754) (253,470) ,057 20, (20,010) 9,619 9,619 58,207 48, , , , , , ,711 - $ 206,039 $ 206,039 $ 186,029 $ (20,010) $ 610,330 $ 610,330 $ 658,918 $ 48,588 (Continued) 87
106 Schedule of Revenues, Expenditures and Changes in Fund Balances by Benefit Zone - Budget and Actual, Continued For the year ended June 30, 2015 Landscape and Lighting Assessment District - Zones of Benefit REVENUES: Zone 4 - West Laguna Variance Positive Original Final Budget Actual (Negative) Charges for current services $ 836,767 $ 836,767 $ 838,006 $ 1,239 Donations and contributions Use of money and property 2,500 2,500 1,832 (668) Miscellaneous Total revenues $ 839,267 $ 839, ,838 $ 571 EXPENDITURES: Current: Recreation and culture Salaries and benefits $ 53,007 $ 53,007 $ 51,558 $ 1,449 Services and supplies 567, , ,429 43,756 Capital outlay Equipment Debt service: Principal Interest Total expenditures 620, , ,987 45,205 REVENUES OVER (UNDER) EXPENDITURES 219, , ,851 45,776 OTHER FINANCING SOURCES (USES): Proceeds from sale of capital assets Issuance of long-term liabilities Insurance recovery Transfers in ,000 25,000 Transfers out (176,605) (176,605) (140,194) 36,411 Total other financing sources (uses) (176,605) (176,605) (114,230) 62,375 Net change in fund balances 42,470 42, , ,151 FUND BALANCES: Beginning of year 931, , ,340 - End of year $ 973,810 $ 973,810 $ 1,081,961 $ 108,151 88
107 Landscape and Lighting Assessment District - Zones of Benefit Zone 5 - Lakeside Zone 6 - Central Elk Grove Variance Variance Positive Positive Original Final Budget Actual (Negative) Original Final Budget Actual (Negative) $ 614,125 $ 614,125 $ 615,023 $ 898 $ 596,761 $ 596,761 $ 597,681 $ ,500 2,500 2,003 (497) 1,400 1, (1,308) $ 616,625 $ 616, ,026 $ 401 $ 598,161 $ 598, ,773 $ (388) $ 52,254 $ 56,001 $ 50,884 $ 5,117 $ 26,761 $ 26,761 $ 25,953 $ , , ,899 54, , , ,887 10, , , ,783 59, , , ,840 11, , , ,243 59, , , ,933 11, ,300-1,300 1,300 (103,525) (106,025) (105,796) 229 (361,138) (365,138) (364,490) 648 (103,525) (106,025) (105,796) 229 (359,838) (365,138) (363,190) 1,948 32,170 28,423 88,447 60,024 58,053 56,753 69,743 12, , , , , , ,435 - $ 1,024,501 $ 1,020,754 $ 1,080,778 $ 60,024 $ 225,488 $ 224,188 $ 237,178 $ 12,990 (Continued) 89
108 Schedule of Revenues, Expenditures and Changes in Fund Balances by Benefit Zone - Budget and Actual, Continued For the year ended June 30, 2015 Landscape and Lighting Assessment District - Zones of Benefit REVENUES: Zone 8 - Other Rural Areas Variance Positive Original Final Budget Actual (Negative) Charges for current services $ 675,535 $ 675,535 $ 676,341 $ 806 Donations and contributions Use of money and property 4,375 4,375 1,826 (2,549) Miscellaneous Total revenues $ 679,910 $ 679, ,167 $ (1,743) EXPENDITURES: Current: Recreation and culture Salaries and benefits $ 14,862 $ 14,862 $ 14,822 $ 40 Services and supplies 18,095 14,095 7,535 6,560 Capital outlay Equipment Debt service: Principal Interest Total expenditures 32,957 28,957 22,357 6,600 REVENUES OVER (UNDER) EXPENDITURES 646, , ,810 4,857 OTHER FINANCING SOURCES (USES): Proceeds from sale of capital assets Issuance of long-term liabilities Insurance recovery Transfers in Transfers out (361,214) (365,214) (365,027) 187 Total other financing sources (uses) (361,214) (365,214) (365,027) 187 Net change in fund balances 285, , ,783 5,044 FUND BALANCES: Beginning of year 860, , ,713 - End of year $ 1,146,452 $ 1,146,452 $ 1,151,496 $ 5,044 90
109 Landscape and Lighting Assessment District - Zones of Benefit Zone 9 - Waterman/Park Village Zone 10 - Auto Mall Variance Variance Positive Positive Original Final Budget Actual (Negative) Original Final Budget Actual (Negative) $ 300,952 $ 300,952 $ 301,395 $ 443 $ 40,659 $ 40,659 $ 40,678 $ ,618 23,618 23, $ 324,570 $ 324, ,148 $ 578 $ 40,709 $ 40,709 40,978 $ 269 $ 47,103 $ 47,103 $ 45,745 $ 1,358 $ - $ - $ - $ - 271, , ,742 60,224 4,954 4,754 2,268 2, , , ,487 61,582 4,954 4,754 2,268 2,486 5,501 5,501 67,661 62,160 35,755 35,955 38,710 2, , ,231 75,350 (300,881) (379,714) (379,714) (113,527) 266,187 (14,493) (14,693) (14,690) 3 (3,483) (3,483) (38,177) (34,694) (14,493) (14,693) (14,690) 3 2,018 2,018 29,484 27,466 21,262 21,262 24,020 2, , , , , , ,400 - $ 165,789 $ 165,789 $ 193,255 $ 27,466 $ 148,662 $ 148,662 $ 151,420 $ 2,758 (Continued) 91
110 Schedule of Revenues, Expenditures and Changes in Fund Balances by Benefit Zone - Budget and Actual, Continued For the year ended June 30, 2015 Landscape and Lighting Assessment District - Zones of Benefit REVENUES: Zone 11 - East Elk Grove Variance Positive Original Final Budget Actual (Negative) Charges for current services $ 1,806,883 $ 1,806,883 $ 1,808,784 $ 1,901 Donations and contributions Use of money and property 10,000 10,000 9,579 (421) Miscellaneous Total revenues $ 1,816,883 $ 1,816,883 1,818,363 $ 1,480 EXPENDITURES: Current: Recreation and culture Salaries and benefits $ 161,956 $ 161,956 $ 152,298 $ 9,658 Services and supplies 865, , , ,941 Capital outlay Equipment Debt service: Principal Interest Total expenditures 1,027,705 1,025, , ,599 REVENUES OVER (UNDER) EXPENDITURES 789, ,678 1,006, ,079 OTHER FINANCING SOURCES (USES): Proceeds from sale of capital assets Issuance of long-term liabilities Insurance recovery Transfers in Transfers out (179,069) (1,322,369) (1,321,902) 467 Total other financing sources (uses) (179,069) (1,322,369) (1,321,902) 467 Net change in fund balances 610,109 (530,691) (315,145) 215,546 FUND BALANCES: Beginning of year 4,331,710 4,331,710 4,331,710 - End of year $ 4,941,819 $ 3,801,019 $ 4,016,565 $ 215,546 92
111 Landscape and Lighting Assessment District - Zones of Benefit Zone 12 - Laguna Stonelake Zone 13 - East Franklin Variance Variance Positive Positive Original Final Budget Actual (Negative) Original Final Budget Actual (Negative) $ 480,757 $ 480,757 $ 481,461 $ 704 $ 3,299,934 $ 3,299,934 $ 3,306,745 $ 6, ,860 39,860 39,771 (89) 36,500 36,500 53,097 16, $ 520,617 $ 520, ,232 $ 615 $ 3,336,434 $ 3,336,434 3,359,842 $ 23,408 $ 53,407 $ 53,407 $ 52,933 $ 474 $ 466,750 $ 466,750 $ 428,272 $ 38, , , ,797 37,482 1,939,295 1,930,645 1,709, , , , ,730 37,956 2,406,045 2,397,395 2,137, , , , ,502 38, , ,039 1,222, , ,300 1,300 (80,113) (152,268) (152,193) 75 (397,495) (403,645) (403,229) 416 (80,113) (152,268) (152,193) 75 (397,495) (403,645) (401,929) 1,716 44,818 (26,337) 12,309 38, , , , , , , ,095-11,601,537 11,601,537 11,601,537 - $ 926,913 $ 855,758 $ 894,404 $ 38,646 $ 12,134,431 $ 12,136,931 $ 12,422,015 $ 285,084 (Continued) 93
112 Schedule of Revenues, Expenditures and Changes in Fund Balances by Benefit Zone - Budget and Actual, Continued For the year ended June 30, 2015 Landscape and Lighting Assessment District - Zones of Benefit REVENUES: Zone 14 - Camden Park Variance Positive Original Final Budget Actual (Negative) Charges for current services $ 137,110 $ 137,110 $ 136,127 $ (983) Donations and contributions Use of money and property Miscellaneous Total revenues $ 137,410 $ 137, ,708 $ (702) EXPENDITURES: Current: Recreation and culture Salaries and benefits $ - $ - $ - $ - Services and supplies 1,200 1,200 1,200 - Capital outlay Equipment Debt service: Principal Interest Total expenditures 1,200 1,200 1,200 - REVENUES OVER (UNDER) EXPENDITURES 136, , ,508 (702) OTHER FINANCING SOURCES (USES): Proceeds from sale of capital assets Issuance of long-term liabilities Insurance recovery Transfers in Transfers out (310,903) (310,903) (64,350) 246,553 Total other financing sources (uses) (310,903) (310,903) (64,350) 246,553 Net change in fund balances (174,693) (174,693) 71, ,851 FUND BALANCES: Beginning of year 282, , ,131 - End of year $ 107,438 $ 107,438 $ 353,289 $ 245,851 94
113 Landscape and Lighting Assessment District - Zones of Benefit Zone 15 - Vista Creek Zone 16 - Fallbrook Park Lane Variance Variance Positive Positive Original Final Budget Actual (Negative) Original Final Budget Actual (Negative) $ 20,629 $ 20,629 $ 20,514 $ (115) $ 125,103 $ 125,103 $ 124,753 $ (350) $ 20,679 $ 20,679 20,640 $ (39) $ 125,303 $ 125, ,340 $ 37 $ - $ - $ - $ - $ - $ - $ - $ ,600 1,600 1, ,600 1,600 1, ,729 19,729 20, , , , (6,042) (6,042) (6,042) - (135,818) (135,818) (43,000) 92,818 (6,042) (6,042) (6,042) - (135,818) (135,818) (43,000) 92,818 13,687 13,687 14, (12,115) (12,115) 80,840 92,955 55,133 55,133 55, , , ,576 - $ 68,820 $ 68,820 $ 69,181 $ 361 $ 263,461 $ 263,461 $ 356,416 $ 92,955 (Continued) 95
114 Schedule of Revenues, Expenditures and Changes in Fund Balances by Benefit Zone - Budget and Actual, Continued For the year ended June 30, 2015 Landscape and Lighting Assessment District - Zones of Benefit REVENUES: Zone 17 - City Landscape Variance Positive Original Final Budget Actual (Negative) Charges for current services $ 940,953 $ 992,753 $ 983,264 $ (9,489) Donations and contributions Use of money and property Miscellaneous Total revenues $ 940,953 $ 992, ,968 $ (8,785) EXPENDITURES: Current: Recreation and culture Salaries and benefits $ 115,622 $ 119,222 $ 119,174 $ 48 Services and supplies 796, , , Capital outlay Equipment Debt service: Principal Interest Total expenditures 912, , , REVENUES OVER (UNDER) EXPENDITURES 28,901 28,901 20,208 (8,693) OTHER FINANCING SOURCES (USES): Proceeds from sale of capital assets Issuance of long-term liabilities Insurance recovery Transfers in Transfers out (21,768) (21,768) (21,768) - Total other financing sources (uses) (21,768) (21,768) (21,768) - Net change in fund balances 7,133 7,133 (1,560) (8,693) FUND BALANCES: Beginning of year 296, , ,787 - End of year $ 303,920 $ 303,920 $ 295,227 $ (8,693) 96
115 Landscape and Lighting Assessment District - Zones of Benefit District Wide Totals Variance Variance Positive Positive Original Final Budget Actual (Negative) Original Final Budget Actual (Negative) $ - $ - $ 4,267 $ 4,267 $ 14,636,041 $ 14,687,841 $ 14,708,161 $ 20, ,900 60,900 48,711 (12,189) 324, , ,361 1, ,990 6, ,990 6,490 $ 61,400 $ 61,400 59,968 $ (1,432) $ 14,961,494 $ 15,013,294 $ 15,041,512 $ 28,218 $ 1,015,523 $ 1,107,323 $ 1,107,292 $ 31 $ 2,519,914 $ 2,619,061 $ 2,525,659 $ 93,402 1,545,215 1,443,715 1,348,829 94,886 9,961,441 9,879,341 8,797,864 1,081,477 29,300 41,350 41, ,300 49,500 49, ,923 32,923 25,703 7,220 32,923 32,923 25,703 7,220 2,726 2,726 1,632 1,094 2,726 2,726 1,632 1,094 2,625,687 2,628,037 2,524, ,327 12,552,304 12,583,551 11,400,260 1,183,291 (2,564,287) (2,566,637) (2,464,742) 101,895 2,409,190 2,429,743 3,641,252 1,211, ,497 1, ,497 1,497-2,350 7,250 4,900-2,350 7,250 4, ,996 14,996 2,471,998 2,471,998 2,501,957 29,959 2,926,061 2,924,761 2,642,949 (281,812) (122,208) (122,208) (113,578) 8,630 (3,904,998) (5,141,103) (4,183,813) 957,290 2,349,790 2,352,140 2,397,126 44,986 (978,937) (2,213,992) (1,517,121) 696,871 (214,497) (214,497) (67,616) 146,881 1,430, ,751 2,124,131 1,908, , , ,578-25,774,685 25,774,685 25,774,685 - $ 172,081 $ 172,081 $ 318,962 $ 146,881 $ 27,204,938 $ 25,990,436 $ 27,898,816 $ 1,908,380 (Concluded) 97
116 This page intentionally left blank. 98
117 CAPITAL ASSETS USED IN THE OPERATION OF GOVERNMENTAL FUNDS The capital asset accounts in the government-wide statement of net assets provide accountability for the District's capital assets. A capital asset is accounted for in this account when it has been purchased using general governmental resources and is used for general governmental purposes. Assets are recorded at historical cost if purchased, or if historical cost is not available, estimated historical cost, or fair market value on the date donated, if donated. Depreciation is recognized on these assets over their estimated useful lives. 99
118 This page intentionally left blank. 100
119 Capital Assets Used in the Operation of Governmental Funds Comparative Schedule of Capital Assets by Source June 30, CAPITAL ASSETS: Land $ 87,113,826 $ 85,443,191 Land improvements 64,509,759 64,201,317 Construction in progress 1,270,681 1,081,776 Structures and improvements 76,466,554 77,035,619 Equipment 24,830,070 25,049,626 Total capital assets $ 254,190,890 $ 252,811,529 INVESTMENT IN CAPITAL ASSETS BY SOURCE: Land, structures and improvements contributed as in-lieu fees $ 72,566,340 $ 72,566,340 Current operations 109,352, ,249,830 Long-term debt proceeds 72,272,328 70,995,359 Investment in capital assets by source $ 254,190,890 $ 252,811,
120 Capital Assets Used in the Operation of Governmental Funds Schedule of Capital Assets by Function and Activity June 30, 2015 Land Construction in Structures and Function and Activity Land Improvement Progress Improvements Equipment Total PUBLIC PROTECTION: Fire 4,520,289 $ - $ 639,135 $ 24,115,421 $ 21,724,288 $ 50,999,133 RECREATION AND CULTURE: Recreation 5,765,990-25,000 3,951,369 1,687,588 11,429,947 Parks 76,485,797 64,509, ,546 48,242, , ,760,247 Total recreation and culture 82,251,787 64,509, ,546 52,193,558 2,603, ,190,194 GENERAL GOVERNMENT: Administration 341, , ,238 1,001,563 Total capital assets $ 87,113,826 $ 64,509,759 $ 1,270,681 $ 76,466,554 $ 24,830,070 $ 254,190,
121 Capital Assets Used in the Operation of Governmental Funds Schedule of Changes in Capital Assets by Function and Activity June 30, 2015 Balance Balance July 1, 2013 Additions Retirements June 30, 2014 PUBLIC PROTECTION: Fire $ 50,474,565 $ 1,688,879 $ (1,164,311) $ 50,999,133 RECREATION AND CULTURE: Recreation 10,942, ,409 (362,412) 11,429,947 Parks 189,165,546 1,720,038 (125,337) 190,760,247 Total recreation and culture 200,108,496 2,569,447 (487,749) 202,190,194 GENERAL GOVERNMENT: Administration 2,228,468 95,184 (1,322,089) 1,001,563 Total capital assets $ 252,811,529 $ 4,353,510 $ (2,974,149) $ 254,190,
122 This page intentionally left blank. 104
123
124
125 STATISTICAL SECTION This part of the s comprehensive annual financial report presents detailed information as a context for understanding what the information in the financial statements, note disclosures, and required supplementary information says about the District s over all financial health. Financial Trends These schedules contain financial trend information for assessing the District s financial performance and well-being over time. 1. Net Position by Component 2. Changes in Net Position 3. Fund Balances of Governmental Funds 4. Changes in Fund Balance of Governmental Funds Revenue Capacity These schedules present revenue capacity information to assess the District s ability to generate revenues. Property taxes, charges for services and developer fees and contributions are the District s most significant revenue sources. 1. Direct and Overlapping Property Tax Rates 2. Principal Property Taxpayers 3. Property Tax Levies and Collections 4. Assessed Value of Taxable Property Debt Capacity These schedules present information to assess the affordability of the District s current levels of outstanding debt and the District s ability to issue additional debt. 1. Ratio of Outstanding Debt by Type 2. Computation of Direct and Overlapping Debt 3. Computation of Legal Debt Margin Information 4. Debt Pledged Revenue Coverage Demographic and Economic Information These schedules provide information on the demographic and economic environment in which the District conducts business. 1. Demographic and Economic Statistics 2. Principal Employers Operating Information These schedules provide information on the District s service infrastructure to assist the reader in understanding how the information in the District s financial report relates to the services the District provides and the activities it performs. 1. Full-Time District Employees by Function 2. Operating Indicators by Function/Program 3. Capital Asset Statistics by Function/Program Sources Unless otherwise noted, the information in these schedules is derived from the comprehensive annual financial reports of the relevant years. 105
126 Net Position by Component (accrual basis of accounting) Fiscal Year (2) 2013 Governmental activities Net investment in capital assets $ 184,981, ,997, ,141,637 Restricted 44,349,631 42,341,817 37,217,297 Unrestricted (54,478,223) (62,177,389) (8,241,726) Total governmental activities net position $ 174,852, ,161, ,117,208 Primary government Net investment in capital assets $ 184,981, ,997, ,141,637 Restricted 44,349,631 42,341,817 37,217,297 Unrestricted (54,478,223) (62,177,389) (8,241,726) Total primary government net position $ 174,852, ,161, ,117,208 Note: The implemented GASB 34 during the year ended June 30, Information prior to the implementation of GASB 34 is not available. Source: Cosumnes CSD Administrative Services Department (1) Information was restated to correct prior year capital assets balances. (2) The District recorded prior period adjustments to record the beginning balance of the net pension liablitliy, and to record employer contributions made for pension in fiscal year 2014 as a deferred outflow of resources. 106
127 Net Position by Component (accrual basis of accounting) Fiscal Year , as restated (1) 2007, as restated (1) 2006, as restated (1) 183,173, ,698, ,181, ,115, ,157, ,925, ,092,494 34,461,962 35,770,912 26,886,848 35,194,322 31,766,453 45,748,555 33,018,911 1,100,458 9,685,628 33,867,845 43,279,283 48,978,356 34,537,638 26,468, ,735, ,155, ,936, ,588, ,902, ,211, ,579, ,173, ,698, ,181, ,115, ,157, ,925, ,092,494 34,461,962 35,770,912 26,886,848 35,194,322 31,766,453 45,748,555 33,018,911 1,100,458 9,685,628 33,867,845 43,279,283 48,978,356 34,537,638 26,486, ,735, ,155, ,936, ,588, ,902, ,211, ,597,
128 Changes in Net Position (accrual basis of accounting) Fiscal Year Expenses Governmental activities: Public protection $ 30,991,966 36,958,524 39,550,114 Recreation and culture 24,421,081 21,697,297 22,221,093 General Government 4,262,813 3,424,446 3,672,163 Interest on long-term debt 773, ,905 1,151,692 Total governmental activities expenses 60,449,089 62,901,172 66,595,062 Total primary government expenses 60,449,089 62,901,172 66,595,062 Program Revenues Governmental activities: Charges for services: Public protection 8,152,295 7,181,029 5,428,004 Recreation and culture 20,399,714 19,711,526 19,673,718 General Government 1,883,787 1,677,351 1,974,385 Operating grants and contributions 113, , ,774 Capital grants and contributions 3,650,142 4,239,631 3,673,497 Total governmental activities program revenues 34,199,604 32,931,183 30,859,378 Total primary government program revenues 34,199,604 32,931,183 30,859,378 Net revenues (expenses): Governmental activities (26,249,485) (29,969,989) (35,735,684) Total net revenues (expenses) (26,249,485) (29,969,989) (35,735,684) General revenues and other changes in net position Governmental activities: Taxes Property Taxes 36,173,988 32,626,823 29,456,296 Other taxes Investment earnings 431, , ,940 Miscellaneous 334, , ,725 Total governmental activities 36,940,538 33,438,671 30,116,961 Total primary government 36,940,538 33,438,671 30,116,961 Changes in net position Governmental activities 10,691,053 3,468,682 (5,618,723) Total primary government $ 10,691,053 3,468,682 (5,618,723) Source: Cosumnes CSD Administrative Services Department 108
129 Changes in Net Position (accrual basis of accounting) Fiscal Year ,708,302 39,892,892 41,217,023 39,910,342 39,356,634 32,466,772 25,974,872 22,920,702 23,053,144 20,872,734 20,417,898 17,725,070 17,696,578 13,297,719 3,680,267 4,147,243 4,336,910 4,917,600 4,969,610 4,128,206 4,803,236 1,339,252 3,190,945 1,874,954 1,987,109 1,537,561 1,490, ,770 67,648,523 70,284,224 68,301,621 67,232,949 63,588,875 55,782,354 45,019,597 67,648,523 70,284,224 68,301,621 67,232,949 63,588,875 55,782,354 45,019,597 5,612,920 3,589,834 5,226,512 4,323,291 5,675,162 5,831,435 5,181,281 20,049,112 6,497,058 18,140,280 16,522,188 14,898,141 16,079,235 12,235,566 1,523,950 14,488,849 1,173,276 1,364,097 1,964, , , , , , , , , ,522 2,078,404 2,891,068 3,416,858 6,039,124 5,568,915 4,814,865 14,630,306 29,455,672 27,725,318 28,075,933 28,429,642 29,035,702 27,249,543 32,815,180 29,455,672 27,725,318 28,075,933 28,429,642 29,035,702 27,249,543 32,815,180 (38,192,851) (42,558,906) (40,225,688) (38,803,307) (34,553,173) (28,532,811) (12,204,417) (38,192,851) (42,558,906) (40,225,688) (38,803,307) (34,553,173) (28,532,811) (12,204,417) 31,186,985 32,253,420 33,603,024 38,695,990 39,350,015 37,568,715 31,692, , , , , , ,265 2,252,726 3,778,975 2,717,402 1,859, , , , ,691 1,054,479 1,353, ,527 31,773,778 32,777,723 34,573,064 41,489,407 44,699,896 42,146,414 34,499,247 31,773,778 32,777,723 34,573,064 41,489,407 44,699,896 42,146,414 34,499,247 (6,419,073) (9,781,183) (5,652,624) 2,686,100 10,146,723 13,613,603 22,294,830 (6,419,073) (9,781,183) (5,652,624) 2,686,100 10,146,723 13,613,603 22,294,
130 Fund Balances of Governmental Funds (modified accrual basis of accounting) Fiscal Year General fund: Nonspendable $ 423, , ,338 Restricted 16,031,122 16,145,077 14,238,705 Assigned 26,108,555 16,466,784 15,204,930 Total general fund $ 42,563,646 33,351,099 29,550,973 All other governmental funds: Restricted $ 28,318,509 26,196,740 22,978,592 Assigned, reported in: Special revenue fund Total all other governmental funds $ 28,318,509 26,196,740 22,978,592 Source: Cosumnes CSD Administrative Services Department 110
131 Fund Balances of Governmental Funds (modified accrual basis of accounting) Fiscal Year ,770 16,207 15,048 14,720,152 17,954,979 20,139,539 23,966,205 27,636,829 40,876,680 28,221,568 19,487,133 23,234,797 26,396,387 31,788,249 35,380,874 28,915,291 24,146,365 34,228,055 41,205,983 46,550,974 55,754,454 63,017,703 69,791,971 52,367,933 19,741,810 17,815,933 6,732,261 11,228,117 4,129,624 3,945,988 3,871, ,270,117 14,482,116 12,499,960 8,876,199 6,189,330 19,741,810 17,815,933 21,002,378 25,710,233 16,629,584 12,822,187 10,060,
132 Changes in Fund Balances of Governmental Funds (modified accrual basis of accounting) Revenues: Fiscal Year Taxes $ 36,173,988 32,626,823 29,456,296 Charges for services 29,519,898 27,835,872 25,669,576 Developer fees and contributions 1,500,655 2,832,285 1,747,613 Intergovernmental 2,149,487 1,407,346 1,925,884 Donations and contributions 113, , ,774 Use of money and property 1,516,902 1,486,062 1,504,489 Miscellaneous 334, , ,965 Total revenues 71,309,383 66,642,385 60,818,597 Expenditures: Current: Public protection 36,077,297 33,362,739 34,372,236 Recreation and culture 21,147,714 18,737,965 18,571,201 General government 4,209,127 3,115,442 3,117,972 Capital outlay 4,355,382 2,412,214 2,462,853 Debt service: Principal 2,060,546 2,678,562 3,021,871 Interest 776, ,905 1,201,336 Total expenditures 68,626,994 61,182,827 62,747,469 Excess of revenues over expenditures 2,682,389 5,459,558 (1,928,872) Other financing sources (uses): Proceeds from sale of capital assets 133,147 16, ,586 Issuance of long-term liabilities 1,276,969 1,436, ,986 Insurance recoveries 7,241, ,452 Transfers in 5,720,119 4,625,190 4,273,702 Transfers out (5,720,119) (4,625,190) (4,273,702) Total other financing sources (uses) 8,651,927 1,558, ,572 Net change in fund balances $ 11,334,316 7,018,274 (1,440,300) Debt service as a percentage of noncapital expenditures 4.4% 6.0% 7.0% Source: Cosumnes CSD Administrative Services Department 112
133 Changes in Fund Balances of Governmental Funds (modified accrual basis of accounting) Fiscal Year ,186,985 32,253,420 33,603,024 38,695,990 39,866,442 37,267,052 31,603,088 25,833,814 25,077,392 23,100,046 22,896,520 22,203,832 19,855,774 16,467,838 1,458,624 1,993, ,588 3,428,132 3,449,473 19,893,358 4,454, , ,309 2,422,270 2,610,992 2,119,442 1,549,143 1,937, , , , , , , ,969 1,367,064 1,521,106 1,544,523 3,232,037 4,728,139 3,603,807 2,742, , , , ,691 1,044, , ,422 60,837,325 62,163,965 62,120,233 71,585,304 74,341,132 83,309,781 57,731,233 33,478,192 33,893,997 34,953,709 35,355,540 34,901,437 30,013,881 24,801,485 19,767,882 20,342,559 18,059,421 17,878,449 17,710,709 16,096,014 11,000,985 3,224,873 3,577,708 3,944,833 4,645,014 4,962,430 3,925,493 4,862,605 4,478,538 3,823,032 17,356,702 15,331,594 16,159,800 23,988,702 32,316,307 4,344,153 6,865,298 3,332,703 4,739,988 3,212,237 2,252,999 1,528,303 1,367,625 3,386,607 1,889,017 1,852,098 1,568,973 1,251, ,987 66,661,263 71,889,201 79,536,385 79,802,683 78,515,586 77,528,537 75,134,672 (5,823,938) (9,725,236) (17,416,152) (8,217,379) (4,174,454) 5,781,244 (17,403,439) 156, , ,189 34, , ,556 5, , ,747 3,231,628 10,000,000 1,088,986 13,767,937 25,085, , ,836 9,842 23,702 63,962 5,544,330 5,539,122 10,881,176 5,902,928 3,790,486 4,682,941 2,577,213 (5,544,330) (5,539,122) (10,881,176) (5,902,928) (3,790,486) (4,682,941) (2,577,213) 771,887 1,193,799 3,504,817 10,034,779 1,207,583 14,404,195 25,155,892 (5,052,051) (8,531,437) (13,911,335) 1,817,400 (2,966,871) 20,185,439 7,752, % 15.1% 8.4% 10.2% 7.7% 6.5% 5.0% 113
134 Direct and Overlapping Property Tax Rates (Rate per $100 of assessed value) Last Ten Fiscal Years District Rate Overlapping Rates: County of Sacramento County Library Elk Grove Unified School District Elk Grove-Cosumnes Cemetery District City of Elk Grove Los Rios Community College Sacramento-Yolo Mosquito Abatement District Other Regional Sanitation District Bonds Los Rios Community College GO Bonds Total Direct Rate Notes: In 1978, California voters passed Proposition 13 which sets the property tax rate at a 1.00% fixed amount. This 1.00% is shared by all taxing agencies for which the subject property resides within. In addition to the 1.00% fixed amount, property owners are charged taxes as a percentage of assessed property values for the payment of Regional Sanitation District bonds and Los Rios Community College General Obligation bonds. Rates are within the City of Elk Grove boundaries. No data is available for areas outside City boundaries. Source: HdL Coren & Cone
135 Principal Property Taxpayers Current Year and Nine Years Ago Taxpayer Percentage of Percentage of Total District Total District Taxable Taxable Taxable Taxable Assessed Assessed Assessed Assessed Value (1) Value Value Value Apple Computer, Inc $ 170,789, % Donahue Schriber Realty Group L P 102,568, % Pappas Laguna 2 Limited Partnership 88,066, % Laguna Springs Corporation Center 69,703, % Kaiser Foundation Health Plan 60,767, % Oakmont Properties II LP 48,456, % Jackson II LLC 37,798, % 9130 Nolan Street LLC 37,554, % Walmart Real Estate Business Trust 34,745, % Zhu Yanzhi 2014 Trust 31,956, % ACI Real Properties 67,874, % Draper Ranney E/TR/ETAL 21,470, % Grupe Development Associates 20,785, % Winncrest Homes 16,776, % DFT Properties 15,710, % Western Investments Real Estate 12,507, % Laguna West 829 LP 11,657, % JVC America Inc. 11,432, % Suburban Propane LP 10,641, % Morris Family Corporation 8,725, % Total $ 682,408, % 197,582, % Notes: (1) Amounts represent assessed values within the City of Elk Grove boundaries. Source: County of Sacramento Assessor's Office and HdL Coren & Cone 115
136 Property Tax Levies and Collections Last Ten Fiscal Years Fiscal Year Taxes Levied Collected within the Fiscal Year of the Levy Collections Total Collections to Date Ended for the Percentage in Subsequent Percentage June 30 Fiscal Year Amount of Levy Years Amount of Levy ,133,955 25,101, % 3,132,224 31,603, % ,793,122 30,707, % 6,559,086 37,267, % ,793,725 36,949, % 2,917,002 39,866, % ,904,491 32,007, % 6,688,873 38,695, % ,523,739 32,007, % 1,595,988 33,603, % ,950,787 31,301, % 952,310 32,253, % ,299,748 31,053, % 133,348 31,186, % ,299,748 29,456, % 476,125 29,932, % ,605,628 32,626, % 435,454 33,062, % ,976,606 36,173, % 401,309 36,575, % Sources: Sacramento County Auditor-Controller and Cosumnes CSD Administrative Services Department 116
137 Assessed Value and Estimated Actual Value of Taxable Property Last Ten Fiscal Years (In Thousands) Fiscal Year Taxable Total Ended Assessed Direct June 30 Secured Unsecured Value Tax Rate ,581, ,470 12,777, ,410, ,466 15,654, ,433, ,944 19,722, ,929, ,351 19,270, ,674, ,438 17,043, ,410, ,933 16,751, ,691, ,105 16,017, ,907, ,293 15,231, ,202, ,789 16,502, ,922, ,625 18,234, Notes: In 1978 the voters of the State of California passed Proposition 13 which limited property taxes to a total maximum rate of 1% based upon the assessed value of the property being taxed. Each year, the assessed value of property may be increased by an "inflation factor" (limited to a maximum increase of 2%). With few exceptions, property is only reassessed at the time that it is sold to a new owner. At that point, the new assessed value is reassessed at the purchase price of the property sold. The assessed valuation data shown above represents the only data currently available with respect to the actual market value of taxable property and is subject to the limitations described above. Source: Sacramento County Auditor-Controller and Cosumnes CSD Administrative Services Department 117
138 Ratios of Outstanding Debt by Type Last Ten Fiscal Years Fiscal Year Governmental Activities Certificates Total Percentage Debt Ended of Capital Governmental of Assessed Per June 30 Participation Loans Leases Activities Valuation Capita ,060,000 1,910,368 16,663,442 20,633, % ,960,000 1,909,186 28,429,561 32,298, % ,850,000 1,647,379 26,682,640 30,180, % ,735,000 1,418,854 32,295,308 35,449, % ,615,000 4,278,280 29,454,966 35,348, % ,341,000 3,302,285 23,564,327 28,207, % ,191,700 2,281,623 20,512,651 23,985, % ,022,900 1,217,925 19,049,265 21,290, % ,200 98,219 19,103,063 20,048, % ,100 88,072 18,512,732 19,264, % Source: Cosumnes CSD Administrative Services Department 118
139 Direct and Overlapping Debt June 30, 2015 District Assessed Valuation (in thousands) $ 18,234,098 Estimated Estimated Share of Percentage Outstanding Overlapping Applicable (1) Debt 6/30/15 Debt Overlapping Debt Repaid with Property Taxes and Assessments: Los Rios Community College District % $ 361,280,000 37,963,302 San Joaquin Delta Community College District 0.005% 145,438,426 7,272 River Delta Joint Unified School District School Facilities Improvement District No % 8,214,996 22,756 Sacramento Unified School District % 439,797, ,820 Grant Joint Union High School District and School District 0.106% & 0.042% 34,028,684 31,501 Elk Grove Community Facilities District % 142,720, ,720,000 Elk Grove Unified School District Community Facilities District No % 178,792, ,051,004 Sacramento County Community Facilities Districts % 28,404,324 28,404,324 California Statewide Community Development Authority 915 Act Bonds % 5,593,994 5,593,994 Total overlapping debt repaid with property taxes and assessments 1,344,270, ,620,973 Overlapping Other Debt: Sacramento County General Fund Obligations % $ 276,872,688 35,342,799 Sacramento County Pension Obligations % 973,933, ,322,673 Sacramento County Board of Education Certificates of Participation % 7,260, ,739 Los Rios Community College District Certificates of Participation % 5,440, ,635 Sacramento Unified School District Certificates of Participation % 72,380, ,074 Sacramento Unified School District Pension Obligations % 1,195,000 2,247 City of Elk Grove General Fund Obligations % 20,720,000 20,720,000 Total overlapping other debt 1,357,801, ,022,167 Total overlapping debt $ 2,702,072, ,643,140 District direct debt 19,264,904 Total direct and overlapping debt $ 518,908,044 Notes: (1) For debt repaid with property taxes, the percentage of overlapping debt applicable is estimated using taxable assessed property values. Applicable percentages were estimated by determining the portion of another governmental unit's taxable assessed value that is within the District's boundaries and dividing it by each unit's total taxable assessed value. Overlapping governments are those that coincide, at least in part, with the geographic boundaries of the District. This schedule estimates the portion of the outstanding debt of those overlapping governments that is borne by the residents and businesses of. This process recognizes that, when considering the District's ability to issue and repay long-term debt, the entire debt burden borne by the residents and businesses should be taken into account. However, this does not imply that every taxpayer is a resident--and therefore responsible for repaying the debt--of each overlapping government. Source: California Municipal Statistics, Inc. 119
140 Legal Debt Margin Information Last Ten Fiscal Years (in thousands of dollars) Fiscal Year Assessed valuation $ 12,777,812 15,654,867 19,722,281 19,270,205 17,043,081 16,751,799 16,017,384 15,231,576 16,502,762 18,234,098 Conversion percentage 25% 25% 25% 25% 25% 25% 25% 25% 25% 25% Adjusted assessed valuation $ 3,194,453 3,913,717 4,930,570 4,817,551 4,260,770 4,187,950 4,004,346 3,807,894 4,125,691 4,558,525 Debt limit percentage 5% 5% 5% 5% 5% 5% 5% 5% 5% 5% 120 Debt limit 159, , , , , , , , , ,926 Total net debt applicable to limit: General obligation bonds Legal debt margin $ 159, , , , , , , , , ,926 Total debt applicable to the limit as a percentage of debt limit 0% 0% 0% 0% 0% 0% 0% 0% 0% 0% Note: The Government Code of the State of California provides for a legal debt limit of 5% of gross assessed valuation. However, this provision was enacted when assessed valuation was based upon 25% of market value. Effective with the fiscal year, each parcel is now assessed at 100% of market value (as of the most recent change in ownership for that parcel). The computations shown above reflect a conversion of assessed valuation data for each fiscal year from the current full valuation perspective to the 25% level that was in effect at the time that the legal debt margin was enacted by the State of California for local governments located within the state. Source: Cosumnes CSD Administrative Services Department and Sacramento County Assessor's Office
141 Pledged-Revenue Coverage Last Ten Fiscal Years Special Assessment Debt Special Less Net Fiscal Assessment Operating Available Debt Service Year Collections Expenses Revenue Principal Interest Coverage ,437,316 5,902,160 2,535, ,393 98, ,197,278 6,716,506 3,480, ,182 88, ,333,259 7,277,479 4,055, , , ,342,506 7,826,819 4,515, , , ,837,355 8,051,156 4,786, , , ,295,157 9,862,791 4,432, ,439 93, ,953,831 9,847,285 4,106, ,729 99, ,213,219 9,624,008 4,589, ,796 65, ,415,446 9,415,366 5,000, ,806 29, ,708,161 11,323,523 3,384,638 25,703 1, Notes: Details regarding the District's outstanding debt can be found in the notes to the financial statements. Special assessments pledged for the loan payable are reported in the Landscape and Lighting Special Revenue Fund and related debt service expenditures are reported in the Debt Service Fund. Operating expenses do not include debt service or capital outlay expenditures. Source: Cosumnes CSD Administrative Services Department 121
142 Demographic and Economic Statistics Last Ten Calendar Years Sacramento Per Capita County Calendar District Personal Unemployment Year Population (1) Income (2) Rate (3) ,000 N/A 4.8% ,000 N/A 5.0% ,500 N/A 7.0% ,430 N/A 11.9% ,885 N/A 12.6% ,870 N/A 12.7% ,333 N/A 11.0% ,259 N/A 8.7% ,333 N/A 6.9% ,564 N/A 5.8% N/A Information is not available. Sources: 1 2 US Department of Commerce, Bureau of Economic Analysis (data shown is for Sacramento County) 3 State of California Employment Development Department (data shown is for Sacramento County) 122
143 Principal Employers Last Ten Calendar Years Percentage Percentage of Total of Total Employer Employees Employment Employees Employment Elk Grove Unified School District 3, % 2,207 (1) Bel Air/Raleys Supermarkets % 381 (1) Apple Computer % 750 (1) Alldata % 425 (1) City of Elk Grove % 240 (1) % 239 (1) Bimbo Bakeries, Inc % - (1) Wal Mart % 325 (1) Maita Chevrolet % - (1) Home Depot % 190 (1) AAA Call Center % 750 (1) Decorative Specialties % 220 (1) Source: and State of CA Employment Dev Dept (1) Information is not available. 123
144 Full-time District Employees by Function Last Ten Fiscal Years Full-time District Employees as of June Function General government Public safety Recreation and culture Total Source: Cosumnes CSD Administrative Services Department
145 Operating Indicators by Function/Program Last Ten Fiscal Years Fiscal Year Function/Program Fire Emergency responses 10,205 10,269 13,934 13,424 13,493 14,011 14,374 14,679 15,170 16,613 Field Inspections (1) (1) (1) (1) (1) 1,602 1,687 2,290 2,165 2,742 Plan checks 1,066 1, ,093 1,110 Resubmitted Plan Checks (1) (1) (1) (1) (1) (1) (1) (1) Weed Abatement (1) (1) (1) (1) (1) Fire Investigations Code Enforcement (1) (1) (1) (1) Parks and recreation Number of recreation programs Source: Various District departments (1) Information is not available.
146 Capital Asset Statistics by Function/Program Last Ten Fiscal Years Fiscal Year Function/Program Fire Fire stations Training facility Fire engines Other Fire vehicles Parks and recreation Parks Acreage Playgrounds Baseball/softball diamonds Soccer/football fields Community centers Swimming pools Tennis courts Skate board park Bike Park Sources: Various District departments
147

148
COMPREHENSIVE ANNUAL FINANCIAL REPORT FISCAL YEAR ENDED JUNE 30, 2018
 COMPREHENSIVE ANNUAL FINANCIAL REPORT FISCAL YEAR ENDED JUNE 30, 2018 Cosumnes Community Services District 9355 E. Stockton Boulevard, Suite 185, Elk Grove, California 95624 Phone: (916) 405-7150 Fax:
CITY OF ATWATER, CALIFORNIA ANNUAL FINANCIAL REPORT FOR THE FISCAL YEAR ENDED JUNE 30, 2016
 CITY OF ATWATER, CALIFORNIA ANNUAL FINANCIAL REPORT FOR THE FISCAL YEAR ENDED JUNE 30, 2016 Prepared by: Finance Department This page intentionally left blank. Basic Financial Statements Table of Contents
CITY OF NEDERLAND, TEXAS. Comprehensive Annual Financial Report
 Comprehensive Annual Financial Report For the Year Ended September 30, 2014 Prepared by the Finance Department INTRODUCTORY SECTION Comprehensive Annual Financial Report September 30, 2014 Table of Contents
Celebrating 25 Years of Excellence
 Celebrating 25 Years of Excellence Comprehensive Annual Financial Report Fiscal Year Ended June 30, 2017 Chino Hills, California , CALIFORNIA COMPREHENSIVE ANNUAL FINANCIAL REPORT FISCAL YEAR ENDED JUNE
CITY OF HEALDSBURG HEALDSBURG, CALIFORNIA COMPREHENSIVE ANNUAL FINANCIAL REPORT WITH REPORT ON AUDIT BY INDEPENDENT CERTIFIED PUBLIC ACCOUNTANTS
 HEALDSBURG, CALIFORNIA COMPREHENSIVE ANNUAL FINANCIAL REPORT WITH REPORT ON AUDIT BY INDEPENDENT CERTIFIED PUBLIC ACCOUNTANTS FISCAL YEAR ENDED JUNE 30, 2008 Prepared by the Finance Department COMPREHENSIVE
CITY OF MINNETRISTA, MINNESOTA COMPREHENSIVE ANNUAL FINANCIAL REPORT YEAR ENDED DECEMBER 31, 2013
 , MINNESOTA COMPREHENSIVE ANNUAL FINANCIAL REPORT YEAR ENDED DECEMBER 31, 2013 PREPARED BY THE FINANCE DEPARTMENT OF THE CITY OF MINNETRISTA, MINNESOTA BRIAN GRIMM DIRECTOR OF FINANCE TABLE OF CONTENTS
CITY OF LAGUNA BEACH, CALIFORNIA. Comprehensive Annual Financial Report. For the Fiscal Year Ended June 30, 2015
 CITY OF LAGUNA BEACH, CALIFORNIA Comprehensive Annual Financial Report For the Fiscal Year Ended June 30, 2015 CITY OF LAGUNA BEACH, CALIFORNIA COMPREHENSIVE ANNUAL FINANCIAL REPORT FOR THE FISCAL YEAR
COMPREHENSIVE ANNUAL FINANCIAL REPORT
 COMPREHENSIVE ANNUAL FINANCIAL REPORT Arvada Fire Protection District Arvada, Colorado for the fiscal year ended December 31, 2017 ARVADA, COLORADO Comprehensive Annual Financial Report For the fiscal
TABLE OF CONTENTS. Page INDEPENDENT AUDITOR'S REPORT 1 MANAGEMENT S DISCUSSION AND ANALYSIS 4 BASIC FINANCIAL STATEMENTS
 VILLAGE OF BEAR LAKE, MICHIGAN ANNUAL FINANCIAL REPORT YEAR ENDED FEBRUARY 28, 2018 TABLE OF CONTENTS INDEPENDENT AUDITOR'S REPORT 1 MANAGEMENT S DISCUSSION AND ANALYSIS 4 BASIC FINANCIAL STATEMENTS Government-wide
COMPREHENSIVE ANNUAL FINANCIAL REPORT Fiscal Year Ended June 30, 2016
 COMPREHENSIVE ANNUAL FINANCIAL REPORT Fiscal Year Ended June 30, 2016 This page intentionally left blank. CITY OF SONOMA, CALIFORNIA COMPREHENSIVE ANNUAL FINANCIAL REPORT FOR THE FISCAL YEAR ENDED JUNE
MEDINAH PARK DISTRICT MEDINAH, ILLINOIS COMPREHENSIVE ANNUAL FINANCIAL REPORT
 MEDINAH PARK DISTRICT MEDINAH, ILLINOIS COMPREHENSIVE ANNUAL FINANCIAL REPORT FOR THE FISCAL YEAR ENDED DECEMBER 31, 2017 Medinah, Illinois Comprehensive Annual Financial Report For The Year Ended December
VILLAGE OF PIGEON PIGEON, MICHIGAN HURON COUNTY FINANCIAL REPORT FEBRUARY 29, 2016
 VILLAGE OF PIGEON PIGEON, MICHIGAN HURON COUNTY FINANCIAL REPORT FEBRUARY 29, 2016 REPORT OF INDEPENDENT AUDITORS MANAGEMENT S DISCUSSION AND ANALYSIS TABLE OF CONTENTS PAGE NUMBER i - iii iv x BASIC FINANCIAL
CITY OF ROLLING HILLS, CALIFORNIA FINANCIAL STATEMENTS FOR THE FISCAL YEAR ENDED JUNE 30, 2017
 , CALIFORNIA FINANCIAL STATEMENTS FOR THE FISCAL YEAR ENDED JUNE 30, 2017 PREPARED BY: THE CITY OF ROLLING HILLS, CALIFORNIA FINANCIAL SERVICES DEPARTMENT THIS PAGE INTENTIONALLY LEFT BLANK FINANCIAL STATEMENTS
CITY OF CARSON CITY, MICHIGAN
 , MICHIGAN FINANCIAL STATEMENTS Vredeveld Haefner LLC CPAs and Consultants TABLE OF CONTENTS FINANCIAL SECTION PAGE Independent Auditors Report 1-2 Management s Discussion and Analysis 3-8 Basic Financial
WOODS CROSS CITY CORPORATION FINANCIAL STATEMENTS. For The Year Ended June 30, Together With Independent Auditor s Report
 CORPORATION FINANCIAL STATEMENTS For The Year Ended June 30, 2017 Together With Independent Auditor s Report Financial Section: WOODS CROSS CITY TABLE OF CONTENTS Independent Auditor s Report... 1 Management
CITY OF LAKE ELMO, MINNESOTA COMPREHENSIVE ANNUAL FINANCIAL REPORT FOR THE FISCAL YEAR ENDED DECEMBER 31, 2017
 COMPREHENSIVE ANNUAL FINANCIAL REPORT FOR THE FISCAL YEAR ENDED DECEMBER 31, 2017 PREPARED BY: FINANCE DEPARTMENT CITY OF LAKE ELMO, MINNESOTA FINANCIAL STATEMENTS For the Fiscal Year Ended December 31,
TOWN OF CUMBERLAND, RHODE ISLAND ANNUAL FINANCIAL STATEMENTS FOR THE YEAR ENDED JUNE 30, 2016
 ANNUAL FINANCIAL STATEMENTS FOR THE YEAR ENDED JUNE 30, 2016 For the year ended Table of Contents Independent Auditor's Report... 1 Management's Discussion and Analysis... 4 Basic Financial Statements...
City of Murphy, Texas
 Comprehensive Annual Financial Report Fiscal Year Ended September 30, 2018 Prepared by: Finance Department This Page Left Intentionally Blank Comprehensive Annual Financial Report For the Fiscal Year Ended
TOWN OF CUMBERLAND, RHODE ISLAND ANNUAL FINANCIAL STATEMENTS FOR THE YEAR ENDED JUNE 30, 2017
 ANNUAL FINANCIAL STATEMENTS FOR THE YEAR ENDED JUNE 30, 2017 For the year ended Table of Contents Independent Auditor's Report... 1 Management's Discussion and Analysis... 4 Basic Financial Statements...
Comprehensive Annual Financial Report. City of Medford Oregon
 Comprehensive Annual Financial Report City of Medford Oregon For the Fiscal Year Ended June 30, 2015 , OREGON COMPREHENSIVE ANNUAL FINANCIAL REPORT FOR THE FISCAL YEAR ENDED JUNE 30, 2015 Prepared by:
COUNTY OF CALDWELL NORTH CAROLINA
 COUNTY OF CALDWELL NORTH CAROLINA COMPREHENSIVE ANNUAL FINANCIAL REPORT FOR THE YEAR ENDED JUNE 30, 2013 Comprehensive Annual Financial Report For the Year Ended June 30, 2013 Prepared by Finance Department
LE SUEUR COUNTY Le Center, Minnesota
 Le Center, Minnesota FINANCIAL STATEMENTS Including Independent Auditors Report As of and for the Year Ended December 31, 2017 TABLE OF CONTENTS As of and for the Year Ended December 31, 2017 Independent
Annual Financial Report. County of Stanislaus, California
 Annual Financial Report County of Stanislaus, California Fiscal Year Ended June 30, 2013 Annual Financial Report County of Stanislaus, California Fiscal Year Ended June 30, 2013 Prepared By Stanislaus
YEO & YEO CPAs & BUSINESS CONSULTANTS
 , Michigan Comprehensive Annual Financial Report For the Year Ended June 30, 2017 YEO & YEO CPAs & BUSINESS CONSULTANTS Comprehensive Annual Financial Report County of Washtenaw State of Michigan Fiscal
City of Sauk Rapids Benton County, Minnesota. Financial Statements. December 31, 2016
 Benton County, Minnesota Financial Statements December 31, 2016 Table of Contents Elected Officials and Administration 1 Independent Auditor's Report 2 Management's Discussion and Analysis 5 Basic Financial
Comprehensive Annual Financial Report. Fiscal Year Ended June 30, 2017
 Comprehensive Annual Financial Report Fiscal Year Ended June 30, 2017 CITY OF COVINGTON, GEORGIA COMPREHENSIVE ANNUAL FINANCIAL REPORT FOR THE FISCAL YEAR ENDED JUNE 30, 2017 Prepared by: Randy Smith,
VILLAGE OF ELMWOOD PARK, ILLINOIS COMPREHENSIVE ANNUAL FINANCIAL REPORT. Year Ended April 30, 2018
 COMPREHENSIVE ANNUAL FINANCIAL REPORT Year Ended April 30, 2018 Prepared By: Finance Department John Lannefeld, Finance Director COMPREHENSIVE ANNUAL FINANCIAL REPORT Year Ended April 30, 2018 TABLE OF
City of Bentonville, Arkansas
 Comprehensive Annual Financial Report For the Year Ended December 31, 2016 Prepared by: Denise Land Finance Director Jake Harper Assistant Finance Director Visit our web site at: www.bentonvillear.com
CITY OF EAST GRAND RAPIDS, MICHIGAN FINANCIAL STATEMENTS FOR THE YEAR ENDED JUNE
 , MICHIGAN FINANCIAL STATEMENTS Vredeveld Haefner LLC TABLE OF CONTENTS FINANCIAL SECTION PAGE Independent Auditors Report 1-2 Management s Discussion and Analysis 3-8 Basic Financial Statements Government-wide
Internal Audit. Sonoma County. Auditor Controller Treasurer Tax Collector
 Auditor Controller Treasurer Tax Collector Internal Audit Sonoma County Financial Statement Audit: Russian River Recreation and Park District Annual Report For the Fiscal Year Ended Audit No: 3425 Report
TOWN OF ASHFORD, CONNECTICUT FINANCIAL STATEMENTS AS OF AND FOR THE YEAR ENDED JUNE 30, 2018
 FINANCIAL STATEMENTS AS OF AND FOR THE YEAR ENDED JUNE 30, 2018 TABLE OF CONTENTS Page Independent Auditor s Report 1 Management s Discussion and Analysis (Unaudited) 3 Basic Financial Statements: Government
Davidson, Jamieson & Cristini, P.L. Certified Public Accountants
 COMPREHENSIVE ANNUAL FINANCIAL REPORT FISCAL YEAR ENDED SEPTEMBER 30, 2014 Davidson, Jamieson & Cristini, P.L. Certified Public Accountants COMPREHENSIVE ANNUAL FINANCIAL REPORT FOR THE FISCAL YEAR ENDED
COMPREHENSIVE ANNUAL FINANCIAL REPORT City of McGregor, Texas. Year ended September 30, 2015
 COMPREHENSIVE ANNUAL FINANCIAL REPORT City of McGregor, Texas Year ended September 30, 2015 This page is intentionally left blank. CITY OF MCGREGOR, TEXAS COMPREHENSIVE ANNUAL FINANCIAL REPORT FOR THE
COMPREHENSIVE ANNUAL FINANCIAL REPORT WITH INDEPENDENT AUDITORS REPORT
 COMPREHENSIVE ANNUAL FINANCIAL REPORT WITH INDEPENDENT AUDITORS REPORT * * * * * JUNE 30, 2011 BASIC FINANCIAL STATEMENTS FOR THE YEAR ENDED JUNE 30, 2011 TABLE OF CONTENTS Independent Auditors' Report
CITY OF BOYNE CITY CHARLEVIOX COUNTY, MICHIGAN ANNUAL FINANCIAL REPORT YEAR ENDED APRIL 30, 2014
 CITY OF BOYNE CITY CHARLEVIOX COUNTY, MICHIGAN ANNUAL FINANCIAL REPORT YEAR ENDED APRIL 30, 2014 TABLE OF CONTENTS INDEPENDENT AUDITOR'S REPORT 1 MANAGEMENT S DISCUSSION AND ANALYSIS 4 BASIC FINANCIAL
LYONS ELEMENTARY SCHOOL DISTRICT 103 ANNUAL FINANCIAL REPORT FOR THE FISCAL YEAR ENDED JUNE 30, 2018
 ANNUAL FINANCIAL REPORT FOR THE FISCAL YEAR ENDED JUNE 30, 2018 ANNUAL FINANCIAL REPORT June 30, 2018 CONTENTS FINANCIAL SECTION Independent Auditor s Report... 1-2 Management s Discussion and Analysis...
REPORT ANNUAL FINANCIAL COMPREHENSIVE. as of and for the year ended June 30, 2018
 COMPREHENSIVE ANNUAL FINANCIAL REPORT as of and for the year ended June 30, 2018 OFFICIALS ISSUING REPORT Dr. Ehren Jarrett Superintendent Michelle R. Jahr, CPA Chief Financial Officer DEPARTMENT ISSUING
VERMONT COMPREHENSIVE ANNUAL FINANCIAL REPORT
 VERMONT COMPREHENSIVE ANNUAL FINANCIAL REPORT For the fiscal year ending JUNE 30, 2004 The cover picture was provided by Linda Morse of Middlesex, VT. STATE OF VERMONT COMPREHENSIVE ANNUAL FINANCIAL REPORT
TOWN OF ASHFORD, CONNECTICUT BASIC FINANCIAL STATEMENTS, SUPPLEMENTARY INFORMATION, AND INDEPENDENT AUDITOR S REPORT
 BASIC FINANCIAL STATEMENTS, SUPPLEMENTARY INFORMATION, AND INDEPENDENT AUDITOR S REPORT CONTENTS Page Independent Auditor s Report 1 Management s Discussion and Analysis (Unaudited) 3 Basic Financial Statements:
CITY OF COLUMBUS Columbus, Wisconsin
 Columbus, Wisconsin FINANCIAL STATEMENTS Including Independent Auditors' Report TABLE OF CONTENTS Independent Auditors' Report Required Supplementary Information Management's Discussion and Analysis Basic
TOWN OF SOUTH PALM BEACH, FLORIDA
 COMPREHENSIVE ANNUAL FINANCIAL REPORT FISCAL YEAR ENDED SEPTEMBER 30, 2009 PREPARED BY FINANCE DEPARTMENT TABLE OF CONTENTS Introductory Section Letter of Transmittal... i-iv Organizational Chart...v Certificate
SALEM CITY CORPORATION FINANCIAL STATEMENTS
 FINANCIAL STATEMENTS FOR THE YEAR ENDED JUNE 30, 2014 TABLE OF CONTENTS Introductory Section: Page Letter of transmittal 3 Financial Section: Independent Auditors Report 7 Management Discussion and Analysis
THE TOWN OF SYKESVILLE, MARYLAND BASIC FINANCIAL STATEMENTS AND REQUIRED SUPPLEMENTARY INFORMATION FOR THE YEAR ENDED JUNE 30, 2016
 BASIC FINANCIAL STATEMENTS AND REQUIRED SUPPLEMENTARY INFORMATION FOR THE YEAR ENDED JUNE 30, 2016 TABLE OF CONTENTS P a g e INDEPENDENT AUDITORS' REPORT 1-3 REQUIRED SUPPLEMENTARY INFORMATION Management
SALEM CITY CORPORATION FINANCIAL STATEMENTS
 FINANCIAL STATEMENTS FOR THE YEAR ENDED JUNE 30, 2016 ii Table of Contents Introductory Section Page Letter of transmittal... 3 Financial Section Independent Auditors Report... 7 Management Discussion
ROBINSON, FARMER, COX ASSOCIATES
 ROBINSON, FARMER, COX ASSOCIATES A PROFESSIONAL LIMITED LIABILITY COMPANY CERTIFIED PUBLIC ACCOUNTANTS Independent Auditors Report To the Honorable Members of the City Council City of Manassas, Virginia
TOWN OF ASHFORD, CONNECTICUT BASIC FINANCIAL STATEMENTS, SUPPLEMENTARY INFORMATION, AND INDEPENDENT AUDITOR S REPORT
 BASIC FINANCIAL STATEMENTS, SUPPLEMENTARY INFORMATION, AND INDEPENDENT AUDITOR S REPORT JUNE 30, 2014 Contents Page Independent Auditor s Report 1 Management s Discussion and Analysis (Unaudited) 3 Basic
City of Grand Ledge. FINANCIAL STATEMENTS (With Required Supplementary Information) June 30, 2018
 June 30, 2018") FINANCIAL STATEMENTS (With Required Supplementary Information) TABLE OF CONTENTS Page INDEPENDENT AUDITOR S REPORT MANAGEMENT S DISCUSSION AND ANALYSIS i-iii iv-x BASIC FINANCIAL STATEMENTS Government-wide
FINANCIAL STATEMENTS (With Required Supplementary Information) TABLE OF CONTENTS Page INDEPENDENT AUDITOR S REPORT MANAGEMENT S DISCUSSION AND ANALYSIS i-iii iv-x BASIC FINANCIAL STATEMENTS Government-wide
City of Alhambra California. Comprehensive Annual Financial Report
 City of Alhambra California Comprehensive Annual Financial Report For the year ended June 30, 2013 On the Cover: Almansor Park Playground The City opened the newly renovated playground in Almansor Park
TOWNSHIP OF TYRONE LIVINGSTON COUNTY, MICHIGAN ANNUAL FINANCIAL REPORT YEAR ENDED MARCH 31, 2018
 TOWNSHIP OF TYRONE LIVINGSTON COUNTY, MICHIGAN ANNUAL FINANCIAL REPORT YEAR ENDED MARCH 31, 2018 TABLE OF CONTENTS INDEPENDENT AUDITOR'S REPORT 1 MANAGEMENT S DISCUSSION AND ANALYSIS 5 BASIC FINANCIAL
CITY OF MINNETRISTA, MINNESOTA COMPREHENSIVE ANNUAL FINANCIAL REPORT YEAR ENDED DECEMBER 31, 2014
 , MINNESOTA COMPREHENSIVE ANNUAL FINANCIAL REPORT YEAR ENDED DECEMBER 31, 2014 PREPARED BY THE FINANCE DEPARTMENT OF THE, MINNESOTA BRIAN GRIMM DIRECTOR OF FINANCE TABLE OF CONTENTS YEAR ENDED DECEMBER
SALEM CITY CORPORATION FINANCIAL STATEMENTS
 FINANCIAL STATEMENTS FOR THE YEAR ENDED JUNE 30, 2017 Allred Jackson, PC 50 East 2500 North, Suite 200 North Logan, UT 84341 (P) 435.752.6441 (F) 435.752.6451 www.allredjackson.com ii Table of Contents
CITY OF FREEPORT FREEPORT, TEXAS
 FREEPORT, TEXAS ANNUAL FINANCIAL REPORT FOR THE YEAR ENDED SEPTEMBER 30, 2013 KENNEMER, MASTERS & LUNSFORD, LLC CERTIFIED PUBLIC ACCOUNTANTS 8 WEST WAY COURT LAKE JACKSON, TEXAS 77566 THIS PAGE LEFT BLANK
Clay County, Florida. County Audit Report September 30, 2014
 Clay County, Florida County Audit Report September 30, 2014 Clay County, Florida County Audit Report September 30, 2014 Table of Contents Section Financial Report 1 County-Wide 3 Clerk of the Circuit Court
COMPREHENSIVE ANNUAL FINANCIAL REPORT CITY OF ORMOND BEACH, FLORIDA FISCAL YEAR ENDED SEPTEMBER 30, 2018
 City of Ormond Beach Florida Photo by Sam West Comprehensive Annual Financial Report Fiscal Year Ended September 30, 2018 COMPREHENSIVE ANNUAL FINANCIAL REPORT FISCAL YEAR ENDED Prepared by: Finance Department
CITY OF LAKE ELMO, MINNESOTA COMPREHENSIVE ANNUAL FINANCIAL REPORT FOR THE FISCAL YEAR ENDED DECEMBER 31, 2016
 COMPREHENSIVE ANNUAL FINANCIAL REPORT FOR THE FISCAL YEAR ENDED DECEMBER 31, 2016 PREPARED BY: FINANCE DEPARTMENT CITY OF LAKE ELMO, MINNESOTA FINANCIAL STATEMENTS For the Fiscal Year Ended December 31,
County Service Area No. 40 Fire Services Annual Report For the Fiscal Year Ended June 30, 2010
 County Service Area No. 40 Fire Services Annual Report For the Fiscal Year Ended June 30, 2010 DONNA DUNK SONOMA COUNTY INTERIM AUDITOR-CONTROLLER TREASURER-TAX COLLECTOR County Service Area No. 40 Fire
City of Sioux Center, Iowa
 City of Sioux Center, Iowa growingebright Annual Financial Report for the fiscal year ended June 30, 2015 Prepared by: Finance Department Darryl Ten Pas, Finance Director CITY OF SIOUX CENTER, IOWA COMPREHENSIVE
City of Tombstone, Arizona Financial Statements. Year Ended June 30, 2016
 City of Tombstone, Arizona Financial Statements Year Ended June 30, 2016 CONTENTS Page INDEPENDENT AUDITOR S REPORT 1 MANAGEMENT S DISCUSSION AND ANALYSIS (MD&A) (Required Supplementary Information) 5
County Service Area No. 40 Fire Services Annual Report. For the Fiscal Year Ended June 30, 2015
 County Service Area No. 40 Fire Services Annual Report For the Fiscal Year Ended June 30, 2015 Table of Contents County Service Area No. 40 Fire Services Annual Report For the Fiscal Year Ended June 30,
INDEPENDENT AUDITOR S REPORT
 INDEPENDENT AUDITOR S REPORT To the Honorable Members of City Council City of Manassas, Virginia We have audited the accompanying financial statements of the governmental activities, the business-type
CAFR COMPREHENSIVE ANNUAL FINANCIAL REPORT
 C I T Y OF LY N WO OD FISCAL YEAR 2014-2015 CAFR COMPREHENSIVE ANNUAL FINANCIAL REPORT Y E A R E N DING J U N E 3 0, 2 0 1 5 Comprehensive Annual Financial Report City of Lynwood, California with Report
TOWN OF WINDSOR LOCKS, CONNECTICUT
 step forward TOWN OF WINDSOR LOCKS, CONNECTICUT FINANCIAL STATEMENTS TABLE OF CONTENTS Exhibit Independent Auditors Report 1-3 Management s Discussion and Analysis 4-11 Basic Financial Statements: Government-Wide
TOWN OF NEWPORT NORTH CAROLINA ANNUAL FINANCIAL REPORT
 TOWN OF NEWPORT NORTH CAROLINA ANNUAL FINANCIAL REPORT MAYOR Dennis Barber MAYOR PRO-TEM David Heath TOWN COUNCIL MEMBERS Chuck Shinn Jim McCoy Mark Eadie Danny Fornes TOWN MANAGER Angela Christian FINANCE
FOREST PRESERVE DISTRICT OF DuPAGE COUNTY, ILLINOIS COMPREHENSIVE ANNUAL FINANCIAL REPORT
 FOREST PRESERVE DISTRICT OF DuPAGE COUNTY, ILLINOIS COMPREHENSIVE ANNUAL FINANCIAL REPORT FOR THE FISCAL YEAR ENDED JUNE 30, 2015 FOREST PRESERVE DISTRICT OF DUPAGE COUNTY, ILLINOIS COMPREHENSIVE ANNUAL
NORTH PALOS FIRE PROTECTION DISTRICT, ILLINOIS ANNUAL FINANCIAL REPORT YEAR ENDED DECEMBER 31,2014
 NORTH PALOS FIRE PROTECTION DISTRICT, ILLINOIS ANNUAL FINANCIAL REPORT YEAR ENDED DECEMBER 31,2014 ANNUAL FINANCIAL REPORT YEAR ENDED DECEMBER 31,2014 CONTENTS INTRODUCTORY SECTION: Names and Titles of
ALHAMBRA ELEMENTARY SCHOOL DISTRICT NO. 68
 ALHAMBRA ELEMENTARY SCHOOL DISTRICT NO. 68 Comprehensive Annual Financial Report Fiscal Year Ended June 30, 2013 4510 North 37 th Avenue Phoenix, Arizona 85019 PHOENIX, ARIZONA COMPREHENSIVE ANNUAL FINANCIAL
WATAUGA COUNTY, NORTH CAROLINA FINANCIAL STATEMENTS FOR THE FISCAL YEAR ENDED JUNE 30, 2017
 WATAUGA COUNTY, NORTH CAROLINA FINANCIAL STATEMENTS FOR THE FISCAL YEAR ENDED JUNE 30, 2017 Misty D. Watson, CPA, PA PO Box 2122 Boone, NC 28607 WATAUGA COUNTY, NORTH CAROLINA BOARD OF COUNTY COMMISSIONERS
COUNTY OF OTTAWA, MICHIGAN FINANCIAL STATEMENTS YEAR ENDED DECEMBER 31, 2017
 COUNTY OF OTTAWA, MICHIGAN FINANCIAL STATEMENTS YEAR ENDED DECEMBER 31, 2017 Vredeveld Haefner LLC CPAs and Consultants Grand Haven Charter Township TABLE OF CONTENTS FINANCIAL SECTION PAGE Independent
TOWN OF NEW SHOREHAM, RHODE ISLAND FINANCIAL STATEMENTS YEAR ENDED JUNE 30, 2015
 FINANCIAL STATEMENTS YEAR ENDED JUNE 30, 2015 Hague, Sahady & Co., Certified Public Accountants P.C. Committed to Excellence Table of Contents Independent Auditors' Report... 1 Management s Discussion
CITY OF MINNETRISTA, MINNESOTA COMPREHENSIVE ANNUAL FINANCIAL REPORT YEAR ENDED DECEMBER 31, 2016
 , MINNESOTA COMPREHENSIVE ANNUAL FINANCIAL REPORT YEAR ENDED DECEMBER 31, 2016 PREPARED BY THE FINANCE DEPARTMENT OF THE CITY OF MINNETRISTA, MINNESOTA BRIAN GRIMM DIRECTOR OF FINANCE TABLE OF CONTENTS
CITY OF BANNING, CALIFORNIA FINANCIAL STATEMENTS FOR THE FISCAL YEAR ENDED JUNE 30, 2017
 , CALIFORNIA FINANCIAL STATEMENTS FOR THE FISCAL YEAR ENDED JUNE 30, 2017 THIS PAGE INTENTIONALLY LEFT BLANK FINANCIAL STATEMENTS FOR THE FISCAL YEAR ENDED JUNE 30, 2017 TABLE OF CONTENTS Page Number INDEPENDENT
Town of Harrisburg, North Carolina
 Basic Financial Statements and Accompanying Information For Fiscal Year Ended June 30, 2012 Town Council Members Timothy Hagler, Mayor Rick Russo, Mayor Pro Tem Chad Baucom Jeff Phillips Phil Cowherd Brian
City of Sachse, Texas As Prepared by The Finance Department
 COMPREHENSIVE ANNUAL FINANCIAL REPORT Fiscal Year Ended September 30, 2017 City of Sachse, Texas As Prepared by The Finance Department Sachse is a tranquil community welcoming the future while offering
CITY OF ALTURAS ALTURAS, CALIFORNIA BASIC FINANCIAL STATEMENTS
 CITY OF ALTURAS ALTURAS, CALIFORNIA BASIC FINANCIAL STATEMENTS JUNE 30, 2016 TABLE OF CONTENTS PAGE Independent Auditors Report 1-2 Management s Discussion and Analysis 3-10 Basic Financial Statements:
Village of Dobbs Ferry, New York
 Financial Statements and Supplementary Information Year Ended May 31, 2015 Table of Contents Page No. Independent Auditors' Report Management's Discussion and Analysis Basic Financial Statements Government-wide
SAN CARLOS PARK FIRE PROTECTION AND RESCUE SERVICE DISTRICT FORT MYERS, FLORIDA FINANCIAL REPORT FOR THE FISCAL YEAR ENDED SEPTEMBER 30, 2016
 SAN CARLOS PARK FIRE PROTECTION AND RESCUE SERVICE DISTRICT FORT MYERS, FLORIDA FINANCIAL REPORT FOR THE FISCAL YEAR ENDED SEPTEMBER 30, 2016 SAN CARLOS PARK FIRE PROTECTION AND RESCUE SERVICE DISTRICT
STATE OF MINNESOTA Office of the State Auditor
 STATE OF MINNESOTA Office of the State Auditor Patricia Anderson State Auditor TOWN OF LIVONIA SHERBURNE COUNTY, MINNESOTA YEAR ENDED DECEMBER 31, 2005 Description of the Office of the State Auditor The
BUCKEYE ELEMENTARY SCHOOL DISTRICT NO. 33
 BUCKEYE ELEMENTARY SCHOOL DISTRICT NO. 33 Comprehensive Annual Financial Report Fiscal Year Ended June 30, 2016 25555 West Durango Street Buckeye, Arizona 85326 BUCKEYE, ARIZONA COMPREHENSIVE ANNUAL FINANCIAL
TOWN OF NEW SHOREHAM, RHODE ISLAND REPORTING PACKAGE JUNE 30, 2014
 REPORTING PACKAGE JUNE 30, 2014 REPORTING PACKAGE JUNE 30, 2014 TABLE OF CONTENTS Section I: Annual Financial Report Section II: Single Audit Report Section III: Current Year Findings and Questioned Costs
TOWN OF EAST GREENWICH ANNUAL FINANCIAL REPORT FOR THE FISCAL YEAR ENDED JUNE 30, 2017
 TOWN OF EAST GREENWICH ANNUAL FINANCIAL REPORT FOR THE FISCAL YEAR ENDED JUNE 30, 2017 Town Hall East Greenwich, Rhode Island Built in 1804 Gayle Corrigan Town Manager Linda Dykeman Finance Director Prepared
Town of Wells, Maine
 Audited Financial Statements and Other Financial Information Town of Wells, Maine June 30, 2017 Proven Expertise and Integrity CONTENTS JUNE 30, 2017 PAGE INDEPENDENT AUDITORS' REPORT 1-3 MANAGEMENT S
ecreation Comprehensive Annual For the Fiscal Year Ended December 31, 2007
 Parks ecreation City of Edina, Minnesota Comprehensive Annual Financial report For the Fiscal Year Ended December 31, 2007 Comprehensive Annual Financial Report For the fiscal year ended December 31, 2007
Town of Wells, Maine
 Audited Financial Statements and Other Financial Information Town of Wells, Maine June 30, 2018 Proven Expertise and Integrity CONTENTS PAGE INDEPENDENT AUDITORS' REPORT 1-3 MANAGEMENT S DISCUSSION AND
TOWN OF PLAINFIELD, CONNECTICUT
 FINANCIAL REPORT JUNE 30, 2009 McGladrey & Pullen, LLP is a member firm of RSM International, an affiliation of separate and independent legal entities. COMPREHENSIVE ANNUAL FINANCIAL REPORT TABLE OF
VILLAGE OF PALMETTO BAY VILLAGE OF PARKS
 VILLAGE OF PALMETTO BAY VILLAGE OF PARKS COMPREHENSIVE ANNUAL FINANCIAL REPORT FOR THE FISCAL YEAR ENDED SEPTEMBER 30, 2013 VILLAGE OF PALMETTO BAY, FLORIDA TABLE OF CONTENTS INTRODUCTORY SECTION Letter
ELKO COUNTY, NEVADA JUNE 30,2010
 , NEVADA JUNE 30,2010 JUNE 30,2010 TABLE OF CONTENTS Page No. FINANCIAL SECTION Independent Auditor's Report: On Financial Statements and Supplementary Data 1 Management's Discussion and Analysis (Required
VILLAGE OF GOLF, FLORIDA COMPREHENSIVE ANNUAL FINANCIAL REPORT FOR THE FISCAL YEAR ENDED SEPTEMBER 30, 2014
 VILLAGE OF GOLF, FLORIDA COMPREHENSIVE ANNUAL FINANCIAL REPORT FOR THE FISCAL YEAR ENDED SEPTEMBER 30, 2014 Prepared by: Finance Department VILLAGE OF GOLF, FLORIDA TABLE OF CONTENTS INTRODUCTORY SECTION
CITY OF BANNING, CALIFORNIA FINANCIAL STATEMENTS FOR THE FISCAL YEAR ENDED JUNE 30, 2016
 , CALIFORNIA FINANCIAL STATEMENTS FOR THE FISCAL YEAR ENDED JUNE 30, 2016 , CALIFORNIA FINANCIAL STATEMENTS FOR THE FISCAL YEAR ENDED JUNE 30, 2016 THIS PAGE INTENTIONALLY LEFT BLANK FINANCIAL STATEMENTS
HEBER-OVERGAARD UNIFIED SCHOOL DISTRICT NO. 6
 HEBER-OVERGAARD UNIFIED SCHOOL DISTRICT NO. 6 Comprehensive Annual Financial Report Fiscal Year Ended June 30, 2012 3375 Buckskin Canyon Road P.O. Box 547 Heber, Arizona 85928 HEBER, ARIZONA COMPREHENSIVE
CITY OF YOAKUM, TEXAS
 CITY OF YOAKUM, TEXAS ANNUAL FINANCIAL REPORT For the year ended September 30, 2015 CITY OF YOAKUM, TEXAS ANNUAL FINANCIAL REPORT For the year ended September 30, 2015 TABLE OF CONTENTS FINANCIAL SECTION
VILLAGE OF ISLAND LAKE, ILLINOIS
 G R A 44 N. Walkup Ave. Crystal Lake, IL 60014 T: 815-459-0700 GRA-CPA.COM Accounting Auditing Consulting VILLAGE OF ISLAND LAKE, ILLINOIS ANNUAL FINANCIAL REPORT WITH SUPPLEMENTARY INFORMATION YEAR ENDED
CITY OF HIALEAH, FLORIDA COMPREHENSIVE ANNUAL FINANCIAL REPORT FISCAL YEAR ENDED SEPTEMBER 30, 2017
 COMPREHENSIVE ANNUAL FINANCIAL REPORT FISCAL YEAR ENDED SEPTEMBER 30, 2017 Prepared by: Finance Department TABLE OF CONTENTS PAGE I. INTRODUCTORY SECTION (UNAUDITED) Letter of Transmittal i-iv Certificate
City of Ocoee, Florida COMPREHENSIVE ANNUAL FINANCIAL REPORT. For The Year Ended September 30, 2016
 City of Ocoee, Florida COMPREHENSIVE ANNUAL FINANCIAL REPORT For The Year Ended September 30, 2016 Prepared by: City of Ocoee Finance Department This page intentionally left blank. INTRODUCTORY SECTION
Town of Ramapo, New York
 Town of Ramapo, New York BASIC FINANCIAL STATEMENTS AND SUPPLEMENTARY INFORMATION FOR THE YEAR ENDED DECEMBER 31, 2015 TOWN OF RAMAPO, NEW YORK Table of Contents TABLE OF CONTENTS 2 INDEPENDENT AUDITOR
CITY OF OAK GROVE, KENTUCKY. Financial Statements and Supplementary Information. For the Year Ended June 30, 2018
 Financial Statements and Supplementary Information For the Year Ended June 30, 2018 Table of Contents Independent Auditor s Report 1-2 Management s Discussion and Analysis 3-8 Basic Financial Statements:
COMPREHENSIVE ANNUAL FINANCIAL REPORT. City of Lucas, Texas
 COMPREHENSIVE ANNUAL FINANCIAL REPORT City of Lucas, Texas Home-Rule, Council-Manager Form of Government Interim City Manager Dan Savage Finance Manager Elizabeth Exum COMPREHENSIVE ANNUAL FINANCIAL REPORT
CITY OF CHILTON, WISCONSIN ANNUAL FINANCIAL REPORT DECEMBER 31, 2012
 ANNUAL FINANCIAL REPORT DECEMBER 31, 2012 December 31, 2012 Table of Contents Page No. INDEPENDENT AUDITORS REPORT 1-2 MANAGEMENT S DISCUSSION AND ANALYSIS 3-8 GOVERNMENT-WIDE FINANCIAL STATEMENTS Statement
BASIC FINANCIAL STATEMENTS, MANAGEMENT DISCUSSION AND ANALYSIS, AND REQUIRED SUPPLEMENTAL INFORMATION
 BASIC FINANCIAL STATEMENTS, MANAGEMENT DISCUSSION AND ANALYSIS, AND REQUIRED SUPPLEMENTAL INFORMATION C O N T E N T S PAGE Independent Auditor's Report........................................... Management
VILLAGE OF PALMETTO BAY, FLORIDA TABLE OF CONTENTS
 VILLAGE OF PALMETTO BAY, FLORIDA TABLE OF CONTENTS INTRODUCTORY SECTION Letter of Transmittal... i - iv Elected and Appointed Officials... v Organization Chart... vi Certificate of Achievement for Excellence
VILLAGE OF TEQUESTA, FLORIDA 2017 COMPREHENSIVE ANNUAL FINANCIAL REPORT
 2017 COMPREHENSIVE ANNUAL FINANCIAL REPORT FISCAL YEAR ENDED SEPTEMBER 30, 2017 VILLAGE OF TEQUESTA COUNCIL MEMBERS 2017 From left to right: Council Member Thomas Paterno, Council Member Vince Arena, Mayor