Port Freeport Freeport, Texas Comprehensive Annual Financial Report For the Fiscal Years Ended September 30, 2014 and 2013
|
|
|
- Estella Phelps
- 5 years ago
- Views:
Transcription
1

2 Port Freeport Freeport, Texas Comprehensive Annual Financial Report For the Fiscal Years Ended September 30, 2014 and 2013 Prepared by: Jeffrey L. Strader, CPA Chief Financial Officer Mary Campus, Controller
3 Freeport, Texas Comprehensive Annual Financial Report Fiscal Years Ended September 30, 2014 and 2013 Table of Contents Page Table Introductory Section Certificate of Achievement for Excellence in Financial Reporting... 4 State of the Port Letter by Executive Port Director/CEO Glenn A. Carlson 6-7 Directory of Officials Organizational Chart Letter of Transmittal Financial Section Independent Auditor's Report Management s Discussion and Analysis Basic Financial Statements: Statements of Net Position Statements of Revenues, Expenses, and Changes in Net Position Statements of Cash Flows Notes to the Financial Statements Statistical Section Ten Year Cargo Quantities Analysis Container Traffic Statistics Cargo Traffic Statistics Net Position by Component Summary of Revenues, Expenses and Changes in Net Position Property Tax Rates - Direct and Overlapping Governments Valuation, Exemptions and General Obligation Debt Taxable and Estimated Valuation of Properties Located Within the Port Taxing District Property Tax Levies and Collections Principal Taxpayers Computation of Legal Debt Margin Ratio of Outstanding Debt by Type Ratio of Net General Bonded Debt to Taxable Value and to Net Bonded Debt per Capita Computation of Direct and Overlapping Bonded Debt of General Obligation Bond Issues Pledged Revenue Coverage Unlimited Tax Refunding Bonds, Series Senior Lien Revenue Refunding Bonds, Series 2013A Senior Lien Revenue Notes, Series 2013B Note Payable Summary of Annual Cash Requirements on Debt Outstanding Miscellaneous Statistical Data History of the Port Map of Current Facilities Map of Port Freeport and Vicinity
4 Freeport, Texas Comprehensive Annual Financial Report Fiscal Years Ended September 30, 2014 and 2013 Table of Contents (Continued) Page Table Federal Award Section Report on Internal Control over Financial Reporting and on Compliance and Other Matters Based on an Audit of Financial Statements Performed in Accordance with Government Auditing Standards Report on Compliance with Requirements That Would Have a Direct and Material Effect on Each Major Program and on Internal Control over Compliance in Accordance with OMB Circular A Schedule of Findings and Questioned Costs 94 Schedule of Status of Prior Findings 95 Corrective Action Plan 96 Schedule of Expenditures of Federal Awards 97 Notes on Accounting Policies for Federal Awards
5 - 4 -
6 - 5 -
 233-2667 1 (800) 362-5743 FAX: (979) 233-5625 STATE OF THE PORT 2015 Port Freeport enhances infrastructure and adds world-leading services to meet burgeoning demands while")
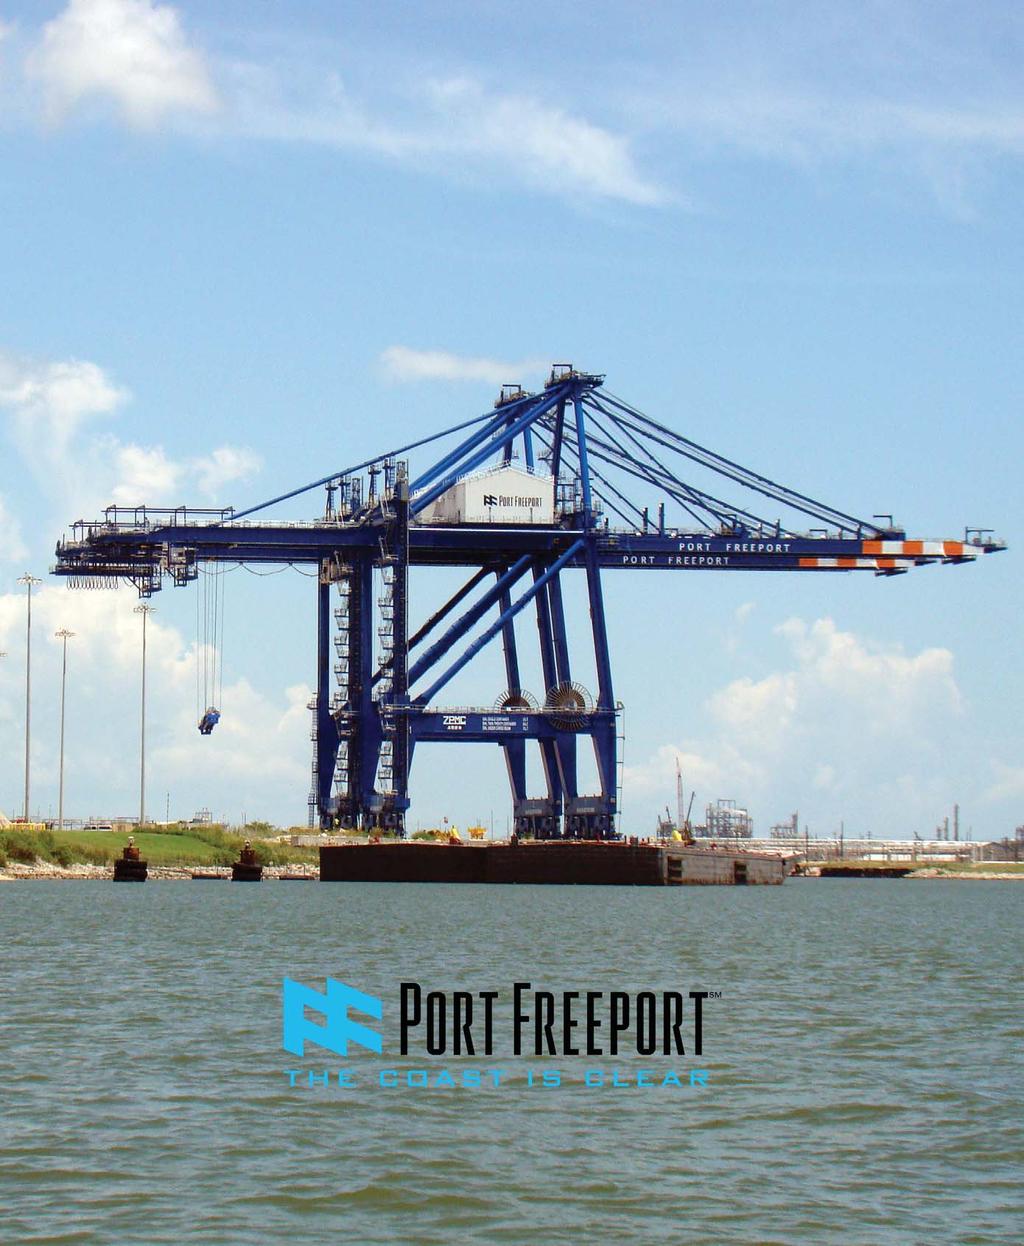
7 200 W. SECOND ST., 3 RD FL., FREEPORT, TX (979) (800) FAX: (979) STATE OF THE PORT 2015 Port Freeport enhances infrastructure and adds world-leading services to meet burgeoning demands while increasing vital role in area s economy From advancement of a deeper wide channel and arrival of two post-panamax cranes to new services by the world s leading container line and No. 1 roll-on/roll-off carrier, Port Freeport continues to move forward as a vital economic force in Brazoria County and beyond. With more than $30 billion in capital investments taking place in and around Brazoria County, Port Freeport is ideally positioned to continue its dynamic growth, meeting demands of today s extensive petrochemical facility construction activities, as well as enhancing its capabilities as a gateway for cargo activity associated with sustained operations for generations to come. By becoming an authorized project under the Water Resources Reform and Development Act of 2014, signed into law in June, the endeavor to bring the depth of Port Freeport s channel from its current 45 feet to as many as 55 feet moves a big step closer to realization following completion the previous year of a favorable chief s report from the U.S. Army Corps of Engineers. The present focus on ensuring the channel s approved width of 400 feet throughout its length is critical to facilitating the arrival and departure of many of the industry s largest oceangoing vessels. When the two 100-gauge ship-to-shore container cranes arrived in July at its new Berth 7, Port Freeport embarked upon a vanguard era of furnishing greater cost savings to the area s burgeoning industry. Savings were realized by the port as well, as it shaved millions of dollars per-unit costs and significantly cut delivery time by assuming assignment of cranes already under construction at Shanghai Zhenhua Heavy Industries Co. Ltd., the world s largest manufacturer of cranes and steel structures. With the cranes in place, Port Freeport quickly attracted new services from global leaders. In October, Mediterranean Shipping Co. S.A., the world s largest containership carrier, under an agreement with Chiquita Brands International Inc., began weekly service to and from Port Freeport throughout Central America, with worldwide relay links. And, as 2015 dawned, the world s top operator of roll-on/roll-off vessels, Höegh Autoliners, inked a 10-year pact to serve Port Freeport. Another major partnership for Port Freeport is the one recently forged with Mammoet USA South Inc., a unit of the world s leading industrial lifting expert. Mammoet is moving project cargo units weighing as many as 675 tons for the region s new and expanding petrochemical plants, which also are creating high demand for aggregate used in building the facilities, providing laydown areas and furnishing parking lots for thousands of construction workers. More than one million tons of aggregate moved through Port Freeport in 2014, and there is no sign of these volumes letting up. PORT COMMISSION JOHN HOSS, CHAIRMAN; PAUL KRESTA, VICE CHAIRMAN; SHANE PIRTLE, SECRETARY; RAVI K. SINGHANIA, ASST. SECRETARY; BILL TERRY, COMMISSIONER; THOMAS S. PERRYMAN, COMMISSIONER; GLENN A. CARLSON, EXECUTIVE PORT DIRECTOR/CEO - 6 -
8 Port Freeport s recently completed master plan establishes a firm foundation for the port s further expansion over the course of the next two decades, including building of additional berths, warehouse facilities proximate to the main terminal, a state-of-the-industry gate complex and other key enhancements that already are under way. As Port Freeport continues its longstanding tradition of being a dedicated contributor to the community, conscientious steward of the environment and steadfast promoter of a safe and secure workplace, it s time to hold onto your hardhats and, with our other partners in progress, reap the benefits that are ours to share with Brazoria County for decades to come. Sincerely, Glenn A. Carlson Executive Port Director/CEO - 7 -


9 Directory of Officials Port Commission John Hoss Chairman Paul Kresta Vice Chairman Shane Pirtle Secretary Ravi K. Singhania Assistant Secretary Bill Terry Commissioner Thomas Perryman Commissioner - 8 -


10 Directory of Officials Executive Staff Glenn A. Carlson Executive Port Director/CEO Jeff Strader Chief Financial Officer Al Durel Mary Campus Mike Wilson Director of Operations Controller Director of Economic Development Jason Hull Director of Engineering Chris Hogan Director of Protective Services - 9 -
11 - 10 -
12 200 W. SECOND ST., 3 RD FL., FREEPORT, TX (979) (800) FAX: (979) LETTER OF TRANSMITTAL January 30, 2015 MEMBERS OF THE PORT COMMISSION FREEPORT, TEXAS Gentlemen: The Comprehensive Annual Financial Report for Port Freeport (Port) for the year ended September 30, 2014 is hereby submitted for your review. Responsibility for both the accuracy of the information contained herein and the completeness and fairness of the presentation, including all disclosures, rests with the administration of the Port. To the best of our knowledge and belief, the enclosed data is accurate in all material aspects and is reported in a manner designed to fairly present the financial position and results of operations of the Port. All disclosures necessary to enable the reader to gain an understanding of the Port's financial activities have been included. The Port has prepared the Comprehensive Annual Financial Report following the guidelines recommended by the Government Accounting Standards Board (GASB). The report is presented in three sections: GENERAL Introductory Section includes the title page, table of contents, letter of transmittal and Certificate of Achievement. It is designed to introduce the reader to the report and present basic background information about the Port as a whole, as well as highlights of the year's operations. Financial Section - includes the auditor s report, management s discussion and analysis, the Port's basic financial statements and notes and required supplementary information. Statistical Section - includes tables that cover periods of ten years relating to the operational and fiscal activity of the Port as well as historical growth trends of the Port. This section also includes a brief history of the Port as well as geographical information. Brazoria County is one of Texas' most fertile agricultural areas, one of the nation's most successful commercial fishing ports, one of the region s more prolific fuel and mineral areas, and in recent decades, the location of one of the world's largest chemical manufacturing complexes. The primary economic bases of the county include chemical manufacturing, petroleum processing, offshore production maintenance services, diversified manufacturing, biochemical and electronic industries, commercial fishing and agriculture. In addition, the area's deep-water channel and port facilities, sports fishing services and tourism are major components of the county's economic base. Since 2004 the northern portion of the county has seen extensive residential, retail and healthcare development with no evidence of slowing in the near term. The Brazoria County Index of Leading Economic indicators increased percent from August 2013 to August The Leading Economic Index, which is designed to forecast the economic performance of the county over the next three to six-months, has been above the moving average for the last twelve months. This indicates that the county is likely entering into or is currently experiencing a period of economic growth. (Brazosport College Economic Forecasting Center, 2014). PORT COMMISSION JOHN HOSS, CHAIRMAN; PAUL KRESTA, VICE CHAIRMAN; SHANE PIRTLE, SECRETARY; RAVI K. SINGHANIA, ASST. SECRETARY; BILL TERRY, COMMISSIONER; THOMAS S. PERRYMAN, COMMISSIONER; GLENN A. CARLSON, EXECUTIVE PORT DIRECTOR/CEO
13 Port Freeport is a political subdivision of the State of Texas encompassing approximately 85 percent of Brazoria County, Texas. The Port exists under the provisions of Article XVI, Section 59 of the Texas State Constitution and related sections of the Revised Civil Statutes of the State of Texas and all amendments thereto. In 2007, the State of Texas passed House Bill 542, which changed the legal name of the Brazos River Harbor Navigation District to Port Freeport and the name of the governing body of the Brazos River Harbor Navigation District to Port Commission and the name of each member of the Port Commission to Port Commissioner. The Port, being a political subdivision of the State of Texas, is a separate and distinct entity and operates independently with its own Port Commission as its governing body. The Port Commission is comprised of six members. Five positions represent a specific geographic area, and one position is at-large. Each Port Commissioner serves a term of six years. The six-year terms are staggered with an election held each uneven numbered year for two commissioner positions. The Executive Port Director and staff manage the operations of the Port under the auspices of the Port s Commission. FINANCIAL The financial statements are prepared using the single enterprise fund model in accordance with GASB 34. The financial reporting entity includes the enterprise fund of the primary government, Port Freeport, as well as all of its component units. Component units are legally separate entities for which the primary government is financially accountable. The Brazos Harbor Industrial Development Corporation (IDC) is a component unit of the Port; however, it is discretely presented and has no assets, liabilities, equities or financial transactions. Financial information for the IDC is limited to the disclosure of revenue bonds issued on behalf of others in the notes to the financial statements. Discussion and analysis of the financial statements and the Port s financial performance may be found in Management Discussion and Analysis at the beginning of the Financial Section. Internal Controls. The administration of the Port is responsible for establishing and maintaining an internal control structure designed to ensure that the assets of the Port are protected from loss, theft or misuse and to ensure that adequate accounting data is compiled to allow for the preparation of financial statements in conformance with generally accepted governmental accounting principles. The internal control structure is designed to provide reasonable, but not absolute, assurance that these objectives are met. The concept of reasonable assurance recognizes that: 1) the cost of a control should not exceed the benefits likely to be derived, and 2) the valuation of costs and benefits requires estimates and judgments by administration. The Port has adopted practices and procedures measures related to fraud prevention and reporting. The Port Commission adopts an annual budget in August for the next fiscal year beginning October 1. Management periodically presents statements comparing actual with budget, explaining significant variances. OTHER FINANCIAL INFORMATION The Port has financial policies which are designed to provide parameters for managing the financial performance of the Port. Two of the Port s more significant financial policies are the cash management and risk management policies. Cash Management. The Port's investment policy complies with the Public Funds Investment Act and is designed to minimize any risk of loss of principal, while maintaining a competitive yield on the funds it has available for investment. Accordingly, Port cash temporarily idle during the year was invested in money market funds, certificates of deposit and guaranteed governmental securities as authorized by the policy. In addition, all deposits were and continue to be either insured by federal depository insurance or otherwise collateralized. All collateral on deposits in excess of federal depository insurance amounts are held by the Port or by the financial institution's trust department or a Federal Reserve Bank in the Port's name. Risk Management. The Port's schedule of insurance provides for comprehensive coverage of all areas of risk. The Port has engaged a consultant to assist with risk management issues. Independent Auditor. The state statutes require an annual audit by independent certified public accountants. Kennemer, Masters & Lunsford, LLC, the independent certified public accountants selected by the Port Commission, audited the basic financial statements for the year ended September 30,
14 Awards. The Government Finance Officers Association of the United States and Canada (GFOA) awarded a Certificate of Achievement for excellence in financial reporting to the Port for its Comprehensive Annual Financial Report for the Fiscal Year ended September 30, The Certificate of Achievement is a prestigious national award that recognizes conformance with the highest standards for preparation of state and local government financial reports. In order to be awarded a Certificate of Achievement, a governmental unit must publish an easily readable and efficiently organized comprehensive annual financial report, whose contents conform to program standards. Such comprehensive annual financial reports must satisfy both generally accepted accounting principles and applicable legal requirements. A Certificate of Achievement is valid for a period of one year only. The Port has received this prestigious award for the last twenty-three consecutive fiscal years. We believe our current report continues to conform to the Certificate of Achievement program requirements, and we are submitting it to the GFOA to determine its eligibility for another certificate. MAJOR INITIATIVES Following the completion of the first phase of the Velasco Terminal Development project, the current year saw further improvements to that infrastructure in the form of two (2) 100% electric quayside ship to shore gantry cranes and supporting berth improvements plus the commencement of concrete paving on the 20 acres of backland stabilized during phase 1 of the project. As a result of these further improvements, the Port was able to attract a major steamship line as well as retain a long standing customer both of which required improved terminal operating capabilities and increased terminal capacity. With the addition of this steamship line, the Port now has complete global access for customers utilizing a containerized form of shipment. Initiated during 2013, the Port continued with its master plan development effort producing and presenting a draft plan to the Board of Commissioners late in the fiscal year. This draft plan outlines, in a phased approach, the long-term development and reconfiguration of the Port s facilities which had been deemed necessary to capture identified addressable market opportunities as well as maintain and grow existing lines of business. Included in the plan is the full build out of Velasco Terminal as well as development of laydown, warehousing and rail facilities on currently undeveloped tracks of land owned by the Port. The Port continues in a role acting as the applicant and fiduciary agent for two Port Security Grants totaling $ 1 million funded by the Department of Homeland Security. These funds will be applied to security improvements. Security grant funding to Port Freeport since 2001 has totaled $ 20 million. Future. With a favorable outcome for both the initial reconnaissance and subsequent feasibility studies, the United State Army Corp of Engineers (USCOE) issued its Chief s Report early in 2013 to the United States Congress recommending the deepening of the Freeport Harbor Channel. Acting on this recommendation, Congress included in the Water Resources Reform and Development Act (WRRDA) of 2014 authorization to move forward with the proposed project funding initial construction planning and design work. During 2014 it was determined that additional improvements, beyond those proposed and authorized in WRRDA, were necessary in order to accommodate the safe navigation of the feasibility study s design vessel. Based on these findings, the Port is actively engaged with the USCOE to develop a multi stage process to adjust for these additional requirements which include bend easing and channel width increases. It is anticipated that the initial phase which will address safe navigation at the current channel depth will cost approximately $ 130 million and will be shared 75%/25% between the Federal Government and Port. Additional phases will provide for the ultimate deepening of the channel to 2014 WRRDA authorized depths. Permitting and detailed design work is currently underway for the further build out of Velasco Terminal, as recommended in the draft Master Plan, including the extension of Berth 7, construction of Berth 8, construction of a RoRo ramp at the end of Berth 8, purchase of additional ship to shore gantry cranes and development of backland to support berth operations. The permit request submission is scheduled for the spring of 2015 with an anticipated approval the following year at about the same time. Costs associated with this further build out are $ 180 million and are scheduled out over the next 5 years. As a result of securing additional lines of business during 2014, the Port is undertaking certain improvements to existing facilities and development of new facilities including the creation of paved open storage and rail sidings to accommodate the import and export for passenger vehicles and large dimensional construction equipment. Costs associated with these efforts are anticipated to run approximately $ 15 million
15 These initiatives as well as others are outlined further in Management s Discussion and Analysis in the Financial Section. ACKNOWLEDGEMENTS The preparation of this Comprehensive Annual Report could not have been accomplished without the aid of the Controller and other Finance Department staff members. These individuals have my sincere appreciation for their efficient and dedicated support in the preparation of this report. Thanks and appreciation also is extended to the Executive Port Director and the Commissioners for their guidance, insight and support throughout the year. Respectfully Submitted, Jeffrey L. Strader, CPA Chief Financial Officer Port Freeport
16 - 15 -
17 Kennemer, Masters & Lunsford CERTIFIED PUBLIC ACCOUNTANTS Limited Liability Company Lake Jackson Office: El Campo Office: Houston Office: 8 West Way Court 201 W. Webb Richmond Ave., Suite 135 Lake Jackson, Texas El Campo, Texas Houston, Texas To the Port Commissioners Port Freeport Freeport, Texas Report on the Financial Statements Independent Auditor s Report We have audited the accompanying statements of net position of Port Freeport (the Port ) as of and for the year ended September 30, 2014 and 2013, and the related statements of revenues, expenses and changes in net position and cash flows and the related notes to the financial statements, which collectively comprise the Port s basic financial statements as listed in the table of contents. Management s Responsibility for the Financial Statements Management is responsible for the preparation and fair presentation of these financial statements in accordance with accounting principles generally accepted in the United States of America; this includes the design, implementation, and maintenance of internal control relevant to the preparation and fair presentation of financial statements that are free from material misstatement, whether due to fraud or error. Auditor s Responsibility Our responsibility is to express opinions on these financial statements based on our audit. We conducted our audit in accordance with auditing standards generally accepted in the United States of America and the standards applicable to financial audits contained in Government Auditing Standards, issued by the Comptroller General of the United States. Those standards require that we plan and perform the audit to obtain reasonable assurance about whether the financial statements are free from material misstatement. An audit involves performing procedures to obtain audit evidence about the amounts and disclosures in the financial statements. The procedures selected depend on the auditor s judgment, including the assessment of the risks of material misstatement of the financial statements, whether due to fraud or error. In making those risk assessments, the auditor considers internal control relevant to the entity s preparation and fair presentation of the financial statements in order to design audit procedures that are appropriate in the circumstances, but not for the purpose of expressing an opinion on the effectiveness of the entity s internal control. Accordingly, we express no such opinion. An audit also includes evaluating the appropriateness of accounting policies used and the reasonableness of significant accounting estimates made by management, as well as evaluating the overall presentation of the financial statements. We believe that the audit evidence we have obtained is sufficient and appropriate to provide a basis for our audit opinions. Opinions In our opinion, the financial statements referred to above present fairly, in all material respects, the respective financial position of Port Freeport, as of September 30, 2014 and 2013, and the respective changes in financial position, and, where applicable, cash flows thereof for years then ended in accordance with accounting principles generally accepted in the United States of America. www. kmandl.com kmkw@kmandl.com Members: American Institute of Certified Public Accountants, Texas Society of Certified Public Accountants, Partnering for CPA Practice Success
18 Port Commissioners Port Freeport Freeport, Texas Page 2 Other Matters Required Supplementary Information Accounting principles generally accepted in the United States of America require that the management s discussion and analysis on pages 18 through 28 be presented to supplement the basic financial statements. Such information, although not a part of the basic financial statements, is required by the Governmental Accounting Standards Board, who considers it to be an essential part of financial reporting for placing the basic financial statements in an appropriate operational, economic, or historical context. We have applied certain limited procedures to the required supplementary information in accordance with auditing standards generally accepted in the United States of America, which consisted of inquiries of management about the methods of preparing the information and comparing the information for consistency with management s responses to our inquiries, the basic financial statements, and other knowledge we obtained during our audit of the basic financial statements. We do not express an opinion or provide any assurance on the information because the limited procedures do not provide us with sufficient evidence to express an opinion or provide any assurance. Other Information Our audit was conducted for the purpose of forming opinions on the financial statements that collectively comprise the Port s basic financial statements. The introductory and statistical sections listed in the table of contents are presented for purposes of additional analysis and are not a required part of the basic financial statements. The schedule of expenditures of federal awards is presented for purposes of additional analysis as required by U.S. Office of Management and Budget Circular A-133, Audits of States, Local Governments, and Non-Profit Organizations, and is also not a required part of the basic financial statements. The schedule of expenditures of federal awards is the responsibility of management and was derived from and relate directly to the underlying accounting and other records used to prepare the basic financial statements. Such information has been subjected to the auditing procedures applied in the audit of the basic financial statements and certain additional procedures, including comparing and reconciling such information directly to the underlying accounting and other records used to prepare the basic financial statements or to the basic financial statements themselves, and other additional procedures in accordance with auditing standards generally accepted in the United States of America. In our opinion, the schedule of expenditures of federal awards, is fairly stated in all material respects in relation to the basic financial statements as a whole. The introductory and statistical sections have not been subjected to the auditing procedures applied in the audit of the basic financial statements, and accordingly, we do not express an opinion or provide any assurance on them. Other Reporting Required by Government Auditing Standards In accordance with Government Auditing Standards, we have also issued our report dated January 30, 2015, on our consideration of the Port s internal control over financial reporting and on our tests of its compliance with certain provisions of laws, regulations, contracts, and grant agreements and other matters. The purpose of that report is to describe the scope of our testing of internal control over financial reporting and compliance and the results of that testing, and not to provide an opinion on internal control over financial reporting or on compliance. That report is an integral part of an audit performed in accordance with Government Auditing Standards in considering the Port s internal control over financial reporting and compliance. Lake Jackson, Texas January 30,
19 Management Discussion and Analysis The management of Port Freeport (Port) offers readers this narrative overview and analysis of the financial activities of the fiscal years ended September 30, 2014, 2013 and This section is intended to enhance the clarity and usefulness of the financial statements for citizens, oversight bodies, investors and creditors. The Port s financial activities are being reported under the requirements of Governmental Accounting Standards Board (GASB) Statement 34 as a single enterprise fund. Financial Highlights September 30, 2014 Total Net Position increased by $ 5.8 million. Total Assets increased by $ 5.7 million primarily due to an increase in property, plant and equipment of $ 15.2 million as a result of purchase of two ship to shore container cranes and other equipment and an increase in cash and cash equivalents of $ 5.3 million offset by a decrease in investments of $ 14.5 million. Total Liabilities were consistent with the previous year. Change in Net Position was lower than the previous year primarily due to the receipt of fewer federal grant funds. September 30, 2013 Total Net Position increased by $ 9.4 million. Total Assets increased by $ 24.4 million primarily due to an increase in cash and cash equivalents of $ 9.8 million and an increase in investments of $ 6.9 million both primarily as a result of the receipt of bond proceeds and a settlement related to the Velasco Terminal, Berth 7. Property, plant and equipment increased by $ 6.9 million, net of depreciation due to the addition of land improvements at Velasco Terminal. Total Liabilities increased by $ 14.9 million due to an increase in net revenue bonds outstanding. Change in Net Position was improved over the previous year primarily due to the receipt of a settlement related to Velasco Terminal. September 30, 2012 Total Net Position increased by $ 2.0 million. Total Assets increased by $ 1.5 million primarily due to an increase in investments of $ 7.3 million as a result of the receipt of insurance claims related to a construction project which was offset by a decrease in other receivables of $ 3.7 million. The remaining decrease relates to net decreases in other assets during the year. Total Liabilities decreased by $ 500 thousand primarily due to a decrease in bonds payable. Change in Net Position was lower than the previous year due to costs incurred on the Berth 7 dock repair. Overview of Financial Statements This discussion and analysis serves as an introduction to the Port s basic financial statements. These statements include a statement of net position that is a statement of assets, deferred outflows of resources, liabilities, deferred inflows of resources and net position; a statement of revenues, expenses and changes in net position that reports all revenues and expenses during the year and their net; a statement of cash flows that reports sources and uses of cash; and notes to the financial statements that explain some of the information in the financial statements and provide more detail. The basic financial statements are prepared on the accrual basis, whereby revenues are recognized when earned, and expenses are recognized when incurred, regardless of when cash is received or paid
20 Management Discussion and Analysis Financial Analysis Over time, increases or decreases in the Port s net position may serve as a useful indicator of whether the Port s financial position is improving or deteriorating. For the years ended September 30, 2014, 2013 and 2012, the Port s net position increased by 3 percent, 5 percent and 1 percent to $ 195 million, $ 189 million and $ 180 million, respectively. Net investment in capital assets that includes land, buildings, machinery and equipment at September 30, 2014, 2013 and 2012, was $ million, $ million and $ million, or 77 percent, 70 percent and 79 percent of total net position, respectively. These net capital assets are recorded at historical cost and are net of depreciation and related debt. The remaining net position, at September 30, 2014, 2013 and 2012, are divided into three categories: restricted for debt service, $ 2.8 million, $ 2.8 million and $ 2.5 million; restricted for capital projects, $ 16 thousand, $ 16 thousand and $ 17 thousand; and unrestricted net position, $ 42.7 million, $ 53.9 million and $ 35.1 million, respectively. Restrictions do not significantly affect the availability of resources for future use. The Port s total net position increased by $ 5.8 million in 2014, $ 9.4 million in 2013 and $ 2.0 million in These increases were provided by operating income (including depreciation) of $ 2.5 million, $ 1.1 million and $ 2.5 million; $ 2.3 million, $ 1.8 million and $ 3.2 million in non-operating net revenues including ad valorem taxes of $ 4.7 million, $ 5.2 million and $ 5.0 million and capital contributions of $ 1.0 million, $ 4.7 million and $ 2.3 million, respectively. In addition there were net extraordinary revenues (expenses) of $ 1.8 million in 2013, $ (5.9) million in Condensed Statements of Net Position (in thousands) (Restated) Current and other assets $ 57,518 $ 67,073 $ 49,599 Capital assets, net of depreciation 206, , ,494 Total assets 264, , ,093 Deferred outflows of resources refunding costs Total deferred outflows of resources Current liabilities 16,002 26,210 14,658 Non-current liabilities 53,225 43,167 39,763 Total liabilities 69,227 69,377 54,421 Deferred inflows of resources Total deferred inflows of resources Net investment in capital assets 149, , ,113 Restricted for debt service 2,763 2,768 2,471 Restricted for capital projects Unrestricted 42,729 53,882 35,071 Total net position $ 194,905 $ 189,090 $ 179,
21 Management Discussion and Analysis Comparative Statement of Revenues, Expenses and Changes in Net Position (in thousands) (Restated) Operating revenues: Harbor operations $ 9,852 $ 8,615 $ 8,598 Lease income 6,955 6,344 5,945 Miscellaneous Total operating revenues 16,996 14,994 14,771 Operating expenses: Payroll and related 4,006 3,858 3,607 Professional services 1,433 1,634 1,536 Supplies and other 2,489 2,317 2,056 Utilities, maintenance and repairs 1,255 1,553 1,119 Depreciation 5,310 4,502 3,998 Total operating expenses 14,493 13,864 12,316 Operating income 2,503 1,130 2,455 Non-operating revenues (expenses): Ad valorem tax, net of collection expenses $ 4,672 $ 5,246 $ 5,017 Investment income 265 ( 59 ) 114 Gain on sale of capital assets and other 18 Debt interest and fees ( 1,285 ) ( 2,164 ) ( 2,034 ) Other ( 1,382 ) ( 1,189 ) 122 Total non-operating revenues (expenses) 2,270 1,852 3,219 Income before capital contributions and extraordinary revenues (expenses) 4,773 2,982 5,674 Capital contributions 1,042 4,683 2,290 Extraordinary revenues (expenses) 1,753 ( 5,925) Change in net position 5,815 9,418 2,039 Total net position beginning (restated) 189, , ,633 Total net position ending $ 194,905 $ 189,090 $ 179,672 Total revenues, including capital contributions, have been relatively consistent over the past three years at $ 23.0 million in 2014, $ 24.9 million in 2013 and $ 21.9 million in Operating revenues increased by $ 2.0 million in 2014 to $ 17.0 million, increased $ 223 thousand in 2013 to $ 15.0 million and decreased $ 815 thousand to $ 14.8 million in Tonnage overall increased 30 percent to 2.6 million tons in 2014 while ship calls increased 34 percent and barge calls decreased 59 percent. Tonnage overall increased 18 percent to 2.0 million tons in 2013 while ship calls increased 7 percent and barge calls decreased 24 percent. Tonnage overall decreased 18 percent to 1.7 million tons in 2012 while ship calls decreased 6 percent and barge calls increased 3 percent. Green fruit imports decreased 18 percent or 80 thousand tons, increased 9 percent or 39 thousand tons, and increased 5 percent or 21 thousand tons, in 2014, 2013 and 2012, respectively. Rice exports decreased 29 percent to 58 thousand tons in 2014, increased 19 percent to 82 thousand tons in 2013, and increased 13 percent to 68 thousand tons in Domestic rice activity decreased 82 percent to 14 thousand tons in 2014, decreased 16 percent to 77 thousand tons in 2013, and increased 19 percent to 92 thousand tons in This was also directly related to the 59 percent decrease in barge calls for 2014, 24 percent decrease in barge calls for 2013, and 3 percent increase in barge calls for Import liquefied natural gas tonnages decreased to 130 thousand tons, increased to 197 thousand tons, and decreased to 187 thousand tons 2014, 2013 and 2012, respectively

22 Management Discussion and Analysis Exported liquefied natural gas remained at 124 thousand tons in 2014, decreased to 124 thousand tons in 2013, and increased to 194 thousand tons in Bulk limestone increased 162 percent to 1.2 million tons in 2014, increased 131 percent to 455 thousand tons in 2013, and increased 26 percent to 196 thousand tons in General export cargo increased 10 percent to 495 thousand tons in 2014, increased 19 percent to 447 thousand tons in 2013, and increased 36 percent to 376 thousand tons in Wind power projects imported and exported through the Port for the fiscal years 2014, 2013 and 2012 totaled 0 tons, 0 tons, and 14 thousand tons, respectively. Total lease revenue increased 9 percent in 2014, increased 7 percent in 2013 and increased by 4 percent in 2012; ground lease revenue increased $ 279 thousand in 2014, increased $ 355 thousand in 2013, and increased $ 249 thousand in 2012 primarily due to contractual rate adjustments. Other leases remained relatively the same in 2014, 2013 and Ad valorem tax revenue decreased by 11.0 percent to $ 4.7 million in 2014 and was $ 5.2 million and $ 5.0 million in 2013 and 2012, respectively. The decrease in the current year ad valorem revenues is a result of decreases in the tax rate. The tax rate was reduced from 5.15 to 4.5 cents per hundred dollars valuation in 2014, reduced from 5.35 to 5.15 cents per hundred dollars valuation in 2013 and remained the same in total for Investment income increased by $ 325 thousand in 2014 as compared to 2013 and decreased by $ 174 thousand in 2013 as compared to 2012 both as a result of a net change in investment market values of investments. Investment income decreased by $ 28 thousand in 2012 as compared to 2011 as a result of a reduction in investments coupled with continued low but stable interest rates. Grant revenues in 2014 were lower than 2013 by $ 3.6 million due to a decrease in Port Security grant expenditures and related revenue, in 2013 were higher than 2012 by $ 2.4 million due to an increase in Port Security grant expenditures and related revenue and in 2012 there was also an increase over 2011 due to an increase in Port Security Grant expenditures and related revenues. Capital contributions in 2014, 2013 and 2012 were directly related to contributions to others made by the Port for grant and capital related projects


23 Management Discussion and Analysis

24 Management Discussion and Analysis Total expenses decreased 40 percent to $ 17.2 million from $ 28.6 million in 2014, increased 34 percent to $ 28.6 million in 2013, and increased 26 percent to $ 21.0 million in Operating expenses, including depreciation, were $ 14.5 million in 2014 increasing $ 685 thousand or 5 percent, $ 13.9 million in 2013 increasing $ 1.5 million or 12.5 percent, and increasing 145 thousand or 1.2 percent to $ 12.3 million in Payroll and related expenses increased by 4 percent in 2014 primarily due to the regular salary increases, increased by 7 percent in 2013 primarily due to the filling of vacant positions and regular salary increases, and decreased by 3 percent in 2012 primarily related to vacant positions for a major portion of the year. Professional services expenses decreased by $ 201 thousand in 2014 due to decreased legal fees associated with construction issues, increased by $ 98 thousand in 2013 and $ 149 thousand in Supplies and other expenses increased in 2014 by $ 172 thousand over 2013, in 2013 by $ 260 thousand over 2012 due to increased equipment supplies whereas supplies and other expenses were relatively consistent in 2012 as compared to 2011 with no significant changes in port operations and with prices for supplies and fuel relatively consistent during this period. Utilities and maintenance expenses were consistent in 2014 as compared to 2013, increased by $ 434 thousand in 2013 over 2012 due to maintenance of the crane and other cargo equipment whereas utilities and maintenance expenses were consistent in 2012 as compared to Depreciation expense in 2014 increased by 18% due to the addition of new equipment and fixed assets, in 2013 increased by 13% due to the addition of new assets for the Velasco Terminal Berth 7, in 2012 increased by 8% also due to placement in service of Velasco Terminal related assets which were previously being held in construction in progress. The Port had no gain or loss on sale of capital assets in 2014 and also in 2012, a small gain on the sale of capital assets occurred in Debt interest and fees decreased to $ 1.3 million in 2014 due to decreases in interest rates, and were consistent between 2013 and 2012 at $ 2.2 million and $ 2.0 million, respectively. Other expenses have decreased significantly in 2014 due to no additional repair expenses related to the Velasco Terminal issue as the issue was settled in the prior year. Other expenses increased significantly in 2013 and 2012 due to costs incurred for the Velasco terminal repairs


25 Management Discussion and Analysis
26 Management Discussion and Analysis Capital Assets and Long Term Debt The Port s investment in capital assets is $ million, $ million, and $ million, net of depreciation, as of September 30, 2014, 2013 and 2012, respectively. The investment includes land and land improvements, docks and appurtenances, buildings, storage yards, equipment, roads and railways, utilities and construction in progress. In 2014, 2013 and 2012 there were additions of $ 20.5 million, $ 11.7 million, and $ 2.7 million (net of construction in progress placed in service) with depreciation of $ 5.3 million, $ 4.5 million and $ 4.0 million, respectively. Regarding additions, administration office renovations added $ 116 thousand to buildings in 2014, the emergency operations center and related infrastructure added $3.8 million to buildings in 2013, and the security gate improvements added $ 1.2 million to buildings in Land and improvements additions were $ 799 thousand, $ 12.5 million, and $ 253 thousand, in 2014, 2013 and 2012, respectively, primarily related to the Velasco Terminal civil site work, and land acquisitions of properties adjacent to the Port. Completion of Velasco Terminal Berth 7 added $ 30 million to docks in Completion of security lighting improvements added $ 1.5 million to utilities in Equipment, furniture, vehicles and other additions totaled $ 17.7 million in 2014 with the purchase of two ship to shore container cranes, $ 520 thousand in 2013 with the purchase of equipment and security equipment, $ 1.2 million in 2012 with the purchase of security equipment and security upgrades. Gross additions to construction in progress were $ 2.2 million in 2014, $ 480 thousand in 2013, and $ 674 thousand in 2012, including the emergency operations center, Gate 4 entrance facilities, additional security systems, and Velasco Terminal improvements. Construction in progress placed in service totaled $ 362 thousand in 2014, $ 38.0 million in 2013, and $ 3.3 million in 2012, respectively. Additional information on capital assets can be found in Note 4 on pages of this report. Total bonds payable are $ 43.0 million at September 30, 2014, $ 58.8 million at September 30, 2013 and $ 41.9 million at September 30, Senior Lien Revenue Bonds, Series 2013A, 2013B and 2013C were issued in June of The 2013A series bonds were issued to refund the 2008 Series bonds which were set to mature in As of September 30, 2014 the amount outstanding on these revenue bonds was $ 37.7 million and was $ 52.6 million at September 30, The debt service for these bonds is paid from the Port s operating revenues. In 2007 the Unlimited Tax Bonds, Series 1998 were partially refunded with Unlimited Tax Refunding Bonds, Series 2006 and in November 2009, were further refunded with the Unlimited Tax Refunding Bonds, Series As of September 30, 2014 the Port had general obligation bonds payable of $ 5.3 million, $ 6.2 million at September 30, 2013 and $ 7.1 million at September 30, The final maturity for these general obligation bonds is The debt service for these bonds is paid from ad valorem tax revenue. On September 30, 2014, the Port entered into a note payable ( Master Lease-Purchase Financing Agreement ) with Chase Bank in the amount of $ 14.1 million. The note calls for annual principal and interest payments beginning on September 30, 2015 and ending on September 30, The note payable represents a refinancing of the two cranes purchased during the year ended September 30, 2014, including $ 1.4 million placed in escrow account until the final payment for the crane purchase. The remaining $ 12.7 million represents a reimbursement of prior payments, based on a Reimbursement Agreement (Resolution Expressing Intent to Finance Expenditures Incurred) adopted by the Board of Commissioners on August 8, Additional information on longterm debt activity can be found in Note 5 on pages of this report


27 Management Discussion and Analysis

28 Management Discussion and Analysis Outlook There are a number of significant developments known at this time which will affect the future financial performance of the Port both in the long as well as mid-term time periods. With the opening of Velasco Terminal Berth 7 and the purchase of two ship-to-shore container cranes, Port Freeport is positioned to continue in growth. The capability of handling cargo resulted in two new major clients. Mediterranean Shipping Co. S.A., the world s largest containership carrier and Höegh Autolines, the world s top roll-on/roll-off vessel operator. Port Freeport now has global access for its customers. The finalization of the masterplan will provide guidance for the future development plans for the Port for the near future as well as long term. Included in the masterplan is the full build out of Velasco Terminal. Design of the extension of Berth 7, Berth 8 and a RoRo ramp have begun. Full build out will also include the development of backland to support the berths as well as purchase of additional equipment. Costs associated with this plan are $ 180 million and are schedules over the next five years. A combination of public and private funding is being explored to fund the projects. Any resulting partnership with the private sector will provide revenue streams in the form of fixed annual facility payments and throughput on cargos handled across the terminals berths. The masterplan also presents guidance for future development of Port facilities on undeveloped land for laydown, warehousing, and rail facilities. These initiatives are estimated to cost $ 70 million and will further enhance the capabilities of the Port. Development planning is underway and will be funded largely through a public and private source. In 2004 Freeport LNG Development, L.P. (FLNP) received approval from the Federal Energy Regulatory Commission (FERC) for construction of a re-gas facility to receive and store imported liquefied natural gas (LNG), convert the product back to a gas form and transport it to commercial and industrial users via pipeline. This facility was completed and placed in operation in the second quarter of With the announcement of shale oil and gas plays in north Texas and other regions of the United States, FLNG refocused its operations on the exportation of LNG and began the permitting process with FERC in To date they have received all of the necessary permits. In addition to the permits they have closed on all of their funding for construction. Construction of these liquefaction facilities are estimated to cost $11 billion and with an anticipated completion date in Further, in order to provide expanded storage for the facility, FLNG reached agreement with a third party for salt dome storage capacity of approximately 7.5 billion cubic feet. A contract has been awarded for mining of the salt and de-brining of the caverns with the facility becoming available concurrent with the liquefaction facilities. This operation has and will continue to provide significant increases to the Port s lease revenues as operations ramp up
29 Management Discussion and Analysis In response to the fore mentioned oil and gas shale plays, Maverick Tube Corporation a wholly owned subsidiary of Tenaris, S.A. has begun construction of seamless pipe fabrication facility located in Bay City, Texas. It is estimated that construction will take approximately two years to complete with manufacturing operations commencing in Once operational, the Port expects to receive raw materials in the form of steel billet to be transported to the production facility as well as a portion of the plant s finished product for short-term storage and export shipment. This operation is projected to provide substantial revenue flows from both cargo handling as well as leasing activities. With the completion of the initial reconnaissance and subsequent feasibility study, The U.S. Army Corps of Engineers (USCOE) issued a Chiefs report in January of 2013 indicating a Federal interest, supported by favorable project economics, to widen the Port Freeport Navigational channel to a width up to 600 feet from the current 400 feet and deepen it to a depth of up to 55 feet from the current 45 feet. The next project phase will include formal project authorization and funding to allow for the development of the preliminary engineering and design (PED) as well as the project management plan (PMP). At present, the project is authorized in the Water Resources Development Act of Initial funding for the PED and PMP is included in the approved 2014 Federal budget. It is estimated that following congressional authorization the project will be completed in 7 to 10 years at estimated total project cost of $300 million which will be cost shared on a basis between the Federal government and the Port. Completion of the proposed improvements will allow the Port and other harbor users to bring not only larger vessel to berth but additionally in greater numbers providing for a fuller utilization of existing and planned port facilities. In addition, the Port is actively engaged with the USCOE in the first phase to address safe navigation and the current channel depth at a cost of approximately $ 130 million which would be shared 75%/25% between the Federal government and the Port. Lastly, spurred by the general U.S. and Texas state economic recoveries as well as expansion of domestic oil and gas production the Freeport based polymer manufactures and other petrochemical companies have resumed planned development and expansion of production facilities. This has created opportunities to handle both bulk as well as project cargo construction materials which utilized the Port s berths, warehouse spaces and cargo lay down areas. These activities are expected to increase operating revenues for the next 5-7 years. Requests for Information This financial report is designed to provide a general overview of Port Freeport s finances and the Port s accountability for the money it receives. If you have questions about this report or need additional information, contact Jeff Strader, Chief Financial Officer, at Port Freeport, 200 West 2 nd Street, 3 rd Floor, Freeport, Texas
30 - 29 -
31 Statements of Net Position September 30, 2014 and 2013 Assets and Deferred Outflows of Resources Current Assets: Cash and cash equivalents $ 30,589,036 $ 26,147,687 Investments 20,267,218 33,911,536 Receivables: Trade accounts (less allowance for uncollectible accounts , $ 26,316; 2013, $ 48,557) 1,530,851 1,705,794 Property taxes (less allowance for uncollectible accounts , $ 51,235; 2013, $ 56,399) 96, ,875 Other 39,766 51,407 Other governments 768, ,183 Accrued interest 104, ,636 Prepaids 714, ,747 Inventory 218,609 78,547 Total unrestricted current assets 54,330,050 63,865,412 Restricted Current Assets: Cash and cash equivalents 1,833,692 1,011,775 Investments 1,257,646 2,073,595 Receivables: Property taxes (less allowance for uncollectible accounts , $ 15,241; 2013, $ 17,156) 32,092 34,776 Accrued interest receivable 3,745 15,265 Other 333 1,270 Total restricted current assets 3,127,508 3,136,681 Total current assets 57,457,558 67,002,093 Property, plant and equipment (less accumulated depreciation , $ 50,417,552; 2013, $ 45,107,143) 206,598, ,377,093 Other assets 60,446 70,959 Total non-current assets 206,658, ,448,052 Total assets 264,116, ,450,145 Deferred Outflows of Resources: Deferred outflows of resources Refunding costs 15,907 17,070 Total deferred outflows of resources 15,907 17,070 The notes to the financial statements are an integral part of this statement
32 Liabilities, Deferred Inflows of Resources and Net Position Current Liabilities: Accounts payable and accrued expenses $ 8,945,279 $ 7,607,866 Unearned lease income 2,522,209 2,294,591 Accrued compensated absences 80, ,000 Total current liabilities 11,547,646 10,002,457 Current Liabilities Payable from Restricted Assets: Accrued bond interest payable 348, ,669 Note payable 1,269,794 Bonds payable 2,820,000 15,840,000 Premium on bonds 15,518 15,518 Total current liabilities payable from restricted assets 4,454,192 16,208,187 Total current liabilities 16,001,838 26,210,644 Non-current Liabilities: Note payable 12,830,206 Bonds payable 40,205,000 43,007,930 Bond premium 60,242 75,760 Accrued compensated absences 129,647 83,030 Total non-current liabilities 53,225,095 43,166,720 Total liabilities 69,226,933 69,377,364 Deferred Inflows of Resources: Deferred inflows of resources Total deferred inflows of resources Net Position: Net investment in capital assets 149,397, ,423,882 Restricted: Debt service 2,762,928 2,767,814 Capital projects 15,700 16,199 Unrestricted 42,729,110 53,881,956 Total net position $ 194,905,399 $ 189,089,
33 Statements of Revenues, Expenses and Changes in Net Position For the Years Ended September 30, 2014 and Operating Revenues: Harbor Operations: Wharfage $ 3,896,689 $ 3,149,424 Dockage 1,763,042 1,353,107 Service, facility use and other fees 4,191,757 4,112,112 Lease income 6,955,488 6,344,343 Miscellaneous 188,619 35,402 Total operating revenues 16,995,595 14,994,388 Operating Expenses: Payroll and related 4,005,446 3,858,186 Professional services 1,432,875 1,634,189 Supplies and other 2,489,337 2,316,959 Utilities 494, ,874 Maintenance and repairs 760, ,932 Depreciation 5,310,409 4,502,480 Total operating expenses 14,492,667 13,864,620 Operating income 2,502,928 1,129,768 Non-Operating Revenues (Expenses): Ad valorem tax, net of collection expenses 4,672,390 5,246,302 Investment income 265,046 ( 59,682 ) Gain on sale of capital assets 17,965 Debt interest and fees ( 1,285,213 ) ( 2,163,797 ) Other ( 1,381,819 ) ( 1,188,604 ) Total non-operating revenues 2,270,404 1,852,184 Income before capital contributions 4,773,332 2,981,952 Capital contributions - grants 1,042,216 4,682,926 Total capital contributions 1,042,216 4,682,926 Extraordinary Revenues (Expenses): Insurance and other proceeds Berth 7 13,095,000 Construction costs Berth 7 ( 9,236,010 ) Legal and expert fees Berth 7 ( 2,106,388 ) Total extraordinary revenues (expenses) -0-1,752,602 Change in net position 5,815,548 9,417,480 Total net position beginning 189,089, ,672,371 Total net position ending $ 194,905,399 $ 189,089,851 The notes to the financial statements are an integral part of this statement
34 Statements of Cash Flows For the Years Ended September 30, 2014 and 2013 Cash Flows from Operating Activities: Cash received from customers $ 17,422,254 $ 14,361,371 Cash paid to suppliers for goods and services ( 3,912,874 ) ( 7,210,844 ) Cash paid to employees for services and benefits ( 3,978,671 ) ( 3,843,945 ) Net cash provided by operating activities 9,530,709 3,306,582 Cash Flows from Non-capital Financing Activities: Property tax receipts 4,697,141 5,309,421 Property tax collection expenses ( 61,160 ) Net non-operating expense ( 1,049,664 ) Net cash provided by non-capital financing activities 3,647,477 5,248,261 Cash Flows from Capital and Related Financing Activities: Issuance of bonds 14,117,070 52,600,000 Principal payments under bond obligations ( 15,855,518 ) ( 35,685,000 ) Interest and fees paid under debt obligations ( 1,287,839 ) ( 2,327,203 ) Land & equipment purchases ( 20,531,737 ) ( 11,367,928 ) Grants received 895,780 4,641,095 Proceeds from the sale of capital assets 17,965 Net cash provided (used) by capital and related financing activities ( 22,662,244 ) 7,878,929 Cash Flows from Investing Activities: Purchase of investments ( 1,597,567 ) ( 27,189,735 ) Proceeds from sale and maturity of investments 15,580,817 20,271,457 Investment earnings 764, ,603 Net cash provided (used) by investing activities 14,747,324 ( 6,679,675 ) Increase in cash and cash equivalents 5,263,266 9,754,097 Cash and cash equivalents, October 1, 27,159,462 17,405,365 Cash and cash equivalents, September 30, $ 32,422,728 $ 27,159,462 (continued)
35 Statements of Cash Flows - Continued For the Years Ended September 30, 2014 and Reconciliation of Operating Income to Net Cash Provided by Operating Activities: Operating income $ 2,502,928 $ 1,129,768 Adjustments to Reconcile Operating Income (Loss) to Net Cash Provided by Operating Activities: Depreciation 5,310,409 4,502,480 Change in assets and liabilities: Accounts receivable 174,943 ( 704,756 ) Other receivables 24, ,142 Inventory ( 140,062 ) ( 1,272 ) Prepaid and other 56,074 ( 92,658 ) Other assets 10,513 Accounts payable and accrued expenses 1,337,413 ( 1,858,208 ) Unearned lease income 227, ,007 Accrued compensated absences 26,775 19,079 Net cash provided by operating activities $ 9,530,709 $ 3,306,582 Non-cash Transactions Affecting Financial Position: Change in value of investments from cost to fair value $( 477,017 ) $( 398,900 ) Gain on the sale of capital assets 17,965 Net effect of non-cash transactions $( 477,017 ) $( 380,935 ) The notes to the financial statements are an integral part of this statement
36 Notes to Financial Statements For the Years Ended September 30, 2014 and 2013 Index Note Page 1. Summary of Significant Accounting Policies Deposits and Investments Allowance for Uncollectable Accounts Capital Assets Long-Term Debt & Non-Current Liabilities Extraordinary Revenues (Expenses) Contingent Liabilities Litigation Freeport Harbor Improvement Projects Leasing Operations Grant Revenue Risk Management Retirement Plans Revenue Bonds Issued on Behalf of Others Economic Dependency Evaluation of Subsequent Events
37 Notes to Financial Statements For the Years Ended September 30, 2014 and 2013 NOTE 1. SUMMARY OF SIGNIFICANT ACCOUNTING POLICIES The financial statements of Port Freeport (the Port ) have been prepared in conformity with generally accepted accounting principles (GAAP) as applied to governmental units for enterprise funds. Enterprise fund accounting follows all Governmental Accounting Standards Board (GASB) pronouncements, as well as Financial Accounting Standards Board (FASB) codification unless the codification conflicts with or contradicts GASB pronouncements, in which case, GASB prevails. The more significant of the Port s accounting policies are described below. A. REPORTING ENTITY In evaluating how to define the government for financial reporting purposes, management has considered all potential component units. The decision to include a potential component unit in the reporting entity was made by applying the criteria set forth in GAAP. Based upon the application of these criteria, the following is a brief review of each potential component unit addressed in defining the Port s reporting entity. Individual financial statements for each component unit can be obtained from the office of Port Freeport. Included within the reporting entity: Port Freeport: Port Freeport was created by action of the voters of Brazoria County, Texas, on December 4, The Port operates under an elected commissioner form of government. Currently six commissioners are authorized by the Texas Legislature. Brazos Harbor Industrial Development Corporation: In November 1979 the Port authorized the filing of a petition to create the Brazos Harbor Industrial Development Corporation (IDC), a nonprofit corporation organized to issue industrial development bonds and pollution control revenue bonds. Vernon s Annotated Texas Civil Statutes authorize the creation and administration of industrial development corporations by specified governmental entities for the use in the promotion and development of commercial, industrial and manufacturing enterprises. The Port Commission appoints a separate board of directors for the IDC. The IDC acts under the authorization and direction of the appointed Board. The IDC negotiates with the user entity to develop the necessary documents for issuing the bonded debt. The bonds are payable solely from the revenues derived from the project. Additionally, the user entity indemnifies and agrees to hold harmless the IDC from any and all claims relating to the issuance of the bonded debt. None of the Port s assets or future revenues are pledged to secure these bonds. The Port Commission has the right of refusal on the issuance of bonds by the IDC; therefore, this constitutes financial accountability. The IDC is included in the reporting entity even though the Port does not provide funding to the IDC or have the ability to elect their governing authority or designate their management, and the IDC was incorporated for the benefit of all commercial enterprises in the area. The IDC is a discretely presented component unit, although it has no assets, liabilities, equities or financial transactions. Financial information is limited to the disclosure of revenue bonds issued on behalf of others (Note 14). B. BASIS OF ACCOUNTING The Port follows enterprise fund accounting and reporting requirements, including the accrual basis of accounting and application of all GASB pronouncements as well as the Financial Accounting Standards Board ( FASB ) pronouncements issued on or before November 30, 1989, unless those pronouncements conflict with or contradict GASB pronouncements
38 Notes to Financial Statements For the Years Ended September 30, 2014 and 2013 NOTE 1. SUMMARY OF SIGNIFICANT ACCOUNTING POLICIES - Continued B. BASIS OF ACCOUNTING - Continued The preparation of financial statements in conformity with accounting principles generally accepted in the United States of America requires management to make estimates and assumptions that affect the reported amounts of assets and liabilities and disclosure of contingent assets and liabilities at the date of the financial statements and the reported amount of revenues and expenses during the reporting period. Actual results could differ from these estimates. Operating revenues and expenses generally result from providing services in connection with ongoing operations. The principal revenues of the Port are charges to customers for sales and services. The Port also recognizes revenue in the form of rents. Operating expenses include the cost of services, administrative expenses and depreciation on capital assets. All revenues and expenses not meeting this definition are reported as nonoperating revenues and expenses. C. RECLASSIFICATIONS Certain amounts for 2013 have been reclassified to conform to the 2014 presentation. D. NEW PRONOUNCEMENTS GASB Statement No. 60, Accounting and Financial Reporting for Service Concession Arrangements, was issued November The statement was implemented and did not have an impact on the Port s financial statements. This statement is effective for periods beginning after December 15, GASB Statement No. 61, The Financial Reporting Entity: Omnibus - an amendment of GASB Statements No. 14 and No. 34, was issued November The statement was implemented and did not have an impact on the Port s financial statements. This statement is effective for periods beginning after June 15, GASB Statement No. 62, Codification of Accounting and Financial Reporting Guidance Contained in Pre- November 30, 1989 FASB and AICPA Pronouncements, was issued December The statement was implemented and did not have an impact on the Port s financial statements. This statement is effective for periods beginning after December 15, GASB Statement No. 63, Financial Reporting of Deferred Outflows of Resources, Deferred Inflows of Resources, and Net Position, was issued June The statement was implemented and did not have an impact on the Port s financial statements, although it has reclassified items previously recorded as assets and liabilities within the Port s financial statements as deferred outflows and inflows of resources. This statement is effective for periods beginning after December 15, GASB Statement No. 64, Derivative Instruments: Application of Hedge Accounting Termination Provisions-and amendment of GASB Statements No. 53, was issued June The statement was implemented and did not have an impact on the Port s financial statements. GASB Statement No. 65, Items Previously Reported as Assets and Liabilities, was issued March The statement was implemented and did have an impact on the Port s financial statements. This statement is effective for periods beginning after December 15, 2012 and was adopted in the current fiscal year. GASB Statement No. 66, Technical Corrections 2012; an amendment of GASB Statements No. 10 and No. 62, was issued March The statement was implemented and did not have an impact on the Port s financial statements. This statement is effective for periods beginning after December 15, GASB Statement No. 67, Financial Reporting for Pension Plans an amendment of GASB Statement No. 25, was issued June The statement was implemented and did not have an impact on the Port s financial statements. This statement is effective for periods beginning after June 15,
39 Notes to Financial Statements For the Years Ended September 30, 2014 and 2013 NOTE 1. SUMMARY OF SIGNIFICANT ACCOUNTING POLICIES - Continued D. NEW PRONOUNCEMENTS - Continued GASB Statement No. 68, Accounting and Financial Reporting for Pensions; an amendment of GASB Statement No. 27, was issued June This Statement replaces the requirements of Statements No. 27 and No. 50 related to pension plan that are administered through trusts or equivalent arrangements. The requirements of Statements No. 27 and No. 50 remain applicable for pensions that are not administered as trusts or equivalent arrangements. The management of the Port does not believe that the implementation of this statement will have a material effect on the financial statements of the Port. This statement is effective for periods beginning after June 15, GASB Statement No. 69, Government Combinations and Disposals of Government Operations, was issued January This Statement establishes accounting and financial reporting standards for mergers, acquisitions, and transfers of operations (i.e., government combinations). This Statement also provides guidance on how to determine the gain or loss on a disposal of government operation. This Statement applies to all state and local governmental entities. The management of the Port does not believe that the implementation of this statement will have a material effect on the financial statements of the Port. This statement is effective for periods beginning after December 15, However, earlier application of the Statement is encouraged. GASB Statement No. 70, Accounting and Financial Reporting for Nonexchange Financial Guarantees, was issued April The statement was implemented and did not have an impact on the Port s financial statements. This statement is effective for periods beginning after June 15, GASB Statement No. 71, Pension Transition for Contributions Made Subsequent to the Measurement Date an amendment of GASB Statement No. 68, was issued November The management of the Port does not believe that the implementation of this statement will have a material effect on the financial statements of the Port. This statement is effective for periods beginning after June 15, E. CASH AND INVESTMENTS Cash and temporary investments include amounts in demand deposits and short-term investments with a maturity date within three months of the date acquired by the Port. For purposes of the cash flow statement, cash and temporary investments are considered cash equivalents. In accordance with GASB Statement 31, Accounting and Financial Reporting for Certain Investments and for External Investment Pools, investments are stated at fair value. F. INVENTORIES Inventories are valued at the lower of cost or market using the average cost method. G. CAPITAL ASSETS Capital assets are defined by the Port as assets with an initial, individual cost of more than $ 5,000 and an estimated useful life of greater than one year. Property constructed or acquired by purchase is stated at cost. Property received as a contribution is stated at estimated fair value on the date received. Depreciation of all exhaustible capital assets is charged as an expense against operations. Accumulated depreciation is reported on the statements of net position. Depreciation has been provided over the estimated useful lives using the straight-line method. Leased assets are depreciated over the lesser of the term of the related lease or the estimated useful lives of the assets. The costs of normal maintenance and repairs that do not add to the value of the asset or materially extend asset lives are not capitalized. Improvements are capitalized and depreciated over the remaining useful lives of the related capital assets, as applicable. When property, plant and equipment is sold or otherwise disposed or becomes obsolete, the asset account and related accumulated depreciation account are relieved, and any gain or loss is charged against income
40 Notes to Financial Statements For the Years Ended September 30, 2014 and 2013 NOTE 1. SUMMARY OF SIGNIFICANT ACCOUNTING POLICIES - Continued G. CAPITAL ASSETS - Continued Capital assets of the Port are depreciated over the following useful lives: Assets Years Buildings 50 Docks & appurtenances Utilities Roads, lots & railways 40 Storage yards Equipment, furniture & vehicles 5-20 Other A significant portion of the Port s capital assets are the result of work performed to the Freeport Harbor Entrance Channel (the Channel) to increase depths to 45 feet (see Note 9). The maintenance of the Channel depths are the responsibility of the U.S. Army Corp of Engineers; thus, management has capitalized these costs as land and land improvements with an indefinite useful life; as such no depreciation has been recorded against these assets. H. INTEREST CAPITALIZATION Interest costs associated with the construction of the Port s capital assets are capitalized and reflected as a part of the cost of the asset. The amount of interest cost to be capitalized on assets acquired with tax-exempt borrowings is equal to the cost of the borrowing less interest earned on the related tax-exempt borrowing. Net interest capitalized was $ -0- for the year ended September 30, 2014 and I. PROPERTY TAXES Property taxes are levied by October 1 of each year in conformity with Subtitle E, Texas Property Tax Code. These taxes are due on receipt and are considered delinquent if not paid before February 1 of the year following the year in which imposed. Interest is charged on delinquent property taxes at a rate established by the state property tax code. Collections made on or after July 1 are subject to an additional fifteen percent collection fee. On January 1 of each year, a tax lien attaches to property to secure the payment of all taxes. The County Tax Collector bills and collects the property taxes for the Port. Collections made by the County Tax Collector are deposited into an account maintained by the Port. Property taxes are recognized as revenue in the year they are levied. Property tax receivables and related allowances for uncollectable taxes are split between the unrestricted and the restricted for debt service based on the percent of the levy available for maintenance and operations, and general obligation bond debt service. The Commission may levy taxes at an unlimited rate for payment of debt service on the Port s General Obligation Bonds. The Commission may also levy taxes, subject to a $ 0.10 per $ 100 assessed valuation limit, for all operation and maintenance expenses of the Port. For the years ended September 30, 2014 and 2013, the Commission levied taxes at a rate of $ and $ for debt service and a rate of $ and $ for operation and maintenance, for a total tax rate of $ and $ per $ 100 assessed valuation for each year, respectively. J. RESTRICTED ASSETS Restricted assets consist of capital and debt service restricted assets. Restricted capital assets consist of net bond proceeds in excess of unspent bond proceeds for unlimited tax improvement bonds. Restricted assets for debt service consist of proceeds available from taxes receivable as well as the revenue dedicated to debt service as stated in applicable bond covenants
41 Notes to Financial Statements For the Years Ended September 30, 2014 and 2013 NOTE 1. SUMMARY OF SIGNIFICANT ACCOUNTING POLICIES - Continued K. COMPENSATED ABSENCES Vested or accumulated vacation is recorded as an expense and liability as the benefits accrue to employees. The Port s vacation and sick leave policy provides that each employee may carry over unused vacation, not to exceed five days, to subsequent years. Further, unused sick leave may be converted to vacation on a five to one ratio. Benefits payable as of September 30, 2014 and 2013 were $ 209,805 and $ 183,030, respectively. L. LONG-TERM OBLIGATIONS Long-term debt and other long-term obligations are reported as liabilities in the statements of net position. Bond premiums and discounts, as well as issuance costs, are deferred and amortized over the life of the bonds using the effective interest method. Bonds payable are reported net of the applicable bond premium or discount. Bond issuance costs are reported as deferred charges and amortized over the term of the related debt. NOTE 2. DEPOSITS AND INVESTMENTS The Port classifies deposits and investments for financial statement purposes as cash and temporary investments and investments based upon both liquidity (demand deposits) and maturity date (deposits and investments) of the asset at the date of purchase. For this purpose, a temporary investment is one that when purchased had a maturity date of three months or less. Cash and temporary investments and investments, as reported on the statements of net position at September 30, 2014 and 2013, are as follows: September 30, 2014 Unrestricted Restricted Total Cash and Temporary Investments: Cash (petty cash accounts) $ 1,320 $ $ 1,320 Financial Institution Deposits: Demand deposits 11,759, ,708 12,429,853 State Treasury Investment Pool: Texpool 18,828,571 1,162,984 19,991,555 Total cash and temporary investments $ 30,589,036 $ 1,833,692 $ 32,422,728 Investments: Investments Held by Broker-Dealers: U.S. Agencies $ 20,267,218 $ 1,257,646 $ 21,524,864 Total investments $ 20,267,218 $ 1,257,646 $ 21,524,864 September 30, 2013 Unrestricted Restricted Total Cash and Temporary Investments: Cash (petty cash accounts) $ 1,321 $ $ 1,321 Financial Institution Deposits: Demand deposits 7,993,862 38,005 8,031,867 State Treasury Investment Pool: Texpool 18,152, ,770 19,126,274 Total cash and temporary investments $ 26,147,687 $ 1,011,775 $ 27,159,462 Investments: Investments Held by Broker-Dealers: U.S. Treasuries $ 33,911,536 $ 2,073,595 $ 35,985,131 Total investments $ 33,911,536 $ 2,073,595 $ 35,985,
42 Notes to Financial Statements For the Years Ended September 30, 2014 and 2013 NOTE 2. DEPOSITS AND INVESTMENTS - Continued Deposits: Custodial Credit Risk Custodial credit risk is the risk that in the event of a financial institution failure, the Port deposits may not be returned to them. The Port requires that all deposits with financial institutions be collateralized in an amount equal to 100 percent of uninsured balances. At September 30, 2014, the carrying amount of the Port s deposits was $ 12,429,853 while the financial institution balances totaled $ 12,871,929. Of the financial institution balances, $ 515,701 was covered by federal deposit insurance, $ 9,058,269 was covered by the Securities Investor Protection Corporation insurance, and $ 3,297,959 was covered by collateral held by the Port s agent in the Port s name. At September 30, 2013, the carrying amount of the Port s deposits was $ 8,031,867 while the financial institution balances totaled $ 8,631,234. Of the financial institution balances, $ 266,199 was covered by federal deposit insurance, $ 5,410,169 was covered by the Securities Investor Protection Corporation insurance and $ 2,954,866 was covered by collateral held by the Port s agent in the Port s name. Investments: Chapter 2256 of the Texas Government Code (the Public Funds Investment Act) authorizes the Port to invest its funds under a written investment policy (the Investment Policy ) that primarily emphasizes safety of principal and liquidity, addresses investment diversification, yield, and maturity and addresses the quality and capability of investment personnel. The Port s Investment Policy defines what constitutes the legal list of investments allowed under the policy. The Port s deposits and investments are invested pursuant to the Investment Policy, which is approved by the Port Commission. The Investment Policy includes a list of authorized investment instruments and allowable stated maturity of individual investments. In addition they include an Investment Strategy Statement that specifically addresses investment options and describes the priorities of suitability of investment type, preservation and safety of principal, liquidity, marketability, diversification and yield. Additionally, the soundness of financial institutions (including broker/dealers) in which the Port will deposit funds is addressed. The Port s investment policies and types of investments are governed by the Public Funds Investment Act (PFIA). The Port s management believes it complied with the requirements of the PFIA and the Port s investment policies. The Port s Investment Officer submits an investment report each quarter to the Port Commission. The report details the investment positions of the Port and the compliance of the investment portfolio s as they relate to both the adopted investment strategy statements and Texas State law. The Port is authorized to invest in the following investment instruments provided that they meet the guidelines of the Investment Policy: 1. U.S. Treasury Securities. 2. Short-term obligations of the United States Government agencies and instrumentalities. 3. Texas State, City, County, School and Road District bonds with an investment grade bond rating from Moody s Investors Services (A and above) and Standard and Poor s Corporation (A- and above) or that is insured. 4. Fully insured or collateralized certificates of deposits issued by a state or national bank, savings bank or a federal credit union with a main office or bank in Texas. 5. Public funds investment pools as permitted by Government Code Other securities or obligations as allowed by the Public Funds Investment Act and approved by the Finance Committee and/or full Port Commission. 7. Money market mutual funds as permitted by Government Code and approved by Commission resolution. The Port participates in Texpool, a Local Government Investment Pool (LGIP). The State Comptroller oversees TexPool, with Federated Investors managing the daily operations of the pool under a contract with the State Comptroller
43 Notes to Financial Statements For the Years Ended September 30, 2014 and 2013 NOTE 2. DEPOSITS AND INVESTMENTS - Continued Investments - Continued The Port invests in TexPool to provide its liquidity needs. TexPool was established in conformity with the Interlocal Cooperation Act, Chapter 791 of the Texas Government Code and the Public Funds Investment Act, Chapter 2256 of the Code. TexPool is a 2(a)7 like fund, meaning that it is structured similar to a money market mutual fund. Such funds allow shareholders the ability to deposit or withdraw funds on a daily basis. Interest rates are also adjusted on a daily basis. Such funds seek to maintain a constant net asset value of $ 1.00, although this cannot be fully guaranteed. TexPool is rated AAAm and must maintain a dollar weighted average maturity not to exceed 60 days. At September 30, 2014 and 2013 TexPool had a weighted average maturity of 48 and 60, respectively. Although TexPool portfolios had a weighted average maturity of 48 and 60 days, respectively, the Port considers holdings in these funds to have a one day weighted average maturity. This is due to the fact that the share position can usually be redeemed each day at the discretion of the shareholder, unless there has been a significant change in value. All of the Port s investments are insured, registered, or the Port s agent holds the securities in the Port s name; therefore, the Port is not exposed to custodial credit risk. The following tables include the portfolio balances of all investment types of the Port at September 30, 2014 and September 30, 2014 Investment Type Unrestricted Restricted Total Local government investment pool $ 18,828,571 $ 1,162,984 $ 19,991,555 Certificates of deposit 6,225, ,000 6,474,000 U.S. Treasuries 546, , ,252 Municipal Bonds 13,496, ,428 14,332,612 Total investments $ 39,095,789 $ 2,420,630 $ 41,516,419 September 30, 2013 Investment Type Unrestricted Restricted Total Local government investment pool $ 18,152,504 $ 973,770 $ 19,126,274 Certificates of deposit 11,170, ,000 11,419,000 U.S. Treasuries 5,106, ,653 5,280,047 U.S. Government Bonds 601, ,151 Municipal Bonds 17,635,142 1,049,791 18,684,933 Total investments $ 52,064,040 $ 3,047,365 $ 55,111,
44 Notes to Financial Statements For the Years Ended September 30, 2014 and 2013 NOTE 2. DEPOSITS AND INVESTMENTS - Continued Investments - Continued Unrestricted Funds As of September 30, 2014, the Port s unrestricted funds had the following investments: Weighted Average Investment Type Fair Value Maturity (Days) Local government investment pool $ 18,828, Certificates of deposit 6,225, U.S. Treasuries 546, Municipal Bonds 13,496, $ 39,095, As of September 30, 2013, the Port s unrestricted funds had the following investments: Weighted Average Investment Type Fair Value Maturity (Days) Local government investment pool $ 18,152, Certificates of deposit 11,170, U. S. Treasuries 5,106, Municipal Bonds 17,635, $ 52,064, Credit Risk As of September 30, 2014, the LGIP (which represent approximately 48% of the unrestricted portfolio) is rated AAAm by Standard and Poor s. The U.S. treasuries (which represent approximately 1% of the unrestricted portfolio) are rated AAA and Aaa by Standard and Poor s and Moody, respectively. The remaining portfolio is made up of Municipal Bonds (which represent approximately 35% of the unrestricted portfolio) and Certificates of Deposit (which represent approximately 16% of the unrestricted portfolio). As of September 30, 2013, the LGIP (which represent approximately 35% of the unrestricted portfolio) is rated AAAm by Standard and Poor s. The U.S. treasuries (which represent approximately 10% of the unrestricted portfolio) are rated AAA and Aaa by Standard and Poor s and Moody, respectively. The remaining portfolio is made up of Municipal Bonds (which represent approximately 34% of the unrestricted portfolio) and Certificates of Deposit (which represent approximately 21% of the unrestricted portfolio). Interest Rate Risk As a means of minimizing risk of loss due to interest rate fluctuations, the Investment Policy requires that individual investments not exceed six years and the overall portfolio maintain a weighted average of less than three years. Quality short-to-medium term securities should be purchased, which compliment each other in a structured manner that minimizes risk and meets the Port s cash flow requirements
45 Notes to Financial Statements For the Years Ended September 30, 2014 and 2013 NOTE 2. DEPOSITS AND INVESTMENTS - Continued Investments - Continued Restricted Funds As of September 30, 2014, the Port s restricted funds had the following investments: Weighted Average Investment Type Fair Value Maturity (Days) Local government investment pool $ 1,162, Certificates of deposit 249, U.S. Treasuries 172, Municipal Bonds 836, As of September 30, 2013, the Port s restricted funds had the following investments: $ 2,420, Weighted Average Investment Type Fair Value Maturity (Days) Local government investment pool $ 973, Certificates of deposit 249, U.S. Treasuries 173, U.S. Government Bonds 601, Municipal Bonds 1,049,792 1,060 $ 3,047, Credit Risk As of September 30, 2014, the LGIP (which represents approximately 48% of the restricted portfolio) is rated AAAm by Standard and Poor s. The U.S. Treasuries (which represent approximately 7% of the restricted portfolio) are rated AAA and Aaa by Standard and Poor s and Moody, respectively. The remaining portfolio is made up of Municipal Bonds (which represent approximately 35% of the restricted portfolio) and Certificates of Deposit (which represent approximately 10% of the restricted portfolio). As of September 30, 2013, the LGIP (which represents approximately 32% of the restricted portfolio) is rated AAAm by Standard and Poor s. The U.S. Treasuries (which represent approximately 6% of the restricted portfolio) are rated AAA and Aaa by Standard and Poor s and Moody, respectively. The remaining portfolio is made up of Municipal Bonds (which represent approximately 34% of the restricted portfolio), U.S. Government Bonds (which represent approximately 20% of the restricted portfolio), and Certificates of Deposit (which represent approximately 8% of the restricted portfolio). Interest Rate Risk As a means of minimizing risk of loss due to interest rate fluctuations, the Investment Policy requires that individual investments not exceed six years and the overall portfolio maintain a weighted average of less than three years. Quality short-to-medium term securities should be purchased, which compliment each other in a structured manner that minimizes risk and meets the Port s cash flow requirements
46 Notes to Financial Statements For the Years Ended September 30, 2014 and 2013 NOTE 2. DEPOSITS AND INVESTMENTS - Continued Investments - Continued Calculation of the net increase (decrease) in fair value of investments as of September 30, 2014 and 2013 utilizing the aggregate method is as follows: 2014 Unrestricted Restricted Total Fair value at September 30, 2014 $ 20,267,218 $ 1,257,646 $ 21,524,864 Add: Proceeds of investments sold 14,790, ,817 15,580,817 Less: Cost of investments purchased ( 1,597,567 ) ( 1,597,567 ) Less: Fair value at September 30, 2013 ( 33,911,535 ) ( 2,073,595 ) ( 35,985,130 ) Changes in fair value of investments for the year ended September 30, 2014 $( 451,884 ) $( 25,132 ) $( 477,016 ) 2013 Unrestricted Restricted Total Fair value at September 30, 2013 $ 33,911,535 $ 2,073,595 $ 35,985,130 Add: Proceeds of investments sold 18,370,000 1,901,456 20,271,456 Less: Cost of investments purchased ( 25,489,284 ) ( 2,099,348 ) ( 27,588,632 ) Less: Fair value at September 30, 2012 ( 27,151,259 ) ( 1,915,595 ) ( 29,066,854 ) Changes in fair value of investments for the year ended September 30, 2013 $( 359,008 ) $( 39,892 ) $( 398,900 ) These changes in fair value for the years ended September 30, 2014 and 2013 are reported as investment income. Derivatives The Port made no direct investments in derivatives during the years ended September 30, 2014 and 2013, and held no direct investments in derivatives at September 30, 2014 and Derivatives are investment products, which may be a security or contract, which derives its value from another security, currency, commodity, or index, regardless of the source of funds used
47 Notes to Financial Statements For the Years Ended September 30, 2014 and 2013 NOTE 3. ALLOWANCE FOR UNCOLLECTIBLE ACCOUNTS Taxes: Ad valorem taxes receivable are reserved based on historical experience and evaluation of collectivity as the lesser of a percentage of the original levy and the current receivable for each levy year. The allowance for uncollectable taxes as of September 30, 2014 and 2013 was $ 66,476 and $ 73,555, respectively. Trade Receivables: The allowance for uncollectable receivables related to Port services is determined based on historical experience and evaluation of collectivity in relation to the aging of customer accounts. The allowance for uncollectable receivables related to Port services at September 30, 2014 and 2013 was $ 26,316 and $ 48,557, respectively. NOTE 4: CAPITAL ASSETS The following is a summary of capital asset activity for the year ended September 30, 2014: Useful Life Balance Balance in Years Additions Deletions Capital assets, not being depreciated: Land & improvements $ 84,626,943 $ 799,417 $ $ 85,426,360 Construction in progress 2,604,422 2,221, ,444 4,463,870 Total capital assets, not being depreciated 87,231,365 3,021, ,444 89,890,230 Capital assets, being depreciated: Buildings 50 30,934, ,940 31,050,217 Docks & appurtenances ,831,758 56,831,758 Utilities ,965,048 1,607,620 20,572,668 Roads, lots & railways 50 7,681, ,413 8,414,133 Storage yards 50 21,036,660 21,036,660 Equipment, furniture & vehicles ,360,764 15,416,899 27,777,663 Other ,442,644 1,442,644 Total capital assets, being depreciated 149,252,871 17,872, ,125,743 Accumulated depreciation: Buildings 12,527,807 1,030,844 13,558,651 Docks & appurtenances 11,432,802 1,239,704 12,672,506 Utilities 4,574, ,911 5,412,655 Roads, lots & railways 2,551, ,140 2,787,468 Storage yards 5,212, ,581 5,831,088 Equipment, furniture & vehicles 8,369,928 1,199,407 9,569,335 Other 438, , ,849 Total accumulated depreciation 45,107,143 5,310, ,417,552 Total capital assets, being depreciated, net 104,145,728 12,562, ,708,191 Total capital assets, net $191,377,093 $ 15,583,772 $ 362,444 $206,598,
48 Notes to Financial Statements For the Years Ended September 30, 2014 and 2013 NOTE 4: CAPITAL ASSETS - Continued The following is a summary of capital asset activity for the year ended September 30, 2013: Useful Life Balance Balance in Years Additions Deletions Capital assets, not being depreciated: Land & improvements $ 71,932,840 $ 12,694,103 $ $ 84,626,943 Construction in progress 40,270, ,448 38,146,414 2,604,422 Total capital assets, not being depreciated 112,203,228 13,174,551 38,146,414 87,231,365 Capital assets, being depreciated: Buildings 50 28,808,427 2,439, ,477 30,934,277 Docks & appurtenances ,808,269 30,028,736 5,247 56,831,758 Utilities ,677,133 1,298,930 11,015 18,965,048 Roads, lots & railways 50 6,436,624 1,289,384 44,288 7,681,720 Storage yards 50 21,149, ,381 21,036,660 Equipment, furniture & vehicles ,175,443 1,185,321 12,360,764 Other , , ,442,644 Total capital assets, being depreciated 113,035,748 36,704, , ,252,871 Accumulated depreciation: Buildings 11,659, ,485 70,685 12,527,807 Docks & appurtenances 10,662, ,946 5,247 11,432,802 Utilities 3,779, ,063 3,728 4,574,744 Roads, lots & railways 2,377, ,188 17,280 2,551,328 Storage yards 4,631, ,645 42,843 5,212,507 Equipment, furniture & vehicles 7,311,483 1,058,445 8,369,928 Other 324, , ,027 Total accumulated depreciation 40,745,296 4,502, ,633 45,107,143 Total capital assets, being depreciated, net 72,290,452 32,201, , ,145,728 Total capital assets, net $184,493,680 $ 45,376,452 $ 38,493,039 $191,377,
49 Notes to Financial Statements For the Years Ended September 30, 2014 and 2013 NOTE 4 CAPITAL ASSETS - Continued The Port has entered into contracts for construction as of September 30, 2014 as follows: Project Required Authori- Expended Remaining Further zation To Date Commitment Financing Consulting $ 1,792,658 $ 1,406,521 $ 386,137 $ Administration Building 460, , ,283 Truck Transfer Station 290,551 20, ,771 Inner Harbor Berth Repairs 68,450 47,630 20,820 Velasco Terminal Berth 8 1,897,936 78,857 1,819,079 Velasco Terminal Berth 9 1,897,936 78,857 1,819,079 Gate 14 Guard House 338, , ,602 M & R Railroad Track Renovation 911, , ,613 Velasco Terminal Backlands Phase II 21,067,778 1,137,475 19,930,303 Electrical Distribution 815,469 75, ,469 Total $ 29,541,309 $ 3,558,153 $ 25,983,156 $ -0- The Port has entered into contracts for construction as of September 30, 2013 as follows: Project Required Authori- Expended Remaining Further zation To Date Commitment Financing Administration Building $ 99,949 $ 71,808 $ 28,141 $ Crane Rail System 713,450 44, ,300 Velasco Terminal Crane Electrical System 1,598, ,350 1,425,869 Warehouse , ,551 Maintenance Shop Repairs 16,475 14,004 2,471 Consulting 784, , ,526 Velasco Terminal Phase 1 Berth 7 18,945,397 18,356, ,397 Total $ 22,448,441 $ 18,978,186 $ 3,470,255 $
50 Notes to Financial Statements For the Years Ended September 30, 2014 and 2013 NOTE 5. LONG-TERM DEBT AND NON-CURRENT LIABILITIES Non-current liabilities activity for the year ended September 30, 2014 was as follows: Balance Balance Due Within Additions Reductions One Year General obligation bonds $ 6,247,930 $ 17,070 $ 950,000 $ 5,315,000 $ 1,000,000 Revenue bonds 52,600,000 14,890,000 37,710,000 1,820,000 Note payable 14,100,000 14,100,000 1,269,794 Components of Long-Term Debt: Premium on bonds 91,278 15,518 75,760 15,518 Accrued bond interest 352, , , , ,880 Compensated absences 183, , , ,805 80,158 Total non-current liabilities $ 59,474,907 $ 14,595,597 $ 16,311,059 $ 57,759,445 $ 4,534,350 Non-current liabilities activity for the year ended September 30, 2013 was as follows: Balance Balance Due Within Additions Reductions One Year General obligation bonds $ 7,111,513 $ 16,417 $ 880,000 $ 6,247,930 $ 950,000 Revenue bonds 34,805,000 52,600,000 34,805,000 52,600,000 14,890,000 Components of Long-Term Debt: Premium on bonds 134,910 43,632 91,278 15,518 Accrued bond interest 631, , , , ,669 Compensated absences 163, , , , ,000 Total non-current liabilities $ 42,846,803 $ 53,091,181 $ 36,463,077 $ 59,474,907 $ 16,308,187 General Obligation Bonds Payable: The Unlimited Tax Refunding Bonds, Series 2006, were issued in November, The proceeds from the $ 6,330,000 of Unlimited Tax Refunding Bonds, Series 2006, were placed in an escrow account and will be used through August 15, 2017 to completely call the remaining Port Freeport Unlimited Tax Bonds, Series By this action the Port will have affected the defeasance of the refunded bonds. The difference between the cash flow required to service the new debt and complete the refunding at the date of the refunding was $ 486,452. The economic gain resulting from the transaction was $ 373,018. The remaining bonds were redeemed on August 31, At September 30, 2014 the balance held in escrow was $ 1,120,091 and the bonds outstanding were $ 1,075,000. The Series 2006 bonds are dated November 15, 2006 with a final maturity of August 15, 2019 and bear interest ranging from 3.5% to 5.5% per annum, payable semi-annually on February 15 and August 15. The issuance of the Unlimited Tax Refunding Bonds, Series 2006, resulted in an additional cost (difference between the reacquisition price and the new carrying amount of the old debt) of $ 180,836 and bond issuance costs of $ 125,926.. The bond resolution for the 2006 Series general obligation bonds obligates the Port annually to assess and cause to be collected property taxes sufficient to pay current principal and interest due on the bonds
51 Notes to Financial Statements For the Years Ended September 30, 2014 and 2013 NOTE 5. LONG-TERM DEBT AND NON-CURRENT LIABILITIES Continued For the years ended September 30, 2014 and 2013, the amount of ad valorem taxes collected for interest and sinking was $ 1,335,739 and $ 1,147,261, while the debt service requirements for principal and interest were $ 1,207,703 and $ 1,155,362 which utilized a portion of existing net position. The bond resolutions provide no express remedies in the event of default and make no provision for acceleration of maturity of the bonds. Annual debt service requirements to maturity for General Obligations Bonds are as follows: Fiscal Year Total Ending Principal September 30 Principal Interest and Interest 2015 $ 1,000,000 $ 227,676 $ 1,227, ,005, ,676 1,192, ,060, ,400 1,192, ,105,000 90,000 1,195, ,145,000 45,800 1,190,800 Total $ 5,315,000 $ 683,552 $ 5,998,552 There was $ 17,070 difference between the bonds outstanding at September 30, 2013 of $ 6,247,930 and the bond principal requirements of $ 6,265,000 which represents the amount of capital appreciation bonds to be accreted as interest over the life of these bonds. These capital appreciation bonds were paid off during the year ended September 30, 2014 Revenue Bonds Payable: On June 13, 2013, the Port issued $ 33,065,000 of Senior Lien Revenue Refunding Bonds, Series 2013A, for the advance refunding of previously issued outstanding revenue bonds (Series 2008). The Port placed the proceeds of the refunding issue in an escrow fund. The escrow fund is irrevocably pledged to the payment of principal and interest on the issues being refunded. The difference between the cash flow required to service the new debt and complete the refunding at the date of the refunding was $ 17,516. The economic gain resulting from the transaction was $ 4,372,600. The funds of the escrow account were used to purchase federal securities which will mature at such times and yield interest sufficient to pay the principal and interest on the Refunded Bonds when due. By this action, the Port has affected the defeasance of the Refunded Bonds. Accordingly, the Refunded Bonds are considered to be extinguished and do not appear as a liability in the statement of net position. The proceeds were used to pay $ 33,398,166 into an escrow account and later utilized to pay off the refunded bonds on June 17, On June 13, 2013, the Port also issued $ 13,670,000 of Senior Lien Revenue Notes (Bonds), Series 2013B and $ 5,865,000 of Senior Lien Revenue Notes (Bonds), Series 2013C. The proceeds of both issuances were used to complete the construction of the new Velasco Terminal and the resulting expansion of the related business. The Series 2013B notes have a final maturity date of June 1, 2016 and bear interest monthly at 70% of the 1-month BBA LIBOR rate plus 66 basis points. The Series 2013C notes have a final maturity date of June 1, 2014 and bear interest monthly at the 1-month BBA LIBOR rate plus 89 basis points
52 Notes to Financial Statements For the Years Ended September 30, 2014 and 2013 NOTE 5. LONG-TERM DEBT AND NON-CURRENT LIABILITIES Continued Revenue Bonds Payable - Continued Annual debt service requirements to maturity for the revenue bonds are as follows: Series 2013A: Fiscal Year Total Ending Principal September 30 Principal Interest and Interest 2015 $ 1,820,000 $ 963,116 $ 2,783, ,880, ,060 2,787, ,935, ,156 2,784, ,990, ,558 2,779, ,055, ,266 2,783, ,265,000 2,652,342 13,917, ,325, ,114 11,132,114 Series 2013B: $ 31,270,000 $ 7, $ 38,966,612 Fiscal Year Total Ending Principal September 30 Principal Interest and Interest 2015 $ $ 51,150 $ 51, ,150 51, ,560,000 32,800 4,592, ,880,000 3,702 1,883,702 Total Revenue Bonds: $ 6,440,000 $ 138,802 $ 6,578,802 Fiscal Year Total Ending Principal September 30 Principal Interest and Interest 2015 $ 1,820,000 $ 1,014,266 $ 2,834, ,880, ,210 2,838, ,495, ,956 7,376, ,870, ,260 4,663, ,055, ,266 2,783, ,265,000 2,652,342 13,917, ,325, ,114 11,132,114 $ 37,710,000 $ 7,835,414 $ 45,545,
53 Notes to Financial Statements For the Years Ended September 30, 2014 and 2013 NOTE 5. LONG-TERM DEBT AND NON-CURRENT LIABILITIES Continued Note Payable: On September 30, 2014, the Port entered into a note payable ( Master Lease-Purchase Financing Agreement ) with Chase Bank in the amount of $ 14,100,000. The note calls for annual principal and interest payments beginning on September 30, 2015 and ending on September 30, The note has an interest rate of 2.306%. The note payable represents a refinancing of two cranes purchased during the year ended September 30, 2014, including $ 1,410,000 placed in escrow account until the final payment for the crane purchase. The remaining $ 12,690,000 represents a reimbursement of prior payments, based on a Reimbursement Agreement (Resolution Expressing Intent to Finance Expenditures Incurred) adopted by the Board of Commissioners on August 8, Annual debt service requirements to maturity for the note payable are as follows: Fiscal Year Total Ending Principal September 30 Principal Interest and Interest 2015 $ 1,269,794 $ 325,146 $ 1,594, ,299, ,865 1,594, ,329, ,908 1,594, ,359, ,260 1,594, ,391, ,906 1,594, ,451, ,319 7,974,702 NOTE 6. EXTRAORDINARY REVENUES (EXPENSES) $ 14,100,000 $ 1,849,404 $ 15,949,404 During the year ended September 30, 2013 the Port incurred extraordinary costs of $ 9,236,000, as a result of the vertical and horizontal movement of the dock at the newly constructed Velasco Terminal, Berth 7, Port Freeport, Texas which was discovered in the year ended September 30, These costs were for engineering services to determine the cause of the dock movement and also for engineering and construction costs related to stopping the movement of the dock and for reconstruction of the dock. Legal and expert fees of $ 2,106,388 for the years ended September 30, 2013 have been incurred which are also directly associated with the Velasco terminal issue. Extraordinary revenues of $ 13,095,000 for the year ended September 30, 2013 represent amounts from a settlement and insurance reimbursements of costs which relate to the Velasco Terminal issue. There were no extraordinary revenues or costs for the year ended September 30, NOTE 7. CONTINGENT LIABILITIES The Port is contingently liable in respect to lawsuits and other claims in the ordinary course of its operations. The potential settlement (if any) of such contingencies under the budgetary process would require appropriation of revenues yet to be realized and would not materially affect the financial position of the Port at September 30, 2014 or NOTE 8. LITIGATION A suit was filed by the Port in the 239 th Judicial District Court of Brazoria County, Texas against Goldston Engineering, Inc., CH2M Hill, Inc., Professional Services Industries, Inc., Zurich American Insurance Company and Lexington Insurance Company for damages resulting from the vertical and horizontal movement of the dock at the Velasco Terminal, Berth 7, Port Freeport, Texas, which was discovered in late March or early April,
54 Notes to Financial Statements For the Years Ended September 30, 2014 and 2013 NOTE 8. LITIGATION - Continued During the year ended September 30, 2013 a settlement was reached and a final settlement payment was received by the Port to settle all outstanding matters related to damages incurred by the Port at the Velasco Terminal, Berth 7. The settlement amount was recorded as an extraordinary revenue for the year ended September 30, A personal injury claim was filed by an individual who has alleged injuries sustained while acting as an independent contractor at Port Freeport. The individual, by and through his attorney, has demanded damages in the sum of $ 200,000. Port Freeport believes the cost of defense and the alleged damages are covered by insurance, which insurance carriers have been notified of this claim. A suit was filed in the 412 th District Court, Brazoria County, Texas. A settlement was reached and approved on October 2014 with no material loss occuring. NOTE 9. FREEPORT HARBOR IMPROVEMENT PROJECTS On November 17, 1986, President Reagan signed into law The Waterway Development Act of This Act authorized the funding of the Freeport Harbor, Texas Channel Widening and Deepening project, known as the 45-Foot Project, at an estimated project cost of $ 88,600,000 of which $ 29,200,000 is to be the Port s non-federal share. During 1992 the Port approved a change order, which increased the total cost of the project by $ 2,405,000. Currently the Port is involved in this cost-sharing project with the U.S. Army Corps of Engineers. The Port maintains investments in an escrow account at a financial institution trust department, which is available for draws by the U.S. Army Corps of Engineers as construction progresses. The funds in the escrow account are restricted for use by the U.S. Army Corps of Engineers on the 45-Foot Project. Once deposited, the Port cannot withdraw any funds from the escrow account other than investment earnings, which are remitted to the Port monthly. Once the 45-Foot Project is complete, any funds remaining in the escrow account will be released for unrestricted use only upon the U.S. Army Corps of Engineer s approval. The following is a summary of the activity in the Escrow Fund for the years ended September 30, 2014 and 2013: Escrow balance, October 1, $ 14,066 $ 14,566 Investment earnings 2 Fiduciary fees ( 500 ) ( 500 ) Escrow balance, September 30, $ 13,568 $ 14,066 On July 15, 1997, the Port and the Department of the Army approved Modification No. 4 of the agreement referred to above. As part of this modification, the U.S. Army Corps of Engineers agreed to provide specific requirements relating to the construction, operation and maintenance of land-based aquatic dredged material disposal facilities required for the project for which a contract for construction of such facilities was awarded in October $ 636,051 was reported as accounts receivable as of September 30, 2014 and 2013, respectively
55 Notes to Financial Statements For the Years Ended September 30, 2014 and 2013 NOTE 10. LEASING OPERATIONS Operating Leases: The Port owns various types of property that are held for lease. There are four types of leases: ground leases, grazing leases, warehouse leases and office space leases, all of which are accounted for as operating leases and are included in current operating income. The terms of the leases expire in various years through The Port has not determined the cost of the specific tracts of land under lease. The cost of the lease facilities as of September 30, 2014 and 2013 was $ 55,866,520 and $ 55,806,146, respectively, and accumulated depreciation was $ 23,766,563 and $22,083,220, respectively. Lease revenue for the years ended September 30, 2014 and 2013 was $ 6,955,488 and $ 6,344,343, respectively. During the year ended September 30, 2007 the Port paid a $ 155,059 lease incentive to an existing lease customer to make space available for another tenant. The payment has been recorded in accordance with guidance per Financial Accounting Standard Board ( FASB ) Technical Bulletin The Port executed a new 15 year agreement. The lease incentive is being amortized over the life of the new agreement and is reflected in the Statement of Revenues, Expenditures and Changes in Net Position as a reduction in service, facility use and other fees revenues. Amortization for the years ended September 30, 2014 and 2013 was $ 10,512 and $ 10,512. As of September 30, 2014, the long-term portion of the lease incentive of $ 60,446 has been recorded as other long-term asset while the current portion of $ 10,512 is included as a prepaid asset on the accompanying Statement of Net Position. Minimum future rentals to be received on noncancelable leases as of September 30, 2014 are as follows: Fiscal Year Ending September $ 8,401, ,157, ,453, ,107, ,683, ,888, ,509, ,030, ,920,721 Total minimum future rentals $ 250,127,
56 Notes to Financial Statements For the Years Ended September 30, 2014 and 2013 NOTE 11. GRANT REVENUE The following is a schedule of port grant revenue for the years ended September 30, 2014 and Remaining Total Pre-2013 Revenue Revenue Project Agency Grant Number Entitlement Revenues US Department of Homeland Security: Homeland Security 2008-GB-T8-K056 $ 3,451,502 $ 351,212 $ 2,718,812 $ $ Homeland Security 2009-PU-T9-K026 2,504,446 57,077 1,508,757 Homeland Security 2009-PU-R ,940,032 1,887,423 Homeland Security 2010-PU-T0-K001 1,712, ,529 1,511,886 Homeland Security 2011-PU-K ,354,831 47, ,828 1,016,046 36,672 Homeland Security 2013-PU S01 308,045 26, ,875 Totals $11,271,271 $ 2,342,997 $ 4,682,926 $ 1,042,216 $ 1,830,433 Accounts receivable related to these grants as of September 30, 2014 and 2013 totaled $ 127,413 and $ 318,133, respectively and are included in the receivables from other governments line item in the accompanying Statements of Net Position. NOTE 12. RISK MANAGEMENT The Port is exposed to various risks of loss related to torts; theft of, damage to, and destruction of assets; errors and omissions; injuries to employees; and natural disasters. The Port maintains commercial insurance for these types of risks. There have been no significant changes in insurance coverage, and no settlements have significantly exceeded insurance coverage for the years ending September 30, 2014 and The Port provides a commercial medical insurance program for its employees. NOTE 13. RETIREMENT PLANS Profit Sharing Plan: The Port provides a flexible, nonstandardized safe harbor profit sharing plan (Plan), defined contribution type, for the benefit of its employees that is administered by MassMutual Financial Group. The Plan covers all full-time employees, which have worked a twelve (12) consecutive month period. The Plan functions for the benefit of the employees and their beneficiaries. The Port s contribution to the Plan is to be determined from year to year and is limited to the amount allowable under the Internal Revenue Code. The Port s Commission appoints the Plan trustee. The Plan is not reported in the Port s basic financial statements
57 Notes to Financial Statements For the Years Ended September 30, 2014 and 2013 NOTE 13. RETIREMENT PLANS - continued The Port Freeport Retirement Plan ( Plan ) became effective on December 1, 2000 and maintains a calendar year end. The Port contributed $ 124,297 ($ 29,319 calendar year 2013 and $ 94,978 for calendar 2014) to the plan for the year ended September 30, The Port contributed $ 105,104 ($ 29,410 calendar year 2012 and $ 75,694 for calendar 2013) to the plan for the year ended September 30, Participants do not contribute to the plan. The trustees of the plan distribute any benefits provided by the plan from net position available for plan benefits. The participants become fully vested in their account after five years of service (years 1 and 2 at 0%, year 3 at 50%, year 4 at 75%, and year 5 at 100%). All of an employee s years of vesting service with the Port are counted to determine the vesting percentage in the participant s individual account. An employee must maintain 1,000 hours of service to constitute a year of vesting service, and 500 hours of service must be exceeded to avoid a break in vesting service. The contributions made by the Port are allocated to each participant s account based on the Commission approved percentage. Forfeited invested amounts are allocated first to the payment of the plan s administrative expenses and any excess applied to reduce the Port profit sharing contributions for any plan year subsequent to the plan year for which the forfeitures arise. The normal retirement age under the plan is sixty-five. When a participant retires, terminates employment or becomes disabled, he/she are entitled to receive all amounts in which he/she has a vested interest in either a lump-sum payment, periodic installments, or an annual annuity contract. Participants are allowed to make hardship withdrawals and loans as defined by the plan. The Plan has met the ERISA minimum funding requirements. Deferred Compensation Plan: The Port also offers its employees a deferred compensation plan (457 Plan) created in accordance with Internal Revenue Code Section 457. The 457 Plan is administered by MassMutual Financial Group and is available to all full time employees which have worked a twelve (12) consecutive month period. The 457 Plan functions for the benefit of the employees and their beneficiaries. Participants may contribute up to the amount allowable under the provisions of the Internal Revenue Code. The Port matches participant contributions up to 3% of the participant s base wages as defined in the 457 Plan. The Port s Commission appoints the Plan trustee. The 457 Plan is not reported in the Port s basic financial statements. The 457 Plan became effective October 1, 2002 and maintains a calendar year-end. The Port contributed $ 40,716 and $ 35,944 to the 457 Plan for the years ended September 30, 2014 and 2013, respectively. Participant contributions for the years ended September 30, 2014 and 2013 totaled $ 74,641 and $ 89,491, respectively. The trustee of the plan distributes any benefits provided by the plan from net position available for plan benefits. Contributions made by participants vest immediately in their accounts; however, contributions made by the Port vest in the participants accounts fully over five years of service (years 1 and 2 at 0%, year 3 at 50%, year 4 at 75% and year 5 at 100%). All of an employee s years of vesting service with the Port are counted to determine the vesting percentage in the participant s individual account. An employee must maintain 1,000 hours of service to constitute a year of vesting service, and 500 hours of service must be exceeded to avoid a break in vesting service. Forfeited invested amounts are allocated first to the payment of the plan s administrative expenses and any excess applied to reduce the Port s discretionary contributions for any plan year subsequent to the plan year for which the forfeitures arise. When a participant retires, terminates employment or becomes disabled, he/she is entitled to receive all amounts in which he/she has a vested interest in either a lump-sum payment, periodic installments, or an annual annuity contract. Participants are allowed to make hardship withdrawals and loans as defined by the 457 Plan. The 457 Plan has met the ERISA minimum funding requirements
58 Notes to Financial Statements For the Years Ended September 30, 2014 and 2013 NOTE 14. REVENUE BONDS ISSUED ON BEHALF OF OTHERS Pollution Control Revenue Bonds: In 1973, the Texas legislature enacted the Clean Air Financing Act, and among other provisions, the legislature authorized certain governmental entities, including districts organized under Article 16, Section 59 of the Constitution, to issue on behalf of users, negotiable bonds to pay cost related to the acquisition, construction, or improvement of air control facilities, such bonds to be retired by revenues received by the issuer from the user. Further, in 1977, the Texas Legislature enacted the Regional Waste Disposal Act, setting forth the authority and procedures for certain governmental entities, including districts created under Article 16, Section 59, of the Constitution, to issue revenue bonds to pay the costs to acquire, construct, improve, enlarge, extend, operate and maintain disposal systems and such bonds to be secured by pledge of revenue derived from any contract between issuer and user, entered into under the provisions of the Act for financing such costs. In accordance with the above authorization, Port Freeport has and continues to act as issuer for and on behalf of local industrial users of pollution control revenue bonds to finance the construction of air pollution control facilities, water quality facilities and solid waste disposal facilities. These bonds do not constitute indebtedness of the Port and are not reported in the Port s financial statements. These bonds are secured solely by the revenues of the commercial enterprise on whose behalf they are issued. Pollution Control Revenue Bond series issued by Port Freeport on behalf of others with principal still outstanding at September 30, 2014 and 2013 are as follows: Balance Balance Issue Maturity Original Outstanding Outstanding Name of Receiving Entity Date Date Issue Dow Chemical Company $ 466,650,000 $ 466,650,000 $ 466,650,000 Dow Chemical Company ,000,000 15,000,000 15,000,000 Dow Chemical Company ,000,000 75,000,000 75,000,000 BASF Corporation ,000,000 25,000,000 25,000,000 BASF Corporation ,000,000 25,000,000 25,000,000 BASF Corporation ,000,000 25,000,000 25,000,000 BASF Corporation ,000,000 25,000,000 25,000,000 Merey Sweeny, L.P ,000,000 25,000,000 25,000,000 Merey Sweeny, L.P ,000,000 25,000,000 25,000,000 Merey Sweeny, L.P ,500,000 12,500,000 12,500,000 Merey Sweeny, L.P ,500,000 12,500,000 12,500,000 Merey Sweeny, L.P ,500,000 12,500,000 12,500,000 Merey Sweeny, L.P ,500,000 12,500,000 12,500,000 Total $ 756,650,000 $ 756,650,000 $ 756,650,000 Industrial Development Bonds: In 1979 the Texas Legislature enacted the Development Corporation Act of 1979 which authorized certain governmental entities, including districts organized under Article 16, Section 59, of the Constitution, to authorize the creation of a nonprofit corporation for the purpose of issuing bonds on behalf of the governmental unit for the purpose of financing manufacturing and industrial facilities, transportation facilities (including but not limited to airports, ports, mass commuting facilities and parking facilities), in furtherance of the public purposes of the Act. Brazos Harbor Industrial Development Corporation (IDC) is the financing arm of Port Freeport for the issuance of industrial development bonds on behalf of various users for the financing of the type of facilities above enumerated related to industrial development. Port Freeport s commissioners have the right of refusal on the issuance of bonds by the IDC. These bonds are secured solely by the revenues of the commercial enterprises on whose behalf they are issued
59 Notes to Financial Statements For the Years Ended September 30, 2014 and 2013 NOTE 14. REVENUE BONDS ISSUED ON BEHALF OF OTHERS - Continued Industrial Development Bond series issued by the IDC on behalf of others with principal still outstanding at September 30, 2014 and 2013 are as follows: Balance Balance Issue Maturity Original Outstanding Outstanding Name of Receiving Entity Date Date Issue American Rice, Inc $13,300,000 $13,300,000 $13,300,000 American Rice, Inc ,000,000 15,000,000 15,000,000 BASF Corporation ,500,000 26,500,000 26,500,000 BASF Corporation ,000,000 25,000,000 25,000,000 BASF Corporation ,000,000 50,000,000 50,000,000 Total $129,800,000 $ 129,800,000 $ 129,800,000 NOTE 15. ECONOMIC DEPENDENCY Operating revenues: During the year ended September 30, 2014, three customers represented approximately 31%, 15% and 12% of the Port s operating revenue. During the year ended September 30, 2013, three customers represented approximately 39%, 14% and 11% of the Port s operating revenue. The loss of these customers would have a significant impact on the Port s financial position. Ad valorem taxes: During the years ended September 30, 2014 and 2013, one taxpayer represented approximately 21% of the total assessed valuation. NOTE 16. EVALUATION OF SUBSEQUENT EVENTS The Port has evaluated subsequent events through January 30, 2015, the date which the financial statements were available to be issued
60 - 59 -
61 Table of Contents Contents Page Operating Information These schedules contain Port cargo traffic data to help the reader understand how the information in the Port s financial report relates to the services the Port provides and the activities it performs. Financial Trends These schedules contain trend information to help the reader understand how the Port s financial performance and well-being have changed over time. Ad Valorem Tax Information These schedules contain information to help the reader assess the Port s nonoperating revenue source, the property tax. Debt Capacity These schedules present information to help the reader assess the affordability of the Port s current levels of outstanding debt and the Port s ability to issue additional debt in the future. Demographic and Economic Information These schedules offer demographic and economic indicators to help the reader understand the environment within which the Port s financial activities take place
62 Ten Year Cargo Quantities Analysis for the Fiscal Years Ended September 30, 2005 through 2014 TABLE 1 Cargo Quantities Percent Total Short Tons Port Tonnage Rice 2,636, % Bananas and Misc. Fruit 3,996, Misc./General Cargo 4,731, Dry Bulk Material 4,113, Liquid Bulk Material 2,593, Project Cargo 223, Chemicals 25, ,319, % Source-Port Freeport Chemicals Classification - Components: Misc. Chemicals, Polyethylene, PVC Resin Misc./General Cargoes - Components: Roll Paper, Cotton, Automobiles, Empty Containers, Nickel Ore Components: Liquefied Natural Gas, Liquid Bulk Naptha Components: Aggregate Components: Containerized Fruit/Palletized Fruit Components: Windpower Components, Steel Rail, Pipe, Industry Project Components Container Traffic Statistics Twenty-Foot Equivalent Units (T.E.U.) for the Fiscal Years Ended September 30, 2005 through 2014 TABLE 2 Percent Fiscal Inbound Outbound Growth/(Reduction) Year T.E.U. T.E.U. Total From Prior Year ,192 37,694 75, % ,226 38,630 76, ,426 37,544 74,970 (2.45) ,296 37,326 74, ,182 35,952 71,134 (4.67) ,416 36,706 72, ,416 33,894 67,310 (6.67) ,052 35,528 70, ,140 50, , ,733 49,317 98,050 (2.74) Source-Port Freeport
63 Cargo Traffic Statistics for the Fiscal Years Ended September 30, 2005 through Rice 170,431 7 % 285, % 293, % 189, % 2. Bananas/Misc. Fruit 371, , , , Misc./General Cargo 495, , , , Dry Bulk Material 1,195, , , , Liquid Bulk Material 370, , , , Project Cargo 33, , , , Chemicals Annual Port Tonnage -Short Tons 2,636, % 2,016, % 1,706, % 2,102, % Percent Export % % % % Percent Import Percent Domestic Source-Port Freeport Chemicals Classification - Components: Misc. Chemicals, Polyethylene, PVC Resin Misc./General Cargoes - Components: Roll Paper, Cotton, Automobiles, Empty Containers, Nickel Ore Components: Liquefied Natural Gas, Liquid Bulk Naptha Components: Aggregate Components: Containerized Fruit/Palletized Fruit Components: Windpower Components, Steel Rail, Pipe, Industry Project Components TARE weight not included
64 TABLE ,766 8 % 126,316 7 % 183, % 299, % 468, % 481, % 429, , , , , , , , , , , , , , , , , , , , , , , , , , , , ,806, % 1,506, % 1,728, % 1,496, % 1,583, % 1,736, % % % % % % %
65 Net Position by Component For The Years 2005 Through (Restated) (Restated) Net Position: Net investment in capital assets $ 149,397,661 $ 132,423,882 $ 142,112,999 $ 141,431,909 Restricted: Debt Service 2,762,928 2,767,814 2,471,425 2,677,543 Capital Projects 15,700 16,199 16,698 17,196 Unrestricted 42,729,110 53,881,956 35,071,249 33,506,284 Total net position $ 194,905,399 $ 189,089,851 $ 179,672,371 $ 177,632,
66 TABLE 4 $ 139,263,051 $ 124,837,211 $ 106,041,805 $ 108,607,433 $ 102,487,808 $ 98,648,579 2,562,125 2,654,335 2,284, , ,071 3,538,134 21,495 25,888 15,020,117 21,967 1,195,255 3,067,673 29,368,269 37,082,280 33,888,790 39,628,907 33,499,583 20,292,881 $ 171,214,940 $ 164,599,714 $ 157,235,077 $ 148,393,300 $ 137,345,717 $ 125,547,
67 Summary of Revenues, Expenses and Changes in Net Position For The Years 2005 Through (Restated) (Restated) Operating Revenues: Harbor Operations: Wharfage $ 3,896,689 $ 3,149,424 $ 3,236,202 $ 2,951,064 Dockage 1,763,042 1,353,107 1,605,188 1,977,324 Service, facility use and other fees 4,191,757 4,112,112 3,757,046 4,950,088 Lease income 6,955,488 6,344,343 5,944,957 5,696,372 Miscellaneous 188,619 35, ,024 11,583 Total operating revenues 16,995,595 14,994,388 14,771,417 15,586,431 Operating Expenses: Payroll and related 4,005,446 3,858,186 3,607,483 3,710,206 Professional services 1,432,875 1,634,189 1,535,977 1,386,515 Supplies and other 2,489,337 2,316,959 2,056,434 2,210,135 Utilities 494, , , ,698 Maintenance and repairs 760, , , ,300 Depreciation 5,310,409 4,502,480 3,998,418 3,709,807 Total operating expenses 14,492,667 13,864,620 12,316,133 12,170,661 Operating income (loss) 2,502,928 1,129,768 2,455,284 3,415,770 Non-Operating Revenues (Expenses): Ad valorum tax collections, net of collection expenses 4,672,390 5,246,302 5,017,130 5,060,167 Investment income 265,046 ( 59,682) 114, ,015 Gain (loss) on sale of capital assets 17,965 4,500 Debt interest and fees ( 1,285,213) ( 2,163,797) ( 2,034,252) ( 2,195,700) Other ( 1,381,819) ( 1,188,604) 122,074 ( 476,356) Total non-operating revenues (expenses) 2,270,404 1,852,184 3,219,225 2,534,626 Income (loss) before capital contributions 4,773,332 2,981,952 5,674,509 5,950,396 Capital contributions -grants 1,042,216 4,682,926 2,290,517 2,269,196 Capital contributions -other Total capital contributions 1,042,216 4,682,926 2,290,517 2,269,196 Extraordinary Revenues (Expenses): Insurance and other proceeds - Berth 7 13,095, ,541 5,659,125 Construction cost - Berth 7 ( 9,236,010) ( 5,773,285) ( 5,946,339) Legal and expert fees - Berth 7 ( 2,106,388) ( 1,122,843) ( 1,115,013) Total extraordinary revenues (expenses) 0 1,752,602 ( 5,925,587) ( 1,402,227) Change in net position $ 5,815,548 $ 9,417,480 $ 2,039,439 $ 6,817,
68 TABLE 5 $ 3,130,735 $ 2,577,245 $ 1,908,272 $ 1,706,555 $ 1,686,554 $ 1,509,278 1,463,269 1,246,154 1,407,643 1,176,209 1,114,831 1,064,267 3,929,599 3,715,210 3,349,964 2,996,296 2,471,406 1,988,210 5,513,072 5,104,487 5,461,429 4,861,294 4,847,531 4,235,213 14,571 31, , , ,375 84,149 14,051,246 12,674,977 12,592,490 11,081,554 10,341,697 8,881,117 3,520,049 3,350,988 3,216,104 2,750,632 2,563,143 2,301,071 1,006,587 1,387,336 1,177,484 1,036,471 1,281, ,519 2,167,854 2,093,330 2,133,667 1,893,418 1,820,520 1,663, , , , , , , , , , , , ,246 3,272,302 3,021,853 2,976,874 2,236,176 2,103,234 1,913,376 11,350,626 10,959,661 10,669,018 8,962,906 8,663,109 7,603,771 2,700,620 1,715,316 1,923,472 2,118,648 1,678,588 1,277,346 5,255,410 5,650,052 5,641,225 5,776,916 5,636,883 5,499, , ,457 1,699,266 2,146,892 1,292, ,981 2,350 5,383 2,601 4,300 ( 308,533) ( 2,354,736) ( 1,125,130) ( 521,691) ( 477,829) ( 628,000) ( 801,351) ( 632,829) ( 719,886) ( 442,597) ( 652,900) 3,049,972 ( 397,000) 2,942,154 4,404,843 6,381,586 6,795,680 9,355,227 4,548,721 5,642,774 6,120,159 8,305,058 8,914,328 11,033,815 5,826, ,749 1,087, ,996 1,907, , , , ,346 17, , , , ,452 1,244, ,719 2,133, ,635 1,401, $ 6,615,226 $ 7,364,637 $ 8,841,777 $ 11,047,583 $ 11,798,450 $ 7,227,
69 Property Tax Rates Direct and Overlapping Governments for the Levy Years 2004 through Port Freeport $ $ $ Overlapping Governments: Alvin I.S.D Alvin Community College Angleton, City of Angleton Drainage District Angleton I.S.D Angleton-Danbury Hospital Brazoria, City of Brazoria County Brazoria County FWD # Brazosport College Brazosport I.S.D Clute, City of Columbia/Brazoria I.S.D Commodore Cove I.D Danbury, City of Danbury Drainage District Danbury I.S.D Freeport, City of Jones Creek, Village of Lake Jackson, City of Liverpool, City of Oak Manor U.D Oyster Creek, City of Quintana, Town of Richwood, City of Surfside, Village of Sweeny, City of Sweeny Hospital District Sweeny I.S.D Treasure Island M.U.D Varner Creek M.U.D Velasco Drainage District West Brazoria County Drainage District # West Columbia, City of Source--Brazoria County Appraisal District Property taxes are levied annually in October. Property tax rates are per $100 taxable valuation
70 TABLE $ $ $ $ $ $ $
71 Valuation, Exemptions and General Obligation Debt for Fiscal Year Ended September 30, 2014 (In Thousands) TABLE Market Valuation: (excluding totally exempt property) Land, Homesite $ 775,022 Land, Non Homesite 754,906 Land, Ag and Timber Market 706,369 Improvement, Homesite 3,649,557 Improvement, Non-Homesite 6,389,187 Non Real, Personal Property 2,842,272 Non Real, Mineral 106,703 Total Market Value Before Exemptions $ 15,224,016 Less Exemptions/Reductions at 100% Market Value: Homestead Exemptions $ 616,459 Over 65 Homesteads Exemptions 695,356 Disabled Exemptions 117,124 Abatements 48,649 Freeport Loss 476,691 Pollution Control 691,241 Productivity Loss 662,240 Tax Exempt 1,409,516 Other 2,615 Total Exemptions $ 4,719,891 Net 2013 Taxable Valuation $ 10,504,125 Source - Brazoria County Appraisal District. Valuations shown are certified taxable values reported to the State Comptroller of Public Accounts. Certified values are subject to change throughout the year as contested values are resolved and the Appraisal District updates records
72 Taxable and Estimated Valuation of Properties Located Within the Port Taxing District for the Fiscal Years 2005 through 2014 (In Thousands) TABLE 8 Estimated Market Value Less: Percent Growth Total Fiscal Real Personal Tax-Exempt Taxable (Reduction) From Direct Tax Year Property Property Property Valuation Prior Year Rate 2005 $ 9,891,263 $ 1,969,596 $ 3,845,733 $ 8,015, % $ ,966,192 2,681,724 4,230,178 8,417, ,695,744 3,188,652 4,459,817 9,424, ,334,116 2,391,067 4,857,589 9,867, ,327,255 2,720,091 5,502,506 10,544, ,608,414 2,593,214 5,580,518 9,621,110 (8.76) ,156,069 2,355,464 5,190,492 9,321,041 (3.12) ,091,652 2,677,361 5,463,411 9,305,602 (0.17) ,063,258 2,886,275 5,377,878 9,571, ,381,744 2,842,272 4,719,891 10,504, Taxable Valuation Source--Brazoria County Appraisal District Property tax rates are per $100 taxable valuation
73 Property Tax Levies and Collections for the Fiscal Years 2005 through 2014 TABLE 9 Total Adjusted Total Percent of Delinquent Total Percent of Fiscal Levy Levy Levy Current Year Current Year Tax Gross Total Year Amount Adjustments Amount Collections Collections Collections Collections Collections 2005 $ 5,410,374 $ - $ 5,433, % $ 63,900 $ 5,497, % ,471,530 5,575, ,711 5,617, ,767, ,494 5,623,741 5,691, ,311 5,754, ,668, ,875 5,525,853 5,594, ,283 5,655, ,673,491 32,001 5,641,490 5,593, ,797 5,657, ,261, ,918 5,147,294 5,178, ,147 5,245, ,139,874 34,583 5,105,291 5,001, ,301 5,089, ,018,556 40,059 4,978,497 4,949, ,738 5,081, ,135, ,479 4,929,445 5,069, ,405 5,102, ,679, ,085 4,560,935 4,632, ,632, Total Collections are reported on the cash receipt basis. The financial statements are presented using the accrual basis of accounting. Since there is an inherent difference between the two methods of reporting, the collections reported on this schedule will not necessarily represent the total revenue reported in the financial statements. Amounts shown are original levy amounts and exclude any subsequent supplemental assessments, and therefore collections may exceed total levy amount. Information prior to 2007 for adjusted tax levy is not readily available. Results will be added each year until ten years are presented
74 Principal Taxpayers Current Year and Nine Years Ago September 30, 2014 (In Thousands) TABLE 10 Percent Percent 2013 of Total 2013 of Total Market Market Taxable Taxable Entity Valuation Valuation Valuation Valuation Dow Chemical Company $ 2,719, % $ 2,178, % Phillips 66 Company 1,213, , BASF Corp. Chemicals Div. 704, , Chevron Phillips Chemical Company 544, , Freeport LNG 238, , Freeport Energy Center 128, , Shintech, Inc. 152, , Sweeny Cogenerations Ltd 102, , Centerpoint Energy Inc 91, , Braskem America Inc. 78, , TOTAL $ 5,973, % $ 4,522, % September 30, 2005 (In Thousands) Percent Percent 2004 of Total 2004 of Total Market Market Taxable Taxable Entity Valuation Valuation Valuation Valuation Dow Chemical Company $ 2,280, % $ 3,103, % BASF Corp. Chemicals Div. 604, , Chevron Phillips Chemical Company 322, , Conoco/Phillips Company 233, , Oyster Creek Limited 132, , Sweeny Cogenerations Ltd 129, , Shintech, Inc. 129, , Centerpoint Energy Inc. 81, , Hicorp Energy Co 73, , Air Liquide America Corp 60, , TOTAL $ 4,047, % $ 5,602, % Source--Brazoria County Appraisal District Property taxes levied for the 2014 fiscal year were based on 2013 market valuations. Property taxes levied for the 2005 fiscal year were based on 2004 market valuations
75 Computation of Legal Debt Margin Levy Year 2013 (In Thousands) TABLE 11 Taxable valuations: Taxable value $ 10,504,125 Add back: exempt real property 4,719,891 Total market value: $ 15,224,016 Legal debt margin: Debt limitation - 25 percent of total taxable value $ 3,806,004 Total debt $ 57,125 Less: Revenue bonds 37,710 Amount available for repayment of general obligation bonds 235 Total debt applicable to limitation 19,180 Legal debt margin $ 3,786,
76 Ratio of Outstanding Debt by Type for the Fiscal Years Ended September 30, 2005 through 2014 (In Thousands) TABLE 12 Fiscal Year General Estimated Estimated Percentage Ending Obligation Revenue Note Personal County of Personal Per September 30 Bonds Bonds Payable Total Income Population Income Capita 2005 $ 12,425 $ 1,355 $ 9 $ 13,789 $ 5,509, % $ , ,020 5,483, , ,245 5,840, ,505 40,000-50,505 5,940, ,725 38,835-48,560 5,940, ,825 37,555-46,380 6,263, ,000 36,215-44,215 6,269, ,112 34,805-41,917 6,328, ,248 52,600-58,848 6,506, ,391 37,710 14,100 57,201 6,526, Source Brazoria County Partnership , The Woods & Poole Economics Demographics Report 2003, Texas State Data Center
77 Ratio of Net General Bonded Debt to Taxable Value and to Net Bonded Debt Per Capita (In Thousands) For Fiscal Years 2005 through 2014 TABLE 13 Gross Debt Service Net Ratio of Net Net Fiscal Taxable General Restricted General Bonded Debt to Estimated Bonded Debt Year Valuation Bonded Debt Cash Bonded Debt Taxable Value Population Per Capita 2005 $ 8,015,126 $ 13,780 $ 1,277 $ 12, $ ,417,738 12, , ,424,579 11, , ,867,594 10, , ,544,840 9, , ,621,110 8, , ,321,041 8, , ,305,602 7, , ,571,655 6, , ,504,125 5, , Source: Source: Texas State Data Center
78 Computation of Direct and Overlapping Bonded Debt of General Obligation Bond Issues September 30, 2014 TABLE 14 Net Bonded Percent Amount Taxing Entity Debt Amount As of Overlapping Overlapping Alvin I.S.D. $ 463,780, % $ 34,226,964 Alvin Community College 14,380, ,183,474 Angleton, City of 17,145, ,145,000 Angleton Drainage District Angleton I.S.D. 134,812, ,197,317 Angleton/Danbury Hospital 11,260, ,260,000 Brazoria, City of 1,420, ,420,000 Brazoria County 90,265, ,320,115 Brazoria County FWSD # Brazosport I.S.D. 139,004, ,004,050 Brazosport College 63,555, ,141,893 Clute, City of Columbia/Brazoria I.S.D. 38,449, ,449,985 Danbury, City of 1,911, ,911,000 Danbury I.S.D. 2,950, ,950,000 Freeport, City of 4,379, ,379,000 Lake Jackson, City of 29,035, ,035,000 Manvel, City of 2,560, ,192 Oyster Creek, Village of 195, ,000 Richwood, City of 2,655, ,655,000 Sweeny, City of 2,526, ,526,000 Sweeny Hospital District Sweeny I.S.D. 27,665, ,665,000 Varner Creek UD 8,280, ,280,000 West Columbia, City of 180, ,000 Sub-total Bonded Debt $ 1,056,407,387 Sub-total Overlapping Debt $ 528,196,990 Port Freeport $ 5,315, % $ 5,315,000 Total Direct & Overlapping General Obligation Issue Debt $ 1,061,722,387 $ 533,511,990 Ratio of Overlapping Debt to Direct 2014 Taxable Valuation %
79 Pledged Revenue Coverage for Fiscal Years 2005 through 2014 (In Thousands) Operating Revenue $ 16,996 $ 14,994 $ 14,771 $ 15,586 $ 14,051 Operating Expenses (Net of Depreciation) ( 9,183) ( 9,363) ( 8,318) ( 8,460) ( 8,078) Ad Valorem Tax Collections 4,672 5,246 5,017 5,060 5,255 Investment Income 265 (59) Other Income 13,785 1,334 5, Net Revenues Available for Debt Service $ 12,750 $ 24,603 $ 12,918 $ 18,036 $ 12,134 Annual Bonded Debt Service $ 5,657 $ 17,123 $ 4,353 $ 4,354 $ 4,345 Percent of Coverage 225% 144% 297% 414% 279% Maximum Debt Service $ 10,164 $ 17,200 $ 4,400 $ 4,400 $ 4,400 Percent of Coverage 125% 143% 294% 410% 276% Indicates the extent to which net revenues available for debt service would provide coverage of maximum annual debt service requirements in any future year. The maximum annual debt service will occur in
80 TABLE $ 12,675 $ 12,592 $ 11,082 $ 10,342 $ 8,881 ( 7,938) ( 7,692) ( 6,727) ( 6,560) ( 5,690) 5,650 5,641 5,777 5,637 5, ,699 2,146 1, ,549 $ 10,984 $ 12,713 $ 12,278 $ 14,260 $ 9,247 $ 4,421 $ 4,425 $ 1,222 $ 1,389 $ 1, % 287% 1005% 1027% 666% $ 4,500 $ 4,500 1,300 $ 1,389 $ 1, % 283% 944% 1027% 666%
81 Unlimited Tax Refunding Bonds, Series 2006 September 30, 2014 TABLE 16 Fiscal Year Interest Interest Principal Total Ending Due Due Due Principal & Principal September 30 Coupon February 15 August 15 August 15 Interest Balance 2014 $ 5,315, % $ 113,838 $ 113,838 $ 1,000,000 $ 1,227,676 4,315, ,838 93,838 1,005,000 1,192,676 3,310, ,200 66,200 1,060,000 1,192,400 2,250, ,000 45,000 1,105,000 1,195,000 1,145, ,900 22,900 1,145,000 1,190,800 0 $ 341,776 $ 341,776 $ 5,315,000 $ 5,998,552 Senior Lien Revenue Refunding Bonds, Series 2013A September 30, 2014 TABLE 17 Fiscal Year Interest Interest Principal Total Ending Due Due Due Principal & Principal September 30 Coupon December 1 June 1 June 1 Interest Balance 2014 $ 31,270, % $ 481,558 $ 481,558 $ 1,820,000 $ 2,783,116 29,450, , ,530 1,880,000 2,787,060 27,570, , ,578 1,935,000 2,784,156 25,635, , ,779 1,990,000 2,779,558 23,645, , ,133 2,055,000 2,783,266 21,590, , ,486 2,115,000 2,779,972 19,475, , ,915 2,185,000 2,784,830 17,290, , ,266 2,250,000 2,782,532 15,040, , ,616 2,320,000 2,783,232 12,720, , ,888 2,395,000 2,786,776 10,325, , ,005 2,465,000 2,783,010 7,860, , ,044 2,540,000 2,782,088 5,320, ,928 81,928 2,620,000 2,783,856 2,700, ,580 41,580 2,700,000 2,783,160 0 $ 3,848,306 $ 3,848,306 $ 31,270,000 $ 38,966,
82 Senior Lien Revenue Notes, Series 2013B September 30, 2014 TABLE 18 Fiscal Year Interest Principal Total Ending Due Due Principal & Principal September 30 Coupon* Monthly 1st * Dec 1 Interest Balance 2014 $ 6,440, $ 51,150 $ - $ 51,150 6,440, ,150 0 $ 51,150 6,440, ,800 4,560,000 $ 4,592,800 1,880, ,702 1,880,000 $ 1,883,702 0 $ 138,802 $ 6,440,000 $ 6,578,802 * Interest is paid monthly on a floating rate of BBA LIBOR plus 66 basis points. Amounts shown are estimated Note Payable September 30, 2014 TABLE 19 Fiscal Year Interest Principal Total Ending Due Due Principal & Principal September 30 Coupon Sept. 30 Sept. 30 Interest Balance 2014 $ 14,100, % $ 325,146 $ 1,269,794 $ 1,594,940 12,830, ,865 1,299,076 1,594,941 11,531, ,908 1,329,033 1,594,941 10,202, ,260 1,359,680 1,594,940 8,842, ,906 1,391,034 1,594,940 7,451, ,829 1,423,112 1,594,941 6,028, ,012 1,455,929 1,594,941 4,572, ,438 1,489,502 1,594,940 3,082, ,090 1,523,850 1,594,940 1,558, ,950 1,558,990 1,594,940 0 $ 1,849,404 $ 14,100,000 $ 15,949,
83 Summary of Annual Cash Requirements on Debt Outstanding September 30, 2014 TABLE 20 Unlimited Senior Lien Senior Lien Fiscal Year Tax Refunding Revenue Revenue Ending Bonds Refunding Bonds Notes Note September 30 Series 2006 Series 2013A Series 2013B Payable Total 2015 $ 1,227,676 $ 2,783,116 $ 51,150 $ 1,594,940 $ 5,656, ,192,676 2,787,060 51,150 1,594,941 5,625, ,192,400 2,784,156 4,592,800 1,594,941 10,164, ,195,000 2,779,558 1,883,702 1,594,940 7,453, ,190,800 2,783,266 1,594,940 5,569, ,779,972 1,594,941 4,374, ,784,830 1,594,941 4,379, ,782,532 1,594,940 4,377, ,783,232 1,594,940 4,378, ,786,776 1,594,940 4,381, ,783,010 2,783, ,782,088 2,782, ,783,856 2,783, ,783,160 2,783,160 $ 5,998,552 $ 38,966,612 $ 6,578,802 $ 15,949,404 $ 67,493,
84 Table 21, Miscellaneous Statistical Data Located in Texas s Central Gulf Coast, Port Freeport currently encompasses approximately 85% of Brazoria County. Occupying the only frontal mainland coastline in Brazoria County, it also offers one of Texas s most fertile agricultural areas. The primary economic bases of the county include chemical manufacturing, petroleum processing, offshore production and maintenance services, diversified manufacturing, biochemical, electronics, commercial fishing and agriculture. In addition, the area s deepwater transportation waterway, port facilities, sport fishing services and tourism are major components of the county s economic base. Date of Incorporation Form of Government... A political subdivision of the state of Texas Number of Employees Geographical Location... Southeast Coast of Texas on the Gulf of Mexico approximately 60 miles South of Houston Port Owned Property approximately 540 acres developed Approximately 7,000 acres undeveloped Elevation feet above sea level Tidal Range-Inner Harbor... Plus (minus) 2.5 feet Aerial Clearance... No restriction Climate Type... Sub-tropical Temperature - Annual Average degrees F. Precipitation - Annual Average Number of Public Docks... 7 Covered Dry Warehouse Space ,400 square feet Cold Storage Space... 38,600 square feet Port Freeport s Total Foreign Tonnage Ranking Among U.S. Ports th highest Port Freeport s Total Tonnage Ranking Among U.S. Ports th highest Major Trade Areas of Port... Central America, South America, Middle East, Africa Major Import Commodities.Food, bulk chemicals, clothing, crude oil, paper goods aggregate, wind energy products, liquid natural gas, resin Major Export Commodities... Food, chemicals, autos, general cargo, clothing, rice paper goods, resin, and liquid natural gas Number of Truck Lines Serving Port Freeport Number of Barge Lines Serving Port Freeport... 7 Number of Railroad Lines Serving Port Freeport... 1 Number of Shipping Lines Calling Port Freeport Area of County... 1,386.4 square miles Brazoria County s Total Assessed Valuation Among Texas Counties th highest without exemptions Brazoria County s Total Population Ranking Among All Texas Counties th highest Brazoria County s Total Area Ranking Among All Texas Counties th highest Economic Impact on Brazoria County... $17.9 billion annually / 13,362 direct jobs; 27,656 induced jobs
85 History of the Port The history of navigation in the Brazos River area can be traced to as early as 1528 when the Spanish explorer Cabeza de Vaca first arrived in the New Land. In 1821, Stephen F. Austin chose the mouth of the Brazos River as the location of a colony and deepwater port to be developed. Throughout the nineteenth century and beyond, the area s importance as a trade and shipping area became more viable. A brief chronological history of the development of Port Freeport. In 1889, Congress authorized the Brazos River and Dock Company to construct, own and operate sufficient jetties as might be necessary to create a navigable channel between the mouth of the Brazos River and the Gulf of Mexico. Granite jetties were constructed by the Brazos River and Dock Company at a cost of $1,449,025. The Brazos River Harbor Navigation District was created by an action of the voters on the 4th day of December In 1960, the size of the elected number of Commissioners was increased from three to six positions by an act of the Texas Legislature. On December 4, 1925, the voters approved the issuance of $989,000 of ad valorem tax bonds to be utilized for the elimination of the river jetty siltation - shoaling problems by diversion of the live Brazos River to another course for its final flow to the Gulf of Mexico. In January 1951, the voters approved the issuance of $2,600,000 of ad valorem tax bonds to be utilized for the purchase of additional land for the construction of the Harbor and District s first dock and terminal facilities. In June 1957, the voters approved the issuance of $1,500,000 of Port Revenue Bonds for construction of a second transit shed and dock facility. In 1961, the harbor and channel were first dredged to the original project depth of 36 - feet by the Federal Government. In June 1963, the Interstate Commerce Commission granted the District an all-inclusive equalization of rail rates, placing the Ports of Houston, Galveston and Freeport on an equal rail rate basis. In January 1964, Transit Shed No. 5 was opened for business. This 36,000 square foot cargo storage facility was constructed with retained Port revenues; no bonds were issued for its construction. In May 1969, the Board of Navigation and Canal Commissioners authorized the issuance of $865,000 of Port Revenue Bonds for the construction of a 60,000 square foot, warehouse, known as Warehouse 53, and modifications and improvements to other District warehouses, transit sheds and dock facilities. On October 5, 1980, the voters approved the issuance of $20,000,000 of ad valorem tax bonds for the acquisition of 8,700 acres of land for future industrial development and for expenses related to the District s waterway and jetty system widening and deepening project, construction of additional office and warehouse space and improvements to existing port facilities. In 1983, the Board of Navigation and Canal Commissioners entered into a lease agreement with Dole Fresh Fruit Company to construct a trailer marshaling yard and maintenance facility to handle Dole s weekly-containerized fruit import and commodity export trade. In 1985, the Board of Navigation and Canal Commissioners entered into a lease agreement with American Rice, Inc. to construct the largest state-of-the-art rice milling facility in the United States on a site leased to it by the Port and authorized the issuance of $10,500,000 of Port Revenue Bonds for the construction of an additional berth, 180,000 square feet of transit sheds, a barge unloading facility along with numerous major infrastructure improvements. On June 2, 1985, then Texas Governor Mark White signed a bill authorizing the Brazos River Harbor Navigation District to apply for and to accept, operate and maintain a Foreign-Trade Zone within its boundaries. The Foreign-Trade Zones Board on June 28, 1988, issued Order No. 385 approving the establishment of Foreign-Trade Zone No. 149 at specific sites located within the jurisdiction of the Brazos River Harbor Navigation District. On July 18, 1988, authorization to activate sites of Foreign-Trade Zone No. 149 was issued by the District Director of the U. S. Customs Service and on July 19, 1988, the first goods were received into Foreign-Trade Zone No In 1962, the District requested the U. S. Army Corps of Engineers to study the widening and deepening of the Freeport jetty system, channels and harbor to improve navigation and to accommodate the larger ships that were first appearing at this time and were forecasted to be standard fleet size in the near future. Twenty-four years later, on November 17, 1986, President Ronald Reagan signed The Water Resources Development Act of 1986 which authorized the first new waterway construction starts since The authorization included the Freeport Harbor, Texas, 45-Foot Project,
86 History of the Port at an estimated total project cost of $88,600,000 of which $29,200,000 was non-federal/local expense. To satisfy the recreational requirements of the project, the District completed the $1,000,000 Surfside Jetty Park Complex in 1994, and through an Interlocal Cooperation Agreement with Brazoria County, turned the park over to the Brazoria County Parks Department for operation and maintenance. In 1989, the Board of Navigation and Canal Commissioners authorized the purchase of the Canadian Millworks, Inc. leasehold improvements, now known as Warehouse 51, for $350,000. The facility has undergone major upgrades and is presently being utilized for warehousing of domestic cargoes. On January 1, 1993, the Board of Navigation and Canal Commissioners entered into an Industrial Lease and Docking Agreement with McDermott, Inc. for the pre and post-mating hook-up and commissioning site for Shell Offshore, Inc. s Auger Tension Leg Platform Project. In conjunction with the lease, the District realized over $580,000 in permanent site improvements to District lands fronting on the Brazos River channel. Additionally, the District contracted for the dredging of a 60-foot deep berthing area in the Upper Turning Basin. In January 1994, the Board of Navigation and Canal Commissioners entered into a lease agreement with Western Towing, Inc. for the construction of a barge fleeting facility located on the Old Brazos River upstream from the Upper Turning Basin. In June 1995, the Board of Navigation and Canal Commissioners adopted a long-term master plan developed with the assistance from the firm, Vickerman, Zachary and Miller. With input from the Board of Navigation and Canal Commissioners, staff, community leaders and local industry, the District s Mission Statement and Goals were developed. An update to the Master Plan was adopted in In September 1995, the Board of Navigation and Canal Commissioners entered into a lease agreement with Chiquita Brands, Inc. for the construction of a Green Fruit Terminal on leased Port lands. The terminal includes space for up to 200 containers on chassis, interchange and maintenance facilities, as well as modular office units at a total cost of $2.5 million. The facility went on line in March $3,265,000 of Port Revenue Bonds were issued to finance the Green Fruit Terminal as well as renovations to Berth No. 1. In December 1998, the voters approved the issuance of $16,000,000 of ad valorem tax bonds to be utilized for the purchase and commissioning of a $3.1 million mobile harbor crane and 500-foot extension of Berth No. 5 and berthing area improvements at Parcel 39. To facilitate the more efficient handling of containerized and project cargoes and to handle the additional loads from container handling equipment, the dock aprons of Berths No. 1 and No. 2 were widened from 45 feet to 100 feet in by demolition of a portion of the transit sheds. These projects were funded by a combination of Port Revenue Bonds and retained earnings. In 1998, Warehouse 52, a 36,000 square foot facility, was constructed and is currently being used for domestic warehousing and cargo storage. This project was funded with Port retained earnings. In 1999, the District acquired two tracts of land adjacent to the Port for future development and expansion. The first is a 2.5-acre tract, formerly occupied by Freeport Welding and Fabrication. The second is a 45-acre tract, formerly owned by Marathon Oil Company, with deep-water frontage on the Old Brazos River. In 1999, the main Port entrance was rebuilt and widened, the 30-plus year old pavement west of the rail crossing on Pete Schaff Blvd. was replaced, and the final phase of a 5-acre open storage yard was completed. In 2000, the Deep Berthing Area was dredged to a depth of 70 feet, making it one of only two 70-foot deep berthing areas in the Upper Gulf Coast. The first phase of Berthing Area Improvements, Parcel 39, was completed in 2000, which included dredging a berthing area to 40-foot depth, the installation of monopile breasting/mooring dolphins and extending the Port s water distribution system. These projects were funded with proceeds from the 1998 bond issuance. In March 2000, the Board of Navigation and Canal Commissioners entered into a lease agreement with Transit Mix Concrete and Materials, a division of Trinity Industries, to import limestone for the construction industry. In October, the first selfunloading vessel carrying over 60,000 tons of limestone discharged at their facility located on the Upper Turning Basin. In the Port completed the Berth 5 Extension Project, increasing the number of public deepwater berths from three to four. A harbor tug berthing facility was constructed to provide a home base for harbor tugs serving vessels in Port Freeport. A portion of Transit Shed No. 5 was demolished and the balance
87 History of the Port renovated to provide for a 100-foot wide dock apron and more efficient handling of cargo. These projects were funded with proceeds from the 1998 bond issuance. In 2001, the Board of Navigation and Canal Commissioners signed a lease agreement with Parker/Cabett Subsea Products Inc. to construct a stateof-the-art umbilical cable manufacturing facility to serve the offshore oil and gas industry. The facility is located adjacent to the recently completed Berth 5 and manufactured its first cable in early In 2002, the Port contracted for the development of a Conceptual Master Plan that provides for the organized expansion of the Port over the next 20 years in order to better serve the marine industry. Also in 2002, the Port started the process of widening and deepening the Freeport Harbor Channel to serve larger vessels and the anticipated increase in vessel traffic. The U. S. Army Corps of Engineers issued the Section 216 Reconnaissance Phase Report that identified a federal interest in the project. In 2003, the Board of Navigation and Canal Commissioners entered into a $6.5 million Feasibility Cost Sharing Agreement with the U.S. Army Corps of Engineers for the Freeport Harbor Improvement Project. The Feasibility Phase of the project is currently underway with scheduled for completion in the first quarter of In 2004, the Port undertook three major projects in its efforts to diversify its cargo base. Construction of a 38,000 square foot Cool Storage Facility to handle palletized fruit as well as other temperature-sensitive commodities was completed in Design of the Velasco Terminal project was started in late 2004 and construction started in early The new 800-foot long berth is designed to handle the next generation of gantry cranes and accommodate vessels up to 48-foot draft. The signing of a land lease agreement with Freeport LNG was the first step in the construction of a liquefied natural gas receiving facility. Construction began in early 2005 and was completed in The first vessel of liquefied natural gas was received in April In 2007, the State of Texas passed House Bill 542, which legally changed the name of the Brazos River Harbor Navigation District to Port Freeport and the name of the governing body of the Brazos River Harbor Navigation District to Port Commission and the name of each member of the Port Commission to be changed to Port Commissioner. Development on Parcel 25 began and Wind energy started calling Port Freeport via Suzlon Wind Energy Corp. and other manufacturers. The Port completed construction of a 60-acre project cargo area that is being leased for storage of wind power production components in 2009 at Parcel 25. In addition, the first 5-acres of an additional project cargo area at Parcel 19 was completed and the design for the next 10-acres was completed in In 2010, Freeport LNG filed an application with the Federal Energy and Regulatory Commission to expand their facility to include re-liquefaction capabilities. In 2011, the State of Texas passed House Bill 1305, which granted authority to Port Freeport to issue permits for the movement of oversize or overweight vehicles carrying cargo on highways located within a ten mile radius of Port Freeport. In 2013, Velasco Terminal Phase 1, Berth 7 was completed and operational. The permit system for the movement of oversize or overweight vehicles carrying cargo on highways located within a ten mile radius of Port Freeport was implemented. In 2014, the Port purchased two ship-to-shore Port Panamax container cranes for Velasco Terminal. Mediterranean Shipping Company, S.A. began servicing the Port in a vessel sharing agreement with Chiquita Brands International. In preparation of its new export facility, Freeport LNG signed an agreement with Port Freeport to widen the entrance of the channel. Also, Congress approved the Water Resource Development Act designating the Port as an authorized project. Port Freeport history documents the prior and current commitment of the Brazoria County residents, its industries, the Port Commission, administration and staff members to ensure the continued successful economic impact of the Port. Historical data summarized from the previous research of Glenn Heath and Nat Hickey

88 - 87 -
89 200 WEST SECOND STREET, FREEPORT, TX (979) (800) (979)

90 - 89 -
91 Kennemer, Masters & Lunsford CERTIFIED PUBLIC ACCOUNTANTS Limited Liability Company Lake Jackson Office: El Campo Office: Houston Office: 8 West Way Court 201 W. Webb Richmond Ave., Suite 210 Lake Jackson, Texas El Campo, Texas Houston, Texas Independent Auditor s Report On Internal Control over Financial Reporting and on Compliance and Other Matters Based on an Audit of Financial Statements Performed in Accordance with Government Auditing Standards To the Port Commissioners Port Freeport Freeport, Texas We have audited, in accordance with the auditing standards generally accepted in the United States of America and the standards applicable to financial audits contained in Government Auditing Standards issued by the Comptroller General of the United States, the financial statements of Port Freeport (the Port ), as of and for the years ended September 30, 2014 and 2013, and the related notes to the financial statements, which collectively comprise the Port s basic financial statements, and have issued our report thereon dated January 30, Internal Control over Financial Reporting In planning and performing our audit of the financial statements, we considered the Port s internal control over financial reporting (internal control) to determine the audit procedures that are appropriate in the circumstances for the purpose of expressing our opinions on the financial statements, but not for the purpose of expressing an opinion on the effectiveness of the Port s internal control. Accordingly, we do not express an opinion on the effectiveness of the Port s internal control. A deficiency in internal control exists when the design or operation of a control does not allow management or employees, in the normal course of performing their assigned functions, to prevent, or detect and correct, misstatements on a timely basis. A material weakness is a deficiency, or a combination of deficiencies, in internal control, such that there is a reasonable possibility that a material misstatement of the entity s financial statements will not be prevented, or detected and corrected on a timely basis. A significant deficiency is a deficiency, or a combination of deficiencies, in internal control that is less severe than a material weakness, yet important enough to merit attention by those charged with governance. Our consideration of internal control was for the limited purpose described in the first paragraph of this section and was not designed to identify all deficiencies in internal control that might be material weaknesses or, significant deficiencies. Given these limitations, during our audit we did not identify any deficiencies in internal control that we consider to be material weaknesses. However, material weaknesses may exist that have not been identified. Compliance and Other Matters As part of obtaining reasonable assurance about whether the Port s financial statements are free from material misstatement, we performed tests of its compliance with certain provisions of laws, regulations, contracts, and grant agreements, noncompliance with which could have a direct and material effect on the determination of financial statement amounts. However, providing an opinion on compliance with those provisions was not an objective of our audit, and accordingly, we do not express such an opinion. The results of our tests disclosed no instances of noncompliance or other matters that are required to be reported under Government Auditing Standards. www. kmandl.com kmkw@kmandl.com Members: American Institute of Certified Public Accountants, Texas Society of Certified Public Accountants, Partnering for CPA Practice Success
92 Port Commissioners Port Freeport Freeport, Texas Page 2 Purpose of this Report The purpose of this report is solely to describe the scope of our testing of internal control and compliance and the results of that testing, and not to provide an opinion on the effectiveness of the entity s internal control or on compliance. This report is an integral part of an audit performed in accordance with Government Auditing Standards in considering the entity s internal control and compliance. Accordingly, this communication is not suitable for any other purpose. Lake Jackson, Texas January 30,
93 Kennemer, Masters & Lunsford CERTIFIED PUBLIC ACCOUNTANTS Limited Liability Company Lake Jackson Office: El Campo Office: Houston Office: 8 West Way Court 201 W. Webb Richmond Ave., Suite 135 Lake Jackson, Texas El Campo, Texas Houston, Texas Independent Auditor s Report On Compliance for each Major Program and on Internal Control over Compliance Required by OMB Circular A-133 To the Port Commissioners Port Freeport Freeport, Texas Report on Compliance for Each Major Federal Program We have audited Port Freeport s (the Port ) compliance with the types of compliance requirements described in the OMB Circular A-133 Compliance Supplement that could have a direct and material effect on each of the Port s major federal programs for the year ended September 30, The Port s major federal programs are identified in the summary of auditor s results section of the accompanying schedule of findings and questioned costs. Management s Responsibility Management is responsible for compliance with the requirements of laws, regulations, contracts, and grants applicable to its federal programs. Auditor s Responsibility Our responsibility is to express an opinion on compliance for each of the Port s major federal programs based on our audit of the types of compliance requirements referred to above. We conducted our audit of compliance in accordance with auditing standards generally accepted in the United States of America; the standards applicable to financial audits contained in Government Auditing Standards, issued by the Comptroller General of the United States; and OMB Circular A-133, Audits of States, Local Governments, and Non-Profit Organizations. Those standards and OMB Circular A-133 require that we plan and perform the audit to obtain reasonable assurance about whether noncompliance with the types of compliance requirements referred to above that could have a direct and material effect on a major federal program occurred. An audit includes examining, on a test basis, evidence about the Port s compliance with those requirements and performing such other procedures as we considered necessary in the circumstances. We believe that our audit provides a reasonable basis for our opinion on compliance for each major federal program. However, our audit does not provide a legal determination of the Port s compliance. Opinion on Each Major Federal Program In our opinion, Port Freeport, complied, in all material respects, with the types of compliance requirements referred to above that could have a direct and material effect on each of its major federal programs for the year ended September 30, www. kmandl.com kmkw@kmandl.com Members: American Institute of Certified Public Accountants, Texas Society of Certified Public Accountants, Partnering for CPA Practice Success
94 Port Commissioners Port Freeport Freeport, Texas Page 2 Report on Internal Control over Compliance Management of the Port is responsible for establishing and maintaining effective internal control over compliance with the types of compliance requirements referred to above. In planning and performing our audit of compliance, we considered the Port s internal control over compliance with the types of requirements that could have a direct and material effect on each major federal program to determine the auditing procedures that are appropriate in the circumstances for the purpose of expressing an opinion on compliance for each major federal program and to test and report on internal control over compliance in accordance with OMB Circular A-133, but not for the purpose of expressing an opinion on the effectiveness of internal control over compliance. Accordingly, we do not express an opinion on the effectiveness of the Port s internal control over compliance. A deficiency in internal control over compliance exists when the design or operation of a control over compliance does not allow management or employees, in the normal course of performing their assigned functions, to prevent, or detect and correct, noncompliance with a type of compliance requirement of a federal program on a timely basis. A material weakness in internal control over compliance is a deficiency, or combination of deficiencies, in internal control over compliance, such that there is a reasonable possibility that material noncompliance with a type of compliance requirement of a federal program will not be prevented, or detected and corrected, on a timely basis. A significant deficiency in internal control over compliance is a deficiency, or a combination of deficiencies, in internal control over compliance with a type of compliance requirement of a federal program that is less severe than a material weakness in internal control over compliance, yet important enough to merit attention by those charged with governance. Our consideration of internal control over compliance was for the limited purpose described in the first paragraph of this section and was not designed to identify all deficiencies in internal control over compliance that might be material weaknesses or significant deficiencies. We did not identify any deficiencies in internal control over compliance that we consider to be material weaknesses. However, material weaknesses may exist that have not been identified. The purpose of this report on internal control over compliance is solely to describe the scope of our testing of internal control over compliance and the results of that testing based on the requirements of OMB Circular A-133. Accordingly, this report is not suitable for any other purpose. Lake Jackson, Texas January 30,
95 Schedule of Findings and Questioned Costs Year Ended September 30, 2014 I. Summary of auditor's results: 1. Type of auditor's report issued on the financial statements: Unmodified. 2. No internal control findings, required to be reported in this schedule, were disclosed in the audit of the financial statements. 3. Noncompliance, which is material to the financial statements: None. 4. No internal control findings, required to be reported in this schedule, were disclosed in the audit of the major programs. 5. Type of auditor's report on compliance for major programs: Unmodified. 6. Did the audit disclose findings, which are required to be reported under Sec._510(a): No. 7. Major programs include: Department of Homeland Security: Port Security Grant. 8. Dollar threshold used to distinguish between Type A and Type B programs: $ 300, Low risk auditee: Yes. II. Findings related to the financial statements The audit disclosed no findings required to be reported. Ill. Findings and questioned costs related to the federal awards. The audit disclosed no findings required to be reported
96 Schedule of Status of Prior Findings Year Ended September 30, 2014 PRIOR YEAR'S FINDING/NONCOMPLIANCE None
97 Corrective Action Plan Year Ended September 30, 2014 None
98 Schedule of Expenditures of Federal Awards Year Ended September 30, 2014 Pass Through Expenditures Federal Entity Indirect Costs Federal Grantor/Pass-Through CFDA Identifying or Award Grantor/Program Title Number Number Amount U. S. Department of Homeland Security Direct Program: Port Security Grant PU-K $ 1,016,046 Port Security Grant PU S01 26,170 TOTAL DEPARTMENT OF HOMELAND SECURITY $ 1,042,216 TOTAL FEDERAL ASSISTANCE $ 1,042,216 See notes to supplement Schedule of Expenditures of Federal Awards
99 Notes on Accounting Policies for Federal Awards Year Ended September 30, The Port is reported as a single enterprise fund and accordingly follows all the requirements set forth in enterprise fund accounting and reporting, including the accrual basis of accounting and application of all GASB pronouncements as well as the Financial Accounting Standards Board ( FASB ) pronouncements issued on or before November 30, 1989, unless those pronouncement conflict with or contradict GASB pronouncements. Federal financial assistance for the benefiting enterprise operations is accounted for in the single Enterprise Fund. Generally, unused balances are returned to the grantor at the close of specified project periods. 2. The Enterprise Fund Type is accounted for on a flow of economic resources measurement focus. With this measurement focus, all assets and all liabilities associated with the operation of this fund are included on the balance sheet. Fund equity (net total assets) is segregated into net investment in capital assets, and restricted or unrestricted net position. Enterprise fund type operating statements present increases (revenues) and decreases (expenses) in net total assets. Federal grant funds were accounted for in the Enterprise Fund. Federal grant funds are considered to be earned to the extent of expenditures made under the provisions of the grant, and, accordingly, when such funds are received, they are recorded as deferred revenues until earned. 3. Matching Expenses - The Port Security Grants Program require local matching expenditures. Matching expenses for the years ended September 30, 2014 and 2013 were as follows: Federal Pass-Through Program Direct Matching Expenses CFDA Grantor s Required Years Ended September 30, Number Number Matching Total 2013 Port Security Grant Program PU S01 $ 37,500 $ $ 26,170 $ 26,170 $ 37,500 $ -0- $ 26,170 $ 26,

100 - 99 -
CITY OF FREEPORT FREEPORT, TEXAS
 FREEPORT, TEXAS ANNUAL FINANCIAL REPORT FOR THE YEAR ENDED SEPTEMBER 30, 2013 KENNEMER, MASTERS & LUNSFORD, LLC CERTIFIED PUBLIC ACCOUNTANTS 8 WEST WAY COURT LAKE JACKSON, TEXAS 77566 THIS PAGE LEFT BLANK
Port Ranking. 24th in the U.S. foreign tonnage. 30th in the U.S. in total tonnage
 Port Ranking 24th in the U.S. foreign tonnage 30th in the U.S. in total tonnage 35.2 million tons of cargo 3,000 vessel calls per year 50,000 railcars per year 155,000 trucks per year Top Trading Partners
2017/2018 FISCAL YEAR BUDGET ADOPTED SEPTEMBER 14, 2017 PREPARED BY:
 2017/2018 FISCAL YEAR BUDGET ADOPTED SEPTEMBER 14, 2017 PREPARED BY: Mary Campus, Controller TABLE OF CONTENTS TRANSMITTAL LETTER 1 CASH FLOWS 4 SOURCES AND USES 5 INCOME STATEMENT 6 CAPITAL BUDGET 7 CAPITAL
ANGLETON INDEPENDENT SCHOOL DISTRICT
 ANGLETON INDEPENDENT SCHOOL DISTRICT ANNUAL FINANCIAL REPORT FOR THE YEAR ENDED AUGUST 31, 2016 KENNEMER, MASTERS & LUNSFORD, LLC CERTIFIED PUBLIC ACCOUNTANTS 8 WEST WAY COURT LAKE JACKSON, TEXAS 77566
CITY OF LAKE ELMO, MINNESOTA COMPREHENSIVE ANNUAL FINANCIAL REPORT FOR THE FISCAL YEAR ENDED DECEMBER 31, 2017
 COMPREHENSIVE ANNUAL FINANCIAL REPORT FOR THE FISCAL YEAR ENDED DECEMBER 31, 2017 PREPARED BY: FINANCE DEPARTMENT CITY OF LAKE ELMO, MINNESOTA FINANCIAL STATEMENTS For the Fiscal Year Ended December 31,
Celebrating 25 Years of Excellence
 Celebrating 25 Years of Excellence Comprehensive Annual Financial Report Fiscal Year Ended June 30, 2017 Chino Hills, California , CALIFORNIA COMPREHENSIVE ANNUAL FINANCIAL REPORT FISCAL YEAR ENDED JUNE
BUCKEYE ELEMENTARY SCHOOL DISTRICT NO. 33
 BUCKEYE ELEMENTARY SCHOOL DISTRICT NO. 33 Comprehensive Annual Financial Report Fiscal Year Ended June 30, 2016 25555 West Durango Street Buckeye, Arizona 85326 BUCKEYE, ARIZONA COMPREHENSIVE ANNUAL FINANCIAL
HEBER-OVERGAARD UNIFIED SCHOOL DISTRICT NO. 6
 HEBER-OVERGAARD UNIFIED SCHOOL DISTRICT NO. 6 Comprehensive Annual Financial Report Fiscal Year Ended June 30, 2012 3375 Buckskin Canyon Road P.O. Box 547 Heber, Arizona 85928 HEBER, ARIZONA COMPREHENSIVE
City of Sanford, North Carolina Comprehensive Annual Financial Report For the Fiscal Year Ended June 30, 2005 TABLE OF CONTENTS INTRODUCTORY SECTION
 City of Sanford, North Carolina Comprehensive Annual Financial Report For the Fiscal Year Ended TABLE OF CONTENTS INTRODUCTORY SECTION PAGE Letter of Transmittal 1 GFOA Certificate of Achievement 5 Organizational
GEORGETOWN INDEPENDENT SCHOOL DISTRICT. Annual Financial Report for the Fiscal Year Ended June 30, 2015
 GEORGETOWN INDEPENDENT SCHOOL DISTRICT Annual Financial Report for the Fiscal Year Ended June 30, 2015 GEORGETOWN INDEPENDENT SCHOOL DISTRICT Annual Financial Report Year Ended June 30, 2015 Table of Contents
Comprehensive Annual Financial Report
 Comprehensive Annual Financial Report Cambrian Commons, Rosemount - Built in 2016 For the Year Ended June 30, 2016 Dakota County Community Development Agency A component unit of Dakota County, Minnesota
Harris County Flood Control District A Component Unit of Harris County, Texas
 Harris County Flood Control District A Component Unit of Harris County, Texas Comprehensive Annual Financial Report For the Fiscal Year Ended February 28, 2015 Prepared By: Barbara J. Schott, C.P.A. County
Cleveland-Cuyahoga County Port Authority. Basic Financial Statements December 31, 2006
 Cleveland-Cuyahoga County Port Authority Basic Financial Statements December 31, 2006 Board of Directors Cleveland-Cuyahoga County Port Authority 1375 East 9th Street, Suite 2300 Cleveland, Ohio 44114-1790
PARIS JUNIOR COLLEGE Paris, Texas REPORT OF AUDIT. August 31, 2015
 PARIS JUNIOR COLLEGE Paris, Texas REPORT OF AUDIT August 31, 2015 PARIS JUNIOR COLLEGE Paris, Texas REPORT OF AUDIT AUGUST 31, 2015 Table of Contents August 31, 2015 Page Organizational Data 1 Report on
Port of Olympia Thurston County
 Washington State Auditor s Office Financial Statements and Federal Single Audit Report Port of Olympia Thurston County Audit Period January 1, 2007 through December 31, 2007 Report No. 75377 Issue Date
Port of Port Townsend
 Financial Statements Audit Report Port of Port Townsend For the period January 1, 2016 through December 31, 2017 Published December 6, 2018 Report No. 1022749 Office of the Washington State Auditor Pat
Annual Financial Report for the. Port Everglades Department of Broward County, Florida. A Major Enterprise Fund of Broward County, Florida
 Annual Financial Report for the Port Everglades Department A Major Enterprise Fund of Broward County, Florida For The Fiscal Years Ended Prepared by the Finance Division - Port Everglades Department Table
PORT OF PALM BEACH DISTRICT FINANCIAL STATEMENTS WITH INDEPENDENT AUDITORS REPORT THEREON SEPTEMBER 30, 2008
 FINANCIAL STATEMENTS WITH INDEPENDENT AUDITORS REPORT THEREON SEPTEMBER 30, 2008 SEPTEMBER 30, 2008 TABLE OF CONTENTS Pages FINANCIAL SECTION Independent Auditors Report 1 2 Management s Discussion and
CITY OF LAKE ELMO, MINNESOTA COMPREHENSIVE ANNUAL FINANCIAL REPORT FOR THE FISCAL YEAR ENDED DECEMBER 31, 2016
 COMPREHENSIVE ANNUAL FINANCIAL REPORT FOR THE FISCAL YEAR ENDED DECEMBER 31, 2016 PREPARED BY: FINANCE DEPARTMENT CITY OF LAKE ELMO, MINNESOTA FINANCIAL STATEMENTS For the Fiscal Year Ended December 31,
WEST CHESTER AREA SCHOOL DISTRICT AUDIT REPORT JUNE 30, 2015
 WEST CHESTER, PENNSYLVANIA AUDIT REPORT JUNE 30, 2015 TABLE OF CONTENTS PAGE INDEPENDENT AUDITOR S REPORT 1-3 MANAGEMENT S DISCUSSION AND ANALYSIS 4-15 BASIC FINANCIAL STATEMENTS Entity-wide Financial
The Little Rock School District of Pulaski County, Arkansas ANNUAL FINANCIAL REPORT
 ANNUAL FINANCIAL REPORT June 30, 2012 ANNUAL FINANCIAL REPORT Table of Contents INDEPENDENT AUDITORS REPORT ON FINANCIAL STATEMENTS AND SUPPLEMENTARY INFORMATION 1 2 MANAGEMENT S DISCUSSION AND ANALYSIS
ARTESIA SPECIAL HOSPITAL DISTRICT EDDY COUNTY, NEW MEXICO FINANCIAL STATEMENTS
 ARTESIA SPECIAL HOSPITAL DISTRICT EDDY COUNTY, NEW MEXICO FINANCIAL STATEMENTS AS OF JUNE 30, 2012 AND 2011 (This page intentionally left blank) 2 INTRODUCTORY SECTION 3 (This page intentionally left blank)
TANQUE VERDE UNIFIED SCHOOL DISTRICT NO. 13
 TANQUE VERDE UNIFIED SCHOOL DISTRICT NO. 13 Comprehensive Annual Financial Report Fiscal Year Ended June 30, 2017 2300 N. Tanque Verde Loop Rd. Bldg #1 Tucson, Arizona 85749 TUCSON, ARIZONA COMPREHENSIVE
SUNNYSIDE UNIFIED SCHOOL DISTRICT NO. 12 COMPREHENSIVE ANNUAL FINANCIAL REPORT FOR THE FISCAL YEAR ENDED JUNE 30, 2014
 COMPREHENSIVE ANNUAL FINANCIAL REPORT FOR THE FISCAL YEAR ENDED JUNE 30, 2014 2238 East Ginter Road Tucson, Arizona 85706 TUCSON, ARIZONA COMPREHENSIVE ANNUAL FINANCIAL REPORT FOR THE FISCAL YEAR ENDED
Accounting & Consulting Group, LLP. Certified Public Accountants
 Accounting & Consulting Group, LLP Certified Public Accountants STATE OF NEW MEXICO ARTESIA SPECIAL HOSPITAL DISTRICT FINANCIAL STATEMENTS AS OF JUNE 30, 2013 AND 2012 (This page intentionally left blank)
WATAUGA COUNTY, NORTH CAROLINA FINANCIAL STATEMENTS FOR THE FISCAL YEAR ENDED JUNE 30, 2017
 WATAUGA COUNTY, NORTH CAROLINA FINANCIAL STATEMENTS FOR THE FISCAL YEAR ENDED JUNE 30, 2017 Misty D. Watson, CPA, PA PO Box 2122 Boone, NC 28607 WATAUGA COUNTY, NORTH CAROLINA BOARD OF COUNTY COMMISSIONERS
2018 BUDGET LETTER. 111 East Loop North Houston, Texas PortHouston.com
 2018 BUDGET LETTER Originally constituted in 1911, the Port of Houston Authority (the Authority or Port Houston ) is a political subdivision of the State of Texas and operates as a navigation district
Comprehensive Annual Financial Report. City of Medford Oregon
 Comprehensive Annual Financial Report City of Medford Oregon For the Fiscal Year Ended June 30, 2015 , OREGON COMPREHENSIVE ANNUAL FINANCIAL REPORT FOR THE FISCAL YEAR ENDED JUNE 30, 2015 Prepared by:
THE TRAILS PUBLIC IMPROVEMENT DISTRICT FINANCIAL STATEMENTS. June 30, 2016
 THE TRAILS PUBLIC IMPROVEMENT DISTRICT FINANCIAL STATEMENTS June 30, 2016 THE TRAILS PUBLIC IMPROVEMENT DISTRICT TABLE OF CONTENTS Table of Contents... 1 Official Roster... 2 Report of Independent Auditors...
BOARD OF EDUCATION OF THE BOROUGH OF HI-NELLA SCHOOL DISTRICT
 BOARD OF EDUCATION OF THE BOROUGH OF HI-NELLA SCHOOL DISTRICT COMPREHENSIVE ANNUAL FINANCIAL REPORT FOR THE FISCAL YEAR ENDED JUNE 30, 2017 22600 BOROUGH OF HI-NELLA SCHOOL DISTRICT Table of Contents INTRODUCTORY
COMPREHENSIVE ANNUAL FINANCIAL REPORT OF THE EAST CEDAR CREEK FRESH WATER SUPPLY DISTRICT
 COMPREHENSIVE ANNUAL FINANCIAL REPORT OF THE EAST CEDAR CREEK FRESH WATER SUPPLY DISTRICT FOR FISCAL YEAR ENDED March 31, 2018 General Manager Bill Goheen COMPREHENSIVE ANNUAL FINANCIAL REPORT FOR THE
SUNNYSIDE UNIFIED SCHOOL DISTRICT NO. 12 COMPREHENSIVE ANNUAL FINANCIAL REPORT FOR THE FISCAL YEAR ENDED JUNE 30, 2015
 COMPREHENSIVE ANNUAL FINANCIAL REPORT FOR THE FISCAL YEAR ENDED JUNE 30, 2015 2238 East Ginter Road Tucson, Arizona 85706 TUCSON, ARIZONA COMPREHENSIVE ANNUAL FINANCIAL REPORT FOR THE FISCAL YEAR ENDED
CABEZON PUBLIC IMPROVEMENT DISTRICT FINANCIAL STATEMENTS. June 30, 2016
 CABEZON PUBLIC IMPROVEMENT DISTRICT FINANCIAL STATEMENTS June 30, 2016 TABLE OF CONTENTS Table of Contents... 1 Official Roster... 2 Report of Independent Certified Public Accountants on Basic Financial
CITY OF FORNEY, TEXAS
 CITY OF FORNEY, TEXAS COMPREHENSIVE ANNUAL FINANCIAL REPORT FISCAL YEAR ENDED SEPTEMBER 30, 2014 CITY MANAGER BRIAN BROOKS DIRECTOR OF ADMINISTRATIVE SERVICES LEIGH CORSON CITY OF FORNEY, TEXAS COMPREHENSIVE
MEDINAH PARK DISTRICT MEDINAH, ILLINOIS COMPREHENSIVE ANNUAL FINANCIAL REPORT
 MEDINAH PARK DISTRICT MEDINAH, ILLINOIS COMPREHENSIVE ANNUAL FINANCIAL REPORT FOR THE FISCAL YEAR ENDED DECEMBER 31, 2017 Medinah, Illinois Comprehensive Annual Financial Report For The Year Ended December
Harris County Flood Control District A Component Unit of Harris County, Texas
 Harris County Flood Control District A Component Unit of Harris County, Texas Comprehensive Annual Financial Report For the Fiscal Year Ended February 28, 2013 Prepared By: Barbara J. Schott, C.P.A. County
COMPREHENSIVE ANNUAL FINANCIAL REPORT
 COMPREHENSIVE ANNUAL FINANCIAL REPORT City of Nampa, Idaho for Fiscal Year Ended September 30, 2014 COMPREHENSIVE ANNUAL FINANCIAL REPORT CITY OF NAMPA, IDAHO Fiscal Year Ended September 30, 2014 Submitted
ANNUAL FINANCIAL REPORT CITY OF GROVES, TEXAS
 ANNUAL FINANCIAL REPORT For the fiscal year ended September 30, 2010 3411 Richmond Avenue Suite 500 Houston, TX 77046 (P) 713.621.1515 (F) 713.621.1570 www.null-lairson.com ANNUAL FINANCIAL REPORT TABLE
ST. CLAIR COUNTY, MICHIGAN
 TABLE OF CONTENTS DECEMBER 31, 2005 Page Number SECTION ONE: INTRODUCTORY SECTION Letter of Transmittal I-1 List of Elected and Appointed Officials I-9 GFOA Certificate of Achievement I-10 Organizational
SUNNYSIDE UNIFIED SCHOOL DISTRICT NO. 12 COMPREHENSIVE ANNUAL FINANCIAL REPORT FOR THE FISCAL YEAR ENDED JUNE 30, 2012
 COMPREHENSIVE ANNUAL FINANCIAL REPORT FOR THE FISCAL YEAR ENDED JUNE 30, 2012 2238 East Ginter Road Tucson, Arizona 85706 TUCSON, ARIZONA COMPREHENSIVE ANNUAL FINANCIAL REPORT FOR THE FISCAL YEAR ENDED
PUBLIC IMPROVEMENT DISTRICT FINANCIAL STATEMENTS
 THE TRAILS PUBLIC IMPROVEMENT DISTRICT FINANCIAL STATEMENTS JUNE 30, 2014, 2013 and 2012 TABLE OF CONTENTS THE TRAILS PUBLIC IMPROVEMENT DISTRICT OFFICIAL ROSTER... 1 REPORT OF INDEPENDENT AUDITORS...
Little Rock School District of Pulaski County, Arkansas ANNUAL FINANCIAL REPORT
 Little Rock School District of Pulaski County, Arkansas ANNUAL FINANCIAL REPORT ANNUAL FINANCIAL REPORT Table of Contents Pages INDEPENDENT AUDITORS REPORT ON FINANCIAL STATEMENTS AND SUPPLEMENTARY INFORMATION
CITY OF NEDERLAND, TEXAS. Comprehensive Annual Financial Report
 Comprehensive Annual Financial Report For the Year Ended September 30, 2014 Prepared by the Finance Department INTRODUCTORY SECTION Comprehensive Annual Financial Report September 30, 2014 Table of Contents
JUDSON INDEPENDENT SCHOOL DISTRICT ANNUAL FINANCIAL REPORT FOR THE YEAR ENDED JUNE 30, 2014
 JUDSON INDEPENDENT SCHOOL DISTRICT ANNUAL FINANCIAL REPORT FOR THE YEAR ENDED JUNE 30, 2014 This Page Intentionally Left Blank ANNUAL FINANCIAL REPORT YEAR ENDED JUNE 30, 2014 TABLE OF CONTENTS PAGE EXHIBIT
DISCOVERY Clean Water Alliance. Vancouver, Washington
 DISCOVERY Clean Water Alliance Vancouver, Washington Comprehensive Annual Financial Report For The Fiscal Year Ended December 31, 2016 DISCOVERY CLEAN WATER ALLIANCE Vancouver, Washington COMPREHENSIVE
COMPREHENSIVE ANNUAL FINANCIAL REPORT
 COMPREHENSIVE ANNUAL FINANCIAL REPORT For the Fiscal Year Ended June 30, 2015 COMPREHENSIVE ANNUAL FINANCIAL REPORT For the Fiscal Year Ended June 30, 2015 Prepared by the West Chester Area School District
Port of Vancouver Clark County
 Washington State Auditor s Office Financial Statements and Federal Single Audit Report Port of Vancouver Clark County Audit Period January 1, 2013 through December 31, 2013 Report No. 1011625 Issue Date
RIO ALTO WATER DISTRICT
 BASIC FINANCIAL STATEMENTS FOR YEAR ENDED JUNE 30, 2016 Photo from: merchantcircle.com Audited Basic Financial Statements Table of Contents Independent Auditor s Report on Basic Financial Statements...
SALEM CITY CORPORATION FINANCIAL STATEMENTS
 FINANCIAL STATEMENTS FOR THE YEAR ENDED JUNE 30, 2017 Allred Jackson, PC 50 East 2500 North, Suite 200 North Logan, UT 84341 (P) 435.752.6441 (F) 435.752.6451 www.allredjackson.com ii Table of Contents
CITY OF MINNETRISTA, MINNESOTA COMPREHENSIVE ANNUAL FINANCIAL REPORT YEAR ENDED DECEMBER 31, 2013
 , MINNESOTA COMPREHENSIVE ANNUAL FINANCIAL REPORT YEAR ENDED DECEMBER 31, 2013 PREPARED BY THE FINANCE DEPARTMENT OF THE CITY OF MINNETRISTA, MINNESOTA BRIAN GRIMM DIRECTOR OF FINANCE TABLE OF CONTENTS
Port of Port Townsend
 Financial Statements Audit Report Port of Port Townsend Jefferson County For the period January 1, 2014 through December 31, 2015 Published January 19, 2017 Report No. 1018433 Office of the Washington
CITY OF ALLEN PARK, MICHIGAN
 FINANCIAL REPORT WITH SUPPLEMENTAL INFORMATION JUNE 30, 2016 Contents Independent Auditor s Report... 1 Management s Discussion and Analysis... 3 Basic Financial Statements: Government-Wide Financial Statements:
ARTESIA SPECIAL HOSPITAL DISTRICT EDDY COUNTY, NEW MEXICO FINANCIAL STATEMENTS
 ARTESIA SPECIAL HOSPITAL DISTRICT EDDY COUNTY, NEW MEXICO FINANCIAL STATEMENTS AS OF JUNE 30, 2010 AND 2009 (This page intentionally left blank) 2 INTRODUCTORY SECTION 3 (This page intentionally left blank)
ALHAMBRA ELEMENTARY SCHOOL DISTRICT NO. 68
 ALHAMBRA ELEMENTARY SCHOOL DISTRICT NO. 68 Comprehensive Annual Financial Report Fiscal Year Ended June 30, 2013 4510 North 37 th Avenue Phoenix, Arizona 85019 PHOENIX, ARIZONA COMPREHENSIVE ANNUAL FINANCIAL
February 28, Hernando County Board of County Commissioners 20 N. Main Street Brooksville, Florida Ladies and Gentlemen:
 February 28, 2002 Hernando County Board of County Commissioners 20 N. Main Street Brooksville, Florida 34601 Ladies and Gentlemen: The Comprehensive Annual Financial Report of Hernando County, Florida,
VILLAGE OF GOLF, FLORIDA COMPREHENSIVE ANNUAL FINANCIAL REPORT FOR THE FISCAL YEAR ENDED SEPTEMBER 30, 2014
 VILLAGE OF GOLF, FLORIDA COMPREHENSIVE ANNUAL FINANCIAL REPORT FOR THE FISCAL YEAR ENDED SEPTEMBER 30, 2014 Prepared by: Finance Department VILLAGE OF GOLF, FLORIDA TABLE OF CONTENTS INTRODUCTORY SECTION
Sherman Independent School District
 Sherman Independent School District Annual Financial Report Year Ended June 30, 2014 Sherman Independent School District Annual Financial Report Year Ended June 30, 2014 Table of Contents Page Exhibit
Washington State Auditor Troy Kelley
 Washington State Auditor Troy Kelley INDEPENDENT AUDITOR S REPORT July 17, 2014 Board of Commissioners Kitsap County Port Orchard, Washington REPORT ON FINANCIAL STATEMENTS We have audited the accompanying
Minutes of Meeting June 23, 2016
 Minutes of Meeting June 23, 2016 A Regular Meeting of the Port Commission of Port Freeport was held June 23, 2016 beginning at 4:02 PM at the Administration Building, 1100 Cherry Street, Freeport, Texas.
LANCASTER COUNTY SCHOOL DISTRICT
 LANCASTER COUNTY SCHOOL DISTRICT LANCASTER, SOUTH CAROLINA COMPREHENSIVE ANNUAL FINANCIAL REPORT FOR FISCAL YEAR ENDED JUNE 30, 2016 ISSUED BY LANCASTER COUNTY SCHOOL DISTRICT GENE MOORE, ED.D. SUPERINTENDENT
CITY OF MCLENDON-CHISHOLM, TEXAS AUDITED FINANCIAL STATEMENTS SEPTEMBER 30, 2017
 AUDITED FINANCIAL STATEMENTS MURREY PASCHALL & CAPERTON, P.C. Certified Public Accountants TABLE OF CONTENTS Independent Auditor s Report Page 3 Management s Discussion and Analysis Page 5 Basic Financial
Comprehensive Annual Financial Report
 Comprehensive Annual Financial Report For the Year Ended September 30, 2015 and 2014 Port Canaveral, Florida Prepared by the Department of Finance COMPREHENSIVE ANNUAL FINANCIAL REPORT of the Canaveral
SCHAUMBURG PARK DISTRICT, ILLINOIS COMPREHENSIVE ANNUAL FINANCIAL REPORT
 SCHAUMBURG PARK DISTRICT, ILLINOIS COMPREHENSIVE ANNUAL FINANCIAL REPORT FOR THE FISCAL YEAR ENDED MARCH 31, 2017 COMPREHENSIVE ANNUAL FINANCIAL REPORT FOR THE FISCAL YEAR ENDED MARCH 31, 2017 Prepared
Comprehensive Annual Financial Report
 Comprehensive Annual Financial Report of the Borough of Avalon Board of Education Cape May County, New Jersey For the Fiscal Year Ended June 30, 2016 TABLE OF CONTENTS Page Letter of Transmittal 1-4 Organizational
River Forest Public Library River Forest, Illinois Comprehensive Annual Financial Report For the Year Ended April 30, 2016
 River Forest, Illinois Comprehensive Annual Financial Report For the Year Ended April 30, 2016 Submitted by: Susan Quinn Library Director Table of Contents For the Year Ended April 30, 2016 PART I - INTRODUCTORY
PUBLIC IMPROVEMENT DISTRICT FINANCIAL STATEMENTS
 VENTANA WEST PUBLIC IMPROVEMENT DISTRICT FINANCIAL STATEMENTS JUNE 30, 2014 and 2013 TABLE OF CONTENTS OFFICIAL ROSTER... 1 REPORT OF INDEPENDENT AUDITORS... 2 MANAGEMENT S DISCUSSION AND ANALYSIS... 4
FINANCIAL STATEMENTS September 30, 2017 and 2016
 FINANCIAL STATEMENTS CHILDREN'S BOARD OF HILLSBOROUGH COUNTY Tampa, Florida FINANCIAL STATEMENTS CONTENTS INDEPENDENT AUDITOR S REPORT... 1-2 MANAGEMENT S DISCUSSION AND ANALYSIS... 3-11 BASIC FINANCIAL
STANDISH-STERLING COMMUNITY SCHOOLS Arenac, Bay, and Gladwin Counties, Michigan. FINANCIAL REPORT WITH SUPPLEMENTAL INFORMATION June 30, 2012
 STANDISH-STERLING COMMUNITY SCHOOLS Arenac, Bay, and Gladwin Counties, Michigan FINANCIAL REPORT WITH SUPPLEMENTAL INFORMATION June 30, 2012 TABLE OF CONTENTS PAGE Report Letter 1 2 Report on Internal
STATE OF NEW MEXICO EL VALLE DE LOS RANCHOS WATER & SANITATION DISTRICT ANNUAL FINANCIAL REPORT JUNE 30, 2016
 STATE OF NEW MEXICO EL VALLE DE LOS RANCHOS WATER & SANITATION DISTRICT ANNUAL FINANCIAL REPORT JUNE 30, 2016 (This page intentionally left blank.) INTRODUCTORY SECTION (This page intentionally left blank.)
CEDARBURG SCHOOL DISTRICT Cedarburg, Wisconsin. Audited Financial Statements Year Ended June 30, Independent Auditors' Report 1-2
 Audited Financial Statements Year Ended Table of Contents Page(s) Independent Auditors' Report 1-2 Management Discussion & Analysis 3-14 Basic Financial Statements Statement of Net Position 15 Statement
The Transit Authority of the City of Omaha FINANCIAL STATEMENTS AND INDEPENDENT AUDITORS REPORT For the years ended December 31, 2014, and 2013
 FINANCIAL STATEMENTS AND INDEPENDENT AUDITORS REPORT For the years ended December 31, 2014, and 2013 TABLE OF CONTENTS INDEPENDENT AUDITOR S REPORT 2-4 MANAGEMENT S DISCUSSION AND ANALYSIS 5-11 GENERAL
BOROUGH OF LINDENWOLD SCHOOL DISTRICT LINDENWOLD, NEW JERSEY
 BOROUGH OF LINDENWOLD SCHOOL DISTRICT LINDENWOLD, NEW JERSEY COMPREHENSIVE ANNUAL FINANCIAL REPORT FOR THE FISCAL YEAR ENDED JUNE 30, 2017 27400 BOROUGH OF LINDENWOLD SCHOOL DISTRICT Table of Contents
MOBILE AIRPORT AUTHORITY
 FINANCIAL STATEMENTS AND SUPPLEMENTARY INFORMATION FOR THE YEAR ENDED SEPTEMBER 30, 2016 WITH COMPARATIVE TOTALS FOR THE YEAR ENDED SEPTEMBER 30, 2015 Introductory Section Transmittal Letter Financial
THE ALASKA RAILROAD CORPORATION. a vision etched in steel
 THE ALASKA RAILROAD CORPORATION a vision etched in steel 2 0 0 4 A N N U A L R E P O R T F I N A N C I A L S E C T I O N T A B L E O F C O N T E N T S Transmittal Letter..................................................................1
MESA COUNTY PUBLIC LIBRARY DISTRICT FINANCIAL STATEMENTS INDEPENDENT AUDITOR S REPORT. December 31, 2017
 FINANCIAL STATEMENTS & INDEPENDENT AUDITOR S REPORT December 31, 2017 TABLE OF CONTENTS Independent Auditor s Report 1 Management s Discussion and Analysis 3 Basic Financial Statements Government-Wide
TOWN OF CUMBERLAND, RHODE ISLAND ANNUAL FINANCIAL STATEMENTS FOR THE YEAR ENDED JUNE 30, 2016
 ANNUAL FINANCIAL STATEMENTS FOR THE YEAR ENDED JUNE 30, 2016 For the year ended Table of Contents Independent Auditor's Report... 1 Management's Discussion and Analysis... 4 Basic Financial Statements...
CAPE COD REGIONAL TRANSIT AUTHORITY (a component Unit of the Massachusetts Department of Transportation)
") (a component Unit of the Massachusetts Department of Transportation) Basic Financial Statements, Supplementary Data For the Year Ended June 30, 2017 Table of Contents Management s Discussion and Analysis
(a component Unit of the Massachusetts Department of Transportation) Basic Financial Statements, Supplementary Data For the Year Ended June 30, 2017 Table of Contents Management s Discussion and Analysis
PROVISO TOWNSHIP HIGH SCHOOL DISTRICT NO. 209 [Forest Park, Illinois] Audited Financial Statements And Supplementary Financial Information
![PROVISO TOWNSHIP HIGH SCHOOL DISTRICT NO. 209 [Forest Park, Illinois] Audited Financial Statements And Supplementary Financial Information](/thumbs/90/101384916.jpg "PROVISO TOWNSHIP HIGH SCHOOL DISTRICT NO. 209 [Forest Park, Illinois] Audited Financial Statements And Supplementary Financial Information") PROVISO TOWNSHIP HIGH SCHOOL DISTRICT NO. 209 [Forest Park, Illinois] Audited Financial Statements And Supplementary Financial Information June 30, 2017 THIS PAGE INTENTIONALLY LEFT BLANK PROVISO TOWNSHIP
PROVISO TOWNSHIP HIGH SCHOOL DISTRICT NO. 209 [Forest Park, Illinois] Audited Financial Statements And Supplementary Financial Information June 30, 2017 THIS PAGE INTENTIONALLY LEFT BLANK PROVISO TOWNSHIP
HARRIS COUNTY EMERGENCY SERVICES DISTRICT NO.
 Report on Financial Statements (With Supplemental Material) For the Year Ended December 31, 2017 BREEDLOVE & CO., P.C. CERTIFIED PUBLIC ACCOUNTANTS TABLE OF CONTENTS Independent Auditors Report... 1-2
ELKO COUNTY, NEVADA JUNE 30,2010
 , NEVADA JUNE 30,2010 JUNE 30,2010 TABLE OF CONTENTS Page No. FINANCIAL SECTION Independent Auditor's Report: On Financial Statements and Supplementary Data 1 Management's Discussion and Analysis (Required
SCHERTZ-CIBOLO-UNIVERSAL CITY INDEPENDENT SCHOOL DISTRICT ANNUAL FINANCIAL REPORT
 SCHERTZ-CIBOLO-UNIVERSAL CITY INDEPENDENT SCHOOL DISTRICT ANNUAL FINANCIAL REPORT FOR THE YEAR ENDED AUGUST 31, 2016 SCHERTZ-CIBOLO-UNIVERSAL CITY INDEPENDENT SCHOOL DISTRICT ANNUAL FINANCIAL REPORT FOR
McLennan County Junior College District Annual Financial Report August 31, 2013 and 2012
 McLennan County Junior College District Annual Financial Report August 31, 2013 and 2012 Introductory Section McLennan County Junior College District Table of Contents Exhibit / Schedule Page Introductory
KANSAS DEPARTMENT OF TRANSPORTATION
 KANSAS DEPARTMENT OF TRANSPORTATION A DEPARTMENT OF THE STATE OF KANSAS COMPREHENSIVE ANNUAL FINANCIAL REPORT FOR THE FISCAL YEAR ENDED JUNE 30, 2017 NOTE: This information is available in alternative
Saginaw-Midland Municipal. Water Supply Corporation
 Saginaw-Midland Municipal Water Supply Corporation Financial Statements Table of Contents Section Page 1 Independent Auditors Report 1 2 Management s Discussion and Analysis 4 3 Basic Financial Statements
MADISON METROPOLITAN SEWERAGE DISTRICT Madison, Wisconsin. FINANCIAL STATEMENTS December 31, 2015 and 2014
 MADISON METROPOLITAN SEWERAGE DISTRICT Madison, Wisconsin FINANCIAL STATEMENTS TABLE OF CONTENTS PAGE INDEPENDENT AUDITOR S REPORT... 1 MANAGEMENT S DISCUSSION AND ANALYSIS... 3 BASIC FINANCIAL STATEMENTS
Eaton County, Michigan. Year Ended September 30, Financial Statements and Single Audit Act Compliance
 Eaton County, Michigan Year Ended September 30, 2017 Financial Statements and Single Audit Act Compliance Table of Contents Introductory Section 1 Letter of Transmittal 3 Organizational Chart 5 Principal
PAULDING COUNTY BOARD OF EDUCATION DALLAS, GEORGIA
 PAULDING COUNTY BOARD OF EDUCATION DALLAS, GEORGIA ANNUAL FINANCIAL REPORT FOR THE FISCAL YEAR ENDED JUNE 30, 2015 (Including Independent Auditor's Reports) PAULDING COUNTY BOARD OF EDUCATION - TABLE OF
COMPREHENSIVE ANNUAL FINANCIAL REPORT. City of Lucas, Texas
 COMPREHENSIVE ANNUAL FINANCIAL REPORT City of Lucas, Texas Home-Rule, Council-Manager Form of Government Interim City Manager Dan Savage Finance Manager Elizabeth Exum COMPREHENSIVE ANNUAL FINANCIAL REPORT
LEE COUNTY SCHOOL DISTRICT BISHOPVILLE, SOUTH CAROLINA
 BISHOPVILLE, SOUTH CAROLINA BASIC FINANCIAL STATEMENTS AND SUPPLEMENTAL INFORMATION FISCAL YEAR ENDED JUNE 30, 2013 TABLE OF CONTENTS JUNE 30, 2013 FINANCIAL SECTION: PAGE Independent Auditor s Report...
CITY OF LAGUNA BEACH, CALIFORNIA. Comprehensive Annual Financial Report. For the Fiscal Year Ended June 30, 2015
 CITY OF LAGUNA BEACH, CALIFORNIA Comprehensive Annual Financial Report For the Fiscal Year Ended June 30, 2015 CITY OF LAGUNA BEACH, CALIFORNIA COMPREHENSIVE ANNUAL FINANCIAL REPORT FOR THE FISCAL YEAR
TOLTEC SCHOOL DISTRICT NO. 22 ELOY, ARIZONA
 ELOY, ARIZONA ANNUAL FINANCIAL REPORT FISCAL YEAR ENDED Issued by: Business and Finance Department This page is intentionally left blank. TABLE OF CONTENTS Page INDEPENDENT AUDITORS' REPORT...1 MANAGEMENT'S
CITY OF GROESBECK, TEXAS ANNUAL FINANCIAL REPORT
 CITY OF GROESBECK, TEXAS ANNUAL FINANCIAL REPORT For the Year Ended September 30, 2017 Introductory Section City of Groesbeck Annual Financial Report For the Year Ended September 30, 2017 Table of Contents
RIO GRANDE CITY CISD ANNUAL FINANCIAL REPORT FOR THE YEAR ENDED AUGUST 31, 2015 TABLE OF CONTENTS
 RIO GRANDE CITY CISD ANNUAL FINANCIAL REPORT FOR THE YEAR ENDED AUGUST 31, 2015 Exhibit TABLE OF CONTENTS Page CERTIFICATE OF BOARD 1 Independent Auditors' Report 2 Management's Discussion and Analysis
HARDEE COUNTY ECONOMIC DEVELOPMENT AUTHORITY FINANCIAL STATEMENTS YEAR ENDED SEPTEMBER 30, 2011
 FINANCIAL STATEMENTS YEAR ENDED TABLE OF CONTENTS YEAR ENDED INDEPENDENT AUDITORS' REPORT 1 MANAGEMENT S DISCUSSION AND ANALYSIS 3 BASIC FINANCIAL STATEMENTS GOVERNMENT-WIDE FINANCIAL STATEMENTS STATEMENT
City of Bentonville, Arkansas
 Comprehensive Annual Financial Report For the Year Ended December 31, 2016 Prepared by: Denise Land Finance Director Jake Harper Assistant Finance Director Visit our web site at: www.bentonvillear.com
CITY OF FRIENDSWOOD, TEXAS
 COMPREHENSIVE ANNUAL FINANCIAL REPORT YEAR ENDED SEPTEMBER 30, 2011 Officials Issuing Report: Roger C. Roecker City Manager Cindy S. Edge Director of Administrative Services COMPREHENSIVE ANNUAL FINANCIAL
LAKE TRAVIS INDEPENDENT SCHOOL DISTRICT. Annual Financial Report for the Fiscal Year Ended August 31, 2016
 LAKE TRAVIS INDEPENDENT SCHOOL DISTRICT Annual Financial Report for the Fiscal Year Ended August 31, 2016 LAKE TRAVIS INDEPENDENT SCHOOL DISTRICT Annual Financial Report Year Ended August 31, 2016 Table
Port of Longview. Financial Statements Audit Report. Cowlitz County. For the period January 1, 2016 through December 31, 2016
 Financial Statements Audit Report Port of Longview Cowlitz County For the period January 1, 2016 through December 31, 2016 Published November 20, 2017 Report No. 1020220 Office of the Washington State
TABLE OF CONTENTS. Page INDEPENDENT AUDITOR'S REPORT 1 MANAGEMENT S DISCUSSION AND ANALYSIS 4 BASIC FINANCIAL STATEMENTS
 VILLAGE OF BEAR LAKE, MICHIGAN ANNUAL FINANCIAL REPORT YEAR ENDED FEBRUARY 28, 2018 TABLE OF CONTENTS INDEPENDENT AUDITOR'S REPORT 1 MANAGEMENT S DISCUSSION AND ANALYSIS 4 BASIC FINANCIAL STATEMENTS Government-wide
QUEEN CREEK UNIFIED SCHOOL DISTRICT NO. 95
 QUEEN CREEK UNIFIED SCHOOL DISTRICT NO. 95 Comprehensive Annual Financial Report Fiscal Year Ended June 30, 2014 20217 East Chandler Heights Road Queen Creek, Arizona 85142 QUEEN CREEK, ARIZONA COMPREHENSIVE