City of Lompoc, California. Financial Statements. Year Ended June 30, 2015
|
|
|
- Fay Norton
- 5 years ago
- Views:
Transcription
1 Financial Statements Year Ended June 30, 2015
2 Financial Statements Year Ended June 30, 2015 Table of Contents Page Independent Auditors Report 4 6 Management s Discussion and Analysis 7 26 Basic Financial Statements Government wide Financial Statements: Statement of Net Position Statement of Activities Fund Financial Statements: Governmental Funds: Balance Sheet Reconciliation of Governmental Funds Balance Sheet to the Statement of Net Position 35 Statement of Revenues, Expenditures, and Changes in Fund Balance 36 Reconciliation of the Governmental Funds Statement of Revenues, Expenditures, and Changes in Fund Balance to the Statement of Activities Proprietary Funds: Statement of Net Position Statement of Revenues, Expenses, and Changes in Fund Net Position Statement of Cash Flows Fiduciary Funds: Statement of Fiduciary Net Position 49 Statement of Changes in Fiduciary Net Position 50 Notes to Financial Statements
3 Financial Statements Year Ended June 30, 2015 Table of Contents Page 2 Page Required Supplementary Information Budgetary Comparison Schedule General Fund Schedule of Funding Progress for OPEB Obligation 105 Schedule of the Changes in the Net Pension Liability and Related Ratios Miscellaneous Agent Multiple Employer Plan 106 Schedule of Plan Contributions Miscellaneous Agent Multiple Employer Plan 107 Schedule of the City's Proportionate Share of the Net Pension Liability Safety Cost Sharing Plans 108 Schedule of the City's Contributions Safety Cost Sharing Plans 109 Notes to Required Supplementary Information Supplementary Information Combining Balance Sheet Other Governmental Funds Combining Statement of Revenues, Expenditures, and Changes in Fund Balance Other Governmental Funds Combining Statement of Net Position Other Enterprise Funds Combining Statement of Revenues, Expenses, and Changes in Fund Net Position Other Enterprise Funds Combining Statement of Cash Flows Other Enterprise Funds Combining Statement of Net Position Internal Service Funds Combining Statement of Revenues, Expenses, and Changes in Fund Net Position Internal Service Funds Combining Statement of Cash Flows Internal Service Funds Municipal Officers 144 Organization Chart 145 3
4
5 Honorable Mayor and City Council City of Lompoc Page 2 We believe that the audit evidence we have obtained is sufficient and appropriate to provide a basis for our audit opinions. Opinions In our opinion, the financial statements referred to above present fairly, in all material respects, the respective financial position of the governmental activities, the business type activities, each major fund, and the aggregate remaining fund information of the, as of June 30, 2015, and the respective changes in financial position and, where applicable, cash flows thereof for the year then ended, in accordance with accounting principles generally accepted in the United States of America. Change in Accounting Principle As discussed in Note 16 to the financial statements, in 2015 the City adopted new accounting guidance, GASB Statement No. 68, Accounting and Financial Reporting for Pensions An Amendment of GASB Statement No. 27 and GASB Statement No. 71, Pension Transition for Contributions Made Subsequent to the Measurement Date An Amendment of GASB Statement No. 68. Our opinion is not modified with respect to this matter. Other Matters Required Supplementary Information Accounting principles generally accepted in the United States of America require that management's discussion and analysis and other required supplementary information as listed in the table of contents be presented to supplement the basic financial statements. Such information, although not a part of the basic financial statements, is required by the Governmental Accounting Standards Board, who considers it to be an essential part of the financial reporting for placing the basic financial statements in an appropriate operational, economic, or historical context. We have applied certain limited procedures to the required supplementary information in accordance with auditing standards generally accepted in the United States of America, which consisted of inquiries of management about the methods of preparing the information and comparing the information for consistency with management s responses to our inquiries, the basic financial statements, and other knowledge we obtained during our audit of the basic financial statements. We do not express an opinion or provide any assurance on the information because the limited procedures do not provide us with sufficient evidence to express an opinion or provide any assurance. Other Information Our audit was conducted for the purpose of forming opinions on the financial statements that collectively comprise the City s basic financial statements. The combining and individual nonmajor fund financial statements are presented for purposes of additional analysis and are not a required part of the basic financial statements. 5

6
7 Management s Discussion and Analysis As management of the City of Lompoc (the City ), we offer readers of the City s financial statements this discussion and analysis of the financial activities of the City for the fiscal year ended June 30, We encourage readers to consider the information presented here in conjunction with the accompanying Basic Financial Statements. EXECUTIVE SUMMARY FINANCIAL HIGHLIGHTS The presentation of the financial activity for the fiscal year ended June 30, 2015 includes the implementation of new pronouncements by the Government Accounting Standards Board (GASB) related to pension reporting. Implementation of GASB Pronouncement No. 68 Accounting and Financial Reporting for Pensions an amendment of GASB Statement No. 27, and GASB Pronouncement No. 71, Pension Transition for Contributions Made Subsequent to the Measurement Date an amendment of GASB Statement No. 68, (herein referred to as GASB 68) requires the recognition of pension liabilities in the Basic Financial Statements rather than reporting pension liabilities only in the notes of the Basic Financial Statements. The City did not reflect these pension standards in the 2014 results because the necessary actuarial information from the California Public Employees Retirement System (herein referred to as CalPERS) was not provided for the prior years presented. This change in presentation will be reflected throughout the Basic Financial Statements beginning below in the summary of financial highlights: Government-wide: City total assets increased by $6.7 million (1.8%) to $371.4 million compared with the prior year, of which $145.5 million represented governmental assets and $226.0 million represented business type assets. City total liabilities increased by $51.1 million (38.4%) to $184.5 million compared with the prior year, of which $61.0 million were governmental liabilities and $123.5 million, were business type liabilities. The implementation of GASB 68 accounts for a significant portion of the increase. The City s total net position decreased by $48.8 million (21.1%) to $182.8 million compared with the prior year. Of this amount, a negative $23.7 million (unrestricted government wide net position) is available to be used to meet the government s ongoing obligations to citizens and creditors. Implementation of GASB 68 accounts for a significant portion of this decrease and for the negative balance of unrestricted net position. City wide revenues were $97.6 million, an increase of $6.3 million (6.9%) compared with the prior year, of which $34 million were generated by governmental activities and $63.6 million were generated by business type activities. City wide expenses were $84 million, a decrease of $5.5 million (6.2%) compared with the prior year, of which $29.1 million were incurred by governmental activities and $54.8 million were incurred by business type activities. Fund Level: Governmental Fund balances increased $0.9 million (3.2%) to $29.5 million compared with the prior year. Of this amount, $5.6 million, or 18.9%, was unassigned fund balance and available for spending at the City s discretion. Governmental Fund revenues decreased by $0.1 million (0.3%) to $33.4 million compared with the prior year. Governmental Fund expenditures increased by $0.4 million (1.2%) to $35.1 million compared with the prior year. Enterprise Fund net position decreased by $6.6 million (6.1%) to $101.3 million compared with the prior year. Of this amount, $11.4 million, or 11.3% was unrestricted net position and available for spending at the City s discretion. Implementation of GASB 68 accounts for a significant portion of this decrease Enterprise Fund operating revenues increased $4.8 million (8.4%) to $62.1 million compared with the prior year. Enterprise Fund operating expenses increased $1.2 million (2.4%) to $52.1 million compared with the prior year. 7
8 City of Lompoc Management s Discussion and Analysis Fiscal Year Ended June 30, 2015 OVERVIEW OF THE BASIC FINANCIAL STATEMENTS This annual report consists of four parts: 1. Management s discussion and analysis (this section), 2. The Basic Financial Statements, 3. Required supplementary information, and 4. Supplementary information. The Basic Financial Statements include two kinds of statements that present different views of the City. The government-wide financial statements provide both long-term and short-term information about the City s overall financial status. Fund financial statements focus on individual parts of the City government, reporting the City s operations in more detail than the government-wide statements. Governmental funds statements tell how general government services such as police, fire, and public works were financed in the short term as well as what remains for future spending. Proprietary fund statements offer short-term and long-term financial information about the activities the City operates like businesses, such as utility services. Fiduciary fund statements provide information about the financial relationships in which the City acts solely as a trustee or agent for the benefit of others, to whom the resources belong. The Basic Financial Statements also include notes that explain some of the information in the financial statements and provide more detailed data. The notes provide additional information that is essential to a full understanding of the data provided in the government-wide and fund financial statements. In the supplementary information section, we have opted to include combining and individual statements that provide details about our nonmajor governmental funds, nonmajor enterprise funds, and internal service funds, each of which is presented in a column in the Basic Financial Statements. Government-Wide Financial Statements The government-wide financial statements report information about the City as a whole using accounting methods similar to those used by private-sector companies. The statement of net positions (the Unrestricted Net Position ) is designed to be similar to a bottom line for the City and its governmental and business-type activities. Over time, increases or decreases in net position may serve as a useful indicator of whether the financial position of the City is improving or deteriorating. This statement combines and consolidates governmental fund s current financial resources (short-term spendable resources) with capital assets and long-term obligations. The statement of activities presents information showing how the government s net position changed during the recent fiscal year. All changes in net positions are reported as soon as the underlying event giving rise to the change occurs, regardless of the timing of the related cash flows. Thus, revenues and expenses are reported in this statement for some items that will only result in cash flows in future fiscal periods (e.g., uncollected taxes and earned but unused vacation leave). 8
9 City of Lompoc Management s Discussion and Analysis Fiscal Year Ended June 30, 2015 The government-wide financial statements of the City are divided as follows: Governmental activities Most of the City s basic services are included here, such as general government, public safety, highways and streets, parks and recreation, and community development. Taxes, state and federal grants, and intergovernmental revenues finance most of these activities. Business-type activities Certain services provided by the City are intended to recover all or a significant portion of their costs through user fees and charges. Among these are electric distribution, water, sewer, solid waste services, transit, recreation, airport services, aquatic center, broadband, and community center. Component Units The City currently has no discretely presented component units. Fund Financial Statements The City, like other state and local governments, uses fund accounting to ensure and demonstrate compliance with finance-related legal requirements. A fund is a group of related accounts that is used to maintain control over resources that have been segregated for specific activities or objectives. All of the funds of the City can be divided into three categories: governmental funds, proprietary funds, and fiduciary funds. Governmental funds Most of the City s basic services are reported in governmental funds, which focus on how money flows into and out of those funds and the balances left at fiscal year-end that are available for spending. These funds are reported using an accounting method called modified accrual accounting, which measures cash and all other financial assets that can readily be converted to cash. The governmental statements provide a detailed short-term view of the City s general government operations and the basic services it provides. Governmental fund information helps you determine whether there are more or fewer financial resources that can be spent in the near future to finance the City s programs. We describe the relationship (or differences) between governmental activities (reported in the Statement of Net Position and the Statement of Activities) and governmental funds in reconciliations to the fund financial statements. Proprietary funds The City maintains two different types of proprietary funds. Enterprise funds are used to report the same functions presented as business-type activities in the government-wide financial statements. The City uses enterprise funds to account for its Water, Electric, Wastewater, Airport, Aquatic Center, Broadband, Solid Waste, Transit, Recreation, River Park Campground, and the Dick DeWees Community and Senior Center. The City uses internal service funds to report activities that provide supplies and services for the City s other programs and activities and to account for its fleet of vehicles, insurance, communications, and central stores. The internal service funds predominantly provide services to governmental activity functions and therefore are included within the governmental activities of the government-wide financial statements. Proprietary funds are reported using the economic resources measurement focus and the full accrual basis of accounting. Revenues are recorded when earned and expenses are recorded at the time liabilities are incurred, regardless of when the related cash flows take place. Fiduciary funds Fiduciary funds are used to account for resources held by the City as a trustee on behalf of other agencies or individuals outside the government. Fiduciary funds are not reflected in the government-wide financial statements because the resources of those funds are not available to support the City s own programs. A relatively new fiduciary fund of the City is the Private Purpose Trust Fund used to account for assets and liabilities held in trust for the Successor Agency to the former Lompoc Redevelopment Agency. The accounting method used for fiduciary funds is also the full accrual basis of accounting. 9
10 City of Lompoc Management s Discussion and Analysis Fiscal Year Ended June 30, 2015 FINANCIAL ANALYSIS OF THE CITY AS A WHOLE As previously noted, net positions may serve over time as a useful indicator of a government s financial position. In the case of the City, assets exceeded liabilities by $182.8 million as of June 30, The largest portion of the City s net positions (97.1%) reflects its investment in capital assets (e.g., land, buildings, machinery, equipment, and infrastructure), less any related debt used to acquire those assets that is still outstanding. The City uses its capital assets to provide services to citizens; consequently, these assets are not available for future spending. Although the City s investment in its capital assets is reported net of related debt, it should be noted that the resources needed to repay this debt must be provided from other sources, since the capital assets themselves cannot be used to liquidate these liabilities. During the current fiscal year, the City s governmental activities net position decreased by $42.2 million or 34.1% compared with the previous year. This decrease was attributable to the net recognition of net pension liabilities ($39.9 million) and deferred inflow of resources ($6.8 million) related to the implementation of GASB 68 offset by reductions in operational expenses across a wide cross section of the City s governmental activities. The City s business-type activities net position decreased by $6.6 million or 6.1% compared with the previous year. The total Citywide decrease in net position was $48.8 million or 21.1% compared with the previous year. The City s decrease in net position is primarily attributable to implementation of GASB 68 offset by net income of enterprise fund s activities and the reduction in operating expenses of governmental fund s activities. Governmental Business-Type Activities Activities Total Current and other assets $ 45,660,569 $ 44,716,208 $ 37,474,628 $ 47,693,849 $ 83,135,197 $ 92,410,057 Capital assets 97,621, ,741, ,988, ,263, ,609, ,005,243 Total assets 143,282, ,457, ,462, ,957, ,744, ,415,300 Deferred outflow of resources 3,864, ,990 1,581, ,990 5,445,345 Current liabilities 7,264,026 6,292,444 12,913,988 12,087,629 20,178,014 18,380,073 Long-term liabilities 12,327,600 54,724, ,828, ,377, ,155, ,101,463 Total liabilities 19,591,626 61,016, ,742, ,465, ,333, ,481,536 Deferred Inflow of resources 6,819,246 2,767,441-9,586,687 Invested in capital assets, net of related debt 90,243,803 94,183,479 84,013,911 83,329, ,257, ,513,121 Restricted Low income housing 1,331,536 5,149,098 1,331,536 5,149,098 Capital projects 4,170,804 13,006, , ,485 4,911,468 13,767,063 Debt service 115, ,232 6,397,013 6,828,934 6,512,143 6,948,166 Other purposes 12,047, ,483 10,829,995 (1,033,853) 22,877,027 (515,370) Unrestricted 15,782,311 (31,490,703) 5,957,927 11,421,047 21,740,238 (20,069,656) Total net position $ 123,690,616 $ 81,486,167 $ 107,939,510 $ 101,306,255 $ 231,630,126 $ 182,792,422 Unrestricted net position represents the amount that may be used to meet the City s ongoing obligations to citizens and creditors. Due to the implementation of GASB 68 and the recording of net pension liabilities to the government wide financial statements, the City s unrestricted net position is ($20.1) million. While positive unrestricted net positions represent amounts that may be used to meet the City s ongoing obligations to citizens and creditors, the City s negative unrestricted net position is reduced by approximately $65 million of long term net pension liabilities or other reductions related to pension liabilities due to the implementation of GASB 68. Net pension liabilities, while they are obligations, will likely not be liquidated for several decades. 10
11 City of Lompoc Management s Discussion and Analysis Fiscal Year Ended June 30, 2015 At the end of June 30, 2015, the City is able to report positive balances in all categories of net position for the government as a whole except for unrestricted net position in governmental activities due to the implementation of GASB 68. The condensed summary of activities, which follows, shows total net position decreased by $48.8 million or 21% prior to the recognition of prior period adjustments due to implementation of GASB 68 compared with the previous year. Prior period adjustments reduced total net position by $63.7 million or 27.5% compared with the previous year. 11
12 City of Lompoc Management s Discussion and Analysis Fiscal Year Ended June 30, 2015 CHANGES IN CITY OF LOMPOC'S NET POSITION Governmental Business-Type Activities Activities Total Revenues: Program revenues: Charges for services $ 9,086,280 $ 9,345,451 $ 52,422,551 $ 56,611,458 $ 61,508,831 $ 65,956,909 Operating grants and contributions 2,843,102 2,652,691 4,867,513 5,466,163 7,710,615 8,118,854 Capital grants and contributions 897,085 1,350, ,364 1,258,830 1,180,449 2,609,803 General revenues: Property taxes 3,954,856 4,060,146 8,667 8,667 3,963,523 4,068,813 Sales taxes 6,288,896 6,607,276 6,288,896 6,607,276 Other taxes 8,187,474 8,093,416 29,067 29,591 8,216,541 8,123,007 Grants and contributions not restricted to specific programs 397, , , ,729 Unrestricted investment earnings 127, ,711 51, , , ,110 Other revenue 1,748,436 1,091,818 80,285 62,118 1,828,721 1,153,936 Total revenues 33,531,341 34,004,211 57,742,788 63,566,226 91,274,129 97,570,437 Expenses: Governmental activities: General government 6,448,238 5,660,682 6,448,238 5,660,682 Police protection 10,883,519 8,254,024 10,883,519 8,254,024 Fire protection 4,396,536 3,809,939 4,396,536 3,809,939 Engineering/streets 7,659,164 5,546,247 7,659,164 5,546,247 Building 483, , , ,983 Community Development 1,212,883 1,437,186 1,212,883 1,437,186 Parks and recreation 3,423,582 2,770,481 3,423,582 2,770,481 Nondepartmental 1,036,953 1,123,173 1,036,953 1,123,173 Interest on long-term debt 116, , , ,368 Business-type activities: Water 9,699,646 9,767,339 9,699,646 9,767,339 Electric 19,153,470 19,928,723 19,153,470 19,928,723 Wastewater 12,813,737 12,957,872 12,813,737 12,957,872 Solid Waste 6,502,845 6,640,369 6,502,845 6,640,369 Aquatic Center 732, , , ,121 Airport 580, , , ,760 Transit 3,023,682 2,933,664 3,023,682 2,933,664 Recreation 347, , , ,701 River Park 194, , , ,945 Lompoc Valley Community Center 173, , , ,959 Broadband 599, , , ,928 Total expenses 35,661,067 29,131,083 53,821,443 54,827,381 89,482,510 83,958,464 Increase (decrease) in net assets before transfers (2,129,726) 4,873,128 3,921,345 8,738,845 1,791,619 13,611,973 Transfers 1,685,959 (2,723,739) (1,685,959) 2,723, Special Item - 1,201,752-1,201,752 Increase (decrease) in net position (443,767) 3,351,141 2,235,386 11,462,584 1,791,619 14,813, Beginning net position 124,134, ,690, ,770, ,939, ,905, ,630,126 Prior year restatements - (45,555,590) (66,802) (18,095,839) (66,802) (63,651,429) Ending net position $ 123,690,616 $ 81,486,167 $ 107,939,510 $ 101,306,255 $ 231,630,126 $ 182,792,422 12
13 City of Lompoc Management s Discussion and Analysis Fiscal Year Ended June 30, 2015 As shown above, the City s revenues for fiscal year 2015 totaled approximately $97.6 million, with the majority of it (67.6%) generated from charges for services. Revenues increased approximately $6.3 million or 6.9% for the year as compared with the previous year. While overall revenues increased by $6.3 million, some individual revenue categories decreased from the previous year while most individual revenues categories increased from the previous year. Increases in revenues occurred in all categories except the following: gas taxes, State of California in-lieu, license and permits and other revenues. The combined total decrease for the four previously mentioned revenue sources is approximately $1.0 million while the largest revenue increase is charges for services of $4.4 million or 67.5% of the overall revenue increase. The single most significant factor of the charges for services increase was attributable to increase in charges for services in the water and wastewater enterprise funds associated with the implementation of rate increases in those funds. Expenses of the City s governmental activities decreased compared to the previous fiscal year. Total government activities expenses for the year ending June 30, 2015 were approximately $29.1 million, which was a decrease of $6.5 million or 18.3% compared with the previous year. The decrease is attributable to implementation of GASB 68 and the current year recognition of investment gains across all components of governmental activities.. Total business-type activities expenses for the year ending June 30, 2015 were approximately $54.8 million, which was an increase of $1.0 million or 1.9% compared with the previous year. While total business-type activities expenses increased $1.0 million or 1.9% compared with the previous year, increases occurred in the Water, Electric, Wastewater, Solid Waste, Airport, Recreation, Dick DeWees Community and Senior Center, and the Aquatic Center enterprises totaling $1.2 million compared with the previous year with Electric making up 63.4% of the total. Decreases occurred in the Transit, Broadband and Campground enterprises totaling $0.2 million compared with the previous year with Transit making up 41.4% of the total. Governmental Activities As summarized above, during the current fiscal year, the City s governmental activities net position decreased by $42.2 million or 34.1% to $81.5 million compared with the previous year. The net position decrease of $42.2 million includes a prior period restatement due to the implementation of GASB 68 of $45.6 million. Following are comparatives of revenues and expenditures for governmental activities with the prior year: Total revenues for the City s governmental activities were $34.0 million for the year ended June 30, Of this total, $18.8 million or 55.2% of total revenues was derived from taxes. Traditional services provided by a city such as public safety, parks, recreation, and public works are primarily funded from property, sales, transient occupancy, motor vehicle, and other local taxes. Approximately $9.3 million or 27.5% of total revenues was derived from charges for services, representing fees charged for various services, including planning, engineering, and recreation. The total revenues for governmental activities increased by $0.5 million or 1.4% compared with the previous year. Decreases in revenues occurred in the operating grants and contributions in the amount of $190,411, gas taxes in the amount of $244,582, State in-lieu taxes in the amount of $289, license and permits in the amount of $107,962, and other revenues in the amount of $656,618 compared with the previous year. Increases in revenues occurred in all other categories as follows: Charges for services increased $259,171, capital grants and contributions increased $453,888, all taxes except gas taxes in the amount of $566,353, and unrestricted investment earnings increased $173,770 all compared with the previous year. 13

 at $12.1 million, which represented 41.")

14 City of Lompoc Management s Discussion and Analysis Fiscal Year Ended June 30, 2015 Total expenses for governmental activities were $29.1 million for the year ended June 30, 2015, which is a $6.5 million or 18.3% decrease compared with the previous year. The largest component of total expenses was for public safety (police and fire) at $12.1 million, which represented 41.4% of the total governmental activities expenses. The next largest component of total expenses was for engineering/streets at $5.5 million, or 19.0%, of total expenses in the governmental activities. Following are graphical displays of governmental activities. The first shows revenues and expenses by functions and programs while the second shows revenues by source. 14

15 City of Lompoc Management s Discussion and Analysis Fiscal Year Ended June 30, 2015 Business-Type Activities During the current fiscal year, the City s business-type activities net position decreased by $6.6 million or 6.1% to $101.3 million compared with the previous year. The net position decrease of $6.6 million includes a prior period restatement due to the implementation of GASB 68 of $18.1 million. Following are comparatives of revenues and expenditures for business-type activities with the prior year: Total revenues for the City s business-type activities were $63.3 million for the year ended June 30, 2015, an increase of $5.8 million or 10.1% compared with the previous year. Of this total, $56.6 million (89.1% of total revenues) was derived from charges for services. As mentioned previously, business-type activities include enterprise fund operations such as Water, Wastewater, Electric, and Solid Waste funds, all of which recover their costs through user fees and charges. Other significant revenues are from operating grants and contributions of $5.5 million (8.6% of total revenues) and capital grants and contributions of $1.3 million (2.0% of total revenues). Total expenses for business-type activities were $54.8 million for the year ended June 30, 2015, an increase of $1.0 million or 1.9% compared with the previous year. The Electric utility is the largest individual category of business-type activities expenses, representing $19.9 million or 36.3% of the total business-type activities expenses. The Wastewater utility s expenses are $13.0 million or 23.6% of total business-type activities expenses while the Water and Solid Waste utilities combined account for $16.4 million or 29.9% of total business-type activities expense. Following are graphical displays of business-type activities. The first shows revenues and expenses by individual major fund and non-major funds in total while the second shows revenues by source for all business-type activities. Businesstype activities expenses include any interest component of debt service payment obligations; however, the principal component of debt service is excluded from expenses. 15
16 City of Lompoc Management s Discussion and Analysis Fiscal Year Ended June 30, 2015 FINANCIAL ANALYSIS OF THE CITY S FUNDS As noted earlier, the City uses fund accounting to ensure and demonstrate compliance with finance-related legal requirements. Governmental Funds The focus of the City s governmental funds is to provide information on near-term inflows, outflows, and balances of spendable resources. Such information is useful in assessing the City s financing requirements. In particular, unassigned fund balance may serve as a useful measure of a government s net resources available for discretionary use as they represent the portion of fund balance which has not yet been limited to use for a particular purpose by either an external party, the City itself, or a group or individual that has been delegated authority to assign resources for use for particular purposes by the City Council. With the implementation of GASB 54, the presentation of City financial statements has been consolidated to combine all governmental activity with characteristics similar to the General Fund with the General Fund and categorized as Other Governmental Funds. In addition to the traditional General Fund, other funds such as the family of Library Funds are now reported with the General Fund in the category of Other Governmental Funds. With the implementation of GASB 68, net pension liabilities are now recorded in the balance sheet of proprietary funds and in the government wide financial statements. However, as governmental funds are to provide information on nearterm inflows, outflows, and balances of spendable resources, GASB 68 accounting of net pension liabilities are not recognized at the governmental fund level of reporting. As of the end of the current fiscal year, the City s governmental funds reported combined ending fund balances of $29.5 million, an increase of $0.9 million or 3.2% compared with the previous year. Of the ending fund balance amounts, approximately $5.6 million or 18.9% constitutes unassigned fund balance, which is available for spending at the City s discretion. The remainder of the fund balance is either non-spendable form, committed, or assigned to indicate that it is 1) not in a spendable form of $4.5 million, 2) restricted for particular purposes of $18.8 million, or 3) committed for particular purposes of $0.6 million. General Fund The General Fund is the primary operating fund of the City. At the end of the current fiscal year, unassigned fund balance of the general fund was $5.7 million, while the total fund balance was approximately $6.3 million. With the implementation of GASB 54, the presentation of City financial statements has been consolidated to combine all governmental activity with characteristics similar to the General Fund with the General Fund. In addition to the traditional General Fund, other funds such as the Traffic Safety, Traffic Offender, State COPS, and Library operating funds are now reported with the General Fund. As a measure of the General Fund s liquidity, it may be useful to compare both unassigned fund balance and total fund balance to total General Fund expenditures. Unassigned fund balance at June 30, 2015 represents approximately 18.8% of total General Fund expenditures for the year ended June 30, 2015, while total fund balance represents approximately 20.6% of that same amount. Current year operations increased the fund balance of the City s General Fund by $0.4 million or 7.1% over the ending fund balance of the prior year. Key factors in this increase are as follows: Increase in revenues of $1 million or 3.9% primarily due to an increase in taxes of $617,165, revenue from other agencies of $279,321, charges for services of $494,211, operating transfers in less operating transfers out of $456,548. The remaining revenues remained relatively constant with license and permits revenues decreasing $107,962 and other revenues decreasing $341,
17 City of Lompoc Management s Discussion and Analysis Fiscal Year Ended June 30, 2015 Three expenditure categories experienced decreases from the previous year while the other categories experienced increases from the previous year. Overall net expenditures increased $1.6 million or 5.45% compared to the previous year. o o o Personnel services increased $0.7 million or 3.3% while maintenance and operations increased $0.9 million or 12.72% compared with the prior year. Capital outlay expenses declined by less than $0.1 million or 23.1% compared with the prior year. Expenditure category increases amounted to $1.8 or 5.5% compared to total expenditures in the previous year. Expenses increased in eleven areas; City Council increased $13,392 or 9.3%, Administration increased $23,338 or 4.7%, Finance and Treasury increased $300,339 or 12.4%, Human Resources increased 51,989 or 10.0%, Planning increased $61,022 or 10.2%, Non departmental increased $277,986 or 33.5%, public safety increased $379,118 or 2.6%, Parks increased $80,132 or 5.6%, Engineering and streets increased $387,774 or 12.4% and other expenses increased $209,397 or 23.1% compared to the previous year. Expenditure category decreases amounted to $212,387 or.7% compared to total expenditures in the previous year. Expenses decreased in five areas; City attorney decreased $89,546 or 15.7%, City Clerk decreased $21,210 or 12.1%, Building and building inspection $3,706 or 1.7%, Information Technologies decreased $61,076 or 5.5%, Recreation decreased $8,388 or 1.7% and Library expenses decreased $24,461 or 2.5% compared to the previous year. Proprietary Funds The information provided relating to the City s proprietary funds provide the same type of information found in the government-wide financial statements, but in more detail. Unrestricted net position of the enterprise funds at the end of the year amounted to $7.8 million, an increase of $1.8 million or 30.2% compared with the previous year. The unrestricted net position in the Electric Utility proprietary fund was $12,563,834 in the prior year. If the net position restricted for other purposes in the Electric Utility proprietary fund had been classified as unrestricted in the prior year as it is in the current year, then the unrestricted net position of the enterprise funds at the end of the year would remain at $7.8 million but would be a decrease of $6.6 million or 45.9% compared with the previous year. The primary cause of this decrease is the recognition of prior period adjustments in all the proprietary funds due to the implementation of GASB 68. The Water Fund net position decreased by $3.1 million or 18.7% compared with the previous year prior to restatement of the prior net position. $4.7 million of the decrease is attributable to the implementation of GASB 68 while net operating revenue increased net position by $1.5 million or 9.3% compared to the unadjusted net position in the prior year. Operating revenues increased $0.9 million or 8.3% while operating expenses increased $0.1 million or 1.2% compared to the previous year. Operating revenues exceeded operating expenses by $2.0 million, while non-operating activities decreased net position by $0.5 million. The second of five rate adjustments was implemented in July 2014 in compliance with Proposition 218. The set of approved rate adjustments were implemented to accomplish several goals including: to improve revenue levels to help reestablish revenues at levels sufficient to cover expenditures and debt service; to establish reserves equal to 90 days of operation expenses based on industry standards; to insure continued compliance with debt coverage covenants; and to implement a planned replacement program for the Fund s infrastructure to insure the safe and reliable delivery of service to ratepayers. If the set of approved rate adjustments scheduled to be phased in over five years are implemented and operational results are consistent with the assumptions underlying the rate adjustments the Water Fund should achieve all the goals identified by June 30, 2018, the end of the term of the rate increase schedule. As of July 2015, three of the five scheduled adjustments have been implemented. The implementation of the third adjustment in July 2015 resulted in a net 7.5% increase due to the combination of the 15% approved increase less a suspension of 50% of the approved increase. Implementation of GASB 68 reduced unrestricted net reserves of the Water Fund and Utility by $4.7 million which will likely delay the achievement of two of the goals of the rate adjustments; the establishment of unrestricted reserves equal to 90 days of operation expenses and the implementation of a planned replacement program for the Fund s infrastructure. 17
18 City of Lompoc Management s Discussion and Analysis Fiscal Year Ended June 30, 2015 The Electric Fund net position decreased by $1.5 million or 3.4% compared with the previous year prior to restatement of the prior net position. $4.8 million of the decrease is attributable to the implementation of GASB 68 while net operating revenue increased net position by $3.2 million or 7.1%. The City secures wholesale electricity through a joint powers agency, the Northern California Power Agency (NCPA). The City, a founding member of NCPA when it was established in 1968, is able to secure purchased power supplies at bulk power rates for customers within the City through NCPA. Without the resources of NCPA, a small electric utility like the City would be at a significant disadvantage in today s wholesale power market. Operating revenues increased by $1.5 million or 6.6% compared with the prior year while operating expenditures increased by $0.8 million or 4.3% compared with the previous year. Overall, operating revenues exceeded expenses by $4.8 million, an increase of $0.7 million or 17.7% compared with the previous year. The Electric Fund has been operating with temporarily reduced residential and commercial rates since August The temporary rates reflect a reduction of 3% from the approved rates for residential and commercial class customers. The Wastewater Fund s net position decreased by $3.2 million or 9.0% compared with the previous year prior to restatement of the prior net position. $3.7 million of the decrease is attributable to the implementation of GASB 68 while net operating revenue increased net position by $0.5 million or 1.4% compared to the unadjusted net position in the prior year. Operating revenues increased $1.3 million or 10.7% while operating expenses increased $0.2 million or 2.1% compared to the previous year. Operating revenues exceeded operating expenses by $2.5 million, while nonoperating activities decreased net position by $2.0 million. A rate adjustment was implemented in July 2014 in compliance with Proposition 218. The set of approved rate adjustments were implemented to accomplish several goals including: to improve revenue levels to help reestablish revenues at levels sufficient to cover expenditures and debt service; to establish reserves equal to 90 days of operation expenses based on industry standards; to insure continued compliance with debt coverage covenants; and to implement a planned replacement program for the Fund s infrastructure to insure the safe and reliable delivery of service to ratepayers. If the set of approved rate adjustments scheduled to be phased in over five years are implemented and operational results are consistent with the assumptions underlying the rate adjustments the Wastewater Fund should achieve all the goals identified by June 30, 2018, the end of the term of the rate increase schedule except the goal to implement a planned replacement program for the Fund s infrastructure.. As of July 2015, three of the five scheduled adjustments have been implemented. The July 2015 rate increase of 10.5% was implemented as approved. Implementation of GASB 68 reduced unrestricted net reserves of the Wastewater Fund and Utility by $3.7 million which will likely delay the achievement of two of the goals of the rate adjustments; the establishment of unrestricted reserves equal to 90 days of operation expenses and the implementation of a planned replacement program for the Fund s infrastructure. The Solid Waste Fund s net position decreased by $2.6 million or 460.1% compared with the previous year prior to restatement of the prior net position. $3.8 million of the decrease is attributable to the implementation of GASB 68 while net operating revenue increased net position by $1.2 million or 220.7%. Operating revenues increased $0.6 million or 7.5% while operating expenses increased $0.2 million or2.4% compared to the previous year. Operating revenues exceeded operating expenses by $1.3 million, while non-operating activities decreased net position by less than $0.1 million. A rate hearing was held and a set of five annual rate adjustments were adopted in April 2015 in compliance with Proposition 218. The set of approved rate adjustments were implemented to accomplish several goals including: to establish reserves equal to 90 days of operation expenses based on industry standards, to fund the utility s share of costs for the installation of a gas collection and monitoring system as required by the State of California at the utility owned landfill which will cost approximately $1.4 to $2.4 million, meet the requirements of the loan with CalRecycle obtained to fund the gas collection and monitoring system and to fund a planned replacement program for the utility. If the set of approved rate adjustments scheduled to be phased in over five years are implemented and operational results are consistent with the assumptions underlying the rate adjustments, the Solid Waste Fund should achieve all the identified goals by June 30, 2019, the end of the term of the rate increases except for the goal to achieve unrestricted reserves equal to 90 days of operation expenses. As of July 2015, the second of five scheduled adjustments have been implemented. The July 2015 rate increase of 3.6% was implemented as approved. Implementation of GASB 68 reduced unrestricted net reserves of the Solid Waste Fund and Utility by $3.8 million which will likely delay the achievement of two of the goals of the rate adjustments; the establishment of unrestricted reserves equal to 90 days of operation expenses and the implementation of a planned replacement program for the Fund s capital and infrastructure needs. 18
19 City of Lompoc Management s Discussion and Analysis Fiscal Year Ended June 30, 2015 Total net position for all business-type activities decreased by $6.6 million or 6.1% compared with the previous year prior to restatement of the prior net position due to implementation of GASB 68. Implementation of GASB 68 resulted in a prior period adjustment for all business-type activities of $18,095,839. Net operating revenues increased the net position of all business-type activities by $11,462,584. The main factors contributing to the net operating increases are increases in operating revenues over operating expenses in the Water, Electric, Wastewater, and Solid Waste funds with cumulative increases of $2.9 million. General Fund Budgetary Highlights Final expenditures for the General Fund at year-end were $4.7 million less than the final budget. This positive variance over the final budget is primarily due to the following: Vacant positions held for salary saving and from vacancies due to turnover. Newly hired employees have a lower pension cost due to pension reform than employees hired before implementation of the City s second tier benefit plans with CalPERS especially for CalPERS Safety members of the Police and Fire Departments. The final expenditure budget exceeds the original budget by $5.4 million. The primary reason for this difference is bargaining changes including the elimination of furloughs at the beginning of the budget and salary adjustments negotiated during both and for Actual revenues were more than the original budget by $1.0 million and more than the final budget by $0.5 million. Taxes exceeded the original and final budget by $0.7 million while revenue from other agencies exceeded the original budget by $0.5 million and the final budget by $0.3 million. Actual revenue was less than the final budget for other revenues by $0.7 million but exceeded the original budget. CAPITAL ASSET AND DEBT ADMINISTRATION Capital Assets As of the June 30, 2015 year-end, the City had $279 million invested in a broad range of capital assets, net of accumulated depreciation. This amount represents a net decrease (including additions, deductions and transfers) of $2.6 million, or 0.9% over the previous year. Capital Assets at Year End (Net of Depreciation) Governmental Business-Type Activities Activities Total Land and land rights $ 26,959,352 $ 28,161,104 $ 7,146,096 $ 7,146,096 $ 34,105,448 $ 35,307,200 Buildings and improvements 21,626,769 21,493, ,407, ,215, ,033, ,709,148 Machinery and equipment 7,126,871 8,490,805 4,332,455 1,340,491 11,459,326 9,831,296 Construction in process 4,421,281 5,437,193 3,102,369 3,561,255 7,523,650 8,998,448 Infrastructure 37,487,400 37,159,151 37,487,400 37,159,151 Totals $ 97,621,673 $ 100,741,586 $ 183,988,092 $ 178,263,657 $ 281,609,765 $ 279,005,243 19
20 City of Lompoc Management s Discussion and Analysis Fiscal Year Ended June 30, 2015 This year s major capital asset additions included the following: Capital Assets for governmental activities as June 30, 2015 totaled $100.7 million (net of accumulated depreciation). Major capital asset additions during the fiscal year included the following: o Street renovation projects $1,556,738 o Vehicle acquisitions $659,578 o Federal and State funded Safe Routes to School sidewalk projects $580,085 o Locally funded sidewalk projects $297,606 o Security and ventilation improvements for City facilities $64,445 o Communications enhancements $56,738 o Library electric improvements $93,536 o Public TV and radio station improvements $52,239 o Completion of Purchasing system upgrades $23,963 o Recreation facilities improvements $116,214 o Library electrical and shelving improvements $116,276 Completion of the replacement of the Citywide PBX phone system $56,738 Capital Assets for business-type activities as June 30, 2015 totaled $178.3 million (net of accumulated depreciation). This was a $5.7 million decrease from the prior year which, after $8.8 million in deprecation, resulted in additions totaling $3.8 million (net of deductions). Major additions include the following: o Renovation to the Water distribution system $151,197 o Capital replacement of Water revenue meters $150,292 o Renovations to the Wastewater distribution and treatment systems $217,454 o Transit system vehicle acquisitions $166,426 o Solid Waste Division s Landfill improvements $52,061 o Electric system equipment enhancements $193,393 o Electric system meter replacement and meter reading project $157,749 o Electric system 4kv to 12kv conversion project improvements $2,136,452 o Electric system LED street light conversion project $1,059,363 o Electric system pole replacement project $166,807 o Airport apron improvements $185,217 o Installation of Data and Communication lines and equipment $85,024 For more detailed information on capital assets, see Note 5 in the Basic Financial Statements. Long-Term Debt The issuance of the Basic Financial Statements for the Fiscal Year Ended June 30, 2015 includes the implementation of GASB 68. GASB 68 provides for the recognition of net pension liabilities in the government wide financial statements along with proprietary fund financial statements beginning with these Basic Financial Statements. In prior Basic Financial Statements, pension liabilities were reported in accordance with GASB 27 in the notes to the financial statements. Because of the changes implemented with GASB 68, pension liabilities reported prior to GASB 68 cannot be comparable with pension liabilities reported under GASB 68. The City s overall net pension liability reported at June 30, 2015 is $55,518,748 with $39,863,222 reported in governmental activities, $15,554,205 reported in business-type activities and $101,321 in fiduciary funds. The $55,518,748 net pension liability is the net of reportable pension assets of $184,044,102 resulting in a funding ratio of 76.8% at June 30, 2015 for all City plans combined. While net pension liabilities are long term in nature, the long term debt note does not include a discussion related to pension costs as GASB 68 requires a separate note entirely devoted to pension debt. This note is included with the rest of the notes to the Basic Financial Statements. 20
21 City of Lompoc Management s Discussion and Analysis Fiscal Year Ended June 30, 2015 In addition to changes due to GASB 68, the City consolidated City-wide compensated absences and other accrued wages and benefits in the Employee Benefits and Insurance Internal Service Fund at June 30, This consolidation reduced Business Activity compensated absences in the long term debt summary and increased the Governmental Activities compensated absences; however, overall compensated absence debt (short term and long term) changed by $1.4 million or 67.4% between June 30, 2014 and June 30, 2015 due entirely to the cumulative changes in employee s earned benefits during the fiscal year. At the end of the current fiscal year, the City had long-term debt outstanding of $117.8 million. Of this amount, $7.5 million represents long-term leases outstanding backed by the equipment purchased, $34.6 million represents assessment district and enterprise fund bonds secured solely by specified revenue sources, $8,301 represents long-term notes payable, and $59.8 million represents long-term loans payable. Outstanding debt associated with the upgrade of the Wastewater Plant accounts for approximately $77.8 million of the $117.8 million, or approximately 66%, of total outstanding long-term debt of the City. Outstanding Debt at Year End Governmental Business-Type Activities Activities Total Compensated absences $ 2,045,073 $ 3,475,306 $ 31,501 $ - 2,076,574 $ 3,475,306 Accrued liabilities 6,584,002 6,798,001 6,584,002 6,798,001 Revenue bonds 2,200,000 2,135,000 33,486,840 32,287,009 35,686,840 34,422,009 Loans payable ,248,317 59,798,789 63,248,317 59,798,789 Long term capital leases 5,177,870 4,423,107 3,443,165 3,031,532 8,621,035 7,454,639 Landfill closure and postclosure costs 5,681,249 5,841,167 5,681,249 5,841,167 Notes payable 14,849 8,301 14,849 8,301 Totals $ 16,006,945 $ 16,831,414 $ 105,905,921 $ 100,966,798 $ 121,912,866 $ 117,798,212 Total debt decreased by $4.1 million during the current fiscal year. The key factors in this decrease were: Decrease of $3.4 million in the principal balance of the State Revolving Loan due to payments. Decrease of $1.3 million due to payments on principal on bonds. Decrease of $1.2 million in leases payable due to payments. Increase of $1.4 million in compensated absences due to the consolidation of agency-wide accruals. Increase of $0.4 million of claims and landfill closure and post-closure liabilities. The City currently has no general obligation debt outstanding. For more detailed information on long-term debt, see Note 6 in the Basic Financial Statements. Significant Accomplishments for Fiscal Year Ending June 30, 2015 The City settled with two of the three employee bargaining groups resulting in approved MOUs with terms through the end of June The third bargaining group agreed to an MOU soon after the end of the year with its term also expiring at the end of June The second of five approved rate adjustments for the Water and Wastewater utilities were put into place on July 1, 2014 in accordance with Proposition 218. The first of five approved rate adjustments for the Solid Waste utilities was implemented on July 1, 2014 in accordance with Proposition
22 City of Lompoc Management s Discussion and Analysis Fiscal Year Ended June 30, 2015 The City s Successor Agency to the (former) Lompoc Redevelopment Agency received approval of the Long Range Property Management Plan from the Department of Finance on February 27, An agency wide master fee study was initiated to validate existing fees and to implement fees for services provided in accordance with Propositions 4 and 26. An agency wide enterprise cost study was initiated to validate cost reimbursement by the City s utilities in accordance with Proposition 26. The Fire Department acquired a Wildland Brush Engine used for City protection from wildland fires and to assist regionally and statewide when requested as well as a Rescue Squad capable of responding to emergency calls in the community. The Lompoc Airport initiated a major apron repaving project using FAA grant funding. A partnership with the Lompoc Valley Parks, Pool and Recreation Foundation led to the completion of a Bike Skills Park at River Bend Park by volunteers of the Foundation and the subsequent donation of the completed facility to the City. The estimated value of the project by the Foundation is $569,000. The facility was completed in April Economic Factors and Next Year s Budgets and Rates The trend in unemployment rates for Santa Barbara County and the City of Lompoc has been positive in recent years. Following are the unemployment rates for the past several years as of June 30 (as reported by the US Department of Labor s Bureau of Labor Statistics): Santa Barbara City of Year Ended County Lompoc 6/30/ % 6.0% 6/30/ % 7.3% 6/30/ % 9.2% 6/30/ % 10.8% 6/30/ % 12.0% 6/30/ % 11.9% 6/30/ % 14.2% 15.0% 10.0% 5.0% 0.0% 1/1/2009 1/1/2010 1/1/2011 1/1/2012 1/1/2013 1/1/2014 1/1/2015 The City s Bradley-Burns sales tax receipts increased 5.1% over the previous year with growth of 5.1% budgeted for The State s budget included the issuance of Economic Recovery Bonds which used a portion of the City s Bradley-Burns 1% sales tax rate to finance the bonds. This mechanism was later called the Triple Flip. The bonds are scheduled to be fully repaid by the State in FY This repayment will restore the City s full 1% Bradley-Burns sales tax rate. The fiscal effect is estimated to increase sales tax receipts in by approximately $287,000. This amount is in addition to the 5.1% increase in sales tax revenues budgeted for Transient Occupancy Tax receipts increased 6.6% over the previous year and are budgeted to increase 27.8% in over the revenues budgeted for Secured property tax revenue increased 2.7%. Secured property taxes are anticipated to increase 4.1% in over according to the Santa Barbara County Auditor Controller. A conservative approach was taken in implementing the biannual budget as the local economy is following a similar pattern established overall for the nation and state. 22
23 City of Lompoc Management s Discussion and Analysis Fiscal Year Ended June 30, 2015 These indicators were taken into account when preparing the City s biannual budget for fiscal years Total General Fund, fund balance increased during the fiscal year ending June 30, 2015 by $380,919 or 6.5% to $6,256,162. Unrestricted General Fund, fund balance at June 30, 2015 is $5,715,418 or 18.8% of expenditures and 16.7% of appropriations. Unrestricted fund balance is $903,473 greater at June 30, 2015 than at June 30, 2013, the beginning of the most recent biennial budget cycle. Unrestricted fund balance meets the City s Fund Balance Policy level of 16.7% using either actual expenditures of or budgeted appropriations of For reporting purposes in compliance with GASB Pronouncement 54, the City has incorporated certain parking funds with fund balances of $74,848, the payroll clearing account with a fund balance of $3,000 and library funds with fund balances of $426,764 into the General Fund. The Economic Uncertainty Fund with a fund balance of $2 million at June 30, 2014 was combined with the General Fund for reporting and budgeting purposes at June 30, For the budget the $2,000,000 balance and investment earnings are a component of the General Fund. The City s adopted General Fund biennial budget for includes General Fund expenditures of $67.5 million, an increase of 19.9% over the previously adopted 2-year budget. The , and budgets incorporated budget reduction mechanisms in response to the Great Recession. While the budget is 19.7% greater than the budget, it represents a 2.5% annual increase over the budget cycle. During the adopted budget 9 additional public safety positions were funded with Federal hiring grant awards. Funding for 7 of the 9 positions expired during the cycle while 6 of the 9 positions were retained in the budget. Because of the need to provide for normal contingencies during the coming fiscal years, the budget provides for a General Fund unrestricted fund balance (reserves) at June 30, 2015, of $5.7 million which includes $2 million unrestricted reserve held in Economic Uncertainty restricted cash that is now incorporated into the general fund for financial reporting purposes. The State of California has caused and continues to cause significant uncertainty in the government sector. This has been especially true for California Redevelopment Agencies, On December 29, 2011, the California Supreme Court issued its opinion in the case of California Redevelopment Association, eta/. v. Ana Matosantos, etc., eta., Case No. S194861, and upheld the validity of Assembly Bill X126 ("AB 26") and invalidated Assembly Bill X127 ("AB 27"). The result of this decision is that all redevelopment agencies have been dissolved as of February 1, The City is now the Successor Agency of the former Lompoc Redevelopment Agency (RDA) and is responsible for winding down the financial activity of the former RDA. The Successor Agency was required to submit and implement a long range property management plan (LRPMP) for non-housing property held by the former RDA. The LRPMP originally was approved by the Successor Agency Oversight and submitted to the Department of Finance (DOF) on September 26, The original submission to DOF was returned for modification and on February 27, 2015, DOF approved the resubmitted LRPMP. The deadline for obtaining approval of the LRPMP by the (DOF) is December 31, The State of California continues the winding down of successor agencies with the annual consolidation of the enforceable obligation filing requirement. Required Obligation Payment Schedules (ROPS) had been required to be submitted semi-annually since 2012 but with the reporting cycle due February 1, 2016, the ROPS is due once for the period. The Successor Agency has outstanding debt requiring debt service payments until September There are still many economic uncertainties facing local governments in the coming years, which could impact the City s overall revenues, however sales tax revenue trends appear to provide for annual growth of between 3% and 5% for the next several years. Property taxes are anticipated to grow at no more than two percent as limited by Proposition 13 passed in Transient Occupancy Tax appears ready to have sustained growth of 5% to 8% annually due to the recent implementation of the Lompoc Tourism Improvement District and the construction of a new hotel which began in November The challenges facing the City are not unique as all cities across California face the same issues as well many cities do across the nation. 23
24 City of Lompoc Management s Discussion and Analysis Fiscal Year Ended June 30, 2015 Expenditure increases continue to challenge local governments. Rising costs related to health care and retirement contributions continue to be significant factors facing cities. On September 12, 2012 the Governor signed pension reform AB 340, which the California State Legislature approved on August 31, Within AB 340 is the California Public Employees Pension Reform Act of 2013 (PEPRA), which affects most California retirement systems, including CalPERS, effective January 1, PEPRA generally restricts current pension provisions while increasing flexibility for employee/employer cost sharing. It includes one new retirement formula for Miscellaneous members and three new retirement formulas for Safety members. While PEPRA will have no significant immediate impact to pension costs, the law is designed to reduce pension costs of all public employers over time as new employees enter the PEPRA plans. New employees hired after December 31, 2012 will be enrolled in a plan with substantially lower benefits with the new employees required to pay at least 50% of the annual normal pension costs. The pension contribution rates for existing employees are expected to rise as the legislation, beginning January 1, 2013 allows employers to require that employees contribute half of the total normal cost capped at 8% of salary for miscellaneous members and 12% of salary for safety members by Prior to the implementation of PEPRA, the City successfully negotiated new pension plans for Miscellaneous and Safety members in New hires after implementation are eligible for the CalPERS 2.0% at 60 plan if a Miscellaneous member and the 3% at 55 plan if a Safety member. With implementation of PEPRA, if a newly hired employee is determined to be a classic member, actively employed by a CalPERS agency within 6 months of hiring, they are enrolled in the City s second tier plans (either 2.0% at 60 or 3% at 55 depending on the employee s membership Miscellaneous or Safety) even if hired after December 31, 2012, the PEPRA implementation date. At June 30, 2015, the City employed 64 members in either the 2.0% at 60 or the 2% at 62 Miscellaneous plans and 26 members in either the 3% at 55 or 2.7% at 55 Safety plans. In addition to PEPRA, as a member of the CalPERS system, the City s retirement plans will be subject to revised amortization policies adopted by the CalPERS board to be effective with the employer contribution rates for the fiscal year. The revised smoothing policy will pay for all gains and losses over a fixed 30 year period with a five year phase in period and is anticipated to allow for the elimination of unfunded liabilities in the pension system in 30 years. This new actuarial method will negatively impact member agencies as contributions are anticipated to grow substantially over the five year phase in period between and The CalPERS annual valuation report issued in October 2014 for the fiscal year ending June 30, 2013 project the City s miscellaneous plan s contributions to increase from % (of reportable salary) during the fiscal year to a projected 29.1% during the fiscal year, the final year of the phase in of the amortization policy change. The City s closed safety plan (3% at 50) is pooled with other like plans throughout the state. Pooled plans have significant changes to contribution formulas beginning in the fiscal year resulting in contributions from a combination of a dollar amount and a percentage of salary (contributions had been based on a percentage of salary only prior to the contribution year). The change makes comparisons to contribution formulas prior to the year less than straightforward. However, the fixed dollar contribution amount is $1,058,160 in and is projected to increase to $1,710,377 in while the contribution based on a percentage of salary is % in and is projected to be 20.3% for the remainder of the periods from to The primary reason for the change from a percentage of salary to a combination formula is the implementation of PEPRA. Over time, the City s primary safety plan will lose members from attrition while new safety members will be hired into either the City s classic plan (3% at 55) or the PEPRA plan (2.7% at 57). Without modifications, the City s original closed plan (3% at 50) will lose active members while the obligation to existing members will continue. CalPERS mitigated this eventuality by consolidating all pooled Safety plans into a single pool (and all pooled Miscellaneous plans into a separate single pool) with the valuations published as of June 30, Additional information regarding the City s plans can be obtained from CalPERS at 400 P Street, Sacramento, California Management is aware of the economic uncertainties along with the Federal and State changes in policies and is prepared to recommend the necessary measures to mitigate their impact on services. Sound budget policies have allowed the City of Lompoc to weather lingering economic uncertainties in fiscal year 2015 without interrupting essential services. Although the economy and the State budget have impacted City revenues, these impacts have been mitigated with 24
25 City of Lompoc Management s Discussion and Analysis Fiscal Year Ended June 30, 2015 proper fiscal management. In addition, by building reserves during the economic good times of the 1990 s, the City is positioned well to meet economic challenges in the future. Beginning with the adoption of the budget, the City implemented a 10 year economic forecast as it relates to the City s General Fund. This forecast provides for the modeling of the CalPERS phased-in implementation of its new amortization formula as well as other factors. The 10 year forecast can be found on pages of the budget available online at In the Electric Fund, the City implemented a temporary reduction in consumer rates in August The temporary reduction was reviewed as part of the budget process and was extended for the budget cycle. The reduction from August 2012 did not affect the Electric Fund s operational results for the period as wholesale energy delivery costs did not increase as fast and as much as had been projected during the budget preparation process. The City had increased rates by 6% increase in the fiscal year and had a 3% increase scheduled for the fiscal year, however the City has deferred the 3% rate increase and reduced consumer rates an additional 3% in August The existing rate schedule, including the 3% rate increases proposed for July 1, 2013 are still effective and can be implemented in the event wholesale power costs, energy delivery costs, or other operational costs increase such that the utility would need the additional revenue to maintain the required operating reserve as outlined in the utility s reserve policy. The City held public hearings in compliance with Proposition 218 on August 6, 2013 for the Water or Wastewater Utilities and the City Council authorized up to 5 years of increases for both funds with the initial increase effective 30 days following the hearing. The public hearings were the result of a rate study process initiated in December 2011 authorized as part of the budget. The approved rate adjustments are anticipated to improve revenue levels to help reestablish revenues at levels sufficient to cover expenditures and debt service and to establish reserves equal to three months (90 days) of operation expenses based on industry standards and to insure continued compliance with debt coverage covenants. The later adjustments may allow the implementation of a funded replacement program for both utilities such that replacement of critical infrastructure will have a funding source when needed. The rate adjustment is scheduled to be phased in over five years achieving the reserve level goal by the fourth or fifth year (depending on future operation results) and may provide for the funding of the replacement program of the Water Utility by the end of the fifth year of the proposed adjustments and by the tenth year for the Wastewater Utility. The Water Utility experienced an increase in user fees and charges for services of $957,250 in over or an increase of 9.4%. The Wastewater Utility experienced an increase in user fees and charges for services of $1,310,722 in over or an increase of 14.7%. The rate study's proposed rate increases of 15% and 10.5% respectively for the second year of the five year implementation of rates. The Wastewater Utility s overall operational results include revenue changes from regional partners, other agencies. Partners include Vandenberg Village Community Services District and Vandenberg Air Force Base. Partner revenues are not subject to the utility rate study but rather are based on long term agreements with each partner paying for their share of treatment plant costs (operational, capital and debt service). The five year implementation plans of both the Water and Wastewater Utility s rates include annual reviews of results prior to implementation of the following years increase. On May 19, 2015, the City Council suspended 50% of the approved 15% rate increase (7.5%) effective July 1, 2015 for the Water Utility. The Wastewater Utility rate adjustment effective July 1, 2015 was approved at the 10.5% rate as originally approved. The July 1, 2015 adjustment is the third of five adjustments provided for in the approval by the City Council on August 6, Successive year increases will continue to be reviewed prior to implementation with the rates to be considered in May The Solid Waste Fund also conducted a rate review study during 2013 and a public hearing on the proposed rates was held in compliance with Proposition 218 on June 3, The rates were approved over five years (the maximum allowed under Proposition 218) and implemented 30 days after adoption. The Solid Waste Utility experienced an increase in user fees and charges for services of $561,045 in over or an increase of 3.9%. The rate study proposed a rate increase of 3.6% for the initial year of the five year implementation of rates. The rate adjustments will be required to pay for the Utility s cost share of the installation of a required landfill gas collection and control system 25
26 City of Lompoc Management s Discussion and Analysis Fiscal Year Ended June 30, 2015 (estimated to cost $1.4 million in 2012). The estimated cost of 2012 was arrived at prior to review of system plans and designs by the Santa Barbara Air Pollution Control Board, the delegated regulatory authority over the project, which has made extensive modifications to the design requirements. To minimize ratepayer cost increases due to this mandate, subsequent to year-end the Solid Waste Utility obtained a $1,000,000 loan amortized over 10 years from the State of California s CalRecycle program. The loan was approved with a fixed annual rate of 0.249% and is available to pay for project costs including design and installation of the gas collection system. The Solid Waste Utility is responsible for design and installation costs above $1,000,000. The approval of the rate structure for the Solid Waste Utility also includes an annual review provision. The rate adjustment for was affirmed at the approved amount of 3.6% on May 19, The rate adjustment will be reviewed in May Requests for information This financial report is designed to provide a general overview of the City s finances for all those with an interest in the government s finances. Questions concerning any of the information provided in this report or requests for additional financial information should be addressed to the City of Lompoc s Finance Division at 100 Civic Center Plaza, Lompoc, CA
27 Statement of Net Position June 30, 2015 Governmental Business Type Activities Activities Total Assets Cash and investments $ 39,147,501 $ 20,445,345 $ 59,592,846 Cash with fiscal agents 1,299,758 11,420,316 12,720,074 Restricted cash with fiscal agent 647, ,236 Accounts receivable 2,057,226 8,839,628 10,896,854 Interest receivable 50,626 30,054 80,680 Prepaid expenses 23, , ,520 Due from other funds (4,142,528) 4,142,528 Inventories 388,880 1,829,398 2,218,278 Loans receivable 4,448,283 4,448,283 Land held for resale 200, ,000 Other post employment benefits (OPEB) asset 1,243,286 1,243,286 Land 28,161,104 7,146,096 35,307,200 Construction in progress 5,437,193 3,561,255 8,998,448 Depreciable capital assets, net of accumulated depreciation 67,143, ,556, ,699,595 Total assets 145,457, ,957, ,415,300 Deferred Outflow of Resources Deferred pensions 3,864,143 1,389,586 5,253,729 Unamortized loss on refundings 191, ,616 Total deferred outflows 3,864,143 1,581,202 5,445,345 The notes to the financial statements are an integral part of these financial statements. 27
28 Statement of Net Position June 30, 2015 Page 2 Liabilities Accounts payable and accrued liabilities $ 2,696,896 $ 1,831,132 $ 4,528,028 Unearned revenue 331,385 2,611,375 2,942,760 Interest payable 53,186 1,384,542 1,437,728 Deposits and retentions payable 1,240,422 1,116,960 2,357,382 Long term liabilities: Due within one year 1,970,556 5,143,620 7,114,176 Due after one year 14,860,857 95,823, ,684,035 Net pension liability 39,863,222 15,554,205 55,417,427 Total liabilities 61,016, ,465, ,481,536 Deferred Inflows of Resources Deferred pensions 6,819,246 2,767,441 9,586,687 Total deferred outflows 6,819,246 2,767,441 9,586,687 Net Position Net investment in capital assets 94,183,479 83,329, ,513,121 Restricted: Low income housing 5,149,098 5,149,098 Capital projects 13,006, ,485 13,767,063 Debt service 119,232 6,828,934 6,948,166 Other purposes 518,483 2,632,766 3,151,249 Unrestricted (31,490,703) 7,754,428 (23,736,275) Total net position $ 81,486,167 $ 101,306,255 $ 182,792,422 The notes to the financial statements are an integral part of these financial statements. 28
29 Statement of Activities Year Ended June 30, 2015 Program Revenues Operating Capital Charges for Grants and Grants and Functions/Programs Expenses Services Contributions Contributions Governmental activities: General government $ 5,660,682 $ 7,286,428 $ 598,627 $ Police protection 8,254, , ,424 Fire protection 3,809,939 84, ,325 Engineering/streets 5,546, , ,626 Building 405, ,332 Community development 1,437, , ,715 Parks and recreation 2,770, , , ,347 Nondepartmental 1,122,384 Health and welfare ,630 Interest on long term debt 123,368 Total governmental activities 29,131,083 9,345,451 2,652,691 1,350,973 Business type activities Water 9,767,339 11,125,356 18, ,954 Electric 19,928,723 23,938, , ,453 Wastewater 12,957,872 10,273,518 3,245,948 Solid Waste 6,640,369 7,855,754 12,143 Other 5,533,078 3,418,623 1,488, ,423 Total business type activities 54,827,381 56,611,458 5,466,163 1,258,830 The notes to the financial statements are an integral part of these financial statements. 29
30 Net Revenues (Expenses) and Changes in Net Position Total Total Governmental Business Type Activities Activities Total $ 2,224,373 $ $ 2,224,373 (7,454,920) (7,454,920) (3,285,654) (3,285,654) (4,568,282) (4,568,282) 39,349 39,349 (742,229) (742,229) (1,052,694) (1,052,694) (1,122,384) (1,122,384) 303, ,841 (123,368) (123,368) (15,781,968) (15,781,968) 1,553,664 1,553,664 4,942,145 4,942, , ,594 1,227,528 1,227, , ,139 8,509,070 8,509,070 30
31 Statement of Activities Year Ended June 30, 2015 Page 2 Program Revenues Operating Capital Charges for Grants and Grants and Functions/Programs Expenses Services Contributions Contributions General revenues: Sales taxes $ $ $ $ Property taxes Transient occupancy tax (TOT) Vehicle license fees Gas tax Business tax Franchise fees State of California in lieu Property transfer tax License and permits Interest income Other revenues Transfers Total general and business type revenues Special item Change in net position Net position beginning of year Prior year restatements Net position beginning of year, restated Net position end of year The notes to the financial statements are an integral part of these financial statements. 31
32 Net Revenues (Expenses) and Changes in Net Position Total Total Governmental Business Type Activities Activities Total $ 6,607,276 $ $ 6,607,276 4,060,146 8,667 4,068,813 1,728,133 1,728,133 3,047,753 3,047,753 2,595,313 29,591 2,624, , , , ,729 8,057 8,057 89,730 89, , , , , ,110 1,091,818 62,118 1,153,936 (2,723,739) 2,723,739 17,931,357 2,953,514 20,884,871 1,201,752 1,201,752 3,351,141 11,462,584 14,813, ,690, ,939, ,630,126 (45,555,590) (18,095,839) (63,651,429) 78,135,026 89,843, ,978,697 $ 81,486,167 $ 101,306,255 $ 182,792,422 32
33 Balance Sheet June 30, 2015 Other Total Governmental Governmental General Funds Funds Assets Cash and investments $ 6,452,593 $ 19,201,347 $ 25,653,940 Accounts receivable, net 1,358, ,528 2,051,259 Interest receivable 11,093 24,444 35,537 Prepaid expenses 23,176 23,176 Due from other funds 150, ,000 Property held for resale 200, ,000 Inventories 39,131 8,225 47,356 Loans receivable 4,448,283 4,448,283 Total assets $ 7,884,724 $ 24,724,827 $ 32,609,551 Liabilities and Fund Balance Liabilities Accounts payable $ 978,099 $ 420,779 $ 1,398,878 Due to other funds 150, ,000 Deposits payable 319, ,344 1,240,422 Unearned revenue 331, ,385 Total liabilities 1,628,562 1,492,123 3,120,685 The notes to the financial statements are an integral part of these financial statements. 33
34 Balance Sheet June 30, 2015 Page 2 Other Total Governmental Governmental General Funds Funds Fund balance: Nonspendable: Inventories $ 39,131 $ 8,225 $ 47,356 Long term loans receivable 4,442,213 4,442,213 Restricted for: Low income housing 5,149,098 5,149,098 Road surface repairs 8,462,039 8,462,039 Library services 426, ,765 Debt service 119, ,232 Law enforcement 3,171 3,171 Other capital projects 4,544,539 4,544,539 Other purpose 74,848 13,699 88,547 Committed to: Library acquisitions 593, ,598 Health and welfare 43,753 43,753 Unassigned 5,715,418 (146,863) 5,568,555 Total fund balance 6,256,162 23,232,704 29,488,866 Total liabilities and fund balance $ 7,884,724 $ 24,724,827 $ 32,609,551 The notes to the financial statements are an integral part of these financial statements. 34
35 Reconciliation of the Governmental Funds Balance Sheet to the Statement of Net Position June 30, 2015 Total fund balance governmental funds $ 29,488,866 Amounts reported for governmental activities in the statement of net position are different because: Capital assets: In governmental funds, only current assets are reported. In the statement of net position, all assets are reported, including capital assets and accumulated depreciation. Net capital assets relating to governmental activities consisted of: Capital assets at estimated historical cost $ 157,519,690 Accumulated depreciation (63,370,905) 94,148,785 Interest payable: In governmental funds, interest on long term debt is not recognized until the period in which it matures and is paid. In the statement of net position, it is recognized in the period that it is incurred. The additional liability for unmatured interest owed at year end was: (31,885) Long term liabilities: In governmental funds, only current liabilities are reported. In the statement of net position, all liabilities, including long term liabilities, are reported. Long term liabilities relating to governmental activities consisted of: Tax Allocation Bonds ,135,000 Capital leases payable 843,284 Net pension liability 36,977,097 Deferred Outflows and Inflows The deferred outflows and inflows are not current assets or resources; and they are not due in the current period and therefore are not reported in the governmental funds. The deferred outflows and deferred inflows consisted of: (39,955,381) Deferred outflows 3,606,301 Deferred inflows (6,305,740) Internal service funds: Internal service funds are used to conduct activities for which costs are charged to other funds on a full cost recovery basis. Because internal service funds are presumed to operated for the benefit of governmental activities, assets and liabilities of internal service funds are reported with governmental activities in the statement of net position. Net position for internal service funds was: 535,221 Total net position governmental activities $ 81,486,167 The notes to the financial statements are an integral part of these financial statements. 35
36 Statement of Revenues, Expenditures and Changes in Fund Balance Governmental Funds Year Ended June 30, 2015 Other Total Governmental Governmental General Funds Funds Revenues: Taxes $ 13,809,429 $ 5,165,261 $ 18,974,690 Licenses and permits 286, ,877 Fines and penalties 99,692 99,692 Revenues from other agencies 2,057,256 1,377,061 3,434,317 Charges for current services 8,407, ,950 9,245,759 Interest 23, , ,164 Other revenues 931, ,346 1,091,818 Total revenues 25,616,403 7,756,914 33,373,317 Expenditures: Personnel services 21,983, ,737 22,674,429 Maintenance and operations 8,225,273 1,301,022 9,526,295 Capital outlay 212,228 2,441,729 2,653,957 Debt services: Principal 120, ,464 Interest and fiscal charges 124, ,136 Total expenditures 30,421,193 4,678,088 35,099,281 Excess of revenues over (under) expenditures (4,804,790) 3,078,826 (1,725,964) Other financing sources (uses) Operating transfers in 5,760, ,748 6,003,885 Operating transfers out (574,428) (2,813,844) (3,388,272) Total other financing sources(uses) 5,185,709 (2,570,096) 2,615,613 Net change in fund balance 380, , ,649 Fund balance beginning of year 5,875,243 22,723,974 28,599,217 Fund balance end of year $ 6,256,162 $ 23,232,704 $ 29,488,866 The notes to the financial statements are an integral part of these financial statements. 36
37 Reconciliation of the Governmental Funds Statement of Revenues, Expenditures and Changes in Fund Balances to the Statement of Activities Year Ended June 30, 2015 Total net change in fund balance governmental funds $ 889,649 Amounts reported for governmental activities in the statement of activities are different because: Capital outlay: In governmental funds, the costs of capital assets are reported as expenditures in the period when the assets are acquired. In the statement of activities, costs of capital assets are allocated over their estimated useful lives as depreciation expense. The difference between capital outlay expenditures and depreciation expense for the year was: Expenditures for capital outlay governmental funds $ 2,653,957 Depreciation expense (2,135,484) 518,473 Loss from disposal of capital assets: In governmental funds, the entire proceeds from disposal of capital assets are reported as revenue. In the statement of activities, only the resulting gain or loss is reported. The difference between the proceeds from disposal of capital assets and the resulting gain or loss was: (210,628) Debt service: In governmental funds, repayments of long term debt are recognized as expenditures. In the government wide statements, repayments of long term debt are reported as reductions of liabilities. Expenditures for repayment of the principal portion of long term debt were: 120,464 Capital assets donated: Any donations of capital assets for governmental activities would not be recognized in governmental funds but in the statement of activities as program income. 569,347 Compensated absences: In governmental funds, compensated absences are measured by the amounts paid during the period. In the statement of activities, compensated absences are measured by the amounts earned. The differences between compensated absences paid and compensated absences earned was: (22,296) Pension expense: In governmental funds, pension expenses are included in the statement of activities, however they do not require the use of current financial resources and therefore are not reported as expenditures in the governmental funds (net change): 2,533,718 The notes to the financial statements are an integral part of these financial statements. 37
38 Reconciliation of the Governmental Funds Statement of Revenues, Expenditures and Changes in Fund Balances to the Statement of Activities Year Ended June 30, 2015 Page 2 Interest expense: Interest on long term debt is recognized as an expenditure in governmental funds when it is due. In the statement of activities, interest expense is recognized as the interest accrues, regardless of when it is due. The difference in interest expense paid and interest accrued was: $ 769 Internal service funds: Internal service funds are used to conduct certain activities for which costs are charged to other funds on a full cost recovery basis. Because internal service funds are presumed to operate for the benefit of governmental activities, internal service activities are reported with governmental activities in the statement of activities. The next increase in the internal service funds was: (4,315,915) Compensated absence liability transferred into the Insurance Control Internal Service Fund from government wide activities at June 30, 2015 was: 2,065,808 Special item reported in the statement of activities: Increase in net position for land transferred to the City from the Successor Agency Trust Fund was: 1,201,752 Total change in net position governmental activities $ 3,351,141 The notes to the financial statements are an integral part of these financial statements. 38
39 Statement of Net Position Proprietary Funds June 30, 2015 Assets Current assets: Water Electric Wastewater Utility Utility Utility Cash and investments $ 2,690,218 $ 2,324,374 $ 6,033,524 Cash with fiscal agents 11,420,316 Restricted cash with fiscal agent 566,432 80,804 Accounts receivable, net 1,483,173 3,296,039 2,041,205 Interest receivable 3,047 7,432 3,579 Prepaid expenses 337,844 Due from other funds 88,293 4,940,854 Inventories 277,503 1,481,298 28,753 Total current assets 5,108,666 23,808,157 8,187,865 Noncurrent assets: Other post employment benefits (OPEB) asset Land 529, , ,758 Construction in progress 217,962 1,853, ,069 Structures and improvements 33,314,005 15,461, ,759,111 Vehicles and equipment 21,935,139 34,785,081 13,245,730 Less accumulated depreciation (29,525,043) (24,302,987) (42,335,576) Total noncurrent assets 26,471,841 28,047, ,167,092 Total assets 31,580,507 51,855, ,354,957 Deferred Outflows of Resources Deferred pensions 358, , ,497 Unamortized loss on refunding 146,543 45,073 Total deferred outflows of resources 505, , ,570 The notes to the financial statements are an integral part of these financial statements. 39
40 Governmental Total Activities Solid Waste Other Enterprise Enterprise Internal Disposal Funds Funds Service Funds $ 5,441,559 $ 3,955,670 $ 20,445,345 $ 13,493,561 11,420,316 1,299, , ,664 1,038,547 8,839,628 5,967 7,107 8,889 30,054 15,089 1, ,344 5,029, ,754 41,844 1,829, ,524 6,429,330 5,046,450 48,580,468 15,813,653 1,243, ,231 5,782,025 7,146,096 56,691 1,256,947 3,561,255 13,003 1,646,928 5,124, ,305, ,833 2,394,189 4,253,519 76,613,658 20,960,573 (2,722,163) (5,477,085) (104,362,854) (14,834,608) 1,637,876 10,939, ,263,657 7,836,087 8,067,206 15,985, ,844,125 23,649, ,787 92,908 1,389, , , ,787 92,908 1,581, ,842 40
41 Statement of Net Position Proprietary Funds June 30, 2015 Page 2 Water Electric Wastewater Utility Utility Utility Liabilities Current liabilities: Accounts payable $ 246,686 $ 802,220 $ 222,525 Due to other funds Accrued wages and benefits Unearned revenue 2,609,686 Interest payable 195,553 13,425 1,169,761 Deposits payable 7, ,973 Trust deposits Reserve fund WCSD 725,500 Current portion of claims payable Current portion of compensated absences Current portion of capital leases payable 146, ,105 9,093 Current portion of loans payable 6,875 3,511,199 Current portion of revenue bonds 629, ,600 Total current liabilities 1,232,445 1,368,723 8,873,364 Noncurrent liabilities: Claims payable, net of current portion Compensated absences, net of current portion Landfill closure and post closure costs Capital leases payable, net of current portion 359,150 1,850, ,302 Loans payable, net of current portion 1,426 56,287,590 Revenue bonds, net of current portion 12,213,553 18,818,456 Net pension liability 4,015,003 4,104,624 3,150,909 Total noncurrent liabilities 16,589,132 5,955,290 78,382,257 Total liabilities 17,821,577 7,324,013 87,255,621 Deferred Inflows of Resources Deferred pensions 714, , ,617 Total inflows of resources 714, , ,617 Net Position Net investment in capital assets 13,261,436 26,017,606 31,834,925 Restricted for: Construction 760,485 Debt service 762,590 6,066,344 Other purposes Unrestricted (474,218) 18,150,310 (6,796,465) $ 13,549,808 $ 44,167,916 $ 31,865,289 The notes to the financial statements are an integral part of these financial statements. 41
42 Governmental Total Activities Solid Waste Other Enterprise Enterprise Internal Disposal Funds Funds Service Funds $ 100,192 $ 447,210 $ 1,818,833 $ 236, , , ,619 4,800,282 12,299 12,299 1,061,482 1,689 2,611,375 1,935 3,868 1,384,542 21, ,360 10,100 10, ,500 1,280,000 3,400,889 32,474 3, , ,555 3,518,074 1,255, ,004 1,060,712 12,974,248 11,421,050 5,518,000 74,417 5,841,167 5,841, ,974 45,894 2,660,986 2,959,263 56,289,016 31,032,009 3,243,701 1,039,968 15,554,205 2,886,125 9,364,842 1,085, ,377,383 11,437,805 9,803,846 2,146, ,351,631 22,858, , ,033 2,767, , , ,033 2,767, ,506 1,325,428 10,890,247 83,329,642 4,256, ,485 6,828,934 2,288, ,002 2,632,766 45,099 (5,638,172) 2,512,973 7,754,428 (3,766,147) $ (2,023,980) $ 13,747,222 $ 101,306,255 $ 535,221 42
43 Statement of Revenues, Expenses and Changes in Fund Net Position Proprietary Funds Year Ended June 30, 2015 Water Electric Wastewater Utility Utility Utility Operating revenues: User fees and charges for services $ 11,101,042 $ 23,816,523 $ 10,249,884 Revenue from other agencies 18, ,208 3,245,948 Other operating revenues 24, ,584 17,634 Facilities rental 100 6,000 Total operating revenues 11,144,049 24,639,415 13,519,466 Operating expenses: Personnel services 2,672,014 1,902,256 2,267,914 Maintenance and operations 4,933,322 16,233,297 4,174,796 Depreciation and amortization 1,525,213 1,736,659 4,545,922 Total operating expenses 9,130,549 19,872,212 10,988,632 Operating income (loss) 2,013,500 4,767,203 2,530,834 Nonoperating revenues and expenses: Interest earnings 13,137 85,635 4,621 Interest expense (636,790) (56,511) (1,969,240) Capital grants and contributions 176, ,453 Other revenue (expense) 9, ,533 1,851 Gas taxes Loss on disposal of equipment (31,295) (38,564) (64,567) Operating transfers in Operating transfers out (2,022,088) Total nonoperating revenues and expenses (468,036) (1,540,542) (2,027,335) Net income (loss) 1,545,464 3,226, ,499 Net position beginning of year 16,658,175 45,698,966 35,014,041 Prior period restatements (4,653,831) (4,757,711) (3,652,251) Net position beginning of year, restated 12,004,344 40,941,255 31,361,790 Net position end of year $ 13,549,808 $ 44,167,916 $ 31,865,289 The notes to the financial statements are an integral part of these financial statements. 43
44 Governmental Total Activities Solid Waste Other Enterprise Enterprise Internal Disposal Funds Funds Service Funds $ 6,319,246 $ 2,930,229 $ 54,416,924 $ 22,101,869 12,143 1,488,171 5,466,163 1,536,508 36,543 1,736, , ,618 7,867,897 4,915,461 62,086,288 22,101,869 2,333,766 1,174,167 10,350,117 6,488,663 4,121,026 3,494,755 32,957,196 12,348, , ,217 8,799, ,818 6,615,213 5,500,139 52,106,745 18,989,543 1,252,684 (584,678) 9,979,543 3,112,326 14,948 11, ,399 61,547 (25,156) (32,939) (2,720,636) (85,035) 850,423 1,258,830 1, , ,591 29,591 (3,815) (73,620) (211,861) 4,745,827 4,745,827 27,697 (2,022,088) (7,432,857) (12,172) 5,531,126 1,483,041 (7,428,241) 1,240,512 4,946,448 11,462,584 (4,315,915) 562,116 10,006, ,939,510 8,196,472 (3,826,608) (1,205,438) (18,095,839) (3,345,336) (3,264,492) 8,800,774 89,843,671 4,851,136 $ (2,023,980) $ 13,747,222 $ 101,306,255 $ 535,221 44
45 Statement of Cash Flows Proprietary Funds Year Ended June 30, 2015 Water Electric Wastewater Utility Utility Utility Cash flows from operating activities: Cash received from customers $ 11,270,797 $ 24,059,393 $ 10,249,532 Cash received from other agencies 18, ,208 3,245,948 Cash received from interfund services provided Internal activity cash paid from (to) other funds 7,249 15,816 Cash paid to suppliers for goods and services (4,870,310) (15,555,021) (4,185,253) Cash paid to employees (3,397,138) (2,620,555) (2,709,242) Net cash provided (used) by operating activities 3,029,291 6,600,841 6,600,985 Cash flows from noncapital financing activities: Cash received from other agencies (15,164) Other revenue 9, ,533 1,853 Net operating transfers (2,022,088) Net cash provided (used) by non capital financing activities 9,958 (1,762,555) (13,311) Cash flows from capital and related financing activities: Acquisition and construction of capital assets (115,072) (2,829,671) (136,194) Gain (loss) on disposal of equipment (31,295) (38,564) (64,567) Principal payments on long term debt (755,212) (174,892) (4,054,081) Interest payments on long term debt (627,894) (58,463) (2,021,611) Cash received from capital grants and contributions 176, ,453 Net cash used by capital and related financial activities (1,352,519) (2,870,137) (6,276,453) Cash flows from investing activities: Interest on investments 10,659 82,387 4,169 Net cash provided by investing activities 10,659 82,387 4,169 Net increase in cash and investments 1,697,389 2,050, ,390 Cash and investments beginning of year 1,559,261 11,694,154 5,798,938 Cash and investments, end of year $ 3,256,650 $ 13,744,690 $ 6,114,328 Summary of cash and investments end of year: Cash and investments $ 2,690,218 $ 2,324,374 $ 6,033,524 Cash with fiscal agents 11,420,316 Restricted cash with fiscal agent 566,432 80,804 Total cash and investments end of year $ 3,256,650 $ 13,744,690 $ 6,114,328 The notes to the financial statements are an integral part of these financial statements. 45
46 Governmental Total Activities Solid Waste Other Enterprise Enterprise Internal Disposal Funds Funds Service Funds $ 7,801,000 $ 3,038,678 $ 56,419,400 $ 12,143 1,488,171 5,466,163 22,096,126 (142,249) (4,826,504) (4,945,688) 8,568,544 (3,919,529) (3,289,081) (31,819,194) (12,106,114) (2,871,694) (1,346,738) (12,945,367) (6,357,275) 879,671 (4,935,474) 12,175,314 12,201,281 30,473 15, , ,195 4,745,827 2,723,739 (7,405,160) 1,851 4,776,300 3,012,243 (7,404,753) (52,203) (8,657) (3,141,797) (1,193,788) (3,815) (73,620) (211,861) (31,734) (51,621) (5,067,540) (699,301) (25,365) (33,555) (2,766,888) (88,502) 850,423 1,258,830 (113,117) 682,970 (9,929,256) (1,981,591) 9,970 3, ,067 51,802 9,970 3, ,067 51, , ,678 5,369,368 2,866,739 4,663,184 3,427,992 27,143,529 11,926,580 $ 5,441,559 $ 3,955,670 $ 32,512,897 $ 14,793,319 $ 5,441,559 $ 3,955,670 $ 20,445,345 $ 13,493,561 11,420,316 $ 5,441,559 3,955, ,236 1,299,758 $ $ 32,512,897 $ 14,793,319 46
47 Statement of Cash Flows Proprietary Funds Year Ended June 30, 2015 Page 2 Water Electric Wastewater Utility Utility Utility Operating income (loss) $ 2,013,500 $ 4,767,203 $ 2,530,834 Adjustments to reconcile operating income (loss) to net cash provided (used) by operating activities: Depreciation and amortization 1,525,213 1,736,659 4,545,922 Accounts receivable 145, ,186 (23,986) Due from other funds 7,249 15,816 Prepaid expenses 1,657 (227,504) 1,121 Inventories 30, , Accounts payable 32, ,207 38,128 Due to other funds Other post employment benefits (OPEB) asset Accrued wages and benefits (715,586) (709,064) (437,106) Deposits payable (1,950) (40,827) Unearned revenue (50,583) Trust deposits Compensated absences (9,538) (9,235) (4,222) Landfill closure and postclosure costs Claim liabilities Total adjustments 1,015,791 1,833,638 4,070,151 Net cash provided (used) by operating activities $ 3,029,291 $ 6,600,841 $ 6,600,985 The notes to the financial statements are an integral part of these financial statements. 47
48 Governmental Total Activities Solid Waste Other Enterprise Enterprise Internal Disposal Funds Funds Service Funds $ 1,252,684 $ (584,678) $ 9,979,543 $ 3,112, , ,217 8,799, ,818 (54,754) (389,812) (201,925) (4,821) 23,065 8,568,544 2,165 2,621 (219,940) 10, ,933 10,266 39, , ,946 16,761 (142,249) (4,826,504) (4,968,753) (609,087) (531,492) (170,501) (2,563,749) 667,619 (42,777) (21,495) (72,078) 1,200 1,200 (6,436) (2,070) (31,501) 72, , , ,999 (373,013) (4,350,796) 2,195,771 9,088,955 $ 879,671 $ (4,935,474) $ 12,175,314 $ 12,201,281 48
49 Statement of Fiduciary Net Position Fiduciary Funds June 30, 2015 Successor Agency Private Purpose Trust Fund Agency Funds Assets Cash and investments $ 880,437 $ 1,413,661 Restricted cash with fiscal agent 606,002 Accounts receivable, net 8,969 Interest receivable 1, Loans receivable 130,181 Total assets 1,617,762 $ 1,423,491 Deferred Outflows of Resources Deferred pensions 9,052 Total deferred outflows of resources 9,052 Liabilities Accounts payable $ 38,710 Accrued wages and benefits 10,505 Interest payable 232,774 Long term debt due within one year 359,010 Long term debt due in more than one year 13,435,522 Amounts due to others 1,384,781 Net pension liability 101,321 Total liabilities 14,139,132 $ 1,423,491 Deferred Inflows of Resources Deferred pensions 18,028 Total deferred inflows of resources 18,028 Net Position Held in trust for successor agency activities $ (12,530,346) The notes to the financial statements are an integral part of these financial statements. 49
50 Statement of Changes in Fiduciary Net Position Fiduciary Funds Year Ended June 30, 2015 Successor Agency Private Purpose Trust Fund Additions: Property taxes $ 1,098,823 Other revenues 12,128 Total additions 1,110,951 Deductions: Program expenses 93,157 Administrative expenses 266,400 Interest on long term debt 712,611 Total deductions 1,072,168 Special item (1,201,752) Change in net position (1,162,969) Net position beginning of year (11,249,935) Prior year restatement (117,442) Net position beginning of year, restated (11,367,377) Net position end of year $ (12,530,346) The notes to the financial statements are an integral part of these financial statements. 50
51 Notes to Financial Statements June 30, 2015 Note 1: The Reporting Entity The City of Lompoc (the City) was incorporated in The City is a general law city under the laws of the State of California and operates under a Council Administrator form of government. The City provides the following services: public safety (police and fire), construction and maintenance of highways and streets, sanitation, culture and recreation, public improvements, planning, zoning and general administration. Enterprise funds, operated in a manner similar to a private business, include water, electric, wastewater, solid waste, transit, and other business type enterprises. The City has defined its reporting entity in accordance with the Governmental Accounting Standards Board (GASB) Statement No. 14, amended by GASB Statements No. 39 and 61. These statements provide guidance for determining which organizations, functions and activities of a government should be included in the general purpose financial statements. The criteria for inclusion in the basic financial statements are generally based upon the ability of the City to exercise oversight responsibility over such organizations, functions and activities. Oversight responsibility is generally defined as the existence of financial interdependency and/or the ability to appoint governing boards, to designate management, to significantly influence operations, to approve operating budgets or control day to day activities. The accompanying financial statements include all activities and reporting entities over which the City exercises oversight responsibility. Effective January 31, 2012, the Lompoc Redevelopment Agency of the City of Lompoc (the Agency) was dissolved through the Supreme Court decision on Assembly Bill 1X 26. This action impacted the reporting entity of the City that previously had reported the Agency as a blended component unit. See Note 17 for additional information on the dissolution and reporting of the Agency as a private purpose trust fund. In determining the financial reporting entity for the City, the following governmental unit has met the criteria for inclusion in the City's financial statements. Lompoc Public Financing Authority The Lompoc Public Financing Authority (the Authority) was established in 1984, and is a separate governmental entity under the laws of the State of California. The purpose of the Authority is to provide financing for the construction and acquisition of selected City facilities. The City Council and the Board of Directors of the Authority are legally separate boards; however, they share a common membership. Activities of the Authority are accounted for in the applicable City governmental or enterprise funds. Separate financial statements are not prepared for the Authority, as it is included in the accompanying financial statements as a blended component unit. Other Governmental Agencies Other governmental agencies provide various levels of services to residents of the City, either entirely or partially. The entities include, but are not limited to, the State of California, the County of Santa Barbara, as well as several school districts. Each of these agencies has an independently elected governing board or is dependent on an independently elected governing board other than the City Council. 51
52 Notes to Financial Statements June 30, 2015 Page 2 Note 1: The Reporting Entity (Continued) The City has no ability to appoint or control the management of any of these entities and is not responsible for any operating losses or debts incurred. As a result of the above analysis, financial information for these agencies is not included within the scope of this report. Note 2: Summary of Significant Accounting Policies The accounting policies of the City conform to accounting principles generally accepted in the United States of America as applied to governmental agencies. The following summary of the City's more significant accounting policies is presented to assist the reader in interpreting the financial statements and other data in this report. These policies should be viewed as an integral part of the accompanying financial statements. Basis of Presentation The City s basic financial statements are prepared in conformity with accounting principles generally accepted in the United States of America. The GASB is the acknowledged standard setting body for establishing accounting and financial reporting standards followed by governmental entities in the United States of America. Government Wide and Fund Financial Statements The government wide financial statements (i.e., the statement of net position and the statement of activities) report information on the primary government and its blended component unit. The effect of interfund activity has been removed from these statements. Governmental activities, which normally are supported by taxes and intergovernmental revenues, are reported separately from business type activities, which rely to a significant extent on fees and charges for support. The statement of activities demonstrates the degree to which the direct expenses of a given function or segment are offset by program revenues. Direct expenses are those that are clearly identifiable with a specific function or segment. Program revenues include 1) charges to customers or applicants who purchase, use or directly benefit from goods, services, or privileges provided by a given function or segment and 2) grants and contributions that are restricted to meeting the operational or capital requirements of a particular function or segment. Taxes and other items not properly included among program revenues are reported instead as general revenues. Separate financial statements are provided for governmental funds and proprietary funds. Major individual governmental funds and major individual enterprise funds are reported as separate columns in the fund financial statements. 52
53 Notes to Financial Statements June 30, 2015 Page 3 Note 2: Summary of Significant Accounting Policies (Continued) Major Funds GASB Statement No. 34 defines major funds and requires that the City s major governmental funds be identified and presented separately in the fund financial statements. All other funds, called non major funds, are combined and reported in a single column, regardless of their fund type. Major funds are defined as funds that have either assets, liabilities, revenues, or expenditures/expenses equal to ten percent of their fund type total. The General Fund is always a major fund. The City may also select other funds it believes should be presented as major funds. The City reported the following major governmental funds in the accompanying financial statements: General Fund: This fund accounts for all financial resources except those to be accounted for in another fund. It is the general operating fund of the City. The City reported the following major proprietary funds in the accompanying financial statements: Water Utility Fund: This fund accounts for the operation of the City s water utility, a self supporting activity, which renders a service on a user charge basis to residents and businesses. Electric Utility Fund: This fund accounts for the operations of the City s electric utility, a self supporting activity, which renders service on a user charge basis to residents and businesses. Wastewater Utility Fund: This fund accounts for the operations of the City s wastewater utility, a self supporting activity, which renders service on a user charge basis to residents and businesses. Solid Waste Fund: This fund accounts for the operations of the City s solid waste collection and disposal services, a self supporting activity, which renders service on a user charge basis to residents and businesses. Basis of Accounting The government wide and proprietary fund financial statements are reported using the economic resources measurement focus and the full accrual basis of accounting. Revenues are recorded when earned and expenses are recorded at the time liabilities are incurred, regardless of when the related cash flows take place. 53
54 Notes to Financial Statements June 30, 2015 Page 4 Note 2: Summary of Significant Accounting Policies (Continued) Governmental funds are reported using the current financial resources measurement focus and the modified accrual basis of accounting. Under this method, revenues are recognized when measurable and available. The City considers all revenues reported in the governmental funds to be available if the revenues are collected within sixty days after fiscal year end. Expenditures are recorded when the related fund liability is incurred, except for principal and interest on long term debt, claims and judgments, and compensated absences, which are recognized as expenditures to the extent that they have matured. Capital asset acquisitions are reported as expenditures in governmental funds. Proceeds of long term debt and acquisitions under capital leases are reported as other financing sources. Non exchange transactions, in which the City gives or receives value without directly receiving or giving equal value in exchange, include property taxes, grants, entitlements, and donations. On an accrual basis, revenue from property taxes is recognized in the fiscal year for which the taxes are levied. Revenue from grants, entitlements, and donations is recognized in the fiscal year in which all eligibility requirements have been satisfied. Other revenues susceptible to accrual include other taxes, intergovernmental revenues, interest, and charges for services. Grant revenues are recognized in the fiscal year in which all eligibility requirements are met. Under the terms of grant agreements, the City may fund certain programs with a combination of cost reimbursement grants, categorical block grants, and general revenues. Thus, both restricted and unrestricted Net Position may be available to finance program expenditures/expenses. The City s policy is to first apply restricted grant resources to such programs, followed by general revenues if necessary. Proprietary funds distinguish operating revenues and expenses from nonoperating items. Operating revenues and expenses generally result from providing services and producing and delivering goods in connection with a proprietary fund s principal ongoing operations. The principal operating revenues of the enterprise funds are charges to customers for sales and services, administrative expenses, and depreciation on capital assets. All revenues and expenses not meeting this definition are reported as nonoperating revenues and expenses. The City has established agency funds, which are used to account for funds held by the City as an agent for private individuals or organizations. The agency funds are accounted for using the accrual basis of accounting. Budgetary Information A two year budget is legally adopted for all funds by the City Council prior to July 1 of odd years, on a basis consistent with accounting principles generally accepted in the United States of America. After adoption of the final budget, transfers of appropriations within a General Fund department, or within other funds, can be made by the 54
55 Notes to Financial Statements June 30, 2015 Page 5 Note 2: Summary of Significant Accounting Policies (Continued) Management Services Director. Budget modifications between funds and increases or decreases to a fund s overall budget, must be approved by the City Administrator or City Council. Numerous properly authorized amendments were made during the fiscal year. The appropriations are legally adopted at the major expenditure classification level for each department within each fund. Expenditures may not legally exceed appropriations at the department level. Cash and Cash Equivalents For purposes of the statement of cash flows, the City considers all highly liquid investments with a maturity of three months or less when purchased to be cash equivalents. The proprietary funds deposits in the City wide cash management pool are, in substance, demand deposits and are, therefore, considered cash equivalents for purposes of the statement of cash flows. Receivables and Payables Activity between funds that are representative of lending/borrowing arrangements outstanding at the end of the fiscal year are referred to as due to/from other funds. All trade and property tax receivables are shown net of any allowance for uncollectible accounts if material. Property tax assessment and collection is administered by the County of Santa Barbara. Property Taxes California Constitution Article XIII A limits the combined property tax rate to one percent of a property s assessed valuation. Additional taxes may be imposed with voter approval. Assessed value is calculated at one hundred percent of a property s fair value, as defined by Article XIII A, and may be increased no more than two percent per year unless a change in ownership occurs. The state legislature has determined the method of distributing the one percent tax levy among the various taxing jurisdictions. In 2011 the City elected to receive property tax revenue in accordance with the County s Teeter plan whereby the County remits 100% of taxes levied without regard to delinquencies. The County then pursues collection, retaining any delinquent taxes and related penalties and interest. Property taxes are billed and collected by the County on behalf of the City. Property taxes attach as an enforceable lien on the property on March 1. Taxes levied on July 1 are due on November 1 and February 1, and become delinquent after December 10 and April 10, respectively. 55
56 Notes to Financial Statements June 30, 2015 Page 6 Note 2: Summary of Significant Accounting Policies (Continued) Inventories Inventories are valued at weighted average cost for all funds under the consumption method of accounting. Under this method, purchases are recorded as increases in inventory and charge to expenditures when used. Prepaid Expenses/Expenditures Certain payments to vendors reflect costs applicable to future accounting periods and are recorded as prepaid expenses in the financial statements. Capital Assets All capital assets are valued at historical cost or estimated historical cost if actual historical cost is not available. Contributed capital assets are valued at their estimated fair value on the date contributed. The City s policy is to capitalize all capital assets with costs exceeding certain minimum of $2,500 and with useful lives exceeding one year. With the implementation of GASB Statement No. 34, the City has recorded all its public domain (infrastructure) capital assets, which include roads, bridges, curbs and gutters, streets and sidewalks, drainage systems, and lighting systems. The purpose of depreciation is to spread the cost of capital assets equitably among all users over the life of these assets. The amount charged to depreciation expense each fiscal year represents that fiscal year s pro rata share of the cost of capital assets. GASB Statement No. 34 requires that all capital assets with limited useful lives be depreciated over their estimated useful lives. Depreciation is provided using the straight line method which means the cost of the asset is divided by its expected useful life in years and the result is charged to expense each fiscal year until the asset is fully depreciated. The City has assigned the useful lives listed below to capital assets: Buildings and utility plants Improvements other than buildings Equipment and vehicles Infrastructure years 5 10 years 6 30 years years 56
57 Notes to Financial Statements June 30, 2015 Page 7 Note 2: Summary of Significant Accounting Policies (Continued) Compensated Absences In compliance with GASB Statement No. 16, the City has established a liability for accrued sick leave and vacation in relevant funds. For governmental funds, the current liability appears in the respective funds. All vacation paid is accrued when incurred in the government wide and proprietary funds financial statements. This liability is set up for current employees at the current rates of pay. If sick leave and vacation are not used by the employee during the term of employment, compensation is payable to the employee at the time of retirement. Such compensation is calculated at the employee s prevailing rate at the time of retirement or termination. Each fiscal year, an adjustment to the liability is made based on pay rate changes and adjustments for the current portion. The General Fund is primarily responsible for the repayment of the governmental portion of compensated absences. Net Pension Liability The City recognizes a net pension liability, which represents the City s proportionate share of the excess of the total pension liability over the fiduciary net position of the pension reflected in the actuarial reports provided by the California Public Employees Retirement System (CalPERS) plans (Plans). The net pension liability is measured as of the City s prior fiscal year end. Changes in the net pension liability are recorded, in the period incurred, as pension expense or as deferred inflows of resources or deferred outflows of resources depending on the nature of the change. The changes in the net pension liability that are recorded as deferred inflows of resources or deferred outflows of resources (that arise from changes in actuarial assumptions or other inputs and differences between expensed or actual experience) are amortized over the weighted average remaining service life of all participants in the respective pension plan and are recorded as a component of pension expense beginning with the period in which they are incurred. For purposes of measuring the net pension liability and deferred outflows/inflows of resources related to pensions, and pension expense, information about the fiduciary net position of the City s California Public Employees Retirement System (CalPERS) plans (Plans) and additions to/deductions from the Plans fiduciary net position have been determined on the same basis as they are reported by CalPERS. For this purpose, benefit payments (including refunds of employee contributions) are recognized when due and payable in accordance with the benefit terms. Investments are reported at fair value. Net Position GASB Statement No. 34, amended by GASB Statement No. 63, adds the concept of net position, which is measured on the full accrual basis, to the concept of fund balance, which is measured on the modified accrual basis. 57
58 Notes to Financial Statements June 30, 2015 Page 8 Note 2: Summary of Significant Accounting Policies (Continued) Net position is the excess of all the City s assets over all its liabilities. Net position is divided into three categories. These categories apply only to net position, which is determined only at the government wide level, and are described below: Net Investment in Capital Assets: Describes the portion of net position which is represented by the current net book value of the City s capital assets, less the outstanding balance of any debt issued to finance these assets. Restricted Net Position: Describes the portion of net position which is restricted as to use by the terms and conditions of agreements with outside parties, governmental regulations, laws, or other restrictions which the City cannot unilaterally alter. These principally include developer fees received for use on capital projects, debt service requirements, and funds restricted to low and moderate income purposes. Unrestricted Net Position: Describes the portion of net position which is not restricted to use. Fund Equity The City s fund financial statements report fund balance in classifications that comprise a hierarchy based primarily on the extent to which the City is bound to honor constraints on the specific purpose for which amounts in the funds can be spent. GASB Statement No. 54, Fund Balance Reporting and Governmental Fund Type Definitions, identifies five components of fund balance nonspendable, restricted, committed, assigned, and unassigned. Nonspendable: This component consists of amounts that cannot be spent because they are either (a) not in spendable form or (b) legally or contractually required to be maintained intact. Restricted: This component consists of amounts that have constraints placed on them either externally by thirdparties (creditors, grantors, contributors, or laws or regulations of other governments) or by law through constitutional provisions or enabling legislation. Enabling legislation authorizes the City to assess, levy, charge or otherwise mandate payment of resources (from external resource providers) and includes legally enforceable requirement (compelled by external parties) that those resources be used only for the specific purposes stipulated in the legislation. Committed: This component consists of amounts that can only be used for specific purposes pursuant to constraints imposed by formal action of the City s highest level of decision making authority which includes the City Municipal Code, Ordinances and Resolutions. Those committed amounts cannot be used for any other purpose unless the City removes or changes the specified use by taking the same type of action (City Municipal Code, Ordinance and Resolution) it employed previously to commit those amounts. 58
59 Notes to Financial Statements June 30, 2015 Page 9 Note 2: Summary of Significant Accounting Policies (Continued) Assigned: This component consists of amounts that are constrained by the City s intent to be used for specific purposes, but are neither restricted nor committed. Such intent should be expressed by the City Council or its designated officials to assign amounts to be used. Constraints imposed on the use of assigned amounts can be removed with no formal Council actions. Unassigned: This component consists of amounts that have not been restricted, committed or assigned to specific purposes. Fund Balance Spending Policy The City has formally adopted a spending policy regarding the order in which restricted, committed, assigned, and unassigned fund balances are spent when more than one amount is available for a specific purpose. When both restricted and unrestricted resources are available for use, it is the City s policy to use restricted resources first, then unrestricted resources (committed, assigned and unassigned) as they are needed. When unrestricted resources (committed, assigned and unassigned) are available for use it is the City s policy to use committed resources first, then assigned, and then unassigned as they are needed. Estimates The preparation of financial statements in conformity with accounting principles generally accepted in the United States of America, as prescribed by the GASB and the American Institute of Certified Public Accountants, requires management to make estimates and assumptions that affect the reported amounts of assets and liabilities and disclosure of contingent assets and liabilities at the date of the financial statements and the reported amounts of revenues and expenditures/expenses during the reporting period. Actual results could differ from those estimates. Note 3: Cash and Investments At June 30, 2015, cash and investments held in the City Treasury are reflected in the financial statements as follows: Cash and investments held in City Treasury $ 75,860,256 Less cash and investments in fiduciary funds (2,900,100) Total government wide $ 72,960,156 59
60 Notes to Financial Statements June 30, 2015 Page 10 Note 3: Cash and Investments (Continued) At June 30, 2015, cash and investments consisted of the following: Fair Percent of Value Portfolio Cash and cash equivalents $ 4,309, % State Local Agency Investment Fund 33,341, % Cash with fiscal agents 12,720, % Restricted cash with fiscal agent 647, % U.S. government securities 19,293, % Certificates of deposit 2,647, % Total $ 72,960, % Investment Policy Cash balances from all funds are combined and invested to the extent possible, pursuant to the City s investment policy, and State Government Code. The earnings from these investments are allocated monthly to each fund, based on an average of monthly opening and closing balances of cash and investments. Interest earned from cash and investments with fiscal agents is credited directly to such funds. As defined in the California Government Code Section and the City s investment policy, the following investment instruments are authorized: Securities issued or guaranteed by the federal government or its agencies Repurchase and reverse repurchase agreements Bankers acceptances Commercial paper Corporate notes and money market mutual funds Negotiable certificates of deposit State Local Agency Investment Fund (LAIF) The policy, in addition to State statutes, establishes that funds on deposit in banks must be federally insured or collateralized and investments shall have maximum maturity not to exceed five years and be subject to limitations to a certain percent of the portfolio for each of the authorized investments. Highly liquid market investments with maturities of one year or less at time of purchase are stated at amortized cost. All other Investments are stated at fair value based on quoted market prices, in accordance with GASB standards. 60
61 Notes to Financial Statements June 30, 2015 Page 11 Note 3: Cash and Investments (Continued) Local Agency Investment Fund (LAIF) The City maintained investments with the State of California Local Agency Investment Fund (LAIF). The LAIF is an external investment pool sponsored by the State of California. These pooled funds approximate fair value. The administration of the LAIF is provided by the California State Treasurer and regulatory oversight is provided by the Pooled Money Investment Board and the Local Investment Advisory Board. State statutes, bond resolutions, and LAIF investment policy resolutions allow investments in United States government securities, negotiable certificates of deposit, bankers acceptances, commercial paper, corporate bonds, bank notes, mortgage loans and notes, other debt securities, repurchase agreements, reverse repurchase agreements, equity securities, real estate, mutual funds and other investments. The State LAIF pool credit quality is unrated. Cash with Fiscal Agents The City had $13,367,310 funds held by fiscal agents pledged for the payment or security of certain liabilities, bonds and capital leases. The California Government code provides that these monies, in the absence of specific statutory provisions governing the issuance of bonds, certificates, or leases, may be invested in accordance with the ordinance, resolutions, or indentures specifying the types of investments its fiscal agents may make. These ordinances, resolutions, and indentures are generally more restrictive than the City s general investment policy. In no instance have additional types of investments, not permitted by the City s general investment policy, been authorized. Custodial Credit Risk Deposits Custodial credit risk is the risk that in the event of a bank failure, the City s deposits may not be returned to it. The City does not have a formal deposit policy for custodial credit risk in addition to the California Government Code collateral requirements. All deposits held by financial institutions are fully insured or collateralized with securities, held by the pledging financial institutions trust departments in the City s name. For custodial credit risk associated with deposits, the City s policy is to follow the California Government Code which required California financial institutions to secure the City s deposits by pledging government securities as collateral. The market value of the pledge securities must equal 110% of the City s deposits. California law also allows financial institutions to secure City deposits by pledging first trust deed mortgage notes equal to 150% of the City s deposits. Interest Rate Risk The City s formal investment policy does not limit investment maturities as a means of managing its exposure to fair value losses arising from increasing interest rates. However, the City s investment portfolio shall remain sufficiently liquid to enable the City to meet its cash flow requirements. An adequate portion of the portfolio shall be maintained in liquid short term securities which can be converted to cash and guarantee the City s ability to meet operating expenditures. 61
62 Notes to Financial Statements June 30, 2014 Page 12 Note 3: Cash and Investments (Continued) At June 30, 2015, maturities using the segmented time distribution method for those investments requiring disclosure are as follows: Fair Less Than One Month One to Three to Value One Month to One Year Three Years Five Years State LAIF $ 33,341,168 $ 33,341,168 $ $ $ U.S. government securities 19,293,803 2,901,207 16,392,596 Certificates of deposit 2,647, ,863 1,683,106 Total $ 55,282,940 $ 33,341,168 $ $ 3,866,070 $ 18,075,702 Investments held by fiscal agents are structured with maturity dates that correspond to the payment of final debt service of the respective liability. Credit Risk State law limits investments in commercial paper, corporate bonds, and mutual bond funds to the top two ratings issued by nationally recognized statistical rating organizations. The City has no investment policy that would further limit its investment choices. The following identifies the Standard & Poor s credit quality ratings for those investments requiring disclosures as of June 30, 2015: Fair Value AA+ Not Rated State LAIF $ 33,341,168 $ $ 33,341,168 U.S. government securities 19,293,803 19,293,803 Certificates of deposit 2,647,969 2,647,969 Total $ 55,282,940 $ 19,293,803 $ 35,989,137 Concentration of Credit Risk The City s policy places the following limits as a percentage of the City s total portfolio on each investment type: Bankers Acceptances 40% Commercial Paper 15% Medium Term Corporate Notes 25% Negotiable Certificates of Deposit 30% Mutual Funds 10% 62
63 Notes to Financial Statements June 30, 2014 Page 13 Note 3: Cash and Investments (Continued) The City places no limit on the amount the City may invest in any one issuer. The City is unlimited in the amount and percentage of the total portfolio it may invest in Certificates of Deposit. The City s investments in the LAIF represented 46% of total cash and investments at June 30, Investments that exceed 5% of the portfolio by issuer are summarized below: Fair Percent of Value Portfolio Federal Home Loan Mortgage Corp. $ 6,006,160 11% Federal National Mortgage Assoc 5,014,930 9% Federal Farm Credit Banks 3,003,150 5% Federal Home Loan Banks 6,015,740 11% Note 4: Loans Receivable Community Development Loans Receivable Community Development Block Grants provide for low income housing assistance; first time home buyers assistance; and single and multi family rehabilitation loans. The City of Lompoc Single Family Rehabilitation Loan Program (the Program) assists low and moderate income homeowners within the City by providing low interest rate loans for home rehabilitation projects. Loans are collateralized by a Deed of Trust recorded on the property. The Program s goals are to provide income qualified homeowners the opportunity to make home improvements and repairs at minimal cost and allow them to protect and/or increase the value of their investment. The Program is designed to improve the quality of life for low income families and seniors by maintaining and upgrading the City s housing stock. The Program also provides for loans to individuals and other organizations that provide benefits to low income households or neighborhoods. The loans principal and interest amounts are typically deferred and due at maturity. Some loan terms provide for maturity upon the sale of the property. Interest rates range from 0% 5% per annum. At June 30, 2015, the outstanding loans receivable was $1,502,168. Affordable Housing In Lieu Loans Receivable The City established an Affordable Housing In Lieu Fee Program (the Program) to allow a developer of a residential development of ten or more units to elect to pay a fee as an alternative to providing affordable housing units on site, if on site units are determined to be infeasible. The Program was originally established for residential developments located outside the boundaries of the Old Town Lompoc Redevelopment Project Area. At June 30, 2015, the outstanding loans receivable was $206,339. As successor housing agency for the low income housing function of the former redevelopment agency, the City will continue to manage the low and moderate income housing loans. The loans are collateralized by a Deed of Trust recorded on the property. The loans principal and interest amounts are typically deferred and due at maturity. Some of the loans provide for maturity upon the sale of the property. Interest rates range from 0% 5% per annum. At June 30, 2015, the outstanding loans receivable was $2,739,
64 Notes to Financial Statements June 30, 2015 Page 14 Note 4: Loans Receivable (Continued) At June 30, 2015, the aggregate maturities of loans receivable were as follows: Note 5: Capital Assets For the Year Ending June 30, 2016 $ 351, , , , ,902 Thereafter 4,070,602 Total $ 4,448,283 For the year ended June 30, 2015, governmental activities capital assets activity was as follows: Balance Balance 6/30/2014 Additions Deductions Transfers 6/30/2015 Capital assets not being depreciated: Land $ 26,959,352 $ 1,201,752 $ $ $ 28,161,104 Construction in progress 4,421,281 1,580,318 (564,406) 5,437,193 Total capital assets not being depreciated 31,380,633 2,782,070 (564,406) 33,598,297 Capital assets being depreciated: Buildings and improvements 36,006,476 91,743 (181,748) 610,262 36,526,733 Vehicles and equipment 28,723, ,033 (1,495,398) 2,192,461 30,257,674 Infrastructure 76,909,624 1,468, ,479 78,564,395 Total capital assets being depreciated 141,639,678 2,397,068 (1,677,146) 2,989, ,348,802 Less accumulated depreciated for: Buildings and improvements 14,379,707 58,369 (20,905) 616,229 15,033,400 Vehicles and equipment 21,596, ,913 (1,445,613) 1,368,862 21,766,869 Infrastructure 39,422,224 1,983,020 41,405,244 Total accumulated depreciation 75,398,638 2,288,302 (1,466,518) 1,985,091 78,205,513 Total capital assets being depreciated, net 66,241, ,766 (210,628) 1,004,111 67,143,289 Governmental activities capital assets, net $ 97,621,673 $ 2,890,836 $ (210,628) $ 439,705 $ 100,741,586 64
65 Notes to Financial Statements June 30, 2015 Page 15 Note 5: Capital Assets (Continued) Depreciation expense was charged to functions as follows: Governmental activities: Public safety $ 15,327 Transportation 1,857 Leisure, cultural and social services 12,424 Building 54,325 Community development 30,733 General governmental 2,020,818 Depreciation on capital assets held by the City's internal service funds are charged to the various functions based on their usage of the assets 152,818 Total governmental activities depreciation expense $ 2,288,302 Governmental activities capital assets include assets under capital leases. The amount of assets under capital leases included in buildings and improvements was $1,288,036 and in equipment was $842,604, and related accumulated depreciation was $329,165 and $166,540, respectively, as of June 30, For the year ended June 30, 2015, business type capital assets activity was as follows: Balance Balance 6/30/2014 Additions Deductions Transfers 6/30/2015 Capital assets not being depreciated: Land $ 7,146,096 $ $ $ $ 7,146,096 Construction in progress 3,102,369 2,048,065 (32,384) (1,556,795) 3,561,255 Total capital assets not being depreciated 10,248,465 2,048,065 (32,384) (1,556,795) 10,707,351 Capital assets being depreciated: Buildings and improvements 193,106, ,937 (196,576) 1,542, ,305,502 Vehicles and equipment 81,009, ,362 (3,493,880) (1,794,392) 76,613,658 Total capital assets being depreciated 274,116,085 1,745,299 (3,690,456) (251,768) 271,919,160 Less accumulated depreciated for: Buildings and improvements 23,766,146 5,489,467 (165,926) 29,089,687 Vehicles and equipment 76,677,113 3,309,965 (3,345,053) (1,368,858) 75,273,167 Total accumulated depreciation 100,443,259 8,799,432 (3,510,979) (1,368,858) 104,362,854 Total capital assets being depreciated, net 173,672,826 (7,054,133) (179,477) 1,117, ,556,306 Business type activities capital assets, net $ 183,921,291 $ (5,006,068) $ (211,861) $ (439,705) $ 178,263,657 65
66 Notes to Financial Statements June 30, 2015 Page 16 Note 5: Capital Assets (Continued) Depreciation expense was charged to functions as follows: Business type activities: Water $ 1,525,213 Wastewater 4,545,922 Transit 469,162 Electric 1,736,659 Solid Waste 160,421 Airport 148,261 River Park Campground 6,279 Broadband 207,515 Total business type activities depreciation expense $ 8,799,432 Business type activities capital assets include assets under capital leases. The amount of assets under capital leases included in buildings and structures was $2,915,638 and in equipment was $3,840,117, and related accumulated depreciation was $745,108 and $1,404,620, respectively, as of June 30, Note 6: Long Term Liabilities For the year ended June 30, 2015, governmental activities long term liability activity was as follows: Balance Balance Due Within 6/30/2014 Additions Deductions 6/30/2015 One Year 2004 tax allocation bonds $ 2,200,000 $ $ 65,000 $ 2,135,000 $ 70,000 Capital leases payable 5,177, ,763 4,423, ,555 Claims liabilities 6,584, , ,895 6,798,000 1,280,001 Compensated absences 2,045,073 2,143, ,911 3,475,306 Total $ 16,006,945 $ 2,980,037 $ 2,155,569 $ 16,831,413 $ 1,970,556 See Note 11 for detail of estimated claims liabilities, which are included in other liabilities on the government wide statement of net position Tax Allocation Bonds During the year ended June 30, 2004, tax allocation bonds in the amount of $9,955,000 were issued to finance the construction and maintenance of the Aquatic Center, park improvements and other capital improvements. The City has pledged its tax increment and property assessment for the repayment of the bonds. The City s former Redevelopment Agency secured $7,350,000 of the issue amount from future tax increment while the City s Park Maintenance and City Pool Assessment District secured the remaining amount of $2,605,000 from annual property 66
67 Notes to Financial Statements June 30, 2015 Page 17 Note 6: Long Term Liabilities (Continued) assessments. The portion of the bonds related to the former Redevelopment Agency has been transferred to the Successor Agency Trust Fund as of February 1, See Note 17. The bonds bear interest rates from 2.75 to 4.85%. Principal and interest payments are due each March 2 and September 2 through September 2, At June 30, 2015, the principal balance outstanding on the City s portion of the bonds was $2,135,000. At June 30, 2015, the aggregate maturities of the 2004 tax allocation bonds were as follows: For the Year Ending June 30, Principal Interest Total 2016 $ 70,000 $ 96,424 $ 166, ,000 93, , ,000 90, , ,000 87, , ,000 84, , , , , , , , ,000 92, ,118 Total $ 2,135,000 $ 1,160,687 $ 3,295,687 Capital Leases Payable The City leases vehicles and equipment under capital leases that expire through September At June 30, 2015, future minimum payments on capital leases were as follows: For the Year Ending June 30, 2016 $ 719, , , , ,812 Thereafter 1,929,078 Total minimum lease payments 4,979,307 Less amounts representing interest (556,200) Principal portion of capital lease obligation 4,423,107 Less current principal portion (620,555) Capital lease obligation, net of current portion $ 3,802,552 67
68 Notes to Financial Statements June 30, 2015 Page 18 Note 6: Long Term Liabilities (Continued) For the year ended June 30, 2015, business type activities long term debt activity was as follows: Balance Balance Due Within 6/30/2014 Additions Deductions 6/30/2015 One Year 1998 revenue bonds $ 5,150,000 $ $ 385,000 $ 4,765,000 $ 405, revenue bonds 13,735, ,000 13,310, , revenue bonds 14,825, ,000 14,425, ,000 33,710,000 1,210,000 32,500,000 1,255,000 Less: Unamortized bond discount (223,160) 10,169 (212,991) Total revenue bonds 33,486,840 1,220,169 32,287,009 1,255,000 Wastewater state loan payable 63,248,317 3,449,528 59,798,789 3,511,199 Water loan payable 14,849 6,548 8,301 6,875 Capital leases payable 3,443, ,633 3,031, ,546 Landfill closure and post closure costs 5,681, ,918 5,841,167 Compensated absences 31,501 1,255,636 1,287,137 Total $ 105,905,921 $ 1,415,554 $ 6,375,015 $ 100,966,798 $ 5,143,620 Revenue Bonds 1998 Water and Wastewater Revenue Bonds On July 7, 1998, revenue bonds in the amount of $9,535,000 were issued. Of this bond issue, $4,470,000 was used to finance various water capital projects and the remaining amount of $5,065,000 was used to advance refund the 1992 Water and Wastewater Revenue Bonds. The advance refunding resulted in a difference of $656,970 between the reacquisition price and the net carrying amount of the old debt. This unamortized loss on refunding is reported in the accompanying financial statements as deferred outflows of financial resources and is being amortized as additional interest expense through the year 2022 using the straight line method and was $191,616 as of June 30, The City completed the advance refunding to reduce its total debt service payments by $822,744 and to obtain an economic gain (difference between the present value of the old debt and the new debt service payments) of $497,677. The bonds bear interest from 3.50 to 5.00% and are due in semi annual installments on March 1 and September 1 through March 1, At June 30, 2015, the principal amount outstanding on the bonds was $4,765, Water and Wastewater Revenue Bonds On March 22, 2005, revenue bonds in the amount of $16,970,000 were issued to finance various water and wastewater capital projects. The bonds bear interest from 3.50 to 4.50% and are due in annual installments on March 1 through March 1, The bonds were issued at a discount of $109,605 which is reported in the accompanying financial statements as a deduction from bonds payable and is being charged to operations as 68
69 Notes to Financial Statements June 30, 2015 Page 19 Note 6: Long Term Liabilities (Continued) amortization expense through the year At June 30, 2015, the principal amount outstanding on the bonds was $13,310,000 and the unamortized bond discount was $56, Water and Wastewater Revenue Bonds On February 14, 2007, revenue bonds in the amount of $17,080,000 were issued. Of this bond issue, $14,545,000 was used to finance a portion of the Wastewater Treatment Plant Upgrade and the remainder was used to finance a water capital project. The bonds bear interest from 3.75 to 4.375% and are due in annual installments on March 1 through March 1, The bonds were issued at a discount of $195,452 which is reported in the accompanying financial statements as a deduction from bonds payable and is being charged to operations as amortization expense through the year At June 30, 2015, the principal balance outstanding on the bonds was $14,425,000 and the unamortized bond discount was $156,274. At June 30, 2015, the aggregate maturities of the revenue bonds were as follows: For the Year Ending June 30, Principal Interest Total 2016 $ 1,255,000 $ 1,444,767 $ 2,699, ,310,000 1,392,437 2,702, ,370,000 1,336,324 2,706, ,420,000 1,277,024 2,697, ,480,000 1,215,574 2,695, ,365,000 5,083,344 12,448, ,720,000 3,766,554 11,486, ,635,000 2,009,025 10,644, ,945, ,425 2,249,425 Total $ 32,500,000 $ 17,829,474 $ 50,329,474 Wastewater State Loan Payable On May 3, 2007, the City executed a contract and obtained financing for the Wastewater Treatment Plant Upgrade project from the State Water Resources Control Board (SWRCB). Proceeds borrowed during the construction phase that were converted to the loan payable were $76,337,875. Under the terms of the agreement, the loan was considered to be interest free during the construction phase with a required matching portion of $15,267,940 which was equal to % of the total estimated cost of the project. The total repayment obligation, including imputed interest, to the SWRCB loan is $91,605,815. Repayments on the loan began during the year ended June 30, 2011 and are equal annual payments of $4,580,291 through The imputed interest rate on the loan is approximately 1.77%. At June 30, 2015, the principal balance outstanding was $59,798,
70 Notes to Financial Statements June 30, 2015 Page 20 Note 6: Long Term Liabilities (Continued) At June 30, 2015, the aggregate maturities of the wastewater state loan payable were as follows: Water Loan Payable For the Year Ending June 30, Principal Interest Total 2016 $ 3,511,199 $ 1,069,092 $ 4,580, ,573,973 1,006,318 4,580, ,637, ,422 4,580, ,702, ,383 4,580, ,769, ,182 4,580, ,880,732 3,020,722 22,901, ,723,001 1,178,877 22,901,878 Total $ 59,798,789 $ 8,905,996 $ 68,704,785 During the year ended June 30, 1997, the City obtained a loan payable of $124,000 from the State for construction of a wet well. The loan is due in annual installments of principal and interest of $7,290 at 5% interest per annum through At June 30, 2015, the principal balance outstanding was $8,301. At June 30, 2015, the aggregate maturities of the water loan payable were as follows: Capital Leases Payable For the Year Ending June 30, 2016 $ 6, ,426 Total $ 8,301 The City leases vehicles and equipment under capital leases that expire through June At June 30, 2015, future minimum payments on capital leases were as follows: For the Year Ending June 30, 2016 $ 444, , , , ,319 Thereafter 1,678,850 Total minimum lease payments 3,499,008 Less amounts representing interest (467,476) Principal portion of capital lease obligation 3,031,532 Less current principal portion (370,546) Capital lease obligation, net of current portion $ 2,660,986 70
71 Notes to Financial Statements June 30, 2015 Page 21 Note 6: Long Term Liabilities (Continued) Landfill Closure and Post Closure Costs State and federal laws and regulations require the City to place a final cover on its sanitary landfill site when it stops accepting waste and to perform certain maintenance and monitoring functions at the site for thirty years after closure. Although closure and post closure costs will be paid only near or after the date that the landfill stops accepting waste, the City reports a portion of these closure and post closure care costs as an operating expense in each period based on landfill capacity used as of each balance sheet date. Landfill closure and post closure care liability of $5,841,167 at June 30, 2015 represents the cumulative amount to date based on the use of 23.2 percent of the estimated capacity of the landfill. This amount is based on what it would cost to perform all closure and postclosure care in The City expects to close the landfill in the year Actual costs may be higher due to inflation, changes in technology, or changes in regulations. The City is required by state and federal laws and regulations to make annual contributions to a reserve account to finance closure and post closure care. The City is in compliance with these requirements, and at June 30, 2015, restricted net position in the amount of $2,288,764 was designated for these purposes. The City expects that future inflation costs will be paid from interest earnings on these annual contributions. However, if interest earnings are inadequate or additional post closure care requirements are determined (due to changes in technology or applicable laws or regulations, for example), these costs may need to be covered by charges to future landfill users. Note 7: Pension Plans The City contributes to the California Public Employees Retirement System (CalPERS) for its employees. The City participates in one agent multiple employer plan for its miscellaneous employees (Miscellaneous Plan) and five cost sharing employer plans for its safety employees (Safety Plans). The Miscellaneous Plan is described in the first section of the footnote under Agent Multiple Employer Plan and the Safety Plans follow and are described in the second section of the footnote under Cost Sharing Employer Plans. The portion of the Miscellaneous Plan that has been allocated to the Successor Agency Trust Fund, an Agency Fund, is included in the Miscellaneous Plan summaries in this footnote. A summary of the government wide balances for all Plans at June 30, 2015 are as follows: Net Pension Deferred Outflows Deferred Inflows Liability of Resources of Resources Miscellaneous Plan $ 36,325,346 $ 3,245,246 $ 6,463,093 Safety Plans 19,193,402 2,017,535 3,141,622 Less: Successor Agency Fund (101,321) (9,052) (18,028) Total Government Wide $ 55,417,427 $ 5,253,729 $ 9,586,687 71
72 Notes to Financial Statements June 30, 2015 Page 22 Note 7: Pension Plans (Continued) Agent Multiple Employer Plan General Information about the Pension Plans Plan Descriptions. As noted above, the City contributes to CalPERS for a defined benefit pension plan for all qualified permanent and probationary employees. CalPERS acts as a common investment and administrative agent for its participating member employers. Benefit provisions under the Plan is established by State statute and City resolution. CalPERS issues publicly available reports that include a full description of the pension plans regarding benefit provisions, assumptions and membership information that can be found on the CalPERS website. Benefits Provided. CalPERS provides service retirement and disability benefits, annual cost of living adjustments and death benefits to plan members, who must be public employees and beneficiaries. Benefits are based on years of credited service, equal to one year of full time employment. Members with five years of total service are eligible to retire at age 50 with statutorily reduced benefits. All members are eligible for non duty disability benefits after 10 years of service. The death benefit is one of the following: the Basic Death Benefit, the 1957 Survivor Benefit, or the Optional Settlement 2W Death Benefit. The cost of living adjustments for the plan are applied as specified by the Public Employees Retirement Law. The Miscellaneous Plan s provisions and benefits in effect at June 30, 2015, are summarized as follows: Miscellaneous Prior to November 19, 2011 to On or after Hire date November 19, 2011 December 31, 2012 January 1, 2013 Benefit formula Benefit vesting schedule 5 years service 5 years service 5 years service Benefit payments monthly for life monthly for life monthly for life Retirement age Monthly benefits, as a % of eligible compensation 2.0% to 2.7% 1.092% to 2.418% 1.0% to 2.5% Required employee contribution rates 8% 7% 6.25% Required employer contribution rates % % % While the City s Miscellaneous Plan is not closed to new entrants, the component option of 55 is closed to new entrants. Classic Members as defined by CalPERS entering the City s Miscellaneous Plan would enter the 60 option while New Members as defined by CalPERS entering the City s Miscellaneous Plan would enter the 62 option. 72
73 Notes to Financial Statements June 30, 2015 Page 23 Note 7: Pension Plans (Continued) Employees Covered. At June 30, 2015, the following employees were covered by the benefit terms for the Miscellaneous Plan: Miscellaneous Inactive employees or beneficiaries currently receiving benefits 295 Inactive employees entitled to but not yet receiving benefits 181 Active employees 285 Total 761 Contributions. Section 20814(c) of the California Public Employees Retirement Law requires that the employer contribution rates for all public employers be determined on an annual basis by the actuary and shall be effective on the July 1 following notice of a change in the rate. Funding contributions for the Plan are determined annually on an actuarial basis as of June 30 by CalPERS. The actuarially determined rate is the estimated amount necessary to finance the costs of benefits earned by employees during the year, with an additional amount to finance any unfunded accrued liability. The City is required to contribute the difference between the actuarially determined rate and the contribution rate of employees. Net Pension Liability The City s net pension liability for the Miscellaneous Plan is measured as the total pension liability, less the pension plan s fiduciary net position. The net pension liability of the Plan is measured as of June 30, 2014, using an annual actuarial valuation as of June 30, 2013 rolled forward to June 30, 2014 using standard update procedures. A summary of principal assumptions and methods used to determine the net pension liability is shown below. 73
74 Notes to Financial Statements June 30, 2015 Page 24 Note 7: Pension Plans (Continued) Actuarial Assumptions. The total pension liabilities in the June 30, 2013 actuarial valuations were determined using the following actuarial assumptions: Miscellaneous Valuation Date June 30, 2013 Measurement Date June 30, 2014 Actuarial Cost Method Entry Age Normal Cost Method Actuarial Assumptions: Discount Rate 7.50% Inflation 2.75% Payroll Growth Varies by Entry Age and Service Projected Salary Increase 3.3% 14.2% (1) Investment Rate of Return 7.50% (2) Mortality (3) (1) Depending on age, service and type of employment. (2) Net of pension plan investment expenses, including inflation. (3) Derived using CalPERS' Membership Data for all Funds. The underlying mortality assumptions and all other actuarial assumptions used in the June 30, 2013 valuation were based on the results of a January 2014 actuarial experience study for the period 1997 to Further details of the Experience Study can found on the CalPERS website. Discount Rate. The discount rate used to measure the total pension liability was 7.50% for the Plan. To determine whether the municipal bond rate should be used in the calculation of a discount rate for each plan, CalPERS stress tested plans that would most likely result in a discount rate that would be different from the actuarially assumed discount rate. Based on the testing, none of the tested plans run out of assets. Therefore, the current 7.50% discount rate is adequate and the use of the municipal bond rate calculation is not necessary. The long term expected discount rate of 7.50% will be applied to all plans in the Public Employees Retirement Fund (PERF). The stress test results are presented in a detailed report that can be obtained from the CalPERS website. According to Paragraph 30 of Statement 68, the long term discount rate should be determined without reduction for pension plan administrative expense. The 7.50% investment return assumption used in this accounting valuation is net of administrative expenses. Administrative expenses are assumed to be 15 basis points. An investment return excluding administrative expenses would have been 7.65%. Using this lower discount rate has resulted in a slightly higher Total Pension Liability and Net Pension Liability. CalPERS checked the materiality threshold for the difference in calculation and did not find it to be a material difference. 74
75 Notes to Financial Statements June 30, 2015 Page 25 Note 7: Pension Plans (Continued) CalPERS is scheduled to review all actuarial assumptions as part of its regular Asset Liability Management (ALM) review cycle that is scheduled to be completed in February Any changes to the discount rate will require Board action and proper stakeholder outreach. For these reasons, CalPERS expects to continue using a discount rate net of administrative expenses for GASB 67 and 68 calculations through at least the fiscal year. CalPERS will continue to check the materiality of the difference in calculation until such time as we have changed our methodology. The long term expected rate of return on pension plan investments was determined using a building block method in which best estimate ranges of expected future real rates of return (expected returns, net of pension plan investment expense and inflation) are developed for each major asset class. In determining the long term expected rate of return, CalPERS took into account both short term and long term market return expectations as well as the expected pension fund cash flows. Using historical returns of all the funds asset classes, expected compound returns were calculated over the short term (first 10 years) and the long term (11 60 years) using a building block approach. Using the expected nominal returns for both short term and long term, the present value of benefits was calculated for each fund. The expected rate of return was set by calculating the single equivalent expected return that arrived at the same present value of benefits for cash flows as the one calculated using both short term and long term returns. The expected rate of return was then set equivalent to the single equivalent rate calculated above and rounded down to the nearest one quarter of one percent. The table below reflects the long term expected real rate of return by asset class. The rate of return was calculated using the capital market assumptions applied to determine the discount rate and asset allocation. These rates of return are net of administrative expenses. Miscellaneous New Strategic Real Return Real Return Asset Class Allocation Years 1 10 (a) Years 11+ (b) Global equity 47.0% 5.25% 5.71% Global fixed income 19.0% 0.99% 2.43% Inflation sensitive 6.0% 0.45% 3.36% Private equity 12.0% 6.83% 6.95% Real estate 11.0% 4.50% 5.13% Infrastructure and forestland 3.0% 4.50% 5.09% Liquidity 2.0% 0.55% 1.05% Total 100% (a) An expected inflation of 2.5% used for this period (b) An expected inflation of 3.0% used for this period. 75
76 Notes to Financial Statements June 30, 2015 Page 26 Note 7: Pension Plans (Continued) Changes in the Net Pension Liability The changes in the Net Pension Liability for the Miscellaneous Plan follows: Plan Net Total Fiduciary Pension Pension Net Liability/ Liability Position (Asset) Balance at June 30, 2013 $ 154,351,715 $ 108,957,411 $ 45,394,304 Changes during the year: Service cost incurred 2,970,875 2,970,875 Interest on total pension liability 11,428,244 11,428,244 Contributions employer 3,289,224 (3,289,224) Contributions employee 1,343,721 (1,343,721) Projected earnings on investments 18,835,132 (18,835,132) Benefit payments (6,921,136) (6,921,136) Total current year changes: 7,477,983 16,546,941 (9,068,958) Balance at June 30, 2014 $ 161,829,698 $ 125,504,352 $ 36,325,346 Sensitivity of the Net Pension Liability to Changes in the Discount Rate. The following presents the net pension liability of the City for the Miscellaneous Plan, calculated using the discount rate for the Miscellaneous Plan, as well as what the City s net pension liability would be if it were calculated using a discount rate that is 1 percentage point lower or 1 percentage point higher than the current rate: Miscellaneous 1% Decrease 6.50% Net Pension Liability $ 57,241,911 Current Discount Rate 7.50% Net Pension Liability $ 36,325,346 1% Increase 8.50% Net Pension Liability $ 18,950,491 Pension Plan Fiduciary Net Position. Detailed information about the pension plan s fiduciary net position is available in the separately issued CalPERS financial reports. 76
77 Notes to Financial Statements June 30, 2015 Page 27 Note 7: Pension Plans (Continued) Pension Expenses and Deferred Outflows/Inflows of Resources Related to Pensions For the year ended June 30, 2015, the City s pension expense for the Miscellaneous Plan was $683,359, of which $676,214 was recognized pension expense for the City and $7,145 was recognized as pension expense for the Successor Agency Trust Fund. At June 30, 2015, the City reported deferred outflows of resources and deferred inflows of resources related to pensions from the following sources: Miscellaneous Deferred Outflows Deferred Inflows of Resources of Resources Pension contributions subsequent to measurement date $ 3,245,246 $ Net differences between projected and actual earnings on plan investments $ (6,463,093) Total $ 3,245,246 $ (6,463,093) The deferred outflows of resources related to contributions subsequent to the measurement date of $3,245,246 will be recognized as a reduction of the net pension liability in the year ended June 30, Other amounts reported as deferred outflows of resources and deferred inflows of resources related to pensions will be recognized as pension income as follows: Miscellaneous Year Ended June 30 Amount 2016 $ (2,154,365) 2017 (2,154,365) 2018 (2,154,363) $ (6,463,093) Payable to the Pension Plan At June 30, 2015, the City reported a payable of $0 for the outstanding amount of contributions to the pension plan required for the year ended June 30,
78 Notes to Financial Statements June 30, 2015 Page 28 Note 7: Pension Plans (Continued) Cost Sharing Employer Plans General Information about the Pension Plans Plan Descriptions. As noted above, the City contributes to CalPERS for a defined benefit pension plan for all qualified permanent and probationary employees. CalPERS acts as a common investment and administrative agent for its participating member employers. Benefit provisions under the Plan is established by State statute and City resolution. CalPERS issues publicly available reports that include a full description of the pension plans regarding benefit provisions, assumptions and membership information that can be found on the CalPERS website. The City participates in five safety cost sharing multiple employer plans. The Safety Plans consist of Police and Fire Tier 1, Police Tier 2, Fire Tier 2, Police PEPRA and Fire PEPRA. Benefits Provided. CalPERS provides service retirement and disability benefits, annual cost of living adjustments and death benefits to plan members, who must be public employees and beneficiaries. Benefits are based on years of credited service, equal to one year of full time employment. Members with five years of total service are eligible to retire at age 50 with statutorily reduced benefits. All members are eligible for non duty disability benefits after 10 years of service. The death benefit is one of the following: the Basic Death Benefit, the 1957 Survivor Benefit, or the Optional Settlement 2W Death Benefit. The cost of living adjustments for each plan are applied as specified by the Public Employees Retirement Law. The Plans provisions and benefits in effect at June 30, 2015, are summarized as follows: Police Tier 1 Fire Tier 1 Police Tier 2 Prior to Prior to November 19, 2011 to Hire date November 19, 2011 September 24, 2011 December 31, 2012 Benefit formula Benefit vesting schedule 5 years service 5 years service 5 years service Benefit payments monthly for life monthly for life monthly for life Retirement age Monthly benefits, as a % of eligible compensation 3.00% 3.00% 2.4% to 3.0% Required employee contribution rates 9% 9% 9% Required employer contribution rates % % % 78
79 Notes to Financial Statements June 30, 2015 Page 29 Note 7: Pension Plans (Continued) Fire Tier 2 Police & Fire PEPRA September 24, 2011 to On or after Hire date December 31, 2012 January 1, 2013 Benefit formula Benefit vesting schedule 5 years service 5 years service Benefit payments monthly for life monthly for life Retirement age Monthly benefits, as a % of eligible compensation 2.4% to 3.0% 2.0% to 2.7% Required employee contribution rates 9% 12.25% Required employer contribution rates % % The Police Pooled Plan effective prior to November 19, 2011 and the Fire Pooled Plan effective prior to September 24, 2011 are closed to new entrants. Contributions. Section 20814(c) of the California Public Employees Retirement Law requires that the employer contribution rates for all public employers be determined on an annual basis by the actuary and shall be effective on the July 1 following notice of a change in the rate. Funding contributions for both Plans are determined annually on an actuarial basis as of June 30 by CalPERS. The actuarially determined rate is the estimated amount necessary to finance the costs of benefits earned by employees during the year, with an additional amount to finance any unfunded accrued liability. The City is required to contribute the difference between the actuarially determined rate and the contribution rate of employees. For the year ended June 30, 2015, the contributions recognized as part of pension expense for each Plan were as follows: Police & Fire Police Fire Police Fire Tier 1 Tier 2 Tier 2 PEPRA PEPRA Contributions employer $ 1,585,168 $ 73,029 $ 64,569 $ $ 54,128 Pension Liabilities, Pension Expenses and Deferred Outflows/Inflows of Resources Related to Pensions As of June 30, 2015, the City reported net pension liabilities for its proportionate shares of the net pension liability of each Plan as follows: Proportionate Share of Net Pension Liability Police & Fire Police Fire Police Fire Tier 1 Tier 2 Tier 2 PEPRA PEPRA Plan's Proportionate Share of the Net Pension Liability $ 19,162,419 $ 10,139 $ 17,769 $ $ 3,075 79
80 Notes to Financial Statements June 30, 2015 Page 30 Note 7: Pension Plans (Continued) The City s net pension liability for each Plan is measured as the proportionate share of the net pension liability. The net pension liability of each of the Plans is measured as of June 30, 2014, and the total pension liability for each Plan used to calculate the net pension liability was determined by an actuarial valuation as of June 30, 2013 rolled forward to June 30, 2014 using standard update procedures. The City s proportion of the net pension liability was based on a projection of the City s long term share of contributions to the pension plans relative to the projected contributions of all participating employers, actuarially determined. The City s proportionate share of the net pension liability for each Plan as of June 30, 2013 and 2014 was as follows: Proportionate Share of Net Pension Liability Police & Fire Police Fire Police Fire Proportionate share Tier 1 Tier 2 Tier 2 PEPRA PEPRA Percentage share at 6/30/ % % % % % Percentage share at 6/30/ % % % % % Change Increase/(Decrease) % % % % % For the year ended June 30, 2015, the City recognized pension expense of $505,211 for the Safety Plans. At June 30, 2015, the City reported deferred outflows of resources and deferred inflows of resources related to pensions for all Safety Plans from the following sources: Deferred Outflows Deferred Inflows of Resources of Resources Pension contributions subsequent to measurement date $ 1,784,713 $ Change in employer's proportion and differences between the employer's contributions and the employer's proportionate share of contributions 138,440 (50,340) Net differences between projected and actual earnings on plan investments (3,025,356) Adjustment due to differences in proportions 94,382 (65,926) Total $ 2,017,535 $ (3,141,622) Pension contributions subsequent to the measurement date of $1,784,713 are reported as deferred outflows of resources and will be recognized as a reduction of the net pension liability in the year ended June 30, Other amounts reported as deferred outflows of resources and deferred inflows of resources related to pensions will be recognized as pension income for all Safety Plans as follows: Year Ended June 30 Amount 2016 $ (961,181) 2017 (964,337) 2018 (983,282) $ (2,908,800) 80
81 Notes to Financial Statements June 30, 2015 Page 31 Note 7: Pension Plans (Continued) Actuarial Assumptions. The total pension liabilities in the June 30, 2013 actuarial valuations for all Safety Plans were determined using the following actuarial assumptions: Valuation Date June 30, 2013 Measurement Date June 30, 2014 Actuarial Cost Method Entry Age Normal Cost Method Actuarial Assumptions: Discount Rate 7.50% Inflation 2.75% Payroll Growth Varies by Entry Age and Service Projected Salary Increase 3.3% 14.2% (1) Investment Rate of Return 7.50% (2) Mortality (3) (1) Depending on age, service and type of employment. (2) Net of pension plan investment expenses, including inflation. (3) Derived using CalPERS' Membership Data for all Funds. The mortality table used was developed based on CalPERS specific data. The table includes 20 years of mortality improvements using Society of Actuaries Scale BB. For more details on this table, please refer to the 2014 experience study report. All other actuarial assumptions used in the June 30, 2013 valuation were based on the results of a January 2014 actuarial experience study for the period 1997 to Further details of the Experience Study can found on the CalPERS website. Discount Rate. The discount rate used to measure the total pension liability was 7.50% for each Plan. To determine whether the municipal bond rate should be used in the calculation of a discount rate for each plan, CalPERS stress tested plans that would most likely result in a discount rate that would be different from the actuarially assumed discount rate. Based on the testing, none of the tested plans run out of assets. Therefore, the current 7.50% discount rate is adequate and the use of the municipal bond rate calculation is not necessary. The long term expected discount rate of 7.50 % will be applied to all plans in the Public Employees Retirement Fund (PERF). The stress test results are presented in a detailed report that can be obtained from the CalPERS website. According to Paragraph 30 of Statement 68, the long term discount rate should be determined without reduction for pension plan administrative expense. The 7.50% investment return assumption used in this accounting valuation is net of administrative expenses. Administrative expenses are assumed to be 15 basis points. An investment return excluding administrative expenses would have been 7.65%. Using this lower discount rate has resulted in a slightly higher Total Pension Liability and Net Pension Liability. CalPERS checked the materiality threshold for the difference in calculation and did not find it to be a material difference. 81
82 Notes to Financial Statements June 30, 2015 Page 32 Note 7: Pension Plans (Continued) CalPERS is scheduled to review all actuarial assumptions as part of its regular Asset Liability Management (ALM) review cycle that is scheduled to be completed in February Any changes to the discount rate will require Board action and proper stakeholder outreach. For these reasons, CalPERS expects to continue using a discount rate net of administrative expenses for GASB 67 and 68 calculations through at least the fiscal year. CalPERS will continue to check the materiality of the difference in calculation until such time as we have changed our methodology. The long term expected rate of return on pension plan investments was determined using a building block method in which best estimate ranges of expected future real rates of return (expected returns, net of pension plan investment expense and inflation) are developed for each major asset class. In determining the long term expected rate of return, CalPERS took into account both short term and long term market return expectations as well as the expected pension fund cash flows. Using historical returns of all the funds asset classes, expected compound returns were calculated over the short term (first 10 years) and the long term (11 60 years) using a building block approach. Using the expected nominal returns for both short term and long term, the present value of benefits was calculated for each fund. The expected rate of return was set by calculating the single equivalent expected return that arrived at the same present value of benefits for cash flows as the one calculated using both short term and long term returns. The expected rate of return was then set equivalent to the single equivalent rate calculated above and rounded down to the nearest one quarter of one percent. The table below reflects the long term expected real rate of return by asset class for all Safety Plans. The rate of return was calculated using the capital market assumptions applied to determine the discount rate and asset allocation. These rates of return are net of administrative expenses. New Strategic Real Return Real Return Asset Class Allocation Years 1 10 (a) Years 11+ (b) Global equity 47.0% 5.25% 5.71% Global fixed income 19.0% 0.99% 2.43% Inflation sensitive 6.0% 0.45% 3.36% Private equity 12.0% 6.83% 6.95% Real estate 11.0% 4.50% 5.13% Infrastructure and forestland 3.0% 4.50% 5.09% Liquidity 2.0% 0.55% 1.05% Total 100% (a) An expected inflation of 2.5% used for this period (b) An expected inflation of 3.0% used for this period. 82
83 Notes to Financial Statements June 30, 2015 Page 33 Note 7: Pension Plans (Continued) Sensitivity of the Proportionate Share of the Net Pension Liability to Changes in the Discount Rate. The following presents the City s proportionate share of the net pension liability for each Plan, calculated using the discount rate for each Plan, as well as what the City s proportionate share of the net pension liability would be if it were calculated using a discount rate that is 1 percentage point lower or 1 percentage point higher than the current rate: Police & Fire Police Fire Police Fire Tier 1 Tier 2 Tier 2 PEPRA PEPRA 1% Decrease 6.50% 6.50% 6.50% 6.50% 6.50% Net Pension Liability $ 29,552,248 $ 17,448 $ 30,578 $ $ 5,291 Current Discount Rate 7.50% 7.50% 7.50% 7.50% 7.50% Net Pension Liability $ 19,162,419 $ 10,139 $ 17,769 $ $ 3,075 1% Increase 8.50% 8.50% 8.50% 8.50% 8.50% Net Pension Liability $ 10,601,649 $ 4,116 $ 7,215 $ $ 1,248 Pension Plan Fiduciary Net Position. Detailed information about each safety plan s fiduciary net position is available in the separately issued CalPERS financial reports. Payable to the Pension Plan At June 30, 2015, the City reported a payable of $0 for the outstanding amount of contributions to the pension plan required for the year ended June 30, Note 8: Other Post Employment Benefits Plan Description The City s primary other post employment benefits (OPEB) cost obligation is for retiree health benefits under its election to participate in the California Public Employees Retirement System (PERS) Health Benefit Program, an agent multiple employer defined benefit OPEB plan, under the unequal contribution option. The City entered the PERS medical insurance program in 2000 under the Public Employees Medical and Hospital Care Act (PEMHCA). The required employer contribution was $122 per month in In addition to the pension benefits described in Note 7, the City provides post employment health care insurance, in accordance with Memorandums of Understanding, to all employees who retire from the City on or after attaining age 55 with at least 15 years of service. Currently, 100 retirees meet those eligibility requirements. The City pays a 83
84 Notes to Financial Statements June 30, 2015 Page 34 Note 8: Other Post Employment Benefits (Continued) percentage of the cost incurred by pre Medicare retirees, toward health and dental insurance, beginning with 50% with 15 years of service and increasing 2.5% with each year, to a maximum of 75% with 25 years of service. The City also reimburses a fixed amount up to $100 per month for a Medicare supplement for the 42 retirees eligible for Medicare. During the fiscal year ended June 30, 2009, the City entered into an agreement with California Employers Retiree Benefit Trust (CERBT) to pre fund the City s OPEB liability. Funding Policy The contribution requirements of the plan members and the City are established and may be amended by the City. The City prefunds the plan through CERBT by contributing at least 100% of the annual required contribution. The City s annual OPEB cost (expense) is calculated based upon the annual required contribution (ARC), an amount actuarially determined in accordance with the parameters of GASB Statement No. 45. The City s ARC represents a level of funding that, if paid on an ongoing basis, is projected to cover the normal cost each year and amortize the unfunded actuarial liability over a period of 30 years. The ARC for the fiscal year was $1,073,000. For the fiscal year , the City contributed $1,682,084 to the Plan. The City paid $609,084 to the PERS Health Benefit Program or directly to retirees during the year, and did not request reimbursement for eligible costs paid under this plan. The expenditure of $1,073,000 represented the City s contributions to the Plan on a pay as you go basis. CERBT is a tax qualified irrevocable trust organized under Internal Revenue Code Section 115 and established to prefund retiree healthcare benefits. CERBT issues a publicly available financial report including GASB Statement No. 43 disclosure information in aggregate with other CERBT participating employers. That report may be obtained by contacting PERS, 400 P Street, Sacramento, California
85 Notes to Financial Statements June 30, 2015 Page 35 Note 8: Other Post Employment Benefits (Continued) Annual OPEB Cost and Net OPEB Obligation The following table shows the components of the City s annual OPEB cost, the actual amount contributed to the plan, and changes in the City s OPEB obligation: Annual Required Contributions $ 1,073,000 Interest on Net OPEB Obligation Adjustment to Annual Required Contributions Annual OPEB cost 1,073,000 Contributions made (1,682,084) Change in net OPEB obligation (609,084) Net OPEB obligation beginning of year (634,202) Net OPEB obligation end of year $ (1,243,286) The City Retiree Medical annual OPEB cost, the percentage of annual OPEB cost contributed to the plan, and the net OPEB obligation for the years ended June 30, 2013, 2014, and 2015 (in thousands) were as follows: Percentage of Net OPEB Fiscal Year Annual Annual Annual OPEB (Prepayment)/ Ended OPEB Cost Contribution Cost Contributed Obligation 6/30/13 $ 1,303 $ 1, % 6/30/14 $ 1,346 $ 1, % (634) 6/30/15 $ 1,073 $ 1, % (1,243) Funded Status and Funding Progress The funded status of the plan of June 30, 2013, the plan s most recent actuarial valuation date (in thousands), was as follows : Actuarial accrued liability (AAL) $ 12,809 Actuarial value of plan assets 3,182 Unfunded ALL (UALL) $ 9,627 Funded ratio 24.8% Covered payroll $ 20,762 UAAL as a percentage of covered payroll 46.4% Actuarial valuations of an ongoing plan involve estimates of the value of reported amounts and assumptions about the probability of occurrence of events far into the future. Examples include assumptions about future employment, mortality, and the healthcare cost trend. Amounts determined regarding the funded status of the plan and the annual required contributions of the employer are subject to continual revision as actual results are compared with past expectations and new estimates are made about the future. 85
86 Notes to Financial Statements June 30, 2015 Page 36 Note 8: Other Post Employment Benefits (Continued) The schedule of funding progress is presented as required supplementary information following the notes to the financial statements. The schedule presents multiyear trend information about whether the actuarial value of Plan assets is increasing or decreasing over time relative to the actuarial liability for benefits. Actuarial Methods and Assumptions Projections of benefits for financial reporting purposes are based on the substantive plan (the plan as understood by the employer and the plan members) and include the types of benefits provided at the time of each valuation and the historical pattern of sharing of benefit costs between the employer and plan members to that point. The actuarial methods and assumptions used include techniques that are designed to reduce the effects of short term volatility in actuarial accrued liabilities and the actuarial value of assets, consistent with the long term perspective of the calculations. In the June 30, 2013 actuarial valuation, the entry age normal actuarial cost method was used. The actuarial assumptions included a 7.25% investment rate of return (net of administrative expenses), which is the expected longterm investment return on CERBT investments and a 3.25% inflation assumption. The initial health care cost trend rates were 5.0 to 8.3% and the ultimate rate was 4.5%. The actuarial value of assets is equal to the market value. The unfunded actuarial accrued liability (UAAL) is being amortized as a level percentage of projected payroll over 30 years on a closed basis. The remaining amortization period at June 30, 2015 was 24 years. Note 9: Interfund Transactions Interfund Receivables and Payables (Due to/due From) Interfund receivables and payables include temporary negative cash balances that result from the timing of cash flows at year end and the time lag between the dates that transactions are recorded in the accounting system and payment between funds are made. Liquidation of interfund receivables and payables typically occurs in the first quarter of the subsequent fiscal year. Interfund balances between governmental funds are not included in the government wide statement of Net Position. 86
87 Notes to Financial Statements June 30, 2015 Page 37 Note 9: Interfund Transactions (Continued) At June 30, 2015, interfund receivables and payables were as follows: Interfund Interfund Receivables Payables Other Governmental Funds $ 150,000 $ 150,000 Internal Service Funds 657,754 4,800,282 Enterprise Funds 5,029, ,403 Other Enterprise Funds 582,216 Total $ 5,836,901 $ 5,836,901 Included within the Electric Utility Fund and the Communication Fund is an interfund balance of $4,800,283 that will not be repaid within one year. The arrangement was established to develop broadband services and repayment will be as revenues become available in the Communication Fund. Interfund Transfers Interfund transfers are used to move revenues from the fund with collection authorization to the debt service fund as debt service principal and interest payments become due and to move unrestricted fund revenues to finance various programs that the government must account for in other funds in accordance with budgetary authorizations, including amounts provided as matching funds for various grant programs. For the year ended June 30, 2015, interfund transfers were as follows: Transfers In Transfers Out General Fund $ 5,760,137 $ 574,428 Other Governmental Funds 243,748 2,813,844 Internal Service Funds 27,697 7,432,857 Government wide Activities 2,065,808 Enterprise Funds 2,022,088 Other Enterprise Funds 4,745,827 Total $ 12,843,217 $ 12,843,217 Note 10: Revenue Limitations Imposed By California Proposition 218 Proposition 218, which was approved by voters in November 1996, regulates the City s ability to impose, increase and extend taxes, assessments, and fees. Any new, increase, or extended taxes, assessments, and fees subject to the provisions of Proposition 218, require voter approval before they can be implemented. Additionally, Proposition
88 Notes to Financial Statements June 30, 2015 Page 38 Note 10: Revenue Limitations Imposed By California Proposition 218 (Continued) provides that these taxes, assessments, and fees are subject to the voter initiative process and may be rescinded in the future years by the voters. Therefore, the City s ability to finance the services for which the taxes, assessments, and fees were imposed may be significantly impaired. Note 11: Risk Management The City is partially self insured for workers compensation, liability claims, and property losses and fully self insured for unemployment claims. The City has been partially self insured for workers compensation since The Self Insured Retention (SIR) for property insurance is $25,000. Insurable property is generally covered for all risks, excluding earthquake and flood, by a policy with an aggregate limit of $ million. Various unique risks, such as boilers, machinery and data processing equipment are also insured. On July 1, 2003, the City joined the California Public Entity Insurance Authority (CPEIA) for the purpose of purchasing excess liability and workers compensation insurance. The CPEIA was formed under the Joint Powers Agreement (JPA) provision of state law (Government Codes 990, 990.4, 990.8, and ). In addition, CPEIA is governed by bylaws adopted by the JPA members. The fund is directed by a board of directors comprised of representatives elected from the various participating municipal agencies. The allocation of the liability insurance policy costs are calculated based on the recommendations of insurance brokers/consultants using recognized insurance experience rating techniques. Separate financial statements of CPEIA may be obtained by writing the Accounting Department, CSAC Excess Insurance Authority, 75 Iron Point Circle, Suite 200, Folsom, CA 95630, or by phoning (916) The City is self insured for the first $100,000 per occurrence, and excess insurance through CPEIA provides coverage to a maximum of $15,000,000 per occurrence. The City s self insured retention (SIR) for workers compensation is $300,000 per occurrence and excess insurance through CPEIA provides coverage to a maximum of $50,000,000 per occurrence. There were no significant reductions in insurance coverage from the prior year. For fiscal years ended June 30, 1996 through 2015, no claims settlements have exceeded insurance coverage. The City s self insurance fund is financed through contributions made by the City s general fund and enterprise funds. Third party administration provides data on estimated claims liabilities (paid and reserves). As of June 30, 2015, the estimated outstanding liability was $6,055,000 for workers compensation and $743,000 for general liability. The Employee Benefits and Insurance Control Fund has total Net Position of $3,805,153, of which $2,516,768 is available for the known outstanding liabilities and for future catastrophic losses. Estimated liabilities for incurred but not reported (IBNR) claims are $2,866,752 at June 30, Such amounts have been accrued in the accompanying financial statements in the self insurance internal service fund. 88
89 Notes to Financial Statements June 30, 2015 Page 39 Note 11: Risk Management (Continued) Changes in balances of claims liabilities for general liability and workers compensation insurance were as follows: Estimated unpaid claims liability 6/30/13 $ 4,912,002 Incurred claims and increase in estimated claims liability at 6/30/14 2,618,216 Claim payments (946,216) Estimated unpaid claims liability 6/30/14 6,584,002 Incurred claims and increase in estimated claims liability at 6/30/15 836,893 Claim payments (622,895) Estimated unpaid claims liability 6/30/15 $ 6,798,000 Note 12: Joint Ventures (Joint Power Agreements) The City of Lompoc participates in two joint ventures under joint powers agreements, Northern California Power Agency (NCPA) and Transmission Agency of Northern California (TANC). NCPA is a nonprofit, joint powers agency of the State of California and is comprised of 11 cities, one port authority, a transit authority, and two other associate member entities. The Agency is generally empowered to purchase, generate, transmit, distribute, and sell electrical energy. The Agency is governed by a Commission comprised of one representative for each member. The Commission is responsible for the general management of the affairs, property and business of the Agency. Separate financial statements of the agency may be obtained by writing NCPA, 651 Commerce Dr., Roseville, California TANC was organized under the California government code pursuant to a joint powers agreement entered into by 15 northern California utilities, of which the City is a part of under NCPA. Each TANC member has agreed to pay a pro rata share of the cost to operate TANC and has the right to participate in future project agreements. TANC is the project manager for the California Oregon Transmission Project. The purpose of the project is to upgrade certain facilities and construct new facilities as needed to allow mutually beneficial power sales between the Pacific Northwest and California. Separate financial statements of the agency may be obtained by writing TANC, PO Box 15129, Sacramento, California While the City is in part contingently liable for a certain portion of the long term debt of each agency, the joint venture s continued existence does not depend upon the continued funding and/or participation by the City. The City s participating percentage in each agency is 3.938% and.408% for NCPA and TANC, respectively, and is below that which would be considered a controlling or significant influence. Therefore, the City s interests in NCPA and TANC are not equity interests. 89
90 Notes to Financial Statements June 30, 2015 Page 40 Note 12: Joint Ventures (Continued) Under the terms of the NCPA and TANC joint power agency agreements, the City is contingently liable, directly or indirectly, for a portion of the long term debt of these agencies under a take or pay or guarantee arrangement. The City was contingently liable at June 30, 2014, the most recent information available, for approximately $0.80 million for its interest in TANC (principal $634,911, interest $160,494). In addition, the City was contingently liable at June 30, 2015 for approximately $56.38 million for its interest in NCPA (principal $32.98 million, interest $23.40 million). Under certain circumstances, such as default or bankruptcy of the other participants, the City may also be liable to pay a portion of the debt of these agencies on behalf of the other participants in these agencies. The NCPA s Geothermal Project has experienced greater than anticipated declines in steam production from existing geothermal wells on its leasehold property. Recent results of the continuing well analysis program indicate that the potential productive capacity for the geothermal steam reservoir is less than previously estimated. Therefore, NCPA has modified the operations of the Geothermal Project to reduce the average annual output from past levels. As a result, the per unit cost of power generated by the projects will be higher than anticipated. Condensed combined financial information of these joint power agencies is as follows NCPA is as of and for the year ended June 30, 2014, the most recent information available, and TANC is as of and for the year ended June 30, 2015 (in thousands): NCPA TANC Assets Current assets $ 84,293 $ 57,168 Property, equipment and capital project costs 648, ,147 Restricted assets and other assets 410,637 43,417 Deferred outflows of resources 69,586 3,615 Total assets and deferred outflows $ 1,213,373 $ 381,347 Liabilities and Capitalization Current liabilities $ 93,482 $ 51,951 Member advances ,410 Long term debt and other liabilities 1,004, ,847 Deferred outflows of resources 82, Members' capital 32,233 15,037 Total liabilities, deferred Outflows, and capitalization $ 1,213,373 $ 381,347 90
91 Notes to Financial Statements June 30, 2015 Page 41 Note 12: Joint Ventures (Continued) NCPA TANC Revenues: Interest $ 737 $ (88) Operating revenues and other revenues 408,096 48,355 Total revenues 408,833 48,267 Costs and expenses: General and other operating costs 340,669 31,016 Interest and other financing costs 44,296 13,872 Total costs and expenses 384,965 44,888 Reserve additions and refunds (27,040) (1,399) Net income (loss) (3,172) 1,980 Accumulated net revenues: Beginning of year 35,405 13,058 End of year $ 32,233 $ 15,038 Note 13: Net Position and Fund Balance Deficiencies At June 30, 2015, the City had negative net positions and fund balances in the following funds: Ending Fund Balance/ Net Position PEG/TAP Cable Access $ (320) SLTPP (142,015) Federal Road (4,417) Park Assessment District (111) River Park Campground (92,688) Recreation (128,820) Aquatic Center (233,899) Note 14: Airport Operating Leases The City acquired the airport in As of June 30, 2015, there were 20 long term lease agreements with the City. The leases include rental of airport hangars, a land lease with the City s wastewater fund, a land and mineral lease, two land leases with private parties and tie down revenues. Each lease is set with terms specific to the rates set at the time of the lease and the size of the hanger or land. A majority of the leases have a consumer price index (CPI) inflator in the lease. The most common inflator has a 1% above the CPI with minimum of a 3% increase. Leases range from 5 years to 40 years. Amounts collected for rentals and leases for the year ended 2015 were $213,
92 Notes to Financial Statements June 30, 2015 Page 42 Note 14: Airport Operating Leases (Continued) At June 30, 2015, the future minimum long term lease revenues were as follows: For the Year Ending June 30, 2016 $ 118, , , , ,808 Therafter 2,383,421 Total $ 2,945,174 Note 15: Contingencies and Commitments Contingent Liabilities The City is presently involved in certain matters of litigation that have arisen in the normal course of conducting City business. City management believes, based upon consultation with the City Attorney, that these cases, in the aggregate, are adequately covered by insurance and not expected to result in a material adverse financial impact on the City. Grant Commitments The City had received state and federal funds for specific purposes that are subject to review and audit by the grantor agencies. Although such audits could generate expenditure disallowances under terms of the grants, it is believed that any required reimbursements will not be material. Construction Commitments Construction and other significant commitments were $2,468,000 as of June 30, Long term construction contracts are billed and paid on a percentage of completion basis by construction phase. Note 16: Prior Year Restatements The City implemented GASB Statement No. 68, Financial Reporting for Pensions an amendment of Statement No. 27, and GASB Statement No. 71, Pension Transitions for Contributions Made Subsequent to the Measurement Date an amendment of GASB Statement No. 68, for the year ended June 30, The City has chosen to present prior year 92
93 Notes to Financial Statements June 30, 2015 Page 43 Note 16: Prior Year Restatements (Continued) data, but not restate the data for the prior year because all of the information available to restate prior year amounts was not readily available. An adjustment of $63,584,628 to reduce beginning net position has been made to reflect the cumulative impact of implementing these standards. In the prior year, the City recorded a disposal in the Solid Waste Fund in the fixed asset subledger which was not properly reflected in the financial statements. A prior year restatement was recorded in this fund to decrease beginning net position and increase accumulated depreciation by $66,801 as of June 30, Note 17: Successor Agency Trust for Assets of Former Redevelopment Agency On December 29, 2011, the California Supreme Court upheld Assembly Bill 1X 26 (the Bill) that provides for the dissolution of all redevelopment agencies in the State of California. This action impacted the reporting entity of the City of Lompoc that previously had reported a redevelopment agency within the reporting entity of the City as a blended component unit. The Bill provides that upon dissolution of a redevelopment agency, either the City or another unit of local government will agree to serve as the successor agency to hold the assets until they are distributed to other units of state and local government. On February 1, 2011, the City of Lompoc became the Successor Agency for the Lompoc Redevelopment Agency and assumed the assets and liabilities of the Lompoc Redevelopment Agency. This assumption is by operation of law pursuant to California Health and Safety Code subsections 34171(j) and 34173(d)(1). After enactment of the law, which occurred on June 28, 2011, redevelopment agencies in the State of California cannot enter into new projects, obligations or commitments. Subject to the control of a newly established oversight board, remaining assets can only be used to pay enforceable obligations in existence at the date of dissolution (including the completion of any unfinished projects that were subject to legally enforceable contractual commitments). In future fiscal years, successor agencies will only be allocated revenue in the amount that is necessary to pay the estimated annual installment payments on enforceable obligations of the former redevelopment agency until all enforceable obligations of the prior redevelopment agency have been paid in full and all assets have been liquidated. The Bill directs the State Controller of the State of California to review the propriety of any transfers of assets between redevelopment agencies and other public bodies that occurred after January 1, If the public body that received such transfers is not contractually committed to a third party for the expenditure of encumbrance of those assets, the State Controller is required to order the available assets to be transferred to the public body designated as the successor agency. 93
94 Notes to Financial Statements June 30, 2015 Page 44 Note 17: Successor Agency Trust for Assets of Former Redevelopment Agency (Continued) Management believes, in consultation with legal counsel, that the obligations of the former redevelopment agency due to the City are valid enforceable obligations payable by the successor agency trust under the requirements of the Bill. The City s position on this issue is not a position of settled law and there is a considerable legal uncertainty regarding this issue. It is reasonably possible that a legal determination may be made at a later date by an appropriate judicial authority that would resolve this issue unfavorably to the City. In accordance with the timeline set forth in the Bill (as modified by the California Supreme Court on December 29, 2011) all redevelopment agencies in the State of California were dissolved and ceased to operate as a legal entity as of February 1, After the date of dissolution, the assets and activities of the dissolved redevelopment agency are reported in a fiduciary fund (private purpose trust fund, the Trust Fund) in the financial statements of the City. Local Agency Investment Fund (LAIF) The Trust Fund had $1,292,170 in cash and investments as of June 30, 2015, that was held in LAIF which represented 45% of total cash and investments. The City manages the Trust Fund s cash and investments in a consistent manner as the rest of its cash and investment pool. Refer to Note 3 for additional information regarding LAIF. Cash with Fiscal Agent The Trust Fund had $606,002 in cash and investments as of June 30, 2015, held by fiscal agents pledged for the payment or security of certain bonds. The California Government code provides that these monies, in the absence of specific statutory provisions governing the issuance of bonds, certificates, or leases, may be invested in accordance with the ordinance, resolutions, or indentures specifying the types of investments its fiscal agents may make. These ordinances, resolutions, and indentures are generally more restrictive than the Trust Fund s general investment policy. In no instance have additional types of investments, not permitted by the Trust Fund s general investment policy, been authorized. Loans Receivable The former redevelopment agency loaned redevelopment tax increment to organizations to assist in the production of affordable housing and the rehabilitation of commercial properties within the redevelopment area prior to the Agency s dissolution. The loans are collateralized by a Deed of Trust recorded on the property. The loan s principal and interest repayments range from monthly payments, to term deferment, and single payments due at maturity. Some of the loans mature upon the sale or title transfer of the property. Interest rates range from 0% to 5% per annum. At June 30, 2015, outstanding loans receivable was $130,
95 Notes to Financial Statements June 30, 2015 Page 45 Note 17: Successor Agency Trust for Assets of Former Redevelopment Agency (Continued) At June 30, 2015, the aggregate maturities of loans receivable were as follows: For the Year Ending June 30, 2016 $ 13, , , , ,402 Thereafter 57,586 Total $ 130,181 Capital Assets For the year ended June 30, 2015, capital assets activity was as follows: Balance Transfers and Balance June 30, 2014 Additions Deductions June 30, 2015 Capital assets not being depreciated: Land $ 1,201,752 $ $ (1,201,752) $ Total capital assets not being depreciated 1,201,752 (1,201,752) Capital assets being depreciated: Buildings and improvements 616,229 (616,229) Total capital assets being depreciated 616,229 (616,229) Less accumulated depreciated for: Buildings and improvements 616,229 (616,229) Total accumulated depreciation 616,229 (616,229) Total capital assets being depreciated, net Governmental activities capital assets, net $ 1,201,752 $ $ (1,201,752) $ 95
96 Notes to Financial Statements June 30, 2015 Page 46 Note 17: Successor Agency Trust for Assets of Former Redevelopment Agency (Continued) Long term Debt The changes in long term liabilities for the year ended June 30, 2015 were as follows: Balance Balance Due Within 6/30/2014 Additions Deductions 6/30/2015 One Year 2004 tax allocation bonds $ 6,065,000 $ $ 185,000 $ 5,880,000 $ 190, tax allocation bonds 8,010, ,000 7,855, ,000 Capital leases payable 63,161 3,898 59,263 4,010 Compensated absences Total $ 14,138,354 $ 76 $ 343,898 $ 13,794,532 $ 359, Tax Allocation Bonds During the year ended June 30, 2004, the former redevelopment agency issued $7,350,000 of tax allocation bonds to finance the construction projects relating to the Aquatic Center. The former Agency had pledged its tax increment for the repayment of the bonds. The bonds bear interest rates from 2.75 to 4.85%. Principal and interest payments are due each March 2 and September 2 through September 2, At June 30, 2015, the principal balance outstanding was $5,880,000. At June 30, 2015, the aggregate maturities of the 2004 tax allocation bonds were as follows: For the Year Ending June 30, Principal Interest Total 2016 $ 190,000 $ 265,610 $ 455, , , , , , , , , , , , , ,260,000 1,011,186 2,271, ,585, ,543 2,268, ,010, ,594 2,262,594 Total $ 5,880,000 $ 3,196,262 $ 9,076,262 96
97 Notes to Financial Statements June 30, 2015 Page 47 Note 17: Successor Agency Trust for Assets of Former Redevelopment Agency (Continued) 2010 Tax Allocation Bonds During 2010, the former redevelopment agency issued $8,385,000 of tax allocation bonds to finance the construction projects relating to the Community and Senior Center and the dehumidifier for the Aquatic Center. The former Agency had pledged its tax increment for the repayment of the bonds. The bonds bear interest rates from 2.00 to 5.75%. Principal and interest payments are due each March 1 and September 1 through September 1, At June 30, 2015, the principal balance outstanding was $7,855,000. At June 30, 2015, the aggregate maturities of the 2010 tax allocation bonds were as follows: For the Year Ending June 30, Principal Interest Total 2016 $ 165,000 $ 436,559 $ 601, , , , , , , , , , , , , ,110,000 1,871,284 2,981, ,430,000 1,532,469 2,962, ,890,000 1,057,250 2,947, ,540, ,700 2,938,700 Total $ 7,855,000 $ 6,970,356 $ 14,825,356 Capital Leases Payable The Trust Fund has a capital lease obligation with Chevron Energy Solutions Company for a fire alarm system in the City s museum. At June 30, 2015, the semi annual lease payment was $2,834 and the capital leases payable outstanding was $59,
98 Notes to Financial Statements June 30, 2015 Page 48 Note 17: Successor Agency Trust for Assets of Former Redevelopment Agency (Continued) At June 30, 2015, future minimum payments on capital leases were as follows: Pensions For the Year Ending June 30, 2016 $ 5, , , , ,667 Thereafter 42,505 Total minimum lease payments 70,840 Less amounts representing interest (11,577) Principal portion of capital lease obligation 59,263 Less current principal portion (4,010) Capital lease obligation, net of current portion $ 55,253 The City has allocated a proportion of the Miscellaneous Plan that relates to the Trust Fund. The portion of the net pension liability allocated to the Trust Fund is $101,321. The portion of the deferred outflows of resources and deferred inflows of resources allocated to the Trust Fund are $9,052 and $18,028, respectively. See Note 7 for further information on the Miscellaneous Pension Plan. Note 18: Recent Pronouncements In January 2013, GASB issued Statement No. 69, Government Combinations and Disposals of Government Operations. This Statement requires disclosures to be made about government combinations and disposals of government operations to enable financial statement users to evaluate the nature and financial effects of those transactions. The provisions of this Statement were effective for periods beginning after December 31, In April 2013, GASB issued Statement No. 70, Accounting and Financial Reporting for Non exchange Financial Guarantees. This Statement specifies the information required to be disclosed by governments that extend nonexchange financial guarantees. In addition, this Statement requires new information to be disclosed by governments that receive non exchange financial guarantees. The provisions of Statement No. 70 were effective for periods beginning after June 15, Implementation of GASB Statements No. 69 and 70 did not have a significant impact on the financial statements of the City. 98
99 Notes to Financial Statements June 30, 2015 Page 49 Note 18: Recent Pronouncements (Continued) In June 2012, GASB issued Statement No. 68, Accounting and Financial Reporting for Pensions an amendment of Statement No. 27, which addresses accounting and financial reporting for pensions that are provided to the employees of state and local governmental employers. The provisions of Statement No. 68 are effective for fiscal years beginning after June 15, In November 2013, GASB issued Statement No. 71, Pension Transition for Contributions Made Subsequent to the Measurement Date an amendment of GASB Statement No. 68. This Statement addresses an issue regarding application of the transition provisions of Statement No. 68, Accounting and Financial Reporting for Pensions. The issue relates to amounts associated with contributions, if any, made by a state or local government employer on nonemployer contributing entity to a defined benefit pension plan after the measurement date of the government s beginning net pension liability. The provisions of Statement No. 71 are required to be applied simultaneously with the provisions of Statement No. 68, effective for fiscal years beginning after June 15, Implementation of GASB Statements No. 68 and 71 for the City s June 30, 2015 financial statements resulted in a restatement of beginning net position as of July 1, See Notes 7 and 16 to the financial statements for further discussion. New Accounting Standards In June 2012, GASB issued Statement No. 67, Financial Reporting for Pension Plans an amendment of GASB Statement No. 25, which revises existing standards of financial reporting for most pension plans. The provisions of Statement No. 67 are effective for periods beginning after June 15, Since this pronouncement is only applicable to pension plans, it does not apply to the City. In February 2015, GASB issued Statement No. 72, Fair Value Measurement and Application, which addresses accounting and financial reporting issues related to fair value measurements. This Statement also provides guidance for applying fair value to certain investments and disclosures related to all fair value measurements. The provisions of Statement No. 72 are effective for fiscal years beginning after June 15, Management has not yet determined the impact of this Statement on its financial statements. In June 2015, GASB issued Statement No. 73, Accounting and Financial Reporting for Pensions and Related Assets That Are Not within the Scope of GASB Statement 68, and Amendments to Certain Provisions of GASB Statements 67 and 68. The requirements of this Statement extend the approach to accounting and financial reporting established in Statement 68 to all pensions, with modifications as necessary to reflect that for accounting and financial reporting purposes, any assets accumulated for pensions that are provided through pension plans that are not administered 99
100 Notes to Financial Statements June 30, 2015 Page 50 Note 18: Recent Pronouncements (Continued) through trusts that meet the criteria specified in Statement 68 should not be considered pension plan assets. The provisions of Statement No. 73 are effective for fiscal years beginning after June 15, Management has not yet determined the impact of this Statement on its financial statements. In June 2015, GASB issued Statement No. 74, Financial Reporting for Postemployment Benefit Plans Other Than Pension Plans, which establishes financial reporting standards for state and local governmental OPEB plans defined benefit OPEB plans and defined contribution OPEB plans that are administered through trusts or equivalent arrangements. The provisions of Statement No. 74 are effective for fiscal years beginning after June 15, Management has not yet determined the impact of this Statement on its financial statements. Additionally, in June 2015, GASB issued Statement No. 75, Accounting and Financial Reporting for Postemployment Benefit Plans Other Than Pensions. Statement No. 75 establishes new accounting and financial reporting requirements for governments whose employees are provided with OPEB, as well as for certain nonemployer governments that have a legal obligation to provide financial support for OPEB provided to the employees of other entities. The provisions of Statement No. 75 are effective for fiscal years beginning after June 15, Management has not yet determined the impact of this Statement on its financial statements. In June 2015, GASB issued Statement No. 76, The Hierarchy of Generally Accepted Accounting Principles for State and Local Governments. The objective of this Statement is to identify in the context of the current governmental financial reporting environment the hierarchy of generally accepted accounting principles. The GAAP hierarchy consists of the sources of accounting principles used to prepare financial statements of state and local governmental entities in conformity with GAAP and the framework for selecting those principles. This Statement reduces the GAAP hierarchy to two categories of authoritative GAAP and addresses the use of authoritative and nonauthoritative literature in the event that the accounting treatment for a transaction or other event is not specified within a source of authoritative GAAP. The provisions of Statement No. 76 are effective for fiscal years beginning after June 15, Management has not yet determined the impact of this Statement on its financial statements. In August 2015, GASB issued Statement No. 77, Tax Abatement Disclosures. Statement No. 77 requires disclosure of tax abatement information about (1) a reporting government s own tax abatement agreements and (2) those that are entered into by other governments and that reduce the reporting government s tax revenues. The provisions of Statement No. 77 are effective for fiscal years beginning after December 15, Management has not yet determined the impact of this Statement on its financial statements. 100
101 Notes to Financial Statements June 30, 2015 Page 51 Note 19: Subsequent Event Events subsequent to June 30, 2015 have been evaluated through December 18, 2015, which is the date the financial statements were available to be issued. Management identified a $1,000,000 loan with CalRecycle to finance the installation of a required landfill gas collection and control system in the Solid Waste Fund. The City has not yet drawn on the loan, but project costs have been incurred beginning in August,
102 Required Supplementary Information (Unaudited) 102
103 Budgetary Comparison Schedule General Fund Year Ended June 30, 2015 Variance with Budget Original Final Actual Positive Budget Budget (GAAP Basis) (Negative) Revenues: Taxes $ 13,039,338 $ 13,039,338 $ 13,809,429 $ 770,091 Licenses and permits 286, , ,877 (5,022) Fines and penalties 127, ,603 99,692 (27,911) Revenues from other agencies 1,590,317 1,718,845 2,057, ,411 Charges for services 8,627,257 8,237,533 8,407, ,276 Interest 19,123 19,123 23,868 4,745 Other revenues 907,483 1,639, ,472 (708,467) Total revenues 24,598,020 25,074,280 25,616, ,123 Expenditures: City council 133, , ,050 (41,548) Administration 432, , ,592 (71,460) City attorney 567, , ,336 37,747 City clerk 199, , ,499 51,847 Finance and city treasurer 2,583,437 2,838,048 2,724, ,952 Human resources 577, , , ,508 Planning 762,065 1,490, , ,840 Non departmental 88, ,271 1,108,886 (212,615) Building and building inspections 484, , ,188 (4,264) Information systems 1,258,324 1,450,085 1,050, ,142 Police 9,822,603 10,747,988 10,200, ,001 Fire 4,216,853 4,659,824 4,573,846 85,978 Recreation 452, , ,776 (3,952) Parks 1,597,568 1,862,957 1,511, ,422 City engineer and streets 4,220,136 4,968,446 3,504,964 1,463,482 Library 1,289,757 2,021,833 1,123, ,176 Other 1,023,478 1,284,599 1,121, ,039 Total expenditures 29,709,258 35,144,488 30,421,193 4,723,295 Deficiency of revenues under expenditures (5,111,238) (10,070,208) (4,804,790) 5,265,418 See notes to required supplementary information. 103
104 Budgetary Comparison Schedule General Fund Year Ended June 30, 2015 Page2 Variance with Budget Original Final Actual Positive Budget Budget (GAAP Basis) (Negative) Other financing sources (uses): Operating transfers in $ 2,906,252 $ 3,829,036 $ 5,760,137 $ 1,931,101 Operating transfers out (743,221) (758,309) (574,428) 183,881 Total other financing sources (uses) 2,163,031 3,070,727 5,185,709 2,114,982 Net change in fund balance (2,948,207) (6,999,481) 380,919 7,380,400 Fund balance beginning of year 5,875,243 5,875,243 5,875,243 Fund balance end of year $ 2,927,036 $ (1,124,238) $ 6,256,162 $ 7,380,
105 Schedule of Funding Progress for OPEB Obligation Year Ended June 30, 2015 (Amounts in thousands) Projected Unit UAAL as a Actuarial Credit Actuarial Percentage Actuarial Value Accrued Unfunded Funded Covered of Covered Valuation Date of Assets Liability (AAL) AAL (UAAL) Ratio Payroll Payroll 6/30/09 $ 913 $ 9,451 $ 8, % $ 21, % 6/30/11 $ 2,136 $ 13,285 $ 11, % $ 19, % 6/30/13 $ 3,182 $ 12,809 $ 9, % $ 20, % See notes to required supplementary information. 105
106 Schedule of the Changes in the Net Pension Liability and Related Ratios Miscellaneous Agent Multiple Employer Plan June 30, 2015 Last 10 Years* Total Pension Liability Service Cost $ 2,970,875 Interest on total pension liability 11,428,244 Benefit payments, including refunds of employee contributions (6,921,136) Net change in total pension liability 7,477,983 Total pension liability beginning 154,351,715 Total pension liability ending (a) $ 161,829,698 Plan fiduciary net position Contributions employer $ 3,289,224 Contributions employee 1,343,721 Net investment income 18,835,132 Benefit payments (6,921,136) Net change in plan fiduciary net position 16,546,941 Plan fiduciary net position beginning 108,957,411 Plan fiduciary net position ending (b) $ 125,504,352 Net pension liability (asset) ending (a) (b) $ 36,325,346 Plan fiduciary net position as a percentage of the total pension liability 77.55% Covered employee payroll $ 15,540,484 Net pension liability as percentage of covered employee payroll % * Fiscal year 2015 was the first year of implementation therefore only one year is shown. Information is required only for measurement periods for which GASB Statement No. 68 is applicable. The measurement period is the year ended June 30, See notes to required supplementary information. 106
107 Schedule of Plan Contributions Miscellaneous Agent Multiple Employer Plan June 30, 2015 Last 10 Years* Actuarially determined contribution $ 3,289,224 Contributions in relation to the actuarially determined contributions (3,289,224) Contribution deficiency (excess) $ Covered employee payroll 15,540,484 Contributions as a percentage of covered employee payroll 21.17% * Fiscal year 2015 was the first year of implementation therefore only one year is shown. Information is required only for measurement periods for which GASB Statement No. 68 is applicable. The measurement period is the year ended June 30, See notes to required supplementary information. 107
108 Schedule of the City s Proportionate Share of the Net Pension Liability Safety Cost Sharing Plans June 30, 2015 Last 10 Years* Safety Police & Fire Police Fire Police Fire Tier 1 Tier 2 Tier 2 PEPRA PEPRA Plan's proportion of the net pension liability % % % % % Plan's proportionate share of the net pension liability $ 19,162,419 $ 10,139 $ 17,769 $ $ 3,075 Plan's covered employee payroll $ 4,769,626 $ 230,803 $ 283,243 $ $ 429,811 Plan's proportionate share of the net pension liability as a percentage of its covered employee payroll % 4.39% 6.27% N/A 0.72% Plan's proportionate share of the fiduciary net position as a percentage of the plan's total pension liability 75.30% 81.42% 81.42% 0.00% 81.42% Plan's proportionate share of aggregate employer contributions $ 1,653,486 $ 1,258 $ 2,204 $ $ 381 * Fiscal year 2015 was the first year of implementation therefore only one year is shown. Information is required only for measurement periods for which GASB Statement No. 68 is applicable. The measurement period is the year ended June 30, See notes to required supplementary information. 108
109 Schedule of the City s Contributions Safety Cost Sharing Plans June 30, 2015 Last 10 Years* Safety Police & Fire Police Fire Police Fire Tier 1 Tier 2 Tier 2 PEPRA PEPRA Actuarially determined contribution $ 1,585,168 $ 73,029 $ 64,569 $ $ 54,128 Contributions in relation to the actuarially determined contributions (1,585,168) (73,029) (64,569) (54,128) Contribution deficiency (excess) $ $ $ $ $ Covered employee payroll 4,769, , , ,811 Contributions as a percentage of covered employee payroll 33.23% 31.64% 22.80% 0.00% 12.59% * Fiscal year 2015 was the first year of implementation therefore only one year is shown. Information is required only for measurement periods for which GASB Statement No. 68 is applicable. The measurement period is the year ended June 30, See notes to required supplementary information. 109
110 Notes to Required Supplementary Information June 30, 2015 Budgetary Comparison Schedule 1. The budget is prepared using the modified accrual basis of accounting consistent with U.S. generally accepted accounting principles. 2. Outstanding encumbrances from the prior fiscal year are not reflected in the original budget column but are included in the final budget amounts. 3. All the City s general government and engineering programs are initially accounted and budgeted for in the General Fund. However, certain of these support service programs also benefit the City s enterprise and agency fund operations, and accordingly, transfers are made from these funds to reimburse the General Fund for these services. The transfers are based on a Cost Allocation Plan prepared for this purpose which distributes the shared costs in a uniform, consistent manner in accordance with U.S. generally accepted accounting principles. Excess of Expenditures Over Appropriations 1. At June 30, 2015 expenditures exceeded appropriations in the General Fund as noted below. This does not represent a violation of City budget policies because no department s total expenditures exceeded their total appropriations within the General Fund. Excess Expenditures General Fund: City council $ 41,548 Administration 71,460 Non departmental 212,615 Building and building inspections 4,264 Recreation 3,952 Communication 5,851,510 Other Post Employment Benefits Plan Schedule of Funding Progress 1. The schedule shows an analysis of actuarial value of assets as a percentage of the actuarial accrued liability and the unfunded actuarial accrued liability (UAAL) as a percentage of the annual covered payroll as of the most recent actuarial report for the period ending June 30, The actuarial report for the period ending June 30, 2013 was used to determine the ARC. 2. This schedule of funding progress presents multiyear trend information about whether the actuarial value of Plan assets is increasing or decreasing over time relative to the actuarial accrued liabilities for benefits. 110
111 Notes to Required Supplementary Information June 30, 2015 Page 2 Schedule of the Changes in the Net Pension Liability and Related Ratios Miscellaneous Plan 1. Benefit changes. The figures shown do not include any liability impact that may have resulted from plan changes which occurred after June 30, This applies for voluntary benefit changes as well as any offers of Two years Additional Service Credit (a.k.a. Golden Handshakes). 2. Changes in assumptions. There were no changes in assumptions. Schedule of the Plan Contributions Miscellaneous Plan The actuarial methods and assumptions used to set the actuarially determined contributions for Fiscal Year were from the June 30, 2011 public agency valuations. Actuarial cost method Entry Age Normal Amortization method For details, see June 30, 2011 Funding Valuation Report. Remaining amortization period For details, see June 30, 2011 Funding Valuation Report. Asset valuation method Actuarial Value of Assets. For details, see June 30, 2011 Funding Valuation Report. Inflation 2.75% Salary increases Varies by Entry Age and Service Payroll growth 3.00% Investment rate of return 7.50% net of pension plan investment and administrative expenses; includes inflation. Retirement age The probabilities of retirement are based on the 2010 CalPERS experience study for the period from 1997 to Mortality The probabilities of mortality are based on the 2010 CalPERS Experience Study for the period from 1997 to Pre retirement and post retirement mortality rates include 5 years of projected mortality Schedule of the City s Proportionate Share of the Net Pension Liability Cost Sharing Plans The plan s proportionate share of aggregate contributions may not match the actual contributions made by the employer during the measurement period. The plan s proportionate share of aggregate contributions is based on the plan s proportion of fiduciary net position shown on line 5 of the table as well as any additional side fund (or unfunded liability) contributions made by the employer during the measurement period. This data is not required to be displayed by GASB 68 for employers participating in cost sharing plans, but it is being shown here because it is used in the calculation of the Plan s pension expense. 111
112 Notes to Required Supplementary Information June 30, 2015 Page 3 Schedule of the City s Contributions Cost Sharing Plans 1. Benefit changes. The figures shown do not include any liability impact that may have resulted from plan changes which occurred after June 30, 2013 as they have minimal cost impact. 2. Changes in assumptions. There were no changes in assumptions. 112
113 Supplementary Information 113
114 Combining Balance Sheet Other Governmental Funds Year Ended June 30, 2015 Special Revenue Special Local Jailer Dispatcher Gas Tax Transportation Training Assets Cash and investments $ 1,513,824 $ 710,028 $ 3,171 Accounts receivable, net 6,610 Interest receivable 1,449 Due from other funds 150,000 Inventories 8,225 Property held for resale Loans receivable Total assets $ 1,523,498 $ 866,638 $ 3,171 Liabilities and Fund Balance Liabilities Accounts payable $ 30,429 $ 1 $ Due to other funds Deposits payable Total liabilities 30,429 1 Fund balance: Nonspendable: Inventories 8,225 Long term loans receivable Restricted for: Low income housing Road surface repairs 1,484, ,637 Debt service Law enforcement 3,171 Other capital projects Other purpose Committed to: Library acquisitions Health and welfare Unassigned Total fund balance 1,493, ,637 3,171 Total liabilities and fund balance $ 1,523,498 $ 866,638 $ 3,
115 Special Revenue Community PEG/TAP Human Development Cable Access Services Beautification SLTPP Federal Road $ 1,054,345 $ (43,064) $ 59,870 $ 13,608 $ 7,985 $ 98, ,727 46,503 1, ,823 1,499 (108) ,502,168 $ 2,679,739 $ 3,331 $ 61,487 $ 13,700 $ 7,985 $ 169,759 $ 65,260 $ 3,651 $ 17,734 $ 1 $ $ 174, ,000 65,260 3,651 17, , ,176 1,496,098 1,118,381 13,699 43,753 (320) (142,015) (4,417) 2,614,479 (320) 43,753 13,699 (142,015) (4,417) $ 2,679,739 $ 3,331 $ 61,487 $ 13,700 $ 7,985 $ 169,
116 Combining Balance Sheet Other Governmental Funds Year Ended June 30, 2015 Page 2 Assets Cash and investments Accounts receivable, net Interest receivable Due from other funds Inventories Property held for resale Loans receivable Total assets Liabilities and Fund Balance Liabilities Accounts payable Due to other funds Deposits payable Total liabilities Fund balance: Nonspendable: Inventories Long term loans receivable Restricted for: Low income housing Road surface repairs Debt service Law enforcement Other capital projects Other purpose Committed to: Library acquisitions Health and welfare Unassigned Total fund balance Total liabilities and fund balance Special Revenue Measure A Affordable Transportation Housing Local STP Improvement In Lieu $ 39 $ 2,241,583 $ 3,825, , , ,875 5, ,000 2,946,115 $ 288,615 $ 2,397,561 $ 6,976,832 $ 17,006 $ 109,163 $ 17, , ,609 2,288,398 2,946,115 4,030, ,609 2,288,398 6,976,832 $ 288,615 $ 2,397,561 $ 6,976,
117 Capital Projects Park Civic Capital Street Assessment Library Children's Center Development Development District Impact Fees Library $ 324,009 $ 4,217,253 $ 4,462,731 $ 13 $ 186,873 $ 405, , ,921 6,201 (124) $ 324,464 $ 4,223,424 $ 4,471,895 $ (111) $ 187,135 $ 406,472 $ $ 3,349 $ $ $ $ 9 921,344 3, , ,550, ,464 4,220, , ,463 (111) 324,464 4,220,075 3,550,551 (111) 187, ,463 $ 324,464 $ 4,223,424 $ 4,471,895 $ (111) $ 187,135 $ 406,
118 Combining Balance Sheet Other Governmental Funds Year Ended June 30, 2015 Page 3 Assets Cash and investments Accounts receivable, net Interest receivable Due from other funds Inventories Property held for resale Loans receivable Total assets Liabilities and Fund Balance Liabilities Accounts payable Due to other funds Deposits payable Total liabilities Fund balance: Nonspendable: Inventories Long term loans receivable Restricted for: Low income housing Road surface repairs Debt service Law enforcement Other capital projects Other purpose Committed to: Library acquisitions Health and welfare Unassigned Total fund balance Total liabilities and fund balance Debt Service Total Other Lease Assessment Governmental Purchase District Funds $ $ 118,890 $ 19,201, , , ,000 8, ,000 4,448,283 $ 119,232 $ 24,724,827 $ $ $ 420, , ,344 1,492,123 8,225 4,442,213 5,149,098 8,462, , ,232 3,171 4,544,539 13, ,598 43,753 (146,863) 119,232 23,232,704 $ $ 119,232 $ 24,724,
119 Combining Statement of Revenues, Expenditures and Changes in Fund Balance Other Governmental Funds Year Ended June 30, 2015 Special Revenue Special Local Jailer Dispatcher Gas Tax Transportation Training Revenues: Taxes $ 1,065,317 $ 1,529,996 $ Revenues from other agencies 5,720 Charges for current services Interest 3,429 2,282 Other revenues 194 Total revenues 1,068,746 1,532,472 5,720 Expenditures: Personnel services Maintenance and operations 239,528 3,094 Capital outlay 443, ,248 Debt services: Principal Interest and fiscal charges Total expenditures 683, ,248 3,094 Excess of revenues over (under) expenditures 385,360 1,140,224 2,626 Other financing sources (uses) Operating transfers in Operating transfers out (466,086) (857,379) Total other financing sources(uses) (466,086) (857,379) Net change in fund balance (80,726) 282,845 2,626 Fund balance beginning of year 1,573, , Fund balance (deficiency) end of year $ 1,493,069 $ 866,637 $ 3,
120 Special Revenue Community PEG/TAP Human Development Cable Access Services Beautification SLTPP Federal Road $ $ 90,267 $ $ $ $ 521, , ,556 1,750 2, ,209 (267) , ,917 92,363 43, , , , ,746 22, ,446 48,682 41,264 3,352 82, ,054 27, , , , ,606 41,264 3, , ,788 (134,556) (163,243) 2,085 (2,456) (75,359) (184,232) 39,486 39,486 (134,556) (123,757) 2,085 (2,456) (75,359) (184,232) 2,749, ,437 41,668 16,155 (66,656) 179,815 $ 2,614,479 $ (320) $ 43,753 $ 13,699 $ (142,015) $ (4,417) 120
121 Combining Statement of Revenues, Expenditures and Changes in Fund Balance Other Governmental Funds Year Ended June 30, 2015 Page 2 Revenues: Taxes Revenues from other agencies Charges for current services Interest Other revenues Total revenues Expenditures: Personnel services Maintenance and operations Capital outlay Debt services: Principal Interest and fiscal charges Total expenditures Excess of revenues over (under) expenditures Other financing sources (uses) Operating transfers in Operating transfers out Total other financing sources(uses) Net change in fund balance Fund balance beginning of year Fund balance (deficiency) end of year Special Revenue Measure A Affordable Transportation Housing Local STP Improvement In Lieu $ $ 2,188,703 $ 288,576 10, ,630 7,021 12, , ,576 2,195, ,248 69,737 77, ,605 11, ,625 77,517 1,073,230 81, ,059 1,122, ,682 (100,000) (1,200,000) (100,000) (1,200,000) 111,059 (77,506) 360, ,550 2,365,904 6,616,150 $ 271,609 $ 2,288,398 $ 6,976,
122 Capital Projects Park Civic Capital Street Assessment Library Children's Center Development Development District Impact Fees Library $ $ $ $ $ $ 57,028 54, ,011 23,463 33, ,401 9,661 (289) 514 1,098 1,650 55, ,440 33,124 (289) 33,915 2,748 66,045 26,459 82,923 3,830 23,991 2,853 34, ,164 26, ,128 4,471 90,036 15,017 28, ,312 28,653 (90,325) 33,915 (12,269) 123,620 (33,353) (33,406) (33,353) 90,214 28, ,959 28,653 (111) 33,915 (12,269) 295,688 3,875,116 3,521, , ,732 $ 324,464 $ 4,220,075 $ 3,550,551 $ (111) $ 187,135 $ 406,
123 Combining Statement of Revenues, Expenditures and Changes in Fund Balance Other Governmental Funds Year Ended June 30, 2015 Page 3 Revenues: Taxes Revenues from other agencies Charges for current services Interest Other revenues Total revenues Expenditures: Personnel services Maintenance and operations Capital outlay Debt services: Principal Interest and fiscal charges Total expenditures Excess of revenues over (under) expenditures Other financing sources (uses) Operating transfers in Operating transfers out Total other financing sources(uses) Net change in fund balance Fund balance beginning of year Fund balance (deficiency) end of year Debt Service Total Other Lease Assessment Governmental Purchase District Funds $ $ 290,978 $ 5,165,261 1,377, , , , ,680 7,756, ,737 1,301,022 2,441,729 55,464 65, ,464 25,178 98, ,136 80, ,958 4,678,088 (80,642) 127,722 3,078,826 80, ,748 (123,620) (2,813,844) 80,642 (123,620) (2,570,096) 4, , ,130 22,723,974 $ $ 119,232 $ 23,232,
124 Combining Statement of Net Position Other Enterprise Funds Year Ended June 30, 2015 Assets Current assets: Lompoc Lompoc Airport Transit Recreation Cash and investments $ 295,875 $ 3,430,100 $ 11,974 Accounts receivable, net 181, , Interest receivable 427 8, Prepaid expenses 1,500 Inventories 28,481 13,363 Total current assets 506,196 4,291,582 13,752 Noncurrent assets: Land 5,401,514 Construction in progress 206,740 1,050,207 Structures and improvements 4,116, ,672 Vehicles 2,417,816 Equipment 798, ,185 15,807 Less accumulated depreciation (1,925,058) (3,034,362) (15,807) Total noncurrent assets 8,598,040 1,896,518 Total assets 9,104,236 6,188,100 13,752 Deferred Outflows of Resources Deferred pensions 9,490 26,459 10,293 Total deferred outflows of resources 9,490 26,459 10,293 Liabilities Current liabilities: Accounts payable 213, ,074 13,458 Due to other funds 228,864 Accrued wages and benefits 2,000 Unearned revenue 1,689 Trust deposits 10,100 Interest payable 3, Current portion of capital leases payable 3,330 Total current liabilities 455, ,760 17,147 Noncurrent liabilities: Capital leases payable, net of current portion 45,894 Net pension liability 106, , ,218 Total noncurrent liabilities 106, , ,218 Total liabilities 562, , ,
125 Lompoc Valley Total River Park Aquatic Community Other Enterprise Campground Center Center Broadband Funds $ 89,157 $ 50,312 $ 16,313 $ 61,939 $ 3,955,670 1,000 16,000 1,038, (26) (16) 115 8,889 1,500 41,844 89,283 50,286 17,297 78,054 5,046, ,511 5,782,025 1,256, ,371 5,124,065 2,417,816 40,147 17, ,412 1,835,703 (207,064) (17,330) (277,464) (5,477,085) 401,965 42,948 10,939, ,248 50,286 17, ,002 15,985,921 18,573 18,931 9,162 92,908 18,573 18,931 9,162 92, ,040 11,240 6, , , ,216 3,824 6,475 12,299 1,689 10,100 3,868 3, ,619 53,515 11,240 6,620 1,060,712 45, , , ,552 1,039, , , ,552 1,085, , ,414 11, ,172 2,146,
126 Combining Statement of Net Position Other Enterprise Funds Year Ended June 30, 2015 Page 2 Lompoc Lompoc Airport Transit Recreation Deferred Inflows of Resources Deferred pensions $ 18,900 $ 52,695 $ 20,500 Total inflows of resources 18,900 52,695 20,500 Net Position Net investment in capital assets 8,598,040 1,847,294 Restricted for other purposes 344,002 Unrestricted (65,254) 3,469,744 (128,820) Total net position $ 8,532,786 $ 5,661,040 $ (128,820) 126
127 Lompoc Valley Total River Park Aquatic Community Other Enterprise Campground Center Center Broadband Funds $ 36,990 $ 37,702 $ $ 18,246 $ 185,033 36,990 37,702 18, , ,965 42,948 10,890, ,002 (494,653) (233,899) 6,057 (40,202) 2,512,973 $ (92,688) $ (233,899) $ 6,057 $ 2,746 $ 13,747,
128 Combining Statement of Revenues, Expenses and Changes in Fund Net Position Other Enterprise Funds Year Ended June 30, 2015 Lompoc Lompoc Airport Transit Recreation Operating revenues: User fees and charges for services $ 216,687 $ 1,322,782 $ 226,189 Revenue from other agencies 225,622 1,252,121 10,428 Other operating revenues 6,873 1,500 27,915 Facilities rental 213,234 36, ,727 Total operating revenues 662,416 2,612, ,259 Operating expenses: Personnel services 75, , ,288 Maintenance and operations 350,474 2,276, ,192 Depreciation and amortization 148, ,162 Total operating expenses 574,223 2,932, ,480 Operating income (loss) 88,193 (319,291) 29,779 Nonoperating revenues and expenses: Interest earnings 843 9,800 Other revenue (expense) 882 Gas taxes 29,591 Interest expense (14,537) (1,470) (16,221) Capital grants and contributions 850,423 Loss on disposal of equipment Operating transfers in Total nonoperating revenues and expenses (12,812) 888,344 (16,221) Net income (loss) 75, ,053 13,558 Net position beginning of year 8,580,536 5,435,281 (8,828) Prior year restatement (123,131) (343,294) (133,550) Net position beginning of year, restated 8,457,405 5,091,987 (142,378) Net position end of year $ 8,532,786 $ 5,661,040 $ (128,820) 128
129 Lompoc Valley Total River Park Aquatic Community Other Enterprise Campground Center Center Broadband Funds $ 191,223 $ 450,861 $ 13,352 $ 509,135 $ 2,930,229 1,488, ,543 12, , , , , , ,303 4,915,461 73, ,322 90, ,413 1,174,167 48, ,799 94, ,000 3,494,755 6, , , , , , ,928 5,500,139 74,989 (353,207) (76,516) (28,625) (584,678) ,058 (77) (19) ,591 (711) (32,939) 850,423 (73,620) (73,620) 291,226 94,024 4,360,577 4,745,827 (457) 291,149 94,005 4,287,118 5,531,126 74,532 (62,058) 17,489 4,258,493 4,946,448 73,759 73,773 (11,432) (4,136,877) 10,006,212 (240,979) (245,614) (118,870) (1,205,438) (167,220) (171,841) (11,432) (4,255,747) 8,800,774 $ (92,688) $ (233,899) $ 6,057 $ 2,746 $ 13,747,
130 Combining Statement of Cash Flows Other Enterprise Funds Year Ended June 30, 2015 Lompoc Lompoc Airport Transit Recreation Cash flows from operating activities: Cash received from customers $ 262,053 $ 1,138,333 $ 362,281 Cash received from other agencies 225,622 1,252,121 10,428 Internal activity cash paid to other funds (19,114) Cash paid to suppliers for goods and services (129,662) (2,297,211) (212,715) Cash paid to employees (96,130) (246,081) (147,769) Net cash provided (used) by operating activities 242,769 (152,838) 12,225 Cash flows from noncapital financing activities: Cash received from other agencies ,591 Net operating transfers Net cash provided by non capital financing activities ,591 Cash flows from capital and related financing activities: Acquisition and contribution of capital assets (191,017) (245,995) Loss on disposal of equipment Principal payments on long term debt (3,238) Interest payments on long term debt (14,825) (1,493) (16,221) Cash received from capital grants and contributions 850,423 Net cash provided (used) by capital and related financial activities (205,842) 599,697 (16,221) Cash flows from investing activities: Interest on investments 555 3,162 (18) Net cash provided (used) by investing activities 555 3,162 (18) Net increase (decrease) in cash and investments 38, ,612 (4,014) Cash investments beginning of year 257,511 2,950,488 15,988 Cash investments end of year $ 295,875 $ 3,430,100 $ 11,
131 Lompoc Valley Total River Park Aquatic Community Other Enterprise Campground Center Center Broadband Funds $ 204,775 $ 451,914 $ 107,443 $ 511,879 $ 3,038,678 1,488,171 (7,108) (4,800,282) (4,826,504) (48,811) (364,057) (88,550) (148,075) (3,289,081) (94,562) (454,607) (98,677) (208,912) (1,346,738) 54,294 (366,750) (79,784) (4,645,390) (4,935,474) 30, ,226 94,024 4,360,577 4,745, ,226 94,024 4,360,577 4,776, ,355 (8,657) (73,620) (73,620) (48,383) (51,621) (711) (305) (33,555) 850,423 (711) 306, , (10) (12) 46 3, (10) (12) 46 3,882 53,742 (75,534) 14,228 21, ,678 35, ,846 2,085 40,659 3,427,992 $ 89,157 $ 50,312 $ 16,313 $ 61,939 $ 3,955,
132 Combining Statement of Cash Flows Other Enterprise Funds Year Ended June 30, 2015 Page 2 Lompoc Lompoc Airport Transit Recreation Operating income (loss) $ 88,193 $ (319,291) $ 29,779 Adjustments to reconcile operating income (loss) to net cash provided (used) by operating activities: Depreciation and amortization 148, ,162 Accounts receivable (175,941) (222,449) 5,450 Prepaid expenses 684 Inventories 15,338 (4,664) Accounts payable 209,546 (16,119) 4,216 Due to other funds (19,114) Accrued wages and benefits (20,349) (58,591) (10,454) Unearned revenue (4,072) (17,423) Trust deposits 1,200 Compensated absences (293) (886) (27) Total adjustments 154, ,453 (17,554) Net cash provided (used) by operating activities $ 242,769 $ (152,838) $ 12,
133 Lompoc Valley Total River Park Aquatic Community Other Enterprise Campground Center Center Broadband Funds $ 74,989 $ (353,207) $ (76,516) $ (28,625) $ (584,678) 6, , ,217 1,552 (1,000) 2,576 (389,812) 1,937 2,621 10,674 (234) 8,805 5,735 1, ,874 (7,108) (4,800,282) (4,826,504) (21,006) (24,169) (7,862) (28,070) (170,501) (21,495) 1,200 (178) (116) (141) (429) (2,070) (20,695) (13,543) (3,268) (4,616,765) (4,350,796) $ 54,294 $ (366,750) $ (79,784) $ (4,645,390) $ (4,935,474) 133
134 Combining Statement of Net Position Internal Service Funds Year Ended June 30, 2015 Employment Benefits and Insurance Control Vehicle Communication Assets Current assets: Cash and investments $ 13,265,101 $ 178,004 $ 13,095 Cash with fiscal agents 1,299,758 Accounts receivable, net 5, Interest receivable 14, Inventories 229,091 Due from other funds 657,754 Total current assets 13,943,510 1,707,181 13,181 Noncurrent assets: Other post employment benefits (OPEB) asset 1,243,286 Construction in progress 7,942 5,061 Structures and improvements 326,865 Vehicles and equipment 18,994,154 1,966,419 Less accumulated depreciation (13,359,191) (1,386,977) Total noncurrent assets 1,243,286 5,969, ,503 Total assets 15,186,796 7,676, ,684 Deferred Outflows of Resources Deferred pensions 124, ,408 Total deferred outflows of resources 124, ,408 Liabilities Current liabilities: Accounts payable 46, ,995 23,344 Due to other funds 4,800,282 Accrued wages and benefits 1,061,482 Interest payable 21,301 Current portion of claims payable 1,280,000 Current portion of compensated absences 3,400,889 Current portion of capital leases payable 620,555 Total current liabilities 5,789, ,851 4,823,626 Noncurrent liabilities: Claims payable, net of current portion 5,518,000 Compensated absences, net of current portion 74,417 Capital leases payable, net of current portion 2,959,263 Net pension liability 1,392,838 1,493,287 Total noncurrent liabilities 5,592,417 4,352,101 1,493,287 Total liabilities 11,381,643 5,146,952 6,316,
135 Stores Total $ 37,361 $ 13,493,561 1,299,758 5,967 (13) 15, , , , ,781 15,813,653 1,243,286 13, , ,833 20,960,573 (88,440) (14,834,608) 38,528 7,836, ,309 23,649, , ,842 13, ,541 4,800,282 1,061,482 21,301 1,280,000 3,400, ,555 13,347 11,421,050 5,518,000 74,417 2,959,263 2,886,125 11,437,805 13,347 22,858,
136 Combining Statement of Net Position Internal Service Funds Year Ended June 30, 2015 Page 2 Employment Benefits and Insurance Control Vehicle Communication Deferred Inflows of Resources Deferred pensions $ $ 247,817 $ 265,689 Total inflows of resources 247, ,689 Net Position Net investment in capital assets 1,243,286 2,389, ,503 Restricted for other purposes 45,099 Unrestricted 2,516,768 16,664 (6,436,013) Total net position $ 3,805,153 $ 2,406,616 $ (5,851,510) 136
137 Stores Total $ $ 513, ,506 38,528 4,256,269 45, ,434 (3,766,147) $ 174,962 $ 535,
138 Combining Statement of Revenues, Expenses and Changes in Fund Net Position Internal Service Funds Year Ended June 30, 2015 Employment Benefits and Insurance Control Vehicle Communication Operating revenues: Charges for services $ 17,355,745 $ 4,043,336 $ 298,334 Total operating revenues 17,355,745 4,043, ,334 Operating expenses: Personnel services 5,514, ,618 97,262 Maintenance and operations 9,865,524 1,942, ,553 Depreciation and amortization 129,000 14,125 Total operating expenses 15,380,307 2,948, ,940 Operating income 1,975,438 1,095,192 4,394 Nonoperating revenues and expenses: Interest earnings 61, Interest expense (85,035) Other revenue 423 Operating transfers in 27,697 Operating transfers out (3,099,730) (4,333,127) Total nonoperating revenues and expenses (3,038,723) (56,375) (4,333,127) Net income (loss) (1,063,285) 1,038,817 (4,328,733) Net position beginning of year 4,868,438 2,982, ,107 Prior year restatement (1,614,452) (1,730,884) Net position beginning of year, restated 4,868,438 1,367,799 (1,522,777) Net position end of year $ 3,805,153 $ 2,406,616 $ (5,851,510) 138
139 Stores Total $ 404,454 $ 22,101, ,454 22,101,869 6,488, ,459 12,348,062 9, , ,152 18,989,543 37,302 3,112,326 61,547 (85,035) (16) ,697 (7,432,857) (16) (7,428,241) 37,286 (4,315,915) 137,676 8,196,472 (3,345,336) 137,676 4,851,136 $ 174,962 $ 535,
140 Combining Statement of Cash Flows Internal Service Funds Year Ended June 30, 2015 Employment Benefits and Insurance Control Vehicle Communication Cash flows from operating activities: Cash received from interfund services provided $ 17,350,002 $ 4,043,336 $ 298,334 Internal activity cash paid from other funds 3,768,262 4,800,282 Cash paid to suppliers for goods and services (9,604,670) (1,937,711) (204,298) Cash paid to employees (5,091,578) (1,051,820) (213,877) Net cash provided by operating activities 6,422,016 1,053,805 4,680,441 Cash flows from noncapital financing activities: Received from other agencies 423 Net operating transfers (3,099,730) 27,697 (4,333,127) Net cash provided (used) by non capital financial activities (3,099,730) 28,120 (4,333,127) Cash flows from capital and related financing activities: Acquisition and construction of capital assets (675,901) (496,445) Principal payments on long term debt (699,301) Interest payments on long term debt (88,502) Net cash used by capital and related financing activities (1,463,704) (496,445) Cash flows from investing activities: Interest on investments 51, (1) Net cash provided (used) by investing activities 51, (1) Net increase (decrease) in cash and cash equivalents 3,373,832 (381,541) (149,132) Cash and investments beginning of year 9,891,269 1,859, ,227 Cash and investments end of year $ 13,265,101 $ 1,477,762 $ 13,095 Summary of cash and investments end of year: Cash and investments 13,265, ,004 13,095 Cash with fiscal agents 1,299,758 Total cash and investments end of year $ 13,265,101 $ 1,477,762 $ 13,
141 Stores Total $ 404,454 $ 22,096,126 8,568,544 (359,435) (12,106,114) (6,357,275) 45,019 12,201,281 (16) 407 (7,405,160) (16) (7,404,753) (21,442) (1,193,788) (699,301) (88,502) (21,442) (1,981,591) 19 51, ,802 23,580 2,866,739 13,781 11,926,580 $ 37,361 $ 14,793,319 37,361 13,493,561 1,299,758 $ 37,361 $ 14,793,
142 Combining Statement of Cash Flows Internal Service Funds Year Ended June 30, 2015 Page 2 Employment Benefits and Insurance Control Vehicle Communication Operating income $ 1,975,438 $ 1,095,192 $ 4,394 Adjustments to reconcile operating income to net cash provided by operating activities: Depreciation and amortization 129,000 14,125 Accounts receivable (5,743) Other post employment benefits (OPEB) asset (609,087) Inventories 18,847 Due from/to other funds 3,768,262 4,800,282 Accounts payable 46,855 (14,935) (21,764) Accrued wages and benefits 957,875 (173,880) (116,376) Compensated absences 74,417 (1,322) (239) Claims and liabilities 213,999 Total adjustments 4,446,578 (41,387) 4,676,047 Net cash provided by operating activities $ 6,422,016 $ 1,053,805 $ 4,680,
143 Stores Total $ 37,302 $ 3,112,326 9, ,818 (4,821) (609,087) (8,581) 10,266 8,568,544 6,605 16, ,619 72, ,999 7,717 9,088,955 $ 45,019 $ 12,201,
144 Municipal Officers June 30, 2015 City Council Mayor.. Councilmember. Councilmember. Councilmember. Councilmember. Bob Lingl Dirk Starbuck Victor Vega DeWayne Holmdahl Jim Mosby Administrative Personnel City Manager Assistant City Manager / Economic Development Director..... City Attorney City Clerk. Utility Director. Public Works Director. Management Services Director / City Treasurer.... Fire Chief. Police Chief... Patrick Wiemiller Teresa Gallavan Joseph W. Pannone Stacey Alvarez Larry Bean Kevin McCune Brad Wilkie Kurt Latipow Pat Walsh 144
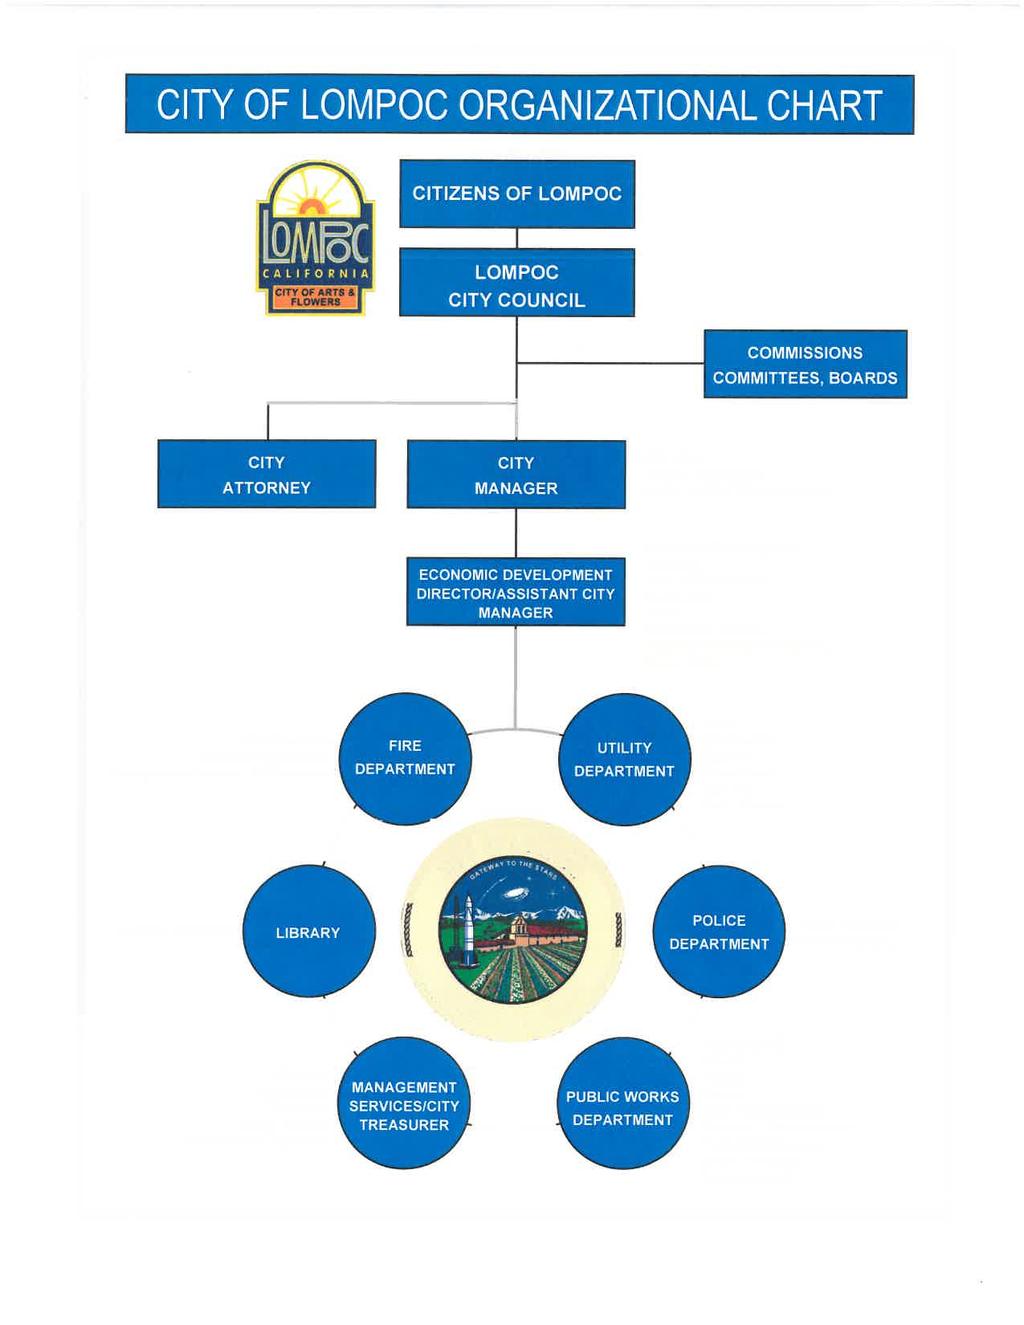


145
CITY OF LOMPOC. Basic Financial Statements Fiscal Year Ended June 30, 2007
 CITY OF LOMPOC Basic Financial Statements Fiscal Year Ended June 30, 2007 FINANCIAL SECTION Independent Auditors' Report.. 1 Management's Discussion and Analysis 3 Basic Financial Statements: Government-wide
WOODS CROSS CITY CORPORATION FINANCIAL STATEMENTS. For The Year Ended June 30, Together With Independent Auditor s Report
 CORPORATION FINANCIAL STATEMENTS For The Year Ended June 30, 2017 Together With Independent Auditor s Report Financial Section: WOODS CROSS CITY TABLE OF CONTENTS Independent Auditor s Report... 1 Management
CITY OF BANNING, CALIFORNIA FINANCIAL STATEMENTS FOR THE FISCAL YEAR ENDED JUNE 30, 2017
 , CALIFORNIA FINANCIAL STATEMENTS FOR THE FISCAL YEAR ENDED JUNE 30, 2017 THIS PAGE INTENTIONALLY LEFT BLANK FINANCIAL STATEMENTS FOR THE FISCAL YEAR ENDED JUNE 30, 2017 TABLE OF CONTENTS Page Number INDEPENDENT
SPRINGVILLE CITY CORPORATION. Financial Statements and Independent Auditors Report. Year Ended June 30, 2017
 Financial Statements and Independent Auditors Report Year Ended June 30, 2017 Financial Statements and Independent Auditors Report Year Ended June 30, 2017 Table of Contents Page FINANCIAL SECTION Report
CITY OF BANNING, CALIFORNIA FINANCIAL STATEMENTS FOR THE FISCAL YEAR ENDED JUNE 30, 2016
 , CALIFORNIA FINANCIAL STATEMENTS FOR THE FISCAL YEAR ENDED JUNE 30, 2016 , CALIFORNIA FINANCIAL STATEMENTS FOR THE FISCAL YEAR ENDED JUNE 30, 2016 THIS PAGE INTENTIONALLY LEFT BLANK FINANCIAL STATEMENTS
(This page intentionally left blank.)
") (This page intentionally left blank.) ANNUAL FINANCIAL REPORT of the For the Year Ended (This page intentionally left blank.) TABLE OF CONTENTS FINANCIAL SECTION Independent Auditor s Report 1 Management
(This page intentionally left blank.) ANNUAL FINANCIAL REPORT of the For the Year Ended (This page intentionally left blank.) TABLE OF CONTENTS FINANCIAL SECTION Independent Auditor s Report 1 Management
City of North Chicago, Illinois
 Annual Financial Report Year Ended April 30, 2015 Annual Financial Report Table of Contents For the Year Ended April 30, 2015 Page INDEPENDENT AUDITORS' REPORT 1-3 MANAGEMENT'S DISCUSSION AND ANALYSIS
City of Grand Ledge. FINANCIAL STATEMENTS (With Required Supplementary Information) June 30, 2018
 June 30, 2018") FINANCIAL STATEMENTS (With Required Supplementary Information) TABLE OF CONTENTS Page INDEPENDENT AUDITOR S REPORT MANAGEMENT S DISCUSSION AND ANALYSIS i-iii iv-x BASIC FINANCIAL STATEMENTS Government-wide
FINANCIAL STATEMENTS (With Required Supplementary Information) TABLE OF CONTENTS Page INDEPENDENT AUDITOR S REPORT MANAGEMENT S DISCUSSION AND ANALYSIS i-iii iv-x BASIC FINANCIAL STATEMENTS Government-wide
CITY OF CHEYENNE FINANCIAL & COMPLIANCE REPORT
 CITY OF CHEYENNE FINANCIAL & COMPLIANCE REPORT Cheyenne, Wyoming Year Ended Prepared by City Treasurer s Office This page is intentionally left blank 2 City of Cheyenne Financial and Compliance Report
CITY OF HERCULES, CALIFORNIA ANNUAL FINANCIAL REPORT YEAR ENDED JUNE 30, 2017
 , CALIFORNIA ANNUAL FINANCIAL REPORT YEAR ENDED WEALTH ADVISORY OUTSOURCING AUDIT, TAX, AND CONSULTING THIS PAGE INTENTIONALLY LEFT BLANK TABLE OF CONTENTS YEAR ENDED FINANCIAL SECTION Independent Auditors
CITY OF FITCHBURG, MASSACHUSETTS. Annual Financial Statements. For the Year Ended June 30, 2016
 CITY OF FITCHBURG, MASSACHUSETTS Annual Financial Statements For the Year Ended June 30, 2016 TABLE OF CONTENTS PAGE INDEPENDENT AUDITORS REPORT 1 MANAGEMENT S DISCUSSION AND ANALYSIS 4 BASIC FINANCIAL
CITY OF LAGUNA BEACH, CALIFORNIA. Comprehensive Annual Financial Report. For the Fiscal Year Ended June 30, 2015
 CITY OF LAGUNA BEACH, CALIFORNIA Comprehensive Annual Financial Report For the Fiscal Year Ended June 30, 2015 CITY OF LAGUNA BEACH, CALIFORNIA COMPREHENSIVE ANNUAL FINANCIAL REPORT FOR THE FISCAL YEAR
CITY OF PLYMOUTH California
 California Annual Financial Report June 30, 2016 City Council Peter Taylor Jon Colburn Sandy Kyles Peter Amoruso Jason Ralphs Mayor Vice Mayor Member Member Member Appointed Officials City Manager Jeffry
City of La Mesa La Mesa, California. Basic Financial Statements and Independent Auditor s Report
 City of La Mesa La Mesa, California Basic Financial Statements and Independent Auditor s Report This page left intentionally blank. Basic Financial Statements Table of Contents Page Independent Auditor's
CITY OF RIPON CALIFORNIA
 CALIFORNIA FINANCIAL STATEMENTS AND INDEPENDENT AUDITOR S REPORT FOR THE YEAR ENDED CALIFORNIA TABLE OF CONTENTS Page Independent Auditor s Report... 1 Management s Discussion and Analysis... 3 Basic Financial
CITY OF SANTA PAULA FINANCIAL STATEMENTS
 CITY OF SANTA PAULA FINANCIAL STATEMENTS Year Ended Financial Statements Year Ended TABLE OF CONTENTS Page Independent Auditor s Report Management s Discussion and Analysis i - iii iv - xii Basic Financial
Town of Wellington, Colorado. Financial Statements and Supplementary Information For the Year Ended December 31, 2017
 , Colorado Financial Statements and Supplementary Information For the Year Ended December 31, 2017 < Contents Independent Auditor s Report 1-2 Management s Discussion and Analysis 3-15 Basic Financial
CITY OF ROLLING HILLS, CALIFORNIA FINANCIAL STATEMENTS FOR THE FISCAL YEAR ENDED JUNE 30, 2017
 , CALIFORNIA FINANCIAL STATEMENTS FOR THE FISCAL YEAR ENDED JUNE 30, 2017 PREPARED BY: THE CITY OF ROLLING HILLS, CALIFORNIA FINANCIAL SERVICES DEPARTMENT THIS PAGE INTENTIONALLY LEFT BLANK FINANCIAL STATEMENTS
Town of Wellington, Colorado. Financial Statements and Supplementary Information For the Year Ended December 31, 2016
 , Colorado Financial Statements and Supplementary Information For the Year Ended December 31, 2016 Contents Independent Auditor s Report 1-2 Management s Discussion and Analysis 3-15 Basic Financial Statements:
City of North Chicago, Illinois
 Annual Financial Report Year Ended Annual Financial Report Table of Contents For the Year Ended Page INDEPENDENT AUDITORS' REPORT 1-3 MANAGEMENT'S DISCUSSION AND ANALYSIS (UNAUDITED) 4-13 BASIC FINANCIAL
TOOELE CITY CORPORATION. Financial Statements and Independent Auditor's Report. June 30, 2012
 Financial Statements and Independent Auditor's Report June 30, 2012 Table of Contents Page Independent Auditor's Report 1 Management's Discussion and Analysis 3 Basic Financial Statements: Government-Wide
CITY OF CAMPBELLSBURG, KENTUCKY
 FINANCIAL STATEMENTS AND SUPPLEMENTARY INFORMATION TABLE OF CONTENTS Report of Independent Auditors... 1 Management Discussion and Analysis... 4 Basic Financial Statements Page Statement of Net Position...
SALEM CITY CORPORATION FINANCIAL STATEMENTS
 FINANCIAL STATEMENTS FOR THE YEAR ENDED JUNE 30, 2017 Allred Jackson, PC 50 East 2500 North, Suite 200 North Logan, UT 84341 (P) 435.752.6441 (F) 435.752.6451 www.allredjackson.com ii Table of Contents
City of Merced, California
 For the Fiscal Year Ended June 30, 2015 Basic Financial Statements, California Merced, California Annual Financial Report For the year ended June 30, 2015 This page intentionally left blank Annual Financial
TOWN OF CUMBERLAND, RHODE ISLAND ANNUAL FINANCIAL STATEMENTS FOR THE YEAR ENDED JUNE 30, 2017
 ANNUAL FINANCIAL STATEMENTS FOR THE YEAR ENDED JUNE 30, 2017 For the year ended Table of Contents Independent Auditor's Report... 1 Management's Discussion and Analysis... 4 Basic Financial Statements...
TOWNSHIP OF TYRONE LIVINGSTON COUNTY, MICHIGAN ANNUAL FINANCIAL REPORT YEAR ENDED MARCH 31, 2018
 TOWNSHIP OF TYRONE LIVINGSTON COUNTY, MICHIGAN ANNUAL FINANCIAL REPORT YEAR ENDED MARCH 31, 2018 TABLE OF CONTENTS INDEPENDENT AUDITOR'S REPORT 1 MANAGEMENT S DISCUSSION AND ANALYSIS 5 BASIC FINANCIAL
City of Tombstone, Arizona Financial Statements. Year Ended June 30, 2016
 City of Tombstone, Arizona Financial Statements Year Ended June 30, 2016 CONTENTS Page INDEPENDENT AUDITOR S REPORT 1 MANAGEMENT S DISCUSSION AND ANALYSIS (MD&A) (Required Supplementary Information) 5
CITY OF BOYNE CITY CHARLEVIOX COUNTY, MICHIGAN ANNUAL FINANCIAL REPORT YEAR ENDED APRIL 30, 2014
 CITY OF BOYNE CITY CHARLEVIOX COUNTY, MICHIGAN ANNUAL FINANCIAL REPORT YEAR ENDED APRIL 30, 2014 TABLE OF CONTENTS INDEPENDENT AUDITOR'S REPORT 1 MANAGEMENT S DISCUSSION AND ANALYSIS 4 BASIC FINANCIAL
TOWN OF FAIR HAVEN, VERMONT AUDIT REPORT
 AUDIT REPORT FOR THE YEAR ENDED JUNE 30, 2018 FOR THE YEAR ENDED JUNE 30, 2018 TABLE OF CONTENTS Independent Auditor s Report 1-2 Management s Discussion and Analysis 3-9 Basic Financial Statements: Government-Wide
CITY OF JASPER Jasper, Alabama. Financial Statements and Supplemental Information. September 30, 2016
 CITY OF JASPER Jasper, Alabama Financial Statements and Supplemental Information Table of Contents Page(s) INDEPENDENT AUDITORS' REPORT 1 3 MANAGEMENT'S DISCUSSION AND ANALYSIS 4 11 BASIC FINANCIAL STATEMENTS
SALEM CITY CORPORATION FINANCIAL STATEMENTS
 FINANCIAL STATEMENTS FOR THE YEAR ENDED JUNE 30, 2014 TABLE OF CONTENTS Introductory Section: Page Letter of transmittal 3 Financial Section: Independent Auditors Report 7 Management Discussion and Analysis
TOOELE CITY CORPORATION. Financial Statements and Independent Auditor's Report. June 30, 2014
 Financial Statements and Independent Auditor's Report June 30, 2014 Table of Contents Page Independent Auditor's Report 1 Management's Discussion and Analysis 3 Basic Financial Statements: Government-Wide
CITY OF SOUTH GATE, CALIFORNIA COMPREHENSIVE ANNUAL FINANCIAL REPORT JUNE 30, 2012
 , CALIFORNIA COMPREHENSIVE ANNUAL FINANCIAL REPORT JUNE 30, 2012 , CALIFORNIA COMPREHENSIVE ANNUAL FINANCIAL REPORT JUNE 30, 2012 PREPARED BY: DEPARTMENT OF FINANCE COMPREHENSIVE ANNUAL FINANCIAL REPORT
SALEM CITY CORPORATION FINANCIAL STATEMENTS
 FINANCIAL STATEMENTS FOR THE YEAR ENDED JUNE 30, 2016 ii Table of Contents Introductory Section Page Letter of transmittal... 3 Financial Section Independent Auditors Report... 7 Management Discussion
TOWN OF MIDDLEBOROUGH, MASSACHUSETTS
 BASIC FINANCIAL STATEMENTS AND MANAGEMENT S DISCUSSION AND ANALYSIS WITH INDEPENDENT AUDITORS REPORT FOR THE YEAR ENDED JUNE 30, 2013 BASIC FINANCIAL STATEMENTS AND MANAGEMENT S DISCUSSION AND ANALYSIS
TOWN OF BLACKSTONE, MASSACHUSETTS. Report on Examination of Basic Financial Statements and Additional Information Year Ended June 30, 2016
 TOWN OF BLACKSTONE, MASSACHUSETTS Report on Examination of Basic Financial Statements and Additional Information Year Ended June 30, 2016 Report on Internal Control Over Financial Reporting and On Compliance
City of Shenandoah, Texas
 ANNUAL FINANCIAL REPORT of the For the Year Ended (This page intentionally left blank.) TABLE OF CONTENTS FINANCIAL SECTION Independent Auditor s Report 1 Management s Discussion and Analysis 7 Basic Financial
City of North Chicago, Illinois
 Annual Financial Report Year Ended Annual Financial Report Table of Contents For the Year Ended Page INDEPENDENT AUDITORS' REPORT 1-3 MANAGEMENT'S DISCUSSION AND ANALYSIS (UNAUDITED) 4-12 BASIC FINANCIAL
TOWN OF CUMBERLAND, RHODE ISLAND ANNUAL FINANCIAL STATEMENTS FOR THE YEAR ENDED JUNE 30, 2016
 ANNUAL FINANCIAL STATEMENTS FOR THE YEAR ENDED JUNE 30, 2016 For the year ended Table of Contents Independent Auditor's Report... 1 Management's Discussion and Analysis... 4 Basic Financial Statements...
City of Le Sueur Le Sueur County, Minnesota. Financial Statements. December 31, 2015
 Le Sueur County, Minnesota Financial Statements December 31, 2015 Table of Contents Page Elected Officials and Administration 1 Independent Auditor's Report 3 Management's Discussion and Analysis 7 Basic
CITY OF NORTH TONAWANDA, NEW YORK BASIC FINANCIAL STATEMENTS AND SINGLE AUDIT WITH INDEPENDENT AUDITOR'S REPORT YEAR ENDED DECEMBER 31, 2015
 BASIC FINANCIAL STATEMENTS AND SINGLE AUDIT WITH INDEPENDENT AUDITOR'S REPORT YEAR ENDED DECEMBER 31, 2015 Table of Contents Independent Auditor's Report...1-3 Management s Discussion and Analysis...4-15
CITY OF CHILTON, WISCONSIN ANNUAL FINANCIAL REPORT DECEMBER 31, 2012
 ANNUAL FINANCIAL REPORT DECEMBER 31, 2012 December 31, 2012 Table of Contents Page No. INDEPENDENT AUDITORS REPORT 1-2 MANAGEMENT S DISCUSSION AND ANALYSIS 3-8 GOVERNMENT-WIDE FINANCIAL STATEMENTS Statement
TOWN OF MAMMOTH LAKES California. Annual Financial Report June 30, 2016
 California Annual Financial Report Table of Contents INDEPENDENT AUDITOR S REPORT... 2-3 MANAGEMENT S DISCUSSION AND ANALYSIS (unaudited) Required Supplementary Information, as prepared by management...
River Valley Technical Center
 Audited Financial Statements and Other Financial Information River Valley Technical Center June 30, 2018 Proven Expertise and Integrity CONTENTS PAGE INDEPENDENT AUDITORS' REPORT 1-3 MANAGEMENT S DISCUSSION
CITY OF INKSTER, MICHIGAN. Year Ended June 30, Financial Statements and Single Audit Compliance Act
 CITY OF INKSTER, MICHIGAN Year Ended June 30, 2016 Financial Statements and Single Audit Compliance Act This page intentionally left blank. Table of Contents Independent Auditors Report 1 Management s
CITY OF BISHOP FINANCIAL STATEMENTS JUNE 30, 2011
 CITY OF BISHOP FINANCIAL STATEMENTS JUNE 30, 2011 CITY OF BISHOP Table of Contents Independent Auditor s Report 1 Management Discussion and Analysis 2 Basic Financial Statements: Government-Wide Financial
CITY OF HEALDSBURG HEALDSBURG, CALIFORNIA COMPREHENSIVE ANNUAL FINANCIAL REPORT WITH REPORT ON AUDIT BY INDEPENDENT CERTIFIED PUBLIC ACCOUNTANTS
 HEALDSBURG, CALIFORNIA COMPREHENSIVE ANNUAL FINANCIAL REPORT WITH REPORT ON AUDIT BY INDEPENDENT CERTIFIED PUBLIC ACCOUNTANTS FISCAL YEAR ENDED JUNE 30, 2008 Prepared by the Finance Department COMPREHENSIVE
VILLAGE OF ELMWOOD PARK, ILLINOIS. ANNUAL FINANCIAL REPORT Year Ended April 30, 2016
 ANNUAL FINANCIAL REPORT Year Ended April 30, 2016 ANNUAL FINANCIAL REPORT Year Ended April 30, 2016 TABLE OF CONTENTS FINANCIAL SECTION... Page Independent Auditor s Report... 1 Required Supplementary
CITY OF FREEPORT, ILLINOIS ANNUAL FINANCIAL REPORT
 ANNUAL FINANCIAL REPORT FOR THE FISCAL YEAR ENDED APRIL 30, 2017 TABLE OF CONTENTS FINANCIAL SECTION PAGE INDEPENDENT AUDITORS' REPORT... 1-3 MANAGEMENT S DISCUSSION AND ANALYSIS... MD&A 1-11 BASIC FINANCIAL
TOWN OF NEW SHOREHAM, RHODE ISLAND FINANCIAL STATEMENTS YEAR ENDED JUNE 30, 2015
 FINANCIAL STATEMENTS YEAR ENDED JUNE 30, 2015 Hague, Sahady & Co., Certified Public Accountants P.C. Committed to Excellence Table of Contents Independent Auditors' Report... 1 Management s Discussion
City of Coeur d Alene, Idaho. Audited Financial Statements
 City of Coeur d Alene, Idaho Audited Financial Statements City of Coeur d Alene, Idaho TABLE OF CONTENTS FINANCIAL SECTION: Independent Auditor s Report...1 3 Management s Discussion and Analysis... 4
City of Marianna Marianna, Florida
 Marianna, Florida Basic Financial Statements For the year ended September 30, 2014 Table of Contents September 30, 2014 REPORT Independent Auditors' Report 1 MANAGEMENT'S DISCUSSION AND ANALYSIS Management's
City of Shenandoah, Texas
 ANNUAL FINANCIAL REPORT of the City of Shenandoah, Texas For the Year Ended (This page intentionally left blank.) TABLE OF CONTENTS FINANCIAL SECTION Independent Auditor s Report 1 Management s Discussion
State of New Mexico City of Hobbs. Annual Financial Report For the Year Ended June 30, 2016
 State of New Mexico Annual Financial Report For the Year Ended June 30, 2016 (This page intentionally left blank.) 2 INTRODUCTORY SECTION 3 STATE OF NEW MEXICO Annual Financial Report June 30, 2016 Table
CITY OF METHUEN, MASSACHUSETTS. Annual Financial Statements. For the Year Ended June 30, 2017
 CITY OF METHUEN, MASSACHUSETTS Annual Financial Statements For the Year Ended June 30, 2017 CITY OF METHUEN, MASSACHUSETTS TABLE OF CONTENTS INDEPENDENT AUDITORS REPORT 1 MANAGEMENT S DISCUSSION AND ANALYSIS
TOWN OF NEWPORT NORTH CAROLINA ANNUAL FINANCIAL REPORT
 TOWN OF NEWPORT NORTH CAROLINA ANNUAL FINANCIAL REPORT MAYOR Dennis Barber MAYOR PRO-TEM David Heath TOWN COUNCIL MEMBERS Chuck Shinn Jim McCoy Mark Eadie Danny Fornes TOWN MANAGER Angela Christian FINANCE
City of Park Rapids Hubbard County, Minnesota. Financial Statements. December 31, 2016
 Hubbard County, Minnesota Financial Statements December 31, 2016 Table of Contents Elected Officials and Administration 1 Independent Auditor's Report 2 Management's Discussion and Analysis 5 Basic Financial
VILLAGE OF ELMWOOD PARK, ILLINOIS. ANNUAL FINANCIAL REPORT Year Ended April 30, 2013
 ANNUAL FINANCIAL REPORT Year Ended April 30, 2013 ANNUAL FINANCIAL REPORT Year ended April 30, 2013 CONTENTS FINANCIAL SECTION: Independent Auditor s Report... 1 REQUIRED SUPPLEMENTARY INFORMATION: Management
City of Princeton, Illinois. Annual Financial Report. For the Fiscal Year Ended April 30, 2015
 Annual Financial Report For the Fiscal Year Ended TABLE OF CONTENTS Page Management s Discussion and Analysis... 4 Independent Auditors Report... 9 Basic Financial Statements: Statement of Net Position...
TOWN OF EAST BRIDGEWATER, MASSACHUSETTS BASIC FINANCIAL STATEMENTS AND MANAGEMENT S DISCUSSION AND ANALYSIS WITH INDEPENDENT AUDITOR S REPORT FOR THE
 BASIC FINANCIAL STATEMENTS AND MANAGEMENT S DISCUSSION AND ANALYSIS WITH INDEPENDENT AUDITOR S REPORT FOR THE YEAR ENDING JUNE 30, 2017 BASIC FINANCIAL STATEMENTS AND MANGEMENT S DISCUSSION AND ANALYSIS
TOWN OF MEDLEY, FLORIDA FINANCIAL SECTION, REQUIRED SUPPLEMENTARY INFORMATION, COMBINING FUND STATEMENTS, AND SUPPLEMENTARY FINANCIAL REPORTS
 FINANCIAL SECTION, REQUIRED SUPPLEMENTARY INFORMATION, COMBINING FUND STATEMENTS, AND SUPPLEMENTARY FINANCIAL REPORTS COMPLIANCE SECTION Year Ended September 30, 2011 CONTENTS Independent Auditors Report
CITY OF CARSON CITY, MICHIGAN
 , MICHIGAN FINANCIAL STATEMENTS Vredeveld Haefner LLC CPAs and Consultants TABLE OF CONTENTS FINANCIAL SECTION PAGE Independent Auditors Report 1-2 Management s Discussion and Analysis 3-8 Basic Financial
City of Beaumont. Beaumont, California. Annual Financial Report and Independent Auditors Report
 Beaumont, California Annual Financial Report and Independent Auditors Report , California ANNUAL FINANCIAL REPORT For the fiscal year ended June 30, 2018 Prepared by the Finance Department Melana Taylor,
STATE OF NEW MEXICO CITY OF BLOOMFIELD
 CITY OF BLOOMFIELD ANNUAL FINANCIAL REPORT JUNE 30, 2011 (This page intentionally left blank.) CITY OF BLOOMFIELD ANNUAL FINANCIAL REPORT JUNE 30, 2011 (This page intentionally left blank.) 2 INTRODUCTORY
CLINTON CITY BASIC FINANCIAL STATEMENTS AND REQUIRED SUPPLEMENTARY INFORMATION WITH INDEPENDENT AUDITOR'S REPORTS YEAR ENDED JUNE 30, 2018
 BASIC FINANCIAL STATEMENTS AND REQUIRED SUPPLEMENTARY INFORMATION WITH INDEPENDENT AUDITOR'S REPORTS YEAR ENDED TABLE OF CONTENTS Independent Auditors Report... 1-2 Management s Discussion and Analysis...
TOWN OF VICTORIA, VIRGINIA ANNUAL FINANCIAL REPORT FOR THE YEAR ENDED JUNE 30, 2015
 TOWN OF VICTORIA, VIRGINIA ANNUAL FINANCIAL REPORT FOR THE YEAR ENDED JUNE 30, 2015 ROBINSON, FARMER, COX ASSOCIATES A PROFESSIONAL LIMITED LIABILITY COMPANY CERTIFIED PUBLIC ACCOUNTANTS CHARLOTTESVILLE
Audited Financial Statements and Other Supplementary Information. Town of Jay, Maine. June 30, Proven Expertise and Integrity
 Audited Financial Statements and Other Supplementary Information Town of Jay, Maine June 30, 2015 Proven Expertise and Integrity CONTENTS INDEPENDENT AUDITORS' REPORT 1-3 PAGE MANAGEMENT S DISCUSSION AND
ANNUAL FINANCIAL REPORT CITY OF GROVES, TEXAS
 ANNUAL FINANCIAL REPORT For the fiscal year ended September 30, 2010 3411 Richmond Avenue Suite 500 Houston, TX 77046 (P) 713.621.1515 (F) 713.621.1570 www.null-lairson.com ANNUAL FINANCIAL REPORT TABLE
CITY OF BROCKTON, MASSACHUSETTS. Basic Financial Statements, Required Supplementary Information and Additional Information.
 Basic Financial Statements, Required Supplementary Information and Additional Information (With Independent Auditors Report Thereon) Table of Contents Page(s) Independent Auditors Report 1 3 Management
VILLAGE OF RICHMOND, ILLINOIS ANNUAL FINANCIAL REPORT
 VILLAGE OF RICHMOND, ILLINOIS ANNUAL FINANCIAL REPORT FOR THE FISCAL YEAR ENDED APRIL 30, 2015 VILLAGE OF RICHMOND TABLE OF CONTENTS APRIL 30, 2015 PAGE INDEPENDENT AUDITOR S REPORT 1 REQUIRED SUPPLEMENTARY
CITY OF BARNESVILLE, MINNESOTA BASIC FINANCIAL STATEMENTS AND SUPPLEMENTARY INFORMATION YEAR ENDED DECEMBER 31, 2015
 BASIC FINANCIAL STATEMENTS AND SUPPLEMENTARY INFORMATION YEAR ENDED DECEMBER 31, 2015 TABLE OF CONTENTS DECEMBER 31, 2015 INTRODUCTORY SECTION PRINCIPAL CITY OFFICIALS 1 FINANCIAL SECTION INDEPENDENT
CITY OF DUNNELLON, FLORIDA ANNUAL FINANCIAL REPORT. September 30, 2017
 CITY OF DUNNELLON, FLORIDA ANNUAL FINANCIAL REPORT September 30, 2017 1 CITY OF DUNNELLON, FLORIDA ANNUAL FINANCIAL REPORT September 30, 2017 T A B L E O F C O N T E N T S PAGE NO. Independent Auditor's
TABLE OF CONTENTS. Page INDEPENDENT AUDITOR'S REPORT 1 MANAGEMENT S DISCUSSION AND ANALYSIS 4 BASIC FINANCIAL STATEMENTS
 VILLAGE OF BEAR LAKE, MICHIGAN ANNUAL FINANCIAL REPORT YEAR ENDED FEBRUARY 28, 2018 TABLE OF CONTENTS INDEPENDENT AUDITOR'S REPORT 1 MANAGEMENT S DISCUSSION AND ANALYSIS 4 BASIC FINANCIAL STATEMENTS Government-wide
CITY OF SOUTH GATE, CALIFORNIA COMPREHENSIVE ANNUAL FINANCIAL REPORT JUNE 30, 2014
 , CALIFORNIA COMPREHENSIVE ANNUAL FINANCIAL REPORT JUNE 30, 2014 , CALIFORNIA COMPREHENSIVE ANNUAL FINANCIAL REPORT JUNE 30, 2014 PREPARED BY: DEPARTMENT OF FINANCE THIS PAGE INTENTIONALLY LEFT BLANK COMPREHENSIVE
City of San Mateo San Mateo, California
 City of San Mateo San Mateo, California Comprehensive Annual Financial Report For the Year Ended June 30, 2005 The City provides a full range of municipal services. These include police and fire
CITY OF HASTINGS, NEBRASKA FINANCIAL REPORT SEPTEMBER 30, 2014
 FINANCIAL REPORT SEPTEMBER 30, 2014 CONTENTS Page INDEPENDENT AUDITOR'S REPORT 1-3 Management's Discussion and Analysis 4-8 FINANCIAL STATEMENTS Statement of Net Position 9 Statement of Activities 10-11
TOWN OF WINDSOR LOCKS, CONNECTICUT
 step forward TOWN OF WINDSOR LOCKS, CONNECTICUT FINANCIAL STATEMENTS TABLE OF CONTENTS Exhibit Independent Auditors Report 1-3 Management s Discussion and Analysis 4-11 Basic Financial Statements: Government-Wide
(This page intentionally left blank.)
") (This page intentionally left blank.) ANNUAL FINANCIAL REPORT of the For the Year Ended (This page intentionally left blank.) TABLE OF CONTENTS FINANCIAL SECTION Independent Auditor s Report 1 Management
(This page intentionally left blank.) ANNUAL FINANCIAL REPORT of the For the Year Ended (This page intentionally left blank.) TABLE OF CONTENTS FINANCIAL SECTION Independent Auditor s Report 1 Management
Clay County, Florida. County Audit Report September 30, 2014
 Clay County, Florida County Audit Report September 30, 2014 Clay County, Florida County Audit Report September 30, 2014 Table of Contents Section Financial Report 1 County-Wide 3 Clerk of the Circuit Court
VILLAGE OF PIGEON PIGEON, MICHIGAN HURON COUNTY FINANCIAL REPORT FEBRUARY 29, 2016
 VILLAGE OF PIGEON PIGEON, MICHIGAN HURON COUNTY FINANCIAL REPORT FEBRUARY 29, 2016 REPORT OF INDEPENDENT AUDITORS MANAGEMENT S DISCUSSION AND ANALYSIS TABLE OF CONTENTS PAGE NUMBER i - iii iv x BASIC FINANCIAL
CITY OF DEERFIELD BEACH, FLORIDA
 COMPREHENSIVE ANNUAL FINANCIAL REPORT FOR THE FISCAL YEAR ENDED SEPTEMBER 30, 2014 Prepared by the Department of Financial Services Director of Finance, Hugh B. Dunkley Assistant Director of Finance, Sophia
City of Sartell Stearns and Benton Counties, Minnesota. Financial Statements. December 31, 2018
 Stearns and Benton Counties, Minnesota Financial Statements December 31, 2018 Table of Contents Elected Officials and Administration 1 Independent Auditor's Report 2 Management's Discussion and Analysis
Village of Pelham, New York
 Financial Statements and Supplementary Information Year Ended May 31, 2016 Table of Contents Page Independent Auditors' Report Management's Discussion and Analysis Basic Financial Statements Government-Wide
TOWN OF NEW SHOREHAM, RHODE ISLAND REPORTING PACKAGE JUNE 30, 2014
 REPORTING PACKAGE JUNE 30, 2014 REPORTING PACKAGE JUNE 30, 2014 TABLE OF CONTENTS Section I: Annual Financial Report Section II: Single Audit Report Section III: Current Year Findings and Questioned Costs
CITY OF COMPTON STATE OF CALIFORNIA. Comprehensive Annual Financial Report. Fiscal Year Ended June 30, 2009
 STATE OF CALIFORNIA Comprehensive Annual Financial Report Fiscal Year Ended Comprehensive Annual Financial Report Table of Contents Page(s) Independent Auditor s Report... 1 Management s Discussion and
CITY OF RIPON, CALIFORNIA
 SINGLE AUDIT REPORT JUNE 30, 2013 Accountancy Corporation CONTENTS Independent Auditors Report 1 Management s Discussion and Analysis 3 Basic Financial Statements Government-Wide Financial Statements Statement
CITY OF ST. PAUL PARK FINANCIAL STATEMENTS FOR THE FISCAL YEAR ENDED DECEMBER 31, 2012
 FINANCIAL STATEMENTS FOR THE FISCAL YEAR ENDED DECEMBER 31, 2012 FINANCIAL STATEMENTS For the Fiscal Year Ended December 31, 2012 TABLE OF CONTENTS INTRODUCTORY SECTION Elected and Appointed Officials
COMPREHENSIVE ANNUAL FINANCIAL REPORT City of McGregor, Texas. Year ended September 30, 2014
 COMPREHENSIVE ANNUAL FINANCIAL REPORT City of McGregor, Texas Year ended September 30, 2014 This page is intentionally left blank. CITY OF MCGREGOR, TEXAS COMPREHENSIVE ANNUAL FINANCIAL REPORT FOR THE
VILLAGE OF DOLTON, ILLINOIS ANNUAL FINANCIAL REPORT
 VILLAGE OF DOLTON, ILLINOIS ANNUAL FINANCIAL REPORT FOR THE FISCAL YEAR ENDED APRIL 30, 2017 TABLE OF CONTENTS FINANCIAL SECTION PAGE INDEPENDENT AUDITORS' REPORT... 1-2 MANAGEMENT S DISCUSSION AND ANALYSIS...
City of Clinton, Iowa. Financial and Compliance Report Year Ended June 30, 2014
 Financial and Compliance Report Year Ended June 30, 2014 Table of Contents Introductory Section Table of contents City officials Organizational chart i ii iii iv Financial Section Independent auditor
COMPREHENSIVE ANNUAL FINANCIAL REPORT City of McGregor, Texas. Year ended September 30, 2015
 COMPREHENSIVE ANNUAL FINANCIAL REPORT City of McGregor, Texas Year ended September 30, 2015 This page is intentionally left blank. CITY OF MCGREGOR, TEXAS COMPREHENSIVE ANNUAL FINANCIAL REPORT FOR THE
VILLAGE OF ISLAND LAKE, ILLINOIS
 G R A 44 N. Walkup Ave. Crystal Lake, IL 60014 T: 815-459-0700 GRA-CPA.COM Accounting Auditing Consulting VILLAGE OF ISLAND LAKE, ILLINOIS ANNUAL FINANCIAL REPORT WITH SUPPLEMENTARY INFORMATION YEAR ENDED
TOWN OF MEDLEY, FLORIDA FINANCIAL SECTION, REQUIRED SUPPLEMENTARY INFORMATION, COMBINING FUND STATEMENTS, AND SUPPLEMENTARY FINANCIAL REPORTS
 FINANCIAL SECTION, REQUIRED SUPPLEMENTARY INFORMATION, COMBINING FUND STATEMENTS, AND SUPPLEMENTARY FINANCIAL REPORTS COMPLIANCE SECTION Year Ended CONTENTS Independent Auditors Report 1 Financial Section:
CITY OF YOAKUM, TEXAS
 CITY OF YOAKUM, TEXAS ANNUAL FINANCIAL REPORT For the year ended September 30, 2015 CITY OF YOAKUM, TEXAS ANNUAL FINANCIAL REPORT For the year ended September 30, 2015 TABLE OF CONTENTS FINANCIAL SECTION
CITY OF COATESVILLE COATESVILLE, PENNSYLVANIA
 COATESVILLE, PENNSYLVANIA BASIC FINANCIAL STATEMENTS WITH SUPPLEMENTARY INFORMATION DECEMBER 31, 2014 TABLE OF CONTENTS PAGE INDEPENDENT AUDITOR S REPORT 1-3 MANAGEMENT S DISCUSSION AND ANALYSIS 4-12 BASIC
VILLAGE OF ISLAND LAKE, ILLINOIS ANNUAL FINANCIAL REPORT WITH SUPPLEMENTARY INFORMATION
 ANNUAL FINANCIAL REPORT WITH SUPPLEMENTARY INFORMATION YEAR ENDED APRIL 30, 2014 CONTENTS Pages Independent Auditor s Report 1-2 Management s Discussion and Analysis 3-7 Basic Financial Statements: Government-wide
COMPREHENSIVE ANNUAL FINANCIAL REPORT WITH INDEPENDENT AUDITORS REPORT
 COMPREHENSIVE ANNUAL FINANCIAL REPORT WITH INDEPENDENT AUDITORS REPORT * * * * * JUNE 30, 2011 BASIC FINANCIAL STATEMENTS FOR THE YEAR ENDED JUNE 30, 2011 TABLE OF CONTENTS Independent Auditors' Report
INDEPENDENT AUDITOR S REPORT
 INDEPENDENT AUDITOR S REPORT To the Honorable Members of City Council City of Manassas, Virginia We have audited the accompanying financial statements of the governmental activities, the business-type
TOWN OF MEDLEY, FLORIDA Financial Section, Required Supplementary Information, Combining Fund Statements, and Supplementary Financial Reports
 TOWN OF MEDLEY, FLORIDA Financial Section, Required Supplementary Information, Combining Fund Statements, and Supplementary Financial Reports Compliance Section With Independent Auditors Report TABLE OF
CITY OF HOLYOKE, MASSACHUSETTS. Annual Financial Statements. For the Year Ended June 30, 2011
 CITY OF HOLYOKE, MASSACHUSETTS Annual Financial Statements For the Year Ended June 30, 2011 TABLE OF CONTENTS INDEPENDENT AUDITORS REPORT 1 MANAGEMENT S DISCUSSION AND ANALYSIS 3 BASIC FINANCIAL STATEMENTS: