ARC Centre of Excellence in Population Ageing Research. Working Paper 2018/17
|
|
|
- Anissa Baker
- 5 years ago
- Views:
Transcription

1 ARC Centre of Excellence in Population Ageing Research Working Paper 2018/17 Learning to Value Annuities: The Role of Information and Engagement Hazel Bateman, Ralph Stevens, Jennifer Alonso Garcia and Eduard Ponds This paper can be downloaded without charge from the ARC Centre of Excellence in Population Ageing Research Working Paper Series available at
2 Learning to value annuities: the role of information and engagement Hazel Bateman, Ralph Stevens, Jennifer Alonso Garcia, Eduard Ponds December, 2018 ABSTRACT Using an online experimental survey we investigate perception (in terms of understanding, riskiness and control) and valuation (elicited using iterative multiple price lists) of lifetime annuities relative to flexible drawdown products. We find that for those participants who are engaged with the experimental tasks information provision can substantially reduce or eliminate be-havioral drivers of the complex task of valuation of annuities. Providing balanced information and multiple opportunities to learn about the key features of the products, including impact of potential outcomes, narrows the gap between the willingness to pay and willingness to accept, and, offsets the effects of low financial capability, information framing and real world institutional settings. Keywords: Information framing, experiments, annuity demand, cross-country analysis. JEL Classifications: D14, D91, G11. CEPAR, School of Risk and Actuarial Studies, UNSW Business School, UNSW Sydney. Corresponding author. CPB Netherlands Bureau for Economic Policy Analysis, CEPAR and Netspar. University of Groningen and CEPAR. Tilburg University & APG. 1
3 1 Introduction and motivation There has been a shift in most developed countries from guaranteed lifetime pensions, such as defined benefit (DB), to defined contribution (DC) pension schemes (OECD, 2017). This trend allows for alternative products such as phased withdrawals or lump sum arrangements which provide more flexibility than traditional pension arrangements. Examples include the U.K. following the abolition of mandatory deferred annuitization in 2015 (Cannon et al., 2016); Australia s superannuation system which allows retirement savings to be allocated to annuities, phased withdrawal products (known as account-based pensions) and lump sums (Bateman, 2016); and the Netherlands which is considering reforms which will provide more choice of pension plan withdrawals (Bovenberg and Nijman, 2017). As a result retirees are increasingly asked to select a portfolio of retirement benefit products - typically comprising a lifetime annuity product and a product which allows flexible withdrawals from a pension account. However, poor knowledge of product features and of the risks faced in retirement may offset the advantages of freedom of choice. Choosing a retirement benefit or a portfolio of benefits is a complex decision. Life annuities and flexible withdrawal products can have an array of different options and characteristics which are often not well understood, particularly by those with low levels of financial capability or product knowledge (Bateman et al., 2016a). Moreover, the recent policy shift and introduction of new retirement income products has provided limited opportunities for social learning from peers or elders (Bernheim, 2002). The growing literature on retirement benefit decisions has investigated optimal allocations to retirement benefit products, including annuities and flexible drawdown products (Maurer et al., 2013) and rational and behavioral explanations for lower levels of annuitization than predicted by theory (Brown, 2009). Behavioral explanations have explored information framing (Brown et al., 2008b; Agnew et al., 2008; Bockweg et al., 2018), mental accounts (Brown et al., 2017a), complexity and cognitive constraints as revealed by widely divergent values for the WTP and WTA annuities (Brown et al., 2017b), financial capability and effort in understanding product features (Bateman et al. 2016b), stickiness to defaults (Benartzi et al., 2011; Butler and Teppa, 2007), and the use of heuristics (Bateman et al., 2016a). In this paper we contribute to the growing literature on retirement benefit decisions by studying the perception and relative valuation of lifetime annuities versus flexible drawdown products in a cross-country context where we provide multiple opportunities to learn about product features and the implication of potential choices. Our countries of investigation are Australia and The Netherlands which have similar multi pillar retirement income arrangements, yet quite different payout structures. The Dutch mandatory income 2
4 replacement pillar is almost always annuitized, while Australian retirees are offered choice of retirement benefit, with most taking flexible withdrawal products (Bateman et al., 2016b; OECD, 2017). We designed and implemented an online experimental survey of annuitization choices using iterative multiple price lists (impls) to elicit revealed preferences, which we fielded to representative samples of approximately 1,000 Dutch and 1,000 Australian pre-retirees aged in June The experimental design involves five between-subject treatments - country (Australia, The Netherlands), marital status (single, married), household income (4 levels), information framing (consumption gain, consumption loss, investment gain, investment loss) and product endowment (WTA, WTP). To elicit annuitization preferences we presented participants six within-subject impl tasks. These tasks differ by the benchmark allocation of retirement assets between an annuity product, which we call a Lifetime Guaranteed Income product, and a phased withdrawal product, which we call a Flexible Account product. Before completing the six impl tasks participants are asked about their perception of the two products in terms of understanding, riskiness and level of control. This allows us to examine how participants perceive and value the Lifetime Guaranteed Income product relative to the Flexible Account product. A feature of the experimental design is that participants are provided with multiple opportunities to learn about the two retirement benefit products. First, before completing the six impl tasks, participants are presented with general information about the two retirement benefit products (which differ by frame). Second, they then complete an incentivized product knowledge review quiz for which their responses are reported as correct or incorrect. Third, participants are asked about their perception of the two products (in terms of understanding, risk and control), which induces them to further reflect on the product features. Fourth, when completing each of the six impl tasks participants are reminded of the key product features (which differ by frame), and finally, to assist with their choice for each impl, participants can elect to use an on screen interactive retirement calculator, which shows the possible implications of the take-up of the products. These design features allow us to investigate the impact of information provision and framing on annuitization decisions. Another feature of the experimental design is that participants are randomly assigned to either the WTP or a WTA condition, which allows investigation of the endowment effect. In addition, the six within-subject impl tasks have different benchmark product portfolios which enables investigation of access to liquidity. The comprehensive set of covariates we collect allows us to examine the influence of personal characteristics, access to financial resources, financial capability, propensities to save and plan for retirement and personality traits, and perceptions on and valuation of annuities relative to flexible drawdown products. 3
5 In terms of perceptions, we find that participants who are financially competent and engaged with the experimental survey are better able to understand the product features. Framing effects are present for the Dutch, and participants who have thought more about retirement planning and have a need for income in retirement have a better understanding of the Lifetime Guaranteed Income product. Institutional effects are strong, with Australian participants showing less understanding of the Lifetime Guaranteed Income product, with which they are unfamiliar due to Australian design where flexible drawdowns are the product of choice and the voluntary annuity market has, until recently, been almost non-existent (Iskhakov et al., 2015). For the valuation of annuities (the Lifetime Guaranteed Income product) relative to the flexible drawdown product we confirm earlier studies by finding a gap between the WTP and the WTA. However, the gap in our study is much smaller than in earlier work (Brown et al., 2017a), which we attribute to our experimental design, specifically the repeated opportunities to learn about the products and the provision of a retirement calculator to illustrate potential outcomes. We find limited effects of information framing, which is restricted to participants less engaged in the experimental survey, and confirm earlier studies by finding the influence of wealth illusion: that is, participants with higher income value annuities more than those with lower income. Our study is related to several strands of the literature investigating demand-side explanations for the miniscule interest in longevity products, including the role of information framing; cognition, effort and engagement; and the endowment effect. Literature on framing and annuitization decisions has focused on the impact of alternative presentations of the key product features. Brown et al. (2008a) show that participants are more likely to consider annuities a good retirement choice when presented in a consumption frame (emphasizing spending and living standards) relative to an investment frame (focusing on rates of return and assets). Similarly, Beshears et al. (2014) find significant reduction of the proportion of wealth annuitized under the investment frame and the frame highlighting flexibility and control of a lump sum. Agnew et al. (2008) consider the impact of loss and gain frames and find that participants are more (less) likely to opt for the annuity option if the provided information favorably biased towards annuities (investment). In the context of Social Security Benefits (SSB) claiming in the U.S. Brown et al. (2016) find no effect of consumption frame versus investment frame although this could be explained by U.S. retirees being more familiar with SSB than annuities, which would make them more capable of making the tradeoff between regular income and a lump sum. Finally, in the context of a large Dutch pension fund Bockweg 4
6 et al. (2018) find heterogeneity of framing impacts across demographics, risk attitude and institutional environment. We contribute to this literature by studying consumption gain/loss, investment gain/loss framing of annuities in a cross country context to investigate the impact of real-world institutional differences. We do so by implementing the same experimental task to Dutch (familiar only with full annuitization of state and private pension benefits) and Australians (familiar with annuitized state pension benefits but full flexibility of private pension benefits). We also supplement the framed information with multiple opportunities to learn about product features and potential outcomes. While we find minimal framing effects overall we do find that real-world institutional settings matter for perceptions of the flexible drawdown products by the Dutch, who have no real-world experience with such products. As well, less engaged participants are more likely to be influenced by information framing. More recent literature has considered the importance of cognition and effort on retirement benefit decisions. Brown et al. (2017b) find that complexity of an annuity product reduces participants ability to value annuities although broad bracketing - jointly thinking about the annuitization decision and the pace of how quickly to spend down assets in retirement - increases participants ability to value these products. Bateman et al. (2016a) find that more numerate participants who put effort into understanding product features chose more longevity insurance at higher ruin risks. We contribute to this literature by investigating the impact of repeated opportunities to learn about product features as well as potential outcomes, using an interactive calculator on perception and valuation of annuities of both engaged and less engaged participants. We less find less confusion in annuity valuation (measured by the gap between WTP and WTA) than in prior studies. Finally, a related strand of the literature on the attractiveness of annuities has investigated the effect of the reference point (or endowment effect). Brown et al. (2016), Brown et al. (2017b) and Brown et al. (2017a) all show a significant endowment effect (status quo effect) in the valuation of SSB. For those Americans in receipt of SSB the value of buying an additional $100 monthly SSB is much less than selling the additional $100 monthly SSB. In related work Reb and Connolly (2007) show that the main driver of the divergence between WTP and WTA is due to subjective feelings of ownership. 1. As in these studies we investigate the endowment effect by analyzing the gap between WTP and WTA. We also find an 1 Whereas delaying SSB is a way to annuitize wealth, caution should be taken to extrapolate these findings to private retirement benefit decisions. First, almost half of Americans either claim SSB at the earliest age that they qualify for it or when they retire (Munnell and Chen, 2015). This indicates that they might not see delaying SSB using savings to provide an income for some years- as purchasing a (cheap) annuity. Second, people s attitude towards the government and the (political) risk associated with SSB may play a role in the perceived attractiveness of SSB 5
7 endowment effect, however the gap (between WTP and WTA) in our study is much smaller, particularly for engaged participants. We attribute this to our experimental design which reduces cognitive load through multiple opportunities to learn about the product features and the interactive calculator which provides potential outcomes from alternative product choice. The paper proceeds as follows. Section 2 describes the experimental design, including the five betweensubject treatments and the six within-subject impl tasks, and describes the covariates we collect. Section 3 reports regression results on perceived understanding of the retirement benefit products, while section 4 analyses the factors that explain the valuation of annuities relative to flexible drawdown products. Section 5 concludes. 2 Experimental survey design We designed and implemented an experimental survey to investigate the effect of information provision (including framing), the endowment effect, and the influence of personal characteristics on annuitization decisions. In the experimental setting participants are asked to select portfolios of retirement benefit products comprising life annuity and phased withdrawal products. We refer to the lifetime annuity as a Guaranteed Lifetime Income product, and the phased withdrawal product as a Flexible Drawdown product, and carefully describe key product features in order to address pre-existing lack of awareness and understanding (Bateman et al., 2016a). The Guaranteed Lifetime Income product includes state pension payments, and we remind participants of this each time they complete a task. We utilize revealed preferences elicited from iterative multiple price lists (impl) to allow us to control for information provision, and the experimental setting allows us to conduct a cross country analysis by minimizing effects induced by institutional arrangements. In June 2017 we surveyed 1,000 Australians and 1,003 Dutch aged who are either not retired or part of a couple where at least one is not retired. Participants were sourced from a panel maintained by Survey Sampling International who manage a subject pool of over 500,000 Australians and 300,000 Dutch. Participants were paid up to A$7 in Australia and e5 in the Netherlands for a completed survey, which had a median time of completion of 35 minutes. Screen shots of the Australian and Dutch surveys are available in the Supplemental Materials, and live versions of the two surveys can be found at (Australian version) and http: //survey.us.confirmit.com/wix/1/p aspx (Dutch version). 6
8 2.1 impl methodology The use of multiple price lists (MPL) to elicit willingness to pay has a long tradition in economics and decision making: see for example Kahneman et al. (1990). The advantage of the MPL method is that it is relatively straightforward to elicit preferences where participants are presented with a range of ordered prices and asked to indicate yes - I would choose or no I would not choose for each price. A disadvantage, observed in prior studies, is that participants may exhibit multiple switching behavior, in contravention to economic theory (see e.g. Bruner, 2011; Holt and Laury, 2002 or Goeree et al., 2003). To prevent such seemingly irrational behavior, Harrison et al. (2005) introduced switching MPLs (smpl). In a smpl monotonicity is enforced by asking a participant to select one switching point. This is enabled by using a price list where the participant indicates for one of the trade-offs whether he prefers Option A or Option B, and the other trade-offs are filled automatically. Hence, for the trade-offs on the price list above the one selected, the choices will automatically be set to Option A and for the trade-offs in the list below the one selected the choices will automatically be set to Option B. The smpl mechanism has several advantages. First, it reduces effort since the participant is required to select just one of the options to indicate preferences for all trade-offs on the list. Second, as the order of attractiveness of the trade-offs on the list is explicit, it enhances participant understanding of the task, which reduces cognitive load. An extension of the smpl method is the iterative MPL (impl) method which consists of multiple (typically two) rounds of smpl. In the second round participants are asked to refine their choice from the first round. The range of alternatives presented in this second round are between the two alternatives from which the participant has switched from Option A to Option B in the first round. Andersen et al. (2009) show that the impl method generates more precise estimates and tends to mitigate initial presentation and order effects that are present with the MPL method. This is particularly important in retirement savings allocation, as previous studies (see e.g. Hedesstrom et al., 2004; Bateman et al., 2017) have shown that such decisions are prone to heuristic choice rules. The advantage of using impl is that, with limited number of alternatives presented to a participant, we can create a multiple of this number of alternative switching points (including always choosing Option A and always choosing Option B) without overloading the participant with choice alternatives. In the experimental task, which we will discuss in Section 2.3.4, the participant has to consider only five tradeoffs in the first stage of the impl and four trade-offs in the second stage. This creates 30 switching points. Yet, in order to implement the impl, we need participants to switch only once. 7
9 Table 1: Between subject treatments Treatment # of conditions Characteristics of conditions Country of residence 2 NL/AU Marital status 2 Couple/Single Retirement income (for full annuitization) 4 See Table 2 Information framing 4 Consumption Gain/ Consumption Loss/ Investment Gain/ Investment Loss Product endowment 2 WTA/WTP 2.2 Between subject treatments The experimental survey is designed with five between-subject treatments and, as discussed in Section six within-subject treatments (impl tasks). The survey starts with preliminary questions to screen for the required sample characteristics and to allocate participants to the between-subject treatments. The treatments are summarized in Table 1. The first treatment is the country of residence. There are two treatment groups: Australia and the Netherlands. The difference between these treatments is the language of the survey instrument (English versus Dutch) and the currency (A$ versus e) used in the survey and tasks. Currencies are converted using pricing power parity (PPP). 2 The second treatment relates to the marital status of the participant with two treatment groups: single, part of a couple. We consider the annuitization decision to be a household decision and therefore this distinction is relevant. For participants who are part of a couple, the annuity (referred to in the experimental task as a Lifetime Guaranteed Income product) is joint with two-thirds reversion to the survivor, whereas a single participant is presented with a single life annuity. Therefore, information for a participant who is part of a couple is presented as you and your partner, whereas for a single it is presented as you, and the values in the experimental task use different prices for the single life annuity and the joint and survivor annuity. The third treatment relates to the participant s net retirement income. Participants are allocated to one of four post retirement (net) income groups using their answer to a question on current gross household income which we ask at the beginning of the survey. The allocation is made such that it roughly aligns to the household income the participant typically could expect when retired. We take this approach to ensure that a participant s hypothetical retirement wealth (either (partially) annuitized or not) in the experimental context is reasonably well aligned with their personal circumstances. The advantage of doing so is twofold. First, it makes the experimental task more relevant to the participant 2 Using OECD PPP, e1 = A$ see 8
10 and reduces the possibility that the participant is alienated by an unrealistic hypothetical situation. Second, the treatment allows us to investigate the effect of the retirement income distribution on the attractiveness of annuities. We use a participant s current gross household income as a proxy for post-retirement income, rather than their actual retirement savings at retirement, for two reasons. First, it allows us to perform a crosscountry analysis between two countries with two different retirement systems (e.g. in the Australian DC system the accumulated balance is actual retirement savings, whereas in the Dutch DB system, retirement savings are represented as accrued retirement income). Second, we expect that participants may not know their current retirement savings, let alone the retirement savings they would have accrued by the time they retire. Given that both Australia and The Netherlands have a mandatory retirement saving scheme, we judge that using household income as a proxy may have a smaller reporting error than a retirement savings question. A further advantage of using the income distribution (and state pension level) in Australia and the Netherlands is that they are very comparable, which makes it a suitable mechanism for allocating participants to one of four treatment groups in the cross-country analysis. The cut-off points for gross household income are set using Australian household income quartiles. 3 The four income treatment groups (net retirement income level in case of full annuitization) for each of Australia and the Netherlands are presented in Table 2. 4 The last two treatments relate to the framing of the product information and the product endowment, which are discussed in detail in the next subsection. 2.3 The experimental task After the initial screening and income treatment allocation question the participant proceeds to the experimental task, which has six stages. First, the participant is presented with information about the two retirement benefit products included in the experimental task. Second, the participant completes an incentivized product knowledge quiz. Third, the participant is asked about his/her perception of the two 3 The numbers are rounded from ABS Table ?OpenDocument and rounded to the closest 2,500. Dutch values were obtained by converting these values into euros using PPP and rounded to the closest 2,500. These align well with the Statistics Netherlands average gross household income for year old of e17,500; e35,300; e60,800; and e128,700 for the four quartiles. 4 For the middle income groups, the allocated net retirement income are set by taking the average of the lower and upper income levels for both the Netherlands and Australia (converted using PPP) and multiplied with 0.7 (income group 2) and 0.65 (income group 3) to account for income tax and replacement rate. For income group 4 we take the average between the Netherlands and Australia (using PPP) of the lower level of income group 4 plus half of the increment of income group 3 and multiplied that with 0.6. For income group 1 we take the average between Australia and the Netherlands (using PPP) of the corresponding upper income level and multiply it with 0.82 (note that for people with only state pension, Australians do not pay any income tax, and Dutch only pay around 5% average income tax). 9
11 Table 2: Household income levels Group Gross household income Full annuitized Lower level Upper level retirement income (net) Australia (A$) 1 47,500 38, ,500 79,999 44, , ,999 67, ,000 90,959 Netherlands (e) 1 27,500 22, ,500 44,999 25, ,000 74,999 38, ,000 52,579 products. Fourth, the iterative multiple price list (impl) method is carefully explained to the participant using an example. Fifth, the participant completes the experimental component of the survey comprising six within-subject treatments (impl tasks). Sixth, for each of the six treatments the participant is asked how likely it would be that they would actually exchange the one retirement benefit product for the other, given their responses in the experimental task First stage: Information and information framing The experimental task begins with the presentation of general information about the experimental component of the survey and the tasks to be completed. Participants are informed that they will be presented with information about two retirement benefit products and will be asked to complete a product knowledge quiz for which they can earn additional monetary rewards. We include the incentivized product knowledge quiz to encourage participants to learn about the products and their features to increase the likelihood that they make informed decisions in the impl tasks. Participants are then randomly assigned to one of four framing treatment groups and receive framed explanations of the general features of the two retirement benefit products. The text of the general features of the two retirement benefit products for the four frame treatments is presented in Table 3. Framing in the context of annuitization has been considered in two dimensions, namely consumption versus investment framing and gain versus loss framing (Agnew et al., 2008; Brown et al., 2008b; Bockweg et al., 2018). The four framing treatments we consider are: consumption gain, consumption loss, investment gain and investment loss. When participants are allocated to a particular frame treatment, this applies to both retirement benefit products. Relevant words are emphasized by presenting them in bold. In the consumption frame the general product information informs the participant of the effect of the 10
12 Guaranteed Lifetime Income product This product provides guaranteed income for your regular expenses for as long as you and your partner live, even if you or your partner live longer than expected. The more you buy of this product the more you have for regular expenditures for the rest of your life. This product provides guaranteed income for your regular expenses for as long as you and your partner live, even if you need more for unexpected expenses. The more you buy of this product the less flexibility you have for unexpected expenses. Table 3: Frames for general product features Flexible Account product Consumption Gain Consumption Loss This product allows you to choose you and your partners income level depending on your expenses. If the account balance is sufficient you will be able to pay for unexpected expenses while maintaining the same standard of living. The more you buy of this product the higher the flexibility you will have to match your expenditures. This product allows you to choose your income level depending on you and your partner s expenses. If the account balance is insufficient you will not be able to pay for unexpected expenses and you may not be able to maintain your standard of living. The more you buy of this product the lower your flexibility to match expenses when your account balance is insufficient. Investment Gain This product provides you with a guaranteed return This product allows you to choose your investment for as long as you live even if the financial markets portfolio. The more risk you re willing to take, perform poorly. If you or your partner live long the higher the expected return. Any remaining then you get more than you paid for. The more you buy of this product the higher the gain when you live long. This product doesn t allow you to take any risk. If the financial markets perform well the value of the product will not increase. If you and your partner die early then you get less than you paid for. The more you buy of this product the more you lose when you or your partner do not live long. Investment Loss account balance is inherited by your dependents or estate when you and your partner die. The more you buy of this product the higher your account balance if financial markets perform well. This product allows you to choose your investment portfolio. The less risk you re willing to take the lower the expected return. Your account balance might be insufficient if you or your partner live long. The less you buy of this product the lower your account balance if the financial markets perform well. products on possible expenditure patterns by emphasizing the words income, expenses and standard of living. In this frame, the trade-off between the two products is having certainty about lifelong income versus having the flexibility to match income with (unexpected) expenditures. In the investment frame the information provided informs the participant of the effect the products have on possible annual returns, by emphasizing the words return, portfolio and account balance. In this frame, the trade-off is between the possibility of earning an excess return versus hedging risk. This occurs in the financial market domain as well as the mortality domain (e.g., outliving your money, setting aside bequests). A further difference is that the investment frame includes information on whether the product enables bequests, which is not included in the consumption frame. In the gain frame the general product information is presented in a positive manner - that is, emphasizing the benefits or advantages of the product. On the contrary, in the 11
13 loss frame the general product information is presented in a negative manner that is, emphasizing the downside of the products. Following the provision of framed general product information, the participant is presented with information about the specific product features. As compared to the presentation of the general product features, which differs according to the framing treatment to which the participant is allocated, the specific product features are designed to be frame-neutral and are therefore the same for all participants (with only slight differences when the participant had a partner). For example, frame-neutral product features for the Lifetime Guaranteed Income product and the Flexible Account product are presented in Table 4 for participants who are part of a couple. For singles, you and your partner is replaced by you and the product feature What happens if I or my partner dies? is not presented. Table 4: Product features How much income will I receive? How long do payments last? What happens if I or my partner dies? What happens if I and my partner die? What happens if the prices of things I buy increase? What happens if there are fluctuations in financial markets (such as interest rates or share prices)? What happens if I live longer than expected? Lifetime guaranteed income product You and your partner will receive a regular income Your regular income will be paid for as long as you or your partner live If one of you passes away, the surviving spouse will receive the regular income. However, the income will be reduced by one third (similar to age pension) If both you and your partner have passed away, there will be no inheritance for your dependents or your estate Your regular income is automatically adjusted to the price level Your regular income will be unchanged As long as you or your partner live, you will receive a regular income Flexible account product You can choose how much to withdraw each month You and your partner can continue to withdraw as long as your account balance is positive If one of you passes away, any remaining money in your account will be left to the surviving spouse If both you and your partner have passes away, the remaining money in your account will be inherited by your dependents or your estate The amount you withdraw is not automatically adjusted to the price level. However, you can increase the amount you withdraw when the prices increase Your account balance will fluctuate with financial markets When you or your partner live long you may run the risk of outliving your account Second stage: Product knowledge quiz Following presentation of general product information (by frame treatment) and the specific product features (frame-neutral), participants complete a product knowledge quiz. Here the participant is asked 12

14 to indicate which product features relates to which of the two retirement benefit products. The goal of the product knowledge quiz is twofold. First, to incentivize participants to learn about the products, to enable them to make informed choices in the experiment task. Second, to provide participants with feedback on their performance (product knowledge) by providing the correct answers (to any incorrectly answered questions) once they had submitted the answers. Providing feedback for incorrect answers gives the participants another opportunity to learn about the product features. A screenshot of the product knowledge quiz, including the feedback screen is presented in Figure 1. Figure 1: Product knowledge quiz. From Table 5 we observe that participants have on average four out of five questions correct, but only 44% (43% in the Netherlands and 45% in Australia) made no mistakes. The questions with most mistakes concern whether the remaining wealth can be a bequest and whether the retirement benefit product is subject to financial market risks. Slightly more Australian than Dutch participants did not know that the Flexible Account product s remaining account balance could be a bequest. However, surprisingly, slightly more Dutch than Australians did not know that payments from the Guaranteed Lifetime Income product do not depend on the financial market, despite lifetime annuities being the most prevalent (and often only) type of retirement benefit. A possible explanation is the close link between benefit indexation and the funding ratio of the fund in Dutch pension design, which ordinary people may mistakenly attribute 13
15 to financial market performance. Table 5: Product knowledge quiz Percentage correct answers per question Total number of mistakes Netherlands Australia Sample Netherlands Australia Sample Q % 92.40% 93.81% % 45.20% 44.03% Q % 85.10% 84.22% % 22.20% 23.66% Q % 65.50% 68.40% % 20.70% 18.96% Q % 70.50% 70.09% % 10.80% 12.13% Q % 86.10% 80.63% % 1.10% 1.15% Average 78.94% 79.92% 79.48% % 0% 0.05% The left panel of the table displays the percentage of participants who had, for each of the questions displayed in Figure 1, the correct answer. The last row of the left panel corresponds to the average of the five questions of the percentage of participants who had the correct answer. The right panel displays the percentage of participants who had 0 to 5 mistakes in the product knowledge quiz Third stage: Product perception Following completion of the product knowledge quiz participants are asked about their perception of each retirement benefit product in terms of understanding of the product, riskiness of the product, and level of control that the product would allow. Responses were collected using a Likert scale with values between 0 and 10. These variables aim to measure the individual s perceived ambiguity, risk and flexibility associated with each of the products and these questions are asked before the six impl tasks, to induce participants to further consider the features of the products before completing the choice tasks. Table 6 reports responses to the 0-10 Likert scale. We observe that on average, participants in Australia and the Netherlands report a similar perceived understanding of the products. The Lifetime Guaranteed Income product is seen by both subsamples as a less risky product. More Dutch participants report a higher perceived risk for the Flexible Account product compared to the Lifetime Guaranteed Income product. This is expected given their unfamiliarity with the Flexible Account product. The Dutch participants self-report a slightly better understanding of the Guaranteed Lifetime Income product (lifetime annuity) than the Australian participants, which is consistent with previous studies which identified poor knowledge of seemingly standard benefit product features (Bateman et al., 2016a). Australian participants respond that Flexible Account products give them much more control, in contrast to the Dutch participants. This is expected as Australians are familiar with Flexible Account products 5, whereas the 5 The account-based pension a type of flexible account product is the most popular type of retirement benefit product (Bateman and Piggott, 2010). 14
16 Table 6: Product perception -10 to -6-5 to to 5 6 to 10 Understanding NL 0.10% 1.10% 3.49% 68% 17.25% 9.17% 0.90% Understanding AU 0% 2.20% 6.60% 76% 10.10% 4.80% 0.30% Understanding 0.05% 1.65% 5.04% 71.99% 13.68% 6.99% 0.60% Riskiness NL 0.40% 5.28% 5.38% 23.93% 6.08% 32.10% 26.82% Riskiness AU 0.80% 5.10% 5.50% 26.80% 8.60% 35.50% 17.70% Riskiness 0.60% 5.19% 5.44% 25.36% 7.34% 33.80% 22.27% Control NL 15.45% 18.25% 6.48% 28.61% 8.37% 17.75% 5.08% Control AU 23.50% 29.90% 7.40% 25.80% 5.70% 6.50% 1.20% Control 19.47% 24.06% 6.94% 27.21% 7.04% 12.13% 2.15% This table displays the difference in the response to the questions for the Lifetime Guaranteed Income product and the Flexible Account product. A higher value implies that the Lifetime Guaranteed Income product is perceived to have more favorable features than the Flexible Account product. The top panel corresponds to the question: How well do you think you understand the features of...?. The middle panel corresponds to the question: How risky do you think the... is? The lower panel corresponds to the question: How much control do you think you have with the...? The first row of each panel includes the only Dutch participants, the middle rows only Australian participants and the last rows both Dutch and Australian participants. Dutch are more familiar with lifetime pensions (a form of Lifetime Guaranteed Income product) Fourth stage: impl task instructions The aim of each impl task is to identify the switching point in preferences between two portfolios of the two retirement benefit products - the Lifetime Guaranteed Income product and the Flexible Account product (designated as Option A and Option B ). Before participants proceed to the six impl tasks, they are presented with an example of the impl method over a series of five screens. 6 The first screen provides an overview and on the following four screens the participant is taken through an example of the iterative multiple price list choice task. To reduce the likelihood that the worked example would guide participant decisions in the actual impl tasks, the example avoids monetary amounts which are similar to those presented in any of the four income treatments. On the first screen of the example, the trade-off between Option A and Option B for first row of the first stage of the interactive multiple price list (impl) is explained. The second screen explains the trade-off for the last row and the third screen for a row in the middle. The last screen (see Figure 2) provides information about stage two - the iterative part of the impl task. 6 The theoretical explanation of the impl task is provided in Section

17 Figure 2: Example Fifth stage: main experimental task Following the worked example, participants proceed to the six iterative multiple price list (impl) tasks. For each impl task, the general product features for the two retirement benefit products are presented at the top of the screen, consistent with the framing treatment to which the participant has been allocated (see Table 3). This ensures that participants are reminded of the framed product features as they complete each task. For each impl task, the participant is asked to indicate preferences for first five (stage one), then four (stage two) alternative trade-offs between two portfolios of retirement benefit products (which can be purchased with the wealth to which they have been allocated). That is, the participant is asked to indicate whether he prefers the portfolio of retirement benefit products in Option A or the portfolio of retirement benefit products in Option B. The portfolios comprise some amount in a Flexible Account product and some amount as a Guaranteed Lifetime Income product. For a given impl task, Option A has the same allocation to the retirement products in all the alternatives (the five alternatives in stage one and the four alternatives in stage two). In Option B either the Lifetime Guaranteed income product or the Flexible Account product has an increasing allocation (as one moves between alternatives in the 16
18 multiple price list), whereas the value of the other product, whether it be the Flexible Account or the Lifetime Guaranteed Income product), remains the same for all alternatives. To assist participants with a given task, a simple retirement calculator appears under each choice set showing the possible implications (of the product allocations) for the drawdown of the products. The retirement calculator provides two possible draw down patterns, one for the combination of products in Option A, and one for the combination of products in Option B. For Option B we display the possible draw down pattern for the first alternative for which the participant prefers Option B over Option A. Note that Option A has the same allocation to the two retirement benefit products in the five alternatives, so the possible draw down pattern for Option A is the same for all the shown alternatives in a particular choice task. The retirement calculator allows participants to adjust four assumptions relating to the product features which could make the products attractive: 1) the last age at which the Flexible Account makes a payment (where the range of possible values is between 80 and 110, in 5-year intervals, with a default of 80 years); 2) the amount of money the participant prefers to set aside for unexpected expenditures or bequests (where the participant can choose any value and the default is set at zero); 3) the option to have a higher income in the first five years (either yes or no, with the default set at no); and 4) the expected return in excess of the inflation rate for the Flexible Account product (where options range from 0% to 7%, with increments of 1%, and the default is set at 1%). The calculator defaults are set the first time the calculator is used, however, in later impl tasks, the default settings are those values previously used by a given participant (which may be the original or revised assumptions). We take this approach because, for a given participant, assumptions should be consistent across impl tasks, and by doing so we reduce required effort as the participant does not have to re-set his preferred assumptions for each task. Between-subject treatment: Product endowment Participants are allocated to one of two product endowment treatments: either a willingness to pay (WTP) for additional lifetime income from the Guaranteed Lifetime Income product or willingness to accept (WTA) a reduction in lifetime income from the Guaranteed Lifetime Income product. In the WTP (WTA) treatment, the values of the Guaranteed Lifetime Income (Flexible Account) product in Option B are increasing and higher than in Option A. Option B has a lower Flexible Account (Guaranteed Lifetime Income) than in Option A. The implicit question for the participant in the WTP frame is -suppose you have the portfolio in Option A- would you decrease your Lifetime Guaranteed Income by A$X to receive an additional A$Y in your Flexible Account? The implicit question for the participant in the WTA frame is -suppose you have the portfolio in Option A- would you reduce your Flexible Account by A$X 17
19 to receive an additional A$Y Lifetime Guaranteed Income. The value of X depends on the question and the value of Y increases with the alternatives in the list? Within-subject treatments: Product allocation In the experimental task, each participant is shown six different impl choice sets. For each of these six choice sets we first constructed the benchmark options A and B with an allocation to the two retirement benefit products. The next four alternatives in each choice set are based on composition of the benchmark options. The benchmark portfolios in the six impl choice sets vary by the proportion of annuitized retirement wealth in addition to state pension. This retirement wealth which can be used to supplement the Lifetime Guaranteed Income product or be incorporated into the Flexible Account product. This is calculated by the difference between the retirement income, as given in Table 2, and the level of state pension. The state pension income level for couples is set by taking the average of e20,000 and A$35,000. For singles it is two-thirds of that amount. Since there are six choice sets, there are six benchmark portfolios with levels of annuitization as follows: 100% annuitization for Option A and 2/3 annuitization for Option B; 100% for Option A and 1/3 for Option B; 100% for Option A and 0% for Option B; 2/3 for Option A and 1/3 for Option B; 2/3 for Option A and 0% for Option B; and 1/3 for Option A and 0% for Option B. The fraction of retirement savings which is not annuitized is converted into the Flexible Account using an annuity factor of for couples and for singles. 7 The order of the six within-subject treatments (choice sets) is randomized to prevent order effects driving the results as participants progress through the treatments. Alternatives in the task Whereas the WTP frame shows increasing impl values for Option Bs Guaranteed Lifetime Income product, the WTA frame has increasing values in Option As Flexible Account product. The level of variation depends on the benchmark portfolio and set multiplication factors. For the WTP (WTA) treatment, the alternative values for Option B (Option A) are set by multiplying the difference between the benchmark Guaranteed Lifetime Income (Flexible Account) in Option A (Option B) and adding that to the Guaranteed Lifetime Income (Flexible Account) of Option B (Option A). For the first round of the impl the multiples are 0.5, 0.707, 1, 1.414, and 2 (see first column of Table 7). Thereafter, in the second round, depending on the choice in the first round, the participant is shown four alternatives. The increments are chosen such that they are log-linear (see columns 3-6 of Table 7). The alternative at which the participant switches in the second round is used to determine the price 7 The annuity factors were calculated as the net present value of an income stream with a duration of 26 (for couples) or 19 (for singles) years and an interest rate of 1%. 18
20 Table 7: Money s worth ratio in the various alternatives First round Second round Always choose Option A: Switch to Option B in first row: Switch to Option B in second row: Switch to Option B in third row: Switch to Option B in fourth row: Always choose Option B: This table displays the money s worth ratio used for setting the alternatives in the task for the WTP treatment. For the WTA treatment the inverse of the numbers is used. The money s worth ratio is the actuarially fair price of the income stream divided by the price of the Lifetime Guaranteed Income product. A number smaller (larger) than one implies that the annuity is more (less) expensive than the actuarially fair price. they are willing to pay for an annuity. This includes always choosing Option A, to which we assign the value 1/3. In case of the WTA (WTP) treatment the price of the annuity for which the participant is willing to buy is equal to the price of the annuity multiplied by (the inverse of) the midpoint of the values in Table 7 corresponding to the rows where the participant switches. For the WTA frame the values in Table 7 can thus be interpreted as the multiple of a fair price, whereas for the WTP treatment it would be the inverse of the values in the table Sixth stage: Likelihood to act One of the disadvantages of using the MPL format is that hypothetical experimental responses might be prone to substantially overestimate WTP (see, for example Cummings et al., 1997). 8 Blumenschein et al. (2008) found that assessing the degree of certainty of the hypothetical responses with Choice Contingent Valuation (see, e.g. Champ et al., 1997 using a ten-point scale, Johannesson et al., 1998 using a dichotomous choice) is effective in mitigating hypothetical bias. Therefore, following the six choice sets we ask participants for each of the six choices how likely is it that you would reduce your Lifetime Guaranteed Income by $X to receive an additional $Y (the reported amount) in your Flexible Account? and in the WTA frame how likely is it that you would use $X from your Flexible Account to buy an additional Guaranteed Lifetime Income of $Y (the reported amount)? The responses are collected on a Likert scale with values between 0 and 10. Each of the six questions starts with Suppose you have $A in your Flexible Account and a Lifetime Guaranteed income of $B. To prevent cognitive exhaustion, all six questions are displayed on one screen, in the non-randomized order described in Section This is not found in all studies, for example, Carson et al. (1996) suggest that values from hypothetical choice and revealed preference studies match fairly well. 19
21 2.4 Covariates After completing the experimental task, participants are asked questions about planning and their personality traits, pension arrangements and financial competence, and demographics and personal characteristics. These variables are collected for two purposes. First, we are interested in whether they could explain any heterogeneity of participant s valuation of the Lifetime Guaranteed Income product (that is, the annuity). Second, once we correct for the main heterogeneity in the collected variables, the remaining country differences in valuation of the Lifetime Guaranteed Income product would be due to differences in social norms and institutional settings between the Netherlands and Australia. Financial capabilities We collect three variables related to financial capabilities. First, the variable SA fin lit is a self-assessed financial literacy measure elicited using a Likert scale from 1 to 7 where 1 means a very low and 7 means a very high understanding of finance. Second, the variable Fin lit is the number of correct answers to the three standard financial literacy questions from Lusardi and Mitchell (2011), while the variable Numeracy is the number of correct answers to the three numeracy questions from Lipkus et al. (2001). Retirement income replacement rate Three variables are collected to measure household wealth. First, the variable Household Income is a categorical variable representing the four categories of income, see Table 2. Second, the variable Homeowner is an indicator variable for whether the participant is a homeowner or not. Being homeowner can been seen as providing an income from the imputed rent. Third, the variable Wealth, which is household wealth excluding owner-occupied housing wealth and retirement savings. This is a categorical variable with four outcomes: less than $0 in Australia (less than e0 in the Netherlands), between $0 and $34,999 (between e0 and e19,999), between $35,000 and $104,999 (between e20,000 and e59,999) and more than $105,000 (more than e60,000). Health & life expectancy We collect three variables related to the health and longevity of the participant. First, Health is an indicator variable which equals one if the self-assessed health is either very good or excellent and zero if poor, moderate or good. Second, the variable SLE-OLE is the difference in years between the participant s subjective life expectancy elicited in the survey and the objective life expectancy (from either the Australian Bureau of Statistics or Statistics Netherlands). The objective life expectancy includes further forecast improvements in life expectancy and is provided to participants as part of the subjective 20
22 life expectancy question. Third, the variable Outlive partner is elicited using a Likert scale from 0 to 10 for the question how likely do you think you will outlive your spouse or partner, where 0 is very unlikely and 10 is very likely. Saving & planning We include six variables designed to measure savings habits and financial planning. The first variable is Savings habit which is the average of twelve questions from Loibl et al. (2011) answered using a Likert scale from 1 to 7. The second variable is Spending horizon which is an indicator variable which equals one if the most important time horizon for planning expenditures and savings is not more than the next couple of months and zero otherwise. The third variable is Future time which is the average of six questions from Jacobs-Lawson and Hershey (2005) answered using a Likert scale from 1 to 7 where a higher number indicates that the participant is more forward looking. The fourth variable is Fin plan which is an indicator variable for whether the participant has ever tried to work out how much they need to save for retirement. The fifth variable is SA planning knowledge which is the average of six questions related to retirement planning from Jacobs-Lawson and Hershey (2005). The sixth variable is SA retirement distance which is a variable measuring whether retirement will occur for the participant in the near future or in the distant future, with answers on a Likert scale from 1 to 7. Personality traits We include three covariates relating to psychological personality traits. In the survey we collect the ten item TIPI questions from Gosling et al. (2003), providing us the big 5 personality traits. In addition, we collect the conscientiousness measure used in Agnew et al. (2013) and Agnew et al. (2016). The covariates are then standardized. 9 We combine the standardized conscientiousness measure from Gosling et al. (2003) and Agnew et al. (2013) and construct the covariate Conscientiousness which equals one if the participant has a higher than the median score on this measure. We construct the Extrovert/Open covariate which equals one if the participant scores higher than the median on the combined standardized extroversion and standardized openness to new ideas measure from Gosling et al. (2003). We construct the Agreeable/Emotional covariate which equals one if the participant scores higher than the median on the combined standardized agreeable and standardized emotional measure from Gosling et al. (2003). We also include two variables for the economic utility parameters. First, the variable Risk is derived 9 We also collected the impulsiveness measure used in Tsukayama et al. (2012). To reduce the number of covariates, we performed a factor analysis on the seven variables, which signals that there are 3 factors. We therefore construct three covariates, where each of the constructed covariates are constructed by selecting the standardized personality measures with the two highest (in absolute values) factor loadings. 21
23 from the Dohman et al. (2011) question How do you see yourself: Are you generally a person who is fully prepared to take risks in financial matters or do you try to avoid taking risks in financial matters?. The question is answered using a Likert scale from 0 (not prepared to take risks) to 10 (fully prepared to take risks). Second, the variable Patience is elicited using a question from Becker et al. (2012) asking How do you see yourself: Are you generally an impatient person or someone who always shows great patience?. The question is answered using a Likert scale from 0 (very impatient) to 10 (very patient). Demographic characteristics We collect several personal characteristics variables as follows. The variable Age is the age of the participant in years. The variable Female is an indicator variable for whether the participant is female or not, the variable Single is an indicator variable of whether the participant is single or not, and the variable Children is an indicator variable of whether the participant has children or not. The variable Bachelor s degree is an indicator variable which equals one if the respondent had at least a bachelor degree and zero otherwise. The variable In labor force is an indicator variable for whether the participant is working -either part-time or full-time- and the variable Self-employed is an indicator of whether the participant is self-employed or not. Representativeness of the sample Table 8 compares the country sub-samples with population characteristics from Statistics Netherlands and the Australian Bureau of Statistics Census data. Apart from being slightly more often in the labor force and slightly more educated than the population, the sample is representative. This is due to the constraint in the experimental survey that at least one member of the household should be in the labor force in order to be eligible to participate in the experimental survey. Table 8: Representativeness of the sample Population Sample NL AU NL AU Female 49.93% 51.13% 44.97% 50.00% Single 33.92% 29.48% 31.80% 31.10% Bachelor s degree 31.07% 29.03% 40.28% 33.50% In labor force 68.19% 73.11% 75.45% 77.60% Self-employed 17.11% 14.05% 13.06% 14.00% This table displays the representativeness of the sample for the main personal characteristics. Columns (1) and (2) are population fractions. These population fractions are based on national representative figures from statistics Netherlands and the 2016 Australian Census for year old. Columns (3) and (4) are the experimental survey sample fractions. 22
24 3 Results - perceived product features The attractiveness of the Lifetime Guaranteed Income product and the Flexible Account product should be mainly driven by whether the participant values the guarantees in the former or the freedom of choice in the latter. Moreover, if the participant perceives that he does not understand the product features he would be less inclined to prefer that product. explains participants perception of the products. Therefore, in this section we investigate what As described in Section 2.3.3, we ask each participant three questions for both products to elicit their perceived understanding of the product, their perception of the riskiness of the product and the control they perceive to have with the product. The descriptive statistics reported in Table 7 show that there is some dispersity in the relative difference in perceived product features. To understand the effect the covariates have on the attractiveness of the Lifetime Guaranteed Income product (relative to the Flexible Account product) we first investigate their effect on the perceived product features. For each of the three product features we perform a linear regression on the difference between the reported values of the Likert scale of the two products. The parameter estimates are presented in Table 9, with regressions on the whole sample (columns (3), (6), and (9)) and on the Dutch (columns (1), (4), and (7)) and Australian (columns (2), (5), and (8)) subsamples separately. The latter is to observe whether institutional settings and social norms -which are country specific- might affect the association of the covariates with the perceived product feature. In the regression we also include covariates specific to our experimental design. The covariate Quiz mistakes is an indicator variable which equals one if the participant made at least three mistakes in the product knowledge quiz. The covariate Short time is an indicator variable which equals one if the participant was among the 10% of participants who spent the least time on the survey. At the end of the survey we asked, How clear do you think the questions in this survey are. If the participant reported either Sometimes clear, mostly confusing or completely confusing our indicator variable Confusing equals one and zero otherwise. To investigate the effect of an participant s engagement with the experimental survey, we define a participant as having a low engagement when either the indicator Quiz mistakes or the indicator Short time is equal to one. We interact this low engagement indicator with various covariates, which is represented by the variable name ending with LOW. 10 The covariate Consumption framing is an indicator variable which equals one for the information 10 The indicator LOW is a linear combination of the variables Quiz mistakes, Short time and Short time x Quiz mistakes. Therefore, our specification includes the main effects of the variables with interaction effects. 23
25 Table 9: Regression estimates for product characteristics regressions Understanding Riskiness Control NL AU sample NL AU sample NL AU sample (1) (2) (3) (4) (5) (6) (7) (8) (9) Institutional settings Australian ( 2.97) ( 3.37) ( 8.79) Australian LOW ( 1.09) (2.51) (5.01) Information framing Gain framing (2.10) ( 0.41) (1.31) (2.69) (0.10) (2.02) ( 1.75) (0.23) ( 0.95) Consumption framing ( 0.68) (0.53) (0.00) ( 2.37) (0.07) ( 1.57) (1.63) (0.17) (1.35) Gain framing LOW ( 2.98) (0.62) ( 2.13) ( 0.94) ( 0.03) ( 0.78) (0.79) ( 0.91) ( 0.21) Consumption framing LOW (1.34) ( 0.76) (0.69) ( 0.22) ( 0.20) ( 0.05) ( 1.06) ( 0.34) ( 1.21) Financial capabilities SA fin lit ( 0.17) ( 2.32) ( 1.69) ( 0.65) ( 1.09) ( 1.37) (0.24) (1.24) (0.91) Fin lit ( 0.53) ( 0.43) ( 0.85) (4.38) (2.65) (4.97) ( 1.82) ( 3.31) ( 3.49) Numeracy ( 1.19) (0.40) ( 0.62) (2.64) (3.21) (4.27) ( 3.98) ( 3.68) ( 5.20) SA fin lit LOW ( 0.47) (0.91) (0.09) (1.66) (1.91) (2.35) ( 1.49) ( 1.00) ( 2.34) Fin lit LOW (1.13) (0.25) (1.27) ( 1.74) ( 0.83) ( 1.79) (2.71) (0.77) (2.55) Numeracy LOW (1.27) ( 0.39) (0.43) ( 0.30) (0.10) ( 0.14) (1.26) (2.10) (2.22) Experimental design Quiz mistakes (0.37) ( 0.43) (0.32) ( 1.75) ( 2.73) ( 3.57) (0.16) (2.65) (0.95) Short time ( 0.10) ( 1.55) ( 0.84) ( 1.81) ( 2.44) ( 3.25) (0.31) (1.75) (0.52) Short time x Quiz mistakes ( 0.40) (1.18) (0.28) (0.97) (2.41) (2.66) ( 0.15) ( 1.56) ( 0.37) Confusing (0.63) (0.19) (0.44) ( 1.59) ( 0.71) ( 1.76) (0.18) (2.86) (2.37) Retirement income replacement rate Household income (0.78) (1.19) (2.01) (3.07) (1.59) (3.67) (1.77) ( 1.18) (0.23) Homeowner ( 0.69) ( 2.34) ( 1.89) (1.78) ( 0.31) (1.35) ( 1.29) (0.78) (0.05) Wealth (0.63) ( 0.07) (0.19) ( 1.80) ( 1.89) ( 2.63) (0.74) (0.42) (1.09) Health & life expectancy Health (1.83) (1.71) (2.31) ( 0.37) (0.17) ( 0.37) ( 0.17) ( 0.89) ( 0.89) SLE-OLE ( 0.30) ( 0.67) ( 0.75) (1.59) (1.07) (2.01) ( 1.17) ( 0.92) ( 1.68) Outlive partner (0.81) ( 0.17) (0.26) ( 0.12) ( 0.94) ( 0.78) (1.47) (1.61) (2.35) Saving & planning Savings habit ( 0.89) ( 1.32) ( 1.68) ( 0.98) ( 0.26) ( 1.14) (0.22) ( 0.83) ( 0.51) Spending horizon ( 0.93) ( 0.51) ( 1.14) ( 0.53) (1.77) (1.06) ( 1.39) ( 0.26) ( 0.79) Future time (0.61) (1.38) (1.15) (0.03) ( 0.36) ( 0.28) (0.30) ( 0.57) ( 0.20) Fin plan ( 1.05) ( 0.37) ( 1.43) ( 0.85) ( 0.74) ( 1.42) (1.76) ( 0.46) (0.67) SA planning knowledge (1.03) (1.97) (2.22) (0.84) (0.07) (0.96) ( 0.03) ( 0.90) ( 0.34) SA retirement distant ( 0.78) (0.03) ( 0.52) (0.12) (0.05) (0.25) ( 0.27) (0.57) (0.54) Personality Traits Conscientiousness (0.72) ( 2.00) ( 0.79) (2.04) ( 0.39) (1.27) (0.38) ( 1.39) ( 0.63) Extrovert/Open (0.51) ( 0.40) (0.31) (0.93) (0.85) (1.34) (0.29) (0.79) (0.76) Agreeable/Emotional ( 0.19) (0.13) (0.15) (1.20) (2.15) (2.59) ( 1.71) ( 0.18) ( 1.40) Risk ( 2.08) ( 2.46) ( 3.09) ( 3.96) ( 1.61) ( 4.05) ( 1.62) ( 1.11) ( 2.23) Patience (0.96) ( 0.53) (0.18) (0.38) (0.35) (0.40) ( 0.82) (0.40) ( 0.33) Demographic Age (1.28) ( 1.56) (0.22) (0.81) ( 0.79) (0.10) (0.21) (0.26) (0.29) Female ( 1.00) ( 2.09) ( 2.03) (1.01) (0.67) (1.33) ( 0.49) ( 1.74) ( 1.63) Single (1.59) (0.67) (1.43) (1.41) ( 0.02) (0.90) ( 0.12) (0.66) (0.41) Children ( 0.53) ( 0.88) ( 1.68) ( 0.62) ( 0.31) ( 1.12) ( 0.34) ( 1.05) ( 0.99) Bachelor s degree (1.05) ( 0.82) (0.14) (2.01) (1.83) (2.67) ( 2.39) ( 0.82) ( 2.35) In labor force ( 1.96) ( 0.69) ( 1.86) ( 1.68) (0.32) ( 0.84) (0.87) ( 0.32) (0.47) Self-employed ( 0.79) (0.78) ( 0.42) (1.37) (0.79) (1.33) ( 0.52) ( 0.03) ( 0.52) Constant ( 0.45) (2.63) (1.36) ( 0.20) (1.70) (1.27) (0.09) ( 0.26) (0.49) N 1, 003 1, 000 2, 003 1, 003 1, 000 2, 003 1, 003 1, 000 2, 003 Dependent variable for (1)-(3): Likert scale of understanding LGI product less FA product. Dependent variable for (4)-(6): Likert scale of riskiness FA product less LGI product. Dependent variable for (7)-(9): Likert scale of control LGI product less FA product. t statistics in parentheses; * p< 0.10, ** p< 0.05, *** p<
26 framing treatments Consumption Gain and Consumption Loss (see Table 3 for the description of the frames), while the covariate Gain framing is an indicator variable which equals one for the information framing treatments Consumption Gain and Investment Gain. We now discuss regression results distinguishing between behavioral influences (information framing, institutional settings and financial capabilities), those influences informed by economic theory, and other factors. 3.1 Perceived product features: main behavioral factors Institutional settings Importantly, the institutional design of the retirement income system remains an influence in the perception of the products. Participants perceive as more favourable the product with which they are familiar from their real world retirement benefit arrangements. That Dutch participants are less familiar with drawdown products and more familiar with annuity products, while Australian participants are less familiar with annuity products and more familiar with drawdown products, shows up as significant parameter Australian in the regression. However, for participants who were less engaged with the experimental task, the institutional effects on the perceived riskiness and control of the products are small. 11 We intentionally did not use familiar product names (annuity for the Dutch or account-based pension for Australians) in the experimental task to address participants attributing features and perceptions from their real world experience with similar products. As a result, the participants with low engagement have likely been less able to link the experimental product features to the real world retirement income system and therefore the institutional setting had little effect for the less engaged participants. Information framing As all the information frames are designed to present the same information, the information framing covariates are expected to have no effect. 12 Indeed, for the Australian subsample (columns (2), (5) and (8)) we do not observe any significant effect of these covariates on the difference in understanding of the two products. However, for the Dutch subsample (columns (1), (4) and (7)) we find that information framing does play a role, but the role depends on whether the participant is engaged with the experimental task or not. Where the Dutch participant is engaged, the loss frame will lead to better understanding 11 The effect of less engaged Australians compared to less engaged Dutch participants is the sum of the parameter estimates of the main effect (Australian) and interaction effect (Australian LOW ). 12 Although, as noted earlier, the framing literature is mixed in the retirement benefits context. 25
27 of the product they are not familiar with -the Flexible Account product- as the higher cost of loss will enhance their effort. As a result, they are more aware that the Flexible Account product is more risky, but provides greater control for unexpected expenses in the near future than the Guaranteed Lifetime Income product. For the less engaged participant, however, the information in the loss frame is harder to understand than in the gain frame and the participant is less likely to spend the effort to learn about it. As a result, the less engaged Dutch participant learns less from the loss frame presentation and is therefore more likely to understand the Lifetime Guaranteed Income product than the Flexible Account product in this frame. As a consequence of limited information acquisition by the less engaged participants, the effect of gain versus loss framing is limited for those participants. For a Dutch participant, the consumption frame as opposed to the investment frame, leads to a higher perceived riskiness of the Lifetime Guaranteed Income product compared to the Flexible Account product. This is likely because the consumption frame also highlights consumption in the event of unexpected expenditures, which would require precautionary savings. Financial capabilities The parameter estimates SA fin lit in the Australian subsample suggest that Australians who might think they know enough and have therefore not spent enough time learning about the Lifetime Guaranteed Income product have less understanding of the unfamiliar product. This effect is only present in the Australian subsample. Participants with high self-reported financial literacy are more likely to consider themselves capable of understanding products which are influenced by financial markets. Participants who are better able to understand the guarantee features of the Guaranteed Lifetime Income product are more likely to find the product less risky. We observe that engaged participants who perform better in the financial literacy and numeracy questions perceive the Lifetime Guaranteed Income product to be less risky, but that means less control of their spending. 13 For the less engaged participants, this effect is not present as their limited engagement with the experimental survey has limited their ability to fully understand the guarantee features of the Guaranteed Lifetime Income product. Therefore, the parameter estimates of the variables Fin lit LOW and Numeracy LOW are of similar magnitude, but of the opposite sign to the variables Fin lit and Numeracy. 13 Note that another way to interpret the results is that those who are less able to understand the products are more likely to provide similar answers to the product features of the Lifetime Guaranteed Income product and the Flexible Account product. 26
28 3.2 Perceived product features: main rational (economic) factors Retirement income replacement rate Participants who would require a higher income replacement rate from their retirement savings -given preannuitized state pension wealth- do perceive the Lifetime Guaranteed Income product as more favourable relative to the Flexible Account product than participants who already have substantial income replacement given the existing state pension income. Hence, the variable Household income tends to be positive, whereas the variable Homeowner tends to be negative, as owning a home provides an imputed income equal to the rental costs of the home. Participants who have more wealth see the Flexible Account product relative to the Lifetime Guaranteed Income product as less risky than those who have less wealth. As wealthier participants are more likely to have benefited from investment returns, this result might be driven by a selection effect. Participants who view the stock market as less risky have invested in it and have accumulated larger wealth, whereas participants who view the stock market as risky would not have invested in it and have experienced lower financial returns. Naturally the former group would consider the exposure to the stock market in the Flexible Account product as less risky than the latter group. Health and life expectancy: the money s worth Participants who are in good Health could expect to live long and have a higher need for income products and therefore know more about the Lifetime Guaranteed Income product. The longer the participant expects to live (higher value of SLE-OLE), the more risk he faces of running out of money before passing away. Therefore he would find the Lifetime Guaranteed Income product less risky compared to the Flexible Account product than those who expect to pass away soon. Given the joint and last survivor feature of the Lifetime Guaranteed Income product, having a higher probability of outliving your partner enhances the control of the product as it implies that the last survivor still receives an income. 14 However, as the income is reduced after the death of one member of the household, expecting to live longer reduces the perception of control for the Lifetime Guaranteed Income product. 3.3 Perceived product features: other factors Many of the parameter estimates related to personal characteristics, both the variables related to saving & planning and personality traits, are not significant for the perception of the products at a 5% significance 14 This is particularly the case as it is a decision for the household retirement wealth of both partners. Whereas females are more likely to be the last survivors, they typically have less personal retirement wealth than their partner. 27
29 level. Those who have thought more about financing retirement -in Australia through a higher score on SA planning knowledge- have greater understanding of the Lifetime Guaranteed Income product, likely because they would be more familiar with the state pension, which has similar features to the Lifetime Guaranteed Income product in our experiment. Relatedly, Australians with a higher score for conscientiousness have a higher perceived understanding of the Flexible Account product, as one would expect that they have made effort in the real world to understand the product most associated with Australia s institutional framework. However, the Dutch with a higher score for conscientiousness, perceive the Flexible Account product relative to the Lifetime Guaranteed Income product as more risky, possibly because they are not familiar with the Flexible Account product. In addition, participants (particularly the Australian sub-sample) who score high for the psychological trait Agreeable/Emotional perceive the Lifetime Guaranteed Income product as less risky. This is not surprising as one would expect that they prefer the guarantee features of this product relative to the uncertainty associated with a Flexible Account product. Finally, the negative parameter estimates of Risk indicates that participants who are more willing to take financial risk perceive the product features of the Flexible Account as more favourable compared to the Lifetime Guaranteed Income product than participants less willing to take financial risks. Many of the parameter estimates related to demographics are not significant for the perception of the products at a 5% significance level. An exception is the covariate Female, which is negative and significant possibly indicating that women in this age cohort (50-64) have thought less about how to finance retirement due to modest account balances or pension rights. 15 In line with the findings for financial capabilities, being better able to understand the product features does not have a significant influence on the perceived understanding of the Lifetime Guaranteed Income product relative to the Flexible Account product. This finding holds for financial capabilities (variables Fin Lit and Numeracy), level of education of the participant (variable Bachelor s degree) and effort (variables Quiz mistakes and Short time). 16 Similarly consistent is the result that better understanding of product features leads to perception that the Flexible Account product is more risky, but provides less control relative to the Lifetime Guaranteed 15 For example, in Australia the median pension account balance for a women aged is A$36,000 (ASFA, 2017). 16 Note that the opposite sign but of smaller magnitude of the interaction term Short time x Quiz mistakes than its main effects implies that the effect of participants who had three or more mistakes in the product knowledge quiz and were within the 10% fastest completions of the experimental survey is larger than the effect of participants where only one of those two conditions held, but that the effect is not additive. 28
30 Income product. This indicates that those who better understand the product features indeed are more likely to perceive the insurance feature against outliving one s wealth of the Lifetime Guaranteed Income product at the expense of giving up some flexibility Results - valuing annuities relative to drawdown products In this section we analyze the drivers that explain the heterogeneity in valuing annuities (our Lifetime Guaranteed Income product) relative to drawdown products (our Flexible Account product). As discussed earlier we collected data on 2,003 participants who provided answers to the six within-subject treatments (that is the six impl tasks which differ by their benchmark portfolio of retirement benefit allocations for Option A and Option B). Table 10 displays the average of the logged money s worth ratio as displayed in Table 7 for various subsamples. The averages (times 100%) can therefore be interpreted as the required percentage increase in the price needed for the participant to be willing to purchase the Lifetime Guaranteed Income product. 17 Again, note that another way to interpret these results is that those who are less able to understand the products are more likely to provide similar answers to the product features of the Lifetime Guaranteed Income product and the Flexible Account product. 29
31 Table 10: Summary statistics for key results Full Sample LOW engagement Engaged sample 1 st 2 nd 1 st 2 nd 1 st 2 nd AU vs NL * *** 0.019* (0.006) (0.009) (0.009) (0.021) (0.021) (0.010) (0.010) Female vs male ** ** (0.006) (0.010) (0.009) (0.023) (0.019) (0.010) (0.010) Single vs couple *** *** 0.065** *** *** (0.006) (0.012) (0.008) (0.026) (0.018) (0.013) (0.008) WTP vs WTA *** 0.082*** *** 0.163*** *** 0.063*** (0.006) (0.009) (0.009) (0.020) (0.021) (0.010) (0.010) Gain vs Loss ** 0.071*** *** frame (0.006) (0.009) (0.009) (0.021) (0.020) (0.010) (0.010) Cons vs Invest ** frame (0.006) (0.009) (0.009) (0.022) (0.020) (0.010) (0.010) Confused vs not *** 0.013* *** (0.006) (0.016) (0.007) (0.030) (0.017) (0.019) (0.008) Observations 12,018 12,018 2,394 9,624 Notes: This table displays the average of the logged money s worth of annuities for various subpopulations. In the even columns (1 th ) the subpopulation has the first characteristic of the row (e.g. Australians, Females), whereas the odd columns (2 nd ) the subpopulation has the second characteristic of the row (e.g. Netherlands, Male). The first three columns the averages are taken for the specific subpopulation of the whole sample, in the next two columns only of the sample with LOW engagement, and in the last two columns of the sample without the participants with LOW engagement. Standard errors in parentheses; * p< 0.10, ** p< 0.05, *** p< Whereas on average the willingness to pay aligns with the actuarial fair price of the annuity, this result varies by subpopulation. Not controlling for other characteristics, Australians, females and couples on average have a higher willingness to pay for annuities (i.e., they would purchase the annuity at a lower price). 18 The effect is larger for the engaged participants than for the participants with low engagement. When participants are asked at which price they want to give up income to receive a lump sum the annuity price is higher than when participants are asked at which price they would purchase income. This effect is mitigated by information provision as the effect for the engaged subsample is much smaller than for the subsample with low engagement. Provision of specific information in addition to the general framed information also mitigates the influence of framing for the engaged participants. 19 Participants who respond that the survey was sometimes clear up to completely confusing indicate they would purchase an 18 For females this is as expected as we used gender neutral annuity prices, making annuities more favourable for females due to longer life expectancy. For couples this is as expected as we used for pricing that the spouse was on average three years younger than the participant, which leads to a relatively high price for the benefits for the surviving spouse. 19 We do observe a significant negative effect for the investment frame. However, this is due lower clarity of the investment frame than the consumption frame. When omitting the participants who indicated the survey was not clear to them, the effect of investment framing for engaged participants was and for consumption framing
32 annuity at a lower price, which suggests that they understand the Guaranteed Lifetime Income product (due to its similarities with the state pension). Table 11 reports the parameter estimates of a panel data model with random effects. The dependent variable is the logged money s worth ratio as displayed in Table 7. The first three columns of Table 11 display the estimation results with all covariates. The first column reports the estimation results of all six liquidity treatments for the Dutch sub-sample, the second column for the Australian sub-sample and the third column for the whole sample. Columns (4) to (9) report the estimation results of each of the six impl tasks separately, for the whole sample (Dutch and Australian combined). As a robustness check, in Table 12 in the appendix we exclude the three covariates related to the perception of the products, which were analyzed in the previous section. We perform this robustness check as these covariates might be confounding variables, affecting both our dependent variable as well as the perception of the product. Controlling for this confounder effect might alter the parameter estimates of the other covariates as it excludes the effect the covariates have through the product perception on the dependent variable. However, we observe that our results are robust to excluding the perception of the products covariates. In the regressions we also include the following experimental covariates. The variable WTP treatment is an indicator variable which equals one if the participant was in the WTP treatment and zero if he was in the WTA treatment. The variable Duration represents the logged duration (in minutes) taken to complete the impl task (this attribute varies per treatment). The variable Order takes values in the range of one to six, which represents the order in which a given impl within-subject treatment was shown to the participant, given that the order of the treatments is randomized by participant. The variable Likelihood to reduce represents the per within-subject treatment and WTP-WTA treatment standardized response to the question described in Section The dummy variables (1-2/3),...,(1/3-0) represent the impl within-subject treatments. The variable SEx(1/3-0) represents the interaction variable between self-employed and treatment 6 (an allocation of 1/3 vs 0 of retirement savings to the Lifetime Guaranteed Income product), i.e. an indicator variable which equals one if the participant is self-employed and answers treatment six. The variable AUx(1-2/3) represents the interaction variable between an Australian participant and treatment 1 (an allocation of 1 vs 2/3 of the retirement savings to the Lifetime Guaranteed Income product), i.e. an indicator variable which equals one if the participant is Australian and has been presented with impl within-subject treatment 1. Next we discuss regression results for annuity valuation distinguishing between behavioral influences 31
33 Table 11: Money s worth ratio regressions table NL AU sample 1-2/3 1-1/ /3-1/3 2/3-0 1/3-0 (1) (2) (3) (4) (5) (6) (7) (8) (9) Institutional settings Australian ( 0.34) ( 1.80) (0.58) ( 0.48) ( 0.15) ( 0.45) ( 0.57) Australian LOW (2.03) (1.99) (1.33) (1.36) (1.78) (1.16) (2.25) Endowment effect WTP treatment ( 3.80) ( 3.39) ( 4.68) ( 3.04) ( 3.79) ( 4.38) ( 3.53) ( 3.62) ( 4.29) WTP treatment LOW ( 1.18) ( 2.79) ( 3.17) ( 3.11) ( 2.31) ( 2.19) ( 2.82) ( 2.75) ( 2.46) Information framing Gain framing (0.90) ( 0.53) (0.27) ( 0.42) (0.53) (0.46) ( 0.11) (0.87) (0.27) Consumption framing (0.28) (0.35) (0.50) (0.24) ( 0.34) (0.80) (0.15) (1.37) (0.09) Gain framing LOW (1.06) (0.43) (1.40) (1.77) (1.29) (1.58) (0.87) (0.21) (1.12) Consumption framing LOW ( 0.78) ( 0.93) ( 1.38) ( 0.47) ( 0.69) ( 1.55) ( 2.50) ( 0.81) ( 0.73) Financial capabilities SA fin lit ( 0.92) (0.05) ( 0.53) (0.37) ( 0.06) ( 1.62) ( 0.30) ( 0.93) ( 0.19) Fin lit (1.13) (0.49) (1.18) (1.45) (2.34) (0.19) (0.50) (1.63) ( 0.09) Numeracy ( 1.62) ( 0.08) ( 1.16) ( 0.58) ( 1.26) ( 0.51) ( 1.04) ( 0.67) ( 1.41) SA fin lit LOW ( 0.51) (2.41) (0.74) (0.13) ( 0.17) (0.88) (0.65) (1.64) (0.37) Fin lit LOW ( 1.63) ( 0.69) ( 1.68) ( 1.41) ( 1.67) ( 1.47) ( 1.58) ( 2.18) ( 0.23) Numeracy LOW (2.69) ( 0.13) (1.84) (1.35) (1.22) (1.40) (2.12) (1.22) (1.29) Experimental design Quiz mistakes (1.19) (0.68) (1.04) (1.08) (2.23) (0.27) (1.32) (0.69) ( 0.16) Short time (0.59) ( 1.08) ( 0.42) ( 0.45) (0.07) ( 0.41) (0.09) ( 1.04) ( 0.97) Short time x Quiz mistakes ( 1.11) (0.69) ( 0.09) ( 0.30) ( 1.29) (0.42) ( 0.54) (0.94) ( 0.15) Confusing ( 1.91) ( 1.80) ( 2.70) ( 1.39) ( 2.68) ( 2.53) ( 1.78) ( 2.35) ( 2.83) Duration ( 0.47) (0.20) ( 0.30) ( 1.08) ( 2.05) ( 1.58) ( 1.18) ( 0.38) ( 1.21) Order ( 1.37) (0.78) ( 0.44) ( 0.48) ( 2.01) (1.55) ( 2.23) ( 0.58) ( 0.70) Likelihood to act ( 3.18) (0.10) ( 2.16) ( 1.16) ( 0.24) ( 2.37) ( 3.51) ( 2.62) ( 1.23) Between-subject treatments: liquidity 1-2/ (.) (.) (.) 1-1/ ( 1.49) (1.97) ( 1.20) ( 0.85) (1.08) ( 1.38) 2/3-1/ ( 0.75) (1.76) ( 0.81) 2/ ( 0.92) (1.59) ( 1.03) 1/ ( 2.06) (0.13) ( 2.46) SEx(1/3-0) ( 0.70) ( 1.93) ( 1.90) AUx(1-2/3) ( 2.18) Retirement income replacement rate Household income (1.02) (2.38) (2.71) (1.18) (1.57) (3.17) (2.15) (2.93) (2.34) Homeowner ( 2.41) (0.49) ( 1.32) ( 1.15) ( 1.40) ( 0.84) ( 1.02) ( 1.00) ( 1.14) Wealth (0.65) ( 0.61) ( 0.18) (0.10) (0.68) ( 0.93) ( 0.33) ( 0.43) ( 0.04) Health & life expectancy Health ( 0.04) ( 0.15) ( 0.19) ( 0.64) ( 0.33) (0.03) ( 0.52) (1.30) ( 0.89) SLE-OLE (0.60) (0.75) (1.36) ( 0.17) (0.89) (1.43) (2.17) (1.64) (0.93) Outlive partner (1.50) ( 0.81) (0.07) ( 0.10) ( 1.30) (0.65) (0.09) (0.49) (0.65) Perceived product features Understanding (0.81) (1.15) (1.37) (0.77) (1.21) (2.53) (1.79) (0.24) (0.37) Riskiness (2.29) (1.27) (2.66) (2.11) (2.55) (2.00) (1.44) (1.70) (3.79) Control (1.41) (1.85) (2.31) (0.99) (1.84) (2.46) (1.85) (2.30) (1.45) Saving & planning Savings habit (0.77) (2.18) (2.11) (2.24) (1.12) (2.40) (1.87) (1.10) (1.38) Spending horizon ( 0.44) ( 0.90) ( 0.99) ( 0.38) ( 1.26) ( 0.50) ( 0.61) ( 1.06) ( 0.74) Future time (0.70) (0.54) (0.98) (0.13) (0.74) (1.44) (0.60) (1.37) (1.04) Fin plan ( 1.47) (1.15) ( 0.19) (0.43) ( 0.17) (0.75) ( 0.41) ( 1.20) ( 0.31) SA planning knowledge (0.56) ( 2.91) ( 1.51) ( 1.13) ( 1.44) ( 1.19) ( 1.23) ( 1.25) ( 1.10) SA retirement distant (1.95) ( 0.58) (0.91) (0.66) (1.16) (0.44) (0.94) (0.39) (0.82) Personality Traits Conscientiousness (0.59) ( 0.90) ( 0.28) (0.11) ( 0.50) ( 0.28) ( 0.26) (0.47) ( 0.82) Extrovert/Open ( 1.31) ( 0.85) ( 1.70) ( 1.78) ( 1.77) ( 1.54) (0.26) ( 1.07) ( 2.30) Agreeable/Emotional (0.05) ( 0.26) ( 0.24) (0.82) ( 0.67) (0.08) ( 0.77) ( 0.72) ( 0.19) Risk ( 1.52) (0.41) ( 0.59) ( 0.34) ( 0.88) ( 0.52) ( 0.18) (0.08) ( 0.73) Patience (2.23) (0.50) (1.47) (1.25) (1.07) (0.41) (1.94) (1.39) (1.51) Demographics Age (1.95) (0.51) (1.65) (1.56) (2.39) (1.26) (1.80) (0.32) (0.97) Female ( 1.65) (0.11) ( 0.82) ( 1.47) ( 1.14) ( 1.26) (0.47) ( 0.00) (0.06) Single (2.96) (2.87) (3.65) (2.02) (2.34) (3.48) (2.34) (3.83) (3.85) Children ( 0.03) ( 1.45) ( 1.42) ( 0.29) ( 1.83) ( 1.21) ( 0.76) ( 1.28) ( 1.60) Bachelor s degree ( 1.31) ( 1.20) ( 1.85) ( 0.83) ( 0.84) ( 1.21) ( 1.96) ( 2.06) ( 1.90) In labor force ( 0.34) ( 0.44) ( 0.62) (0.70) ( 1.08) ( 0.74) ( 0.62) ( 1.32) ( 0.30) Self-employed ( 0.39) ( 0.83) ( 0.92) ( 1.13) ( 1.34) (0.04) (0.16) ( 1.51) ( 2.02) 32 Constant ( 2.12) ( 0.52) ( 1.59) ( 1.61) ( 1.43) ( 1.04) ( 1.35) ( 0.57) ( 0.81) N 6, 018 6, , 018 2, 003 2, 003 2, 003 2, 003 2, 003 2, 003 Dependent variable: logged money s worth ratio (as displayed in Table 7); t statistics in parentheses; * p < 0.10, ** p < 0.05, *** p < 0.01
34 (institutional settings, product endowment, information framing and financial capabilities), those informed by economic (rational) influences and other factors. 4.1 Annuity valuation: main behavioral factors The experimental design includes features to investigate to what extent behavioral factors such as product endowment and information framing (as well as institutional setting and financial capability) are associated with the valuation of the Guaranteed Lifetime Income product. Moreover, we are interested in whether -as for the perceived product features- the engagement of the participant is important in explaining the behavioral factors. It is important to remember that participants completed the impl tasks immediately after the perceived product feature questions. In the impl task participants have the opportunity to receive new information from use of the retirement calculator on the possible income stream generated from the product portfolios (i.e., outcomes), depending on the assumptions they set. In addition, the framed general information (see Table 3) is repeated on each screen. Institutional settings Whereas for the engaged participants the real world institutional setting was important for perceived product features, it is not important for the valuation of the Lifetime Guaranteed Income product in our experiment. In contrast, participants with low engagement need to have a lower value of the Lifetime Guaranteed Income product in order to accept this product over the Flexible Account product. Hence, institutional settings remain important, leading to a higher valuation of the product that the less engaged participants are not typically able to purchase in their real world retirement income system. However, the various sources of information provision (presentation of product features, product knowledge quiz and retirement calculator) in the experiment are such that for engaged participants the effect of the real world retirement income system is offset. This is the case despite the complex task of valuing a lifetime income stream. Product endowment We observe substantial effects for the product endowment treatment (that is, WTP or WTA). When a participant is given an income and asked how much he requires to give up the income, the valuation of 33
35 the Guaranteed Lifetime Income product is much higher than when he is asked how much he is willing to pay for the Guaranteed Lifetime Income product. This is contrary to Willig (1976) which shows that the price changes of willingness to pay (price changes for compensating) and willingness to accept (price changes for equivalent) should be very close in value, depending on the size of the income elasticity of the demand for the product. Given that the income effects are minor in the experimental task, one would expect minor effects. An explanation of the size of the treatment effect would be the lack of substitutes (Hanemann, 1991). This disparity between WTP and WTA is well documented in the literature (Knetsch and Sinden, 1984) and in the domain of valuing retirement income streams, the gap between WTA and WTP has been investigated in Brown et al. (2017b) and Schreiber et al. (2016) who find a WTA to WTP ratio of the price of a factor three to four. Our effects are much smaller than the values in those studies. Brown et al. (2017b) and Brown et al. (2017a) both find cognition and complexity to be factors which can explain the high buy-sell spread. The Flexible Account product is complex as drawdown products have many options (investment portfolio, draw down rates) and the Guaranteed Lifetime Income product is complex to value as it includes inflation, compounding and longevity risk. The effect of WTP treatment LOW is of similar size as the effect of the treatment itself. Hence, participants with low engagement with the experimental task had a twice as large WTP-WTA gap than the engaged. This is supporting evidence that complexity might reduce the valuation of an income stream as participants who report to have found the experimental survey complex value the annuity less. Our experimental setting has tried to eliminate or reduce this barrier by using the impl methodology and providing participants with a retirement calculator (which illustrates key outcomes of their decisions). Overall there seems to be evidence that the experimental design succeeded, as our financial capability measures are not significant despite the intrinsic complexity of the task. Our results supplement these earlier studies by showing that even after reducing the complexity of the task a WTP-WTA gap remains. Hence, the implication is that online tools similar to our retirement calculator or having access to financial advice could reduce the WTP-WTA gap, but would probably not eliminate it. The implication is that a default for retirement savings drawdown products -which would induce either a WTP or a WTA frame- would play an important role in the choice between an income product and a drawdown product. This is also supported by the following three findings (discussed later more in detail). First, participants who have a high income prefer the income product, as choosing the draw down product would reduce their income replacement rate more due to the fixed state pension income. Second, Australians relative to Dutch are more reluctant to fully annuitize their retirement savings. Third, the 34
36 self-employed who typically have to plan and organize retirement savings themselves, are reluctant to give up any of their wealth to provide for an income just above the state pension level. In our experimental design we are careful to control for participants misconceptions. First, we included a practice round before we ask participants to complete the six experimental tasks. Second, we included a number of explanatory variables to capture the number of mistakes in the product knowledge quiz, an indicator of whether the participant found the experimental survey confusing, the time spent on each within-subject impl treatment and the order in which the treatment was presented. Given that order does not play an effect, the preference hypothesis identified by Plott (1996) does not seem to play a major role in our experimental setting. Information framing We find that the information framing effect is not significant. For engaged participants, information framing is both economically and statistically insignificant. However, for the low engaged, despite not being statistically significant, information framing is economically significant with a magnitude of approximately a 9% higher or lower valuation of the Lifetime Guaranteed Income product when altering the information frame. We note that the results are robust when excluding product features (see Table 12). We find that for engaged participants the provision of framed information on top of each screen in the impl task does not influence benefit choice. We suggest that this is because engaged participants have utilized the objective information provided on various occasions prior to the impl tasks and in the context of the retirement calculator. In contrast, less engaged participants would have likely utilized less of the objective information provided in the experimental survey and paid more attention to the framed information clearly visible on the top of each screen in each of the impl tasks. As expected, the gain frame which highlights the positive insurance feature against outliving one s wealth of the Lifetime Guaranteed Income product seems to enhance the value of the product. On the other hand, the consumption frame highlights the risk of unexpected expenditures and therefore reduces the value of the Lifetime Guaranteed Income product to the less engaged. The literature on the effects of information framing on the demand for retirement benefit products is mixed. Our result of no effect of information framing for engaged participants is despite the framed information presented at the top of the screen for each of the impl task. However, the other experimental survey design features, in particular the retirement calculator, were intended to encourage the participant 35
37 think about how quickly to spent down assets, which would have reduced the complexity of the tradeoff they were asked to make between the portfolios in the impl tasks. This is supported by our finding that the financial capability measures are not significant. Financial capabilities For engaged participants, financial capabilities do not influence the valuation of the Lifetime Guaranteed Income product. This is in contrast to the effect financial capabilities had on the perceived riskiness and control of the products and in similar studies on retirement product choices. We suggest that this difference is due to the inclusion of a retirement calculator in conjunction with each impl task which provided engaged participants with the information they needed to make an informed choice. Hence, the engaged participant utilized information not only on the features of the product, but also the possible income stream it could generate, conditional on assumptions the participant could alter. In contrast, financial capabilities do play a role in the valuation of the Lifetime Guaranteed Income product for low engaged participants. For low engaged Dutch participants, having low numeracy skills decreases their valuation of the Lifetime Guaranteed Income product, likely because these participants underestimate the income the Flexible Account product can deliver. This effect is not present for low engaged Australians, as they are likely more aware, from peers with experience of the predominant flexible drawdown products, of the risk of outliving one s wealth. Therefore, they would more likely consider a more conservative drawdown strategy for the Flexible Account product than low engaged Dutch participants. Better financial literacy skills, especially for low engaged Dutch participants participants could suggest that they consider themselves more capable to invest in the stock market and therefore value the Flexible Account product more. In addition, for the low engaged Dutch participant, better financial literacy skills help participants to understand the product they are less familiar with. For Australians higher self-assessed financial literacy could suggest that they understand the product they are less familiar with even though they have not utilized all the information that was available to them in the experimental task. 4.2 Annuity valuation: main rational factors Between-subject treatments: liquidity The six within-subject impl treatments with varying portfolio compositions (and therefore access to liquidity) can be used to examine the effect of the lack of substitutes (Hanemann, 1991). An income stream 36
38 is typically irreversible and only by saving from the income can a participant slowly increase his liquid wealth again. Although the wealth in a Flexible Account product could be used to purchase an annuity after retirement, this rarely occurs in practice. The voluntary annuity market in the Netherlands and Australia is small. Therefore, most participants would consider the decision between product portfolios to be an irreversible decision. Substitutes for income (except the state pension and the imputed rent from owning a home) and wealth are scarce for retirees. Given that retirement savings are a sizeable proportion of their asset holdings, the allocation decision could have substantial welfare effects if the participant faced a large disutility from a non-optimal product mix. For the Dutch sub-sample we observe from the within-subject treatment effects that participants would prefer not to diversify. The treatment 1-2/3 (base case) has the highest valuation by the Dutch participants. However, the treatment effects are not significant except for the other extreme treatment 1/3-0. This does however signal that the Dutch participants would generally have a larger disutility from giving up some of their income in exchange for liquid wealth than for giving up a similar amount of their income in exchange for liquid wealth when they already have a lower income and more liquid wealth. As the Flexible Account product would provide flexibility for unexpected expenses, one would expect the participants to value this feature more when they have most of their wealth in the inflexible Guaranteed Lifetime Income product. This result can also be interpreted as the Dutch preferring to stick to their real world retirement income system (of full annuitization). This is contrary to the 1-2/3 portfolio where the Dutch participant might stick with the preference to the simplicity of managing an income product, the 1/3-0 portfolio would induce the participant to consider how to manage the wealth in the Flexible Account product. This does reduce the valuation of the Lifetime Guaranteed Income product for the Dutch sub-sample. Compared to the Dutch, the Australian participants do value income less when they have to fully annuitize their retirement wealth than when they have to partly annuitize. However, they too have a tendency to stick to their real world retirement drawdown system, as they also value the income less in the case they have to annuitize part of their retirement wealth (treatment 1/3-0) or if they have the option between only income and only liquid wealth in addition to income at the state pension level (treatment 1-0). We also test the product endowment differences between the Dutch and Australian sub-samples in column (3) of Table 11 which includes the interaction term between being Australian and the 1-2/3 treatment. As expected, we observe that the Dutch value the additional income much more than 37
39 Australians when they already have a sizeable income. Similarly, using the interaction term between being self-employed and treatment 1/3-0, we test whether the self-employed do not want to give any of their accumulated wealth up for an income. Again, our results support our hypothesis, although this is not significant for the Dutch sub-sample. This might be due to Dutch self-employed, who had in the past accumulated a DB pension, reducing the product endowment. Retirement income replacement rate A participant s financial capabilities or labor market participation does not have a significant influence on the valuation of the Lifetime Guaranteed Income product. Nor does liquid (non-housing and nonretirement) wealth. However, the income replacement rate does play a role. Participants who have a high income do value the Lifetime Guaranteed Income product more. Participants who own their home derive an imputed income from it which would equate to the cost of renting the property. Since in retirement, mortgage repayments are typically much lower than earlier in the life cycle, the difference in replacement rate would be smaller for homeowners than for renters, making them value the lifetime Guaranteed Income product less. This is in line with empirical observations in, for example, the U.K. 20 and Australia that people tend to take small pension pots as a lump sum whereas larger pots are either annuitized or converted into an income product. In addition, it could be driven by the finding in Goldstein et al. (2016) that people tend to undervalue an annuity when the income of the annuity is small, but overvalue it when it is large. Health and life expectancy: the money s worth We can use our collected covariates to investigate the extent to which the participant s choice is driven by monetary reasons (that is, choosing a portfolio as it is good value for money) or the extent to which it is driven by an intrinsic preference for one product over the other (that is the perceived product features). A Lifetime Guaranteed Income product would be good value for money if the participant is in good health and expects to live long. However, as indicated in Table 9, the three measures relating to life expectancy in the health and life expectancy category are all not significant. This would indicate that the participant s choice for the portfolio of retirement benefit products is not driven by their (private) information on their expected remaining lifetime. We note that the SLE-OLE measure typically has the expected sign in the regressions (and is significant in regression (7) too at a level of significance of 5%), indicating that there might be a small effect that people who expect to live longer would find a lifetime guaranteed income more preferable. 20 Financial Conduct Authority Data bulletin (10) reports that 86% of people with pension pots of less than 10,000 chose full cash withdrawals whereas 90% of people with pension pots over 250,000 chose annuities or drawdown products. 38
40 Perceived product features The perceived product features Riskiness and Control have a significant effect on the preference for the Guaranteed Lifetime Income product relative to the Flexible Account product. This indicates that people who see the Lifetime Guaranteed Income product relative to the Flexible Account as having more attractive features do value the Lifetime Guaranteed Income product more. This would indicate that the utility derived from the product would also have an influence on the preference for the products. 4.3 Annuity valuation: other factors Many of the parameter estimates related to personal characteristics, both variables related to saving & planning and personality traits, are not significant for the valuation of annuities at a 5% significance level. In the Dutch sub-sample those who are more patient prefer the Lifetime Guaranteed Income product more. People who are less patient can use the money in the Flexible Account to consume more today. Although Patience is not significant for the Australian sub-sample, Savings habit is. Since people who have better savings habits also tend to be more patient, and Australians who are better savers (and thus typically more patient) tend to prefer the Lifetime Guaranteed Income product more. Moreover, Australians with high levels of self-assessed planning knowledge are more likely to prefer the Flexible Account product more. Gender generally has no significant effect, even though women tend to live longer than men. The sign for Females is negative, which would even imply that women, who live longer, would value the Lifetime Guaranteed Income product less than males. However, the gender differences in life expectancy was also expected to have a minor effect given that the Lifetime Guaranteed Income product is a joint and survivor annuity and not a single life annuity. Of the demographic variables, only the variable Single is significant at a 5% level. The effect of being single rather than living together could be that singles prefer an income more than people in a couple. In a couple there would be more opportunity for home production, which could be interpreted in economic terms as an income. However, one does have to be careful interpreting this variable as there is also a pricing difference between a joint and survivor annuity and a single life annuity. Hence, it could also be that participants who are part of a couple value the survivor benefit less than our calculated price. Experimental design: active participant People who have the opportunity to exercise more choice in the real world retirement system do prefer the 39
41 Guaranteed Lifetime Income product less. However, as the retirement system and the choice menu are different in the two countries, there are other variables which are significant in our regression. Australians have ample choice and those who prefer to exercise it would typically indicate that they have a good retirement planning knowledge. Contrary to Australians, the Dutch do not have choice of retirement investments: these are decided by the fiduciary (typically a pension fund). However, people can choose to exercise the option to retire early. Hence, for those who exercise the option retirement is not distant and they value the Lifetime Guaranteed income product less. 5 Conclusions and policy implications This paper investigates the stated attractiveness of partial and full annuitization. We use an experimental survey to elicit an individual s willingness to pay or willingness to accept annuities in a setting where participants choose a preferred allocation of two retirement benefit products - a lifetime annuity (which we call Guaranteed Lifetime Income product) and a phased withdrawal product (which we call a Flexible Account product). To assist participants make informed choices, we reduce the cognitive difficulty associated with choice of allocations of complex and likely unfamiliar products by: providing detailed information about the features of the two products; implementing an incentivized product knowledge test with feedback; using the impl methodology to reduce the cognitive complexity of the valuation task; and by providing a retirement calculator to illustrate the retirement income implications of the chosen portfolio of retirement benefit products. The experimental survey was conducted in two countries - Australia and the Netherlands - which allows investigation of the impact of real world institutional differences. The former operates a DC pension system, with choice of retirement benefit (which includes flexible drawdowns), while the latter is predominantly a DB pension system with mandatory annuitization. There are several recurring themes in our analysis of the perceived understanding and perceptions of product features of the retirement benefit products. First, the impact of information framing is minimal for Australians who have real world familiarity with a Flexible Account-type retirement benefit product through mandatory pension system and with a Lifetime Guaranteed Income-type product from the state pension. However, for the Dutch sub-sample, who have no real world familiarity with a Flexible Accounttype retirement benefit, information framing does influence the perception of the retirement benefit products introduced in the experimental context. Second, those participants who are financially competent and are engaged with the experimental task are better able to understand the features of the 40
42 products, which confirms findings in Bateman et al. (2016a). Third, those participants who have thought more about retirement planning and have a need for income in retirement have more understanding of the Lifetime Guaranteed Income product. Finally, comparing Australian participants with Dutch participants, the former have a more favorable perception of the Flexible Account product relative to the Lifetime Guaranteed Income product. This is likely be due to the lack of familiarity with annuity-type products in the real world institutional arrangements in which drawdown products are almost always taken and the voluntary annuity market has been, until recently, almost non-existent (Iskhakov et al., 2015). In terms of the valuation of lifetime annuities we find a product endowment effect, identified as a gap between the willingness to pay (WTP) and willingness to accept (WTA), which is twice as large for participants with low engagement in the experimental task as for engaged participants. However, in general the WTP-WTA gap in our experimental survey is much smaller than in previous experimental settings (such as Brown et al., 2017a). This could be due to the experimental design which included a simple retirement calculator (indicating outcomes in terms of the impact on potential spending in retirement of the income streams corresponding to individual s choices) to reduce cognitive effort. While we do find a product endowment effect, we find no information framing effect on the valuation of annuities, despite presentation of key product information in four different frames -consumption gain, consumption loss, investment gain and investment loss. Our experimental design, which provides repeated opportunities to learn about the products, and the frame-neutral detailed product descriptions (in conjunction with the framed general descriptions), successfully eliminate the potential information framing effects for most participants. The exception are those participants with low engagement with the experimental survey, where we observe that the gain frame is associated with a higher valuation of annuities. We also find that participants do not determine their preference for annuities relative to drawdown products based on money s worth, but rather on whether the product provides them with utility. For example, the variables we collect that relate to (subjective) life expectancy do not explain an individual s preference for annuities, whereas product perceptions, in terms of riskiness or control, do explain their preferences. Moreover, people with higher retirement savings are more willing to annuitize. This can be explained by the illusion of wealth, as well as the lessor impact of the state pension on the retirement income replacement ratio for those on high incomes. Overall our findings suggest three key lessons for policy and product development. First, the effects of familiarity with current products and policy settings are strong, so it cannot be assumed that people will 41
43 fully understand the features and implications of new products and policies. Second, clear presentation of basic information on retirement benefit product features is essential to minimize the effects of information framing. Third, financial advice, (such as via the pre-populated online calculator we provide) that presents details of the rest of lifetime implications of alternative product allocations, should be available at the time of product allocation, in order to facilitate informed choice. 42
44 References Agnew, J. R., Anderson, L. R., Gerlach, J. R., and Szykman, L. R. (2008). Who chooses annuities? an experimental investigation of the role of gender, framing, and defaults. The American Economic Review: Papers & Proceedings, 98(2): Agnew, J. R., Bateman, H., Eckert, C., Iskhakov, F., Louviere, J., and Thorp, S. (2016). First impressions matter: An experimental investigation of online financial advice. Management Science. Agnew, J. R., Bateman, H., and Thorp, S. (2013). Financial literacy and retirement planning in Australia. Numeracy, 6(2):1 25. Andersen, S., Harrison, G. W., Lau, M. I., and Rutstöm, E. E. (2009). Elicitation using multiple price list formats. Experimental Economics, 12(4): ASFA (2017). Superannuation account balances by age and gender. ASFA Research and Resource Centre. Bateman, H. (2016). Retirement income strategies for an ageing population. In Kendig, H., MacDonald, P., and Piggott, J., editors, Population Ageing and Australia s Future, pages ANU Press, Canberra. Bateman, H., Eckert, C., Iskhakov, F., Louviere, J., Satchell, S., and Thorp, S. (2016a). Individual capability and effort in retirement benefit choice. Journal of Risk and Insurance. Bateman, H., Eckert, C., Iskhakov, F., Louviere, J., Satchell, S., and Thorp, S. (2017). Default and diversification heuristics in annuity choice. Australian Journal of Management, 42(1): Bateman, H. and Piggott, J. (2010). Too much risk to insure? The Australian (non-) market for annuities. Technical Report , Pension Research Council Working Paper. Bateman, H., Piggott, J., and Stevens, R. (2016b). Sustainable retirement income policies in aging society: Lessons from the UK, Australia and the Netherlands. mimeo. Becker, A., Deckers, T., Dohmen, T., Falk, A., and Kosse, F. (2012). The relationship between economic preferences and psychological personality measures. Annual Review of Economics, 4(1-662): Benartzi, S., Previtero, A., and Thaler, R. H. (2011). Annuitization puzzles. Journal of Economic Perspectives, 25(4): Bernheim, B. D. (2002). Taxation and saving. In Auerbach, A. J. and Feldstein, M., editors, Handbook of Public Economics, pages Elsevier, Amsterdam, Netherlands. Beshears, J., Choi, J. J., Laibson, D., Madrian, B. C., and Zeldes, S. P. (2014). What makes annuitization more appealing? Journal of Public Economics, 116(August):2 16. Blumenschein, K., Blomquist, G. C., Johannesson, M., Horn, N., and Freeman, P. (2008). Eliciting willingness to pay without bias: Evidence from a field experiment. The Economic Journal, 118(525): Bockweg, C., Ponds, E., Steenbeek, O., and Vonken, J. (2018). Framing and the annuitization decision experimental evidence from a Dutch pension fund. Journal of Pension Economics and Finance, 17(3): Bovenberg, L. and Nijman, T. (2017). New Dutch pension contracts and lessons for other countries. Working paper, DP: 09/ Brown, J., Kling, J., Mullainathan, S., and Wrobel, M. (2008a). Why don t people insure late-life consumption? A framing explanation of the under-annuitization puzzle. American Economic Review, 98(2): Brown, J. R. (2009). Understanding the role of annuities in retirement planning. In Lusardi, A., editor, Overcoming the 43
45 Savings Slump: How to Increase the Effectiveness of Financial Education and Saving Programs, pages University of Chicago Press, Chicago. Brown, J. R., Kapetyn, A., Luttmer, E. F., Mitchell, O. S., and Samek, A. (2017a). Behavioral impediments to valuing annuities: Evidence on the effects of complexity and choice bracketing. Working Paper w24101, National Bureau of Economic Research. Brown, J. R., Kapteyn, A., Luttmer, E. F., and Mitchell, O. S. (2017b). Cognitive constraints on valuing annuities. Journal of the European Economic Association, European Economic Association, 5(2): Brown, J. R., Kapteyn, A., and Mitchell, O. S. (2016). Framing and claiming: how information-framing affects expected social security claiming behavior. Journal of Risk and Insurance, 83(1): Brown, J. R., Kling, J. R., Mullainathan, S., and Wrobel, M. V. (2008b). Why don t people insure late-life consumption? A framing explanation of the under-annuitization puzzle. The American Economic Review: Papers & Proceedings, 98(2): Bruner, D. M. (2011). Multiple switching behaviour in multiple price list. Applied Economic Letters, 11(5): Butler, M. and Teppa, F. (2007). The choice between and annuity and a lump sum: Results from Swiss pension funds. Journal of Public Economics, 91(10): Cannon, E., Tonks, I., and Yuille, R. (2016). The effect of reforms to compulsion on annuity demand. National Institute Economic Review, 237(1):R47 R54. Carson, R. T., Flores, N. E., Martin, K. M., and Wright, J. L. (1996). Contingent valuation and revealed preference methodologies: Comparing the estimates for quasi-public goods. Land Economics, 72(1): Champ, P. A., Bishop, R. C., Brown, T. C., and McCollum, D. W. (1997). Using donation mechanisms to value nonuse benefits from public goods. Journal of Environmental Economics and Management, 33(2): Cummings, R. G., Elliott, S., Harrison, G. W., and Murphy, J. (1997). Are hypothetical referenda incentive compatible? Journal of Political Economy, 105(3): Dohman, T., Falk, A., Huffman, D., Sunde, U., Schupp, J., and Wagner, G. G. (2011). Individual risk attitudes: Measurement, determinants and behaviour consequences. Journal of the European Economic Association, 9(3): Goeree, J., Holt, C., and Palfrey, T. (2003). Risk averse behavior in generalized matching pennies games. Games and Economic Behavior, 45(1): Goldstein, D., Hershfield, H., and Benartzi, S. (2016). The illusion of wealth and its reversal. Journal of Marketing Research, 53(5): Gosling, S. D., Rentfrow, P. J., and Jr, W. B. S. (2003). A very brief measure of the Big-Five personality domains. Journal of Research in Personality, 37(6): Hanemann, W. M. (1991). Willingness to pay and willingness to accept: How much can they differ? The American Economic Review, 81(3): Harrison, G. W., Johnson, E., McInnes, M. M., and Rutström, E. E. (2005). Risk aversion and incentive effects: Comment. American Economic Review, 95(3): Hedesstrom, T. M., Svedsater, H., and Garling, T. (2004). Identifying heuristic choice rules in the Swedish premium pension scheme. Journal of Behavioral Finance, 5(1): Holt, C. and Laury, S. (2002). Risk aversion and incentive effects. American Economic Review, 92(5):
46 Iskhakov, F., Thorp, S., and Bateman, H. (2015). Optimal annuity purchases for Australian retirees. Economic Record, 91(293): Jacobs-Lawson, J. and Hershey, D. (2005). Influence of future time perspective, financial knowledge, and financial risk tolerance on retirement saving behaviors. Financial Services Review, 14(4): Johannesson, M., Liljas, B., and Johansson, P.-O. (1998). An experimental comparison of dichotomous choice contingent valuation questions and real purchase decisions. Applied Economics, 30(5): Kahneman, D., Knetsch, J. L., and Thaler, R. H. (1990). Experimental tests of the endowment effect and the coase theorem. Journal of Political Economy, 98(6): Knetsch, J. L. and Sinden, J. A. (1984). Willingness to pay and compensation demanded: Experimental evidence of an unexpected disparity in measures of value. The Quarterly Journal of Economics, 99(3): Lipkus, I. M., Samsa, G., and Rimer, B. K. (2001). General performance on a numeracy scale among highly educated samples. Medical Decision Making, 21(1): Loibl, C., Kraybill, D. S., and DeMay, S. W. (2011). Accounting for the role of habit in regular saving. Journal of Economic Psychology, 32(4): Lusardi, A. and Mitchell, O. S. (2011). Financial literacy around the world: An overview. Journal of Pension Economics and Finance, 10(4): Maurer, R., Mitchell, O. S., Rogalla, R., and Kartashov, V. (2013). Lifecycle portfolio choice with stochastic and systematic longevity risk, and variable investment-linked deferred annuities. Journal of Risk and Insurance, 80(3): Munnell, A. H. and Chen, A. (2015). Trends in social security claiming. Centre for Retirement Research at Boston College, issue in Brief, number 15-08, pages. OECD (2017). Pensions at a Glance 2017: OECD and G20 Indicators. OECD, Paris. Plott, C. R. (1996). Rational Individual Behavior in Markets and Social Choice Processes: The Discovered Preference Hypothesis. In Kenneth J. Arrow, Enrico Colombatto, Mark Perlman, and Christian Schmidt, eds., The rational foundations of economic behavior, volume 114 of IEA Conference. Macmillan, London. Reb, J. and Connolly, T. (2007). Possession, feelings of ownership and the endowment effect. Judgment and Decision Making, 2(2): Schreiber, P., Merkle, C., and Weber, M. (2016). The willingness to pay, accept, and retire. Netspar Discussion Paper DP 01/ , pages. Tsukayama, E., Duckworth, A. L., and Kim, B. (2012). Resisting everything except temptation: Evidence and an explanation for domain-specific impulsivity. European Journal of Personality, 26(3): Willig, R. D. (1976). Consumer s surplus without apology. The American Economic Review, 66(4): A Robustness check
47 Table 12: Robustness check Annuity factor Regression table NL AU sample 1-2/3 1-1/ /3-1/3 2/3-0 1/3-0 (1) (2) (3) (4) (5) (6) (7) (8) (9) Institutional settings Australian ( 1.10) ( 2.27) ( 0.07) ( 1.29) ( 0.76) ( 1.08) ( 1.22) Australian LOW (2.27) (2.13) (1.55) (1.56) (1.94) (1.41) (2.52) Endowment effect WTP treatment ( 3.74) ( 3.38) ( 4.63) ( 3.00) ( 3.73) ( 4.36) ( 3.52) ( 3.59) ( 4.23) WTP treatment LOW ( 1.13) ( 2.79) ( 3.13) ( 3.09) ( 2.28) ( 2.15) ( 2.78) ( 2.72) ( 2.40) Information framing Gain framing (1.10) ( 0.51) (0.40) ( 0.30) (0.65) (0.58) ( 0.02) (0.91) (0.43) Consumption framing (0.16) (0.39) (0.49) (0.19) ( 0.35) (0.82) (0.16) (1.39) (0.03) Gain framing LOW (0.91) (0.41) (1.24) (1.66) (1.16) (1.37) (0.71) (0.14) (1.00) Consumption framing LOW ( 0.79) ( 1.00) ( 1.42) ( 0.49) ( 0.73) ( 1.56) ( 2.51) ( 0.86) ( 0.80) Financial capabilities SA fin lit ( 0.93) (0.01) ( 0.59) (0.32) ( 0.12) ( 1.69) ( 0.36) ( 0.93) ( 0.26) Fin lit (1.40) (0.40) (1.32) (1.60) (2.51) (0.20) (0.49) (1.66) (0.21) Numeracy ( 1.62) ( 0.16) ( 1.19) ( 0.50) ( 1.26) ( 0.64) ( 1.15) ( 0.78) ( 1.21) SA fin lit LOW ( 0.52) (2.42) (0.65) (0.11) ( 0.23) (0.78) (0.57) (1.55) (0.37) Fin lit LOW ( 1.66) ( 0.69) ( 1.69) ( 1.45) ( 1.69) ( 1.41) ( 1.52) ( 2.15) ( 0.34) Numeracy LOW (2.71) ( 0.04) (1.92) (1.37) (1.29) (1.51) (2.19) (1.30) (1.34) Experimental design Quiz mistakes (1.12) (0.81) (1.02) (1.04) (2.17) (0.32) (1.35) (0.67) ( 0.29) Short time (0.49) ( 1.06) ( 0.50) ( 0.51) (0.00) ( 0.51) (0.02) ( 1.08) ( 1.06) Short time x Quiz mistakes ( 1.12) (0.70) ( 0.09) ( 0.28) ( 1.26) (0.42) ( 0.53) (0.94) ( 0.11) Confusing ( 1.98) ( 1.66) ( 2.67) ( 1.42) ( 2.69) ( 2.47) ( 1.72) ( 2.30) ( 2.86) Duration ( 0.35) (0.19) ( 0.21) ( 0.92) ( 1.85) ( 1.52) ( 1.07) ( 0.32) ( 0.66) Order ( 1.31) (0.78) ( 0.39) ( 0.32) ( 1.96) (1.50) ( 2.15) ( 0.60) ( 0.34) Likelihood to act ( 3.24) (0.10) ( 2.20) ( 1.28) ( 0.41) ( 2.45) ( 3.59) ( 2.63) ( 1.42) Between-subject treatments: liquidity 1-2/ (.) (.) (.) 1-1/ ( 1.49) (1.97) ( 1.20) ( 0.84) (1.08) ( 1.38) 2/3-1/ ( 0.75) (1.76) ( 0.81) 2/ ( 0.92) (1.59) ( 1.03) 1/ ( 2.06) (0.13) ( 2.46) SEx(1/3-0) ( 0.70) ( 1.93) ( 1.90) AUx(1-2/3) ( 2.17) Retirement income replacement rate Household income (1.39) (2.44) (3.02) (1.42) (1.87) (3.46) (2.38) (3.11) (2.68) Homeowner ( 2.35) (0.43) ( 1.30) ( 1.12) ( 1.38) ( 0.90) ( 1.07) ( 0.95) ( 1.01) Wealth (0.56) ( 0.67) ( 0.28) ( 0.00) (0.57) ( 0.98) ( 0.36) ( 0.48) ( 0.24) Health & life expectancy Health ( 0.03) ( 0.12) ( 0.19) ( 0.64) ( 0.31) (0.10) ( 0.47) (1.25) ( 0.94) SLE-OLE (0.65) (0.71) (1.37) ( 0.13) (0.92) (1.38) (2.14) (1.63) (1.03) Outlive partner (1.59) ( 0.76) (0.15) ( 0.08) ( 1.23) (0.76) (0.18) (0.59) (0.67) Saving & planning Savings habit (0.69) (2.07) (1.97) (2.16) (0.99) (2.23) (1.76) (1.03) (1.27) Spending horizon ( 0.56) ( 0.86) ( 0.99) ( 0.35) ( 1.25) ( 0.54) ( 0.65) ( 1.06) ( 0.67) Future time (0.73) (0.54) (0.99) (0.13) (0.74) (1.47) (0.63) (1.35) (0.98) Fin plan ( 1.49) (1.08) ( 0.30) (0.34) ( 0.29) (0.63) ( 0.50) ( 1.23) ( 0.42) SA planning knowledge (0.63) ( 2.89) ( 1.39) ( 1.05) ( 1.31) ( 1.02) ( 1.10) ( 1.21) ( 1.00) SA retirement distant (1.93) ( 0.54) (0.95) (0.69) (1.20) (0.46) (0.97) (0.43) (0.88) Personality Traits Conscientiousness (0.79) ( 1.06) ( 0.26) (0.15) ( 0.48) ( 0.30) ( 0.28) (0.48) ( 0.74) Extrovert/Open ( 1.20) ( 0.77) ( 1.56) ( 1.69) ( 1.65) ( 1.40) (0.35) ( 0.97) ( 2.14) Agreeable/Emotional (0.06) ( 0.18) ( 0.14) (0.92) ( 0.58) (0.14) ( 0.74) ( 0.69) ( 0.01) Risk ( 1.99) (0.16) ( 1.09) ( 0.67) ( 1.32) ( 1.07) ( 0.56) ( 0.22) ( 1.16) Patience (2.26) (0.52) (1.49) (1.27) (1.09) (0.42) (1.94) (1.39) (1.52) Demographics Age (2.04) (0.44) (1.68) (1.56) (2.40) (1.29) (1.82) (0.33) (0.99) Female ( 1.63) ( 0.06) ( 0.89) ( 1.51) ( 1.22) ( 1.42) (0.35) ( 0.05) (0.07) Single (3.11) (2.93) (3.76) (2.11) (2.46) (3.61) (2.45) (3.90) (3.93) Children ( 0.11) ( 1.56) ( 1.59) ( 0.39) ( 1.96) ( 1.41) ( 0.90) ( 1.39) ( 1.73) Bachelor s degree ( 1.24) ( 1.21) ( 1.81) ( 0.74) ( 0.77) ( 1.20) ( 1.97) ( 2.09) ( 1.73) In labor force ( 0.49) ( 0.48) ( 0.71) (0.64) ( 1.17) ( 0.86) ( 0.72) ( 1.34) ( 0.37) 46 Self-employed ( 0.33) ( 0.77) ( 0.89) ( 1.10) ( 1.30) (0.05) (0.16) ( 1.49) ( 1.94) Constant ( 2.16) ( 0.38) ( 1.49) ( 1.59) ( 1.38) ( 0.91) ( 1.28) ( 0.51) ( 0.84) N 6, 018 6, , 018 2, 003 2, 003 2, 003 2, 003 2, 003 2, 003
48 Supplemental Materials Screen shots of Australian survey

49


50


51


52

53


54

55

56


57


58

59

60
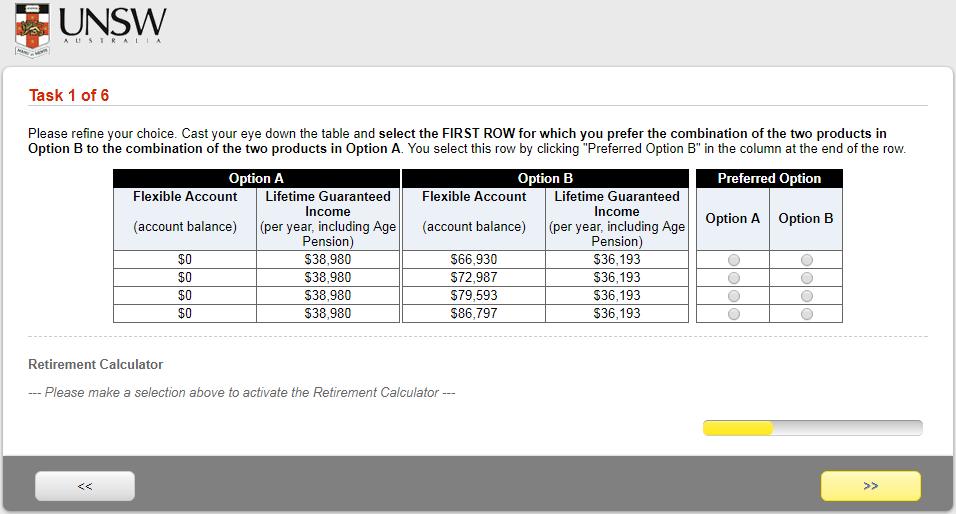

61

62

63
64


65

66
67

68
69
70


71
72
73

74

75

76
institutional setting in annuity valuation
 Beyond framing: the role of information, the endowment effect and institutional setting in annuity valuation Hazel Bateman, Ralph Stevens, Jennifer Alonso Garcia, Eduard Ponds February, 2018 ABSTRACT In
a partial solution to the annuity puzzle
 59 Disengagement: a partial solution to the annuity puzzle Hazel Bateman Director, Risk and Actuarial Studies, University of New South Wales, Sydney Christine Eckhert Marketing and CenSoC, University of
Jennifer Alonso Garcia, Hazel Bateman, Johan Bonekamp, Ralph Stevens, Arthur van Soest
 A cross country study of saving and spending in retirement [Saving preferences in retirement: the impact of mandatory annuitization, flexibility and health status] 23 October 2017 Jennifer Alonso Garcia,
Retirement drawdown defaults: the role of implied endorsement
 Retirement drawdown defaults: the role of implied endorsement Jennifer Alonso-García Hazel Bateman Johan Bonekamp Ralph Stevens February 26, 2018 Abstract Implied endorsement is considered, together with
Cognitive Constraints on Valuing Annuities. Jeffrey R. Brown Arie Kapteyn Erzo F.P. Luttmer Olivia S. Mitchell
 Cognitive Constraints on Valuing Annuities Jeffrey R. Brown Arie Kapteyn Erzo F.P. Luttmer Olivia S. Mitchell Under a wide range of assumptions people should annuitize to guard against length-of-life uncertainty
Have the Australians got it right? Converting Retirement Savings to Retirement Benefits: Lessons from Australia
 Have the s got it right? Converting Retirement Savings to Retirement Benefits: Lessons from Australia Hazel Bateman Director, Centre for Pensions and Superannuation Risk and Actuarial Studies The University
Optimal portfolio choice with health-contingent income products: The value of life care annuities
 Optimal portfolio choice with health-contingent income products: The value of life care annuities Shang Wu, Hazel Bateman and Ralph Stevens CEPAR and School of Risk and Actuarial Studies University of
EXECUTIVE SUMMARY - Study on the performance and adequacy of pension decumulation practices in four EU countries
 EXECUTIVE SUMMARY - Study on the performance and adequacy of pension decumulation practices in four EU countries mmmll DISCLAIMER The information and views set out in this study are those of the authors
Enhancing Singapore s Pension Scheme: A Blueprint for Further Flexibility
 Article Enhancing Singapore s Pension Scheme: A Blueprint for Further Flexibility Koon-Shing Kwong 1, Yiu-Kuen Tse 1 and Wai-Sum Chan 2, * 1 School of Economics, Singapore Management University, Singapore
Evaluating Lump Sum Incentives for Delayed Social Security Claiming*
 Evaluating Lump Sum Incentives for Delayed Social Security Claiming* Olivia S. Mitchell and Raimond Maurer October 2017 PRC WP2017 Pension Research Council Working Paper Pension Research Council The Wharton
Getting Beyond Ordinary MANAGING PLAN COSTS IN AUTOMATIC PROGRAMS
 PRICE PERSPECTIVE In-depth analysis and insights to inform your decision-making. Getting Beyond Ordinary MANAGING PLAN COSTS IN AUTOMATIC PROGRAMS EXECUTIVE SUMMARY Plan sponsors today are faced with unprecedented
Retirement. Optimal Asset Allocation in Retirement: A Downside Risk Perspective. JUne W. Van Harlow, Ph.D., CFA Director of Research ABSTRACT
 Putnam Institute JUne 2011 Optimal Asset Allocation in : A Downside Perspective W. Van Harlow, Ph.D., CFA Director of Research ABSTRACT Once an individual has retired, asset allocation becomes a critical
Target Date Glide Paths: BALANCING PLAN SPONSOR GOALS 1
 PRICE PERSPECTIVE In-depth analysis and insights to inform your decision-making. Target Date Glide Paths: BALANCING PLAN SPONSOR GOALS 1 EXECUTIVE SUMMARY We believe that target date portfolios are well
Investment Decisions and Negative Interest Rates
 Investment Decisions and Negative Interest Rates No. 16-23 Anat Bracha Abstract: While the current European Central Bank deposit rate and 2-year German government bond yields are negative, the U.S. 2-year
MUNICIPAL EMPLOYEES' RETIREMENT SYSTEM OF MICHIGAN APPENDIX TO THE ANNUAL ACTUARIAL VALUATION REPORT DECEMBER 31, 2016
 MUNICIPAL EMPLOYEES' RETIREMENT SYSTEM OF MICHIGAN APPENDIX TO THE ANNUAL ACTUARIAL VALUATION REPORT DECEMBER 31, 2016 Summary of Plan Provisions, Actuarial Assumptions and Actuarial Funding Method as
Payout-Phase of Mandatory Pension Accounts
 Goethe University Frankfurt, Germany Payout-Phase of Mandatory Pension Accounts Raimond Maurer (Budapest,24 th March 2009) (download see Rethinking Retirement Income Strategies How Can We Secure Better
THE CODING OF OUTCOMES IN TAXPAYERS REPORTING DECISIONS. A. Schepanski The University of Iowa
 THE CODING OF OUTCOMES IN TAXPAYERS REPORTING DECISIONS A. Schepanski The University of Iowa May 2001 The author thanks Teri Shearer and the participants of The University of Iowa Judgment and Decision-Making
Long-term care risk, income streams and late in life savings
 Long-term care risk, income streams and late in life savings Abstract We conduct and analyze a large experimental survey where participants made hypothetical allocations of their retirement savings to
Nordic Journal of Political Economy
 Nordic Journal of Political Economy Volume 39 204 Article 3 The welfare effects of the Finnish survivors pension scheme Niku Määttänen * * Niku Määttänen, The Research Institute of the Finnish Economy
MetLife Retirement Income. A Survey of Pre-Retiree Knowledge of Financial Retirement Issues
 MetLife Retirement Income IQ Study A Survey of Pre-Retiree Knowledge of Financial Retirement Issues June, 2008 The MetLife Mature Market Institute Established in 1997, the Mature Market Institute (MMI)
On the provision of incentives in finance experiments. Web Appendix
 On the provision of incentives in finance experiments. Daniel Kleinlercher Thomas Stöckl May 29, 2017 Contents Web Appendix 1 Calculation of price efficiency measures 2 2 Additional information for PRICE
About PrARI. Background
 About PrARI By Anna Abaimova Background In the early years of our financial life the most important piece of economic wisdom that guides wealth accumulation is the concept of portfolio diversification
Retirement funding is at a crossroads. For many years, Why Income Should Be the Outcome of a Defined Contribution Plan. Retirement
 Retirement Why Income Should Be the Outcome of a Defined Contribution Plan Defined contribution (DC) plan participants need to understand how their savings will translate to income during retirement. For
Policy Considerations in Annuitizing Individual Pension Accounts
 Policy Considerations in Annuitizing Individual Pension Accounts by Jan Walliser 1 International Monetary Fund January 2000 Author s E-Mail Address:jwalliser@imf.org 1 This paper draws on Jan Walliser,
Are the American Future Elderly Prepared?
 Are the American Future Elderly Prepared? Arie Kapteyn Center for Economic and Social Research, University of Southern California Based on joint work with Jeff Brown, Leandro Carvalho, Erzo Luttmer, Olivia
Determining a Realistic Withdrawal Amount and Asset Allocation in Retirement
 Determining a Realistic Withdrawal Amount and Asset Allocation in Retirement >> Many people look forward to retirement, but it can be one of the most complicated stages of life from a financial planning
Hartford Lifetime Income Summary booklet
 Hartford Lifetime Income Summary booklet A group deferred fixed annuity issued by Hartford Life Insurance Company TABLE OF CONTENTS 2 HLI at a glance 4 Is this investment option right for you? 4 How HLI
Why do Individuals Retire When They Do and What Does It Mean for Their Retirement Security?
 July 2011 Why do Individuals Retire When They Do and What Does It Mean for Their Retirement Security? The factors that have a significant impact on individuals decisions regarding when to retire include:
Target-Date Glide Paths: Balancing Plan Sponsor Goals 1
 Target-Date Glide Paths: Balancing Plan Sponsor Goals 1 T. Rowe Price Investment Dialogue November 2014 Authored by: Richard K. Fullmer, CFA James A Tzitzouris, Ph.D. Executive Summary We believe that
Using Fixed SPIAs and Investments to Create an Inflation-Adjusted Income Stream
 Using Fixed SPIAs and Investments to Create an Inflation-Adjusted Income Stream April 5, 2016 by Luke F. Delorme Advisor Perspectives welcomes guest contributions. The views presented here do not necessarily
Retirement Savings: How Much Will Workers Have When They Retire?
 Order Code RL33845 Retirement Savings: How Much Will Workers Have When They Retire? January 29, 2007 Patrick Purcell Specialist in Social Legislation Domestic Social Policy Division Debra B. Whitman Specialist
Design considerations for retirement savings and retirement income products Received (in revised form): 14 th October 2010
: 14 th October 2010") Original Article Design considerations for retirement savings and retirement income products Received (in revised form): 14 th October 2010 Lakshman Alles is an associate professor and former Head of the
Original Article Design considerations for retirement savings and retirement income products Received (in revised form): 14 th October 2010 Lakshman Alles is an associate professor and former Head of the
Future Beneficiary Expectations of the Returns to Delayed Social Security Benefit Claiming and Choice Behavior
 Future Beneficiary Expectations of the Returns to Delayed Social Security Benefit Claiming and Choice Behavior Jeff Dominitz Angela Hung Arthur van Soest RAND Preliminary and Incomplete Draft Updated for
Irrational people and rational needs for optimal pension plans
 Gordana Drobnjak CFA MBA Executive Director Republic of Srpska Pension reserve fund management company Irrational people and rational needs for optimal pension plans CEE Pension Funds Conference & Awards
Issue Number 60 August A publication of the TIAA-CREF Institute
 18429AA 3/9/00 7:01 AM Page 1 Research Dialogues Issue Number August 1999 A publication of the TIAA-CREF Institute The Retirement Patterns and Annuitization Decisions of a Cohort of TIAA-CREF Participants
Saving and Investing Among High Income African-American and White Americans
 The Ariel Mutual Funds/Charles Schwab & Co., Inc. Black Investor Survey: Saving and Investing Among High Income African-American and Americans June 2002 1 Prepared for Ariel Mutual Funds and Charles Schwab
Why Advisors Should Use Deferred-Income Annuities
 Why Advisors Should Use Deferred-Income Annuities November 24, 2015 by Michael Finke Retirement income planning is a mathematical problem in which an investor begins with a lump sum of wealth and withdraws
Volume URL: Chapter Title: Introduction to "Pensions in the U.S. Economy"
 This PDF is a selection from an out-of-print volume from the National Bureau of Economic Research Volume Title: Pensions in the U.S. Economy Volume Author/Editor: Zvi Bodie, John B. Shoven, and David A.
Annuity Decisions with Systematic Longevity Risk. Ralph Stevens
 Annuity Decisions with Systematic Longevity Risk Ralph Stevens Netspar, CentER, Tilburg University The Netherlands Annuity Decisions with Systematic Longevity Risk 1 / 29 Contribution Annuity menu Literature
RE: The future of retirement A Consultation on investing for NEST s members in a new regulatory landscape
 National Employment Savings Trust Riverside House 2A Southwark Bridge Road London SE1 9HA 2 February 2015 Submitted via email to: nestresponses@nestcorporation.org.uk RE: The future of retirement A Consultation
LIFECYCLE INVESTING : DOES IT MAKE SENSE
 Page 1 LIFECYCLE INVESTING : DOES IT MAKE SENSE TO REDUCE RISK AS RETIREMENT APPROACHES? John Livanas UNSW, School of Actuarial Sciences Lifecycle Investing, or the gradual reduction in the investment
OECD INSURANCE AND PRIVATE PENSIONS COMMITTEE. Issues Note on Longevity and Annuities 1. Policy Suggestions for Developing Annuities Markets
 OECD INSURANCE AND PRIVATE PENSIONS COMMITTEE I. Introduction Issues Note on Longevity and Annuities 1 Policy Suggestions for Developing Annuities Markets 1. After an initial discussion of longevity and
Pension freedoms inquiry IFoA response to Work and Pensions Committee
 Pension freedoms inquiry IFoA response to Work and Pensions Committee 23 October 2017 About the Institute and Faculty of Actuaries The Institute and Faculty of Actuaries is the chartered professional body
2013 Risks and Process of Retirement Survey Report of Findings. Sponsored by The Society of Actuaries
 2013 Risks and Process of Survey Report of Findings Sponsored by The Society of Actuaries Prepared by Mathew Greenwald & Associates, Inc. December 2013 2013 Society of Actuaries, All Rights Reserved The
As easy as pie: How retirement savers use prescribed investment disclosures
 As easy as pie: How retirement savers use prescribed investment disclosures Hazel Bateman* Isabella Dobrescu* Ben R. Newell* Andreas Ortmann* Susan Thorp # *University of New South Wales #University of
Longevity Risk Pooling Opportunities to Increase Retirement Security
 Longevity Risk Pooling Opportunities to Increase Retirement Security March 2017 2 Longevity Risk Pooling Opportunities to Increase Retirement Security AUTHOR Daniel Bauer Georgia State University SPONSOR
Payout phase in DC pension funds policy option - Theoretical considerations and Albanian available options
 Payout phase in DC pension funds policy option - Theoretical considerations and Albanian available options Abstract Enkeleda Shehi Albanian Financial Supervisory Authority The aim of this paper is to provide
Americans Willingness to Voluntarily Delay Retirement
 Americans Willingness to Voluntarily Delay Retirement Raimond H. Maurer Olivia S. Mitchell The Wharton School MRRC Tatjana Schimetschek Ralph Rogalla Prepared for the 16 th Annual Joint Meeting of the
International Perspectives on Pension Reform: Switzerland
 International Perspectives on Pension Reform: Switzerland Monika Bütler University of St. Gallen & Netspar Reimagining Pensions: The Next 40 Years May 1 and 2, 2014 The Wharton School, University of Pennsylvania
Income products for the post-retirement market in Australia Received 28th May, 2004
 Income products for the post-retirement market in Australia Received 28th May, 2004 Graham Bird is a consultant, based in Sydney. He advises clients on a broad range of strategic issues relating to efficient
Disengagement: A partial solution to the annuity puzzle
 Disengagement: A partial solution to the annuity puzzle Hazel Bateman School of Risk and Actuarial Studies, University of New South Wales, Australia Christine Eckert Centre for the Study of Choice and
Risks of Retirement Key Findings and Issues. February 2004
 Risks of Retirement Key Findings and Issues February 2004 Introduction and Background An understanding of post-retirement risks is particularly important today in light of the aging society, the volatility
Age-dependent or target-driven investing?
 Age-dependent or target-driven investing? New research identifies the best funding and investment strategies in defined contribution pension plans for rational econs and for human investors When designing
Public and Private Pension Plans: A Combined Income Replacement Approach to Policy Options for Old Age Income Security
 Public and Private Pension Plans: A Combined Income Replacement Approach to Policy Options for Old Age Income Security Hyeyoun Baek Associate Research Fellow, KIHASA 1. Introduction Korea's retirement
When and How to Delegate? A Life Cycle Analysis of Financial Advice
 When and How to Delegate? A Life Cycle Analysis of Financial Advice Hugh Hoikwang Kim, Raimond Maurer, and Olivia S. Mitchell Prepared for presentation at the Pension Research Council Symposium, May 5-6,
Family Status Transitions, Latent Health, and the Post- Retirement Evolution of Assets
 Family Status Transitions, Latent Health, and the Post- Retirement Evolution of Assets by James Poterba MIT and NBER Steven Venti Dartmouth College and NBER David A. Wise Harvard University and NBER May
MUNICIPAL EMPLOYEES' RETIREMENT SYSTEM OF MICHIGAN
 MUNICIPAL EMPLOYEES' RETIREMENT SYSTEM OF MICHIGAN Summary of Actuarial Assumptions and Actuarial Funding Method as of December 31, 2015 Actuarial Assumptions To calculate MERS contribution requirements,
The Pioneer Investments Forum
 The Pioneer Investments Forum 30th November 2007 Psychological and Economic Factors in Decumulation: Implications for Product Design David Laibson Harvard University Professor of Finance Stephen Zeldes
Toyota Australia Superannuation Plan. Your Pension Guide. Product Disclosure Statement ISSUED: 1 OCTOBER 2015
 Toyota Australia Superannuation Plan Your Pension Guide Product Disclosure Statement ISSUED: 1 OCTOBER 2015 Contents Introducing your pension 1 How your pension works 3 Investing your pension 8 Tax and
Table of Contents I. Annuities 2 A. Who... 2 B. What... 2 C. Where... 2 D. When... 3 Annuity Phases... 3 a) Immediate Annuity...
 Immediate Annuity...") Table of Contents I. Annuities 2 A. Who... 2 B. What... 2 C. Where... 2 D. When... 3 Annuity Phases... 3 a) Immediate Annuity... 3 b) Deferred Annuity... 3 E. Why... 4 F. How do I put my money in?... 4
Table of Contents I. Annuities 2 A. Who... 2 B. What... 2 C. Where... 2 D. When... 3 Annuity Phases... 3 a) Immediate Annuity... 3 b) Deferred Annuity... 3 E. Why... 4 F. How do I put my money in?... 4
Since the publication of the first edition of this book in
 Saving Social Security: An Update Since the publication of the first edition of this book in early 2004, the Social Security debate has moved to the top of the domestic policy agenda. In his February 2005
Optimizing Retirement Income Solutions in Defined Contribution Retirement Plans. A Framework for Building Retirement Income Portfolios
 Optimizing Retirement Income Solutions in Defined Contribution Retirement Plans A Framework for Building Retirement Income Portfolios Dr. Wade Pfau Joe Tomlinson, FSA, CFP Steve Vernon, FSA MAY 2016 Acknowledgements
Tasks Ahead for Private Pension Development in Korea
 Tasks Ahead for Private Pension Development in Korea Song, Hong Sun Korea should improve its insufficient private pension system in the direction that maximizes the value of pension assets with minimum
The evolving retirement landscape
 The evolving retirement landscape This report has been sponsored by A Research Report by Lauren Wilkinson and Tim Pike Published by the Pensions Policy Institute May 2018 978-1-906284-52-23 www.pensionspolicyinstitute.org.uk
Jeffrey Brown and Theo Nijman. Opportunities for Improving Pension Wealth Decumulation in the Netherlands. Discussion Paper 01/
 Jeffrey Brown and Theo Nijman Opportunities for Improving Pension Wealth Decumulation in the Netherlands Discussion Paper 01/2011-008 Opportunities for Improving Pension Wealth Decumulation in the Netherlands
Risk Aversion, Stochastic Dominance, and Rules of Thumb: Concept and Application
 Risk Aversion, Stochastic Dominance, and Rules of Thumb: Concept and Application Vivek H. Dehejia Carleton University and CESifo Email: vdehejia@ccs.carleton.ca January 14, 2008 JEL classification code:
The Role of the Annuity s Value on the Decision (Not) to Annuitize: Evidence from a Large Policy Change
 to Annuitize: Evidence from a Large Policy Change") The Role of the Annuity s Value on the Decision (Not) to Annuitize: Evidence from a Large Policy Change Monika Bütler, Universität St. Gallen (joint with Stefan Staubli and Maria Grazia Zito) September
The Role of the Annuity s Value on the Decision (Not) to Annuitize: Evidence from a Large Policy Change Monika Bütler, Universität St. Gallen (joint with Stefan Staubli and Maria Grazia Zito) September
Back to the Future: Hybrid Co-operative Pensions and the TIAA-CREF System
 Back to the Future: Hybrid Co-operative Pensions and the TIAA-CREF System Benjamin Goodman and David P. Richardson September 2014 PRC WP2014-11 Pension Research Council The Wharton School, University of
MAKING YOUR NEST EGG LAST A LIFETIME
 September 2009, Number 9-20 MAKING YOUR NEST EGG LAST A LIFETIME By Anthony Webb* Introduction Media attention on retirement security generally focuses on the need to save enough to enjoy a comfortable
Making Retirement Income Last a Lifetime: Public Policy Options and Practical Tools
 Making Retirement Income Last a Lifetime: Public Policy Options and Practical Tools Capitol Hill Briefing April 13, 2018 Today s Presenters Josh Shapiro, MAAA, FSA, EA, FCA Vice President, Pension Practice
Flexible Income Annuity
 Flexible Income Annuity Key Features This is an important document and you should read it before deciding whether to buy your pension annuity from us Purpose of this document This Key Features booklet
Accumulating Funds in an Annuity: A Deferred Fixed Interest and Indexed Annuity Review
 Accumulating Funds in an Annuity: A Deferred Fixed Interest and Indexed Annuity Review Did you know that an annuity can be used to systematically accumulate money for retirement purposes, as well as to
INDIVIDUAL AND HOUSEHOLD WILLINGNESS TO PAY FOR PUBLIC GOODS JOHN QUIGGIN
 This version 3 July 997 IDIVIDUAL AD HOUSEHOLD WILLIGESS TO PAY FOR PUBLIC GOODS JOH QUIGGI American Journal of Agricultural Economics, forthcoming I would like to thank ancy Wallace and two anonymous
Compensation of Executive Board Members in European Health Care Companies. HCM Health Care
 Compensation of Executive Board Members in European Health Care Companies HCM Health Care CONTENTS 4 EXECUTIVE SUMMARY 5 DATA SAMPLE 6 MARKET DATA OVERVIEW 6 Compensation level 10 Compensation structure
Social Security Planning Strategies
 Social Security Planning Strategies Allen McLellan LUTCF, CLU, ChFC, CASL, CFP Adjunct Professor of Insurance Disclaimer The material included in this presentation is not offered as legal or tax advice.
New Dutch pension contracts and lessons for other countries Bovenberg, Lans; Nijman, Theo
 Tilburg University New Dutch pension contracts and lessons for other countries Bovenberg, Lans; Nijman, Theo Document version: Publisher's PDF, also known as Version of record Publication date: 2017 Link
Annuities in Pension Plans Policies to Encourage Annuitization
 U.S. Department of Labor Employee Benefits Security Administration Annuities in Pension Plans Policies to Encourage Annuitization Brian Buyniski International Benefits Issues Employee Benefits Security
All findings, interpretations, and conclusions of this presentation represent the views of the author(s) and not those of the Wharton School or the
 and not those of the Wharton School or the") All findings, interpretations, and conclusions of this presentation represent the views of the author(s) and not those of the Wharton School or the Pension Research Council. 2010 Pension Research Council
All findings, interpretations, and conclusions of this presentation represent the views of the author(s) and not those of the Wharton School or the Pension Research Council. 2010 Pension Research Council
Selection of High-Deductible Health Plans: Attributes Influencing Likelihood and Implications for Consumer-Driven Approaches
 Selection of High-Deductible Health Plans: Attributes Influencing Likelihood and Implications for Consumer-Driven Approaches Wendy D. Lynch, Ph.D. Harold H. Gardner, M.D. Nathan L. Kleinman, Ph.D. Health
Focus on income: Help shape your participants retirement
 Focus on income: Help shape your participants retirement Target Date Plus Models offered as part of the TIAA Custom Portfolios Model Service FPO For institutional investor use only. Not for use with or
National Employment Savings Trust The future of retirement. Response from The Pensions Management Institute
 National Employment Savings Trust The future of retirement Response from The Pensions Management Institute - 2 - Response from the Pensions Management Institute to NEST s Consultation The future of retirement
CAPITAL STRUCTURE AND THE 2003 TAX CUTS Richard H. Fosberg
 CAPITAL STRUCTURE AND THE 2003 TAX CUTS Richard H. Fosberg William Paterson University, Deptartment of Economics, USA. KEYWORDS Capital structure, tax rates, cost of capital. ABSTRACT The main purpose
August 07, Re: Regulation Identifier Number RIN 1210 AB20. To Whom It May Concern:
 August 07, 2013 Office of Regulations and Interpretations, Employee Benefits Security Administration, Room N 5655, U.S. Department of Labor 200 Constitution Avenue N.W. Washington, DC 20210 Attention:
TECHNICAL ANALYSIS OF THE SPECIAL COMMISSION TO STUDY THE MASSACHUSETTS CONTRIBUTORY RETIREMENT SYSTEMS SUBMITTED OCTOBER 7, 2009
 TECHNICAL ANALYSIS OF THE SPECIAL COMMISSION TO STUDY THE MASSACHUSETTS CONTRIBUTORY RETIREMENT SYSTEMS SUBMITTED OCTOBER 7, 2009 Technical Analysis I. Introduction While the central elements affecting
CFA Level III - LOS Changes
 CFA Level III - LOS Changes 2016-2017 Ethics Ethics Ethics Ethics Ethics Ethics Ethics Ethics Topic LOS Level III - 2016 (332 LOS) LOS Level III - 2017 (337 LOS) Compared 1.1.a 1.1.b 1.2.a 1.2.b 2.3.a
Framing, Reference Points, and Preferences for Life Annuities
 - The Retirement Security Project Research Brief Framing, Reference Points, and Preferences for Life Annuities Jeffrey R. Brown, Jeffrey R. Kling, Sendhil Mullainathan, Garth R. Wiens and Marian V. Wrobel
Evaluating Investments versus Insurance in Retirement
 Evaluating Investments versus Insurance in Retirement June 30, 2015 by Wade Pfau Retirement-income planning has emerged as a distinct field in the financial services profession. But because it is still
Inflation Expectations and Behavior: Do Survey Respondents Act on their Beliefs? October Wilbert van der Klaauw
 Inflation Expectations and Behavior: Do Survey Respondents Act on their Beliefs? October 16 2014 Wilbert van der Klaauw The views presented here are those of the author and do not necessarily reflect those
AN ANNUITY THAT PEOPLE MIGHT ACTUALLY BUY
 July 2007, Number 7-10 AN ANNUITY THAT PEOPLE MIGHT ACTUALLY BUY By Anthony Webb, Guan Gong, and Wei Sun* Introduction Immediate annuities provide insurance against outliving one s wealth. Previous research
Psychological Factors of Voluntary Retirement Saving
 Psychological Factors of Voluntary Retirement Saving (August 2015) Extended Abstract 1 Psychological Factors of Voluntary Retirement Saving Andreas Pedroni & Jörg Rieskamp University of Basel Correspondence
Somewhere. Cash Balance Plans. in the Middle
 Somewhere Cash Balance Plans in the Middle By Paul Zorn The recent financial downturn and resulting economic decline have put substantial fiscal pressures on state and local governments. As a result, many
Optimal Retirement Income Solutions in DC Retirement Plans Phase 1: Baseline, Interim Results and Commentary
 Optimal Retirement Income Solutions in DC Retirement Plans Phase 1: Baseline, Interim Results and Commentary July 2015 0 Acknowledgments Authors: Steve Vernon, FSA, svernon@stanford.edu Dr. Wade Pfau,
MISCELLANEOUS PLAN OF THE CITY OF MODESTO (CalPERS ID: ) Annual Valuation Report as of June 30, 2014
 Annual Valuation Report as of June 30, 2014") California Public Employees Retirement System Actuarial Office P.O. Box 942701 Sacramento, CA 94229-2701 TTY: (916) 795-3240 (888) 225-7377 phone (916) 795-2744 fax www.calpers.ca.gov October 2015 MISCELLANEOUS
California Public Employees Retirement System Actuarial Office P.O. Box 942701 Sacramento, CA 94229-2701 TTY: (916) 795-3240 (888) 225-7377 phone (916) 795-2744 fax www.calpers.ca.gov October 2015 MISCELLANEOUS
CFA Level III - LOS Changes
 CFA Level III - LOS Changes 2017-2018 Ethics Ethics Ethics Ethics Ethics Ethics Ethics Topic LOS Level III - 2017 (337 LOS) LOS Level III - 2018 (340 LOS) Compared 1.1.a 1.1.b 1.2.a 1.2.b 2.3.a 2.3.b 2.4.a
Employer Contribution Rate % % (projected)
") California Public Employees Retirement System Actuarial Office P.O. Box 942701 Sacramento, CA 94229-2701 TTY: (916) 795-3240 (888) 225-7377 phone (916) 795-2744 fax www.calpers.ca.gov October 2015 SAFETY
California Public Employees Retirement System Actuarial Office P.O. Box 942701 Sacramento, CA 94229-2701 TTY: (916) 795-3240 (888) 225-7377 phone (916) 795-2744 fax www.calpers.ca.gov October 2015 SAFETY
NBER WORKING PAPER SERIES THE DECISION TO DELAY SOCIAL SECURITY BENEFITS: THEORY AND EVIDENCE. John B. Shoven Sita Nataraj Slavov
 NBER WORKING PAPER SERIES THE DECISION TO DELAY SOCIAL SECURITY BENEFITS: THEORY AND EVIDENCE John B. Shoven Sita Nataraj Slavov Working Paper 17866 http://www.nber.org/papers/w17866 NATIONAL BUREAU OF
How Much Should Americans Be Saving for Retirement?
 How Much Should Americans Be Saving for Retirement? by B. Douglas Bernheim Stanford University The National Bureau of Economic Research Lorenzo Forni The Bank of Italy Jagadeesh Gokhale The Federal Reserve
NDC Schemes and Heterogeneity in Longevity: Proposals for Re-design
 NDC Schemes and Heterogeneity in Longevity: Proposals for Re-design Robert Holzmann, Jennifer Alonso-García, Héloïse Labit-Hardy, Andrés Villegas CEPAR, UNSW Business School, Australia 26th Colloquium
How to Use Reverse Mortgages to Secure Your Retirement
 How to Use Reverse Mortgages to Secure Your Retirement October 10, 2016 by Wade D. Pfau, Ph.D., CFA The following is excerpted from Wade Pfau s new book, Reverse Mortgages: How to use Reverse Mortgages
SAFETY PLAN OF THE CITY OF PASADENA (CalPERS ID: ) Annual Valuation Report as of June 30, 2014
 Annual Valuation Report as of June 30, 2014") California Public Employees Retirement System Actuarial Office P.O. Box 942701 Sacramento, CA 94229-2701 TTY: (916) 795-3240 (888) 225-7377 phone (916) 795-2744 fax www.calpers.ca.gov October 2015 SAFETY
California Public Employees Retirement System Actuarial Office P.O. Box 942701 Sacramento, CA 94229-2701 TTY: (916) 795-3240 (888) 225-7377 phone (916) 795-2744 fax www.calpers.ca.gov October 2015 SAFETY