Lynn Todman, PhD. Executive Director of Population Health Lakeland Health
|
|
|
- Leo Austin
- 5 years ago
- Views:
Transcription

1

2 Lynn Todman, PhD Executive Director of Population Health Lakeland Health

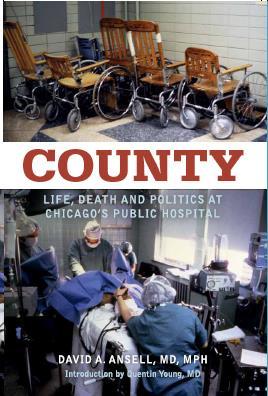
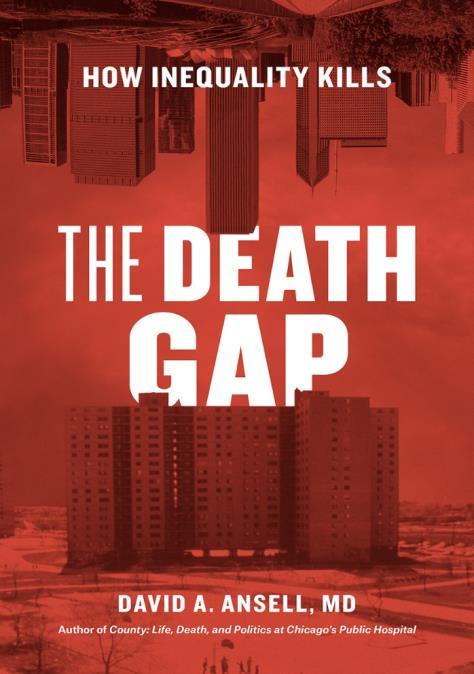
3 David Ansell, MD, MPH How Inequality Kills: Health Systems and Health Equity Michael E. Kelley Professor of Internal Medicine SVP and Associate Provost for Community Health Equity Rush University Medical Center
4
5 A Talk in Three Parts Death Gaps Naming Racism: social determinants of health and social determinants of inequity Health Systems and Health Equity

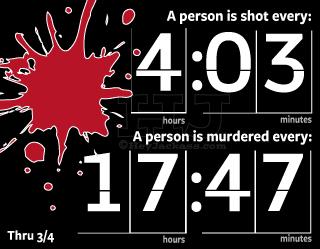
6 Part 1: Death Gaps In America, where you live dictates when you die


7
8

9 Growing US Income Inequality

10 Widening US Gap in Life Expectancy Between High and Low Earners Remaining Life Expectancy for Men Turning 60 Source: Waldron. ORES, Social Security Admin, #108, 2007


11 Neighborhood Income Change, Chicago Income distribution in Chicago, Then and Now 2003 RUSH University Medical Center


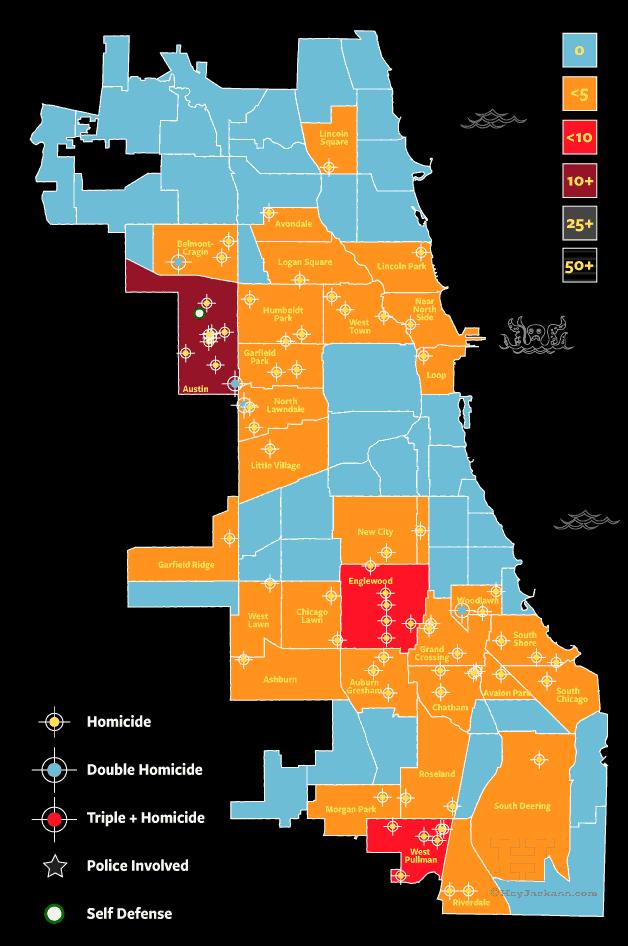
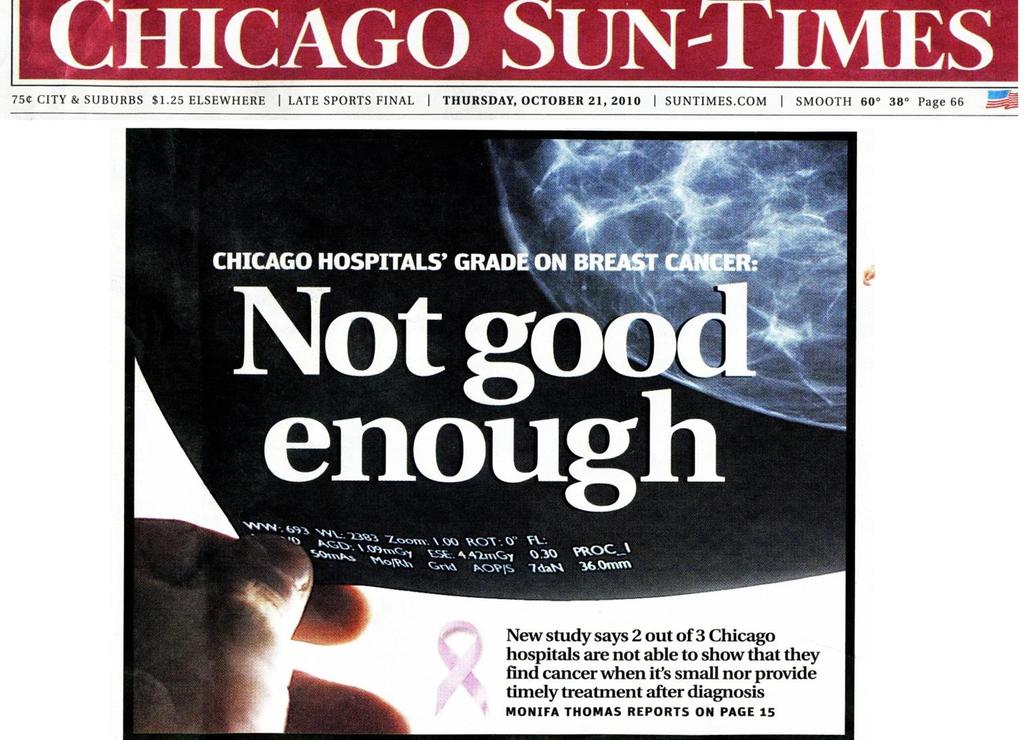
12 Chicago Death Gaps
13


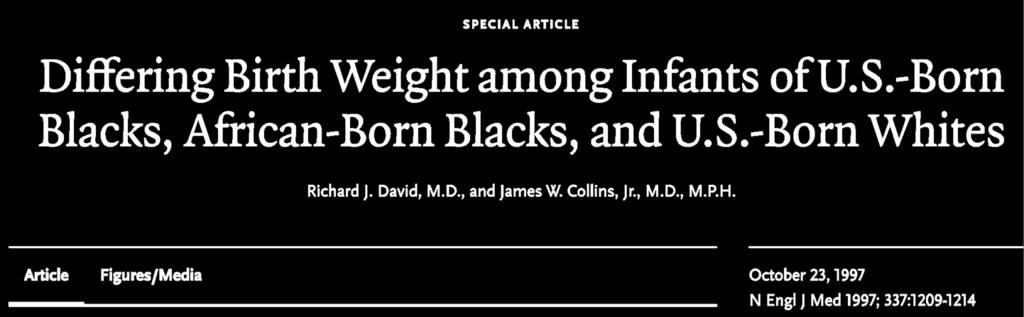
14 Percent low birth weight by Chicago community

15
16 Chicago
17 Los Angeles
18 Virginia

19 Michigan

20 Berrien County Life Expectancy

21 19 Year Life Expectancy Gap in Nine Miles

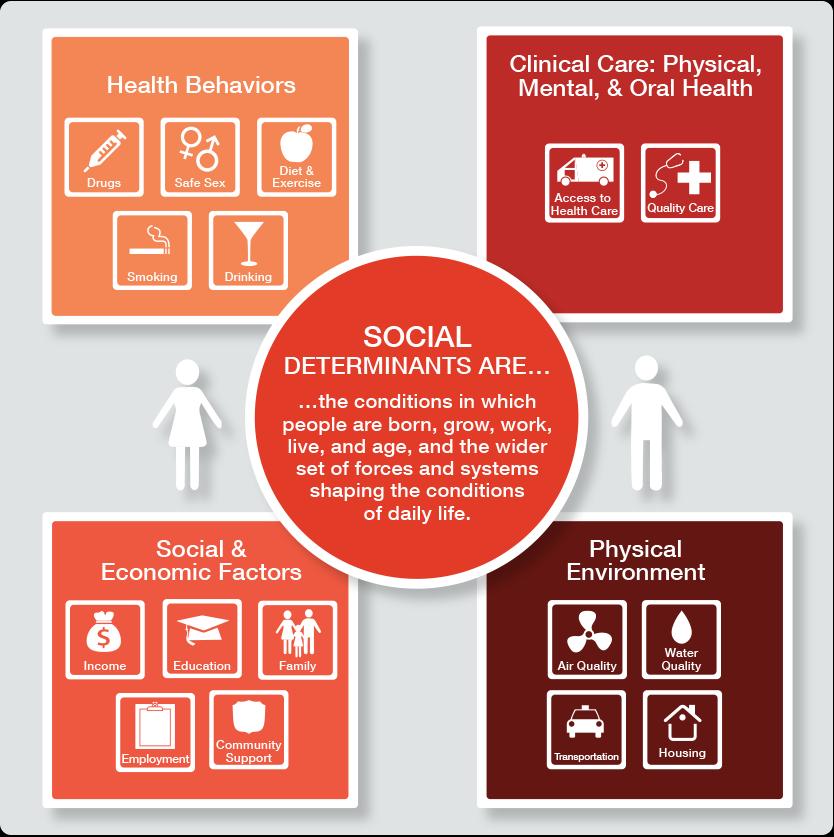
22 The Social Determinants of Health and Inequity 2003 RUSH University Medical Center
23

24 How Health Care Inequities Arise Differences in quality of care Differences in access Life opportunity gaps that lead to health status differences

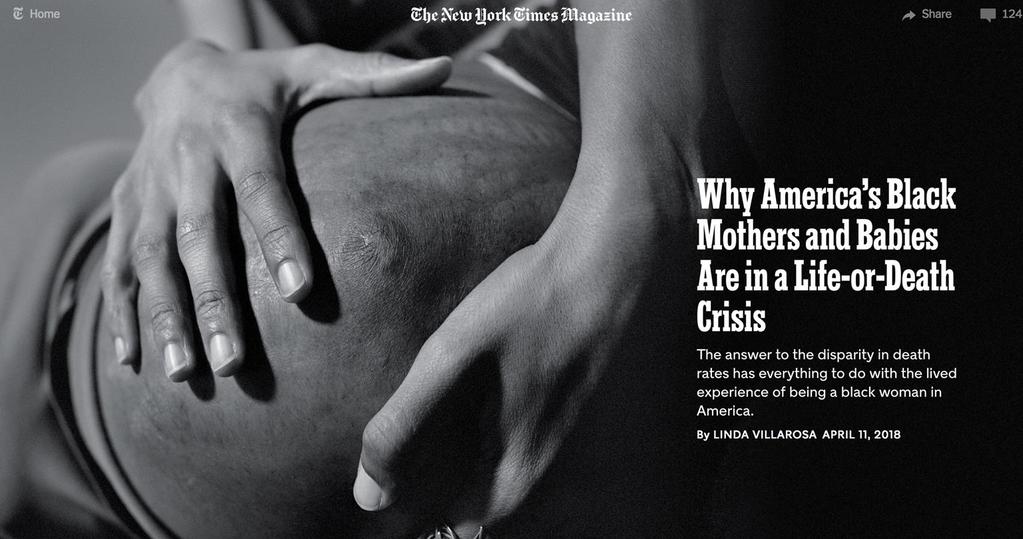
25 Racism is a Determinant of Health Inequities
26 Segregation and Mortality African Americans in Berrien County are seven times more likely to live in a high-mortality neighborhood than a low-mortality neighborhood Whites in Berrien County are two times more likely to live in a low-mortality neighborhood than a high-mortality neighborhood

27 Median Household Income by Race % as percentage of median household income of the entire population 1 Including Hispanic whites 2 American Indians and Alaska Native 3 Entire population 4 and other Pacific Islander

28 Household Income Distribution by Race Independent household income distribution of the given ethno-racial groups, normalized so that the sum of each interval is 100% Scope: households in Berrien County Count number of people in interval 1 non-hispanic whites 2 White Hispanic 3 Including Hispanic
29 Part 2: Naming Racism Differential access to the goods, services and opportunities of society by race Racism is a system of structuring opportunity and assigning value based on how someone looks Difficult to recognize a system of inequity that privileges us
30 Six Ways Racism Causes Inequity 1. Unfair concentration of Black disadvantage (White Advantage)- zip code effect 2. Institutional racism: police, incarceration, schools, hospitals, housing, jobs, food 3. Embodiment of racism (Embodiment of Privilege) 4. Bias (Implicit and Explicit) 5. Inequality in quality of health care delivery 6. Inequity in health outcomes

31 Institute of Medicine Report on Healthcare Disparity

32 2003 RUSH University Medical Center


33 Deaths per 100,000 women Chicago Black Women are 62% More Likely To Die Of Breast Cancer Age-Adjusted Female Breast Cancer Mortality for Chicago, Per 100,000 Population. Prepared by The Sinai Urban Health Institute Black White per 100,000 is 62% more deaths than 24 per 100,

34 Geography Of the Death Gap Chicago Community Areas with the Highest Annual Breast Cancer Mortality Rates Predominately African American Communities Non- African American Communities Hospitals with American College of Surgeons Approved Cancer Programs
35

36 36
37
38

39 How Does Structural Racism Work Here?

40 Part 3: Health Systems and Health Equity
41 Health Systems and Health Equity Hospitals often the largest employer Provide access to care through insurance and clinical locations to underserved Large purchaser of supplies Have large reserves in major banks Have many employees from afflicted communities Have responsibility for community health
42 Equity is an Inside-Out and Outside-In Strategy Equity strategy must be endorsed by Board and led by senior leaders Accelerate diversity and inclusion in leadership aim to achieve demographic parity in leadership We will screen our patients and partner to treat the social and structural determinants of health We name the root causes of health inequity including structural racism, economic and educational deprivation We have identified opportunities to build wealth among our low wage employees through pension reform, educational and career pathways We have adopted an anchor mission to buy, hire, invest and volunteer locally We work to identify and eliminate health care outcome gaps We partner with community groups, hospitals and community providers to address place-based root-causes of these gaps We communicate widely in many forums about what equity means 42
43 Equity is an Inside-Out and Outside-In Strategy Equity strategy must be endorsed by Board and led by senior leaders Accelerate diversity and inclusion in leadership aim to achieve demographic parity in leadership We will screen our patients and partner to treat the social and structural determinants of health We name the root causes of health inequity including structural racism, economic and educational deprivation We have identified opportunities to build wealth among our low wage employees through pension reform, educational and career pathways We have adopted an anchor mission to buy, hire, invest and volunteer locally We work to identify and eliminate health care outcome gaps We partner with community groups, hospitals and community providers to address place-based root-causes of these gaps We communicate widely in many forums about what equity means 43
44 Equity is an Inside-Out and Outside-In Strategy Equity strategy must be endorsed by Board and led by senior leaders Accelerate diversity and inclusion in leadership aim to achieve demographic parity in leadership We will screen our patients and partner to treat the social and structural determinants of health We name the root causes of health inequity including structural racism, economic and educational deprivation We have identified opportunities to build wealth among our low wage employees through pension reform, educational and career pathways We have adopted an anchor mission to buy, hire, invest and volunteer locally We work to identify and eliminate health care outcome gaps We partner with community groups, hospitals and community providers to address place-based root-causes of these gaps We communicate widely in many forums about what equity means 44
45 Equity is an Inside-Out and Outside-In Strategy Equity strategy must be endorsed by Board and led by senior leaders Accelerate diversity and inclusion in leadership aim to achieve demographic parity in leadership We will screen our patients and partner to treat the social and structural determinants of health We name the root causes of health inequity including structural racism, economic and educational deprivation We have identified opportunities to build wealth among our low wage employees through pension reform, educational and career pathways We have adopted an anchor mission to buy, hire, invest and volunteer locally We work to identify and eliminate health care outcome gaps We partner with community groups, hospitals and community providers to address place-based root-causes of these gaps We communicate widely in many forums about what equity means 45
46 Equity is an Inside-Out and Outside-In Strategy Equity strategy must be endorsed by Board and led by senior leaders Accelerate diversity and inclusion in leadership aim to achieve demographic parity in leadership We will screen our patients and partner to treat the social and structural determinants of health We name the root causes of health inequity including structural racism, economic and educational deprivation We have identified opportunities to build wealth among our low wage employees through pension reform, educational and career pathways We have adopted an anchor mission to buy, hire, invest and volunteer locally We work to identify and eliminate health care outcome gaps We partner with community groups, hospitals and community providers to address place-based root-causes of these gaps We communicate widely in many forums about what equity means 46
47 Equity is an Inside-Out and Outside-In Strategy Equity strategy must be endorsed by Board and led by senior leaders Accelerate diversity and inclusion in leadership aim to achieve demographic parity in leadership We will screen our patients and partner to treat the social and structural determinants of health We name the root causes of health inequity including structural racism, economic and educational deprivation We have identified opportunities to build wealth among our low wage employees through pension reform, educational and career pathways We have adopted an anchor mission to buy, hire, invest and volunteer locally We work to identify and eliminate health care outcome gaps We partner with community groups, hospitals and community providers to address place-based root-causes of these gaps We communicate widely in many forums about what equity means 47
48 Equity is an Inside-Out and Outside-In Strategy Equity strategy must be endorsed by Board and led by senior leaders Accelerate diversity and inclusion in leadership aim to achieve demographic parity in leadership We will screen our patients and partner to treat the social and structural determinants of health We name the root causes of health inequity including structural racism, economic and educational deprivation We have identified opportunities to build wealth among our low wage employees through pension reform, educational and career pathways We have adopted an anchor mission to buy, hire, invest and volunteer locally We work to identify and eliminate health care outcome gaps We partner with community groups, hospitals and community providers to address place-based root-causes of these gaps We communicate widely in many forums about what equity means 48
49 Equity is an Inside-Out and Outside-In Strategy Equity strategy must be endorsed by Board and led by senior leaders Accelerate diversity and inclusion in leadership aim to achieve demographic parity in leadership We will screen our patients and partner to treat the social and structural determinants of health We name the root causes of health inequity including structural racism, economic and educational deprivation We have identified opportunities to build wealth among our low wage employees through pension reform, educational and career pathways We have adopted an anchor mission to buy, hire, invest and volunteer locally We work to identify and eliminate health care outcome gaps We partner with community groups, hospitals and community providers to address place-based root-causes of these gaps We communicate widely in many forums about what equity means 49
50 Equity is an Inside-Out and Outside-In Strategy Equity strategy must be endorsed by Board and led by senior leaders Accelerate diversity and inclusion in leadership aim to achieve demographic parity in leadership We will screen our patients and partner to treat the social and structural determinants of health We name the root causes of health inequity including structural racism, economic and educational deprivation We have identified opportunities to build wealth among our low wage employees through pension reform, educational and career pathways We have adopted an anchor mission to buy, hire, invest and volunteer locally We work to identify and eliminate health care outcome gaps We partner with community groups, hospitals and community providers to address place-based root-causes of these gaps We communicate widely in many forums about what equity means 50
51 Equity is an Inside-Out and Outside-In Strategy Equity strategy must be endorsed by Board and led by senior leaders Accelerate diversity and inclusion in leadership aim to achieve demographic parity in leadership We will screen our patients and partner to treat the social and structural determinants of health We name the root causes of health inequity including structural racism, economic and educational deprivation We have identified opportunities to build wealth among our low wage employees through pension reform, educational and career pathways We have adopted an anchor mission to buy, hire, invest and volunteer locally We work to identify and eliminate health care outcome gaps We partner with community groups, hospitals and community providers to address place-based root-causes of these gaps We communicate widely in many forums about what equity means 51
52 Title Slide? Should we introduce West Side United?

53 West Side United Goal: Decrease life expectancy gap by 50% by
54 The West Side United Mission, Vision and Aim MISSION To build community health and economic wellness on Chicago s West Side and build healthy, vibrant neighborhoods. 54
55 The West Side United Mission, Vision and Aim VISION To improve neighborhood health by addressing inequities in healthcare, education, economic vitality and the physical environment using a cross-sector, place-based strategy. Partners will include other healthcare providers, education providers, the faith community, business, government and residents that work together to coordinate investments and share outcomes. 55
56 The West Side United Mission, Vision and Aim AIM To reduce the life expectancy gap between the Loop and Westside neighborhoods by 50% by
57 West Side United: a place-based, equity-framed approach to well being and neighborhood vitality Health and Healthcare Economic Vitality Neighborhood and Physical Environment Education Holistically address the social and structural determinants of health Have a unified West Side Voice to outside audiences Create opportunities to scale programs that work on the community level Identify and create new high-value connections between organizations Create common measures of success Increase the visibility of existing efforts Community led Aim: Reduce the Life Expectancy Gap between Loop and West Side by 50% by 2030
58 West Side United Work Streams West Side United Community Partnerships & Projects West Side Anchor Committee Projects Population Health Projects Individual Institutions Projects CHNA/CHIP, Internal Anchor Mission Governance Decision Rights Staffing Funding - Communications


59 Listening Tours Recommended Focus Areas from What We Heard Report


60


")
61 Hire locally and develop talent Buy and source locally Invest locally Volunteer and support community building Employment preference initiative Career ladder development Skills training Mentoring and coaching Local purchasing program Local labor for capital projects Apprenticeship Diversity hiring and contracts Impact investing in local communities Local business incubation to fulfill sourcing needs Employee engagement in local communities Leveraging employee expertise (e.g., teaching skills class)

62 West Side United Envisions Vital, Healthy Communities for All Residents and Stakeholders Equal access to behavioral and physical health services Healthy, affordable food in each neighborhood Residents employed in high-quality jobs Summer jobs & apprenticeships opportunities for all students Goal: Decrease the life expectancy gap between each neighborhood and the Loop by 50% by

63 Health Equity Achieved.Nothing About Us Without US 63

64 Thank You
ATSU-ASDOH Graduate Loan Repayment Program Application Funded by UnitedHealth Foundation
 ATSU-ASDOH Graduate Loan Repayment Program Application Funded by UnitedHealth Foundation Date: Name Last First Middle Initial Address Street Address City State Zip Code Telephone ( ) - Email Address Graduation
The Well-Being of Women in Utah
 1 The Well-Being of Women in Utah YWCA Utah s vision is that all Utah women are thriving and leading the lives they choose, with their strength benefiting their families, communities, and the state as
SENATE BILL 234 CHAPTER. Maryland Health Improvement and Disparities Reduction Act of 2012
 J SENATE BILL lr0 CF HB By: The President (By Request Administration) and Senators Benson, Currie, Ferguson, Kelley, King, Middleton, Peters, Pugh, and Rosapepe Rosapepe, and Jones Rodwell Introduced and
Citizens Health Care Working Group Wesson, Mississippi Listening Session March 29, 2006 Data Sheet
 Wesson, Mississippi Data Sheet Percent Total A Are you male or female? 42.9% 3 1 Male 57.1% 4 2 Female Percent Total B How old are you? 0.0% 1 Under 25 14.3% 1 2 25 to 44 85.7% 6 3 45 to 64 0.0% 4 Over
OFC OF FOREIGN ASSETS CONTROL. 3rd Level Subagency Report
 Department of the Treasury Response Summary Surveys Completed Department of the Treasury 51,038 Departmental Offices 1,002 UNDER SEC (TERROR&FIN INTELL) 208 88 This 2014 Federal Employee Viewpoint Survey
27% 42% 51% 16% 51% 19% PROFILE. Assets & opportunity ProfILe: PortLANd. key highlights. ABoUt the ProfILe ASSETS & OPPORTUNITY
 Assets & opportunity ProfILe: PortLANd ASSETS & OPPORTUNITY PROFILE key highlights 27% of Portland households live in asset poverty Cities have long been thought of as places of opportunity for low-income
A Framework for Implementing the Patient Protection & Affordable Care Act to Improve Health in Latino Communities
 The Latino Coalition for a Healthy California A Framework for Implementing the Patient Protection & Affordable Care Act to Improve Health in Latino Communities Preamble Twenty years ago, the Latino Coalition
Trend Analysis of Changes to Population and Income in Philadelphia, using American Community Survey (ACS) Data
 Data") OFFICE OF THE PRESIDENT FINANCE AND BUDGET TEAM City Council of Philadelphia 9.22.17 Trend Analysis of Changes to Population and Income in Philadelphia, using 2010-2016 American Community Survey (ACS)
OFFICE OF THE PRESIDENT FINANCE AND BUDGET TEAM City Council of Philadelphia 9.22.17 Trend Analysis of Changes to Population and Income in Philadelphia, using 2010-2016 American Community Survey (ACS)
(Please Print using Black or Blue Ink) SEX: GENDER IDENTITY: MARITAL STATUS: SINGLE MARRIED OTHER
 SEX: GENDER IDENTITY: MARITAL STATUS: SINGLE MARRIED OTHER") PATIENT INFORMATION (Please Print using Black or Blue Ink) LAST NAME: FIRST NAME: MIDDLE INITIAL: ADDRESS: CITY: STATE: ZIP: SEX: GENDER IDENTITY: MARITAL STATUS: SINGLE MARRIED OTHER RACE (OPTIONAL):
PATIENT INFORMATION (Please Print using Black or Blue Ink) LAST NAME: FIRST NAME: MIDDLE INITIAL: ADDRESS: CITY: STATE: ZIP: SEX: GENDER IDENTITY: MARITAL STATUS: SINGLE MARRIED OTHER RACE (OPTIONAL):
Occupation Overview Criminal Justice Administration-Corrections Related Occupations in Kern
 Occupation Overview Criminal Justice Administration-Corrections Related Occupations in Kern EMSI Q2 2015 Data Set Taft College 29 Emmons Park Drive Taft, California 93268 661.763.7700 EMSI Q2 2015 Data
Commission District 4 Census Data Aggregation
 Commission District 4 Census Data Aggregation 2011-2015 American Community Survey Data, U.S. Census Bureau Table 1 (page 2) Table 2 (page 2) Table 3 (page 3) Table 4 (page 4) Table 5 (page 4) Table 6 (page
The Demographics of Wealth
 Demographics and the Future of American Families The Demographics of Wealth May 13, 2015 William R. Emmons Bryan J. Noeth Center for Household Financial Stability Federal Reserve Bank of St. Louis William.R.Emmons@stls.frb.org
National Civic Engagement Survey Spring 2015 Descriptive Statistics
 National Civic Engagement Survey Spring 2015 Descriptive Statistics In spring 2015, nine community colleges from across the state were provided a small stipend to participate in the Civic Engagement Survey
Northwest Census Data Aggregation
 Northwest Census Data Aggregation 2011-2015 American Community Survey Data, U.S. Census Bureau Table 1 (page 2) Table 2 (page 2) Table 3 (page 3) Table 4 (page 4) Table 5 (page 4) Table 6 (page 5) Table
Riverview Census Data Aggregation
 Riverview Census Data Aggregation 2011-2015 American Community Survey Data, U.S. Census Bureau Table 1 (page 2) Table 2 (page 2) Table 3 (page 3) Table 4 (page 4) Table 5 (page 4) Table 6 (page 5) Table
Zipe Code Census Data Aggregation
 Zipe Code 66101 Census Data Aggregation 2011-2015 American Community Survey Data, U.S. Census Bureau Table 1 (page 2) Table 2 (page 2) Table 3 (page 3) Table 4 (page 4) Table 5 (page 4) Table 6 (page 5)
Zipe Code Census Data Aggregation
 Zipe Code 66103 Census Data Aggregation 2011-2015 American Community Survey Data, U.S. Census Bureau Table 1 (page 2) Table 2 (page 2) Table 3 (page 3) Table 4 (page 4) Table 5 (page 4) Table 6 (page 5)
AIA 2019 Compensation Survey Survey Questions
 Contact Info page 1 AIA 2019 Compensation Survey Survey Questions Contact Info *1. Do you currently reside in a European Union member country? This survey does not apply if you currently reside in the
Occupation Overview Industrial Health & Safety Related Occupations in Kern
 Occupation Overview Industrial Health & Safety Related Occupations in Kern EMSI Q2 2015 Data Set Taft College 29 Emmons Park Drive Taft, California 93268 661.763.7700 EMSI Q2 2015 Data Set www.economicmodeling.com
Occupational Therapy Assistant Occupation Overview
 Occupational Therapy Assistant Occupation Overview Emsi Q1 2018 Data Set March 2018 Western Technical College 400 Seventh Street La Crosse, Wisconsin 54601 608.785.9200 Emsi Q1 2018 Data Set www.economicmodeling.com
FINAL RESULTS: National Voter Survey Sample Size: 1200 Margin of Error: ±2.8% Interview Dates: June 14 th 15 th, 2018
 FINAL RESULTS: National Voter Survey Sample Size: 1200 Margin of Error: ±2.8% Interview Dates: June 14 th 15 th, 2018 Methodology: Online panel. Respondents: Likely November 2018 voters. 1: SCREENING 1.
Respiratory Therapy Occupation Overview
 Respiratory Therapy Occupation Overview Emsi Q1 2018 Data Set March 2018 Western Technical College 400 Seventh Street La Crosse, Wisconsin 54601 608.785.9200 Emsi Q1 2018 Data Set www.economicmodeling.com
SOUTH LOUISVILLE NEIGHBORHOOD PROFILE
 SOUTH LOUISVILLE NEIGHBORHOOD PROFILE July 2017 Prepared in Partnership Between the Kentucky State Data Center at the University of Louisville and Metro United Way Louisville s traditional urban neighborhoods
hera sambaziotis, md, mph, facog & martina frandina, md, facog anthony bozza, md, facog
 hera sambaziotis, md, mph, facog & martina frandina, md, facog anthony bozza, md, facog PLEASE FILL OUT ALL INFORMATION COMPLETELY AND ACCURATELY Failure to do so may give you a larger out of pocket expense
STUDY OF THE IMPACT OF THE AFFORDABLE CARE ACT (ACA) IMPLEMENTATION IN KENTUCKY
 IMPLEMENTATION IN KENTUCKY") STUDY OF THE IMPACT OF THE AFFORDABLE CARE ACT (ACA) IMPLEMENTATION IN KENTUCKY Webinar April 27, 2017, 1:00 PM CDT You will be connected to broadcast audio through your computer. You can also connect
STUDY OF THE IMPACT OF THE AFFORDABLE CARE ACT (ACA) IMPLEMENTATION IN KENTUCKY Webinar April 27, 2017, 1:00 PM CDT You will be connected to broadcast audio through your computer. You can also connect
Advancing Health Equity and Inclusive Growth in the Sacramento Region: Narrative and Data for an Equity Policy Agenda
 Advancing Health Equity and Inclusive Growth in the Sacramento Region: Narrative and Data for an Equity Policy Agenda Equity is the Superior Growth Model Racial inequities hinder economic prosperity Sacramento
In Baltimore City today, 20% of households live in poverty, but more than half of the
 Building Economic Opportunity in Baltimore: A Data Profile Baltimore Highlights In Baltimore City today, 20% of households live in poverty, but more than half of the city s population 55% is financially
Summer Enrichment Program Application
 Child s : LAST Summer Enrichment Program Application FIRST Parent/Guardian s : LAST FIRST Address: STREET CITY STATE ZIP Phone: Home (607) Work (607) Cell Phone (607) of Birth: Do you have available transportation:
The Impact of Tracing Variation on Response Rates within Panel Studies
 The Impact of Tracing Variation on Response Rates within Panel Studies Christine Carr Jennifer Wallin Kathleen Considine Azot Derecho Sarah Harris Barbara Bibb RTI International is a trade name of Research
OLD LOUISVILLE-LIMERICK (OLD LOU-LMK) NEIGHBORHOOD PROFILE
 NEIGHBORHOOD PROFILE") OLD LOUISVILLE-LIMERICK () NEIGHBORHOOD PROFILE July 2017 Prepared in Partnership Between the Kentucky State Data Center at the University of Louisville and Metro United Way Louisville s traditional urban
OLD LOUISVILLE-LIMERICK () NEIGHBORHOOD PROFILE July 2017 Prepared in Partnership Between the Kentucky State Data Center at the University of Louisville and Metro United Way Louisville s traditional urban
GERMANTOWN-PARISTOWN NEIGHBORHOOD PROFILE
 GERMANTOWN-PARISTOWN NEIGHBORHOOD PROFILE July 2017 Prepared in Partnership Between the Kentucky State Data Center at the University of Louisville and Metro United Way Louisville s traditional urban neighborhoods
LAKE FOREST NEIGHBORHOOD PROFILE
 LAKE FOREST NEIGHBORHOOD PROFILE July 2017 Prepared in Partnership Between the Kentucky State Data Center at the University of Louisville and Metro United Way This data profile uses 2010 census tract boundaries
SELECTED INDICATORS FOR WOMEN AGES 15 TO 44 IN KITSAP COUNTY
 SELECTED INDICATORS FOR WOMEN AGES 15 TO 44 IN KITSAP COUNTY TABLE OF CONTENTS Introduction page 2 Data Details page 3 Demographic Indicators page 4 Pregnancy Indicators page 5 Socioeconomic Indicators
SDs from Regional Peer Group Mean. SDs from Size Peer Group Mean
 Family: Population Demographics Population Entire MSA 2414616 Central Cities (CC) 764431 Outside Central Cities 1650185 Percent of Entire MSA 31.66% Population in CC Percent Change in Population from 1999
FUTURE LANDSCAPES. The effects of changing demographics. Background. Future landscapes: The effects of changing demographics February, 2007
 FUTURE LANDSCAPES The effects of changing demographics Background DRCOG Board Retreat 1 Our region is changing Demographic facts: Rapid growth of the older population Increasing immigration Flexible, creative
SHELBY PARK NEIGHBORHOOD PROFILE
 SHELBY PARK NEIGHBORHOOD PROFILE July 2017 Prepared in Partnership Between the Kentucky State Data Center at the University of Louisville and Metro United Way Louisville s traditional urban neighborhoods
2018:IIIQ Nevada Unemployment Rate Demographics Report*
 2018:IIIQ Nevada Unemployment Rate Demographics Report* Department of Employment, Training & Rehabilitation Research and Analysis Bureau Dr. Tiffany Tyler-Garner, Director Dennis Perea, Deputy Director
CHEROKEE-SENECA NEIGHBORHOOD PROFILE
 CHEROKEE-SENECA NEIGHBORHOOD PROFILE July 2017 Prepared in Partnership Between the Kentucky State Data Center at the University of Louisville and Metro United Way Louisville s traditional urban neighborhoods
2018 Trustee & Employee Diversity Update. June 2018
 2018 Trustee & Employee Diversity Update June 2018 Highlights at a Glance Established DEI Task Force & Steering Committee DEI Transparency: posted demographic data publicly Defined diversity, equity and
Occupation Overview. EMSI Q Data Set. Criminal Justice Program. October Western Technical College
 Occupation Overview EMSI Q2 2015 Data Set Criminal Justice Program October 2015 Western Technical College 400 Seventh Street La Crosse, Wisconsin 54601 608.785.9200 EMSI Q2 2015 Data Set www.economicmodeling.com
Cumulative Count and Percent CampusClimate
 What is your primary job assignment? Full-time Faculty (classroom) Full-time Faculty (non-classroom) 76 77.55 % 76 77.55 % 22 22.45 % 98 100.00 % Where is your primary job assignment? Oceanside Campus
2018 Annual Report of the Emerging Entrepreneur Loan Program
 This document is made available electronically by the Minnesota Legislative Reference Library as part of an ongoing digital archiving project. http://www.leg.state.mn.us/lrl/lrl.asp 2018 Annual Report
PORTLAND NEIGHBORHOOD PROFILE
 PORTLAND NEIGHBORHOOD PROFILE July 2017 Prepared in Partnership Between the Kentucky State Data Center at the University of Louisville and Metro United Way Louisville s traditional urban neighborhoods
2016 Labor Market Profile
 2016 Labor Market Profile Prepared by The Tyler Economic Development Council Tyler Area Sponsor June 2016 The ability to demonstrate a regions availability of talented workers has become a vital tool
ESPRI Hempstead- needs assessment survey
 ESPRI Hempstead- needs assessment survey February 14, 2018 ESPRI HEMPSTEAD- NEEDS ASSESSMENT SURVEY - FEBRUARY 14, 2018 1 Contents I. Introduction.....2 II. Executive Summary... 3 III. Methodology... 4
Department of Human Resources Annual Report School Year (October 1, 2008 September 30, 2009)
") Albemarle County Public Schools Department of Human Resources Annual Report 2009 2010 School Year (October 1, 2008 September 30, 2009) School Year 2009-2010 Annual Report (October 1, 2008 September 30,
Albemarle County Public Schools Department of Human Resources Annual Report 2009 2010 School Year (October 1, 2008 September 30, 2009) School Year 2009-2010 Annual Report (October 1, 2008 September 30,
SALARY EQUITY ANALYSIS AT ARL INSTITUTIONS
 SALARY EQUITY ANALYSIS AT ARL INSTITUTIONS Quinn Galbraith, MSS & MLS - Sociology and Family Life Librarian, ARL Visiting Program Officer Michael Groesbeck, BS - Statistician Brigham R. Frandsen, PhD -
OFFICE OF HUMAN RESOURCES FISCAL YEAR 2019 BUDGET TESTIMONY APRIL 16, 2018
 INTRODUCTION OFFICE OF HUMAN RESOURCES FISCAL YEAR 2019 BUDGET TESTIMONY APRIL 16, 2018 Good Afternoon, President Clarke and Members of City Council. I am Pedro Rodriguez, Director of Human Resources.
This is a PDF version of the 2019 Law survey. To complete the survey, follow this link to the online form.
 This is a PDF version of the 2019 Law360 400 survey. To complete the survey, follow this link to the online form. Welcome to the 2019 Law360 400 survey! The answers to these questions will be used for
How Medicaid Enrollees Fare Compared with Privately Insured and Uninsured Adults
 ISSUE BRIEF APRIL 2017 How Medicaid Enrollees Fare Compared with Privately Insured and Uninsured Adults Findings from the Commonwealth Fund Biennial Health Insurance Survey, 2016 Munira Z. Gunja Senior
State and Federal Health Care Reform in Alameda County:
 State and Federal Health Care Reform in Alameda County: -Preliminary Impact Analysis -Challenges and Opportunities -The Low Income Health Program - The Health Care Portal Alex Briscoe, Director, Alameda
Florida State University. From the SelectedWorks of Patrick L. Mason. Patrick Leon Mason, Florida State University. Winter February, 2009
 Florida State University From the SelectedWorks of Patrick L. Mason Winter February, 2009 DISTRIBUTIONAL ANALYSIS OF LABOR AND PROPERTY INCOME AMONG NEW SENIORS AND EARLY RETIREES: BY RACE, GENDER, REGION,
Although several factors determine whether and how women use health
 CHAPTER 3: WOMEN AND HEALTH INSURANCE COVERAGE Although several factors determine whether and how women use health care services, the importance of health coverage as a critical resource in promoting access
Case Study Primer Purpose of a Case Study: Practical Uses for a Case Study: UpLift Solutions CDFI Case Study:
 Case Study Primer Opportunity Finance Network is the leading national network of community development financial institutions (CDFIs) investing in opportunities that benefit low-income, low-wealth, and
AFFORDABLE CARE ACT. And the Aging Population Jan Figart, MS & Laura Ross-White, MSW. A Sign of the Times: Health Trends and Ethics
 AFFORDABLE CARE ACT And the Aging Population Jan Figart, MS & Laura Ross-White, MSW A Sign of the Times: Health Trends and Ethics LiveStream: http://ostate.tv Learning Objectives Describe the history of
FRANCHISED BUSINESS OWNERSHIP: By Minority and Gender Groups
 Published by Sponsored by FRANCHISED BUSINESS OWNERSHIP: By Minority and Gender Groups 2011 The IFA Educational Foundation. All Rights Reserved. No part of this book may be reproduced or transmitted in
Home Improvement Loan Application
 Home Improvement Loan Application Submit your application and required documents by email, mail, or hand deliver. Email to: eotero@cityofboise.org Mail to: Boise City HCD Hand deliver: 150 N Capitol Blvd
Whither Retirement Strategies?
 Whither Retirement Strategies? Discussion of Byrne & Reilly and Fitchner & Seligman papers PENSION RESEARCH COUNCIL 2017 CONFERENCE Emily Kessler, FSA, Society of Actuaries 04 May 2017 How do you prepare
EASTWOOD-LONG RUN NEIGHBORHOOD PROFILE
 EASTWOOD-LONG RUN NEIGHBORHOOD PROFILE July 2017 Prepared in Partnership Between the Kentucky State Data Center at the University of Louisville and Metro United Way This data profile uses 2010 census tract
WHO S LEFT TO HIRE? WORKFORCE AND UNEMPLOYMENT ANALYSIS PREPARED BY BENJAMIN FRIEDMAN JANUARY 23, 2019
 JANUARY 23, 2019 WHO S LEFT TO HIRE? WORKFORCE AND UNEMPLOYMENT ANALYSIS PREPARED BY BENJAMIN FRIEDMAN 13805 58TH STREET NORTH CLEARNWATER, FL, 33760 727-464-7332 Executive Summary: Pinellas County s unemployment
PRIME COMMERCIAL LAND FOR SALE
 PRIME COMMERCIAL LAND AVENUE P-4 & 5 TH STREET WEST OUTSTANDING HWY. 14 EXPOSURE COMING SOON TRADE & COMMERCE CENTER HEART OF S RETAIL & BUSINESS CORRIDOR The depiction in the included photograph of any
Issue Brief. Does Medicaid Make a Difference? The COMMONWEALTH FUND. Findings from the Commonwealth Fund Biennial Health Insurance Survey, 2014
 Issue Brief JUNE 2015 The COMMONWEALTH FUND Does Medicaid Make a Difference? Findings from the Commonwealth Fund Biennial Health Insurance Survey, 2014 The mission of The Commonwealth Fund is to promote
Wealth Inequality and the American Dream
 Wealth Inequality and the American Dream Economic Realities of the American Dream Professors Steve Fazzari and Mark Rank April 16, 2018 Ray Boshara Director, Center for Household Financial Stability Federal
SDs from Regional Peer Group Mean. SDs from Size Peer Group Mean
 Family: Population Demographics Population Entire MSA 602894 Central Cities (CC) 227,818 Outside Central Cities 375,076 Percent of Entire MSA 37.79% Population in CC Percent Change in Population from 1999
SDs from Regional Peer Group Mean. SDs from Size Peer Group Mean
 Family: Population Demographics Population Entire MSA 1187941 Central Cities (CC) 511,843 Outside Central Cities 676,098 Percent of Entire MSA 43.09% Population in CC Percent Change in Population from
SDs from Regional Peer Group Mean. SDs from Size Peer Group Mean
 Family: Population Demographics Population Entire MSA 661645 Central Cities (CC) 247,057 Outside Central Cities 414,588 Percent of Entire MSA 37.34% Population in CC Percent Change in Population from 1999
SDs from Regional Peer Group Mean. SDs from Size Peer Group Mean
 Family: Population Demographics Population Entire MSA 583845 Central Cities (CC) 316,649 Outside Central Cities 267,196 Percent of Entire MSA 54.24% Population in CC Percent Change in Population from 1999
SDs from Regional Peer Group Mean. SDs from Size Peer Group Mean
 Family: Population Demographics Population Entire MSA 1251509 Central Cities (CC) 540,423 Outside Central Cities 711,086 Percent of Entire MSA 43.18% Population in CC Percent Change in Population from
SDs from Regional Peer Group Mean. SDs from Size Peer Group Mean
 Family: Population Demographics Population Entire MSA 1135614 Central Cities (CC) 677,766 Outside Central Cities 457,848 Percent of Entire MSA 59.68% Population in CC Percent Change in Population from
SDs from Regional Peer Group Mean. SDs from Size Peer Group Mean
 Family: Population Demographics Population Entire MSA 591932 Central Cities (CC) 260,970 Outside Central Cities 330,962 Percent of Entire MSA 44.09% Population in CC Percent Change in Population from 1999
SDs from Regional Peer Group Mean. SDs from Size Peer Group Mean
 Family: Population Demographics Population Entire MSA 1100491 Central Cities (CC) 735,617 Outside Central Cities 364,874 Percent of Entire MSA 66.84% Population in CC Percent Change in Population from
SDs from Regional Peer Group Mean. SDs from Size Peer Group Mean
 Family: Population Demographics Population Entire MSA 540258 Central Cities (CC) 198,915 Outside Central Cities 341,343 Percent of Entire MSA 36.82% Population in CC Percent Change in Population from 1999
SDs from Regional Peer Group Mean. SDs from Size Peer Group Mean
 Family: Population Demographics Population Entire MSA 1249763 Central Cities (CC) 691,295 Outside Central Cities 558,468 Percent of Entire MSA 55.31% Population in CC Percent Change in Population from
SDs from Regional Peer Group Mean. SDs from Size Peer Group Mean
 Family: Population Demographics Population Entire MSA 1088514 Central Cities (CC) 272,953 Outside Central Cities 815,561 Percent of Entire MSA 25.08% Population in CC Percent Change in Population from
SDs from Regional Peer Group Mean. SDs from Size Peer Group Mean
 Family: Population Demographics Population Entire MSA 922516 Central Cities (CC) 470,859 Outside Central Cities 451,657 Percent of Entire MSA 51.04% Population in CC Percent Change in Population from 1999
SDs from Regional Peer Group Mean. SDs from Size Peer Group Mean
 Family: Population Demographics Population Entire MSA 687249 Central Cities (CC) 198,500 Outside Central Cities 488,749 Percent of Entire MSA 28.88% Population in CC Percent Change in Population from 1999
SDs from Regional Peer Group Mean. SDs from Size Peer Group Mean
 Family: Population Demographics Population Entire MSA 542149 Central Cities (CC) 181870 Outside Central Cities 360279 Percent of Entire MSA 33.55% Population in CC Percent Change in Population from 1999
SDs from Regional Peer Group Mean. SDs from Size Peer Group Mean
 Family: Population Demographics Population Entire MSA 1025598 Central Cities (CC) 293,834 Outside Central Cities 731,764 Percent of Entire MSA 28.65% Population in CC Percent Change in Population from
SDs from Regional Peer Group Mean. SDs from Size Peer Group Mean
 Family: Population Demographics Population Entire MSA 875583 Central Cities (CC) 232,835 Outside Central Cities 642,748 Percent of Entire MSA 26.59% Population in CC Percent Change in Population from 1999
SDs from Regional Peer Group Mean. SDs from Size Peer Group Mean
 Family: Population Demographics Population Entire MSA 716998 Central Cities (CC) 448,275 Outside Central Cities 268,723 Percent of Entire MSA 62.52% Population in CC Percent Change in Population from 1999
SDs from Regional Peer Group Mean. SDs from Size Peer Group Mean
 Family: Population Demographics Population Entire MSA 1333914 Central Cities (CC) 284,943 Outside Central Cities 1,048,971 Percent of Entire MSA 21.36% Population in CC Percent Change in Population from
SDs from Regional Peer Group Mean. SDs from Size Peer Group Mean
 Family: Population Demographics Population Entire MSA 712738 Central Cities (CC) 448,607 Outside Central Cities 264,131 Percent of Entire MSA 62.94% Population in CC Percent Change in Population from 1999
SDs from Regional Peer Group Mean. SDs from Size Peer Group Mean. Population Entire MSA
 Family: Population Demographics Population Entire MSA 1169641 Central Cities (CC) 0 Outside Central Cities 1,169,641 Percent of Entire MSA 0% Population in CC Percent Change in Population from 1999 to
SDs from Regional Peer Group Mean. SDs from Size Peer Group Mean
 Family: Population Demographics Population Entire MSA 3251876 Central Cities (CC) 2,078,750 Outside Central Cities 1,173,126 Percent of Entire MSA 63.92% Population in CC Percent Change in Population from
SDs from Regional Peer Group Mean. SDs from Size Peer Group Mean
 Family: Population Demographics Population Entire MSA 1592383 Central Cities (CC) 1,181,140 Outside Central Cities 411,243 Percent of Entire MSA 74.17% Population in CC Percent Change in Population from
SDs from Regional Peer Group Mean. SDs from Size Peer Group Mean
 Family: Population Demographics Population Entire MSA 1776062 Central Cities (CC) 716,793 Outside Central Cities 1,059,269 Percent of Entire MSA 40.36% Population in CC Percent Change in Population from
SDs from Regional Peer Group Mean. SDs from Size Peer Group Mean
 Family: Population Demographics Population Entire MSA 4112198 Central Cities (CC) 416,474 Outside Central Cities 3,695,724 Percent of Entire MSA 10.13% Population in CC Percent Change in Population from
SDs from Regional Peer Group Mean. SDs from Size Peer Group Mean
 Family: Population Demographics Population Entire MSA 9519338 Central Cities (CC) 4408996 Outside Central Cities 5110342 Percent of Entire MSA 46.32% Population in CC Percent Change in Population from
SDs from Regional Peer Group Mean. SDs from Size Peer Group Mean
 Family: Population Demographics Population Entire MSA 1623018 Central Cities (CC) 152397 Outside Central Cities 1470621 Percent of Entire MSA 9.39% Population in CC Percent Change in Population from 1999
SDs from Regional Peer Group Mean. SDs from Size Peer Group Mean
 Family: Population Demographics Population Entire MSA 1731183 Central Cities (CC) 776733 Outside Central Cities 954450 Percent of Entire MSA 44.87% Population in CC Percent Change in Population from 1999
SDs from Regional Peer Group Mean. SDs from Size Peer Group Mean
 Family: Population Demographics Population Entire MSA 2968806 Central Cities (CC) 669,769 Outside Central Cities 2,299,037 Percent of Entire MSA 22.56% Population in CC Percent Change in Population from
SDs from Regional Peer Group Mean. SDs from Size Peer Group Mean
 Family: Population Demographics Population Entire MSA 2846289 Central Cities (CC) 809063 Outside Central Cities 2037226 Percent of Entire MSA 28.43% Population in CC Percent Change in Population from 1999
SDs from Regional Peer Group Mean. SDs from Size Peer Group Mean
 Family: Population Demographics Population Entire MSA 4441551 Central Cities (CC) 1147720 Outside Central Cities 3293831 Percent of Entire MSA 25.84% Population in CC Percent Change in Population from
SDs from Regional Peer Group Mean. SDs from Size Peer Group Mean
 Family: Population Demographics Population Entire MSA 1500741 Central Cities (CC) 661799 Outside Central Cities 838942 Percent of Entire MSA 44.1% Population in CC Percent Change in Population from 1999
SDs from Regional Peer Group Mean. SDs from Size Peer Group Mean
 Family: Population Demographics Population Entire MSA 2552994 Central Cities (CC) 686992 Outside Central Cities 1866002 Percent of Entire MSA 26.91% Population in CC Percent Change in Population from 1999
Increase career awareness Build the pipeline Foster retention and development in the career Improve and strengthen the organization
 2 0 1 7 S T R AT E G I C I N I T I AT I V E S INTRODUCTION Over the past few years, we have focused on a long-term strategic plan that was carefully carved out to help us live up to the mission of our
Racial Wealth Divide Initiative
 Racial Wealth Divide Initiative Dedrick Asante-Muhammad Director of the Racial Wealth Divide CFED Mission: CFED's work makes it possible for millions of people to achieve financial security and contribute
Small Area Health Insurance Estimates from the Census Bureau: 2008 and 2009
 October 2011 Small Area Health Insurance Estimates from the Census Bureau: 2008 and 2009 Introduction The U.S. Census Bureau s Small Area Health Insurance Estimates (SAHIE) program produces model based
Kansas City Regional Health Assessment
 Kansas City Regional Health Assessment REACH Healthcare Foundation Prepared by Mid-America Regional Council 2013 The Regional Health Story How socio-economic factors, health access factors, health insurance
American Indian Health System. Donald Warne, MD, MPH Oglala Lakota
 American Indian Health System Donald Warne, MD, MPH Oglala Lakota Overview of: OBJECTIVES Issues in Health Law & Policy AI Health & Resource Disparities Social Justice and Indian Health Role of ACA on