FY2018 Full Year Results. 30 August 2018 David Singleton, Chief Executive Officer Greg Jason, Chief Financial Officer
|
|
|
- Iris Bridges
- 5 years ago
- Views:
Transcription

1 FY2018 Full Year Results 30 August 2018 David Singleton, Chief Executive Officer Greg Jason, Chief Financial Officer
2 Financial Headlines EBIT $65 m 43% NPAT $39 m 154% Dividend 3 per share 50% Operating Cash Flow $66 m up $104 m 1 YEAR ON YEAR CHANGE Net Cash $34 m up $15 m 1. Excludes Capes 9 & 10 operating lease


3 2018 Key Facts $1.39B ~ $3.0 B REVENUE ORDER BOOK NEW SHIPS ORDERED SHIPS UNDER CONSTRUCTION OR SCHEDULED 5 SHIPS DELIVERED 5,250 EMPLOYEES 4 SERVICE CENTRES 5 SHIPYARDS 32 VESSELS UNDER SUSTAINMENT OR REFURBISHMENT
.")

4 Operational Highlights USA Business performing ahead of expectations: Shipbuilding margin increased from 6.8% to 8.6%. 4 Vessels delivered in year. 3 LCS and 1 EPF in US 2018 Federal defense budget. Commercial Ferry Market growing fast: $420 million new orders (Total order book $444 million). Commercial revenue will double in FY2019. Significant investment in new vessel designs. Expanding Asian capacity four fold. Asia and Australia on track for FY2019 profitability. Double digit Support growth maintained. Revenue now over $200 million pa. Order Pipeline remains very strong: Commercial ferry order pipeline remains strong. Trinidad and Philippines have announced intention to purchase Austal Defence vessels.
5 FY2018 Financials
6 Earnings $ m FY2018 FY2017 Change Revenue $ 1,392.0 $ 1,310.1 $ 81.9 EBITDA EBIT Operating Revenue increased across all shipyards (pre FX impact). Significant increase across all profit measures, driven by strength of USA earnings. USA shipbuilding results exceeded guidance. Effective accounting tax rate ~ 31% (cash rate of ~ 12%). NPAT EPS (cents)
7 Segment breakdown $m Concept Ships Systems Support Other Total USA: Australia: Revenue $ $ $ $ - $ 1,162.6 USA EBIT (3.0) 83.0 EBIT Margin % 8.5% 2.9% 6.4% - 7.1% Revenue $ $ - $ 75.0 $ - $ Australia EBIT (10.9) (6.7) EBIT Margin % (8.8%) - 5.7% - (3.4%) Revenue $ 57.9 $ - $ - $ - $ 57.9 Asia EBIT (1.6) (1.6) EBIT Margin % (2.8%) (2.8%) Shipbuilding margin exceeded upper end of guidance range, Support Revenue continued to grow and EBIT excludes some award fees not assessed by the customer at year end. Volume impacted by OPV outcome, GCPB with zero profit take up in FY2018, as planned. Support strong considering the negative influence of onerous CCPB sustainment contract. Asia: Philippines EBIT of $(0.3) m, Vietnam start-up costs expensed $(1.2) m. Philippines throughput constrained by infrastructure, expansion in progress in both countries, will double revenue in FY2019.
8 USA shipbuilding margin reporting FY2019 Accounting changes required under AASB 15 will result in the Ships and Systems components being combined. FY2018 & FY2017 results have been recalculated to provide a comparative for future reporting periods. FY % is a weighted average of Ships (8.5%) and Systems (2.9%) from the prior slide. $m Concept Ships Support Other Total Revenue $ 1,028.0 $ $ - $ 1,162.6 FY2018 EBIT (3.0) 83.0 EBIT Margin % 7.5% 6.4% - 7.1% Revenue $ 1,049.1 $ $ - $ 1,172.1 FY2017 EBIT (2.4) 76.1 EBIT Margin % 5.9% 13.3% - 6.5% Revenue $ (21.0) $ 11.6 $ - $ (9.4) B/(W) EBIT 15.1 (7.6) (0.5) 7.0 EBIT Margin % 1.6% (6.8%) - (73.9%)
9 Cash flow $ m FY2018 FY2017 Change Operating $ 65.6 $ (37.9) $ Investing Sustaining $ (15.0) $ (10.7) $ (4.3) Enhancing (15.9) - (15.9) CCPB 9 & 10 (3.0) (42.8) 39.8 Financing Debt $ (9.2) $ (13.5) $ 4.2 CCPB 9 & (38.1) Dividends (12.8) (12.3) (0.5) FX differences (3.4) Net Cash Flow $ 11.6 $ (73.8) $ 85.4 Cash Jun 2018 Jun 2017 Change Operating: Significant operating cash flow. Strong EBITDA conversion. Investing: Sustaining capex in typical range of $(10) (15) million. Enhancing capex includes $(9.8) m acquisition of ElectraWatch and $(5.2) m expansion of Philippines. Financing: GZB & lease debt reduction. Dividends net of DRP. Closing cash: Strong closing cash position. Higher net cash excluding CCPB 9 & 10 debt. Supports 3 cps final dividend. bank $ $ $ 11.6 Net cash $ 33.9 $ 19.3 $ 14.6
10 Net Cash / (Debt) $ m $100 June 2018 Net Cash $34 m excluding CCPB 9 & 10 residual buyback guarantee $50 $0 ($50) Cash (Debt) ($100) ($150) ($200) Dec 2012 Jun 2013 Dec 2013 Jun 2014 Dec 2014 Jun 2015 Dec 2015 Jun 2016 Dec 2016 Jun 2017 Dec 2017 Jun 2018


11 Business Priorities 2019
 7-8% Defence 1 or")


12 FY2019 Guidance Revenue of $ billion USA Margin (new combined method) 7-8% Defence 1 or 2 LCS from 2018 US fiscal budget. 1 EPF from 2018 US fiscal budget. Trinidad have announced intent to purchase 2 Cape Class Patrol Boats. Philippines have announced intent to purchase OPVs. Group Expect cash generation to be similar to FY2018. Effective tax rates similar to FY2018. Commercial Commercial vessel order pipeline continues to be strong. Capacity expansion in Asia will be fully functional by FY2019 H2 although start up risks for both sites remain. 8 vessels in construction excluding China. Australia revenue flat but return to profit. Asia revenue to double. Support Continued Naval support growth. Expansion in San Diego for LCS. Armidale support complete. GCPB support starts late FY2019. CCPB support performance remains concerning.
13 Business Overview


14 Ships in Construction


15 Support


16 Shipyards


17


18

19

20
21 Strategy and Outlook
22 Commercial Ferry Market Overview 1. Austal s core market of commercial ferries has entered a period of likely sustained growth based on the need to replace old vessels and the growth of new routes. 2. Austal has invested in major capacity expansion and new modern vessel designs early in the cycle and is in a position to deliver into this market. 3. Austal remains highly differentiated in its core aluminium high speed market.
23 Global passenger transport sector is strong. Intra-European travel a leading indicator of ROPAX ferry demand. Growth in global air-travel is accelerating year on year, with negligible impact from high oil prices or recessions In Europe, local Europeans make up more than 90% of all tourist destination travel, growing at 4% CAGR 2 Passengers carried, worldwide by airlines millions Nights stayed in European tourist destinations, millions % CAGR Europeans 1. World Bank compilation of International Civil Aviation Organization, Civil Aviation Statistics of the World and ICAO staff estimates 2. Eurostat non-europeans
24 Conventional large ferry construction market is running at record levels of activity, globally New build orders per year [ Vessels >70m ] 30 year historic peak
25 Global high speed ferry replacement market is now underway, but yet to hit its peak Age of global high speed ferry fleet (vessels >70 metres) Expected Life = 25 years 12 Number of vessels Vessel Age Source: Fast Ferry International, Shippax
26 New build market for large high speed ferries is exceeding Austal projections, due to operators adding new capacity and routes. 6 5 New build orders per year [ Vessels >70m] Projected renewal orders Actual renewal orders Actual new capacity orders Austal analysis


27 Austal s technology differentiation is evident in new vessel sales; unique trimaran hull-forms paired with next generation Marinelink


28 Austal has rapidly expanded yard capacity ( X4 ) and in house design capacity at Henderson has grown to match plan Vietnam Philippines Australia Design Team (FTE) Sub-Contractors In-House Design Team 0 Build Capacity : Approximate tonnes of Aluminium per annum* * circle sizes for indicative purposes only


29 Defence Market Overview 1. The core LCS and EPF programs in the US continue to improve in productivity and delivery velocity, providing healthy foundation for Group profitability. 2. Austal s performance is reflected in the strengthening order book and naval opportunity pipeline, both in the US and exports from Australia. 3. As the operational fleet of Austal designed and built naval vessels steadily increases, income from sustainment activity is growing in parallel.


30 USA build efficiency has improved dramatically on both LCS & EPF and led to a step change in delivery velocity Labour hours per vessel Deliveries by Year, LCS & EPF LCS EPF % FY13 FY14 FY15 FY16 FY17 FY18
31 US shipbuilding margin improving, orders are strong. US shipbuilding margin, % 10% Orders by year, EPF & LCS 4 LCS EPF 9% 3 8% 7% 2 6% 1 5% FY2017 H1 FY2017 H2 FY2018 H1 FY2018 H2 0 FY13 FY14 FY15 FY16 FY17 FY18


32 Sustainment Revenue linked to growth of OEM vessels under management 9 x LCS 9 x EPF 10 x CCPB 21 x GCPB


33 Sustainment has been growing in line with naval vessel deliveries, Vessels under management set to grow. $250 Group Sustainment Revenue Vessels under Management 75 $200 $150 $ Other AUSA Australia $50 $0 CAGR 30% FY2015 FY2016 FY2017 FY FY14 FY15 FY16 FY17 FY18 FY19 FY20 FY21 FY22 FY23

34 FY2018 Operational Overview
. Margin improving ship to ship. LCS 12, 14 & 16 delivered in the year. Awarded LCS 30 through a competitive tender.")
 maybe contracted in each of next 2 years.")
35 USA operations Shipbuilding margin improvement to 8.6% (FY2017 margin 6.8%). Change since FY2017 VESSEL PROGRAMS: Littoral Combat Ship (~US$5.9 billion program). Margin improving ship to ship. LCS 12, 14 & 16 delivered in the year. Awarded LCS 30 through a competitive tender. US Federal budget shows 3 LCS in 2018 and potentially 3 more in Expeditionary Fast Transport (~US$2.0 billion program). Margin steady and at internal target. 2 additional vessels in current RFP (EPF 13 & 14) maybe contracted in each of next 2 years. Various opportunities for additional vessels in emerging applications. EPF 9 delivered in the year.

. Several new small vessel designs. Marine Link Smart development. VESSEL PROGRAMS: GCPB (~$335 million, 21 ship program).")

36 Australia operations Change since FY2017 Shipbuilding programs (Mols and PPB) on schedule and cost. but construction volume to increase in FY2018. Construction volume flat in FY2019. Major cost reduction drive underway. Achieved 25% labour reduction. Significant technology investment underway to keep ferry capability ahead given strong market conditions. New 109m and 94m catamaran designs. 2 new trimaran designs (117m & 82m). Several new small vessel designs. Marine Link Smart development. VESSEL PROGRAMS: GCPB (~$335 million, 21 ship program). 1 st vessel undergoing sea trials on-time. Recognise profit from Mols (~$90 million, 109m vehicle / passenger ferry). Vessel close to launch and on schedule. Best ever efficiency in build. Cape Class Patrol Boats 9 & year charter commenced FY2017. Charter extension review in H1 CY2019. SUPPORT CONTRACTS: CCPB support $3.2 million provision in FY2017 as more resources required than anticipated. Armidale Class remediation, performed well now complete.


. Delivery early CY2020, completion in Australia.")

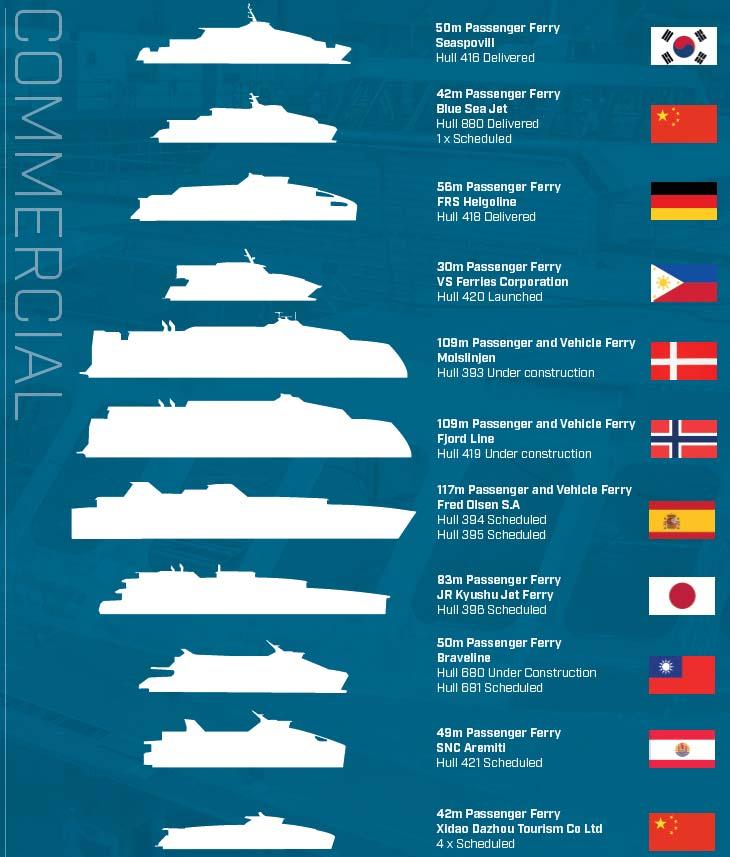
37 Philippines operations Change since FY2017 $22 million investment to increase ship building capacity 3 fold. New facilities complete by year end. Yard at full capacity to end CY2019. CY2019 revenue will be twice historic peak and ~ 3 times historic average. Investment in facilities unlocks capacity for larger and more vessels. VESSEL PROGRAMS: Fjord Line A$108 million, 109m vehicle / passenger ferry under construction. Modules in build. Integration commences early CY2019 (when new facility complete). Delivery early CY2020, completion in Australia. VS Ferries Samar Philippines A$5.5 million, 30m catamaran delivered August Aremiti 49m catamaran, delivery July Brave Line Taiwan A$44 million, 2 x 50m catamarans under construction. FRS Germany A$22 million, 56m high speed catamaran delivered. Seaspovill South Korea A$16 million, 50m high speed passenger ferry delivered.


38 Vietnam operations (new facility) New leased facility in build, capable of building medium to large vessels. Lease is for minimum 2 years plus extensions at Austal option. Expatriate management team in place who have built multiple catamarans and operations have commenced supporting Philippines. Large aluminium experienced labor pool available. 2 significant vessels expected to commence full production during next 6 months subject to order confirmation. Low overhead and cost base should drive material profitability in first year.


39 China operations (Aulong Shipbuilding) 40: 60 Joint Venture with Guandong Jianglong Shipbuilding, formed Growth expected into FY2019. VESSEL PROGRAMS: Blue Sea Jet A$10 m, 42 m high speed ferry DELIVERED January Blue Sea Jet A$5.6 m, 35 m high speed catamaran under construction. Xidao Dazhou Tourism Co Ltd. A$20 m, 4 x 42m high speed catamarans under construction..
40 Disclaimer David Singleton, Chief Executive Officer Telephone: For further information visit Disclaimer This presentation and any oral presentation accompanying it has been prepared by Austal Limited ( Austal ). It should not be considered as an offer or invitation to subscribe for or purchase any securities in Austal or as an inducement to make an offer or invitation with respect to those securities. No agreement to subscribe for securities in Austal will be entered into on the basis of this presentation. Our presentation contains forward-looking statements or projections based on current expectations. These statements are not guarantees of future performance and are subject to risks and uncertainties. Key risks are set out in the Company s Corporate Governance Statement and published on its website they include impacts to US programs, the availability of US government funding due to budgetary or debt ceiling constraints; changes in customer priorities or their ability to meet contractual requirements, additional costs or schedule revisions. There are also broader risks to the enterprise such as cyber Sample Image only security, HSEQ incidents, product liability and material unexpected changes to the Company s financing arrangements. Austal s expansion into Asia also naturally brings with it a number of risks that are typical when entering new jurisdictions or expanding in others. Actual results may also effect the capitalization changes on earnings per share; the allowability of costs under government cost accounting divestitures or joint ventures; the timing and availability of future impact of acquisitions; the timing and availability of future government awards; economic, business and regulatory conditions and other factors. We disclaim any duty to update forward looking statements to reflect new developments. Accordingly, to the maximum extent permitted by applicable laws, Austal makes no representation and can give no assurance, guarantee or warrant, express or implied, as to, and takes not responsibility and assumes no liability for, the authenticity, validity, accuracy, suitability or completeness of, or any errors in or omission, from any information, statement or opinion contained in this presentation. You should not act or refrain from acting in reliance on this presentation material. This overview of Austal does not purport to be all inclusive or to contain all information which its recipients may require in order to make an informed assessment of Austal s prospects. You should conduct your own investigation and perform your own analysis in order to satisfy yourself as to the accuracy and completeness of the information, statements and opinions contained in this presentation before making any investment decision.


41 END
Photo: Willie Blaauw
 Photo: Willie Blaauw $ m Concept Ships Support Other Total Revenue $ 596.7 $ 90.1 $ - $ 686.8 USA EBIT 42.2 6.9 (0.0) 49.1 EBIT Margin % 7.1% 7.7% - 7.2% Revenue $ 139.0 $ 30.6 $ - $ 169.7 Australasia
FY2016 earnings and LCS program update. David Singleton, Chief Executive Officer 4 July 2016 Greg Jason, Chief Financial Officer
 FY2016 earnings and LCS program update David Singleton, Chief Executive Officer 4 July 2016 Greg Jason, Chief Financial Officer Summary post detailed review of LCS program LCS review Increased the total
STRONG RESULT WITH $100M CASHFLOW, RECORD $5.2B ORDER BOOK
 STRONG RESULT WITH $100M CASHFLOW, RECORD $5.2B ORDER BOOK COMPANY ANNOUNCEMENT 28 FEBRUARY 2019 FY2019 H1 Summary: Revenue of $851.5 million (FY2018 H1: $650.3 million), up 31% EBIT of $40.4 million (FY2018
For personal use only
 COMPANY ANNOUNCEMENT 23 FEBRUARY 2016 AUSTAL DELIVERS STRONG CASHFLOW, DOUBLES INTERIM DIVIDEND Summary: Revenue of $747.4 million (FY2015 H1: $680.2 million) EBIT of $29.0 million (FY2015 H1: $45.0 million,
31 DECEMBER 2017 HALF YEAR REPORT
 AUSTAL LIMITED 31 DECEMBER 2017 HALF YEAR REPORT Contents Contents... 1 Directors report... 2 Auditor independence... 6 Consolidated statement of profit and loss and other comprehensive income for the
AUSTAL DELIVERS RECORD REVENUE AND REDUCES NET DEBT BY 50%
 AUSTAL DELIVERS RECORD REVENUE AND REDUCES NET DEBT BY 50% COMPANY ANNOUNCEMENT 27 AUGUST 2014 Summary of results: Revenue of $1,122.9 million (FY2013: $899.5 million), EBIT of $55.6 million (FY2013: $38.1
TOURISM HOLDINGS LTD FY16 INTERIM RESULTS PRESENTATION. 23 February 2016
 TOURISM HOLDINGS LTD FY16 INTERIM RESULTS PRESENTATION 23 February 2016 $M H1 FY16 Highlights Revenue $134M up 20% Earnings before interest and tax* $15.0M up 42% Net profit after tax $8.2M up 45% H1 EBIT
Austal. Retail take up 62% Earnings and target price revision. Price catalyst. Action and recommendation
 AUSTRALIA ASB AU Price (at 01:41, 02 Jan 2013 GMT) A$0.58 Volatility index Medium GICS sector Capital Goods Market cap A$m 201 30-day avg turnover A$m 0.3 Number shares on issue m 346.0 Investment fundamentals
FY2017 RESULTS PRESENTATION FULL YEAR RESULTS TO 30 JUNE 2017
 FY2017 RESULTS PRESENTATION FULL RESULTS TO 30 JUNE 2017 This presentation has been prepared by rhipe Limited ACN 112 452 436 (RHP). Each Recipient of this presentation is deemed to have agreed to accept
26 November Company Announcements Office Australian Securities Exchange Limited Exchange Centre 20 Bridge Street Sydney NSW 2000
 26 November 2013 Company Announcements Office Australian Securities Exchange Limited Exchange Centre 20 Bridge Street Sydney NSW 2000 Aristocrat Leisure Limited 2013 Aristocrat Leisure Limited will make
Delivering our strategy and investing for growth
 Delivering our strategy and investing for growth QinetiQ Group plc Interim results for half year ended 30 September 2017 16 November 2017 Agenda 1 Headlines 2 Financial overview 3 Strategic update 4 Q&A
For personal use only
 APPENDIX 4D HALFYEAR REPORT AUSTAL LIMITED A.B.N. 73 009 250 266 FOR THE PERIOD ENDED 31 DECEMBER 2014 1. The reporting period is 1 July 2014 to 31 December 2014. The previous corresponding period is 1
Morgans Conference 13 October 2017
 Morgans Conference 13 October 2017 IMPORTANT NOTICE AND DISCLAIMER Important notice and disclaimer This document is a presentation of general background information about the activities of Mantra Group
FY Alliance Aviation Services Limited Results Presentation. August 2018
 FY 2018 Alliance Aviation Services Limited Results Presentation August 2018 Key Messages Alliance Aviation Services Limited announces a full year result which includes: $ 26.1m A strong financial performance
Engenco Limited Investor Presentation FY17. Presented by: Vince De Santis (Chairman) Kevin Pallas (Managing Director & CEO)
 Kevin Pallas (Managing Director & CEO)") Engenco Limited Investor Presentation Presented by: Vince De Santis (Chairman) Kevin Pallas (Managing Director & CEO) Company $8,269,000 Highlights Total profit for the period Revenue (from continuing
Engenco Limited Investor Presentation Presented by: Vince De Santis (Chairman) Kevin Pallas (Managing Director & CEO) Company $8,269,000 Highlights Total profit for the period Revenue (from continuing
INTERIM RESULTS PRESENTATION Strong start to the year, with a strong order book for the second half of September 2017
 INTERIM RESULTS PRESENTATION Strong start to the year, with a strong order book for the second half of 2017 11 September 2017 AGENDA Introduction and highlights John Hornby Financial review David Main
HALF YEAR RESULTS FEBRUARY 2018
 23 FEBRUARY 2018 HALF YEAR RESULTS FEBRUARY 2018 Macmahon Holdings Pty Ltd 1 OVERVIEW Positive 1H financial performance 1H17 revenue from operations of $270.0 million - up from $168.3 million in the pcp
Half Year Result 2016
 Half Year Result 2016 MATRIX COMPOSITES & ENGINEERING Aaron Begley Chief Executive Officer Peter Tazewell Chief Financial Officer 24 February 2016 Agenda Overview Financial results Performance, strategies
Half Year Results. For the 6 Months to 31 December Managing Director & CEO: Dr Paul Dalgleish. Chief Financial Officer: Mr Andrew Phipps
 Half Year Results For the 6 Months to 31 December 2013 Managing Director & CEO: Dr Paul Dalgleish Chief Financial Officer: Mr Andrew Phipps 18 February 2014 1 Delivering Returns To Shareholders Revenue
STEEL & TUBE HOLDINGS LIMITED. HY18 Interim Results Presentation. For the Six Months to 31 December February 2018
 STEEL & TUBE HOLDINGS LIMITED HY18 Interim Results Presentation For the Six Months to 31 December 2017 23 February 2018 BECOMING A MODERN AND INNOVATIVE COMPANY Providing Strength to New Zealand Steel
For personal use only
 2015 Full Year Results Presentation MATRIX COMPOSITES AND ENGINEERING 19 August 2015 Agenda Overview Financial results Operational review Strategy & outlook 2 Overview Financial Revenue: $144.1 million
FY18 $109.6m up $113.3m on FY17 GROUP UNDERLYING Delivered despite $45.0m fuel (net of FX) headwind
 headwind") FY18 GROUP OUTCOMES FY18 $109.6m up $113.3m on FY17 GROUP UNDERLYING PROFIT BEFORE TAX (PBT) 1 Highest underlying result since FY08 Delivered despite $45.0m fuel (net of FX) headwind X VA DOMESTIC RECORD
FY18 GROUP OUTCOMES FY18 $109.6m up $113.3m on FY17 GROUP UNDERLYING PROFIT BEFORE TAX (PBT) 1 Highest underlying result since FY08 Delivered despite $45.0m fuel (net of FX) headwind X VA DOMESTIC RECORD
CEO Presentation AGM. David Buckingham Managing Director and Chief Executive Officer
 CEO Presentation AGM David Buckingham Managing Director and Chief Executive Officer 15 November 2018 Disclaimer Disclaimer This investor presentation (Presentation) has been prepared by Navitas Limited
Tourism Holdings. ROCE exceeds 14% long-term target. Key drivers remain positive. Deeper customer relationships to drive yield
 Tourism Holdings ROCE exceeds 14% longterm target FY16 results Travel & leisure Tourism Holdings (THL s) FY16 NPAT of NZ$24.4m was in line with company guidance, 21% ahead of FY15 and 1.3% below our forecasts.
For the Financial Year Ended 30 June 2013
 Annual Results For the Financial Year Ended 30 June 2013 Record Profit Record Revenue Record Cash Record Year Managing Director & CEO: Paul Dalgleish Chief Financial Officer: Andrew Walsh 22 August 2013
Cover-More Group. UBS Australasia Conference. November 2015
 Cover-More Group UBS Australasia Conference November 2015 Executive summary: FY15 overview Cover-More delivered another year of double digit earnings growth, with offshore business growing substantially.
Air Lease Corporation. Q Investor Presentation
 Air Lease Corporation Q3 2016 Investor Presentation Forward Looking Statements & Non-GAAP Measures Statements in this presentation that are not historical facts are hereby identified as forward-looking
FY 2017 Results Presentation
 FY 2017 Results Presentation Wednesday 23 August 2017 Presented by: Mr. Alf Moufarrige, Chief Executive Officer 1 Disclaimer Important Information Servcorp Limited (ABN 97 089 222 506) ( Servcorp ) is
Boeing Capital Corporation CURRENT AIRCRAFT FINANCE MARKET OUTLOOK
 Boeing Capital Corporation CURRENT AIRCRAFT FINANCE MARKET OUTLOOK 2018 The 2018 Current Aircraft Finance Market Outlook forecasts another year of stable growth and funding diversification. The aviation
Air Lease Corporation. Q Investor Presentation
 Air Lease Corporation Q4 2016 Investor Presentation Forward Looking Statements & Non-GAAP Measures Statements in this presentation that are not historical facts are hereby identified as forward-looking
Tegel Group Holdings Limited
 Tegel Group Holdings Limited FY17 Interim Results Presentation 15 December 2016 TEGEL GROUP HOLDINGS LIMITED FY17 INTERIM RESULTS 1 Disclaimer This presentation contains summary information about Tegel
Peppers Soul, Surfers Paradise. Mantra Group April 2017
 Peppers Soul, Surfers Paradise Mantra Group April 2017 IMPORTANT NOTICE AND DISCLAIMER Important notice and disclaimer This document is a presentation of general background information about the activities
H Interim Results. 18 May 2017
 H1 2017 Interim Results 18 May 2017 Agenda Highlights - Peter Fankhauser CEO Financial results Strategic progress Current trading and outlook Page 2 Strategic actions leading to improved performance Growing
For personal use only
 SUMMARY OF 1H19 GROUP OUTCOMES Strong first half performance UNDERLYING PROFIT BEFORE TAX (UPBT) 1H19 $112.3m up $30.4m on 1H18 Highest 1H underlying result in 11 years Delivered despite $88.2m fuel and
For personal use only
 Blue Sky Alternative Investments 1H FY18 Results Presentation Private Equity Private Real Estate Real Assets Hedge Funds Disclaimer This presentation has been prepared by Blue Sky Alternative Investments
FY17 Results. Robust, innovative technology. DONALD McGURK Managing Director & CEO
 Robust, innovative technology FY17 Results DONALD McGURK Managing Director & CEO MICHAEL BARTON Chief Financial Officer 6 September 2017 SARAH EMMS Manager, Investor Relations Important Notice and Disclaimer
Full Year results and outlook
 PRESENTATION TO INVESTORS & ANALYSTS Full Year results and outlook David Banfield, Group CEO 29 August 2018 for 12 months 1 July 2017 30 June 2018 Strong international performance drives double digit earnings
Financial results & business update. Quarter and year ended 31 December February 2017
 Financial results & business update Quarter and year ended 31 December 2016 14 February 2017 Disclaimer 3 Any remarks that we may make about future expectations, plans and prospects for the company constitute
ASL MARINE Corporate Presentation FY2011
 ASL MARINE Corporate Presentation FY2011 Presentation Outline Group Overview FY2011 Financial Review (12 months ended 30 June 2011) Operational Review - Shipbuilding - Shiprepair and Conversion - Shipchartering
Business outlook 13 November 2018
 Business outlook 13 November 2018 Disclaimer Disclaimer This investor presentation (Presentation) has been prepared by Navitas Limited ABN 69 109 613 309 (Navitas) for information purposes only. In response
KION Q3 UPDATE CALL Gordon Riske, CEO Thomas Toepfer, CFO Wiesbaden, 14 November 2013
 KION Q3 UPDATE CALL 2013 Gordon Riske, CEO Thomas Toepfer, CFO Wiesbaden, 14 November 2013 AGENDA 1 Highlights 2013 Gordon Riske 2 Financial Update Thomas Toepfer 3 Outlook Gordon Riske 14 November 2013
Blue Sky Alternative Investments Limited 2017 ANNUAL GENERAL MEETING
 Blue Sky Alternative Investments Limited 2017 ANNUAL GENERAL MEETING Disclaimer This presentation has been prepared by Blue Sky Alternative Investments Limited ( Blue Sky ). The information in this presentation
Important Notice. The sum totals throughout this presentation may not add exactly due to rounding differences.
 Important Notice This presentation contains general information about Reliance Worldwide Corporation Limited s activities at the date of presentation (26 February 2018). It is information given in summary
December 2018 Half Year Presentation
 December 2018 Half Year Presentation 19 February 2019 Access this presentation at: http://webcasting.brrmedia.com/broadcast/5c 5783f9a5daa339d94c6db8 or http://www.sandfire.com.au Slide : 1 Important Information
2017 Full Year Results Presentation
 2017 Full Year Results Presentation Australia's leading supplier of aluminium products and solutions 5 plants; 8 extrusion presses 18 distribution centres Australia-wide Annual extrusion capacity 70k tonnes
Air Lease Corporation. Q Investor Presentation
 Air Lease Corporation Q2 2017 Investor Presentation Forward Looking Statements & Non-GAAP Measures Statements in this presentation that are not historical facts are hereby identified as forward-looking
Investor & Analyst Presentation
 Investor & Analyst Presentation FY18 H1 Results For the six monthsended 31 December 2017 15 th February 2018 Rebekah O Flaherty-CEO I Jonathan Kenny-CFO Agenda 1 2 3 4 5 6 Overview Strategic Priorities
Half Year results and outlook
 PRESENTATION TO INVESTORS & ANALYSTS Half Year results and outlook David Banfield - Group CEO Jannine Mountford - Group CFO 1 March 2018 For 6 months 1 July 31 December 2017 New Zealand tapware underperforms,
SIMS METAL MANAGEMENT ANNOUNCES FISCAL 2018 HALF YEAR RESULTS
 ASX & MEDIA RELEASE (ASX: SGM, USOTC: SMSMY) 16 February 2018 Results at a glance SIMS METAL MANAGEMENT ANNOUNCES FISCAL 2018 HALF YEAR RESULTS STATUTORY (A$m) 1H FY18 1H FY17 Change (%) Sales revenue
Progress in a backward market
 China Aviation Oil (Singapore) Progress in a backward market H117 results update Aviation services China Aviation Oil (Singapore) Corporation (CAO) has made good progress in the first half of the year,
Straits Asia Resources Limited
 Straits Asia Resources Limited AGM CEO Presentation to Shareholders Martin Purvis 30 April 2010 Table of Contents 1 Company Snapshot 2 2009 Review 3 Market Outlook 4 Consolidating a Strong Foundation 5
Sealegs Corporation. Sea change. H1 update. Changing business mix. Valuation: New focus improves valuation. H1 results
 Sealegs Corporation Sea change H1 results Industrial engineering Sealegs (SLG) reported better than expected H1 results, driven by tighter cost management and increased sales from the higher-margin amphibious
For personal use only
 Mantra Group Limited (ASX Code: MTR) ABN 69 137 639 395 2014 Annual General Meeting 26 November 2014 Chairman s Address by Peter Bush Good Morning, I m Peter Bush, Chairman of the Mantra Group and I welcome
YEAR END RESULTS 31 MARCH Russell Down, Chief Executive Chris Morgan, Group Finance Director
 YEAR END RESULTS 31 MARCH 2018 Russell Down, Chief Executive Chris Morgan, Group Finance Director Customer service strategy improving performance Revenue (excluding disposals) 371.6m 6.4% FY17: 349.1m
INVESTOR PRESENTATION
 INVESTOR PRESENTATION Results for the 6 months ended 31 December 2017 Kevin Slaven CEO Geoff Stephenson CFO www.pmplimited.com.au ABN 39 050 148 644 27 February 2018 TABLE OF CONTENTS Financial Highlights
For personal use only
 Click to edit Master text styles IDP Education FY16 Results Presentation Twelve months to 30 June 2016 11 February 2016 Important notice and disclaimer Click Disclaimer to edit Master text styles The material
FY2013 Financial Results
 FY2013 Financial Results February 2014 Disclaimer The presentation is prepared by AVIC International Maritime Holdings Limited (the Company ). The information contained in this presentation is subject
Servcorp Limited. FY 2017 Interim Results Presentation 17/03/2017. Presented by: Mr. Alf Moufarrige, Chief Executive Officer
 Servcorp Limited FY 2017 Interim Results Presentation 17/03/2017 Presented by: Mr. Alf Moufarrige, Chief Executive Officer 1 Disclaimer Important Information Servcorp Limited (ABN 97 089 222 506) ( Servcorp
Doug Rowe CMA Corporation Limited
 Doug Rowe CMA Corporation Limited An emerging force in responsible recycling ASX Small to Mid Caps Conference New York, 26 February 2009 Doug Rowe MANAGING DIRECTOR Disclaimer This presentation for CMA
Corporate Presentation. December 2016
 Corporate Presentation December 2016 1 Disclaimer This presentation may contain forward looking statements which are subject to risks and uncertainties that could cause actual results, performance or achievements
OURNEY ONTINUES. FY19 Interim Results Presentation
 UR OURNEY ONTINUES. FY19 Interim Results Presentation DISCLAIMER This presentation contains forward-looking statements and projections. These reflect thl s current expectations, based on what it thinks
Global Helicopter Forecast
 Global Helicopter Forecast C&P untapped demand is rising Key world economies are still underequipped TOP 10 Countries in 2016 ( H/C fleet in service) U.S.A. Russia Canada Brazil Australia United Kingdom
Annual F inancial Financial Results 2008
 Annual Financial Results 2008 16 February 2009 Disclaimer Our presentation contains some forward looking statements with respect to the financial Our presentation contains some forward looking statements
Gear4music Holdings. Market share gains and margin boost. Strong pre-christmas trading. FY18 forecast maintained
 Gear4music Holdings Market share gains and margin boost January trading statement Retail Gear4music s (G4M) Christmas trading statement shows it continuing to take share in its niche markets to generate
July 26, 2017 LafargeHolcim Ltd 2015
 Second Quarter 2017 Results Beat Hess, Chairman and Interim CEO Roland Köhler, Interim COO and Regional Head of Europe, Australia/NZ & Trading Ron Wirahadiraksa, CFO July 26, 2017 LafargeHolcim Ltd 2015
Pareto Securities Oil and offshore Conference Oslo, September 2014 Presented by Atle Jacobsen (CEO)
") Pareto Securities Oil and offshore Conference Oslo, 10-11 September 2014 Presented by Atle Jacobsen (CEO) Disclaimer This presentation includes and is based, inter alia, on forward-looking information
Pareto Securities Oil and offshore Conference Oslo, 10-11 September 2014 Presented by Atle Jacobsen (CEO) Disclaimer This presentation includes and is based, inter alia, on forward-looking information
Half-Year 2016 Results Presentation
 Half-Year 2016 Results Presentation ASX Limited Elmer Funke Kupper Peter Hiom 11 February 2016 Disclaimer The material contained in this document is a presentation of general information about the ASX
FY14. Vita Group (VTG) RESULTS PRESENTATION
 RESULTS PRESENTATION") FY14 Vita Group (VTG) RESULTS PRESENTATION GROUP HIGHLIGHTS Strong sustained performance in competitive markets Execution against strategic objectives Continued earnings growth from optimisation program
FY14 Vita Group (VTG) RESULTS PRESENTATION GROUP HIGHLIGHTS Strong sustained performance in competitive markets Execution against strategic objectives Continued earnings growth from optimisation program
Interim FY 2015 results 6 months ended 31 December February 2015
 Interim FY 2015 results 31 December 2014 18 February 2015 Highlights Solid trading result for 1H FY2015; change in accounting policy for acquisition of healthcare practices First half result highlights
Investor Presentation 2017 Fourth Quarter and Full Year
 Investor Presentation 2017 Fourth Quarter and Full Year Forward Looking Statements & Non-GAAP Measures Statements in this presentation that are not historical facts are hereby identified as forward-looking
Full Year 2017 Results Presentation Bravura Solutions Limited
 Full Year 2017 Results Presentation Bravura Solutions Limited 23 rd August 2017 Important notice and disclaimer The information contained in this document (including this notice) or discussed at this presentation
INVESTOR PRESENTATION SG FLEET GROUP LIMITED - FY2016 RESULTS
 INVESTOR PRESENTATION SG FLEET GROUP LIMITED - FY2016 RESULTS 16 August 2016 Important Notice and Disclaimer IMPORTANT INFORMATION The information in this presentation is general in nature and does not
2018 Preliminary Results
 2018 Preliminary Results 21 February 2019 All statements other than statements of historical fact included in this document, including, without limitation, those regarding the financial condition, results,
Financial results & business update. Quarter ended 30 September October 2016
 Financial results & business update Quarter ended 30 September 2016 19 October 2016 Disclaimer 3 Any remarks that we may make about future expectations, plans and prospects for the company constitute forward-looking
FY2017 Result Presentation. 21 August 2017
 FY2017 Result Presentation 21 August 2017 The Hansen journey growing and diversifying by geography, industry, propriety products and customer Early 1990 s Today Revenue by geography Industry verticals
Dynagas LNG Partners ( DLNG ) 2nd Quarter and Six Months ended June 30, July 2016
 2nd Quarter and Six Months ended June 30, July 2016") Dynagas LNG Partners ( DLNG ) 2nd Quarter and Six Months ended June 30, 2016 29 July 2016 Forward Looking Statements This presentation contains certain statements that may be deemed to be forward-looking
Dynagas LNG Partners ( DLNG ) 2nd Quarter and Six Months ended June 30, 2016 29 July 2016 Forward Looking Statements This presentation contains certain statements that may be deemed to be forward-looking
COCHLEAR FINANCIAL RESULTS FOR THE SIX MONTHS ENDED DECEMBER 2018
 ASX Announcement 19 February 2019 COCHLEAR FINANCIAL RESULTS FOR THE SIX MONTHS ENDED DECEMBER 2018 The business delivered an increase in in sales revenue of 11% and net profit of 16% for the half Reported
Exmar CPS Conference January 2019 London
 Exmar CPS Conference January 2019 London 2 DISCLAIMER About this presentation This presentation (the Presentation ) has been produced by EXMAR NV ( EXMAR or the Company ). By attending a meeting where
6 MARCH 2017 FULL YEAR RESULTS
 6 MARCH 2017 FULL YEAR RESULTS FOR THE YEAR ENDED 31 DECEMBER 2016 01 THE COLLAGEN CASING COMPANY Global Leader One of the world s leading providers of collagen casings for the processed meats sector Provides
For personal use only
 FY16 RESULTS BRIEFING H U G H M A R K S C H I E F E X E C U T I V E O F F I C E R G R E G B A R N E S C H I E F F I N A N C I A L O F F I C E R M I C H A E L S T E P H E N S O N C H I E F S A L E S O F
BROKER PRESENTATION JUNE 2017
 PACIFIC ENERGY LIMITED ASX : PEA BROKER PRESENTATION JUNE 2017 Important Notice and Disclaimer This presentation has been prepared by (PEA) for information purposes only. This presentation is not a product
Kepler Cheuvreux European Infrastructure Tour September, Stefan J. Rüter Head of Finance & IR
 September, 2016 Stefan J. Rüter Head of Finance & IR 2 Disclaimer This document has been prepared by Fraport solely for use in this presentation. The information contained in this document has not been
Tune Ins Holdings Berhad. Financial Results March 2015 Analyst Presentation May 2015
 Tune Ins Holdings Berhad Financial Results March 2015 Analyst Presentation May 2015 1 Agenda Page Executive Summary 3-7 Key highlights 1Q2015 financial highlights Update on Strategies Snapshot of Indonesia
For personal use only
 Financial Results Half year ended 31 December 2016 15 February 2017 Agenda Results Overview Galdino Claro, Group CEO Financial Results Fred Knechtel, Group CFO Strategic Progress & Outlook Galdino Claro,
AGT FY2015: Distributable Income Rises; DPU Yield Now 10.4%
 Singapore Business Trust Accordia Golf Trust (AGT SP) June 7, 216 AGT FY215: Distributable Income Rises; DPU Yield Now 1.4% Accordia Golf Trust recorded 4Q15 operating income of JPY 1,446mn, 6.5% higher
Financial results & business update. Quarter and year ended 31 December February 2016
 Financial results & business update Quarter and year ended 31 December 2015 11 February 2016 Disclaimer 3 Any remarks that we may make about future expectations, plans and prospects for the company constitute
Australia: Economic and Financial Outlook
 Australia: Economic and Financial Outlook Greg Noonan Head of Business Markets Queensland & Agribusiness 5 June 2015 Australian economy and financial markets continue to be impacted by a large number of
2018 Interim Results. 1 August BAE Systems 2018
 2018 Interim Results 1 August 2018 All statements other than statements of historical fact included in this document, including, without limitation, those regarding the financial condition, results, operations
Financial Position (Consolidated)
") Disclaimer This presentation is for informational purposes only, contains preliminary financial and other information about Korean Air Lines Co., Ltd. and is subject to updating, revision, amendment and
Disclaimer This presentation is for informational purposes only, contains preliminary financial and other information about Korean Air Lines Co., Ltd. and is subject to updating, revision, amendment and
Full Year 2015 Results Presentation. Monday, 24 August 2015
 Full Year 2015 Results Presentation Monday, 24 August 2015 FY15 overview What we said we would do What we delivered Revenue $2.3b Revenue $2.3b Underlying EBIT $47m (ex DTZ) EBIT $47.5m Net debt $30-50m
Financial Year 2015 Results Presentation. August 7, 2015
 Financial Year 2015 Results Presentation August 7, 2015 Key highlights FY15 vs. FY14 1 Underlying Loss Before Tax 2 ($49m) $163m Statutory Loss After Tax ($94m) $260m Return on Invested Capital 2 6.1%
Agenda. Company Overview Annual Financial Results. Business Review and Prospects
 Disclaimer This presentation and the accompanying slides (the Presentation ) which have been prepared by IGG INC (the Company ) do not constitute any offer or invitation to purchase or subscribe for any
rhipe Limited (ASX code RHP) FY16 Full Year Results Presentation & FY 2017 Outlook
 FY16 Full Year Results Presentation & FY 2017 Outlook") rhipe Limited (ASX code RHP) FY16 Full Year Results Presentation & FY 2017 Outlook Dominic O Hanlon, CEO & Managing Director Mike Hill, Executive Chairman 1 This presentation has been prepared by rhipe
rhipe Limited (ASX code RHP) FY16 Full Year Results Presentation & FY 2017 Outlook Dominic O Hanlon, CEO & Managing Director Mike Hill, Executive Chairman 1 This presentation has been prepared by rhipe
EXMAR GENERAL ASSEMBLY 15 th May 2018
 EXMAR GENERAL ASSEMBLY 15 th May 2018 2 DISCLAIMER About this presentation This presentation (the Presentation ) has been produced by EXMAR NV ( EXMAR or the Company ). By attending a meeting where this
Investor Presentation. ASX: SGM USOTC: SMSMY
 Investor Presentation ASX: SGM USOTC: SMSMY www.simsmm.com Business Highlights Company Global leader in metals and electronics recycling with $4.7 billion in annual sales revenue Operations in 20 countries
Interim Results Presentation. For the six months ended 31 December 2018
 Interim Results Presentation For the six months ended 31 December 2018 1 STEEL & TUBE IS One of New Zealand s leading providers of steel solutions, and a proud New Zealand company, with over 65 years of
2012 Annual General Meeting Wednesday, 14 November 2012
 Wednesday, 14 November 2012 For personal use only L9 123 Queen Street, Melbourne Chairman s Address Dale Elphinstone Streamlined Operational Structure 3 Revenue and Earnings Operating Revenue ($m) EBITDA
Forward-looking Statements
 Forward-looking Statements This presentation has been produced by BW LPG Limited ( BW LPG ) exclusively for information purposes. This presentation may not be reproduced or redistributed, in whole or in
AVIC International Investments Limited. 4Q/FP2011 Corporate Presentation. 22 February 2012
 AVIC International Investments Limited 4Q/FP2011 Corporate Presentation 22 February 2012 Disclaimer The presentation is prepared by AVIC International Investments Limited(the Company ). The information
The emerging Asian middle class -What does it mean for Australian & International Equities
 Clime Asset Management The emerging Asian middle class -What does it mean for Australian & International Equities Presented by John Abernethy 1 Disclaimer The information contained in this document is