Company presentation. Third quarter October Norway s fastest growing region is our home market
|
|
|
- Ruby Clementine Baker
- 5 years ago
- Views:
Transcription
1 Company presentation Third quarter October Norway s fastest growing region is our home market

2 Summary


3 Good profitability and continued strong lending growth Summary third quarter 2018 High activity levels in all business areas Strong income and lending growth Increased focus in real estate brokerage and accounting services Good growth in numbers of retail and corporate customers Good cost control and operating cost development in line with ambitions Still low loan losses Marginally lower solidity due to strong lending growth Signed agreement of merger between SpareBank 1 Skadeforsikring and DNB Forsikring awaiting MoF approval 3

4 The performance in third quarter is in line with ambitions Financial targets 2018 and performance as of 3Q-2018 Profitability Return on equity at least 10 % 11.1 % Dividends 50 % pay-out ratio after tax* 50 % Solidity CET 1 at 16 % 15.9 % Costs 5 % cost reduction** -1.3 % 4 * Profit after tax before minority interests ** Nominal costs pro-forma parent bank compared with 2017 (accumulated)
5 The bank and the market area
 until 1 April 2017.")


6 SpareBank 1 Østlandet at a glance Norway's fourth largest savings bank with a broad and diversified customer base History from 1845 known as Sparebanken Hedmark ("SBHE") until 1 April Norway's fourth largest savings bank * with total adjusted assets (incl. covered bonds) of NOK 161 billion. Operations in Hedmark, Oppland, Oslo and Akershus a market with more than 1.7 million inhabitants. Head office in Hamar, 38 branches and 1,146 FTEs. Approximately 332,000 customers with a retail lending share of 74 %. Diversified product offerings traditional banking, leasing, accounting and real estate brokerage services. Part of the SpareBank 1 Alliance and owns 12.4 % of SpareBank 1 Gruppen AS. 6 Sources: Annual/interim reports, SpareBank 1 Gruppen Comments (*): Total assets on own balance sheet, plus mortgages transferred to SB1 Boligkreditt and SB1 Næringskreditt
 Increasing productivity and low unemployment 4 Growth in production, q/q and forecast for 6 months (per cent) 4 Registered unemployment rate, NAV (per cent) 5.")

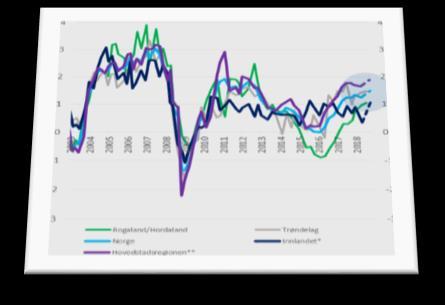
7 High economic activity in our market area (1) Increasing productivity and low unemployment 4 Growth in production, q/q and forecast for 6 months (per cent) 4 Registered unemployment rate, NAV (per cent) Trøndelag Inland Region* Rogaland/Hordaland Norway Capital Region** -3 Rogaland Hordaland Trøndelag Norway Inland Region* Oslo/Akershus Source 1: Norges Bank Regional Network 03/18 (*) Includes Hedmark and Oppland (* *) Includes Oslo, Akershus, Østfold and Buskerud Source 2: Statistics Norway, NAV, Thompson Reuters Datastream
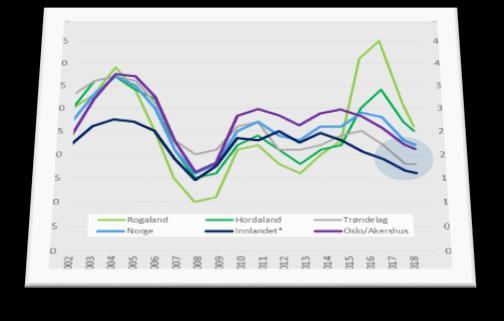
8 High economic activity in our market area (2) Investment leveling out on higher profitability 2.50 Expected change in investments next 12 months (per cent) 2.00 Change in profitability past 3 months compared to last year (per cent) (0.50) (0.50) (1.00) Inland Region* Capital Region** Rogaland/Hordaland Trøndelag Norway (1.00) Inland Region* Capital Region** Rogaland/Hordaland Trøndelag Norway 8 Source 1: Norges Bank Regional Network 03/18 (*) Includes Hedmark and Oppland (* *) Includes Oslo, Akershus, Østfold and Buskerud Source 2: Statistics Norway, NAV, Thompson Reuters Datastream
 House prices, indexed** 30.")
 20.0% 12-month growth: +2.7 % 130.00 Oslo 15.0% +4.1 % Inland Region* +2.2 % 10.0% 120.00 150.00 140.00 130.00 120.00 5.0% 0.0% 5.0% 0.0% 110.00 110.00-5.0% -5.0% 100.00 100.00-10.0% -10.")
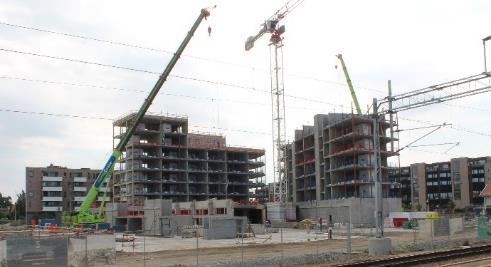
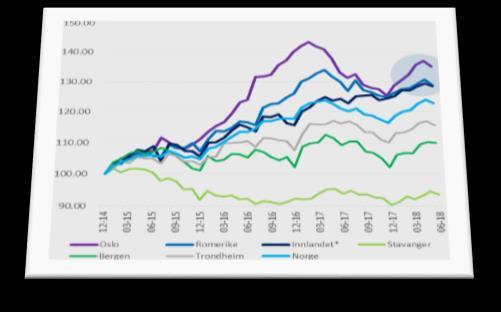
9 Housing prices leveling out with high construction activity House price developments for relevant areas compared with Norway Housing prices by area, 12-month growth (per cent) House prices, indexed** 30.0% 25.0% 20.0% 15.0% 10.0% SEPTEMBER % Nominal -1.1 %/seasonally adjusted +0.1 % Record high 25.0% sales activity but also high supply Shortest time to sale in Hamar/Stange (20 days) 20.0% 12-month growth: +2.7 % Oslo 15.0% +4.1 % Inland Region* +2.2 % 10.0% % 0.0% 5.0% 0.0% % -5.0% % -10.0% % -15.0% Stavanger Bergen Trondheim Norway Oslo Romerike Inland Region* Stavanger Bergen Trondheim Norway Oslo Romerike Inland Region* 9 Source: Eiendom Norge Housing Prices September 2018 (*) Includes: Oppland and Hedmark (**)Index 31 December 2014 = 100

 Oppland Hedmark 1,250,000 1,000,000 Oslo 750,000 500,000 250,000 Akershus 0 10 Source: Statistics Norway:")
10 A market area with long term growth potential Considerable population growth in the Greater Capital Area Population projection Population projection, municipalities ,000,000 1,750,000 1,500, % (0.8% yearly) Oppland Hedmark 1,250,000 1,000,000 Oslo 750, , ,000 Akershus 0 10 Source: Statistics Norway: Population Forecast, Base scenario
11 The growth is expected in financially interesting demographic groups Population forecast per county and demographics , , , ,000 Oslo Akershus Hedmark Oppland 759, , , ,000 Expected population growth 2030: Norway: 8 % Oslo: 13 % Akershus: 13 % Hedmark: 6 % Oppland: 5 % Total population in the market area: 2018: 1.7 million 2030: 1.9 million 14 % 21 % 7 % 13 % % 12 % 12 % 11 % 8 % 17 % 19 % % 11 % 12 % 9 % 12 % Age Expected demographic growth 2030: 0-17 years: 2 % years: 5 % years: 3 % years: 17 % years: 1 % years: 9 % years: 25 % 67+ years: 35 % 11 Source: Statistics Norway: Population Forecast, Base scenario (counties)
12 # in thousands Solid customer growth after the merger Numbers of customers in parent bank Personal customers Total number of customers Corporate customers - Right axis In connection with the technical merger in October 2017, standardization of the product and customer definitions were made. After the technical merger, the customer growth has been solid A total of 16,400 customers, equivalent to 5.2 % 800 corporate customers, equivalent to 3.3 % 15,600 retail customers, equivalent to 5.3 % After the Bank 1 OA acquisition in June 2016, the numbers of customers has increased from (estimated) 290,000 to 332,000, equivalent to 14.5 % 12 Source: SpareBank 1 Østlandet «Customers» are defined as customers with account activity
13 1Q Q Q Q Q Q Q Q Q Q Q Q Q Q Q Q Q Q 2018 Value creation above national average Industry index (quarterly) based on gross product per county Oslo Hedmark Akershus Oppland Norway 40 % of Norway s mainland GDP is created in our market area Growth in value creation per county: Norway +8.2 % Oslo: % Hedmark: +9.9 % Akershus: +9.0 % Oppland: +8.6 % Source: Statistics Norway. National accounts based on gross product in 2016 prices. Quarterly numbers estimated. 1Q 2014 = 100

14 Financial accounts 3Q-2018
15 Financial results for the third quarter of 2018 (Last year's figures in brackets) Increased profitability Profit after tax in 3Q 18 isolated at NOK 362 million (NOK 377 million). Profit after tax as of 3Q 18 accumulated NOK 1,092 million (NOK 926 million). Higher return on equity Solid capitalization ROE in 3Q 18 at 10.8 % (12.0 %). ROE as of 3Q 18 accumulated 11.1 % (10.1 %) CET 1 ratio 15.9 % (16.9 %). Leverage ratio at 7.2 % (7.3 %). High lending growth Lending growth of 8.9 % (incl. the covered bond companies) last 12 months (7.9 %). Lending growth of 2.0 % from 2Q 18 Strengthened deposit growth Deposit growth of 7.6 % in the last 12 months (5.1 %). Low impairments Impairments on loans and guarantees of NOK 12 million in 3Q 18 isolated Impairments on loans and guarantees of NOK 24 million as of 3Q 18 accumulated 15 *Annualised loss rate
16 Income statement 3Q 2018 Group Net interest income 1,530 1,454 1,956 Net commission income ,095 Other income Total operating expenses 1,375 1,348 1,898 Result bank operation before losses 1,128 1,056 1,321 Impairment losses on loans and guarantees Result bank operation after losses 1,104 1,063 1,341 Dividends Net profit from ownership interest Net income from financial assets/liabilities Profit/loss before tax 1,388 1,197 1,618 Tax charge Profit/loss after tax 1, ,263 Return on equity capital after tax 11.1 % 10.1 % 10.2 % Total operating costs in relation to total income 49.3 % 53.1 % 54.3 % Losses on loans as a percentage of gross loans 0.03 % % % 16
17 Special items 3Q 2018 The insurance merger Description and effects Merger SpareBank 1 Forsikring and DNB Forsikring* The SpareBank 1 Group (SB1G) and DNB agreed 24 September 2018 on the merger of SpareBank 1 Forsikring and DNB Forsikring Ownership ratio will be 65/35 between SB1G and DNB DNB with call option to increase ownership to 40 % The merged business is valued at NOK billion. The increased ownership of 15 % for DNB equals NOK 2.96 billion. The merger increases SB1G s equity on group level with NOK 6.9 billion SpareBank 1 Østlandet s (SB1Ø) share is approximately NOK 528 million The CET 1 is more or less unchanged The transaction gives SB1G a tax-free gain of approx. NOK 2.65 billion SB1Ø s share of a possible dividend is NOK 329 million The estimated effect on SB1Ø s CET 1 is 0.4 percentage points The dividend is conditioned by The capital situation and decisions from SB1G take place in 2Q 2019 at the earliest Proposed changed dividend regulation from the NFSA, to prevent dividend based on interim reports. If concluded dividend from SB1G will take place in 2020 at the earliest and from the owner banks in *Complete stock exchange announcement ->
18 Key financials quarterly (1) Pre-tax profit (NOK million) Net interes income and and commision fees from covered bond companies (NOK million) Q-17 4Q-17 1Q-18 2Q-18 3Q-18 Impairments on loans and guarantees (NOK million) Q-17 4Q-17 1Q-18 2Q-18 3Q-18 Total operating costs (NOK million) Q-17 4Q-17 1Q-18 2Q-18 3Q-18 3Q-17 4Q-17 1Q-18 2Q-18 3Q-18 18
19 Key financials quarterly (2) Return on equity 12.0 % 10.4 % 9.9 % 12.9 % 10.8 % CET 1 ratio 16.9 % 16.8 % 16.2 % 16.1 % 15.9 % 3Q-17 4Q-17 1Q-18 2Q-18 3Q-18 3Q-17 4Q-17 1Q-18 2Q-18 3Q-18 Lending growth (including loans transferred to covered bond companies) last 12 months 8.8 % 8.9 % 8.9 % 8.4 % 7.9 % Deposit growth last 12 months 5.1 % 5.3 % 4.6 % 6.0 % 7.6 % 3Q-17 4Q-17 1Q-18 2Q-18 3Q-18 3Q-17 4Q-17 1Q-18 2Q-18 3Q-18 19
.")
20 Profit contributions from subsidiaries 3Q 2018 (3Q 2017) SpareBank 1 Finans Østlandet - Profit before tax NOK million (NOK million). - Strong growth, cost control and increasing profitability. - Increased focus on innovation and business development. EiendomsMegler 1 Hedmark - Profit before tax NOK 16.6 million (NOK 20.1 million). - Solid market position, expanded project and CRE brokerage increase market share. - High activity level, but increased cost from termination of IT contract and new recruitment. EiendomsMegler 1 Oslo Akershus - Profit before tax NOK 5.3 million (NOK -1.0 million). - Restructuring completed, higher activity and cross-selling. - Accounting effects from termination of an IT contract and new recruitment. SpareBank 1 Østlandet VIT AS (SpareBank 1 Regnskapshuset AS og TheVIT AS) - Profit before tax NOK -3.7 million (NOK 1.2 million*). - The merged company is well positioned with value adding offerings. - Strengthened presence in Greater Oslo and continued digitalization of key processes. 20 * Last year s figures is SpareBank 1 Regnskapshuset Østlandet AS
 - Ownership 21.1 % SpareBank 1 Næringskreditt - Profit before tax NOK 46.7 million (NOK 66.")
21 Contribution from joint ventures 3Q 2018 (3Q 2017) SpareBank 1 Gruppen - Profit before tax NOK 1,244 million (NOK 1,437 million) - Ownership 12.4 % SpareBank 1 Boligkreditt AS - Profit before tax NOK 52.3 million (NOK million) - Ownership 21.1 % SpareBank 1 Næringskreditt - Profit before tax NOK 46.7 million (NOK 66.7 million) - Ownership 12.4 % SpareBank 1 Kredittkort - Profit before tax NOK million (NOK 77.7 million) - Ownership 20.5 % 21
22 Net interest income Net interest income incl. commissions from covered bond companies % % 1.86% 1.81% 1.78% 1.77% 1.90% 1.80% Higher NII last quarter due to strong lending growth % 1.60% Flat NII in per cent of average assets Q-17 4Q-17 1Q-18 2Q-18 3Q-18 Net interest income and commission fees from covered bond companies (MNOK) Commission fees from covered bond companies Net interest income Net interest income in % of average of average total assets (accumultated) 1.50% 1.40% 1.30% 1.20% 1.10% 1.00% Commission fees from covered bond companies reduced on increased funding costs Announced interest rate increase with up to 0.25 % on lending and deposits 21 September. The increase is effective from 11 October for CM and 8 November for RM. 22
23 Continued strong lending growth Lending volume (Group, NOK billion) Q-17 4Q-17 1Q-18 2Q-18 3Q-18 Loans transferred to covered bond companies Gross loans to customers (own balance sheet) Total lending in the Group, including loans transferred to covered bond companies, increased last quarter with NOK 2.2 bn This is equivalent to a 2.0 % growth last quarter Group lending growth in the last 12 months was 8.9 % (7.9 %) Lending growth retail 8.7 % Lending growth corporates 9.3 % Growth in loans including loans transferred to covered bond companies in the last 12 months 23
24 Lending margins Retail and corporate markets (parent bank) 2.76% 2.68% 2.49% 2.53% 2.53% A continued stabilizing of lending margins during 3Q 18, but shows a marginal increase in RM. 1.92% 1.93% 1.76% 1.59% 1.62% 3Q-17 4Q-17 1Q-18 2Q-18 3Q-18 Marginal increase in corporate lending margins. This is a result of targeted repricing of individual products and customer groups, and focused pricing of new business. Interest rate increase with effect from 11 October in CM and 8 November in RM. 24 Lending margin RM, incl. covered bond companies Lending margin CM, incl. covered bond companies
25 Loan book dominated by retail and SME lending Lending to customers per sector (% and NOK millions) Primary industries 4,425 Wholesale and retail trade 1,290 Commercial services 4,497 Other 5,524 Corporate lending 26% Retail lending 74% Building and construction 4,733 Transferred to Næringskreditt 1,479 Real estate 13,874 Transferred to Boligkreditt 38,415 Private customers 63,917 25
26 The concentration risk is low Retail and corporate loans by size (% share)* Retail market Corporate market 39.0% 26.0% 34.0% 22.3% 18.8% 9.6% 13.2% 12.0% 10.6% 10.4% 4.2% <1 M M M 5-10 M >10 M <5 M 5-10 M M M M > 200 M 26 * Including loans transferred to the covered bond companies
27 Building and constructions Primary industries Commercial services Other industry Hotel and restaurants Real estate Power and water supply Wholesale and retail trade Transport and communication Paper and pulp industries Public sector Growth in NOK million Well diversified growth in corporate loan portfolio last quarter From 2Q 2018 to 3Q
28 Building and constructions Paper and pulp industries Commercial services Public sector Other industry Transport and communication Hotel and restaurants Power and water supply Wholesale and retail trade Other Primary industries Real estate Growth in NOK million Well diversified corporate lending growth last year From 3Q 2017to 3Q ,908 1,654 28
29 Utilisation of flexibility quota in mortgages Daily follow-up ensures optimal utilisation of the permitted quota Utilisation of flexibility quota in 3Q-2018: City of Oslo 7.1 % (8 % quota) Other areas 4.9 % (10 % quota) The mortgage regulation* constrains the lending: Debt servicing capacity Stress: 5 % interest rate increase Maximum loan to value (LTV) 85 % 75 % legal limit in the covered pool Gearing Total debt must not exceed five times gross annual income Installment payment Exceptions are permitted within 10 % (8 % for Oslo) of the total granted volume each quarter The so called Flexibility quota 29 * "Regulation on the requirements for new lending with collateral in housing"
30 High quality credit process leads to low and stable LTV Percentage of granted mortgages and average LTV per county Percentage of granted volume Average LTV at the time of grant 66% 62% 60% 59% 59% 69% 66% 61% 61% 61% 70% 66% 61% 61% 61% 78% 73% 66% 69% 69% 67% 70% 67% 63% 64% 33% 31% 29% 28% 27% 29% 30% 32% 32% 30% 27% 30% 30% 30% 33% 3% 4% 4% 4% 4% 7% 6% 6% 6% 7% Q18 2Q18 3Q Q18 2Q18 3Q Q18 2Q18 3Q Q18 2Q18 3Q Q18 2Q18 3Q18 Oslo Akershus Hedmark Oppland Others 30
31 Low LTV in the residential mortgage lending Exposure per LTV bucket in the residential mortgage portfolio 100% 95.0 % 80% 60% 40% 20% 0% 4.0 % 0.5 % 0.5 % Below 70% LTV 70-85% LTV % LTV Over 100% LTV 31
32 Satisfactory deposit coverage and higher deposit growth Deposit volume, Group (NOK billion) Deposit growth last 12 months 7.6 % (5.1 %) Deposit growth - retail 7.5 % Deposit growth - corporates 7.9 % Deposit coverage ratio 71.5 % Deposit coverage ratio - including mortgages transferred to the covered bond companies 50.9 % 3Q-17 4Q-17 1Q-18 2Q-18 3Q *) Includes 100% ownership of Bank 1 Oslo Akershus
33 Deposit margins Retail market and corporate market (parent bank)* 0.30% 0.26% Marginally reduced deposit margins in last quarter 0.23% 0.22% 0.20% The margins are stabilizing after two quarters with strong growth. 0.09% 0.11% 0.08% Interest rate increase with effect from 11 October in CM and 8 November in RM % -0.04% 3Q-17 4Q-17 1Q-18 2Q-18 3Q-18 Deposit margin RM Deposit margin CM 33 * Included transferred to covered bond companies
34 Increased income in subsidiaries Net commissions and other income (NOK millions) Other income Commission income from credit cards Income from accounting services Income from real estate brokerage Mutual fund and insurance commisions Payment transmission Total Commissions and other operating income was reduced with 5.1 % from last quarter. The changes was based on seasonally lower activity in July for real estate brokerage. Compared to last year the commission income increased with 3.7 % Q-17 4Q-17 1Q-18 2Q-18 3Q
35 Group operating costs Operating costs per quarter (NOK millions) Other operating expenses Depreciation Admin. and other operating costs Social security Pensions Payrolls The operating costs have increased with 5.6 % compared to last year. Personnel expenses have increased due to higher activity level and staffing in the subsidiaries. Write-downs of an IT project in the EM1 alliance amounted to NOK 5 million in 2Q Total 3Q-17 4Q-17 1Q-18 2Q-18 3Q
36 Increased staffing in subsidiaries Headcount (FTE) 1,102 1,109 1,111 1,126 1,146 Stable level of staffing in the Parent Bank after the merger downsizing has been completed Increased staffing in the subsidiaries due to higher ambitions and activity levels in real estate brokerage and accounting services Q-17 4Q-17 1Q-18 2Q-18 3Q-18 Parent bank Subsidiaries # Fulltime equivalents (FTE) 36
37 Expenses Parent Bank (adjusted*) Operating Costs per quarter (NOK million) The operating costs as of 3Q 2018 were NOK 12 million lower than in the same period in This is equivalent to a 1.3 % cost reduction compared with last year The ambition of a 5 % cost reduction in absolute terms for the pro-forma parent for the year 2018 compared with 2017 is maintained. 3Q-17 4Q-17 1Q-18 2Q-18 3Q-18 Forecasts for 4Q 2018 indicates that the bank is in line to reach its ambition of 5 % cost reduction. 37 * The analysis takes into account that the former Bank 1 Oslo Akershus is consolidated from 2Q 17. Adjusted is calculated as if the merger had effect for the whole year of 2017.
38 The contribution from financial items has increased Net income from financial assets and liabilities (NOK millions) Net income from financial assets and liabilities has increased with NOK 23 million. See previous slides Issued debt securities were in 2017 generally assessed at fair value and showed, mainly due to lower credit spreads, a loss of NOK 78 million. Issued debt securities are after 1 January 2018 generally assessed at amortised costs (reclassification due to transfer to IFRS 9). The remaining improvement in net change on securities issues compared with last year is marginally positive and counts for NOK 9 million. The accumulated contribution is NOK 87 million. Net income from financial assets and liabilities Dividends from other than Group companies Net profit from ownership interests Net change in value on securities issued including hedge derivatives Net income from financial assets and liabilities excl. net change in value on securities issued including hedge derivatives Net income from financial assets and liabilities Net income from other posts has increased with NOK 38 million. Main contribution is a one-off from the Vipps/BID/BAX-merger (NOK 59 million), bond investments (NOK 54 million), and positive contribution from ownership interests (NOK 23 million). 38
39 Still low impairments on loans and guarantees Impairments on loans and guarantees (NOK million) Q Impairments on loans and guarantees was NOK 24 million, equal to 0.02 % of gross loans Parent bank NOK 12 million SB1 Finans Østlandet NOK 12 million Impairments on loans and guarantees was NOK 12 million in the third quarter Parent bank NOK 4 million SB1 Finans Østlandet NOK 8 million -13 3Q-17 4Q-17 1Q-18 2Q-18 3Q * Annualised loss rate.
40 Low levels of problem loans Non-performing and other doubtful commitments* % % 1.12% % 0.61% 0.59% 0.42% 0.41% % 0.36% Q-2018 Gross doubtful commitments (not in default) 1.60% 1.40% 1.20% 1.00% 0.80% 0.60% 0.40% 0.20% 0.00% The proportion of problem loans decreases further Gross defaulted commitments for more than 90 days Gross doubtful (not in default) and gross defaulted commitments as % of gross loans Gross doubtful and gross defaulted commitments as % of gross loans incl. loans transferred to covered bond companies 40 *) NOK million and percentage of total lending
41 Low impairments and low net exposure in Stage 3 Specification of impairments and net exposure (NOK million) Impairments per segment - quarterly Maximum exposure (on and off-balance sheet items), net of accumulated impairments 3Q18 2Q-18 1Q-18 Personal customers Corporate customers SB 1 Finans Østlandet Total % 94.5 % 93.3 % Stage 1 Initial recognition and no significant deterioration of credit quality 12-month expected credit losses Stage 2 Significant deterioration of credit quality Lifetime expected credit losses Stage 3 Significant deterioration of credit quality and objective credit loss Lifetime expected credit losses 5.0 % 5.2 % 6.3 % 0.4 % 0.3 % 0.4 % Stage 1 Stage 2 Stage 3 1Q-18 2Q-18 3Q-18 41
42 CET 1 close to target Core equity tier 1 ratio (Group) The target for CET 1 is 16.0 %. The Group s common equity tier 1 ratio was 15.9 % % 17.2 % 16.9 % 16.8 % 15.9 % The reduction in CET 1 was due to strong lending growth in the period. The leverage ratio was 7.2 % Q
43 Changes to capital requirements are expected to leave little impact on the bank Group CET 1 (per cent) exclusive and inclusive the Basel 1-floor 20.0 % 19.0 % 18.0 % 17.0 % 16.0 % 15.0 % 14.0 % 13.0 % 19.00% 16.80% 18.00% 15.90% CET - ex Basel 1 floor CET1 incl Basel 1 floor Management buffer after removal of floor and introduction of SIFI will still be app. 2 % CET1-requirement as SIFI 15,8 % CET1-requirement today 13,8 % The group s CET 1, exclusive the Basel 1-floor, is approximately 2 percentage point above the CET 1 inclusive Basel 1. The Basel 1-floor will be removed, and as a consequence the group CET 1 will increase with app. 2 percentage points. The NFSA delivered 19 October a recommendation to the Ministry of Finance regarding systematically important financial institutions (SIFI). It is expected that SpareBank 1 Østlandet will be defined as SIFI under this regulation with an increased capital requirement of 2 percentage points. These two changes in regulation are expected to have an offsetting effect for SpareBank 1 Østlandet, and the bank considers the SIFIrequirement to have no isolated effect on capitalization, growth plans or dividend policy*. 43 * A SIFI-status could have positive impact on Moody s credit rating, as the current negative outlook is based on the implementation of the BRRD which will trigger a reassessment of Moody s government support assumption. As a SIFI-institution the assumption of government support will be stronger, and could have a positive impact at next rating action by Moody s Investor Service

44 Well positioned to serve a growth region Summary 44


45 Richard Heiberg CEO Tel.: Contact details Geir-Egil Bolstad CFO Tel.: Runar Hauge Investor relations Tel.:
46 Disclaimer This presentation contains forward-looking statements that reflect management s current views with respect to certain future events and potential financial performance. Although SpareBank 1 Østlandet believes that the expectations reflected in such forward-looking statements are reasonable, no assurance can be given that such expectations will prove to have been correct. Accordingly, results could differ materially from those set out in the forward-looking statements as a result of various factors. Important factors that may cause such a difference for SpareBank 1 Østlandet are, but are not limited to: (i) the macroeconomic development, (ii) change in the competitive climate, (iii) change in the regulatory environment and other government actions and (iv) change in interest rate and foreign exchange rate levels. This presentation does not imply that SpareBank 1 Østlandet has undertaken to revise these forward-looking statements, beyond what is required by applicable law or applicable stock exchange regulations if and when circumstances arise that will lead to changes compared to the date when these statements were provided. 46
47 Together to create Proficient Nearby Engaged
Company presentation. Fourth quarter February 2018
 Company presentation Fourth quarter 2018 8 February 2018 Companies in the Hedmark county are top notch in Europe in social media utilization. Tretopphyttene AS in Ringsaker gives social media much of the
Financial results. First Quarter April 2018
 Financial results First Quarter 2018 27 April 2018 Solid performance in first quarter 2018 First customer dividend has been paid We teach parents and children digital economy Innovative focus on digital
Investor presentation September 2018
 Investor presentation September 2018 Geir-Egil Bolstad Cathrine Mordal Runar Hauge CFO Head of Treasury Portfolio manager/ir - Norway s fastest growing region is our home market Executive summary SpareBank
Investor presentation February Geir-Egil Bolstad Cathrine Mordal Runar Hauge CFO Head of treasury Portfolio manager/ir
 Investor presentation February 2018 Geir-Egil Bolstad Cathrine Mordal Runar Hauge CFO Head of treasury Portfolio manager/ir Executive summary SpareBank 1 Østlandet Norway s fourth largest savings bank
Financial result. First quarter 2016 April 28th 2016
 Financial result First quarter 2016 April 28th 2016 Highlights financial report first quarter 2016 Satisfactory Return on Equity - Return on equity was 7.6 per cent. - Return on equity adjusted for securities
Sparebanken Hedmark. Q Presentation of financial results. CEO Richard Heiberg. 1 November 2013
 Sparebanken Hedmark Q3-213 Presentation of financial results CEO Richard Heiberg 1 November 213 About Sparebanken Hedmark Sparebanken Hedmark is the leading provider of financial products to people, companies
Sparebanken Hedmark. 1st Half Year 2013 Presentation of financial results. CEO Richard Heiberg. 14 August 2013
 Sparebanken Hedmark 1st Half Year 2013 Presentation of financial results CEO Richard Heiberg 14 August 2013 Apendix I. Highlights first half year Page 4 II. Income statement Page 5 III. Balance Sheet and
Financial result. Fourth quarter
 Financial result Fourth quarter 2015 05.02.2016 Highlights financial report fourth quarter 2015 Satisfactory return on Equity Solvency further strengthened Improved interest margin and high financial income
Quarterly report. Interim report. First Quarter 2017 NOTES TO THE ACCOUNTS
 Quarterly report Interim report First Quarter 2017 1 Content 3 Main figures 4 9 Interim report 10 Income statement 11 Balance sheet 12 Changes in equity capital 14 Cash flow statement 15 Quarterly accounts
Second quarter report 2018
 Second quarter report 2018 SPAREBANK 1 ØSTLANDET Plastdugnaden - a large-scale voluntary plastic cleanup on waterways with funding from SpareBank 1 Østlandet and Sparebankstiftelsen Hedmark. Content Key
Quarterly report. Interim report Q NOTES TO THE ACCOUNTS 1
 Quarterly report Interim report Q4 2016 NOTES TO THE ACCOUNTS 1 Content 3 Main figures 4 10 Interim report 11 Income statement 12 Balance sheet 13 Changes in equity capital 15 Cash flow statement 16-17
SpareBank 1 SR-Bank ASA 3rd quarter 2014
 SpareBank 1 SR-Bank ASA 3rd quarter 2014 Page 1 Disclaimer This presentation contains forward-looking statements that reflect management s current views with respect to certain future events and potential
Fourth quarter report 2017 SPAREBANK 1 ØSTLANDET
 Fourth quarter report 2017 SPAREBANK 1 ØSTLANDET Content Key figures Group... 2 Report of the Board of Directors... 3 Income statement... 10 Balance sheet... 11 Changes in equity capital... 12 Cash Flow
HALF-YEAR REPORT 2014
 HALF-YEAR REPORT 2014 Contents First half year 2014 3 4 6 7 8 9 10 11 12 22 Main figures Quarterly report Income Statement Balance sheet Changes in equity capital Cash flow statement Results from the quarterly
1st half August 2018
 8. August 2018 SpareBank 1 SMN, the region s most important financial institution SpareBank 1 SMN History 221,000 retail customers Established in 1823 14,800 corporate customers Sparebanken Midt-Norge
1st quarter May 2018
 4. May 2018 SpareBank 1 SMN, the region s most important financial institution SpareBank 1 SMN History 219,000 retail customers Established in 1823 14,800 corporate customers Sparebanken Midt-Norge since
Interim Report. Interim Report Q NOTES TO THE ACCOUNTS 1
 Interim Report Interim Report Q3 2015 NOTES TO THE ACCOUNTS 1 Contents 3 Main figures 4 8 Interim report 9 Income statement 10 Balance sheet 11 Changes in equity capital 12 Cash flow statement 13 Results
Interim Financial Statements Q3 2018
 Interim Financial Statements Q3 2018 Key figures... 3 Report of the Board of Directors... 4 Income Statement... 17 Balance Sheet... 18 Statement of Changes in Equity... 19 Cash Flow Statement... 20 Notes
Report of the Board of Directors
 Report of the Board of Directors Accounts for first nine months 2017 (Consolidated figures. Figures in parenthesis refer to the same period of 2016 unless otherwise stated) Pre-tax profit: NOK 1,568m (1,430m)
Sparebanken Sør Boligkreditt AS Q2 2017
 Sparebanken Sør Boligkreditt AS Q2 2017 Sparebanken Sør Business Sparebanken Sør is an independent financial group with activities within banking, securities and real estate Balance The sixth largest
Sparebanken Sør Boligkreditt AS Q3 2017
 Sparebanken Sør Boligkreditt AS Q3 2017 Sparebanken Sør Business Sparebanken Sør is an independent financial group with activities within banking, securities and real estate Balance The sixth largest
First quarter report 2018
 First quarter report 2018 SPAREBANK 1 ØSTLANDET First bank in Norway to pay customer dividends Content Key figures Group... 2 Income statement... 9 Balance sheet... 10 Changes in equity capital... 11 Cash
First quarter 2011 SpareBank 1 SR-Bank konsern
 First quarter 2011 SpareBank 1 SR-Bank konsern Page 1 Good quarterly results Q1 2011 Profit before tax: NOK 336 million (NOK 395 million) Return on equity after tax: 11.2% (14.8%) Earnings per equity certificate:
Quarterly Report Fourth quarter 2011
 4. quarter 2011 Quarterly Report Fourth quarter 2011 Norwegian and international economy In spite of the weak performance in Europe, global growth is estimated to be around 3 per cent in 2011. There has
SpareBank 1 SR-Bank Group Unaudited 1
 SpareBank 1 SR-Bank Group Unaudited 1 Interim Financial Statements Q1 2017 Key figures... 3 Report of the Board of Directors... 4 Income Statement... 15 Balance Sheet... 16 Statement of Changes in Equity...
Second quarter (Unaudited) Sbanken Boligkreditt AS
 Sbanken Boligkreditt AS") Q2 Second quarter 2018 (Unaudited) Sbanken Boligkreditt AS Key figures In NOK thousand Reference Jan - Jun 18 Jan - Jun 17 2017 Summary of income statement Net interest income 130 836 80 366 206 181 Net
Q2 Second quarter 2018 (Unaudited) Sbanken Boligkreditt AS Key figures In NOK thousand Reference Jan - Jun 18 Jan - Jun 17 2017 Summary of income statement Net interest income 130 836 80 366 206 181 Net
SpareBank 1 SR-Bank ASA. 3rd quarter st November Page 1
 SpareBank 1 SR-Bank ASA 3rd quarter 2012 1st November 2012 Page 1 Disclaimer This presentation contains forward-looking statements that reflect management s current views with respect to certain future
3rd quarter October 2018
 3rd quarter 2018 26. October 2018 SpareBank 1 SMN, the region s most important financial institution SpareBank 1 SMN History 222,450 retail customers Established in 1823 14,980 corporate customers Sparebanken
INTERIM REPORT FOR THE 3RD QUARTER
 2018 INTERIM REPORT FOR THE 3RD QUARTER SPAREBANK 1 BV NO 944 521 836 TEL. +45 915 02480 BUSINESS IDEA, VISION/VALUES AND GOALS Business idea Business areas SpareBank 1 BV aims to contribute to value creation
Third quarter (Unaudited) Sbanken Boligkreditt AS
 Sbanken Boligkreditt AS") Q3 Third quarter 2018 (Unaudited) Sbanken Boligkreditt AS Key figures In NOK thousand Reference Jan - Sep 18 Jan - Sep 17 2017 Summary of income statement Net interest income 187 849 136 708 206 181 Net
Q3 Third quarter 2018 (Unaudited) Sbanken Boligkreditt AS Key figures In NOK thousand Reference Jan - Sep 18 Jan - Sep 17 2017 Summary of income statement Net interest income 187 849 136 708 206 181 Net
Third quarter (Unaudited) Sbanken ASA
 Sbanken ASA") Q3 Third quarter 2018 (Unaudited) Sbanken ASA Q3 Third quarter 2018 Highlights Sbanken ASA Annual lending growth 9.4% (17.8% * ) Cost-to-income ratio 39.0% (38.3% * ) ROE 12.5% (13.0% * ) Net interest
Q3 Third quarter 2018 (Unaudited) Sbanken ASA Q3 Third quarter 2018 Highlights Sbanken ASA Annual lending growth 9.4% (17.8% * ) Cost-to-income ratio 39.0% (38.3% * ) ROE 12.5% (13.0% * ) Net interest
Third quarter (Unaudited) Skandiabanken Boligkreditt AS
 Skandiabanken Boligkreditt AS") Q3 Third quarter 2017 (Unaudited) Skandiabanken Boligkreditt AS Key figures In NOK thousand Reference Jan- Sep 17 Jan- Sep 16 2016 Summary of income statement Net interest income 136 708 93 957 121 141
Q3 Third quarter 2017 (Unaudited) Skandiabanken Boligkreditt AS Key figures In NOK thousand Reference Jan- Sep 17 Jan- Sep 16 2016 Summary of income statement Net interest income 136 708 93 957 121 141
Contents. 2nd quarter 2013
 Contents Main figures... 3 Report of the Board of Directors... 5 Income statement... 18 Balance sheet... 20 Cash flow statement... 21 Change in equity... 22 Equity capital certificate ratio... 24 Results
1st quarter th April Arne Austreid, Chief Executive Officer Inge Reinertsen, Chief Financial Officer
 SpareBank 1 SR-Bank Group 1st quarter 2011 28th April 2010 Arne Austreid, Chief Executive Officer Inge Reinertsen, Chief Financial Officer Creating values for more than 170 years 1839 1849 1859 1869 1879
Contents. 1st Quarter 2017
 Contents Main figures... 3 Report of the Board of Directors... 5 Income statement... 18 Balance sheet... 20 Cash flow statement... 21 Change in equity... 22 Notes... 25 Equity capital certificate ratio...
1 Introduction 3. 2 Capital adequacy Capital adequacy regulations 4
 2016 PILLAR 3 2 Contents 1 Introduction 3 2 Capital adequacy 4 2.1 Capital adequacy regulations 4 2.1.1 Pillar 1 Minimum capital requirements 4 2.1.2 Pillar 2 - Internal Capital Adequacy Accessment Process
Report of the Board of Directors
 Report of the Board of Directors Preliminary annual accounts 2017 (Consolidated figures. Figures in parenthesis refer to the same period of 2016 unless otherwise stated) As from the fourth quarter of 2017
Contents. 1st Quarter 2018
 Contents Main figures... 3 Report of the Board of Directors... 5 Income statement... 18 Balance sheet... 20 Cash flow statement... 21 Change in equity... 22 Notes... 25 Results from quarterly accounts...
Sparebanken Sør Boligkreditt AS QUARTER 4
 Sparebanken Sør Boligkreditt AS QUARTER 4 2018 1 Sparebanken Sør Business Balance Employees Products and services Summary Sparebanken Sør is an independent financial group with activities within banking,
Contents. 1st Quarter 2012
 Contents Main figures... 3 Report of the Board of Directors... 5 Income statement... 16 Balance sheet... 18 Cash flow statement... 19 Change in equity... 20 Equity capital certificate ratio... 23 Results
Q3 RESULTS DNB GROUP THIRD QUARTER Roadshow London, Edinburgh and Dublin
 Q3 RESULTS DNB GROUP THIRD QUARTER 2015 Roadshow London, Edinburgh and Dublin 22.10.2015 Third quarter 2015 Pre-tax operating profit before impairment in NOK billion 8.1 (7.6) Cost/income ratio in per
FOURTH QUARTER 2017 AND THE YEAR 2017 JAN ERIK KJERPESETH CEO SPAREBANKEN VEST
 FOURTH QUARTER 2017 AND THE YEAR 2017 JAN ERIK KJERPESETH CEO SPAREBANKEN VEST 2017: A YEAR MARKED BY GOOD GROWTH, LOW LOSSES AND HIGHER MARGINS GOOD GROWTH IN THE RETAIL AND CORPORATE MARKETS Retail market
Fourth quarter February 2018
 Fourth quarter 2017 7. February 2018 SpareBank 1 SMN, the region s most important financial institution SpareBank 1 SMN History 218,000 retail customers Established in 1823 14,500 corporate customers Sparebanken
Investor presentation
 Q2 Investor presentation RESULTS DNB GROUP SECOND QUARTER AND FIRST HALF Rune Bjerke (CEO) Bjørn Erik Næss (CFO) Second quarter Pre-tax operating profit before impairment in NOK billion 6.7 (6.1) Cost/income
Equity story. December 2017
 Equity story December 2017 2007 2008 2009 2010 2011 2012 2013 2014 2015 2016 2017E 2018E 2019E 2020E Operating in a robust Norwegian economy Positive GDP growth and low unemployment rates Norwegian GDP
Second quarter (Unaudited) Sbanken ASA
 Sbanken ASA") Q2 Second quarter 2018 (Unaudited) Sbanken ASA Q2 Second quarter 2018 Highlights Sbanken ASA Annual lending growth 8.1% (18.1% * ) Cost-to-income ratio 38.6% (40.2% * ) ROE 15.3% (12.4% * ) Net interest
Q2 Second quarter 2018 (Unaudited) Sbanken ASA Q2 Second quarter 2018 Highlights Sbanken ASA Annual lending growth 8.1% (18.1% * ) Cost-to-income ratio 38.6% (40.2% * ) ROE 15.3% (12.4% * ) Net interest
Annual report Financial results
 Financial results 1 of 124 Report of the Board of Directors Macroeconomic conditions World economy International growth picked up somewhat in 2013, but remains at moderate levels. In the US, hefty public
Interim report as of 30 June 2018 (unaudited) Interim report as of 30 June 2018
 Interim report as of 30 June 2018") Interim report as of 30 June 2018 1 Interim report as of 30 June 2018 (unaudited) First half-year 2018 Successful launch of consumer loans and savings account for private customers Distribution network
Interim report as of 30 June 2018 1 Interim report as of 30 June 2018 (unaudited) First half-year 2018 Successful launch of consumer loans and savings account for private customers Distribution network
First quarter 2012 The Sparebanken Vest Group
 First quarter 2012 The Sparebanken Vest Group 25 April 2012 Stein Klakegg, CEO Eivind Areklett Norebø, CFO 1 First quarter 2012 Optimism among businesses in Western Norway despite financial unrest internationally
Næringskreditt 2nd Quarterly Report 2015
 Næringskreditt 2 nd Quarterly Report 2015 Contents Financial Statements as of the 2 nd quarter 2015 Report of the Board of Directors...3 Statement of the Board and the CEO...7 Income Statement... 8 Statement
Sparebanken Sør Boligkreditt AS Q2 2018
 Sparebanken Sør Boligkreditt AS Q2 2018 1 Sparebanken Sør Business Balance Employees Products and services Summary Sparebanken Sør is an independent financial group with activities within banking, securities
SR-Boligkreditt. Investor Presentation. Cover Pool per
 SR-Boligkreditt Investor Presentation Cover Pool per 31.12.2015 Disclaimer This presentation contains forward-looking statements that reflect management s current views with respect to certain future events
FIRST QUARTER APRIL JAN ERIK KJERPESETH MANAGING DIRECTOR
 FIRST QUARTER 2015 28 APRIL JAN ERIK KJERPESETH MANAGING DIRECTOR KEY DEVELOPMENTS IN THE FIRST QUARTER PRE-TAX OPERATING PROFIT PROFIT PERFORMANCE NOK 407 MILL. (526) PROFIT PERFORMANCE EXCL. NON-RECURRING
interim report 4 quarter unaudited
 interim report 4 quarter unaudited 18 Interim report from the Board of Directors About the Company Møre Boligkreditt AS is a wholly owned subsidiary of Sparebanken Møre. The company is licensed to operate
Investor presentation
 Third quarter 2015 Investor presentation KLP Banken AS KLP Kommunekreditt AS KLP Boligkreditt AS Financials 2 Interim report Q3 2015 Key figures YTD 2015 ( YTD 2014) Change Profit before tax: 34m (30m)
FIRST QUARTER 2016 JAN ERIK KJERPESETH MANAGING DIRECTOR
 FIRST QUARTER 2016 JAN ERIK KJERPESETH MANAGING DIRECTOR KEY DEVELOPMENTS INCREASED NET INTEREST POSITIV MARGIN DEVELOPMENT IN THE COPORATE MARKET AND GROWTH IN LINE WITH TARGET LOW LOSSES AND CAPITAL
The leading financial group in the southwest of Norway
 Disclaimer This presentation contains forward-looking statements that reflect management s current views with respect to certain future events and potential financial performance. Although SpareBank 1
The leading financial group in the southwest of Norway
 FOURTH QUARTER 2015 Disclaimer This presentation contains forward-looking statements that reflect management s current views with respect to certain future events and potential financial performance. Although
DNB on track. Rune Bjerke CEO
 DNB on track Rune Bjerke CEO Financial ambitions - 2016 and 2017 Return on equity > 12 per cent Min. 14% CET1-ratio* as capital plateau > 50% dividend when capital plateau is reached 1 * Based on transitional
Investor Relations. Supplementary information First Quarter 2018
 Investor Relations Supplementary information First Quarter 2018 CEO Finn Haugan For further information, please contact Kjell Fordal, CFO kjell.fordal@smn.no +47 905 41 672 Address SpareBank 1 SMN, Postboks
The cover pool- portfolio information
 The cover pool- portfolio information DnB NOR Boligkreditt AS Covered Bond Programme - EUR 40 billion As at 31.05.10 Ratings S&P Moody's Fitch DnB NOR Bank ASA (Parent bank) A+ Aa3 - DnB NOR Boligkreditt
The leading financial group in the southwest of Norway
 SECOND QUARTER 2016 Disclaimer This presentation contains forward-looking statements that reflect management s current views with respect to certain future events and potential financial performance. Although
Q Presentation KLP Banken Group. Q financial highlights and cover pool
 Q3 2018 Presentation KLP Banken Group Q3 2018 - financial highlights and cover pool Content Financial highlights Cover Pool Report KLP Boligkreditt AS Cover Pool Report KLP Kommunekreditt AS Overview -
From the DNB NXT Conference in October 2016
 DNB Group Results Rune Bjerke (CEO) Kjerstin Braathen (CFO) 28.04.2017 From the DNB NXT Conference in October Profits on track sound trend in net interest income Net interest income increased by NOK 149
RESULTS DNB GROUP. Rune Bjerke (CEO) Bjørn Erik Næss (CFO)
 Bjørn Erik Næss (CFO)") RESULTS DNB GROUP Rune Bjerke (CEO) Bjørn Erik Næss (CFO) 28.04.2016 First quarter 2016 Pre-tax operating profit in NOK billion 6.8 (8.7) Cost/income ratio in per cent 41.8 (37.0) Return on equity in per
RESULTS DNB GROUP Rune Bjerke (CEO) Bjørn Erik Næss (CFO) 28.04.2016 First quarter 2016 Pre-tax operating profit in NOK billion 6.8 (8.7) Cost/income ratio in per cent 41.8 (37.0) Return on equity in per
Q Presentation KLP Banken Group. Q financial highlights and cover pool
 Q2 2018 Presentation KLP Banken Group Q2 2018 - financial highlights and cover pool Content Financial highlights Cover Pool Report KLP Boligkreditt AS Cover Pool Report KLP Kommunekreditt AS Overview -
RESULTS DNB GROUP 1ST QUARTER Rune Bjerke (CEO) Bjørn Erik Næss (CFO)
 Bjørn Erik Næss (CFO)") Q1 RESULTS DNB GROUP 1ST QUARTER 2015 Rune Bjerke (CEO) Bjørn Erik Næss (CFO) First quarter 2015 Pre-tax operating profit before impairment in NOK billion 9.3 (7.4) Cost/income ratio in per cent 37.0 (41.3)
Q1 RESULTS DNB GROUP 1ST QUARTER 2015 Rune Bjerke (CEO) Bjørn Erik Næss (CFO) First quarter 2015 Pre-tax operating profit before impairment in NOK billion 9.3 (7.4) Cost/income ratio in per cent 37.0 (41.3)
RESULTS DNB GROUP FOURTH QUARTER
 RESULTS DNB GROUP FOURTH QUARTER 03.02.2017 Major achievements in 2016 CET1 ratio requirement reached one year ahead of plan. CET1 ratio 16.0 per cent. Leverage ratio 7.3 per cent, well above the upcoming
Investor Relations. Supplementary information Fourth Quarter 2016
 Investor Relations Supplementary information Fourth Quarter CEO Finn Haugan For further information, please contact Kjell Fordal, CFO kjell.fordal@smn.no +47 905 41 672 Address SpareBank 1 SMN, Postboks
Q1 presentation Financial highlights and cover pool
 First quarter 2016 Q1 presentation Financial highlights and cover pool KLP Banken AS KLP Kommunekreditt AS KLP Boligkreditt AS Financials 2 Interim financial report Q1 2016 - Summary Profitability (NOK
Sparebanken Sør 3 rd quarter 2017
 Sparebanken Sør 3 rd quarter 2017 Sparebanken Sør Business Sparebanken Sør is an independent financial group with activities within banking, securities and real estate brokerage. Balance The sixth largest
Q Presentation KLP Banken Group. -financial highlights and cover pool
 Q4 2017 Presentation KLP Banken Group -financial highlights and cover pool Content Financial highlights Cover Pool Report KLP Boligkreditt AS Cover Pool Report KLP Kommunekreditt AS Overview Profitability
Investor Relations. Supplementary information Fourth Quarter 2017
 Investor Relations Supplementary information Fourth Quarter CEO Finn Haugan For further information, please contact Kjell Fordal, CFO kjell.fordal@smn.no +47 905 41 672 Address SpareBank 1 SMN, Postboks
Sandnes Sparebank. 4 th Quarter Results 2016 Oslo, 15 February 2016
 Sandnes Sparebank 4 th Quarter Results 2016 Oslo, 15 February 2016 Contents About Sandnes Sparebank Macro Economic Conditions Financial Highlights Loan Portfolio Overview Capital, Liquidity and Funding
Report for the 1st quarter Norwegian Finans Holding ASA
 (NFH) owns 100% of the shares in Bank Norwegian AS. The company does not engage in any other operations. The ownership of is divided between institutional and private investors in Norway and abroad, of
SpareBank 1 Boligkreditt
 SpareBank 1 Boligkreditt Investor Presentation June 2010 Overview The Norwegian Economy: The Norwegian economy was impacted by the financial crisis, but to a lesser extent than most other economies with
Nordea Eiendomskreditt Covered Bonds Investor presentation Q3 2017
 Nordea Eiendomskreditt Covered Bonds Investor presentation Nordea Eiendomskreditt overview A 100% owned subsidiary of Nordea Bank AB The purpose of the Issuer is to acquire and provide residential mortgage
Nordea Eiendomskreditt Covered Bonds Investor presentation Q2 2017
 Nordea Eiendomskreditt Covered Bonds Investor presentation Nordea Eiendomskreditt overview A 100% owned subsidiary of Nordea Bank AB The purpose of the Issuer is to acquire and provide residential mortgage
Boligkreditt 1st Quarterly Report 2018
 Boligkreditt 1st Quarterly Report 2018 Table of contents Report of the Board of Directors... 4 Cover pool and outstanding covered bonds... 4 Key figures... 4 Key developments... 4 Nature and development
Helgeland Boligkreditt AS cover pool data
 Helgeland Boligkreditt AS cover pool data Report date: 30.06.2017 Report currency: NOK 1. General cover pool information 1.1. Key chatacteristics Total cover pool, nominal balance 6.225.039.754 Nominal
DNB Group Results. Rune Bjerke (CEO) Kjerstin Braathen (CFO)
 Kjerstin Braathen (CFO)") DNB Group Results Rune Bjerke (CEO) Kjerstin Braathen (CFO) 26 October 2017 Through Digital Challenge, DNB challenged technology students to define how the future of mobile banking should look Highlights
DNB Group Results Rune Bjerke (CEO) Kjerstin Braathen (CFO) 26 October 2017 Through Digital Challenge, DNB challenged technology students to define how the future of mobile banking should look Highlights
Investor presentation
 First quarter 2015 Investor presentation KLP Banken AS KLP Kommunekreditt AS KLP Boligkreditt AS Financials 2 Interim report Q1 2015 P&Ls KLP Banken Group million Q1 2015 Q1 2014 2014 Net interest income
Introduction to SpareBank 1 SR-Bank ASA
 Disclaimer This presentation contains forward-looking statements that reflect management s current views with respect to certain future events and potential financial performance. Although SpareBank 1
INTERIM REPORT Q1 2017
 INTERIM REPORT Q1 First quarter Higher pre-tax profit: NOK 432 million (NOK 322 mill.) Higher return on equity: 10.6% (8.8%) Stable nominal net interest: NOK 610 million (NOK 609 mill.), up from NOK 597
SpareBank 1 SR-Bank. SR-Boligkreditt. Norwegian economy. Appendix
 Disclaimer This presentation contains forward-looking statements that reflect management s current views with respect to certain future events and potential financial performance. Although SpareBank 1
Adapting to a new banking reality
 Adapting to a new banking reality Morgan Stanley Financials Conference March 21, 2013 1 Bjørn Erik Næss CFO of DNB Profit figures last five years Pre-tax operating profit before impairment (NOK million)
Investor Presentation KLP Banken Group. Q financial highlights and cover pool
 Investor Presentation KLP Banken Group financial highlights and cover pool Content Financial highlights Cover Pool Report KLP Boligkreditt AS Cover Pool Report KLP Kommunekreditt AS Overview Profitability
Investor presentation
 Second quarter 2015 Investor presentation KLP Banken AS KLP Kommunekreditt AS KLP Boligkreditt AS Financials 2 Interim report Q2 2015 P&Ls KLP Banken Group million Q2 2015 Q2 2014 2014 Net interest income
Contents. 4th Quarter 2015
 Contents Main figures... 3 Report of the Board of Directors... 4 Income statement... 18 Balance sheet... 20 Cash flow statement... 21 Change in equity... 22 Equity capital cetificate ratio... 25 Results
Investor Relations. Supplementary information Second Quarter 2018
 Investor Relations Supplementary information Second Quarter 2018 CEO Finn Haugan For further information, please contact Kjell Fordal, CFO kjell.fordal@smn.no +47 905 41 672 Address SpareBank 1 SMN, Postboks
SSB Boligkreditt AS. Investor Presentation 4Q 2013
 SSB Boligkreditt AS Investor Presentation 4Q 2013 Characteristics of the Cover Pool Loans originated by SSB Boligkreditt AS Cover pool mortgages MNOK 6,521 Substitute assets MNOK 341 Total cover pool MNOK
Second quarter DNB Group Results. Rune Bjerke (CEO) Kjerstin Braathen (CFO) 12 July 2018
 Kjerstin Braathen (CFO) 12 July 2018") Q2 Second quarter 2018 DNB Group Results Rune Bjerke (CEO) Kjerstin Braathen (CFO) 12 July 2018 Approaching ROE >12 per cent Return on equity Per cent, 12-month trailing average 11.6 Return on equity 11.8
Q2 Second quarter 2018 DNB Group Results Rune Bjerke (CEO) Kjerstin Braathen (CFO) 12 July 2018 Approaching ROE >12 per cent Return on equity Per cent, 12-month trailing average 11.6 Return on equity 11.8
BN Boligkreditt AS. INTERIM REPORT 4th QUARTER 2011
 BN Boligkreditt AS INTERIM REPORT 4th QUARTER 2011 Content Summary of results for Q4 2011...3 Financial Ratios...4 Directors Report...5 Income Statement...7 Balance Sheet...8 Statement of Changes in Equity...9
DNB GROUP. Goldman Sachs European Financials Conference Madrid June 2014
 DNB GROUP Goldman Sachs European Financials Conference Madrid 10-12 June 2014 DNB - Norway s Leading Financial Services Group - Market leader in Norway and leading within selected global industries Significant
INTERIM REPORT Q3 2017
 INTERIM REPORT Q3 Third quarter Strong pre-tax profit: NOK 513 million (NOK 453 million*) Return on equity: 12.2% (11.9%*) Net interest: 1.50% (1.44%) Higher nominal net interest: NOK 650 million (NOK
SSB Boligkreditt AS. Investor Presentation 4Q 2014
 SSB Boligkreditt AS Investor Presentation 4Q 2014 Characteristics of the Cover Pool Loans originated by SSB Boligkreditt AS Cover pool mortgages MNOK 6,730 Substitute assets MNOK 317 Total cover pool MNOK
JAN ERIK KJERPESETH MANAGING DIRECTOR SPAREBANKEN VEST
 2016 JAN ERIK KJERPESETH MANAGING DIRECTOR SPAREBANKEN VEST SPAREBANKEN VEST Market area Brief information about Sparebanken Vest Established in 1823 and listed on Oslo Børs since 1995 Norway's second
DNB Bank. A company in the DNB Group. Third quarter report 2018 (Unaudited)
") DNB Bank A company in the DNB Group Q3 Third quarter report 2018 (Unaudited) Financial highlights Income statement 3rd quarter 3rd quarter January-September Full year Amounts in NOK million 2018 2017 2018
DNB Bank A company in the DNB Group Q3 Third quarter report 2018 (Unaudited) Financial highlights Income statement 3rd quarter 3rd quarter January-September Full year Amounts in NOK million 2018 2017 2018
QUARTER (UNAUDITED)
") QUARTER 3 2014 (UNAUDITED) 2 Contents Information 2 Key figures Group 3 Report from the Board of Directors 4 Income statement 10 Balance sheet 11 Cash flow statement 12 Equity statement 13 Notes 14 Risk
QUARTER 3 2014 (UNAUDITED) 2 Contents Information 2 Key figures Group 3 Report from the Board of Directors 4 Income statement 10 Balance sheet 11 Cash flow statement 12 Equity statement 13 Notes 14 Risk
RESULTS DNB GROUP FOURTH QUARTER 2015
 Q4 RESULTS DNB GROUP FOURTH QUARTER Rune Bjerke (CEO) Bjørn Erik Næss (CFO) 04.02.2016 Full year Pre-tax operating profit before impairment in NOK billion 34.1 (28.7) Cost/income ratio in per cent 36.9