Investor Relations. Supplementary information Fourth Quarter 2017
|
|
|
- Noel Norton
- 6 years ago
- Views:
Transcription

1 Investor Relations Supplementary information Fourth Quarter
2 CEO Finn Haugan For further information, please contact Kjell Fordal, CFO Address SpareBank 1 SMN, Postboks 4796 Sluppen, 7467 Trondheim Visiting address: Søndre gate 4, 7011 Trondheim Sparebank 1 SMN Switchboard: Information on the Internet SpareBank 1 SMN s home page ECC information in general Financial Calendar st quarter May nd quarter August rd quarter October
3 Table of Contents 1. SpareBank 1 SMN Financial highlights Business description Credit ratings Equity capital certificate (MING) Financial results Main figures Net interest income Commission income Operating expenses Loans to customers Distribution of loans by industry Risk profile and write-downs Capital adequacy Funding Financial results Segment Information Extract from income statement Retail Market Corporate Subsidiaries Development last ten years
4 1. SpareBank 1 SMN 1.1. Financial highlights January- December (Consolidated figures. Figures in parentheses refer to the same period of 2016 unless otherwise stated). Profit before tax and inv. held for sale: NOK 2,279 million (NOK 2,029 million) Net profit: NOK 1,828 million (NOK 1,681 million) Return on equity: 11.5 per cent (11.3 per cent) 12-month growth in lending (incl. SB1 Boligkreditt and SB1 Næringskreditt): 8.2 per cent (8.0 per cent) 12-month growth in deposits: 13.9 per cent (4.8 per cent) Loan losses: NOK 341 million (NOK 516 million) Common equity tier 1 ratio: 14.9 per cent (14.9 per cent) Earnings per EC: NOK 8.71 (7.93) Fourth quarter Profit before tax and inv. held for sale: NOK 678 million (NOK 565 million) Net profit: NOK 553 million (NOK 470 million) Return on equity: 13.4 per cent (12.2 per cent) Loan losses: NOK 78 million (NOK 99 million), including individual write downs of NOK 77 million (NOK 152 million), and collective write downs of NOK 1 million (NOK -53 million) Earnings per EC: NOK 2.63 (NOK 2.21) 3
5 1.2. Business description SpareBank 1 SMN is Mid-Norway s largest bank with assets totalling NOK 153 billion at the end of September. Head office is in Trondheim. SpareBank 1 SMN employs 1,403 FTEs (full time equivalents), including subsidiaries, and provides a full range of products and services within financing, investments, money transfers, pensions as well as life and non-life insurance. SpareBank 1 SMN's activities Main areas of Sparebank 1 SMN Retail Market 350 FTE Corporate Market 147 FTE Adm. & Support 99 FTE Subsidiaries* Ownership: 87.0 % 251 FTE Key area: Real estate agency Ownership: 64.6 % 32 FTE Key area: Lease finance Ownership: 95.4 % 349 FTE Key area: Accountancy business Ownership: 66.7 % 132 FTE Key area: Investment banking Joint ventures SpareBank 1 Gruppen AS (19.5%) BN Bank ASA (33%) SpareBank 1 Boligkreditt AS (19.9 %) SpareBank 1 Næringskreditt AS (33.5 %) SpareBank 1 Kredittkort (17.9 %) - Holding company for the SpareBank 1-Alliance - Commercial bank located in Oslo and Trondheim - Covered bond company (mortgages) - Covered bond company (commercial real estate) - Credit card company located in Trondheim *In addition SpareBank 1 SMN has subsidiaries with activities covering asset management, investments in regional seed corn, venture and private equity funds, property companies and car fleet management. These subsidiaries account for 43 FTEs 4


6 Organisation of SpareBank 1 SMN The Bank's operational structure is illustrated in the figure below Serves the retail market incl. agricultural customers, sole proprietorships, associations etc. Serves the corporate clients. Central credit function for the Group Finance, accounting, analysis and strategy HR, development projects, technology and marketing Communication, events, sponsorships and endowments Overview of governing and control bodies 5


7 SpareBank 1 Alliance SpareBank 1 SMN was one of the founding partners of the SpareBank 1 Alliance ("the Alliance") in The Alliance consists of closely cooperating savings banks, all of them being independent and locally anchored banks. The purpose of the SpareBank 1 Alliance is for members to develop, procure and supply competitive financial services and products and to exploit economies of scale. The Alliance canalize a lot of its mutual interests through SpareBank 1 Gruppen AS, a holding company of life and non-life insurance, mutual funds, a broker-dealer and other companies. The Alliance is the 2 nd largest Norwegian financial group with a wide distribution all over Norway. *) LO: The Norwegian Confederation of Trade Unions SpareBank 1 Østlandet 6
8 1.3. Credit ratings Moody's Current Year end rating Outlook Negative Stable Negative Stable Rating(s) under review Stable Stable Issuer Rating A1 A1 A2 A2 A2 A1 A1 Bank Deposits A1/P-1 A1/P-1 A2/P-1 A2/P-1 A2/P-1 A1/P-1 A1/P-1 Senior Unsecured A1 A1 A2 A2 A2 A1 A1 Subordinate Baa2 Baa2 Baa2 Baa3 Baa3 A2 A2 Fitch Year end Current rating Outlook Stable Stable Stable Stable Stable Stable Negative Long-term IDR A- A- A- A- A- A- A Short-term IDR F2 F2 F2 F2 F2 F2 F1 Support rating
9 1.4. Equity capital certificate (MING) The key figures are corrected for issues. 31 December the price of the Bank s ECC was NOK (NOK 64.75). Earnings per ECC were NOK 8.71 (NOK 7.93). Book value per ECC was NOK (NOK 73.35) as of 31 December. Key figures 4Q 3Q 2Q 1Q 4Q 31 Dec. (in NOK million) ECC price Number of certificates issued, millions Booked equity capital per ECC (incl. dividend) Adjusted profit per ECC P/E per ECC (annualised) P/B equity capital Stock price compared with OSEBX 1) and OSEEX 2) 1 Jan 2016 to 31 Dec SMN OSEBX OSEEX 0 Jan 16 Mar 16 May 16 Jul 16 Sep 16 Nov 16 Jan 17 Mar 17 May 17 Jul 17 Sep 17 Nov 17 1) OSEBX = Oslo Stock Exchange Benchmark Index (rebased) 2) OSEEX = Oslo Stock Exchange ECC Index (rebased) 8,000 Trading statistics 1) 1 Jan 2016 to 31 Dec 6,000 4,000 2,000 0 Jan 16 Mar 16 May 16 Jul 16 Sep 16 Nov 16 Jan 17 Mar 17 May 17 Jul 17 Sep 17 Nov 17 1) Total number of ECs traded (1,000) 8
10 Market value and profit per ECC , , , ,000 4, , Q 1Q 2Q 3Q 4Q Market value, NOK bill. Adjusted profit per ECC Equity certificates ratio (parent bank) 31 Dec. 30 Sept. 30 Jun. 31 Mar. 31 Dec. 31 Dec. (in NOK million) ECC capital 2,597 2,597 2,597 2,597 2,597 2,597 Dividend equalisation reserve 5,079 4,487 4,487 4,487 4,487 3,790 Premium reserve Unrealised gains reserve Other equity A. The equity certificate owner's capital 8,652 8,064 8,066 8,060 8,060 7,428 Saving bank reserve 4,831 4,498 4,498 4,498 4,499 4,105 Unrealised gains reserve Other equity B. Ownerless capital 4,877 4,545 4,546 4,543 4,545 4,186 Provision for gifts Recommended dividends Equity ex. hybrid capital 14,422 12,609 12,612 12,603 13,214 11,614 Equity certificates ratio A/(A+B) % % % % % % Equity certificates ratio for distribution 0.00 % % % % % % 9
11 20 largest ECC holders Owner VPF Nordea Norge Verdi State Street Bank and Trust CO (nominee) Sparebankstiftelsen SMN VPF Odin Norge VPF Danske Invest Norske Aksjer Inst. II Verdipapirfondet DNB Norge (IV) JP Morgan Chase Bank (nominee) VPF Pareto Aksje Norge State Street Bank and Trust CO (nominee) Morgan Stanley And Co Intl plc VPF Alfred Berg Gambak Pareto AS VPF Danske Invest Norske Aksjer Inst. I Forsvarets Personellservice JP Morgan Chase Bank (nominee) MP Pensjon PK VPF Nordea Kapital VPF Nordea Avkastning VPF Storebrand Norge I JP Morgan Chase Bank (nominee) Total 20 largest shareholders Others Total Number 6,572,299 4,013,854 3,965,391 3,726,686 3,334,265 2,961,197 2,669,005 2,356,459 2,203,038 2,098,751 1,924,604 1,821,202 1,772,092 1,717,046 1,714,638 1,568,771 1,423,991 1,289,111 1,208,665 1,163,440 49,504,505 80,331, ,836,443 Ownership in % 5.06 % 3.09 % 3.05 % 2.87 % 2.57 % 2.28 % 2.06 % 1.81 % 1.70 % 1.62 % 1.48 % 1.40 % 1.36 % 1.32 % 1.32 % 1.21 % 1.10 % 0.99 % 0.93 % 0.90 % % % % 10
12 ECC capital history Year Change 1991 Placing 1992 Placing 2000 Employee placing 2001 Employee placing 2002 Employee placing 2004 Bonus Issue 2005 Placing 2005 Employee placing 2005 Split 2005 Bonus Issue 2007 Dividend Issue 2007 Employee placing 2008 Dividend Issue 2008 Employee placing 2009 Bonus Issue 2010 Placing 2010 Employee placing 2011 Issue 2012 Placing 2012 Employee placing Change in ECC capital 2012 Private placement ,250, , , ,373 1 Total ECC capital ,009 1,009 1,262 1,447 1,736 2,373 2,468 2,484 6,000,000 6,053,099 40,391,268 50,489,085 53,752,203 1,349 53,976,003 1,440 2,597 No. of ECC's 6,099,432 6,148,060 7,685,075 9,859,317 10,097,817 57,603,748 57,861,806 69,434,167 94,397,474 94,905,286 94,930, ,407, ,218, ,836,443 11
13 2. Financial results 2.1. Main figures 4Q 3Q 2Q 1Q 4Q 31 Dec. (in NOK million) Net interest ,225 1,929 1,929 1,920 Commission income and other income ,005 1,674 1,674 1,545 Net return on financial investments Total income 1,374 1,287 1,202 1,126 1,146 4,989 4,547 4,547 3,924 Total operating expenses ,369 2,003 2,003 1,931 Result before losses ,621 2,544 2,544 1,993 Loss on loans, guarantees etc Result before tax ,279 2,029 2,029 1,824 Tax charge Results investments held for sale, after tax Net profit ,828 1,681 1,681 1,441 Balance sheet - condensed 31 Dec. 30 Sept. 30 Jun. 31 Mar. 31 Dec. 31 Dec. Balance (in NOK million) Total assets 153, , , , , ,145 Average total assets (quarterly) 150, , , , , ,745 Gross loans to customers * 148, , , , , ,583 Deposits from customers 76,476 73,086 75,559 70,176 67,168 67,031 Total equity capital 17,510 17,208 16,733 16,269 16,253 14,857 * Loans to customers includes SpareBank 1 Boligkreditt and SpareBank 1 Næringskreditt Key figures 4Q 3Q 2Q 1Q 4Q 31 Dec Return on equity 13.4 % 12.5 % 10.5 % 9.4 % 12.2 % 11.5 % 11.3 % 11.3 % 10.7 % Common Equity Tier 1 ratio 14.9 % 14.7 % 15.0 % 14.8 % 14.9 % 14.9 % 14.9 % 14.9 % 13.6 % Cost/income ratio group 45 % 46 % 50 % 51 % 43 % 47 % 44 % 44 % 50 % Growth in loans incl Boligkreditt and Næringskreditt last 12 months 8.2 % 9.4 % 8.5 % 8.1 % 8.0 % 8.2 % 8.0 % 8.0 % 5.8 % Growth in deposits last 12 months 13.9 % 10.3 % 12.7 % 9.9 % 4.8 % 13.9 % 4.8 % 4.8 % 5.6 % Deposits-to-loan ratio incl Boligkreditt and Næringskreditt last 12 months 51 % 50 % 53 % 50 % 49 % 51 % 49 % 49 % 50 % Impairment losses ratio 0.22 % 0.24 % 0.24 % 0.26 % 0.29 % 0.23 % 0.39 % 0.39 % 0.14 % Non-performing commitm. as % of gross loans 0.19 % 0.18 % 0.18 % 0.15 % 0.16 % 0.19 % 0.16 % 0.16 % 0.16 % ECC price Booked equity capital per ECC (incl. dividend) Adjusted profit per ECC
14 2.2. Net interest income Net interest income 4Q 3Q 2Q 1Q 4Q 31 Dec. (in NOK million) Interest income ,825 3,597 3,597 4,031 Interest expences ,600 1,668 1,668 2,111 Net interest income ,225 1,929 1,929 1,920 As percentage of total income 43 % 44 % 44 % 47 % 43 % 45 % 42 % 42 % 49 % Margins on loans sold to Sparebank 1 Boligkreditt and Sparebank 1 Næringskreditt are recorded as commision income. See part 2.3. Commision Income Development in net interest income % % % % 44.0 % 42.0 % 40.0 % % % % % 220 4Q16 1Q17 2Q17 3Q17 4Q17 Net interest income, NOK mill As percentage of total income 30.0 % Changes in interest income from lending and deposits, last 12 months (in NOK million) Volume Margin Total Lending Deposits Total
15 Changes in net interest income 31 Dec. (in NOK million) Change 2016 Net interest income 2, ,929 Equity capital 9 Lending volume 161 Fees on lending -8 Deposit margin -66 Subsidiaries 54 Deposit volume 6 Lending margin 163 Funding and liquidity buffer -23 Change ,225 1,929 Net Interest Income 31 Dec.2016 Lending margin Lending volume Subsidiaries Equity capital Deposit volume Fees on lending Funding and liquidity buffer Deposit margin Net interest income 31 Dec. 14
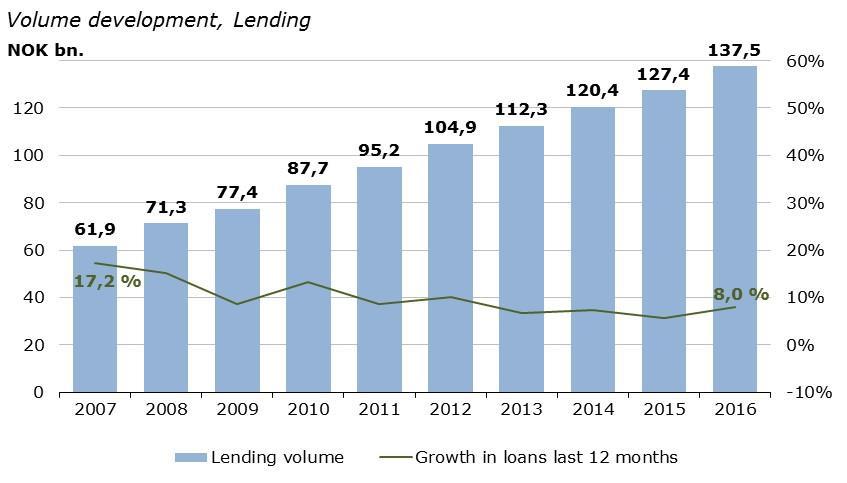
16 Margin development Definition margin: Average customer interest minus 3 months nibor Dec. 31 Mar. 30 Jun. 30 Sept. 31 Dec. Lending margin Deposits margin Volume development NOK bn % % % % 15% % 8.2 % 10% % % % 31 Dec. 31 Mar. 30 Jun. 30 Sept. 31 Dec. Lending volume Growth in loans last 12 months Deposits volume Growth in deposits last 12 months 15
 2016 2016 2016 2015 Guarantees 19 25 17 19 15 80 76 76 80 SpareBank 1 Boligkreditt 100 95 86 72 60 353 271 271 326 SpareBank 1 Næringskreditt 4 4 4 4 4 17 12 12 8 Commission of")

17 2.3. Commission income Total commission and other income 4Q 3Q 2Q 1Q 4Q 31 Dec. (in NOK million) Guarantees SpareBank 1 Boligkreditt SpareBank 1 Næringskreditt Commission of savings products Real estate agency Insurance Payments transmission Other Total commissions income ,390 1,251 1,251 1,245 Operating- and sales income real estate Accounting services Other operating income Total other operating income Commission expenses Total commissions and other income ,005 1,674 1,674 1,545 As percentage of total income 39 % 38 % 45 % 41 % 37 % 40 % 37 % 37 % 40 % Distribution of commission income Payments transmission 26 % Other 5 % Insurance 12 % Guarantees 6 % Real estate agency 16 % Commission of savings products 8 % SpareBank 1 Næringskreditt 1 % SpareBank 1 Boligkreditt 25 % 16
18 Change in commission and other income 31 Dec. (in NOK million) Change 2016 Total 2, ,674 Real estate agency -24 Other operating income 90 Operating- and sales income real estate -3 Accounting services 140 Insurance 13 Commission of savings products 41 Commission expenses -35 Other 10 Payments transmission 7 Guarantees 5 SpareBank 1 Boligkreditt 83 SpareBank 1 Næringskreditt 5 17
 2016 2016 2016 2015 Dividends 0 1 3 1 1 6 88 88 25 SpareBank 1 Gruppen 134 80 68 66 97 349 317 317 251 SpareBank 1 Boligkreditt -15 11-13 -24-26 -41-17 -17 80 SpareBank 1")

19 Net return on financial investments incl investments held for sale 4Q 3Q 2Q 1Q 4Q 31 Dec. (in NOK million) Dividends SpareBank 1 Gruppen SpareBank 1 Boligkreditt SpareBank 1 Næringskreditt BN Bank SpareBank 1 Kredittkort SpareBank 1 Mobilbetaling Other companies Income from investment in associates and joint v Capital gains shares Gain on derivatives Gain on other financial instruments at fair value (FVO) 7 26 Foreign exchange gain Gain on sertificates and bonds 58-2 Gain on shares and derivatives in SB1 Markets Gain on financial instruments related to hedging Net return on financial investments* Total net return on financial investments *New specification of net return on financial investments as of June, historical figures have not been prepared Change in net return on financial investments 31 Dec. (in NOK million) Change 2016 Total Dividends -82 Income from investment in related companies, incl. inv. held for sale 9 Capital gains shares -14 Gain on derivatives -131 Gain on other financial instruments at fair value (FVO) -19 Foreign exchange gain -6 Gain on sertificates and bonds 60 Gain on shares and derivatives in SB1 Markets 19 Gain on financial instruments related to hedging
20 2.4. Operating expenses Operating expenses 4Q 3Q 2Q 1Q 4Q 31 Dec. (in NOK million) Salary Pension costs (defined benefit plan) Employer's insurance contributions Other personnel expenses Total personnel expenses EDP and telecommunication expenses Postage and transportation services Marketing Operating exp. on properties and premises Other external services Other operating expenses Depr./write-downs of fixed & intangible assets Other expenses Total operating expenses ,369 2,003 2,003 1,931 Cost/income ratio 45 % 45 % 50 % 51 % 42 % 47 % 44 % 44 % 50 % Cost/income ratio ex financial inv. 55 % 56 % 56 % 58 % 53 % 56 % 56 % 56 % 57 % 12-month cost growth* 28.1 % 15.4 % 13.3 % 16.8 % -6.4 % 18.3 % 0.8 % 3.7 % 8.1 % * SpareBank 1 Regnskapshuset SMN's acquisition of a large accounting firm 1 January affects the 12 month cost growth in. The 12 month cost growth in 2016 is affected by the consolidation of SpareBank 1 Markets as a subsidiary Change in operating expenses 31 Dec. (in NOK million) Change 2016 Total 2, ,003 Total personnel expenses 267 Depr./write-downs of fixed & intangible assets 36 EDP and telecommunication expenses 14 Other operating expenses 31 Operating exp. on properties and premises 4 Other external services 9 Marketing 6 Postage and transportation services -0 19
21 Cost/income ratio NOK mill. 1,400 1,200 1,146 1,126 1,202 1,287 1, % 1, % % 45 % % 0 4Q16 1Q17 2Q17 3Q17 4Q17 Income Expenses Cost/income ratio * * Total operating expences as a percentage of total operating income 40 % Employees in employment 1,192 1,208 1, , , Q Parent bank EiendomsMegler 1 Midt-Norge AS SpareBank 1 Markets SpareBank 1 Regnskapshuset SMN AS SpareBank 1 Finans Midt-Norge AS Other SpareBank 1 Markets has been a subsidiary of SpareBank 1 SMN since 1 April SpareBank 1 SMN s capital market activities, including 32 FTEs, were transferred to SpareBank 1 Markets as part of the transaction. 20

 2016 2015 Agriculture/ forestry/ fisheries/ hunting 11,606 11,486 11,213 10,679 10,499 9,357 Fish farming 1,697 1,745 1,708 1,700 1,985 2,044 Manufacturing and mining 3,157 3,560")
22 3. Loans to customers 3.1. Distribution of loans by industry Distribution of loans by industry 31 Dec. 30 Sept. 30 Jun. 31 Mar. 31 Dec. 31 Dec. (in NOK million) Agriculture/ forestry/ fisheries/ hunting 11,606 11,486 11,213 10,679 10,499 9,357 Fish farming 1,697 1,745 1,708 1,700 1,985 2,044 Manufacturing and mining 3,157 3,560 3,415 3,113 2,985 2,823 Construction, power and water supply 3,419 3,341 4,018 3,335 3,532 3,432 Retail trade, hotels and restaurants 2,700 2,546 1,589 2,735 2,510 2,591 Maritime sector 4,639 4,678 4,532 4,863 4,983 5,407 Commercial Real Estate 14,348 14,867 14,749 14,115 13,744 14,110 Business services 2,260 2,216 2,230 2,100 2,072 2,119 Transport and other services provision 4,322 4,332 4,142 3,840 3,836 3,829 Public administration Other sectors 1,699 1,796 1,819 1,924 1,700 1,512 Gross loans in corporate market 50,087 50,794 49,698 48,696 48,133 47,411 Retail customers 98,697 96,352 94,101 91,343 89,402 85,171 Gross loans incl. Boligkr. and Næringskr. 148, , , , , ,583 - Adv. of this Boligkreditt 34,885 34,196 34,181 33,757 33,142 32,952 - Adv. of this Næringskreditt 1,828 2,255 2,261 2,164 2,069 1,841 Gross loans in balance sheet 112, , , , ,325 97,790 Share of loans, corporate market 34 % 35 % 35 % 35 % 35 % 36 % Share of loans, retail market 66 % 65 % 65 % 65 % 65 % 64 % Distribution of loans by industry Retail customers 66 % Agriculture/ forestry/ fisheries/ hunting 8 % Fish farming 1 % Other sectors 1 % Transport and other services provision 3 % Commercial Business Real Estate services 10 % 2 % Maritime sector 3 % Manufacturing and mining 2 % Construction, power and water supply 2 % Retail trade, hotels and restaurants 2 % 21
23 3.2. Risk profile and write-downs Actual risk profile, Exposure At Default NOK billion A B C D E F G H I J K Actual risk profile, Exposure At Default Per cent % 4.8 % 23.3 % % 22.3 % % 4Q17 4Q % 7.5 % 7.4 % 6.2 % 6.4 % 5.8 % 4.7 % 4.1 % % 1.8 % % % 0.8 % 0.1 % 0.1 % 1.2 % A B C D E F G H I J K 22
24 Risk classification in SpareBank 1 SMN Risk class Low High A AAA - A3 B Baa1 - Baa2 C Baa3 D Ba1 E Ba2 F G Ba2 - B1 H B1 - B2 I B3 - caa3 J Default K Written down Risk class A represents the lowest risk and class K the highest risk. * Probability of default PD* in percent Corresponding ratingclass at Moody's Write-downs on loans and guarantees 4Q 3Q 2Q 1Q 4Q 31 Dec. (in NOK million) Increase in and new individual write-downs Reassessments and recoveries Total individual write-downs Change in group write-downs on loans Write-downs on loans and guarantees As % of gross loans incl. Boligkreditt 0.22 % 0.24 % 0.24 % 0.26 % 0.29 % 0.23 % 0.39 % 0.39 % 0.14 % Loss on loans by segment 4Q 3Q 2Q 1Q 4Q 31 Dec. (in NOK million) Retail Corporate * SMN Finans and other Collective write downs * Total loss on loans * The change in collective write downs is mainly related to the Corporate portfolio and includes reversal NOK -55m in 4Q 2016, NOK -25m in 3Q 2016 (in connection with higher individual write-downs in 4q16 and 3q16) 23
25 Individual and collective write-downs 4Q 3Q 2Q 1Q 4Q (in NOK million) Individual write-downs to cover loss on loans, guarantees at start of period Write downs of loans previously subject to individual write down Reversal of previous years' write downs Increase in write downs of commitments not previously subject to individual write down Dec. Confirmed losses in the period on loans, guarantees etc., prev. subject to ind. write down Individual write downs to cover loss Collective write downs to cover loss on loans, guarantees at start of period Period s collective write down to cover loss on loans, guarantees etc Collective write downs to cover loss on loans, guarantees Loans and guarantees by industry Total Very low risk Wage earners 99,369 84,828 9,335 3, Public administration 1,063 1, Agriculture and forestry 12,355 7,550 2,912 1, Sea farming industries 2,263 1, Manufacturing 4, , Construction, power and water supply 4,444 1,162 1,060 1, Retail trade, hotels and restaurants 3, ,235 1, Maritime sector Property management 15,322 8,746 2,330 3, Business services 4, , Transport and other services provision 9,643 2,850 3,786 1, ,118 Finance Other sectors 7,652 6, Q17 164, ,961 23,842 16,258 3,394 2,480 1, , ,123 21,643 18,875 2,766 1,702 1, ,680 97,588 25,632 19,231 3,838 1, Low risk Medium risk High risk Very high risk Default and written down Write-down ratio 31 Dec. 30 Sept. 30 Jun. 31 Mar. 31 Dec. 31 Dec. (in NOK million) Non-performing commitments (gross) Impaired commitments (gross) 1,184 1,215 1,151 1,078 1, Gross non-performing and impaired commitments 1,468 1,478 1,409 1,289 1, Individual write-downs Collective write-downs Write-down ratio (%) 76.1 % 71.2 % 69.3 % 71.3 % 57.9 % 92.5 % 24
26 Default in excess of 90 days NOK million Q 1Q 2Q 3Q 4Q Retail > 90 d Default in excess of 90 days NOK million Q 1Q 2Q 3Q 4Q Corporates* > 90 d 25
27 3.3. Capital adequacy SpareBank 1 SMN utilises the Internal Rating Based Approach (IRB) for credit risk. Use of IRB imposes wide-ranging requirements on the bank s organisational set-up, competence, risk models and risk management systems. As from 31 March 2015 the bank has received permission to apply the Advanced IRB Approach to those corporate portfolios that were previously reported under the Basic Indicator Approach. As of 31 December the capital conservation buffer requirement is 2.5 per cent, the systemic risk requirement is 3.0 per cent and the Norwegian countercyclical buffer is 2.0 per cent. These requirements are additional to the requirement of 4.5 per cent CET1 capital, so that the overall minimum requirement on CET1 capital is 12.0 per cent. In addition the financial supervisory authority has set a Pillar 2 requirement of 2.1 per cent for SpareBank 1 SMN, effective as from the fourth quarter of The total minimum requirement on CET1 capital is accordingly 14.1 per cent. The countercyclical buffer increased from 1.5 per cent to 2.0 per cent with effect from 31 December. SpareBank 1 SMN has in fourth quarter reclassified two additional Tier 1 capital bonds from liabilities to equity, and the comparable figures has been restated. For further details, see note 1. As from the fourth quarter of 2016 differentiated rates came into force for the countercyclical buffer. For exposures in other countries the countercyclical buffer rate set by the authorities in the country concerned is applied. If that country has not set a rate, the same rate as for exposures in Norway is applied unless the Ministry of Finance sets another rate. For the fourth quarter of the parent bank is below the capital deduction threshold such that the Norwegian rate is applied to all relevant exposures. For groups, the risk-weighted countercyclical capital buffer is 2.0 per cent. Parts of the group s hybrid capital and subordinated debt were issued under earlier rules. This will be subject to a write-down of 40 per cent in 2016 and 50 per cent in. The write-down will increase by another 10 per cent per year thereafter. As at 31 Desember the bank held hybrid capital worth NOK 450 million subject to write-down. For subordinated debt the figure NOK 659 million. SpareBank 1 SMN's methods for calculating the minimum regulatory capital requirements are summarized below: Methods for calculating minimum requirements Type of risk Portfolio Regulatory method Credit risk States - parent bank Standardized approach Institutions - parent bank Standardized approach Housing cooperatives, clubs and associations - parent bank Standardized approach Enterprises - parent bank Advanced IRB approach Mass market - parent bank IRB - mass market (advanced) SpareBank 1 Finans Midt-Norge AS Standardized approach SpareBank 1 SMN Invest Standardized approach SpareBank 1 Allegro Kapitalforvaltning AS Standardized approach Mass market - SpareBank 1 Boligkreditt AS IRB- mass market (advanced) Enterprises - SpareBank 1 Næringskreditt AS Standardized approach Enterprises - BN Bank AS Advanced IRB approach Mass market - BN Bank AS IRB - mass market (advanced) Market risk Equity risk - parent bank Standardized approach Debt risk - parent bank Standardized approach Currency risk - parent bank Standardized approach Subsidiaries and part-ow ned companies Standardized approach Operational risk SpareBank 1 SMN (parent bank) Standardized approach Subsidiaries and part-ow ned companies Basic Indicator Approach 26
28 Capital Adequacy 31 Dec. 30 Sept. 30 Jun. 31 Mar. 31 Dec. 31 Dec. (in NOK million) Total book equity 17,510 17,208 16,733 16,269 16,253 14,857 Hybrid capital included in total equity ,216-1,218-1, Deferred taxes, goodwill and other intangible assets Part of reserve for unrealised gains, associated companies Deduction for allocated dividends and gifts Non-controlling interests recognised in other equity capital Non-controlling interests eligible for inclusion in CET1 capital Surplus financing of pension obligations Net profit 0-1, Year-to-date profit included in core capital (50 per cent pre tax of group profit in ) Value adjustments due to requirements for prudent valuation Positive value of adjusted expected loss under IRB Approach Adjustments for unrealised losses (gains) arising from the institution's own credit risk related to derivative liabilities (DVA) Direct, indirect and synthetic investments in financial sector companies Total common equity Tier one 13,938 13,990 13,806 13,437 13,233 12,196 Hybrid capital, core capital 1,427 1,358 1,358 1,358 1,358 1,301 Hybrid capital covered by transitional provisions Total core capital 15,824 15,807 15,622 15,254 15,073 13,992 Supplementary capital in excess of core capital Subordinated capital 1,615 1,979 1,710 1,710 1,698 1,647 Subordinated capital covered by transitional provisions Deduction for significant investments in financial institutions Total supplementary capital 1,922 2,286 2,026 2,034 2,116 2,390 Net subordinated capital 17,746 18,093 17,649 17,288 17,189 16,381 27
29 Minimum requirements subordinated capital 31 Dec. 30 Sept. 30 Jun. 31 Mar. 31 Dec. 31 Dec. (in NOK million) Specialised enterprises 1,107 1,177 1,232 1,186 1,206 1,213 Corporate 1,113 1,054 1,045 1,126 1,102 1,105 Mass market exposure, property 1,892 1,763 1,759 1,769 1,753 1,709 Other mass market Equity investments, IRB Total credit risk IRB 4,205 4,084 4,131 4,173 4,153 4,082 Central government Covered bonds Institutions Local and regional authorities, state-owned enterprises Corporate Mass market Exposures secured on real property Equity positions Other assets Total credit risk standardised approach 1,820 1,870 1,942 1,891 1,772 1,805 Debt risk Equity risk Currency risk Operational risk Credit value adjustment risk (CVA) Transitional arrangements Minimum requirements subordinated capital 7,478 7,595 7,376 7,268 7,103 7,157 Risk Weighted Assets (RWA) 93,474 94,938 92,202 90,845 88,786 89,465 Minimum requirement on CET1 capital, 4.5 per cent 4,206 4,272 4,149 4,088 3,995 4,026 Capital conservation buffer, 2,5 per cent 2,337 2,373 2,305 2,271 2,220 2,237 Systemic risk buffer, 3.0 per cent 2,804 2,848 2,766 2,725 2,664 2,684 Countercyclical buffer, 2.0 per cent (1.5 per cent) 1,869 1,424 1,383 1,363 1, Available CET1 capital after buffer requirements 2,721 3,072 3,203 2,990 3,022 2,355 Common equity Tier one ratio 14.9 % 14.7 % 15.0 % 14.8 % 14.9 % 13.6 % Core capital ratio 16.9 % 16.6 % 16.9 % 16.8 % 17.0 % 15.6 % Capital adequacy ratio 19.0 % 19.1 % 19.1 % 19.0 % 19.4 % 18.3 % Leverage ratio Balance sheet items 210, , , , , ,616 Off-balance sheet items 9,295 9,506 9,400 9,292 10,068 12,017 Regulatory adjustments -1,580-1,301-1,190-1,346-1,388-1,487 Calculation basis for leverage ratio 218, , , , , ,145 Core capital 15,824 15,807 15,622 15,254 15,073 13,992 Leverage Ratio 7.2 % 7.5 % 7.2 % 7.4 % 7.4 % 6.7 % 28
30 Capital Adequacy 19.4 % 19.0 % 19.1 % 19.1 % 19.0 % 17.0 % 16.8 % 16.9 % 16.6 % 16.9 % 14.9 % 14.8 % 15.0 % 14.7 % 14.9 % Dec. 31 Mar. 30 Jun. 30 Sept. 31 Dec. Capital adequacy ratio Core capital ratio Common equity Tier one ratio 29


31 Quarterly change in Common equity Tier 1 Quarterly change in Minimum requirements subordinated capital 30
32 4. Funding Funding maturity dates NOK bill > Funding maturity dates over the next eight quarters NOK bill Q1 18 Q2 18 Q3 18 Q4 18 Q1 19 Q2 19 Q3 19 Q

 2016 2015 NOK Bonds 13,683 13,178 13,601 13,753 14,237 14,645 Curr Bonds 28,334 24,793 26,011 26,037 21,908 23,429 NOK CD's - - - - - - Curr CD's 177 120")
33 Capital markets funding 31 Dec. 30 Sept. 30 Jun. 31 Mar. 31 Dec. 31 Dec. (in NOK million) NOK Bonds 13,683 13,178 13,601 13,753 14,237 14,645 Curr Bonds 28,334 24,793 26,011 26,037 21,908 23,429 NOK CD's Curr CD's Interbank 9,046 8,663 9,261 6,598 10,299 10,212 Perp. Sub. Loan capital Hybrid equity 475 1,428 1,429 1,431 1,433 1,443 Subordinated loan capital 1,684 2,033 1,712 1,729 1,707 1,793 Other liabilities 3,997 5,478 4,410 5,193 4,487 6,556 Total 57,396 55,692 56,487 54,852 54,242 58,441 Curr CD's 0 % Curr Bonds 49 % Interbank 16 % Hybrid equity 1 % Subordinated loan capital 3 % Other liabilities 7 % NOK Bonds 24 % 32
34 5. Financial results Financial results (in NOK million) 4Q 3Q 2Q 1Q 4Q 31 Dec Interest income ,825 3,597 3,597 4,031 Interest expenses ,600 1,668 1,668 2,111 Net interest ,225 1,929 1,929 1,920 Commission income ,390 1,251 1,251 1,245 Commission expenses Other operating income Commission income and other income ,005 1,674 1,674 1,545 Dividends Income from investment in related companies Net return on financial investments Net return on financial investments Total income 1,374 1,287 1,202 1,126 1,146 4,989 4,547 4,547 3,924 Staff costs ,426 1,159 1,159 1,093 Other operating expenses Total operating expenses ,369 2,003 2,003 1,931 Result before losses ,621 2,544 2,544 1,993 Loss on loans, guarantees etc Result before tax ,279 2,029 2,029 1,824 Tax charge Results investments held for sale, after tax Net profit ,828 1,681 1,681 1,441 Majority share ,763 1,606 1,606 1,410 Minority interest
35 Balance sheet (in NOK million) 31 Dec. 30 Sept. 30 Jun. 31 Mar. 31 Dec. 31 Dec Cash and receivables from central banks 3,313 1,351 2,448 1, ,270 Deposits with and loans to credit institutions 4,214 2,310 4,997 3,008 3,892 2,407 Net loans to and receivables from customers 110, , , , ,354 93,415 Fixed-income CDs and bonds at fair value 19,736 17,908 20,312 18,704 17,557 15,752 Derivatives 4,351 4,262 4,673 4,701 4,752 7,524 Shares, units and other equity interests 1,825 1,607 1,475 1,676 1,542 1,485 Investment in related companies 5,760 5,820 5,633 5,974 5,638 5,522 Investments held for sale Intangible assets Other assets 1,654 3,256 2,780 2,903 2,376 1,962 Assets 153, , , , , ,914 Deposits from credit institutions 9,607 9,484 9,521 6,959 10,509 8,155 Deposits from and debt to customers 76,476 73,086 75,559 70,176 67,168 64,090 Debt created by issue of securities 42,194 38,091 39,674 39,901 36,317 35,154 Derivatives 3,343 3,679 3,761 3,509 4,074 5,414 Other liabilities 1,923 2,816 1,970 2,979 1,531 1,734 Investments held for sale Subordinated loan capital 2,201 2,549 2,231 2,249 2,228 2,509 Total liabilities 135, , , , , ,056 Equity capital certificate 2,597 2,597 2,597 2,597 2,597 2,597 Own holding of ECCs Premium fund Dividend equalisation fund 5,072 4,477 4,482 4,470 4,487 3,790 Recommended dividends Provision for gifts Ownerless capital 4,831 4,498 4,498 4,498 4,499 4,106 Unrealised gains reserve Other equity capital 1,547 1,895 1,906 1,925 1,656 1,597 Hybrid capital Result of the period 0 1, Minority interests Total equity capital 17,510 17,208 16,733 16,269 16,253 14,857 Total liabilities and equity 153, , , , , ,914 34
36 Key figures 4Q 3Q 2Q 1Q 4Q 31 Dec Return on equity 13.4 % 12.5 % 10.5 % 9.4 % 12.2 % 11.5 % 11.3 % 11.3 % 10.7 % Cost/income ratio group 45 % 45 % 50 % 51 % 42 % 47 % 44 % 44 % 50 % Cost/income ratio group, ex. financial inv. 55 % 56 % 56 % 58 % 53 % 56 % 56 % 56 % 57 % 12-month cost growth 28.1 % 20.7 % 18.6 % 16.8 % -1.4 % 18.3 % 0.8 % 3.7 % 7.9 % Gross loans to customers* 148, , , , , , , , ,378 Growth in loans last 12 months* 8.2 % 9.4 % 8.5 % 8.1 % 8.0 % 8.2 % 8.0 % 8.0 % 5.8 % Growth in loans this period* 1.1 % 2.3 % 2.7 % 1.8 % 2.3 % 8.2 % 8.0 % 8.0 % 5.8 % Deposits from customers 76,476 73,086 75,559 70,176 67,168 76,476 67,168 67,168 64,090 Growth in deposits last 12 months 13.9 % 10.3 % 12.7 % 9.9 % 4.8 % 13.9 % 4.8 % 4.8 % 5.6 % Growth in deposits this period 4.6 % -3.3 % 7.7 % 4.5 % 1.3 % 13.9 % 4.8 % 4.8 % 5.6 % Deposit-to-loan ratio* 51 % 50 % 53 % 50 % 49 % 51 % 49 % 49 % 50 % Total assets 153, , , , , , , , ,914 Average total assets (quarterly) 150, , , , , , , , ,355 Employees in employment group 1,403 1,415 1,408 1,362 1,254 1,403 1,254 1,254 1,208 Employees in employment parent bank Employees in employment subsidiares Number of branches Lending margin Deposit margin Net other operating income of total income 39 % 38 % 45 % 41 % 37 % 40 % 37 % 37 % 40 % Common Equity Tier 1 ratio 14.9 % 14.7 % 15.0 % 14.8 % 14.9 % 14.9 % 14.9 % 14.9 % 13.6 % Core capital ratio 16.9 % 16.6 % 16.9 % 16.8 % 17.0 % 16.9 % 17.0 % 17.0 % 15.6 % Capital adequacy ratio 19.0 % 19.1 % 19.1 % 19.0 % 19.4 % 19.0 % 19.4 % 19.4 % 18.3 % Total core capital 15,824 15,807 15,622 15,254 15,073 15,824 15,073 15,073 13,988 Net subordinated capital 17,746 18,093 17,649 17,288 17,189 17,746 17,189 17,189 16,378 Liquidity Coverage Ratio (LCR) (%) 164 % 124 % 160 % 136 % 129 % 164 % 129 % 129 % 118 % Leverage ratio 7.2 % 7.5 % 7.2 % 7.4 % 7.4 % 7.2 % 7.4 % 7.4 % 6.7 % Impairment losses ratio 0.22 % 0.24 % 0.24 % 0.26 % 0.28 % 0.23 % 0.39 % 0.39 % 0.14 % Non-performing commitm. as % of gross loans 0.19 % 0.18 % 0.18 % 0.15 % 0.16 % 0.19 % 0.16 % 0.16 % 0.16 % Other doubtfull commitm. as % of gross loans 0.80 % 0.83 % 0.80 % 0.77 % 1.07 % 0.80 % 1.07 % 1.07 % 0.31 % ECC price Number of certificates issued, millions Booked equity capital per ECC (incl. dividend) Adjusted profit per ECC P/E per ECC P/B equity capital
37 6. Segment Information For the subsidiaries the figures refer to the respective company accounts, while for joint ventures incorporated by the equity method the Group s profit share is stated, after tax, as well as book value of the investment at group level Extract from income statement Group (in NOK million) 31 Dec. Retail Market Corporate Market SB 1 Markets Eiendoms- Megler 1 Midt-Norge SB 1 Finans Midt-Norge SB 1 Regnskapshuset SMN SB 1 Gruppen BN Bank Uncollated Total Net interest ,225 Allocated Total interest income 1,137 1, ,225 Commission income and other income ,005 Net profit on financial investments Total income 1,926 1, ,988 Total operating expenses ,369 Ordinary operating profit 1, ,619 Loss on loans, guarantees etc Result before tax incl investments held for sale 1, ,278 Post-tax return on equity* 16.6 % 10.5 % 11.5 % Balance sheet Loans and advances to customers 103,131 39, , ,784 adv. of this to Boligkreditt and Næringskreditt -35,047-1, ,713 Individual allowance for impairment on loan Group allowance for impairment on loan Other assets 168 4,141 2, ,569 1,149 32,070 42,295 Total assets 68,141 41,010 2, , ,569 1,149 31, ,254 Deposits to customers 37,182 38, ,476 Other liabilities and equity 30,959 2,290 2, , ,569 1,149 30,909 76,778 Total liabilites 68,141 41,010 2, , ,569 1,149 31, ,254 *) Calculation of capital employed in Retail Banking and Corporate Banking is based on regulatory capital. This capital is grossed up to 15.0 (14.5) percent to be in line with the capital plan. 36


38 Income specified by segment, excluding financial investments SpareBank 1 Markets 7 % Eiendoms- Megler 1 Midt-Norge 10 % SB 1 Finans Midt- Norge 6 % SB 1 Regnskapshuset SMN 6 % Corporate Market 30 % Retail Market 40 % 37
39 Interest income, Retail Market and Corporate Market 4Q 3Q 2Q 1Q 4Q 31 Dec. (in NOK million) Retail Corporate Net interest income ,971 1,866 1,866 1,829 Developement in margin, Retail Market and Corporate Market 4Q 3Q 2Q 1Q 4Q 31 Dec. Lending (in percentage) Retail Corporate Total Q 3Q 2Q 1Q 4Q 31 Dec. Deposits (in percentage) Retail Corporate Total *Definition margin: Average customer interest minus 3 months average nibor Development in volume, Retail Market and Corporate Market 4Q 3Q 2Q 1Q 4Q 31 Dec. Lending* (in NOK million) Retail 103, ,745 98,262 95,482 93, ,131 93,757 93,757 84,981 Corporate 39,482 40,419 39,895 39,421 38,938 39,482 38,938 38,938 37,226 Total 142, , , , , , , , ,206 * Gross loans to customers includes SpareBank 1 Boligkreditt and SpareBank 1 Næringskreditt 4Q 3Q 2Q 1Q 4Q 31 Dec. Deposits (in NOK million) Retail 37,182 36,974 37,437 34,943 34,856 37,182 34,856 34,856 33,534 Corporate 38,719 36,275 37,669 35,778 32,401 38,719 32,401 32,401 30,367 Total 75,902 73,249 75,106 70,721 67,257 75,902 67,257 67,257 63,902 Developement in commision income, Retail Market and Corporate Market 4Q 3Q 2Q 1Q 4Q 31 Dec. (in NOK million) Retail Corporate Total
40 6.2. Retail Market Business description 31 Dec. 31 Dec. Facts about the business area 2016 Lending volume 103,131 93,757 Deposits volume 37,182 34,856 No. of active customers 217, ,478 FTEs Financial performance 4Q 3Q 2Q 1Q 4Q 31 Dec. (in NOK million) Net interest income lending Net interest income deposits Net interest income allocated capital Total interest income , Net guarantee commision, incl. BK, NK Net commision of savings products Net commision insurance services Net commision payment trans. services Other commision income Net fee and commission income Net profit on financial investments Total income ,926 1,631 1,631 1,663 Total operating expences* Results , Loss on loans, guarantees etc Results before tax , Post-tax return on equity (annualized)** 16.6 % 13.8 % 13.8 % 15.8 % *) Includes both direct and distributed expences **) Calculation of capital employed in Retail Banking and Corporate Banking is based on regulatory capital. This capital is grossed up to 15.0 (14.5) percent to be in line with the capital plan. 39
41 Development in margin Definition margin: Average customer interest minus 3 months nibor Q 1Q 2Q 3Q 4Q Lending margin Retail Deposits margin Retail Development in lending volume NOK bill Q 1Q 2Q 3Q 4Q Development in deposits volume NOK bill Q 1Q 2Q 3Q 4Q 40
42 6.3. Corporate Business description 31 Dec. 31 Dec. Facts about the business area 2016 Lending volume 39,482 Deposits volume 38,719 No. of active customers 14,516 FTEs 147 Financial performance 4Q 3Q 2Q 1Q 4Q 31 Dec. (in NOK million) Net interest income lending Net interest income deposits Net interest income allocated capital Total interest income ,108 1,000 1, Net guarantee commision, incl. BK, NK Net commision of savings products Net commision insurance services Net commision payment trans. services Other commision income Net fee and commission income Net profit on financial investments Total income ,315 1,205 1,205 1,164 Total operating expences* Results Loss on loans, guarantees etc Results before tax Post-tax return on equity (annualized)** 10.5 % 6.9 % 6.9 % 12.4 % *) Includes both direct and distributed expences **) Calculation of capital employed in Retail Banking and Corporate Banking is based on regulatory capital. This capital is grossed up to 15.0 (14.5) percent to be in line with the capital plan. 41
43 Development in margin Definition margin: Average customer interest minus 3 months nibor Q 1Q 2Q 3Q 4Q Lending margin Corporates Deposit margin Corporates Development in lending volume NOK bill Q 1Q 2Q 3Q 4Q Development in deposits volume NOK bill Q 1Q 2Q 3Q 4Q 42
44 6.4. Subsidiaries EiendomsMegler 1 Midt-Norge AS EiendomsMegler 1 Midt-Norge is a real estate agency, and has a solid market-leader position in the region. The company has specialized operations, which include separate units for project and commercial real estate broking. In addition, the company, in cooperation with BN Bank, has established BN Bolig in which EiendomsMegler 1 Midt-Norge and BN Bank each hold a 50 per cent stake. As of 1Q EiendomsMegler 1 Midt-Norge fully consolidates BN Bolig s results as a subsidiary. The company is owned by SpareBank 1 SMN (87 per cent), SpareBank 1 Nordvest (7.6 per cent) and SpareBank 1 Søre Sunnmøre (5.4 per cent). Financial performance 4Q 3Q 2Q 1Q 4Q 31 Dec. (in NOK million) Net interest Commission income and other income Total income Total operating expenses Result before tax Cost and income (NOK mill.) Result before tax (NOK mill.) Q 1Q 2Q 3Q 4Q Total operating expenses Total income Result before tax 43
45 SpareBank 1 Finans Midt-Norge AS SpareBank 1 Finans Midt- Norge offers car loans and leasing to corporates and private individuals. The company services the market through its own sales operation and through the Bank s offices and other partners. The company is owned by SpareBank 1 SMN (64.6 per cent), Samarbeidende Sparebanker (27.9 per cent) and SpareBanken Sogn og Fjordane (7.5 per cent). With Samarbeidende Sparebanker as a co-owner, the company has a presence in ten different counties dispersed across Mid- and South Norway. Financial performance 4Q 3Q 2Q 1Q 4Q 31 Dec. (in NOK million) Total interest income Commission income and other income Total income Total operating expenses Ordinary operating profit Loss on loans, guarantees etc Result before tax Cost and income (NOK mill.) Result before tax (NOK mill.) Q 1Q 2Q 3Q 4Q Total income Result before tax 44
46 SpareBank 1 Regnskapshuset SMN AS SpareBank 1 Regnskapshuset SMN is an accountancy business within the SMB segment. SpareBank 1 Regnskapshuset intends to be one of Norway s leading actors in the accounting industry by building up a national accounting enterprise based on regional ownership, strong links to the owner banks and closeness to the market. The strategy of growth through acquisitions represents a consolidation of a fragmented accounting industry. SpareBank 1 Regnskapshuset SMN acquired all shares of one large accounting firm with effect from 1 January, leading to a substantial increase in both income and costs. In 2016 three accounting firms and one IT company was acquired. The company is owned by SpareBank 1 SMN (95.4 per cent) and SpareBank 1 Søre Sunnmøre (4.6 per cent). Financial performance 4Q 3Q 2Q 1Q 4Q 31 Dec. (in NOK million) Total interest income Commission income and other income Total income Total operating expenses Result before tax Cost and income (NOK mill.) Q Q 105 2Q 3Q Result before tax (NOK mill.) 4Q Total operating expenses Total income Result before tax 45
47 SpareBank 1 Markets SpareBank 1 Markets AS is a Norwegian investment bank within the SpareBank 1 Alliance. The company provides research, financial advice, capital raising and stockbroking services, debt and fixed income products. Through the collaboration with the SpareBank 1 Alliance, SpareBank 1 Markets can offer a complete national capital structure service, and cover all customer segments, from retail clients and small and medium-sized businesses to large listed companies and institutional investors. The company is headquartered in Oslo and has offices in Trondheim and Ålesund. SpareBank 1 Markets acquired Allegro Kapitalforvaltning in Trondheim and SpareBank 1 Nord-Norge Forvaltning in Tromsø from SpareBank 1 SMN and SpareBank 1 Nord-Norge respectively in 2 nd quarter. The acquired companies are merged and will spearhead SpareBank 1 Markets asset management business. The new business unit has combined AUM of 10 NOK billion. In the fourth quarter the company acquired the trading desk at SpareBank 1 SR-Bank Markets. SpareBank 1 SR-Bank became co-owner of the company as a result of the transaction. SpareBank 1 Markets is owned by SpareBank 1 SMN (66.7 per cent), SpareBank 1 Nord-Norge (12.2 per cent), SamSpar (9.4 percent), SpareBank 1 Østlandet (5.8 percent), SpareBank 1 SR-Bank (5.6 percent) and others (0.3 percent). Financial performance 4Q 3Q 2Q 1Q 4Q 31 Dec. (in NOK million) Net interest Equities / High Yield Fixed Income Corporate Foreign exchange/ interest rate deriv Asset Management Other commission income Total income Total operating expences Result Loss on loans, guarantees etc Result before tax Cost and income (NOK mill.) Result before tax (NOK mill.) Q 1Q 2Q 3Q Total operating expenses Total income Result before tax 4Q 46
48 Other subsidiaries SpareBank 1 Bilplan: The company delivers car fleet management solutions to the public and private sectors nationwide. The company services the market through its own sales operation and through cooperation with SpareBank 1 Finans Midt-Norge, SpareBank 1 SR- Finans, SpareBank 1 Finans Nord-Norge and through the Bank s office network. SpareBank 1 Invest: The company s strategy is to carry out investments in regional start-ups, venture and private equity funds and to invest directly in growth companies with national/ international market potential in the same market area. Property companies: Their mission is to own, operate and develop property. Property companies: SpareBank 1 SMN Kvartalet, SpareBank 1 Bygget Steinkjer, St Olavs Plass 1 SMN, Jernbanegata 19 SMN, SpareBank 1 Bygget Trondheim, Bjerkeløkkja. 47
49 7. Development last ten years Financial results (in NOK million) Net interest 1,139 1,350 1,325 1,317 1,392 1,477 1,616 1,790 1,872 1,883 Commission income and other income ,139 1,463 1,512 1,545 1,674 Net return on financial investments Total income 2,142 2,167 2,677 2,582 2,746 3,067 3,580 4,021 3,876 4,502 Staff costs ,002 1,093 1,159 Other operating expenses Total operating expenses 1,102 1,194 1,253 1,140 1,482 1,654 1,722 1,789 1,931 2,003 Result before losses 1, ,424 1,441 1,264 1,414 1,859 2,232 1,945 2,499 Loss on loans, guarantees etc Result before tax 1, ,147 1,309 1,236 1,355 1,758 2,143 1,776 1,983 Tax charge Results investments held for sale, after tax (1) 4 Net profit ,022 1,024 1,077 1,400 1,782 1,406 1,647 Balance sheet (in NOK million) Cash and loans to and claims on credit institutions 3,878 4,548 1,260 2,532 4,075 4,091 5,984 5,965 5,677 4,207 CDs, bonds and other interest-bearing securities 7,246 12,036 19,302 22,948 21,485 25,614 26,358 27,891 30,282 29,489 Gross loans to customers before write-downs 59,178 64,016 61,782 69,847 73,105 74,943 80,548 90,578 93, ,325 - Specified write-downs Write-downs by loan category Other assets 1,502 4,540 2,704 3,182 3,252 3,766 2,938 2,080 2,540 3,030 Assets 71,503 84,679 84,541 97, , , , , , ,080 Deposits from credit institutions 5,346 9,000 11,310 13,062 9,118 7,410 6,581 9,123 8,155 10,509 Deposits from and debt to customers 32,434 35,280 37,227 42,786 47,871 52,252 55,927 60,680 64,090 67,168 Debt created by issue of securities 23,950 29,680 24,070 29,625 31,306 33,121 36,806 39,254 40,569 40,390 Other liabilities 2,265 2,045 1,876 1,922 2,122 2,070 1,485 1,095 1,734 1,532 Subordinated loan capital 2,648 3,156 3,875 2,758 2,690 3,040 3,319 3,371 3,463 3,182 Total equity capital 4,860 5,518 6,183 7,846 8,348 10,082 11,242 12,524 13,904 15,299 Total liabilities and equity 71,503 84,679 84,541 97, , , , , , ,080 Historical numbers are not adjusted for the reclassification of hybrid capital 48
50 Key figures Return on equity 18.9 % 11.9 % 16.2 % 14.6 % 12.8 % 11.7 % 13.3 % 15.1 % 10.7 % 11.3 % Cost/income ratio group 51.7 % 55.0 % 46.8 % 44.2 % 54.0 % 53.9 % 48.1 % 44.5 % 49.8 % 44.5 % Cost/income ratio group, ex. financial inv % 60.2 % 52.5 % 52.5 % 64.1 % 63.2 % 55.9 % 54.2 % 56.5 % 56.3 % Cost/income ratio parent bank 52.4 % 55.3 % 47.2 % 40.2 % 50.5 % 47.5 % 40.2 % 40.5 % 38.0 % 31.9 % 12-month cost growth 11.8 % 7.9 % 4.9 % -9.0 % 30.0 % 11.6 % 4.1 % 3.9 % 7.9 % 3.7 % Gross loans to customers* 61,910 71,317 77,429 87,665 95, , , , , ,535 Gross loans in retail market 38,872 42,679 45,157 49,619 55,034 62,587 68,591 74,087 80,725 89,402 Gross loans in corporate market 23,038 28,638 32,272 38,046 40,198 42,322 43,692 46,348 46,653 48,133 Growth in loans last 12 months* 17.2 % 15.2 % 8.6 % 13.2 % 8.6 % 10.2 % 6.8 % 7.3 % 5.8 % 8.0 % Deposits from customers 32,434 35,280 37,227 42,786 47,871 52,252 55,927 60,680 64,090 67,168 Deposits from retail market 16,070 17,566 17,898 19,052 20,860 22,279 23,891 26,496 28,336 29,769 Deposits from corporate market 16,363 17,715 19,330 23,734 27,011 29,973 32,036 34,184 35,754 37,398 Growth in deposits last 12 months 7.6 % 8.8 % 5.5 % 14.9 % 11.9 % 9.2 % 7.3 % 8.5 % 5.6 % 4.8 % Deposit-to-loan ratio* 52.4 % 49.5 % 48.1 % 48.8 % 50.3 % 49.8 % 49.8 % 50.4 % 50.3 % 48.8 % Total assets 71,503 84,679 84,541 97, , , , , , ,080 Average total assets 67,202 75,820 86,679 91,317 98, , , , , ,060 Employees in employment group ,016 1,035 1,098 1,135 1,159 1,192 1,208 1,254 Employees in employment parent bank Employees in employment subsidiares Net other operating income of total income 31.3 % 28.2 % 28.2 % 33.1 % 33.5 % 37.1 % 40.8 % 38.0 % 40 % 37 % Common Equity Tier 1 ratio 7.4 % 7.1 % 7.7 % 9.3 % 8.9 % 10.0 % 11.1 % 11.2 % 13.6 % 14.9 % Capital adequacy ratio 12.1 % 11.9 % 13.6 % 13.0 % 12.0 % 13.3 % 14.7 % 15.7 % 18.3 % 19.4 % Core capital ratio 8.4 % 8.1 % 10.4 % 10.9 % 10.4 % 11.3 % 13.0 % 13.0 % 15.6 % 17.0 % Total core capital 4,019 4,967 6,730 7,283 7,856 9,357 10,989 12,382 13,988 15,069 Net subordinated capital 5,762 7,312 8,730 8,646 9,055 10,943 12,417 14,937 16,378 17,185 Impairment losses ratio % 0.21 % 0.31 % 0.16 % 0.03 % 0.06 % 0.09 % 0.08 % 0.14 % 0.39 % Non-perf. commitm. as % of gross loans 0.39 % 0.46 % 0.49 % 0.57 % 0.36 % 0.36 % 0.34 % 0.22 % 0.16 % 0.16 % Other doubtfull commitm. as % of gross loans 0.37 % 1.33 % 0.57 % 0.24 % 0.21 % 0.14 % 0.14 % 0.18 % 0.31 % 1.07 % * Gross loans to customers includes SpareBank 1 Boligkreditt and SpareBank 1 Næringskreditt Historical numbers are not adjusted for the reclassification of hybrid capital 49


51 Historical numbers are not adjusted for the reclassification of hybrid capital 50


52 Historical numbers are not adjusted for the reclassification of hybrid capital 51

53 52

54 Historical numbers are not adjusted for the reclassification of hybrid capital 53

55 54

56 55

57 56
Investor Relations. Supplementary information Fourth Quarter 2016
 Investor Relations Supplementary information Fourth Quarter CEO Finn Haugan For further information, please contact Kjell Fordal, CFO kjell.fordal@smn.no +47 905 41 672 Address SpareBank 1 SMN, Postboks
Investor Relations. Supplementary information Second Quarter 2018
 Investor Relations Supplementary information Second Quarter 2018 CEO Finn Haugan For further information, please contact Kjell Fordal, CFO kjell.fordal@smn.no +47 905 41 672 Address SpareBank 1 SMN, Postboks
Investor Relations. Supplementary information First Quarter 2018
 Investor Relations Supplementary information First Quarter 2018 CEO Finn Haugan For further information, please contact Kjell Fordal, CFO kjell.fordal@smn.no +47 905 41 672 Address SpareBank 1 SMN, Postboks
Investor Relations. Supplementary information Third Quarter 2015
 Investor Relations Supplementary information Third Quarter Chief Executive, CEO Finn Haugan For further information, please contact Kjell Fordal, Executive Director Finance kjell.fordal@smn.no +47 905
Investor Relations. Supplementary information Fourth Quarter 2014
 Investor Relations Supplementary information Fourth Quarter SpareBank 1 SMN 7467 Trondheim Chief Executive, CEO Finn Haugan For further information, please contact Kjell Fordal, Executive Director Finance
Investor Relations. Supplementary information Second Quarter 2013
 Investor Relations Supplementary information Second Quarter SpareBank 1 SMN 7467 Trondheim Chief Executive, CEO Finn Haugan For further information, please contact Kjell Fordal, Executive Director Finance
Investor Relations. Supplementary information Fourth Quarter 2012
 Investor Relations Supplementary information Fourth Quarter SpareBank 1 SMN 7467 Trondheim Chief Executive, CEO Finn Haugan For further information, please contact Kjell Fordal, Executive Director Finance
SpareBank 1 SMN 7467 Trondheim
 SpareBank 1 SMN 7467 Trondheim Chief Executive, CEO Finn Haugan For further information, please contact Kjell Fordal, Executive Director Finance Division tel +47 905 41 672 Switchboard tel +47 07300 Information
Contents. 2nd quarter 2013
 Contents Main figures... 3 Report of the Board of Directors... 5 Income statement... 18 Balance sheet... 20 Cash flow statement... 21 Change in equity... 22 Equity capital certificate ratio... 24 Results
1st quarter May 2018
 4. May 2018 SpareBank 1 SMN, the region s most important financial institution SpareBank 1 SMN History 219,000 retail customers Established in 1823 14,800 corporate customers Sparebanken Midt-Norge since
Contents. 1st Quarter 2017
 Contents Main figures... 3 Report of the Board of Directors... 5 Income statement... 18 Balance sheet... 20 Cash flow statement... 21 Change in equity... 22 Notes... 25 Equity capital certificate ratio...
1st half August 2018
 8. August 2018 SpareBank 1 SMN, the region s most important financial institution SpareBank 1 SMN History 221,000 retail customers Established in 1823 14,800 corporate customers Sparebanken Midt-Norge
Contents. 1st Quarter 2018
 Contents Main figures... 3 Report of the Board of Directors... 5 Income statement... 18 Balance sheet... 20 Cash flow statement... 21 Change in equity... 22 Notes... 25 Results from quarterly accounts...
Contents. 4th Quarter 2015
 Contents Main figures... 3 Report of the Board of Directors... 4 Income statement... 18 Balance sheet... 20 Cash flow statement... 21 Change in equity... 22 Equity capital cetificate ratio... 25 Results
Report of the Board of Directors
 Report of the Board of Directors Preliminary annual accounts 2017 (Consolidated figures. Figures in parenthesis refer to the same period of 2016 unless otherwise stated) As from the fourth quarter of 2017
Notes. Contents. 3rd Quarter 2012
 3rd Quarter Notes Contents Note 1 - Accounting principles... 2 Note 2 - Critical estimates and assessment concerning the use of accounting principles... 3 Note 3 - Account by business line... 4 Note 4
Interim Report. Interim Report Q NOTES TO THE ACCOUNTS 1
 Interim Report Interim Report Q3 2015 NOTES TO THE ACCOUNTS 1 Contents 3 Main figures 4 8 Interim report 9 Income statement 10 Balance sheet 11 Changes in equity capital 12 Cash flow statement 13 Results
SpareBank 1 SR-Bank Group Unaudited 1
 SpareBank 1 SR-Bank Group Unaudited 1 Interim Financial Statements Q1 2017 Key figures... 3 Report of the Board of Directors... 4 Income Statement... 15 Balance Sheet... 16 Statement of Changes in Equity...
Contents. 1st Quarter 2012
 Contents Main figures... 3 Report of the Board of Directors... 5 Income statement... 16 Balance sheet... 18 Cash flow statement... 19 Change in equity... 20 Equity capital certificate ratio... 23 Results
SpareBank 1 SR-Bank ASA 3rd quarter 2014
 SpareBank 1 SR-Bank ASA 3rd quarter 2014 Page 1 Disclaimer This presentation contains forward-looking statements that reflect management s current views with respect to certain future events and potential
Report of the Board of Directors
 Report of the Board of Directors Accounts for first nine months 2017 (Consolidated figures. Figures in parenthesis refer to the same period of 2016 unless otherwise stated) Pre-tax profit: NOK 1,568m (1,430m)
Fourth quarter February 2018
 Fourth quarter 2017 7. February 2018 SpareBank 1 SMN, the region s most important financial institution SpareBank 1 SMN History 218,000 retail customers Established in 1823 14,500 corporate customers Sparebanken
3rd quarter October 2018
 3rd quarter 2018 26. October 2018 SpareBank 1 SMN, the region s most important financial institution SpareBank 1 SMN History 222,450 retail customers Established in 1823 14,980 corporate customers Sparebanken
Financial result. First quarter 2016 April 28th 2016
 Financial result First quarter 2016 April 28th 2016 Highlights financial report first quarter 2016 Satisfactory Return on Equity - Return on equity was 7.6 per cent. - Return on equity adjusted for securities
unaudited interim report 1 quarter
 unaudited interim report 1 quarter 2015 Financial highlights - Group Income statement Q1 2015 Q1 2014 2014 NOK million In percentage NOK million In percentage NOK million In percentage Net interest income
The leading financial group in the southwest of Norway
 FOURTH QUARTER 2015 Disclaimer This presentation contains forward-looking statements that reflect management s current views with respect to certain future events and potential financial performance. Although
Quarterly report. Interim report Q NOTES TO THE ACCOUNTS 1
 Quarterly report Interim report Q4 2016 NOTES TO THE ACCOUNTS 1 Content 3 Main figures 4 10 Interim report 11 Income statement 12 Balance sheet 13 Changes in equity capital 15 Cash flow statement 16-17
The leading financial group in the southwest of Norway
 SECOND QUARTER 2016 Disclaimer This presentation contains forward-looking statements that reflect management s current views with respect to certain future events and potential financial performance. Although
Quarterly report. Interim report. First Quarter 2017 NOTES TO THE ACCOUNTS
 Quarterly report Interim report First Quarter 2017 1 Content 3 Main figures 4 9 Interim report 10 Income statement 11 Balance sheet 12 Changes in equity capital 14 Cash flow statement 15 Quarterly accounts
SpareBank 1 SR-Bank ASA. 3rd quarter st November Page 1
 SpareBank 1 SR-Bank ASA 3rd quarter 2012 1st November 2012 Page 1 Disclaimer This presentation contains forward-looking statements that reflect management s current views with respect to certain future
Interim Financial Statements Q3 2018
 Interim Financial Statements Q3 2018 Key figures... 3 Report of the Board of Directors... 4 Income Statement... 17 Balance Sheet... 18 Statement of Changes in Equity... 19 Cash Flow Statement... 20 Notes
The leading financial group in the southwest of Norway
 Disclaimer This presentation contains forward-looking statements that reflect management s current views with respect to certain future events and potential financial performance. Although SpareBank 1
unaudited interim report 2 quarter 2016
 unaudited interim report 2 quarter 2016 Financial highlights - Group Income statement Q2 2016 Q2 2015 30.06.2016 30.06.2015 2015 NOK million % NOK million % NOK million % NOK million % NOK million % Net
Sparebanken Hedmark. 1st Half Year 2013 Presentation of financial results. CEO Richard Heiberg. 14 August 2013
 Sparebanken Hedmark 1st Half Year 2013 Presentation of financial results CEO Richard Heiberg 14 August 2013 Apendix I. Highlights first half year Page 4 II. Income statement Page 5 III. Balance Sheet and
Annual report Financial results
 Financial results 1 of 124 Report of the Board of Directors Macroeconomic conditions World economy International growth picked up somewhat in 2013, but remains at moderate levels. In the US, hefty public
Third quarter The Sparebanken Vest Group. Managing Director Stein Klakegg 27 October 2010
 Third quarter 2010 The Sparebanken Vest Group Managing Director Stein Klakegg 27 October 2010 1 Improved profit performance - increased market shares for deposits and lendings Growth in nominal net interest
Second quarter report 2018
 Second quarter report 2018 SPAREBANK 1 ØSTLANDET Plastdugnaden - a large-scale voluntary plastic cleanup on waterways with funding from SpareBank 1 Østlandet and Sparebankstiftelsen Hedmark. Content Key
SpareBank 1 Nord-Norge
 SpareBank 1 Nord-Norge Preliminary annual report and accounts 2008 The Group Satisfactory result for the fourth quarter when taking the global financial crisis into consideration. The underlying banking
HALF-YEAR REPORT 2014
 HALF-YEAR REPORT 2014 Contents First half year 2014 3 4 6 7 8 9 10 11 12 22 Main figures Quarterly report Income Statement Balance sheet Changes in equity capital Cash flow statement Results from the quarterly
First quarter report 2018
 First quarter report 2018 SPAREBANK 1 ØSTLANDET First bank in Norway to pay customer dividends Content Key figures Group... 2 Income statement... 9 Balance sheet... 10 Changes in equity capital... 11 Cash
First quarter 2011 SpareBank 1 SR-Bank konsern
 First quarter 2011 SpareBank 1 SR-Bank konsern Page 1 Good quarterly results Q1 2011 Profit before tax: NOK 336 million (NOK 395 million) Return on equity after tax: 11.2% (14.8%) Earnings per equity certificate:
Chief Executive, CEO. Arne Austreid. For further information, please contact
 Chief Executive, CEO Arne Austreid For further information, please contact Inge Reinertsen, Chief Financial Officer inge.reinertsen@sr-bank.no +47 909 95 033 Vidar Torsøe, VP Investor Relations vidar.torsoe@sr-bank.no
Fourth quarter report 2017 SPAREBANK 1 ØSTLANDET
 Fourth quarter report 2017 SPAREBANK 1 ØSTLANDET Content Key figures Group... 2 Report of the Board of Directors... 3 Income statement... 10 Balance sheet... 11 Changes in equity capital... 12 Cash Flow
Sparebanken Hedmark. Q Presentation of financial results. CEO Richard Heiberg. 1 November 2013
 Sparebanken Hedmark Q3-213 Presentation of financial results CEO Richard Heiberg 1 November 213 About Sparebanken Hedmark Sparebanken Hedmark is the leading provider of financial products to people, companies
Company presentation. Third quarter October Norway s fastest growing region is our home market
 Company presentation Third quarter 2018 26 October 2018 - Norway s fastest growing region is our home market Summary Good profitability and continued strong lending growth Summary third quarter 2018 High
interim report 2 quarter not audited
 interim report 2 quarter not audited 13 2 2nd QUARTER 2013 Contents 3 Financial highlights 4 Interim report from the Board of Directors The Accounts 7 Statement of income 8 Balance Sheet 9 Statement of
Financial result. Fourth quarter
 Financial result Fourth quarter 2015 05.02.2016 Highlights financial report fourth quarter 2015 Satisfactory return on Equity Solvency further strengthened Improved interest margin and high financial income
Introduction to SpareBank 1 SR-Bank ASA
 Disclaimer This presentation contains forward-looking statements that reflect management s current views with respect to certain future events and potential financial performance. Although SpareBank 1
Second quarter 2004 (Unaudited)
") Investor Relations Supplementary Information for Investors and Analysts Second quarter 2004 (Unaudited) Chief Executive Officer Svein Aaser For further information, please contact Tom Grøndahl, Chief Financial
Investor Relations Supplementary Information for Investors and Analysts Second quarter 2004 (Unaudited) Chief Executive Officer Svein Aaser For further information, please contact Tom Grøndahl, Chief Financial
INVESTOR UPDATE FIRST QUARTER 2017
 INVESTOR UPDATE FIRST QUARTER 2017 Disclaimer This presentation contains forward-looking statements that reflect management s current views with respect to certain future events and potential financial
Q3 RESULTS DNB GROUP THIRD QUARTER Roadshow London, Edinburgh and Dublin
 Q3 RESULTS DNB GROUP THIRD QUARTER 2015 Roadshow London, Edinburgh and Dublin 22.10.2015 Third quarter 2015 Pre-tax operating profit before impairment in NOK billion 8.1 (7.6) Cost/income ratio in per
BN Bank ASA INTERIM REPORT Q3 2015
 BN Bank ASA INTERIM REPORT Q3 2015 Content Financial Ratios... 3 Report from the Board of Directors... 4 GROUP Income Statement... 8 Balance Sheet... 9 Change in Equity...10 Cash Flow Analysis...11 Notes...12
DNB Group FACT BOOK. Second quarter 2013 (UNAUDITED) - ADJUSTED ACCORDING TO NEW CUSTOMER SEGMENTS -
 - ADJUSTED ACCORDING TO NEW CUSTOMER SEGMENTS -") 2 DNB Group FACT BOOK Second quarter 2013 (UNAUDITED) - ADJUSTED ACCORDING TO NEW CUSTOMER SEGMENTS - Chapter 1 - Financial results DNB Group 0 Group business structure and financial governance 0.1 Legal
2 DNB Group FACT BOOK Second quarter 2013 (UNAUDITED) - ADJUSTED ACCORDING TO NEW CUSTOMER SEGMENTS - Chapter 1 - Financial results DNB Group 0 Group business structure and financial governance 0.1 Legal
Company presentation. Fourth quarter February 2018
 Company presentation Fourth quarter 2018 8 February 2018 Companies in the Hedmark county are top notch in Europe in social media utilization. Tretopphyttene AS in Ringsaker gives social media much of the
BN Bank ASA INTERIM REPORT 2ND QUARTER 2014
 BN Bank ASA INTERIM REPORT 2ND QUARTER 2014 Content Financial Ratios... 3 Report from the Board of Directors... 4 Income Statement... 8 Balance Sheet... 9 Change in Equity...10 Cash Flow Analysis...11
Interim Report 2 nd quarter 2010 Nordea Bank Norge Group
 Interim Report 2 nd quarter 200 Nordea Bank Norge Group Nordea Bank Norge is part of the Nordea Group. Nordea s vision is to be a Great European bank, acknowledged for its people, creating superior value
Annual report Financial results
 Financial results 1 of 124 Report of the Board of Directors Macroeconomic conditions World economy The world economy is still marked by the debt crisis in the eurozone. Demand for goods and services is
Pillar III. Capital Adequacy and Risk Management Report
 Pillar III 2013 Capital Adequacy and Risk Management Report Contents Contents... 2 1. Introduction... 4 2. Important events and lessons in 2013... 4 3. Organisation, internal control and management model...
Næringskreditt 2nd Quarterly Report 2015
 Næringskreditt 2 nd Quarterly Report 2015 Contents Financial Statements as of the 2 nd quarter 2015 Report of the Board of Directors...3 Statement of the Board and the CEO...7 Income Statement... 8 Statement
Investor presentation February Geir-Egil Bolstad Cathrine Mordal Runar Hauge CFO Head of treasury Portfolio manager/ir
 Investor presentation February 2018 Geir-Egil Bolstad Cathrine Mordal Runar Hauge CFO Head of treasury Portfolio manager/ir Executive summary SpareBank 1 Østlandet Norway s fourth largest savings bank
DNB Group SUPPLEMENTARY INFORMATION FOR INVESTORS AND ANALYSTS (PRELIMINARY AND UNAUDITED)
") 4 DNB Group SUPPLEMENTARY INFORMATION FOR INVESTORS AND ANALYSTS Fourth quarter 2012 (PRELIMINARY AND UNAUDITED) Group Chief Executive Rune Bjerke For further information, please contact Bjørn Erik Næss,
4 DNB Group SUPPLEMENTARY INFORMATION FOR INVESTORS AND ANALYSTS Fourth quarter 2012 (PRELIMINARY AND UNAUDITED) Group Chief Executive Rune Bjerke For further information, please contact Bjørn Erik Næss,
Quarterly Report Fourth quarter 2011
 4. quarter 2011 Quarterly Report Fourth quarter 2011 Norwegian and international economy In spite of the weak performance in Europe, global growth is estimated to be around 3 per cent in 2011. There has
Half Year Report 2009
 Half Year Report 2009 SpareBank 1 Nord-Norge Group Board of Directors Report/Operating Report Half year accounts Statement from Board of Directors and Chief Executive Officer Group Information 1/22 SpareBank
Chart 1.1 Risk premiums 1 on European and US corporate bonds. Basis points. 1 January October 2017
 Chart 1.1 Risk premiums 1 on European and US corporate bonds. Basis points. 1 January 26 27 October 217 2 4 2 1 6 Investment grade corporations US Investment grade corporations Europe High-yield corporations
DNB GROUP FACT BOOK. First quarter 2015 (Unaudited) Released 30 April 2015
 Released 30 April 2015") Q1 DNB GROUP FACT BOOK First quarter 2015 (Unaudited) Released 30 April 2015 FACT BOOK DNB - 1Q15 Contact information Group Chief Executive Rune Bjerke For further information, please contact Bjørn Erik
Q1 DNB GROUP FACT BOOK First quarter 2015 (Unaudited) Released 30 April 2015 FACT BOOK DNB - 1Q15 Contact information Group Chief Executive Rune Bjerke For further information, please contact Bjørn Erik
Interim Report 2 nd quarter 2015 Nordea Eiendomskreditt AS
 Interim Report 2 nd quarter 205 Nordea Eiendomskreditt AS Nordea Eiendomskreditt AS is part of the Nordea group. Nordea s vision is to be a Great European bank, acknowledged for its people, creating superior
Second quarter and first half-year Sparebanken Vest Group. CEO Stein Klakegg 19 August 2010
 Second quarter and first half-year 2010 Sparebanken Vest Group CEO Stein Klakegg 19 August 2010 1 Western Norway's leading finance company Committed and independent bank for individuals and businesses
Pilar III. Financial information
 Pilar III 2015 Financial information Contents 1. Introduction... 4 2. Important events in 2015... 4 3 Changes in framework conditions... 5 Part 1: Risk and capital management... 9 4 Capital adequacy...
Interim Report 2 nd quarter 2007 Nordea Bank Norge Group
 Interim Report 2 nd quarter 2007 Nordea Bank Norge Group Nordea Bank Norge is part of the Nordea Group. Nordea s vision is to be perceived as the leading Nordic bank, acknowledged for its people, creating
INTERIM REPORT FOR THE 3RD QUARTER
 2018 INTERIM REPORT FOR THE 3RD QUARTER SPAREBANK 1 BV NO 944 521 836 TEL. +45 915 02480 BUSINESS IDEA, VISION/VALUES AND GOALS Business idea Business areas SpareBank 1 BV aims to contribute to value creation
Sandnes Sparebank. 4 th Quarter Results 2016 Oslo, 15 February 2016
 Sandnes Sparebank 4 th Quarter Results 2016 Oslo, 15 February 2016 Contents About Sandnes Sparebank Macro Economic Conditions Financial Highlights Loan Portfolio Overview Capital, Liquidity and Funding
Shareholder information
 SHAREHOLDER INFORMATION Index 107 07: Shareholder information Share price development in 2010 NOK 65 60 55 50 45 40 35 30 25 Jan. Feb. Mar. Apr. May Jun. Jul. Aug. Sept. Oct. Nov. Dec. Hydro Oslo Børs
Investor Relations. Supplementary Information for Investors and Analysts 2009 Third Quarter Results adjusted version. (Unaudited)
") Investor Relations Supplementary Information for Investors and Analysts 2009 Third Quarter Results adjusted version (Unaudited) Group Chief Executive Rune Bjerke For further information, please contact
Investor Relations Supplementary Information for Investors and Analysts 2009 Third Quarter Results adjusted version (Unaudited) Group Chief Executive Rune Bjerke For further information, please contact
Quarterly Report. Financial statement Q
 Quarterly Report Financial statement Q4 2017 www.snn.no Index Key figures group...... 1 Key figures ECC...... 2 Quarterly report... 3 Statement of income.... 15 Statement of financial position 16 Changes
QUARTER 3 (UNAUDITED)
") QUARTER 3 2016 (UNAUDITED) 2 Contents Key figures Group 3 Report from the Board of Directors 4 Income statement 11 Balance sheet 12 Cash flow statement 13 Equity statement 14 Notes 15 Risk and Capital
QUARTER 3 2016 (UNAUDITED) 2 Contents Key figures Group 3 Report from the Board of Directors 4 Income statement 11 Balance sheet 12 Cash flow statement 13 Equity statement 14 Notes 15 Risk and Capital
Interim report for the second quarter and first half of 2012 Unaudited. Terra BoligKreditt AS
 Interim report for the second quarter and first half of 2012 Unaudited Terra BoligKreditt AS Key figures Interim report for the second quarter and first half of 2012 The company had a pre-tax profit of
Third quarter (Unaudited) Skandiabanken Boligkreditt AS
 Skandiabanken Boligkreditt AS") Q3 Third quarter 2017 (Unaudited) Skandiabanken Boligkreditt AS Key figures In NOK thousand Reference Jan- Sep 17 Jan- Sep 16 2016 Summary of income statement Net interest income 136 708 93 957 121 141
Q3 Third quarter 2017 (Unaudited) Skandiabanken Boligkreditt AS Key figures In NOK thousand Reference Jan- Sep 17 Jan- Sep 16 2016 Summary of income statement Net interest income 136 708 93 957 121 141
Capital efficiency and cost control. Bjørn Erik Næss, CFO
 Capital efficiency and cost control Bjørn Erik Næss, CFO 4 Capital efficiency and cost control Adequately capitalised Strict cost control Strong funding position 2 Macro parameters Norway - key assumptions
Interim Report 2 nd quarter 2013 Nordea Eiendomskreditt AS
 Interim Report 2 nd quarter 2013 Nordea Eiendomskreditt AS Nordea Eiendomskreditt AS is part of the Nordea Group. Nordea s vision is to be a Great European bank, acknowledged for its people, creating superior
Financial results. First Quarter April 2018
 Financial results First Quarter 2018 27 April 2018 Solid performance in first quarter 2018 First customer dividend has been paid We teach parents and children digital economy Innovative focus on digital
DNB BOLIGKREDITT AS. a company in the DNB Group. Second quarter and first half report 2014 (Unaudited)
") Q2 DNB BOLIGKREDITT AS a company in the DNB Group Second quarter and first half report 2014 (Unaudited) Key figures Statement of comprehensive income 2nd quarter 2nd quarter 1st half 1st half Full year
Q2 DNB BOLIGKREDITT AS a company in the DNB Group Second quarter and first half report 2014 (Unaudited) Key figures Statement of comprehensive income 2nd quarter 2nd quarter 1st half 1st half Full year
1st quarter th April Arne Austreid, Chief Executive Officer Inge Reinertsen, Chief Financial Officer
 SpareBank 1 SR-Bank Group 1st quarter 2011 28th April 2010 Arne Austreid, Chief Executive Officer Inge Reinertsen, Chief Financial Officer Creating values for more than 170 years 1839 1849 1859 1869 1879
Pillar III Gjensidige Bank Holding AS Gjensidige Bank Holding Group
 Pillar III 2014 Gjensidige Bank Holding AS Gjensidige Bank Holding Group Contents 1. Introduction 3 2. Capital adequacy regulations 3 2.1 The introduction of CRD IV 4 2.1.1 Liquidity requirements 4 2.1.2
feeling NORWAY 3rd quarterly report 2012 SpareBank 1 Boligkreditt AS
 feeling NORWAY 3rd quarterly report 2012 SpareBank 1 Boligkreditt AS feeling NORWAY fig 1 Natural Gas Power Even though Norway has several natural gas based power stations they produce relatively small
Investor Relations. Supplementary Information for Investors and Analysts 2007 Second Quarter Results. (Unaudited)
") Investor Relations Supplementary Information for Investors and Analysts 2007 Second Quarter Results (Unaudited) Group Chief Executive Rune Bjerke For further information, please contact Tom Grøndahl, Deputy
Investor Relations Supplementary Information for Investors and Analysts 2007 Second Quarter Results (Unaudited) Group Chief Executive Rune Bjerke For further information, please contact Tom Grøndahl, Deputy
RESULTS DNB GROUP FOURTH QUARTER 2015
 Q4 RESULTS DNB GROUP FOURTH QUARTER Rune Bjerke (CEO) Bjørn Erik Næss (CFO) 04.02.2016 Full year Pre-tax operating profit before impairment in NOK billion 34.1 (28.7) Cost/income ratio in per cent 36.9
Financial stability 2/11. Charts
 Financial stability /11 Charts External sources of risk to banking sector Vulnerability in banking sector Chart 1.1 Vulnerabilities in the Norwegian banking sector and external sources of risk to the banking
Shareholder information
 SHAREHOLDER INFORMATION Index 89 06: Shareholder information Share price development in 2009 NOK NOK 60 50 40 30 20 10 0 Jan. Feb. Mar. Apr. May Jun. Jul. Aug. Sept. Oct. Nov. Dec. Introduction p.90 Dividend
Interim report. Storebrand Bank ASA
 Interim report Storebrand Bank ASA 3 rd quarter 2013 Storebrand Bank Group - Quarterly report for the third quarter of 2013 (Profit figures for the corresponding period in 2012 are shown in parentheses.
1 Introduction 3. 2 Capital adequacy Capital adequacy regulations 4
 2016 PILLAR 3 2 Contents 1 Introduction 3 2 Capital adequacy 4 2.1 Capital adequacy regulations 4 2.1.1 Pillar 1 Minimum capital requirements 4 2.1.2 Pillar 2 - Internal Capital Adequacy Accessment Process
Shareholder information
 SHAREHOLDER INFORMATION Index 115 05: Shareholder information Share price development in 2011 NOK 55 50 45 40 35 30 25 20 Jan. Feb. Mar. Apr. May Jun. Jul. Aug. Sept. Oct. Nov. Dec. Introduction p.116
RESULTS DNB GROUP 1ST QUARTER Rune Bjerke (CEO) Bjørn Erik Næss (CFO)
 Bjørn Erik Næss (CFO)") Q1 RESULTS DNB GROUP 1ST QUARTER 2015 Rune Bjerke (CEO) Bjørn Erik Næss (CFO) First quarter 2015 Pre-tax operating profit before impairment in NOK billion 9.3 (7.4) Cost/income ratio in per cent 37.0 (41.3)
Q1 RESULTS DNB GROUP 1ST QUARTER 2015 Rune Bjerke (CEO) Bjørn Erik Næss (CFO) First quarter 2015 Pre-tax operating profit before impairment in NOK billion 9.3 (7.4) Cost/income ratio in per cent 37.0 (41.3)
Boligkreditt 1st Quarterly Report 2018
 Boligkreditt 1st Quarterly Report 2018 Table of contents Report of the Board of Directors... 4 Cover pool and outstanding covered bonds... 4 Key figures... 4 Key developments... 4 Nature and development
Third quarter (Unaudited) Sbanken Boligkreditt AS
 Sbanken Boligkreditt AS") Q3 Third quarter 2018 (Unaudited) Sbanken Boligkreditt AS Key figures In NOK thousand Reference Jan - Sep 18 Jan - Sep 17 2017 Summary of income statement Net interest income 187 849 136 708 206 181 Net
Q3 Third quarter 2018 (Unaudited) Sbanken Boligkreditt AS Key figures In NOK thousand Reference Jan - Sep 18 Jan - Sep 17 2017 Summary of income statement Net interest income 187 849 136 708 206 181 Net
Sparebanken Vest Report for the third quarter 2010
 Sparebanken Vest - tredje kvartal 2010 Sparebanken Vest Report for the third quarter 2010 Key developments Improved profit performance and greater market shares for deposits and lendings Growth in nominal
Second quarter DNB Group Results. Rune Bjerke (CEO) Kjerstin Braathen (CFO) 12 July 2018
 Kjerstin Braathen (CFO) 12 July 2018") Q2 Second quarter 2018 DNB Group Results Rune Bjerke (CEO) Kjerstin Braathen (CFO) 12 July 2018 Approaching ROE >12 per cent Return on equity Per cent, 12-month trailing average 11.6 Return on equity 11.8
Q2 Second quarter 2018 DNB Group Results Rune Bjerke (CEO) Kjerstin Braathen (CFO) 12 July 2018 Approaching ROE >12 per cent Return on equity Per cent, 12-month trailing average 11.6 Return on equity 11.8
3 rd quarter result presentation. 1 November 2017
 3 rd quarter result presentation 1 November 2017 Disclaimer This Presentation from Easybank ASA ("Easybank" or the "Company") includes among other things forward-looking statements. Certain such forward-looking
REPORT FOR THE FIRST HALF OF Terra BoligKreditt AS
 REPORT FOR THE FIRST HALF OF 2009 Terra BoligKreditt AS Key figures First half-year 2009 Operating profit before tax of NOK 28.8 million for the first half-year, against negative operating profit before
RESULTS DNB GROUP SECOND QUARTER 2015 AS OF 10 JULY 2015 INVESTOR MEETINGS ZÜRICH & GENÈVE. Terje Turnes (CRO) Jan Erik Gjerland (IR)
 Jan Erik Gjerland (IR)") Q2 RESULTS DNB GROUP SECOND QUARTER 2015 AS OF 10 JULY 2015 INVESTOR MEETINGS ZÜRICH & GENÈVE Terje Turnes (CRO) Jan Erik Gjerland (IR) Second quarter 2015 Pre-tax operating profit before impairment in
Q2 RESULTS DNB GROUP SECOND QUARTER 2015 AS OF 10 JULY 2015 INVESTOR MEETINGS ZÜRICH & GENÈVE Terje Turnes (CRO) Jan Erik Gjerland (IR) Second quarter 2015 Pre-tax operating profit before impairment in
Basel II - Pilar 3 Public disclosure of central risk information. SpareBank 1 SR-Bank 2008
 Basel II - Pilar 3 Public disclosure of central risk information SpareBank 1 SR-Bank 2008 2 SpareBank 1 SR-Bank TABLE OF CONTENTS 1. BASEL II NEW CAPITAL ADEQUACY REQUIREMENTS 4 1.1 INTRODUCTION TO NEW