Indiana State University Financial Report Message from the President Letter of Transmittal Independent Auditor s Report...
|
|
|
- Sabrina Hancock
- 5 years ago
- Views:
Transcription


1
2

3 Table of Contents Indiana State University Financial Report Message from the President... 3 Letter of Transmittal... 5 Independent Auditor s Report... 6 Management s Discussion and Analysis... 9 Indiana State University: Statement of Net Position Statement of Revenues, Expenses, and Changes in Net Position Statement of Cash Flows Indiana State University Foundation, Inc. Consolidated Statements of Financial Position Consolidated Statements of Activities Consolidated Statements of Cash Flows Notes to Financial Statements Required Supplementary Information Home Counties of Indiana State University Students Board of Trustees and University Administration... 60

4 2

5 Message from the President Greetings on behalf of the Trustees, Faculty, Administration and Students of Indiana State University: The year saw a change in presidential leadership for Indiana State University. In April 2017, Dr. Daniel J. Bradley announced his intention to retire as president at the end of the calendar year, completing nine plus years of highly effective leadership. Dr. Bradley oversaw a period of historic enrollments, academic program development in high-demand fields, unprecedented construction, national recognition for community engagement, and significant improvements in degree production and graduation rates. I have the honor of being selected to serve as the 12th president of Indiana State, and I began my duties in January. This has been a true homecoming for me as I earned my Ph.D. from Indiana State which facilitated my move from K-12 education to higher education. I was attracted to this role because of the distinctive mission Indiana State serves among Indiana s public higher education institutions. We work hard to provide a quality education that is affordable. This is especially important as around half of our entering students are Pell-eligible with an equal percentage being the first in their families who will earn a college degree. The majority of students we serve are from Indiana but we also attract students from across the country and around the world, and are proud to be one of the most diverse campuses in Indiana. We are nearing the midpoint of our There s More to Blue strategic plan which runs through To keep the plan dynamic, we fine-tune it each year, a process we have just completed. Our top priority remains improving student success with a special focus on degree completion. Earning that degree is the key factor to transforming our students lives. Going into the state s biennial budget cycle for , Indiana State is pleased to have positive numbers in every category of the state s performancebased funding formula. From to , the period measured for this cycle, Indiana State experienced a 34 percent increase in degree completion and a 41 percent increase in degrees conferred to Pell-eligible (at-risk) students. We also saw our on-time graduation rate increase by 8.6 percentage points for Hoosier students while the rate for all students has grown by 9.3 percentage points in the past three years. Persistence success rates, which measure the completion of 30, 60 and 90 credits hours, grew by 10 to 14 percentage points. Enrollment has grown by 25 percent in the past ten years, and we are in the midst of developing a strategic enrollment management plan to address the changing demographics of traditional college aged students along with the needs of the adult population that has some college but no degree. The plan will integrate undergraduate, graduate, on-campus, online and international recruitment and marketing activities with academic programs as well as retention and graduation strategies. As we pivot to a more strategic method of recruitment, we will be utilizing predictive analytics to inform admission decisions. The strategic plan also expands our experiential learning goal to include career readiness skills today s employees need. We plan to significantly increase the number of high-impact experiences such as more opportunities for student internships. Indiana State will also retain its commitment to community service as part of our students educational experience through an expansion of effective partnerships while encouraging our students to be productive citizens in their communities. Another goal pertains to university vitality and momentum in expanding the capacity needed to ensure long-term sustainability and success. Much of this goal focuses on the responsible stewardship of 3
6 university resources coupled with more aggressive fundraising activities to support our institutional mission. The final goal addresses the need to attract and retain extraordinary employees. We want to make concerted efforts to continue to diversify the makeup of our faculty and staff, including the executive group, so that it emulates that of our student body. The percentage of female full professors must grow in order to better reflect the gender makeup of our faculty. On the capital front, our 10-year plan to upgrade our residence halls was completed with the reopening of Rhoads Hall this fall. All of Indiana State s residence halls are now sprinkled for fire protection and are air conditioned with many also providing suite-style living with private bathrooms. Through our partnership with Sodexo, a $16 million renovation of Sycamore Dining will begin early next year, and a fully licensed Starbucks recently opened in Hulman Memorial Student Union. A new sports performance center and nutrition station opened last fall for our intercollegiate student athletes. The center features state-of-the-art weight training equipment. Improvements were also made to the track and field annex including the installation of an indoor training track. The first phase of the largest state-funded project in the University s history, a $64 million addition to the Health and Human Services Building, opened in spring The renovation of the former Arena Building is now underway and will open in The project directly addresses the state s need for more healthcare professionals by providing laboratory and classroom space for our growing health-care programs. A $15 million renovation of the Fine Arts and Commerce Building is currently underway and work on a $50 million upgrade to Hulman Center is expected to begin later this fall. The University also partnered with local redevelopment authorities to transfer the former American Can Company property, saving the University the cost to demolish the property. A $23 million project by Core Redevelopment has converted the structure into market-value apartments which opened this summer. The project is part of Riverscape, a community effort to redevelop the riverfront. This is an exciting time for Indiana State, and our university is well-positioned to advance to even greater heights. The educational experience our students are receiving is filled with opportunities for experiential learning, community engagement, undergraduate research, leadership roles, intercultural activities, and more. It is so rewarding to see these students lives being transformed by the dedicated work of our faculty and staff. It is truly my honor to serve in this role, at this time, with these outstanding professionals. Indiana State University is the state of Indiana s university. Since returning to Terre Haute in January, I have been deeply impressed with the caliber and dedication of our faculty and staff and the students they serve. Sincerely, Deborah J. Curtis, Ph.D. President 4


7 Letter of Transmittal Dear President Curtis and Trustees of Indiana State University: With this letter I transmit to you Indiana State University s audited financial report for the year ended June 30, Although a financial statement is but one measure of an institution s well-being, this report confirms that Indiana State University is in sound financial condition and that its leadership continues diligent and careful management of its resources. Indiana State University is committed to excellence in teaching and learning. This report reflects an equal commitment to excellence in stewarding the resources used in those pursuits. University management is responsible for the accuracy and completeness of the information as presented, including all disclosures. The financial statements are prepared in accordance with guidelines established by the Governmental Accounting Standards Board (GASB) and audited by the Indiana State Board of Accounts. The unmodified audit opinion, the most favorable outcome of the audit process, is on pages 6 and 7 of this report. The Management s Discussion and Analysis (MD&A) provides a narrative introduction and overview of the basic financial statements, as well as information regarding the financial position and results of operations of the University for the fiscal year. The MD&A is on pages 9 through 20 followed by financial statements and accompanying notes. As a state-supported university, we remain grateful that Hoosiers value higher education and Indiana s government leaders remain steadfast in providing our faculty and students support to achieve our mission. Sincerely, Diann E. McKee Senior Vice President for Finance and Administration and University Treasurer 5

8 6 Independent Auditor s Report
9 7

10 8 View of a stairwell in the expansion of the Health and Human Services Building.
11 Management s Discussion and Analysis Introduction The following discussion and analysis provides an overview of the financial position and activities of Indiana State University (the University) for the fiscal years ended June 30, 2018 and 2017, along with comparative financial information for the fiscal year ended June 30, This overview complies with Governmental Accounting Standards Board (GASB) principles, GASB Statement No. 35, Basic Financial Statements and Management s Discussion and Analysis for Public Colleges and Universities, as amended by GASB Statements No. 37 and No. 38. This discussion has been prepared by management and should be read in conjunction with the accompanying financial statements and the notes that follow this section. Indiana State University is a doctoral R3, residential institution offering instruction at the associate, bachelor, master, and doctoral levels. The University offers a diverse range of degree programs through a framework of 43 departmental units in five academic colleges and various divisions. Located in Terre Haute, Indiana, with 13,771 students, Indiana State University is a significant economic engine for the Wabash Valley and the State of Indiana. Using the Financial Statements The University s financial report includes three financial statements: (1) the Statement of Net Position; (2) the Statement of Revenues, Expenses, and Changes in Net Position; and (3) the Statement of Cash Flows. The Statement of Net Position provides a summary view of the assets, liabilities, deferred inflows and outflows, and net position of the University and classifies assets and liabilities as either current or noncurrent. Current assets include those that may be used to support regular ongoing operations, such as cash and cash equivalents, accounts receivable, and inventories. Deferred outflows of resources are items that represent a decrease in net position applicable to a future reporting period. Current liabilities are those items which are estimated to become due and payable within the next fiscal year. Non-current assets include capital assets, certain receivables, and long-term investments. Non-current liabilities include long-term bonds and notes payable. Deferred inflows of resources represent an increase of net position applicable to a future reporting period. The Statement of Revenues, Expenses, and Changes in Net Position summarizes financial performance for the year and explains the changes in the year-end net position. The Statement of Cash Flows reconciles the beginning and ending balances of cash and cash equivalents and identifies all sources and uses of cash during the fiscal year. The Governmental Accounting Standards Board (GASB) requires the inclusion of financial statements for all significant University component units. As of June 30, 2018 the Indiana State University Foundation is the only component unit to be included. The Foundation is a nonprofit organization that is subject to reporting guidelines governed by the Financial Accounting Standards Board (FASB); accordingly, certain revenue recognition criteria and presentation features are different from established GASB standards. No modifications have been made to the Indiana State University Foundation s financial information in the University s financial reporting presentation for these differences. 9
12 Statement of Net Position The Statement of Net Position presents the financial position of the University at the end of the fiscal year and includes all assets, liabilities and deferred inflows and outflows. The difference between total assets, total liabilities, and total deferred inflows and outflows is the net position, which is one measure of the financial condition of the University. Changes in net position are an indicator of whether the overall financial condition has improved or declined during the year. Assets, liabilities, and deferred inflows and outflows are generally measured at historical values in accordance with generally accepted accounting principles. One notable exception is investments, which are recorded at fair market value as of the date of the financial statements. A summarized comparison of the University s assets, liabilities, deferred inflows and outflows, and net position at June 30, 2018, 2017 and 2016 is as follows: Statement of Net Position (in millions) Current assets $ 74.2 $ 92.3 $ 56.9 Non-current assets: Notes receivable, net Other long-term investments Net OPEB asset Capital assets, net Other assets Total assets $ $ $ Deferred outflows of resources $ 6.7 $ 8.8 $ 7.7 Current liabilities $ 42.0 $ 40.5 $ 40.8 Non-current liabilities Total liabilities $ $ $ Deferred inflows of resources $ 4.8 $ 2.2 $ 2.7 Net position $ $ $ Assets and Deferred Outflows of Resources Current assets consist primarily of cash, operating investments, and accounts receivable. Non-current assets consist primarily of capital assets net of depreciation, long-term investments, notes receivable net of allowance, and the net other post-employment benefit (OPEB) asset. Deferred outflows of resources reflect deferred outflows related to early debt retirement, pensions and OPEB. Total assets increased by $18 million in 2018 as compared to a $70.8 million increase in This represents a 2.4 percent increase in 2018 and a 10.6 percent increase in The current year activity is summarized below: Cash and cash equivalents and short-term investments decreased by $10.1 million and $10 million, respectively, reflecting the use of these funds for the renovation of the College of Health and Human Services Building and Rhoads Hall, the final phase of renovation of Sycamore Towers (student housing). The expenditures for these projects are also reflected in the $12.4 million decrease in other long-term investments. Accounts receivable decreased by $0.1 million as a result of growth in the allowance for doubtful accounts of $1.1 million and increased write-offs in The state receivable of $0.7 million, included in other assets, reflects the amount of expenditures for the Fine Arts and Commerce Building billed to the State through the end of fiscal year (See Capital and Debt Activities for details.) The current portion of notes receivable grew by $0.3 million while the non-current portion decreased by $0.5 million. This reflects the phase-out of the Perkins loan program. Perkins loans will no longer be issued in fiscal year Capital assets increased by $35.6 million. This growth is the result of construction projects including the College of Health and Human Services Building, Cromwell Hall, Rhoads Hall and the Hulman Center renovations. 10

13 The net OPEB asset grew by $13.5 million. $10.1 million represents a prior period adjustment resulting from a change of accounting principle with the implementation of GASB Statement No. 75, Accounting and Financial Reporting for Postemployment Benefits Other Than Pensions. This reflects the changes of cost methods and payroll growth rates that are required under GASB 75, as well as recognition of the full net OPEB liability. Any changes to the liability are now recognized as they occur rather than amortized. Deferred outflows of resources decreased to $6.7 million in 2018 from $8.8 million in 2017 and $7.7 million in The University s contribution of $2.1 million to the Public Employees Retirement Fund (PERF) during 2018 was recognized as a deferred outflow of resources as required by GASB Statements No. 68 and 71. The details can be reviewed in Note 16 of the accompanying Notes to the Financial Statements. In addition, $0.2 million of deferred outflow related to OPEB as required by GASB Statement No. 75 is recognized. The details of can be reviewed in Note 18. A Voluntary Employee Benefit Association (VEBA) Trust was established by the University in 1998 to set aside funds for post-retirement health and life insurance benefits and provide for investment of these assets. The fund assets cannot revert to the University and therefore the financial statements do not reflect the value of these assets. As of June 30, 2018, the value of the Trust assets was $90.6 million. The outstanding actuarial accrued liability for post-retirement benefits as of June 30, 2018 is $58.2 million resulting in a positive funded ratio of percent. Liabilities and Deferred Inflows of Resources Current liabilities include accounts payable, accrued compensation, unearned revenue, and the current portion of long-term debt. Non-current liabilities consist primarily of the non-current portion of long-term debt, net pension liability and advances from the federal government. Deferred inflows of resources consist of the service concession arrangement with Sodexo and inflows related to pensions and other post-employment benefits. Total liabilities decreased $11.8 million in 2018 as compared to a $67.8 million increase in This represents a 3.8 percent decrease in 2018 and a 28.1 percent increase in Key changes in current year liabilities and deferred inflows of resources are as follows: 11

14 The Hulman Memorial Student Union s Starbucks retail store Accounts payable increased by $2.5 million due to increased construction payables of $3.3 million and reduced operating payables of $0.8 million. Accrued payroll and deductions decreased by $0.6 million due to reduced faculty payroll and the close-out of prior medical-processor accounts. Other current liabilities decreased by $1.1 million due to the reduction of the liability for medical claims. Current and non-current bonds payable decreased by $11 million in 2018 resulting from bond principal payments. There were no new bond issues in fiscal year The deferred service concession arrangement increase of $0.9 million recognizes Sodexo s additional investment of $1 million toward the build-out of a Starbucks retail store in Hulman Memorial Student Union. The deferred inflows related to OPEB of $1.8 million is the result of the difference between expected and actual experience for the plan. The University contributes to retirement plans for faculty and staff. Faculty and exempt staff participate in a defined contribution plan administered by TIAA-CREF resulting in no outstanding pension liability for the University. Non-exempt staff participates in a defined benefit plan administered by the State of Indiana. The net pension liability as of June 30, 2018 is $17.2 million for this group of employees. Capital and Debt Activities An important element in the continuing quality of academic programs, research activities, and student residential life is the sustained commitment to the development and renewal of the University s capital assets. The University continues to implement its Campus Master Plan with new construction, renovation, and modernization of existing facilities. Please refer to Note 3 in the Notes to the Financial Statements for activities in capital assets, including additions and deletions of capital assets in the current fiscal year. Cromwell Hall Completed for Fall 2017 occupancy, this project was the third phase of a comprehensive renovation of Sycamore Towers. The Cromwell Hall renovation upgraded living and learning spaces and provided a total of 366 beds. The project was capitalized in 2018 with an overall cost of $19.7 million. 12


15 Health and Human Services Building Work began in the summer of 2016 on the construction, expansion, and renovation and equipping of the University s facility for the College of Health and Human Services. The work includes major upgrades to building systems, reconfiguring of interior spaces to enable academic programs to function more efficiently, and the construction of an approximately 87,000 square foot addition to the facility. This will allow the college to house new academic programs and accommodate existing programs now housed elsewhere on the Indiana State campus. The project has a total estimated cost of $64 million, of which $43 million has been expended and capitalized as phase one in 2018, with the remaining scheduled for completion in March The project is funded through the issuance of Student Fee Bonds, Series R, which are fee-replaced bonds reimbursed by the State of Indiana issued September Rhoads Hall The renovation of Rhoads Hall is the fourth phase of the comprehensive renovation of Sycamore Towers. The project includes the renovation of an estimated 99,953 square feet of residence hall space. The facility will provide approximately 344 revenue generating spaces. The overall cost of the Rhoads Hall project is estimated at $20.5 million, of which $4.1 million is funded from Housing and Dining System reserves and $16.4 million from the proceeds of the Indiana State University Housing and Dining Revenue Bonds, Series 2017, issued June Expenditures incurred through 2018 totaled $18.4 million. The project was completed for Fall 2018 occupancy. Fine Arts and Commerce Building The 2017 Indiana General Assembly appropriated funding effective July 1, 2018 for Academic Facility Renovation Phase I (Fine Arts and Commerce Building). Constructed as a Public Works Administration project with land donated by the City of Terre Exterior and interior views of the state-of-the-art expansion Haute, the building was dedicated in 1940 by First Lady of the Health and Human Services Building. Eleanor Roosevelt. The project will replace outdated and obsolete mechanical and electrical systems. Interior spaces will be reconfigured to improve building egress and access and enhance instructional capabilities. Funding for the project will consist of a $15 million cash appropriation from the State of Indiana. Expenditures that occurred through 2018 totaled $0.7 million. Hulman Center The Hulman Center renovation is a $50 million project with $37.5 million of fee replacement bonds authorized by the 2015 Indiana General Assembly. Student Fee Bonds, Series S, issued August 14, 2018 (see Note 19). Site work began in July 2018 with construction beginning Fall 2018 and is expected to be completed by Fall Expenditures incurred through 2018 totaled $2.6 million. The University continues to work assertively to manage its financial resources efficiently, including the issuance of debt to finance capital projects. Indiana State University Student Fee Bonds, Series R and Indiana State University Housing and Dining System Revenue Bonds, Series 2017, issued during fiscal year 2017, had underlying credit ratings of (A-1) from Moody s and (AA-) from Fitch Ratings. Both Moody s and Fitch Ratings assigned a stable outlook to the Series R and Series 2017 bonds, listing consistent positive University operating performance, enrollment related revenue growth, prudent financial management, and solid balance sheet resources. 13
 2018 2017 2016 Net investment in capital assets $ 306.9 $ 299.")
16 Net Position Net position represents the residual value of the University s assets and deferred outflows after liabilities and deferred inflows are deducted. The University s net position at June 30, 2018, 2017 and 2016 are summarized in the table that follows: Net Position (in millions) Net investment in capital assets $ $ $ Restricted Non-expendable Expendable Unrestricted Total net position $ $ $ Net investment in capital assets reflects the University s capital assets, net of accumulated depreciation and outstanding principal balances of debt attributable to the acquisition, construction or improvement of these assets. Net investment in capital assets increased $7.9 million in 2018 and $8.1 million in 2017 for a total increase of $16 million since This reflects renovations of University housing (Blumberg Hall, Cromwell Hall and Rhoads Hall), and academic buildings (Phase I of CHHS Building). Restricted net position is subject to externally imposed restrictions governing its use. Restricted nonexpendable net position represents funds held for scholarships and fellowships. Restricted expendable net position includes funds for research, loans, and funds limited to construction and renovation. Restricted expendable net position increased by $4.8 million reflecting a $5 million payment from Sodexo Services of Indiana Limited Partnership earmarked for the renovation of the Sycamore Towers Dining Facility. Although unrestricted net position is not subject to externally imposed stipulations, all of the University s unrestricted net position has been internally designated for various ongoing needs of the University, including debt service, capital projects, University initiatives, benefit claims, technology improvements, and academic and administrative activities. Unrestricted net position has increased $8.1 million from The increase of $12.4 million in 2018 relates to the change of accounting principle for the implementation of GASB Statement No

17 Statement of Revenues, Expenses, and Changes in Net Position The Statement of Revenues, Expenses, and Changes in Net Position presents the University s results of operations for the identified fiscal year periods. A summarized comparison of the University s revenues, expenses, and changes in net position for the years ended June 30, 2018, 2017 and 2016 is as follows: Revenue, Expenses, and Changes in Net Position (in millions) Operating revenues Tuition and fees, net $ 67.7 $ 70.5 $ 71.4 Grants and contracts Auxiliary enterprises fees and services, net Other revenues Total operating revenue $ $ $ Operating expenses (248.4) (247.6) (255.3) Operating loss $ (115.9) $ (114.6) $ (121.2) Non-operating revenues (expenses) State appropriations $ 78.0 $ 77.1 $ 75.1 Investment income, net Non-operating grants and contracts Capital appropriations Capital grants and gifts Other non-operating revenues Other non-operating expenses - (0.7) (0.2) Interest on capital asset related debt (5.7) (5.6) (6.3) Net non-operating and other revenues $ $ $ Increase in net position $ 15.0 $ 4.6 $ 7.8 Net position, beginning of year $ $ $ Prior period adjustment for change in accounting principle $ 10.1 $ - $ - Net position, end of year $ $ $ One of the University s greatest strengths is its diverse stream of revenues that supplement student fees, including voluntary private support from individuals, foundations, and corporations, along with government and other sponsored programs, state appropriations, and investment income. To supplement student tuition the University will continue to aggressively seek funding from all possible sources consistent with its mission and will direct the financial resources realized from these efforts to fund University operating priorities. 15

18 The following is a comparative graphic illustration of revenues by source (both operating and nonoperating) for the years ending June 30, 2018, 2017 and 2016, which are used to fund the University s ongoing activities. As the following charts indicate, tuition and state appropriations remain the primary sources of funding for the University s academic programs. It should be noted that significant recurring sources of the University s revenues, including state appropriations, are considered non-operating revenues. Revenue by Source (in millions) $6.4 $5.8 $ $1.0 $7.7 $ $0.9 $6.6 $8.6 $75.1 $46.7 $77.1 $46.7 $78.0 $49.6 $71.4 $54.6 $70.5 $47.4 $67.7 $57.7 Other operating revenues Investment income Other non-operating revenue* Tuition and fees Federal, state, local, and non-governmental grants/contracts State appropriations Auxiliary enterprises fees and services * Includes non-operating grants and contracts (federal and state student assistance), other non-operating revenues, gifts and capital revenues Operating revenues have decreased by $1.6 million since The 2018 decrease of $0.5 is comprised of the following: Net tuition and fee income decreased by $2.8 million due to a decrease in graduate enrollment and increased scholarship allowance which reflects growth in state aid. Net auxiliary enterprises fees and services revenue grew by $2.9 million. This reflects growth in room and board income as the result of the opening of renovated facilities and a change in accounting treatment for revenue associated with live-in staff. Grants and contracts increased by $0.5 million reflecting new grants from U.S. Department of Health and Human Services and the North Carolina Department of Transportation Other operating revenues decreased by $1.1 million. This reflects a reduction of insurance recovery on damages and reduced commissions. Net non-operating and other revenues increased by $11.7 million in 2018 and decreased by $9.8 million in 2017 for a total increase of $1.9 million since Significant changes in non-operating revenues in 2018 were as follows: State appropriations increased by $0.9 million to reflect an additional $2.4 million appropriation for Student Success initiatives while the operating appropriation and fee replacement decreased by $0.7 million and $0.8 million, respectively. Non-operating grants and contracts revenue increased by $4.8 million which reflects growth in State aid awards and programs by $2.4 million and growth in Federal Pell grant awards of $2.2 million. Other non-operating revenues decreased $0.6 million due to reduction of ISU Foundation payments. 16

19 Capital appropriations increased by $0.7 million reflecting expenditures through 2018 for cash funding by the State for the Fine Arts and Commerce Building. Capital grants and gifts grew by $5.4 million as a result of a $5 million payment from Sodexo for the renovation of the Sycamore Dining facility. A comparative summary of the University s expenses for the years ended June 30, 2018, 2017 and 2016 is as follows: Operating and Non-Operating Expenses (in millions) Operating Compensation and employee benefits $ $ $ Supplies and expenses Utilities Scholarships and fellowships Depreciation Total operating expenses $ $ $ Non-operating Interest on capital asset related debt $ 5.7 $ 5.5 $ 6.3 Other non-operating expenses Total non-operating expenses $ 5.7 $ 6.2 $ 6.5 Total expenses $ $ $ Total operating expenses decreased by $6.8 million from $255.2 million in 2016 to $248.4 million in The increase of $0.8 million of operating expense from 2017 to 2018 is attributed to the following: Compensation and employee benefits decreased by $3 million. This is a result of decreased medical costs for active employees and an increase in the OPEB credit for This savings was partially offset by a 1.25 percent wage increase implemented in November Supplies and expenses increased by $2.4 million from This includes increased student meal costs, non-capitalized expenses associated with the Hulman Center renovation and additional computer purchases. Scholarships and fellowships show an increase of $0.9 million that reflects the implementation of a new Illinois scholarship program and additional students qualifying for merit-based aid. Depreciation expense grew by $0.8 million to reflect the capital additions of Cromwell Hall and Phase I of the College of Health and Human Services Building. 17
20 Non-operating expenses decreased by $0.5 million from 2017 to This is related to bond issuance costs for Series R and Housing and Dining Revenue Bonds, Series 2017, that were included in other-non operating expense in 2017 and having no new bond issuances in Indiana State University continues to make market-competitive compensation and employee benefits a top priority. These expenses represent 57 percent of total University operating expense. In addition to their natural (object) classification (expenditure type), it is also beneficial to the reader to review operating expenses by the nature of the University division incurring the expense. A summary of the University s expenses by functional classification for the years ended June 30, 2018, 2017 and 2016 is as follows: Expenses by Function (in millions) Operating Instruction $ 73.9 $ 76.2 $ 76.9 Research Public service Institutional and academic support Student services Operation of plant Scholarships Auxiliary enterprises Depreciation Total functional operating expenses $ $ $ Statement of Cash Flows The Statement of Cash Flows provides information about the University s financial health and performance by identifying the major sources and uses of cash. The statement assists the reader in evaluating the entity s ability to generate future net cash flows to meet obligations as they come due. Below is a comparative summary of the Statement of Cash Flows for the years ended June 30, 2018, 2017 and 2016: Statement of Cash Flows (in millions) Net cash (used) provided by: Operating activities $ (96.4) $ (92.7) $ (100.0) Non-capital financing activities Capital financing activities (64.5) 7.4 (22.9) Investing activities 22.9 (30.1) 1.0 Net increase (decrease) in cash and cash equivalents $ (10.0) $ 7.3 $ 2.1 The University experienced a $10 million decrease in cash and cash equivalents in 2018 and a $7.3 million increase in 2017 for an overall decrease of $2.7 million since Highlights of major changes in 2018 are discussed below: Operating activities Cash used by operating activities increased from $92.7 million in 2017 to $96.4 million in Cash provided by tuition and fees and auxiliary enterprises comprise 87 percent of inflows from operating activities. Cash provided by tuition and fees decreased by $0.7 million while cash provided by auxiliary enterprises decreased by $0.2 million. 18
21 Payments to employees and for employee benefits make up 62 percent of outflows of cash for operating activities. These payments decreased by $0.5 million in Payments to suppliers increased by $2.8 million. This includes increased payments for student meal costs, computer purchases and non-capitalized Hulman Center renovation expenditures. Cash received for other receipts decreased by $1.2 million. This decrease was related to revenue received for insurance proceeds in 2017 in association with water damage occurring during the construction of Blumberg Hall. Non-capital financing activities Cash provided by non-capital financing activities increased by $5.3 million. State appropriations make up 61 percent of net cash provided by non-capital financing activities. Cash received for state appropriations increased by $0.9 million to reflect a $2.4 million increase for a Student Success appropriation, a $0.7 million decrease in the operating appropriation, and a $0.8 million decrease in fee replacement. Cash received from non-operating grants and contracts increased by $4.5 million. This is due to an increase of $2.6 million in funds received for non-operating state grants and an increase of $1.9 million in funds received for non-operating federal grants. Capital financing activities Net cash used by capital financing activities increased by $71.9 million. Cash received from capital gifts and grants grew by $5.2 million in 2018 due to the receipt of a $5 million payment from Sodexo, which is contractually obligated to be used toward dining renovations. New bond issues in 2017 resulted in cash receipts of $80 million for Housing & Dining Revenue Bonds, Series 2017, and Student Fee Bonds, Series R. There were no new bond issues in Cash paid for capital assets increased from $50 million to $51.4 million in Principal and interest paid on capital debt and leases decreased by $3.4 million. Investing activities Cash provided by investing activities increased by $53 million. The University utilized bond proceeds invested in certificates of deposit purchased in 2017 for the College of Health and Human Services and Rhoads Hall projects. As a result, the proceeds from the sale of investments increased by $22.6 million while the purchases of investments decreased by $30.3 million. Economic Factors that Will Affect the Future Indiana State University continues to provide an environment that both challenges and educates students. With an emphasis on experiential learning and community engagement activities, graduates are prepared for future leadership roles in their professions and communities. Although student enrollment has increased significantly during the past ten years, changing demographics of traditional college-aged students throughout the mid-west and the growing numbers of the adult population with some college but no degree require a more focused approach to student recruitment and retention efforts. The development of a strategic enrollment plan that utilizes predictive analytics to make informed admission decisions will assist in continuing to improve student degree completion and meet the workforce needs of the State of Indiana. The Indiana Commission for Higher Education utilizes various performance funding metrics that determine a portion of state support for higher education. These metrics focus on student retention and degree completion. Because of the many student success and degree completion initiatives in place, the University has experienced a 34 percent increase in degree completion for 2011 to 2017 with the number of Hoosier students completing a degree within four years increasing by 9.3 percentage points during this period. The There s More to Blue strategic plan that guides planning efforts through 2021 is reviewed annually to ensure it continues to serve the needs of the University. A recent review resulted in a consolidation of 19

22 goals that remain focused on student success and degree completion. The five main goals of the plan are as follows: Goal 1 Student Success and Degree Completion Goal 2 High Impact Academic Programs Built Upon a Foundation of Experiential Learning and Career Readiness Goal 3 Community Engagement and Effective Partnerships Goal 4 University Vitality and Momentum Goal 5 Employee Success Each of the goals has various strategies and key performance indicators to ensure success. The 2016 Campus Master Plan outlines physical improvements to several key areas including academic facilities, student housing, athletic venues, and student recreational areas. As part of the Master Plan, the final project within the Sycamores Towers student housing complex is the remodel of the Sycamore Dining facility planned to begin in January The overall project involves the renovation of approximately 35,000 square feet to improve existing dining and food service operations and create additional seating capacity. Project cost is estimated at $16.8 million. A $50 million renovation of Hulman Center is scheduled to begin in November of Completion in November 2020 is anticipated. The project includes update of all mechanical and electrical systems, new exterior facade and entryway as well as improved restroom and concession areas to better serve visitor needs. Indiana State University s management is confident that the University s financial condition is strong and will meet all foreseeable economic conditions. 20
23 Indiana State University Statement of Net Position As of June 30, 2018 and June 30, 2017 (Dollars in Thousands) ASSETS Current Assets Cash and cash equivalents Short-term investments Accrued interest Accounts receivable (net of allowance of $7,166 for 2018 and $6,039 for 2017) Other accounts receivable Grants receivable State receivable Notes receivable, current portion Prepaid expenses Inventories Total current assets Non-current Assets Endowment investments held in trust Deposits with bond trustee Notes receivable, non-current portion (net of allowance of $903 for 2018 and $926 for 2017) Other long-term investments Net OPEB Asset Capital assets (net of accumulated depreciation of $306,288 for 2018 and $289,896 for 2017) Total non-current assets TOTAL ASSETS DEFERRED OUTFLOWS OF RESOURCES Deferred loss on early retirement of debt Deferred outflows related to pensions Deferred outflows related to OPEB Total deferred outflows of resources LIABILITIES Current liabilities Accounts payable Accrued payroll and deductions Unearned revenue Funds held in custody for others Other current liabilities Bonds payable Compensated absences and termination benefits Lease payable Debt interest payable Total current liabilities Non-current liabilities Bonds payable Compensated absences and termination benefits Lease payable Net pension liability Advances from Federal Government Total non-current liabilities TOTAL LIABILITIES DEFERRED INFLOWS OF RESOURCES Deferred service concession arrangement Deferred inflows related to pensions Deferred inflows related to OPEB Total deferred inflows of resources NET POSITION Net investment in capital assets Restricted for: Non-expendable: Scholarships and fellowships Expendable: Research and other grants Loans Capital projects Unrestricted TOTAL NET POSITION 2018 $ 22,343 25, ,892 1, ,832 3, $ 74,241 $ , ,997 32, ,254 $ 683,724 $ 757,965 $ 790 5, $ 6,659 $ 6,148 3,487 6,871 1,138 4,675 11,792 3,860 1,919 2,121 $ 42,011 $ 203, ,250 17,182 7,268 $ 254,977 $ 296,988 $ 1,882 1,189 1,764 $ 4,835 $ 306, ,084 8, ,388 $ 462, $ 32,423 35, ,011 1, ,510 2, $ 92,289 $ , ,375 19, ,639 $ 647,698 $ 739,987 $ 956 7,825 $ 8,781 $ 3,662 4,040 6,525 1,290 5,796 10,957 4,217 1,926 2,044 $ 40,457 $ 214, ,314 17,855 7,357 $ 268,348 $ 308,805 $ 970 1,250 $ 2,220 $ 299, ,121 2, ,043 $ 437,743 The accompanying notes to financial statements are an integral part of this statement. 21
24 Indiana State University Statement of Revenues, Expenses, and Changes in Net Position For the Years Ended June 30, 2018 and June 30, 2017 (Dollars in Thousands) OPERATING REVENUES Tuition and Fees Scholarship allowances for tuition and fees Other allowances Net tuition and fees Federal grants and contracts State and local grants and contracts Non-governmental grants and contracts Auxiliary enterprises fees and services Scholarship allowances for room and board Other allowances Net auxiliary enterprises fees and services Other operating revenues Total operating revenues EXPENSES Compensation and employee benefits Supplies and expenses Utilities Scholarships and fellowships Depreciation Total operating expenses Operating loss NON-OPERATING REVENUES (EXPENSES) State appropriations Gifts Investment income (net of investment expenses of $484,715 for 2018 and $486,806 for 2017) Interest on capital asset related debt Non-operating grants and contracts Other non-operating revenues Other non-operating expenses Net non-operating revenues Income before other revenues, expenses, gains, or losses Capital appropriations Capital grants and gifts Total other revenues Increase in net position NET POSITION Net position beginning of year Prior period adjustment for change in accounting principle Restated net position at beginning of year Net position end of year 2018 $ 114,695 (45,999) (954) 67,742 5, ,296 63,557 (13,256) (684) 49,617 6,570 $ 132,515 $ 142,743 64,005 10,157 12,547 19,020 $ 248,472 $ (115,957) $ 77, (5,689) 47,797 1,799 $ 123,129 $ 7,172 $ 2,113 $ 5,723 $ 7,836 $ 15,008 $ 437,743 10,050 $ 447,793 $ 462, $ 113,573 (42,132) (951) 70,490 4, ,092 58,546 (11,289) (528) 46,729 7,695 $ 133,038 $ 145,740 61,600 10,410 11,751 18,157 $ 247,658 $ (114,620) $ 77, ,013 (5,557) 43,000 2,389 (671) $ 117,622 $ 3,002 $ 1,383 $ 256 $ 1,639 $ 4,641 $ 433,102 $ 433,102 $ 437,743 22
25 Indiana State University Statement of Cash Flows For the Years Ended June 30, 2018 and June 30, 2017 (Dollars in Thousands) CASH FLOWS FROM OPERATING ACTIVITIES Tuition and fees Grants and contracts Auxiliary enterprises Payments to suppliers Payments to employees Payments for benefits Payments to students Loans issued to students Student loans collected Other receipts Net cash used by operating activities CASH FLOWS FROM NON-CAPITAL FINANCING ACTIVITIES State appropriations Direct loan program receipts Direct loan program disbursements Non-operating grants and contracts Gifts and other non-operating income Net cash provided by non-capital financing activities CASH FLOWS FROM CAPITAL FINANCING ACTIVITIES Capital appropriations received Capital gifts and grants received Proceeds from bond issue Costs of issuance Cash paid for capital assets Principal and interest paid on capital debt and leases Net cash (used) provided by capital financing activities CASH FLOWS FROM INVESTING ACTIVITIES Proceeds from sale of investments Income from investing activities Purchase of investments Net cash provided (used) by investing activities Net (decrease) increase in cash and cash equivalents Cash and cash equivalents beginning of year Cash and cash equivalents- end of year 2018 $ 68,648 8,559 46,542 (76,060) (75,123) (64,948) (11,306) (676) 1,113 6,824 $ (96,427) $ 77,985 22,328 (22,328) 47,451 2,554 $ 127,990 $ 1,391 5,357 (51,427) (19,869) $ (64,548) $ 25,914 3,108 (6,117) $ 22,905 $ (10,080) $ 32,423 $ 22, $ 69,366 8,157 46,751 (73,216) (74,027) (66,531) (11,038) (1,496) 1,329 8,052 $ (92,653) $ 77,126 23,466 (23,466) 42,940 2,658 $ 122,724 $ 1, ,778 (638) (49,984) (23,316) $ 7,365 $ 3,311 3,020 (36,419) $ (30,088) $ 7,348 $ 25,075 $ 32,423 Reconciliation of Operating Loss to Net Cash Used by Operating Activities Operating Loss Adjustments to reconcile operating loss to net cash used by operating activities Depreciation expense Other non-cash adjustments Changes in assets and liabilities Accounts receivable Grants receivable Notes receivable, current Inventories Prepaid expenses Accounts payable Accrued payroll and deductions Unearned revenue Funds held in custody for others Other current liabilities Compensated absences and termination benefits Net cash used by operating activities Non-cash transactions Equipment Capital lease The accompanying notes to financial statements are an integral part of this statement. $ (115,957) $ 19,020 $ 4,673 $ 120 (134) (322) 19 (1,111) (899) (553) 347 (152) (1,121) (357) $ (96,427) $ $ $ (114,620) $ 18,157 $ 4,002 $ (2,737) 445 (156) , (208) 406 $ (92,653) $ 56 $ (56) 23
26 Indiana State University Foundation, Inc. Consolidated Statements of Financial Position June 30, 2018 and 2017 ASSETS Cash and cash equivalents Due from Indiana State University Other assets Property held for future use Investment in joint ventures Investments Contributions receivable, net Investments held in split-interest agreements Beneficial interest in remainder trusts Property and equipment, net Beneficial interest in perpetual trusts Total assets 2018 $ 3,097,222 32, ,898 9,452 1,239,946 71,889,254 3,338, , , ,004 1,025,260 $ 83,071, $ 5,126, , ,528 9, ,152 66,373,634 3,384, , , ,278 1,053,906 $ 79,347,656 LIABILITIES Accounts payable Due to Indiana State University Line of credit Notes payable Split-interest agreement obligations Refundable advances Total liabilities NET ASSETS Unrestricted Temporarily restricted Permanently restricted Total net assets Total liabilities and net assets $ 252,480 1,241,071 8,381, , ,675 10,597,304 51,071 24,443,617 47,979,230 72,473,918 $ 83,071,222 $ 42,159 2,292,636 2,202,699 6,453, ,172 57,936 11,834,316 (1,998,007) 22,135,221 47,376,126 67,513,340 $ 79,347,656 24
27 REVENUES, GAINS AND OTHER SUPPORT Contributions In-kind contributions Investment return Interest and dividends Net realized and unrealized gains (losses) Total investment return Non-gift income Change in value of split-interest agreements Endowment administration and gift assessments fee Intercompany transfers Net assets released from restrictions Total revenues, gains and other support Indiana State University Foundation, Inc. Consolidated Statements of Activities Years Ended June 30, 2018 and 2017 Unrestricted Temporarily Restricted Permanently Restricted Total $ 873,219 $ 2,712,843 $ 572,971 $ 4,159, , , ,771 1,256,051 25,053 1,785,875 1,802,945 2,330,839 (31,896) 4,101,888 2,307,716 3,586,890 (6,843) 5,887, , ,567 1,650,062 9,250 (13,996) 43,672 38, ,682 (312,682) 78,718 (78,718) 4,920,080 6,885, ,800 12,415,784 4,584,204 (4,577,508) (6,696) 9,504,284 2,308, ,104 12,415, EXPENSES Scholarships and awards Restricted and designated expenditures Total program services Foundation operations Sycamore operations Development and president Sports marketing program Alumni affairs Total expenses CHANGE IN NET ASSETS NET ASSETS, Beginning of Year NET ASSETS, End of Year 870, ,235 4,038,318 4,038,318 4,908,553 4,908,553 1,603,567 1,603, , , , , , ,591 53,185 53,185 7,455,206 7,455,206 2,049,078 2,308, ,104 4,960,578 (1,998,007) 22,135,221 47,376,126 67,513,340 $ 51,071 $ 24,443,617 $ 47,979,230 $ 72,473, REVENUES, GAINS AND OTHER SUPPORT Contributions In-kind contributions Investment return Interest and dividends Net realized and unrealized gains (losses) Total investment return Non-gift income Change in value of split-interest agreements Endowment administration and gift assessments fee Intercompany transfers Net assets released from restrictions Total revenues, gains and other support EXPENSES Scholarships and awards Restricted and designated expenditures Total program services Foundation operations Sycamore operations Development and president Sports marketing program Alumni affairs Total expenses CHANGE IN NET ASSETS NET ASSETS, Beginning of Year NET ASSETS, End of Year Unrestricted Temporarily Restricted Permanently Restricted Total $ 788,094 $ 2,478,764 $ 5,051,300 $ 8,318, , ,376 29,288 1,386,097 2,590,941 3,464, ,631 6,254,363 3,016,374 4,396, ,919 7,640, , ,878 1,163,790 (55,829) 17,844 (18,459) (56,444) 799,889 (789,705) (10,184) 5,184,440 6,630,948 5,250,576 17,065,964 4,527,589 (4,444,281) (83,308) 9,712,029 2,186,667 5,167,268 17,065,964 1,439,890 1,439,890 3,556,661 3,556,661 4,996,551 4,996,551 1,473,073 1,473, , , , , , ,688 26,042 26,042 7,490,607 7,490,607 2,221,422 2,186,667 5,167,268 9,575,357 (4,219,429) 19,948,554 42,208,858 57,937,983 $ (1,998,007) $ 22,135,221 $ 47,376,126 $ 67,513,340 25
28 Indiana State University Foundation, Inc. Consolidated Statements of Cash Flows Years Ended June 30, 2018 and 2017 OPERATING ACTIVITIES Change in net assets Items not requiring (providing) cash Depreciation and amortization Credit for uncollectible contributions receivable Net realized and unrealized gains on investments Loss on sale of property and equipment Contributions restricted for long-term investment Net change in value of split-interest agreements Changes in Contributions receivable Due from Indiana State University Other assets Accounts payable Due to Indiana State University Net cash used in operating activities INVESTING ACTIVITIES Purchase of investments Sales and maturities of investments Proceeds from property and equipment held for future use Purchase of property and equipment Net cash used in investing activities FINANCING ACTIVITIES Repayments of line of credit Repayments of note payable Proceeds from note payable Proceeds from contributions restricted for investments in permanent endowment Net cash provided by financing activities NET INCREASE (DECREASE) IN CASH AND CASH EQUIVALENTS CASH AND CASH EQUIVALENTS, BEGINNING OF YEAR CASH AND CASH EQUIVALENTS, END OF YEAR SUPPLEMENTAL CASH FLOWS INFORMATION Interest paid 2018 $ 4,960, ,522 (16,583) (4,101,888) (572,971) (129,103) 61, ,057 (185,370) 210,321 (1,051,565) (536,256) (20,450,876) 18,675,694 (15,248) (1,790,430) (2,202,699) (6,625,790) 8,553, , ,663 (2,029,023) 5,126,245 $ 3,097,222 $ 314, $ 9,575, ,510 (16,829) (6,254,363) 48,518 (5,051,300) (231,873) 27,285 (118,180) 194,653 (160,357) (98,666) (1,945,245) (43,484,953) 42,954, ,000 (47,374) (477,345) (95,597) (388,666) 5,051,300 4,567,037 2,144,447 2,981,798 $ 5,126,245 $ 262,318 26
29 Notes to Financial Statements As of June 30, 2018 Note 1. Summary of Significant Accounting Policies Indiana State University (the University), a publicly supported, comprehensive, doctoral granting University, serves the State of Indiana, the nation, and the international community by generating and disseminating knowledge in the humanities, arts, social sciences, scientific, and professional disciplines through instruction and research. The University is governed by a nine-member Board of Trustees, appointed by the Governor. The accompanying financial statements of the University are prepared in accordance with generally accepted accounting standards as prescribed by the Governmental Accounting Standards Board (GASB) in Statement 34, Basic Financial Statements and Management s Discussion and Analysis for State and Local Governments as amended by GASB Statement No. 35, Basic Financial Statements and Management s Discussion and Analysis for Public Colleges and Universities. Since the University is a component unit of the State of Indiana, it is included in the Comprehensive Annual Financial Report of the State. A. Reporting Entity The University implemented Governmental Accounting Standards Board (GASB) Statement No. 39, Determining Whether Certain Organizations are Component Units, and GASB Statement No. 61, The Financial Reporting Entity: Omnibus an amendment of GASB Statements No. 14 and No. 34. These Statements amend GASB Statement No. 14, The Financial Reporting Entity, to provide additional guidance to determine whether certain organizations for which the University is not financially accountable should be reported as component units based on the nature and significance of their relationship with the University. As defined by generally accepted accounting principles established by the GASB, the financial reporting entity consists of the University as the primary government, and the Indiana State University Foundation as a discretely presented component unit. This component unit is further described in Section P. B. Basis of Accounting For financial reporting purposes, the University is considered a special-purpose government engaged only in business-type activities. The financial statements of the University have been prepared on the accrual basis, including depreciation expense relating to capital assets. Under the accrual basis of accounting, revenues are recognized when earned, and expenses are recorded when an obligation has been incurred. All significant intra-university transactions have been eliminated to avoid double counting of these transactions. Examples of these would include sales between University departments or internal loans between funds. C. Cash Equivalents The University considers all highly liquid investments with a maturity date of three months or less to be cash equivalents. The University invests operating cash in investments with varying maturities. For purpose of liquidity classification, investments maturities are evaluated as of the financial statement date. D. Investments Investments in securities are reported on the financial statements at fair value as of the date of the financial statements. Investments with maturity of less than one year are reported as current assets, with the remaining investments reported as non-current assets. 27
30 E. Inventories Inventories are carried at the lower of cost or market value and on the first-in, first-out (FIFO) basis. F. Capital Assets Capital assets are stated at cost or, if donated, at fair market value on the date of acquisition. Moveable equipment costing $5,000 with a useful life of more than one year and building improvements that exceed $100,000 and extend the life of the building are capitalized. Infrastructure assets are included in the financial statements and are depreciated. Depreciation is reported using the straight-line method of depreciation over the estimated useful life of the asset. Capital assets and related accumulated depreciation are removed from the records at the time of disposal. Works of art are recorded either at cost or fair market value at the time of acquisition, but are not depreciated because these assets tend to appreciate in value over time. Minimum Capitalization Value and Useful Life by Asset Types Asset Types Capitalization Threshold Useful Life Moveable equipment $5,000 5 to 10 years Vehicles and machinery 5,000 4 to 10 years Software and computer equipment 5,000 5 years Buildings and related components 100, to 100 years Land improvements and infrastructure 100, to 20 years Library books and audio visual aids 1 20 years Works of art 1 Not depreciated G. Deferred Outflows of Resources Deferred outflows of resources represent the consumption of net assets by the University that are applicable to a future reporting period, but do not require a further exchange of goods or services. Examples of items the University considers deferred outflows of resources include loss on early retirement of debt and outflows related to pensions and other post-employment benefits. H. Compensated Absences Liabilities for compensated absences are recorded for vacation leave based on actual amounts earned as of the statement of net position date. Employees may accrue vacation benefits up to a maximum of 300 hours, which is payable upon termination. The accompanying Statement of Net Position reflects an accrual for the amounts earned and ultimately payable for such benefits at the end of the fiscal year. I. Net Pension Liability and Related Items For purposes of measuring the net pension liability, deferred outflows of resources and deferred inflows of resources related to pensions, and pension expense, information about the fiduciary net position of the Indiana Public Employees Retirement Fund (PERF) and additions to/deductions from PERF s fiduciary net position have been determined on the same basis as they are reported by PERF. Indiana Public Retirement System financial reports have been prepared using the accrual basis of accounting in conformity with generally accepted accounting principles (GAAP) as applied to government units. Benefit payments (including refunds of employee contributions) are recognized when due and payable in accordance with the benefit terms. Investments are reported at fair value. J. Deferred Inflows of Resources Deferred inflows of resources represent the acquisition of net assets by the University applicable to a future reporting period, but do not require a further exchange of goods or services. Examples of items the 28

31 University considers deferred inflows of resources include inflows from service concession arrangements and inflows related to pensions and other post-employment benefits. K. Net Position University resources are classified for financial reporting purposes into four net position categories: Net investment in capital assets: This represents the University s total investment in capital assets, net of depreciation and outstanding debt obligations related to those capital assets. Restricted net position, non-expendable: Non-expendable restricted net position consists of endowment and similar type funds in which donors or other outside sources have stipulated, as a condition of the gift instrument, that the principal is to be maintained inviolate and in perpetuity and invested for the purpose of producing present and future income, which may either be expended or added to principal. Restricted net position, expendable: Restricted expendable net position includes resources that the University is legally or contractually obligated to spend in accordance with restrictions imposed by external third parties. Unrestricted net position: Unrestricted net position represents resources derived from student tuition and fees, state appropriations, and sales and services of educational departments and auxiliary enterprises. These resources are used for transactions relating to the educational and general operations of the University and may be used at the discretion of the governing board to meet current expenses for any purpose. These resources also include auxiliary enterprises, which are substantially self-supporting activities that provide services for students, faculty and staff. Substantially all unrestricted net position is designated for academic programs and initiatives, capital purposes, and general operations of the University. 29

32 L. Restricted and Unrestricted Resources When both restricted and unrestricted resources are available for a particular expenditure, University management may select the most appropriate funding source based on individual facts and circumstances. The University does not require funds be expended in a particular order, and the decision on what fund order is used is made on a case-by-case basis. M. Operating Revenues and Expenses Operating revenues include all revenues from exchange transactions resulting from providing goods and services for higher education, research, public service, and other related activities. Examples include student tuition and fees, net of scholarship discounts and allowances, most federal, state and local grants and contracts, interest on institutional student loans, and auxiliary operations (such as Intercollegiate Athletics and Housing and Dining Services). Operating expenses contain all expenses paid to acquire or produce goods and services provided in return for operating revenues to carry out the mission of the University. Examples include compensation and benefits, travel, and other supplies and expenses. Expenses are reported using natural classifications in the Statement of Revenues, Expenses, and Changes in Net Position. N. Scholarship Discounts and Other Allowances Student tuition and fee revenues and certain other revenues from students are reported net of scholarship discounts and allowances in the Statement of Revenues, Expenses, and Changes in Net Position. Scholarship discounts are the difference between the stated charge for goods and services provided by the University and the amount that is paid by students and/or third parties making payments on the students behalf. Certain governmental grants, such as Pell grants, and other federal, state or non-governmental programs, are recorded as non-operating revenues in the University s financial statements. To the extent that revenues from such programs are used to satisfy tuition and fees and other student charges, the University has recorded a scholarship discount. Other allowances include the allowance for bad debt, which will be recorded as a reduction to the appropriate revenue. 30
33 O. Non-Operating Revenues and Expenses Non-operating revenues include activities that have the characteristics of non-exchange transactions, such as gifts and contributions, and other revenue sources that are defined as non-operating revenues by GASB No. 9, Reporting Cash Flows of Proprietary and Non-expendable Trust Funds and Governmental Entities That Use Proprietary Fund Accounting, and GASB No. 34, including state appropriations and investment income. Non-operating revenues include any grant that meets the definition of a non-exchange transaction, for which the University has administrative duties. This would include Pell Grant, SEOG, and any State Grant that the University has to determine eligibility, even if the eligibility requirements are set forth by Federal or State agencies. Non-operating expenses contain all expenses that are incurred in the performance of activities not directly related to the core operations of the University. Examples include interest on capital asset related debt, bond issuance costs, and the loss on the sale of investments. P. Component Units The Indiana State University Foundation is a legally separate, tax-exempt component unit of Indiana State University. Indiana State University Foundation, Inc. was incorporated on March 10, The Foundation was organized to promote educational purposes and receive contributions primarily for the benefit of Indiana State University and its students. The Foundation acts primarily as a fund-raising organization to supplement the resources that are available to the University in support of its programs. The Indiana State University Foundation Board of Directors represents a diverse group of volunteer professional and business leaders who devote their time and resources in service of the Foundation for the benefit of Indiana State University. The majority of resources that the Foundation holds and invests, and the income generated by these assets, are restricted to the activities of the University by its donors. Because these resources can only be used for the activities of the University, the ISU Foundation is considered a component unit of the University, and its audited financial statements are discretely presented in the University s financial statements. The Foundation is a private nonprofit organization that reports under Financial Accounting Standards Board (FASB) standards, including FASB Statement No. 117, Financial Statements of Not-for-Profit Organizations. As such, certain revenue recognition criteria and presentation features are different from GASB revenue recognition criteria and presentation features. No modifications have been made to the Foundation s financial information in the University s financial reporting presentation for these differences. During the years ended June 30, 2018 and June 30, 2017 the Foundation distributed $4,040,000 and $4,428,000, respectively, to the University for both restricted and unrestricted purposes. Complete financial statements for the Foundation can be obtained from the Foundation Office at 30 North 5th Street, Terre Haute, IN Q. New Accounting Pronouncements Effective with the fiscal year 2018, the University implemented GASB Statement No. 75, Accounting and Financial Reporting for Postemployment Benefits Other Than Pensions. This statement establishes accounting and financial reporting standards for other post-employment benefits (OPEB) other than pensions provided to the employees of state and local governmental employers. Implementation of this standard requires a restatement to beginning net position, recognition of a net OPEB liability (asset), and recognition of OPEB related deferred inflows and deferred outflows. The University has reported a $10.1 million change in accounting principle adjustment to unrestricted net position as of July 1, June 30, 2017 amounts have not been restated to reflect the impact of GASB 75 because the information is not available to calculate the impact on net position expense for that fiscal year. The Statement also enhances accountability and transparency for OPEB plans through revised note disclosures and required supplementary information. More information about the University s OPEB plan can be found in Note
34 Note 2. Cash and Investments The University maintains a cash and investment pool that is available for use by all funds. Each fund s portion of this pool is displayed in the Statement of Net Position under cash and cash equivalents, shortterm investments, long-term investments, or endowment investments-held in trust, depending on the nature of the investment. Cash and Investments Cash & Investments (Dollars in Thousands) Cash on hand $ 89 $ 94 Deposits with financial institutions 4,122 8,263 Investments 158, ,287 $ 163,173 $ 195,644 Authorization for investment activity is stated in Indiana Code Title 21, Article 21, Chapter 3, Section.3. Additionally, IC (Indiana Prudent Investor Act) requires the Board of Trustees of the University to act as a prudent investor would, by considering the purposes, terms, distribution requirements, and other circumstances of the trust. It also requires that management decisions be made in the context of the trust portfolio as a whole and as a part of the overall investment strategy having risk and return objectives reasonably suited to the trust. The Board holds responsibility to assure the assets are prudently invested in a manner consistent with this investment policy. The Board has delegated the day-to-day responsibilities for overseeing the investment program to the Senior Vice President for Finance and Administration and University Treasurer. The University s current investment policy was approved by the Board of Trustees on May 7, 2010 and implemented in September The objective of the Investment Policy is to adequately provide for the liquidity needs of the University while maximizing the opportunity to increase yield on investments. The investment structure is divided into three liquidity tiers to provide for income maximization while meeting the daily liquidity requirements of the University. In order to supply sufficient day-to-day operating liquidity, Tier I is invested in money market securities and liquidity reserves. Tier II is invested in limited duration securities to provide for a sufficient level of reserves in case of unanticipated liquidity needs; yet provide for a level of incremental return over Tier I. Tier III is invested for income maximization while taking on appropriate levels of risk. Authorized investments include US Treasury, US Government Agency or Instrumentality, Mortgage-Backed Securities, Asset-Backed Securities, Taxable Municipal Bonds, Non-Benefit Responsive GIC s, Money Market Instruments and Funds, Corporate Investment Grade Bonds, Corporate High Yield Bonds, and Non-US Dollar Debt. Credit Quality and Market Value percentages are established for each investment manager portfolio. Disclosures Relating to Interest Rate Risk Interest rate risk is the risk that increases in market interest rates will adversely decrease the fair value of an investment. Generally, the longer the maturity of an investment, the greater the sensitivity of its fair value to changes in market interest rates. One of the ways that the University and its investment managers limit its exposure to interest rate risk is by purchasing a combination of shorter term and longer term investments and by timing cash flows from maturities so that a portion of the portfolio is maturing or coming close to maturity evenly over time as necessary to provide the cash flow and liquidity needed for operations. Information about the sensitivity of the fair values of the University s investments (including investments held by bond trustee) to market interest rate fluctuations for fiscal years 2018 and 2017 are provided by the following tables showing the distribution of investments by maturity: 32

35 University Investments and Maturities at June 30, 2018 (Dollars in Thousands) Investment Type Fair Value Less Than 1 Year 1-5 Years 6-10 Years More Than 10 Years Cash on hand (petty cash) $ 89 $ 89 $ - $ - $ - Demand deposits 4,122 4, Money market funds 13,397 13, Certificates of deposit 16,256 13,944 2, Asset-backed securities 5, , Collateralized mortgage obligations 8, ,503 1,584 4,807 Corporate bonds 41,623 2,785 26,908 5,757 6,173 Commercial paper Government agencies 10,041 2,074 5,984 1, Mortgage-backed securities 13, , ,994 Municipal notes and bonds 1, Treasury notes and bonds 45,151 10,499 13,939 12,219 8,494 Foreign notes and bonds 2, , Exchange traded funds Endowment investments held in trust $ 163,173 $ 48,110 $ 58,155 $ 23,449 $ 33,459 University Investments and Maturities at June 30, 2017 (Dollars in Thousands) Investment Type Fair Value Less Than 1 Year 1-5 Years 6-10 Years More Than 10 Years Cash on hand (petty cash) $ 94 $ 94 $ - $ - $ - Demand deposits 8,263 8, Money market funds 7,515 7, Certificates of deposit 52,854 39,890 12, Asset-backed securities 10, ,020 1, Collateralized mortgage obligations 6, , ,583 Corporate bonds 42,870 4,133 24,384 8,646 5,707 Common stock Government agencies 8, ,142 1, Mortgage-backed securities 12,248-2,334 1,799 8,115 Municipal notes and bonds 1, Treasury notes and bonds 42,588 5,750 17,383 12,278 7,177 Foreign equities Foreign notes and bonds 2,100-1, Endowment investments held in trust $ 195,644 $ 67,595 $ 73,133 $ 27,426 $ 27,490 Investments with Fair Values Highly Sensitive to Interest Rate Fluctuations The University s investments include the following investments that are highly sensitive to interest rate fluctuations (to a greater degree than already indicated in the information provided). 33
36 Disclosure Relating to Credit Risk Generally, credit risk is the risk that an issuer of an investment will not fulfill its obligation to the holder of the investment. This is measured by the assignment of a rating by a nationally recognized statistical rating organization. Credit risk is addressed in the University Investment Policy, approved May 7, Credit risk guidelines are established for each investment manager. The policy stipulates the percentage of each manager s fixed income portfolio that must be rated Aa or better at the time of purchase. These percentages range from 65 percent to 100 percent. Presented below is the actual Moody s rating at year end for each investment type for fiscal years 2018 and Moody's Rating Scale at June 30, 2018 (Dollars in Thousands) Investment Type Fair Value AAA Aa A B or Lower Not Rated Cash on hand (petty cash) $ 89 $ - $ - $ - $ - $ 89 Demand deposits 4, ,122 Money market funds 13, ,397 Certificates of deposit 16, ,256 Asset-backed securities 5,529 2, ,678 Collateralized mortgage obligations 8,155 1, ,612 Corporate bonds 41, ,452 14,012 20,126 1,837 Commercial paper Government agencies 10,041-8, ,922 Mortgage-backed securities 13, ,587 Municipal notes and bonds 1, Treasury notes and bonds 45,151 45, Foreign notes and bonds 2, ,913 Exchange traded funds Endowment investments held in trust $ 163,173 $ 49,467 $ 14,177 $ 14,574 $ 20,773 $ 64,182 Moody's Rating Scale at June 30, 2017 (Dollars in Thousands) Investment Type Fair Value AAA Aa A B or Lower Not Rated Cash on hand (petty cash) $ 94 $ - $ - $ - $ - $ 94 Demand deposits 8, ,263 Money market funds 7, ,515 Certificates of deposit 52, ,854 Asset-backed securities 10,127 3, ,628 Collateralized mortgage obligations 6, ,589 Corporate bonds 42, ,481 12,241 23,294 2,350 Common stock Government agencies 8,412-7, Mortgage-backed securities 12, ,248 Municipal notes and bonds 1, Treasury notes and bonds 42,588 42, Foreign equities Foreign notes and bonds 2, ,603 Endowment investments held in trust $ 195,644 $ 47,723 $ 13,355 $ 13,576 $ 24,289 $ 96,701 Concentration of Credit Risk The investment policy of the University contains no limitations on the amount that can be invested in any one issuer. At June 30, 2018 investments in any one issuer (other than U.S. Treasury securities and mutual funds) that represent five percent or more of total University investments included Fannie Mae mortgage-backed securities totaling $8,349,000. At June 30, 2017 Old National Bank certificates of deposit, totaling $14,600,000, represented five percent or more of total University investments. Custodial Credit Risk Custodial credit risk for deposits is the risk that, in the event of the failure of a depository financial institution, the University will not be able to recover its deposits or will not be able to recover collateral securities that are in the possession of an outside party. The custodial credit risk for investments is the 34
 to a transaction, the University will not be able to recover the value of its investment or collateral securities that are in the possession of another party.")
37 risk that, in the event of the failure of the counterparty (e.g., broker-dealer) to a transaction, the University will not be able to recover the value of its investment or collateral securities that are in the possession of another party. Indiana State University s investment policy does not contain legal or policy requirements that would limit the exposure to custodial credit risk for deposits or investments, other than preference will be given to Indiana institutions because of additional insurance coverage provided by the State. At June 30, 2018, $45,151,000 in U.S. Treasury Notes and Bonds, $10,041,000 in U.S. Government Agencies and $13,397,000 of the Money Market funds invested in U.S. Government-backed funds were held by a trust department not in the University s name. At June 30, 2017 $42,588,000 in U.S. Treasury Notes and Bonds, $8,412,000 in U.S. Government Agencies and $7,515,000 of the Money Market funds invested in U.S. Government-backed funds were held by a trust department not in the University s name. As of June 30, 2018 and 2017 Indiana State University s deposits with financial institutions held in uncollateralized accounts were insured up to $250,000 by FDIC and in excess of $250,000 by the Indiana Public Deposits Fund. Certificates of Deposits of $11,499,000 held in 2018 and $50,210,000 held in 2017 were also covered under the Indiana Public Deposits Fund, as they were invested in Indiana financial institutions. The University had less than four percent of investments that are made up of foreign currency in 2018 and 2017; therefore, the University s exposure to foreign currency risk is insignificant. Fair Value Measurements The University categorizes its fair value measurements within the fair value hierarchy established by generally accepted accounting principles. Fair value is the price that would be received to sell an asset or paid to transfer a liability in an orderly transaction between market participants at the measurement date. The hierarchy input levels are defined as follows: Level 1 inputs are quoted prices for identical assets or liabilities in an active market. Level 2 inputs consist of observable prices for similar assets or liabilities in active or inactive markets and inputs other than quoted prices that are observable for the asset or liability. Level 3 inputs are unobservable inputs for an asset or liability. The University s investments are composed of assets valued using Level 1 or Level 2 inputs. Fair market value is established for our level two assets in various manners. Fair value is determined on level two assets based on their quoted prices in inactive markets when possible. In other situations, the fair value 35
38 determination is based on models. The inputs for these models are observable either directly or indirectly for substantially the full term of the asset. Level two model inputs include the following: Quoted prices for similar assets or liabilities in active markets (for example, restricted stock); Quoted prices for identical or similar assets or liabilities in non-active markets (examples include corporate and municipal bonds, which trade infrequently); Pricing models whose inputs are observable for substantially the full term of the asset or liability (examples include most over-the-counter derivatives, including interest rate and currency swaps); and Pricing models whose inputs are derived principally from or corroborated by observable market data through correlation or other means for substantially the full term of the asset or liability (examples include certain residential and commercial mortgage related assets, including loans, securities and derivatives.) Endowment investments held in trust are included in a pool of investments that use a mix of Level 1 and Level 2 inputs, and are thus reported at Level 2, the lowest level. The University s fair value measurements of reoccurring investments as of June 30, 2018 and 2017 are presented below. University Investments by Fair Value Level at June 30, 2018 (Dollars in Thousands) Investment Type Fair Value Level 1 Level 2 Level 3 Cash Cash on hand (petty cash) $ 89 $ - $ - $ - $ 89 Demand deposits 4, ,122 Money market funds 13,397-13, Certificates of deposit 16,256 10,800 5, Asset-backed securities 5,529-5, Collateralized mortgage obligations 8,155-8, Corporate bonds 41,623-41, Commercial paper Government agencies 10,041-10, Mortgage-backed securities 13,587-13, Municipal notes and bonds 1,042-1, Treasury notes and bonds 45,151-45, Foreign notes and bonds 2,560-2, Exchange traded funds Endowment investments held in trust $ 163,173 $ 10,800 $ 148,162 $ - $ 4,211 University Investments by Fair Value Level at June 30, 2017 (Dollars in Thousands) Investment Type Fair Value Level 1 Level 2 Level 3 Cash Cash on hand (petty cash) $ 94 $ - $ - $ - $ 94 Demand deposits 8, ,263 Money market funds 7,515-6, Certificates of deposit 52,854 49,500 3, Asset-backed securities 10,127-10, Collateralized mortgage obligations 6,170-6, Corporate bonds 42,870-42, Common stock Government agencies 8,412-8, Mortgage-backed securities 12,248-12, Municipal notes and bonds 1,328-1, Treasury notes and bonds 42,588-42, Foreign equities Foreign notes and bonds 2,100-2, Endowment investments held in trust $ 195,644 $ 49,500 $ 137,201 $ - $ 8,943 36
 Balance June 30, 2017 Additions Transfers Deductions Balance June 30, 2018 Capital assets not being depreciated Land $ 35,331 $ - $ 35 $ (141) $ 35,225 Works of")
39 Note 3. Capital Assets (Dollars in Thousands) Balance June 30, 2017 Additions Transfers Deductions Balance June 30, 2018 Capital assets not being depreciated Land $ 35,331 $ - $ 35 $ (141) $ 35,225 Works of art 2, (73) 2,010 Construction in progress 46,961 54,471 (67,171) (1,239) 33,022 Total assets not being depreciated $ 84,366 $ 54,480 $ (67,136) $ (1,453) $ 70,257 Capital assets being depreciated Infrastructure $ 35,699 $ - $ - $ - $ 35,699 Land improvements 34,485-3,210-37,695 Buildings 517,453-63,926 (1,953) 579,426 Equipment 81,950 3,012 - (2,079) 82,883 Capital lease assets 32, ,014 Leasehold improvements Total capital assets depreciated $ 702,169 $ 3,012 $ 67,136 $ (4,032) $ 768,285 Less accumulated depreciation Infrastructure $ (33,585) $ (108) $ - $ - $ (33,693) Land improvements (18,639) (1,663) - - (20,302) Buildings (170,051) (12,486) (181,538) Equipment (64,356) (3,283) - 1,629 (66,010) Lease amortization (3,057) (1,366) - - (4,423) Leasehold improvements amortization (208) (114) - - (322) Total accumulated depreciation $ (289,896) $ (19,020) $ - $ 2,628 $ (306,288) Total capital assets being depreciated, net $ 412,273 $ (16,008) $ 67,136 $ (1,404) $ 461,997 Total capital assets, net $ 496,639 $ 38,472 $ - $ (2,857) $ 532,254 37

40 During fiscal years 2018 and 2017, the University incurred $9,458,000 and $8,289,000 in interest costs related to the ownership of capital assets, respectively. Of these totals, $2,750,000 and $2,497,000 were capitalized for years ending June 30, 2018 and 2017, respectively. A breakdown of significant projects included in construction in progress as of June 30, 2018 and 2017 are shown below: Construction Work in Progress (Dollars in Thousands) Project June 30, 2018 Rhoads Hall Renovation $ 18,411 College of Health and Human Services Renovation 5,230 Hulman Center Renovation 2,623 Memorial Stadium Turf Upgrade 1,387 Fine Arts Building Renovation 1,151 Other Miscellaneous Projects 4,220 Total $ 33,022 Construction Work in Progress (Dollars in Thousands) Project June 30, 2017 College of Health and Human Services Renovation $ 23,024 Cromwell Hall Renovation 18,456 Hulman Center Renovation (A&E) 1,843 Rhoads Hall Renovation 1,562 Other Miscellaneous Projects 2,076 Total $ 46,961 Note 4. Long-Term Liabilities Long-term liabilities of the University consist of bonds and notes payable, capital leases payable, compensated absences, and other liabilities. 38
41 The changes in long-term liabilities for fiscal years ending June 30, 2018 and 2017 are as shown below: (Dollars in Thousands) Balance July 1, 2017 Additions Reductions Balance July 1, 2018 Current Portion Bonds payable $ 203,370 $ - $ 9,695 $ 193,675 $ 10,530 Bond premiums 22,392-1,262 21,130 1,262 Lease payable 30,240-1,071 29,169 1,919 Compensated absences and termination benefits 4, ,124 3,860 Advances from Federal Government 7, ,268 - Total long-term liabilities $ 267,593 $ 136 $ 12,363 $ 255,366 $ 17,571 Bond redemption reserve (matured unpaid bonds and coupons) 5 Total long-term liabilities- current portion $ 17,576 (Dollars in Thousands) Balance July 1, 2016 Additions Reductions Balance July 1, 2017 Current Portion Bonds payable $ 152,585 $ 98,035 $ 47,250 $ 203,370 $ 9,695 Bond premiums 6,995 16,825 1,428 22,392 1,262 Lease payable 30, ,240 1,926 Compensated absences and termination benefits 4, ,234 4,217 Advances from Federal Government 7, ,357 - Total long-term liabilities $ 202,035 $ 115,162 $ 49,604 $ 267,593 $ 17,100 Bond redemption reserve (matured unpaid bonds and coupons) 28 Total long-term liabilities- current portion $ 17,128 Note 5. Bonds Payable Indiana State University is authorized by acts of the Indiana General Assembly to issue bonds and notes for the purposes of financing the construction of student housing, athletic facilities, parking, and academic facilities. The outstanding bond principal indebtedness consists of the following issues. (Dollars in Thousands) Original Face Value Issue Date Interest Rate Final Maturity Dates Principal Outstanding June 30, 2018 Principal Outstanding June 30, 2017 Student Fee Bonds Series N, Satellite Chiller & Science Laboratory Projects $ 9, % 2030 $ 6,530 $ 6,950 Series P, Science Laboratory Renovation Project 4, % ,240 3,505 Series Q, Refund Series K, L, and Partial M 19, % ,945 14,400 Series R, College of Health and Human Services, Refund Series M & O 83, % ,270 80,050 Housing and Dining Revenue Bonds Series 2009, Sandison, Jones, & Burford Hall Renovation Projects 13, % ,180 8,930 Series 2010, Pickerl Hall Renovation Project 9, % ,610 6,145 Series 2012, Erickson Hall & Reeve Hall Projects 28, % ,350 26,180 Series 2014, Sycamore Towers Phase 1 - Mills Hall Project 16, % ,915 14,530 Series 2015, Sycamore Towers Phase 2 - Blumberg Hall Project 16, % ,350 14,940 Series 2016, Sycamore Towers Phase 3 - Cromwell Hall Project 14, % ,095 13,550 Series 2017, Sycamore Towers Phase 4 - Rhoads Hall Project $ 14, % 2038 $ 14,190 $ 14,190 Bonds 193, ,370 Premium 21,130 22,392 Total $ 214,805 $ 225,762 Student Fee Bonds are secured by a pledge of student fees. The Indiana General Assembly authorizes a specific state appropriation known as fee replacement to the University for the purpose of reimbursing a portion of the debt service payments for certain academic facilities, including classrooms, laboratories, and other academic support facilities. Total bond principal payments eligible for fee replacement appropriations in 2018 and 2017 were $9,048,000 and $9,799,000, respectively. Housing and Dining Revenue Bonds are secured by a pledge of housing and dining net income. As of June 30, 2018 and 2017, total net pledged income was approximately $13,494,000 and $12,558,000, respectively. In prior years, Indiana State University defeased certain serial bonds by placing the proceeds of new debt in an irrevocable trust to provide for all future debt service payments on the defeased bonds. Accordingly, 39
42 the trust accounts and liability for the defeased bonds are not included in the financial statements of Indiana State University. The University issued $14,190,000 of Housing and Dining System Revenue Bonds, Series 2017, on June 28, See Note 6 for details. Debt Service Requirements (Dollars in Thousands) Fiscal Year Bond Principal Bond Interest Total 2019 $ 10,530 $ 8,387 $ 18, ,980 7,910 18, ,850 7,367 21, ,350 6,819 17, ,830 6,310 17, ,875 23,208 80, ,710 11,442 61, ,550 2,594 33,144 Total $ 193,675 $ 74,037 $ 267,712 Net unamortized premium 21,130-21,130 Total $ 214,805 $ 74,037 $ 288,842 Note 6. Bond Issues Housing and Dining Revenue Bonds, Series 2017 On June 28, 2017, the University issued $14,190,000 of Housing and Dining Revenue Bonds, Series This issue was tax-exempt with a True Interest Cost (TIC) of percent. The bond proceeds of $16,617,000, which included $2,427,000 of net bond premium less issuance costs of $115,000 and $96,000 of underwriter s discount, netted $16,405,000 to be used for the renovation of Rhoads Hall. Rhoads Hall The project consists of the renovation of Rhoads Hall as the fourth phase of the comprehensive renovation of Sycamore Towers. The renovated facility will provide 344 revenue generating spaces and is part of a systematic upgrading of residence hall facilities to provide living and learning spaces that are attractive to prospective and returning students. The overall cost of the Rhoads Hall renovation is estimated at $20.5 million, of which $16.4 million was funded by the Series 2017 Bonds and the remaining $4.1 million was funded by Housing and Dining System reserves. The project is expected to be completed for Fall 2018 occupancy. Note 7. Service Concession Arrangements In July 2010, Indiana State University entered into a contract with Sodexo Services of Indiana Limited Partnership to provide food services for ISU s students, faculty, staff and invited guests for a term of 11 years. In December 2017, this agreement was extended through June 30, Included in the agreement was a commitment by Sodexo to provide equipment and facility enhancements of up to $2,900,000 to construct the Sycamore Banquet Center inside the Hulman Memorial Student Union, with contributions by the University of approximately $800,000. Construction was completed and the Banquet Center was put into use in April In October 2017, Sodexo made an additional investment of $1,000,000 towards the build-out of a Starbucks retail store. Food services for the Banquet Center and the Starbucks will be provided by Sodexo, and both facilities will remain an asset of the University. Due to the nature of this agreement, whereas Sodexo is the operator and ISU is the transferor, it has been classified as a service concession arrangement. The Sycamore Banquet Center and the Starbucks retail space have been classified as capital assets with offsetting deferred 40
43 inflows of resources. Over the life of the contract, ISU will amortize the deferred inflow of resources, while recognizing auxiliary revenue each year. If the agreement expires, terminates, or is amended in a way that has an adverse impact on Sodexo, ISU will be liable for the unamortized portion of Sodexo s investment. Deferred Service Concession Arrangement (Dollars in Thousands) Deferred Service Concession Arrangement beginning balance $ 970 $ 1,213 Service Concession Arrangement additions 1,000 - Revenue recognition for the fiscal year (88) (243) Deferred Service Concession Arrangement ending balance $ 1,882 $ 970 Note 8. Lease Payable Indiana State University has entered into capital lease agreements for equipment and facilities. The University has a five-year lease agreement with Ricoh USA, Inc. to lease copiers and printers for the campus effective July 1, The cost of equipment held under capital leases totaled $1,778,000 as of June 30, 2018 and Accumulated amortization of leased equipment totaled $1,399,000 and $1,041,000 at June 30, 2018 and 2017, respectively. As of January 8, 2014, the University entered into a lease agreement with 500 Wabash Housing, LLC to lease floors 2-5 of the 500 Wabash Avenue building to be used for student housing. The lease commencement date was July 15, The lease term is 30 years with an option to purchase. The cost of the leased asset totaled $30,237,000 for years ending June 30, 2018 and 2017 with accumulated amortization of $3,024,000 and $2,016,000 as of June 30, 2018 and 2017, respectively. These capital lease obligations are included in the Statement of Net Position and future scheduled payments under these agreements are illustrated in the schedule below. The University records lease amortization as depreciation expense on the Statement of Revenues, Expenses and Changes in Net Position. (Dollars in Thousands) Fiscal Year Equipment Lease Payments Facilities Total 2019 $ 390 $ 1,535 $ 1, ,535 1, ,535 1, ,535 1, ,535 1, ,675 7, ,675 7, ,675 7, ,675 7, ,070 3,070 Total minimum lease payments $ 390 $ 41,445 $ 41,835 Less: Amount representing interest (6) (12,660) (12,666) Present value of minimum lease payments $ 384 $ 28,785 $ 29,169 Note 9. Termination Benefits Liability The Governmental Accounting Standards Board (GASB), Statement No. 47, Accounting for Termination Benefits, requires the University to recognize an expense and liability for voluntary termination benefits, such as early-retirement incentives. This expense is recognized when an offer is accepted and the amount of the benefit can be estimated. 41
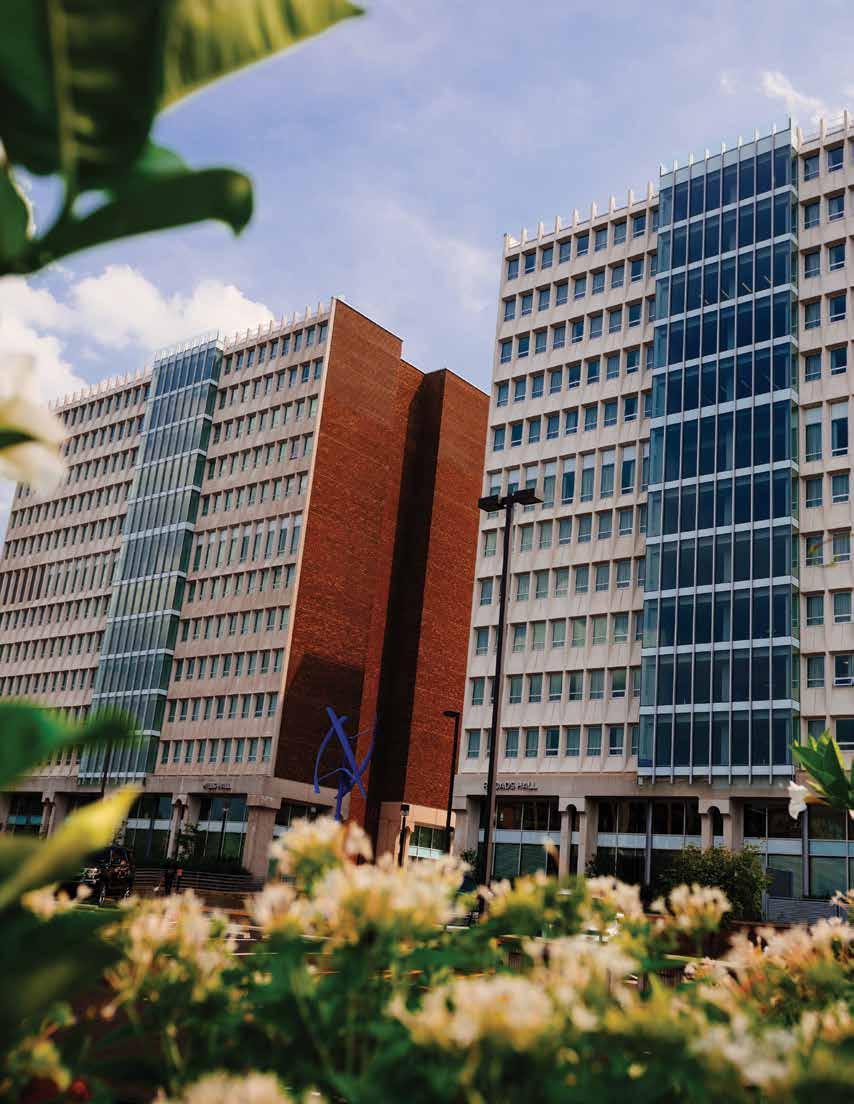
44 42
45 The ISU Board of Trustees approved a Retirement Severance Plan for eligible faculty and staff on February 18, Under the Retirement Severance Plan, employees must be age 62 or older and have 20 years of service to retire from Indiana State University. The severance payments available under the plan are 60 percent for those employees with 15 years or more of service at December 31, 2010, and 40 percent for employees with less than 15 years of service at December 31, New employees hired on or after March 1, 2010 would be eligible for a 25 percent severance pay at retirement. A total of 37 employees enrolled in the program during the 2018 fiscal year at a cost of $1,799,000 and 18 employees enrolled during the 2017 fiscal year at a cost of $848,000. Total termination benefits liability reported at June 30, 2018 was $124,000 and $247,000 at June 30, Note 10. Risk Management The University is exposed to various risks of loss related to torts; theft of, damage to, or destruction of assets; errors or omissions; job-related illnesses or injuries to employees; and health and other medical benefits provided to employees and their dependents. The University handles these risks of loss through combinations of risk retention and commercial insurance. For buildings and contents, the University has risk retention of $100,000 per occurrence. The University also holds an additional builder s risk component with a deductible of $25,000. The maximum liability to the University for job-related illnesses or injuries is $400,000 per occurrence. Settled claims have not exceeded the University s coverage in any of the past three fiscal years. The University retains the risk for medical benefits up to a stop-loss provision of $250,000 per member. Accrued liabilities for unpaid medical claims, as of June 30, 2018 are included in current other liabilities. The liability is based on 25 percent of actual claims paid during the year, which represents a three-month average turnover period for claims processing. Changes in the balance of claims liabilities during the 2018 fiscal year are as follows: (Dollars in Thousands) Unpaid medical claims- July 1 $ 5,284 $ 5,295 Claims incurred 14,047 21,125 Claims paid (15,190) (21,136) Unpaid medical claims- June 30 $ 4,141 $ 5,284 Note 11. Litigation The University has been named as a defendant in a number of lawsuits. For most of these lawsuits, the final outcome cannot be determined and management is of the opinion that any ultimate outcome will not have a material effect upon the University s financial position. Note 12. Funds Held in Custody for Others Funds held in custody for others consist of $1,138,000 and $1,290,000 at June 30, 2018 and 2017, respectively. These funds are held for other agencies (student and faculty organizations) and unapplied student payments. Note 13. Pollution Remediation Obligation To comply with GASB Statement No. 49, Accounting and Reporting for Pollution Remediation Obligations, the University must report a liability for an obligating event. An obligating event occurs when the University commences or legally obligates itself to commence pollution remediation. During fiscal year 2018 and in prior years, Indiana State University voluntarily obligated itself to remediate pollution in the Hulman Center 43
46 and other buildings. As of June 30, 2018 these projects had not been completed, leaving an outstanding obligation of $335,000 which is classified as a current other liability. The outstanding obligation as of June 30, 2017 was $124,000. Note 14. Natural Classifications with Functional Classifications The University s operating expenses by functional classification were as follows: Natural Classifications Years Ended June 30, 2018 and June 30, 2017 (Dollars in Thousands) Functional Compensation and Supplies and Scholarships Classification Benefits Expenses Utilities and Fellowships Depreciation Total Total Instruction $ 67,362 $ 6,582 $ - $ - $ - $ 73,944 $ 76,185 Research 4,769 4, ,781 8,330 Public service 2,488 1, ,180 4,450 Academic support 14,446 6, ,646 21,177 Student services 11,508 4, ,040 17,161 Institutional support 13,688 7, ,010 20,991 Operation of plant 9,965 11,079 9, ,883 30,265 Scholarships 1, ,547-13,960 13,331 Auxiliary enterprises 17,104 22, ,010 37,611 Depreciation ,020 19,020 18,157 Total $ 142,743 $ 64,007 $ 10,157 $ 12,547 $ 19,020 $ 248,474 $ 247,658 Note 15. Hedge Contracts Indiana State University has entered into forward contracts with EDF, Energy Services to purchase natural gas at a specified time in the future at a guaranteed price. This allows the University to plan its natural gas costs for the year and to protect itself against an increase in the market price of the commodity. It is possible the market price before or at the specified time to purchase natural gas may be lower or higher than the price at which the University is committed to buy. Note 16. Retirement Plans Authorization Authorization to establish retirement plans is stated in Indiana Code Title 21, Article 21, Chapter 3, and Section 3. Faculty and Exempt Staff Faculty and executive/administrative/professional employees of the University participate in a noncontributory, defined contribution plan administered through the Teachers Insurance and Annuity Association (TIAA) and College Retirement Equity Fund (CREF). Benefit provisions are established and/ or amended by the Board of Trustees. The plan purchases individual annuity contracts for members and provides for immediate vesting. Contributions and plan participant data for fiscal years 2018 and 2017 are displayed below. TIAA-CREF Contributions (Dollars in Thousands) University Contributions to Plan $7,413 $7,349 Total Participating Employee Annual Salaries $73,186 $72,550 Employee and Retiree Plan Participants
.")
47 Non-exempt Staff Plan Description Regular clerical and service staff are provided with pensions through the Public Employees Retirement Fund (PERF). PERF is a cost sharing, multiple-employer defined benefit plan administered by the Indiana Public Retirement System (INPRS). PERF was established by the Indiana Legislature in 1945 and is governed by the INPRS Board of Trustees in accordance with Indiana Code IC , IC , and IC There are two parts to the plan: an annuity savings plan and a monthly defined benefit pension. Employees are eligible to participate in this plan immediately upon employment and are fully vested in the defined benefit plan after ten years of service. The INPRS issues a publicly available financial report that can be obtained at Benefits Provided PERF provides retirement, disability and survivor benefits. To be eligible for 100 percent of the pension component a member must reach age 65 with 10 years of service, or age 60 with 15 years of service, or age 55 and whose age plus number of years of service is at least 85. Pension benefits for 100 percent normal retirement are calculated at 1.1 percent times the average annual compensation times the number of years of creditable service. The average annual compensation in this calculation uses the highest 20 calendar quarters of salary in a covered position. Cost of living adjustments (COLA) are granted by the Indiana General Assembly on an ad hoc basis. Five years of service is required for disability benefits in which the benefits are calculated the same as normal retirement. Upon the death of a member in service with 15 or more years of service, a survivor benefit may be paid to the surviving spouse or surviving dependent children. Contribution Required Contributions to PERF are determined by INPRS Board of Trustees in accordance with IC The funding policy provides for employer contributions that are sufficient to fund pension benefits, which are actuarially determined. The University was required to contribute 11.2 percent of employees gross earnings to the defined benefit plan in fiscal years 2018 and Employees are required to contribute three percent of covered payroll to their annuity savings account. The University has the option to contribute this on their behalf and elected to do so in both years presented. Contributions and plan participant data for fiscal years 2018 and 2017 are displayed below. PERF Contributions (Dollars in Thousands) University Contributions to PERF Plan $2,130 $2,148 University Contributions to Annuity Savings Accounts $572 $575 Total Participating Employee Annual Salaries $18,912 $19,086 Employee Plan Participants
48 Pension Liabilities For the fiscal years ending June 30, 2018 and June 30, 2017, the University reported liabilities of $17,182,000 and $17,855,000, respectively, for its proportionate share of the net pension liability. The net pension liability was measured as of June 30, 2017 and the total pension liability used to calculate the net pension liability was determined by an actuarial valuation as of June 30, The University s proportion of the net pension liability was based on a projection of the University s long-term share of contributions to the pension plan relative to the contribution of all participating state entities, actuarially determined. At June 30, 2017 the University s portion was.39 percent. Pension Expense, Deferred Outflows of Resources, and Deferred Inflows of Resources Indiana State University recognized pension expense of $3,536,000 during fiscal year 2018 and $3,610,000 for fiscal year The University reported deferred outflows of resources and deferred inflows of resources related to pensions from the following sources: (Dollars in Thousands) Deferred Outflows of Resources Deferred Inflows of Resources Deferred Outflows of Resources Deferred Inflows of Resources Differences between expected and actual experience $ 326 $ 13 $ 400 $ 33 Net difference between projected and actual investment earnings on pension plan investments 2, ,927 1,005 Change of assumptions Changes in proportion and difference between employer contributions and proportionate share of contributions Contributions subsequent to the measurement date 227 2, , TOTAL $ 5,677 $ 1,189 $ 7,825 $ 1,250 The University reported $2,130,000 as deferred outflows of resources related to pensions resulting from contributions subsequent to the measurement date. These contributions will be recognized as a reduction of the net pension liability in the year ended June 30, All other amounts reported as deferred inflows or outflows of resources related to pensions will be recognized in pension expense as follows: Amortization of Deferred Outflows/(Inflows) of Resources (Dollars in Thousands) 2018 $ 1, , (92) Thereafter - Total $ 2,358 Actuarial Assumptions The total pension liability in the June 30, 2016 actuarial valuation was determined using the following actuarial assumptions, applied to all periods included in the measurement. Inflation Rate: 2.25% Salary Increases: 2.50%-4.25% including inflation Experience Study Date: Period of 4 years ended June 30, 2014 Investment Rate of Return: 6.75%, net of investments expense, including inflation Actuarial Cost Method: Entry Age Normal (Level Percent of Payroll) Cost of Living Increases: 1.0% Mortality: RP-2014 Total Data Set Mortality Table, with Social Security Administration generational improvement scale from
49 The long-term return expectation for PERF has been determined by using a building-block approach. A forecasted rate of inflation serves as the baseline for the return expectation. Various real return premiums over the baseline inflation rate have been established for each asset class. The long-term expected nominal rate of return has been determined by calculating a weighted average of the expected real return premiums for each asset class, adding projected inflation rate, and adding the expected return from rebalancing uncorrelated assets classes. Geometric Basis Target Asset Long-Term Expected Allocation Real Rate of Return Public Equity 22.0% 4.9% Private Equity 14.0% 5.7% Fixed Income- Ex Inflation-Linked 20.0% 2.3% Fixed Income- Inflation-Linked 7.0% 0.6% Commodities 8.0% 2.2% Real Estate 7.0% 3.7% Absolute Return 10.0% 3.9% Risk Parity 12.0% 5.1% Discount Rate The discount rate used to measure the total pension liability was 6.75 percent. The projection of cash flows used to determine the discount rate assumed that plan member contributions will be made at the actuarially determined required rates computed in accordance with the current funding policy adopted by the INPRS Board and contributions required by the State of Indiana would be made as stipulated by state statue. Based on those assumptions, the pension plans fiduciary net position was projected to be available to make all projected future benefit payments of current active and inactive employees. Therefore, the long-term expected rate of return on pension plan investments was applied to all periods of projected benefit payments to determine the total pension liability. Sensitivity of the University s proportionate share of the net pension liability to changes in the discount rate Net pension liability is sensitive to changes in the discount rate. The following presents the University s proportionate share of net pension liability calculated using the discount rate of 6.75 percent, as well as what the University s share of the net pension liability would be if it were calculated using a discount rate that is 1-percentage-point lower (5.75 percent) or 1-percentage-point higher (7.75 percent) than the current rate. Discount Rate Sensitivity-Liability/(Asset) (Dollars in Thousands) 1% Decrease (5.75%) Current (6.75%) 1% Increase (7.75%) $ 25,059 $ 17,182 $ 10,634 Pension plan fiduciary net position Detailed information about the pension plan s fiduciary net position is available in the separately issued INPRS financial report which is available at Refer to Note 1, Section I for information regarding the INPRS basis of accounting. Note 17. VEBA Trust The University established a Voluntary Employees Benefit Association (VEBA) trust, with an independent trustee, for the purpose of providing retiree medical benefits for retired employees of Indiana State University and their dependents that become eligible upon accruing the required years of service. Approval from the IRS for the tax-exempt status of the trust was received on March 2,
50 The trust is funded from reserves set aside in previous years paid by the University, contributions, employee payroll deductions for post-retirement benefits, and reinvested net earnings. Beginning January 1, 2014, the University activated the VEBA Trust. The University was reimbursed 100 percent of both pre-65 and post-65 retirement medical insurance premiums paid in fiscal year A summary of the activity in the trust for the year ending June 30, 2018 is as follows: Dollars in Thousands Market value at July 1, 2017 $ 88,856 Reimbursement of University retirement expenses (3,200) Reinvested net earnings 4,286 Less: management fees (313) Realized gain on sale of investments 11,124 Unrealized gain on increase in market value (10,105) Market value at June 30, 2018 $ 90,648 These funds cannot under any circumstances revert to the University; therefore, the financial statements of the University do not include the value of these assets. The following charts show the actual diversification of the VEBA investments. VEBA Investment Policy Guideline Diversification Asset Class Target Minimum Maximum Equity 60.0% 55.0% 65.0% Fixed Income 40.0% 35.0% 45.0% Actual VEBA Investment Diversification (Dollars in Thousands) Actual $ Actual % Domestic-Equity-Passive $ 33, % International Equity 16, % Fixed Income 40, % Cash and Money Market % Total $ 90, % Note 18. Other Post-Employment Benefits On July 1, 2017, Indiana State University implemented GASB Statement No. 75, Accounting and Financial Reporting for Postemployment Benefits Other Than Pensions, which replaces the requirements of GASB Statement No. 45, Accounting and Financial Reporting by Employers for Postemployment Benefits Other Than Pensions. The accounting change adopted to conform to the provisions of GASB Statement 75 has been applied retroactively by restating the beginning net position for the fiscal year ended June 30, 2017 by $10,050,000. The University has elected not to restate information presented for the period ended June 30, 2016, and as a result, disclosure information for fiscal years 2018 and 2017 are presented separately below. Plan Description The Indiana State University Retiree Medical Program is a single-employer, post-medicare retiree health plan administered by AmWins Group Benefits. All retirees, after reaching the age of 65, are required to participate in the fully insured plan in order to retain the retirement medical benefit. This group of post- Medicare retirees retain dental coverage through Delta Dental of Indiana and life insurance through the Symetra Life Insurance Company. Retirees under the age of 65 will continue participation in the Indiana State University Healthcare Plan for active employees until age 65 is attained. This plan is a single-employer defined benefit healthcare 48

51 plan that provides medical, dental and life insurance for eligible retirees and their spouses. The plan is administrated by Anthem Life Insurance Company for medical coverage, Delta Dental Plan of Indiana for dental coverage, CVS Caremark for prescription coverage, and UMUM for life insurance. Starting in January 2018 a High Deductible Health Plan (HDHP) was offered to employees and retirees under the age of 65. Active employees are eligible for these plans provided they retire after attaining age 62 with at least 20 years of service. Surviving spouses may continue in the plan until remarriage or death. Employees hired after January 1, 2005 or employees or their spouses who had not enrolled in the ISU health plan before January 1, 2005 are not eligible for the plan. The Indiana State University Board of Trustees has the authority to establish and amend provisions to the University plan, including contribution requirements. This plan does not issue a stand-alone financial report. As of June 30, 2018, the plan participants consisted of the following: Contributions Covered Employees Health Life Active employees Retirees receiving benefits, pre-medicare Retirees receiving benefits, post-medicare ,104 1,202 Retirees contribute the portion of premium rates not covered by the University s explicit subsidy. The University has four employee contribution groups with the standard rate and another three groups with or without wellness incentive and/or tobacco surcharge. Retiree contributions follow the wellness incentive and tobacco free contribution group. The monthly retiree contributions on January 1, 2018 (applicable to medical and dental benefits) for this category is as shown below. Salary at Retirement Employee Employee/Spouse Pre-Medicare Below 200% Federal Poverty Level $ $ At least 200% Federal Poverty Level $ $ Post-Medicare $ $ Retiree contributions (for the standard rates) as a percentage of premium rates is set by the University for both pre and post-medicare retirees. The contribution percentage assumed for the valuation is based on the retiree contributions effective January 1, 2018 as follows: Employee Employee/Spouse Pre-Medicare (weighted average) 30.9% 32.4% Post-Medicare 33.3% 33.3% 49
52 Contribution rates are based on a weighted average of the contribution rates for the University s PPO and HDHP plans, with 97.6 percent of the enrollment in the PPO plan. For the PPO plan, the contribution rates are $211 for Employee and $582 for Employee/Spouse. For the HDHP plan, the contribution rates are $146 for Employee and $404 for Employee/Spouse. Fiscal Year 2018 Disclosures (Post-Implementation of GASB Statement No. 75) Net OPEB Liability (Asset) The University s Net OPEB Liability of ($32,454,000) was measured as of June 30, 2018, and was determined by an actuarial valuation as of that date. The net OPEB liability is presented as a Net OPEB Asset on the Statement of Net Position due to the plan s status of being fully funded at percent as of June 30th. The actuarial valuation was determined using the following actuarial assumptions: Actuarial Assumptions Valuation and measurement date June 30, 2018 Inflation 3% per year Participant data July 2017 Mortality SOA RPH-2017 Total Dataset Mortality Table fully generational using Scale MP-2017 (RPH-2017 table is based on RPH-2014 table with 8 years of mortality improvement using scale MP-2014 backed out and projected to 2017 using scale MP-2017) Payroll Growth 3% per year for future employee salary increases and increases in the Federal Poverty Limit Healthcare Trend Rates Annual healthcare trend rates vary by benefits as shown below: Medical/RX FYE Pre-Medicare Post-Medicare Dental % 7.00% 4.50% % 6.75% 4.50% % 6.50% 4.50% % 6.25% 4.50% % 6.00% 4.50% % 5.75% 4.50% % 5.50% 4.50% % 5.25% 4.50% % 5.00% 4.50% The discount rate used to measure the total OPEB liability is based on the long-term expected rate of return on OPEB plan investments that are expected to be used to finance future benefit payments to the extent that they are sufficient to pay projected benefits and that the OPEB plan assets are invested using a strategy that will achieve that return. The long-term rate of return on OPEB plan investments is assumed to be 6 percent, and the VEBA Trust is invested according to an investment strategy of 60 percent investment in stock with the remaining funds invested in bonds. Since the Trust s current balance is sufficient to pay all future expected benefit payments, the discount rate used is 6 percent. See Note 17 for additional information regarding the VEBA trust. Changes in the Net OPEB Liability (Asset) The beginning balance of the OPEB Liability presented below has been adjusted to conform to actuarial changes as required by the implementation of GASB Statement No. 75. These changes included updating the actuarial cost method from Projected Unit Credit with linear proration to decrement to Entry Age Normal Level percent of Salary and updating the payroll growth assumption from 3 to 2 percent per year to more accurately reflect the makeup of the active population. 50
 - (2,646) Benefit payments (2,948) (2,948) -")
53 (Dollars in Thousands) Total OPEB Liability (a) Balance at June 30, ,782 Increases (Decreases) Plan Fiduciary Net Position (b) Net OPEB Liability (Asset) (a) - (b) $ $ 88,857 $ (29,075) Changes for the year: Service cost Interest 3,525-3,525 Changes in assumptions Differences between expected and actual experience (2,646) - (2,646) Benefit payments (2,948) (2,948) - Net investment income - 5,052 (5,052) Trust administrative expenses - (313) 313 Net Changes (1,588) 1,791 (3,379) Balance at June 30, 2018 $ 58,194 $ 90,648 $ (32,454) A one-percentage point change in the discount rate and assumed health care cost trend rates would have the following impact on the net OPEB liability (asset) at June 30, 2018: Dollars in Thousands 1% Decrease Current 1% Increase Discount Rate $ 25,145 $ 32,454 $ 38,511 Healthcare Trend Rate $ 38,583 $ 32,454 $ 25,084 51
54 OPEB Expense and Deferred Outflows of Resources and Deferred Inflows of Resources Related to OPEB For the year ended June 30, 2018, the University recognized OPEB expense of ($1,808,000), deferred inflows related to OPEB of $1,764,000, and deferred outflows related to OPEB of $192,000 as summarized below: OPEB Expense (Dollars in Thousands) Service cost $ 412 Interest 3,525 Projected earnings on OPEB plan investments (5,235) OPEB Plan administrative expenses 313 Current period recognition of deferred outflows/(inflows) of resources: Differences between expected and actual experience $ (882) Changes in assumptions 23 Net difference between projected and actual earnings on OPEB plan 36 Total current period recognition $ (823) Total OPEB expense $ (1,808) Dollars in Thousands Deferred Outflows Deferred Inflows of Resources of Resources Difference between expected and actual experience $ $ (1,764) Changes in assumptions 46 Net difference between projected and actual earnings in OPEB plan investments 146 Total $ 192 $ (1,764) The balances of June 30, 2018 deferred outflows/(inflows) of resources will be recognized in OPEB expense in the future fiscal years as noted: Amortization of Deferred Outflows/(Inflows) of Resources (Dollars in Thousands) 2019 $ (823) 2020 (823) Thereafter - Total $ (1,572) Fiscal Year 2017 Disclosures (Pre-Implementation of GASB Statement No. 75) Funding Policy For the fiscal year ended June 30, 2017 the total pay-as-you-go costs of the plan totaled $3.6 million. The University activated the VEBA Trust as of January 1, 2014, and has been reimbursed for $3.4 million of the medical premiums paid for post-65 retirees during fiscal year Pre-65 plan members receiving benefits contributed $0.2 million, based on the required contribution rates as follows: 52
55 Participants' Monthly Contributions Wellness Incentive and Tobacco Free Wellness Incentive and Tobacco Surcharge No Wellness and Tobacco Surcharge Under Age 65 Employee Rates - Monthly $ $ $ Employees/Spouses $ $ $ Employees Below 200% of Federal Poverty Level Employees $ $ $ Employees/Spouses $ $ $ Age 65 and over (AmWins fully insured) Employee Employee/Spouse Option 1 $ $ Option 2 $ $ Annual OPEB Cost and Net OPEB Obligation The University s annual other postemployment benefit (OPEB) cost (expense) is calculated based on the annual required contribution of the employer (ARC), an amount actuarially determined in accordance with the parameters of GASB Statement 45. The ARC represents a level of funding that, if paid on an ongoing basis, is projected to cover normal cost each year and amortize any unfunded actuarial liabilities (or funding excess) over a period not to exceed 30 years. The following table shows the components of the University s annual OPEB cost for fiscal years 2015, 2016, and 2017, the amount actually contributed to the plan, and changes in the University s net OPEB obligation to the plan. GASB 45 ARC and Annual Expense (Dollars in Thousands) Annual required contribution $ - $ - $ - Interest on net OPEB obligation (980) (1,084) (1,156) Adjustment to annual required contribution 1,187 1,312 1,400 Annual OPEB cost $ 207 $ 228 $ 244 Contributions made $ (1,945) $ (1,431) $ - Increase (Decrease) in net OPEB obligation $ (1,738) $ (1,203) $ 244 Net OPEB obligation (asset) beginning of year $ (16,327) $ (18,065) $ (19,268) Net OPEB obligation (asset) end of year $ (18,065) $ (19,268) $ (19,024) The University s annual OPEB cost, the percentage of the annual OPEB cost contributed to the plan, and the net OPEB asset for the fiscal years ending as follows: (Dollars in Thousands) Percentage of Year Ending Annual OPEB Cost Annual OPEB Cost Contributed Net OPEB Asset 6/30/2017 $ % $19,024 6/30/2016 $ % $19,268 6/30/2015 $ % $18,065 Funded Status and Funding Progress As of June 30, 2017, the most recent actuarial valuation date, the plan was percent funded. The actuarial accrued liability for benefits was $56.6 million, and the actuarial value of assets was $88.9 million, resulting in an overfunded actuarial accrued liability (UAAL) of $32.3 million. The covered payroll 53

56 (annual payroll of active employees covered by the plan) was $35.9 million. The ratio of the UAAL to covered payroll was percent which indicates the OPEB plan is over 100 percent funded at fiscal year end June 30, Actuarial valuations of an ongoing plan involve estimates of the value of reported amounts and assumptions about the probability of occurrence of events far into the future. Examples include assumptions about future employment, mortality, and the healthcare cost trend. Amounts determined regarding the funded status of the plan and the annual required contributions of the employer are subject to continual revision as actual results are compared with past expectations and new estimates are made about the future. The Schedule of Funding Progress, presented below, shows multiyear trend information about whether the actuarial value of plan assets is increasing or decreasing over time relative to the actuarial accrued liabilities for benefits. Three-Year Trend Info (Dollars in Thousands) Actuarial Accrued UAAL as a Actuarial Value Liability Underfunded AAL Funded Annual Percentage of of Assets (AAL) (UAAL) Ratio Covered Payroll Covered Payroll (a) (b) (b-a) (a/b) (c) ((b-a)/c) 6/30/17 $88,856 $ 56,628 $ (32,228) 156.9% $35,932 (89.7%) 6/30/16 $85,123 $ 63,298 $ (21,824) 134.5% $39,400 (55.4%) 6/30/15 $83,921 $ 64,311 $ (19,610) 130.5% $38,252 (51.3%) 54
57 Actuarial Methods and Assumptions Projections of benefits for financial reporting purposes are based on the substantive plan (the plan as understood by the employer and the plan members) and include the types of benefits provided at the time of each valuation and the historical pattern of sharing of benefit costs between the employer and plan members to that point. The actuarial methods and assumptions used include techniques that are designed to reduce the effects of short-term volatility in actuarial accrued liabilities and the actuarial value of assets, consistent with the long-term perspective of the calculations. Valuation and measurement date June 30, 2017 Participant data July 2017 Discount rate 6% Mortality SOA RPH-2016 Total Dataset Mortality Table fully generational using Scale MP-2016 (RPH-2016 table is based on RPH-2014 table with 8 years of mortality improvement using scale MP-2014 backed out and projected to 2016 using scale MP-2016) Payroll Growth 3% per year increase was used to model future employees salary increases Healthcare Trend Rates 2% per year increase to model future increases in the Federal Poverty Limit Medical/RX FYE Pre-Medicare Post-Medicare Dental % 7.00% 4.50% % 6.75% 4.50% % 6.50% 4.50% % 6.25% 4.50% % 6.00% 4.50% % 5.75% 4.50% % 5.50% 4.50% % 5.25% 4.50% % 5.00% 4.50% Methods Actuarial cost method Assets method Amortization method Accounting method Actuarial gains/losses Projected Unit Credit with linear proration to decrement age Market value Level dollar amount over thirty years based on an open group Unit credit Reflected immediately in cost method Note 19. Subsequent Events Indiana State University issued $39,685,000 in Student Fee Bonds, Series S, on August 14, These bonds will be used to finance the renovation of the Hulman Center. The proceeds of the Series S bonds include a principal amount of $39,685,000 plus a bond premium of $4,955,000 for a total of $44,640,000. The Hulman Center renovation was approved as a $50,000,000 project, to be funded by $37,500,000 of debt of which is eligible for fee replacement and $6,800,000 of debt not eligible for fee replacement with the balance to be funded by University reserves and gifts. Site work began in July 2018 with construction beginning Fall 2018, and is scheduled for completion in Fall
58 Required Supplementary Information Schedule of Indiana State University s Proportionate Share of the Net Pension Liability Public Employees Retirement Fund (PERF) Last 10 Fiscal Years* (Dollars in Thousands) Measurement Date as of June Proportion of the net pension liability (asset) 0.39% 0.39% 0.38% 0.36% 0.36% Proportionate share of the net pension liability (asset) $ 17,182 $ 17,855 $ 15,538 $ 9,494 $ 12,387 Covered-employee payroll $ 19,086 $ 18,855 $ 18,273 $ 17,638 $ 17,364 Proportionate share of the net pension liability (asset) as a percentage of its covered-employee payroll 90.0% 94.7% 85.0% 53.8% 71.3% Plan fiduciary net position as a percentage of the total pension liability 76.6% 75.3% 77.3% 84.3% 78.8% *Schedule is intended to show information for the last 10 years. Additional years will be displayed as they become available. Schedule of Indiana State University s Contributions Public Employees Retirement Fund (PERF) Last 10 Fiscal Years* (Dollars in Thousands) Measurement Date as of June Contractually required contribution $ 2,139 $ 2,112 $ 2,047 $ 1,976 $ 1,672 Contributions in relation to the contractually required contribution $ (2,139) $ (2,112) $ (2,047) $ (1,976) $ (1,672) Contribution deficiency (excess) $ $ $ $ $ Covered-employee payroll $ 19,086 $ 18,855 $ 18,273 $ 17,638 $ 17,364 Contributions as a percentage of covered-employee payroll 11.2% 11.2% 11.2% 11.2% 9.6% *Schedule is intended to show information for the last 10 years. Additional years will be displayed as they become available. 56

59 Schedule of Indiana State University s Changes in Net OPEB Liability and Related Ratios Last 10 Fiscal Years* (Dollars in Thousands) Total OPEB liability Service cost Interest Changes of benefit terms Differences between expected and actual experience Changes of assumptions Benefit payments Net change in total OPEB liability Total OPEB liability beginning of year Total OPEB liability end of year Plan fiduciary net position Contributions employer Net investment income Benefit payments Administrative expense Net change in plan fiduciary net position Plan fiduciary net position beginning of year Plan fiduciary net position end of year Net OPEB liability end of year Plan fiduciary net position as a percentage of the total OPEB liability Covered-employee payroll Net OPEB liability as a percentage of covered-employee payroll 2018 $ 412 3, (2,646) (2,948) (1,588) 59,783 $ 58,195 $ 5,052 (2,948) (313) 1,791 88,857 $ 90,648 $ (32,453) 155.8% $ 33, % *Schedule is intended to show information for the last 10 years. Additional years will be displayed as they become available. 57
 $ $ $ (1,431) $ (1,945) $")
60 Schedule of Indiana State University s OPEB Contributions Last 10 Fiscal Years* (Dollars in Thousands) Actuarially determined contribution $ $ $ - $ $ 101 $ 522 $ 959 $ 2,548 $ 4,559 Contribution in relation to the actuarially determined contribution 1,431 1,945 2,370 3,762 5,085 5,924 7,213 Contribution deficiency (excess) $ $ $ (1,431) $ (1,945) $ (2,269) $ (3,240) $ (4,126) $ (3,376) $ (2,654) Covered-employee payroll $ 33,824 $ 35,932 $ 39,400 $ 38,252 $ 42,804 $ 41,557 $ 41,697 $ 40,483 $ 41,945 Contributions as a percentage of covered-employee payroll 0.0% 0.0% 3.6% 5.1% 5.5% 9.1% 12.2% 14.6% 17.2% *Schedule is intended to show information for the last 10 years. Additional years will be displayed as they become available. Notes to Schedule Valuation date: Fiscal year ending June 30 Methods and assumptions used to determine contribution rates: Discount rate 6% Payroll growth factor used for amortization 2% Actuarial cost method Entry Age Normal Level % of Salary Amortization type Level Dollar Amortization period (years) 30 58

61 59 Posey 14 Vanderburgh 129 Warrick 52 Spencer 29 Perry 27 Crawford 16 Harrison 39 Floyd 52 Clark 74 Decatur 52 Bartholomew 61 Jennings 27 Jackson 66 Washington 17 Scott 24 Orange 84 Lawrence 77 Monroe 135 Brown 35 Dubois 143 Pike 12 Gibson 56 Knox 91 Daviess 39 Martin 13 Greene 164 Sullivan 225 Vigo 1,788 Clay 346 Owen 77 Morgan 152 Johnson 279 Lake 627 Porter 134 LaPorte 94 St. Joseph 132 Elkhart 93 LaGrange 8 Noble 19 Kosciusko 32 Marshall 25 Starke 14 Newton 15 Jasper 60 Pulaski 7 Fulton 19 Whitley 18 Huntington 14 Wabash 16 Miami 20 Cass 32 Benton 20 White 19 Warren 35 Tippecanoe 120 Carroll 36 Howard 76 Grant 32 Delaware 66 Madison 104 Tipton 19 Clinton 41 Montgomery 119 Fountain 104 Vermillion 183 Parke 194 Putnam 170 Boone 86 Hamilton 347 Hendricks 443 Marion 1,455 Shelby 69 Henry 31 Rush 17 Hancock 115 Steuben 6 DeKalb 15 Allen 195 Wells 17 Adams 12 Blackford 7 Jay 6 Jefferson 23 Switzerland 5 Randolph 12 Wayne 42 Fayette 8 Union 5 Franklin 14 Dearborn 45 Ripley 29 Ohio 3 Indiana (92 counties) 10,119 Out-of-State (49 states) 2,864 International (81 countries) 788 Total Enrollment 13,771 Home Counties of Indiana State Students (Fall 2017) Unaudited
Message from the President...3. Independent Auditor s Report...4. Management s Discussion and Analysis...6
 Table of Contents Indiana State University Financial Report 2014-2015 Message from the President...3 Independent Auditor s Report...4 Management s Discussion and Analysis...6 Indiana State UniversityStatement
Message from the President...2. Independent Auditor s Report...4. Management s Discussion and Analysis...6
 indiana state university 1 Table of Contents Financial Report 2013-2014 Message from the President...2 Independent Auditor s Report...4 Management s Discussion and Analysis...6 Indiana State UniversityStatement
Message from the President...3. Letter of Transmittal...6. Independent Auditor s Report...7. Management s Discussion and Analysis...
 B47361 FILED 12/22/2016 Table of Contents Indiana State University Financial Report 2015-2016 Message from the President...3 Letter of Transmittal...6 Independent Auditor s Report...7 Management s Discussion
MOREHEAD STATE UNIVERSITY. Single Audit Reports Under Uniform Guidance
 Single Audit Reports Under Uniform Guidance As of and for the Years Ended June 30, 2017 and 2016 with Report of Independent Auditors M CONTENTS Management s Discussion and Analysis... 1 Report of Independent
WINSTON-SALEM STATE UNIVERSITY
 STATE OF NORTH f CAROLINA OFFICE OF THE STATE AUDITOR BETH A. WOOD, CPA WINSTON-SALEM STATE UNIVERSITY WINSTON-SALEM, NORTH CAROLINA FINANCIAL STATEMENT AUDIT REPORT FOR THE YEAR ENDED JUNE 30, 2018 A
Ohio University (a component unit of the State of Ohio) Financial Statements June 30, 2017 and 2016
 Financial Statements June 30, 2017 and 2016") (a component unit of the State of Ohio) Financial Statements Contents Independent Auditor s Report 1-3 Financial Statements Management s Discussion and Analysis 4-12 Statements of Net Position 13-14 Statements
(a component unit of the State of Ohio) Financial Statements Contents Independent Auditor s Report 1-3 Financial Statements Management s Discussion and Analysis 4-12 Statements of Net Position 13-14 Statements
FINANCIAL STATEMENT REPORT
 FINANCIAL STATEMENT REPORT FOR THE YEAR ENDED TABLE OF CONTENTS INDEPENDENT AUDITOR S REPORT... 1 MANAGEMENT S DISCUSSION AND ANALYSIS... 3 FINANCIAL STATEMENTS COLLEGE EXHIBITS A-1 STATEMENT OF NET POSITION...
UNIVERSITY OF ALASKA
 UNIVERSITY OF ALASKA (A Component Unit of the State of Alaska) Financial Statements (With Independent Auditors Report Thereon) University of Alaska (A Component Unit of the State of Alaska) Financial Statements
JOHNSON COUNTY COMMUNITY COLLEGE FINANCIAL STATEMENTS JUNE 30, 2018
 JOHNSON COUNTY COMMUNITY COLLEGE FINANCIAL STATEMENTS JUNE 30, 2018 Contents Independent Auditor s Report 1 2 Management s Discussion and Analysis 3 13 Financial Statements Statements of net position 14
Oakland University. Annual Financial Report. Years ended June 30, 2003 and 2002 with Report of Independent Auditors
 Annual Financial Report Years ended June 30, 2003 and 2002 with Report of Independent Auditors Annual Financial Statements Years ended June 30, 2003 and 2002 Contents Management s Discussion and Analysis...
Missouri Southern State University (A Component Unit of the State of Missouri) Independent Auditor s Reports and Financial Statements
 Independent Auditor s Reports and Financial Statements") (A Component Unit of the State of Missouri) Independent Auditor s Reports and Financial Statements Contents Independent Auditor s Report... 1 Management s Discussion and Analysis... 3 Financial Statements
(A Component Unit of the State of Missouri) Independent Auditor s Reports and Financial Statements Contents Independent Auditor s Report... 1 Management s Discussion and Analysis... 3 Financial Statements
The William Paterson University of New Jersey
 The William Paterson University of New Jersey (A Component Unit of the State of New Jersey) Financial Statements and Management s Discussion and Analysis Table of Contents Page Independent Auditors Report
MORGAN STATE UNIVERSITY. Financial Statements Together with Report of Independent Public Accountants
 Financial Statements Together with Report of Independent Public Accountants Years Ended JUNE 30, 2016 AND 2015 CONTENTS REPORT OF INDEPENDENT PUBLIC ACCOUNTANTS 1 MANAGEMENT S DISCUSSION AND ANALYSIS 3
Financial Statements with Supplemental Schedules. Fiscal Year Ended June 30, 2013
 Financial Statements with Supplemental Schedules Fiscal Year Ended June 30, 2013 Financial Statements with Supplemental Schedules Fiscal Year Ended June 30, 2013 Prepared by: University of Alaska Statewide
Cleveland State University (a component unit of the State of Ohio) Financial Report Including Supplemental Information June 30, 2017
 Financial Report Including Supplemental Information June 30, 2017") Cleveland State University (a component unit of the State of Ohio) Financial Report Including Supplemental Information June 30, 2017 Contents Report of Independent Auditors 1-3 Management s Discussion
Cleveland State University (a component unit of the State of Ohio) Financial Report Including Supplemental Information June 30, 2017 Contents Report of Independent Auditors 1-3 Management s Discussion
UNIVERSITY OF CENTRAL MISSOURI A COMPONENT UNIT OF THE STATE OF MISSOURI FINANCIAL STATEMENTS JUNE 30, 2017
 A COMPONENT UNIT OF THE STATE OF MISSOURI FINANCIAL STATEMENTS JUNE 30, 2017 Contents Page Independent Auditors Report... 1-3 Management s Discussion And Analysis... 4-19 Financial Statements Statement
Missouri Southern State University (A Component Unit of the State of Missouri) Independent Auditor s Reports and Financial Statements
 Independent Auditor s Reports and Financial Statements") (A Component Unit of the State of Missouri) Independent Auditor s Reports and Financial Statements Contents Independent Auditor s Report... 1 Management s Discussion and Analysis... 3 Financial Statements
(A Component Unit of the State of Missouri) Independent Auditor s Reports and Financial Statements Contents Independent Auditor s Report... 1 Management s Discussion and Analysis... 3 Financial Statements
The William Paterson University of New Jersey
 The William Paterson University of New Jersey (A Component Unit of the State of New Jersey) Financial Statements and Management s Discussion and Analysis Table of Contents Page Independent Auditors Report
UNIVERSITY OF ALASKA
 UNIVERSITY OF ALASKA (A Component Unit of the State of Alaska) Financial Statements (With Independent Auditors Report Thereon) University of Alaska (A Component Unit of the State of Alaska) Financial Statements
UNIVERSITY OF ALASKA
 UNIVERSITY OF ALASKA (A Component Unit of the State of Alaska) Financial Statements (With Independent Auditors Report Thereon) University of Alaska (A Component Unit of the State of Alaska) Financial Statements
ST. CHARLES COMMUNITY COLLEGE FINANCIAL STATEMENTS FOR THE YEARS ENDED JUNE 30, 2018 AND 2017
 ST. CHARLES COMMUNITY COLLEGE FINANCIAL STATEMENTS FOR THE YEARS ENDED JUNE 30, 2018 AND 2017 ST. CHARLES COMMUNITY COLLEGE CONTENTS PAGE INDEPENDENT AUDITORS REPORT 1 MANAGEMENT S DISCUSSION AND ANALYSIS
Auburn University Report on Federal Awards in Accordance with OMB Circular A-133 For the Year Ended September 30, 2008 EIN:
 Report on Federal Awards in Accordance with OMB Circular A-133 For the Year Ended September 30, 2008 EIN: 63-6000724 Report on Federal Awards in Accordance with OMB Circular A-133 Index September 30, 2008
Cleveland State University (a component unit of the State of Ohio) Financial Report with Supplemental Information June 30, 2018
 Financial Report with Supplemental Information June 30, 2018") Cleveland State University (a component unit of the State of Ohio) Financial Report with Supplemental Information June 30, 2018 Contents Independent Auditor s Report 1-3 Management s Discussion and Analysis
Cleveland State University (a component unit of the State of Ohio) Financial Report with Supplemental Information June 30, 2018 Contents Independent Auditor s Report 1-3 Management s Discussion and Analysis
Financial Statements with Supplemental Schedules. Fiscal Year Ended June 30, 2016
 Financial Statements with Supplemental Schedules Fiscal Year Ended June 30, 2016 Financial Statements with Supplemental Schedules Fiscal Year Ended June 30, 2016 Prepared by: University of Alaska Statewide
CENTRAL STATE UNIVERSITY Wilberforce, Ohio. FINANCIAL STATEMENTS June 30, 2017 and 2016
 Wilberforce, Ohio FINANCIAL STATEMENTS Wilberforce, Ohio FINANCIAL STATEMENTS CONTENTS INDEPENDENT AUDITOR S REPORT... 1 MANAGEMENT S DISCUSSION AND ANALYSIS (UNAUDITED)... 3 FINANCIAL STATEMENTS STATEMENTS
NORTHWESTERN OKLAHOMA STATE UNIVERSITY
 NORTHWESTERN OKLAHOMA STATE UNIVERSITY A DEPARTMENT OF THE REGIONAL UNIVERSITY SYSTEM OF OKLAHOMA ANNUAL FINANCIAL STATEMENTS AND INDEPENDENT AUDITOR S REPORT AS OF AND FOR THE YEAR ENDED JUNE 30, 2015
KENTUCKY STATE UNIVERSITY (A Component Unit of the Commonwealth of Kentucky) FINANCIAL STATEMENTS June 30, 2018
 FINANCIAL STATEMENTS June 30, 2018") (A Component Unit of the Commonwealth of Kentucky) FINANCIAL STATEMENTS FINANCIAL STATEMENTS CONTENTS INDEPENDENT AUDITOR S REPORT... 1 MANAGEMENT'S DISCUSSION AND ANALYSIS... 3 FINANCIAL STATEMENTS KENTUCKY
(A Component Unit of the Commonwealth of Kentucky) FINANCIAL STATEMENTS FINANCIAL STATEMENTS CONTENTS INDEPENDENT AUDITOR S REPORT... 1 MANAGEMENT'S DISCUSSION AND ANALYSIS... 3 FINANCIAL STATEMENTS KENTUCKY
Auditors' Opinion 1. Management s Discussion & Analysis Statement of Net Assets 13. Statement of Revenues, Expenses, and Change in Net Assets 14
 Financial Report 2001-2002 TABLE OF CONTENTS Auditors' Opinion 1 Management s Discussion & Analysis 4 11 Statement of Net Assets 13 Statement of Revenues, Expenses, and Change in Net Assets 14 Statement
STATEMENTS FINANCIAL. Unaudited Fiscal Year 2016
 STATEMENTS FINANCIAL Unaudited Fiscal Year 2016 TABLE OF CONTENTS 2 Management s Discussion and Analysis 16 Financial Statements 16 Statements of Net Position The University of Mississippi 18 Statements
SAN FRANCISCO STATE UNIVERSITY. Financial Statements. June 30, (With Independent Auditors Report Thereon)
") Financial Statements (With Independent Auditors Report Thereon) Table of Contents Page(s) Independent Auditors Report 1 2 Management s Discussion and Analysis (Unaudited) 3 14 Financial Statements: Statement
Financial Statements (With Independent Auditors Report Thereon) Table of Contents Page(s) Independent Auditors Report 1 2 Management s Discussion and Analysis (Unaudited) 3 14 Financial Statements: Statement
(A component unit of the State of Ohio) Financial Report. With Supplemental Information
 Financial Report. With Supplemental Information") (A component unit of the State of Ohio) Financial Report With Supplemental Information June 30, 2017 Board of Trustees The University of Akron 302 Butchel Common Akron, Ohio 44325 We have reviewed the
(A component unit of the State of Ohio) Financial Report With Supplemental Information June 30, 2017 Board of Trustees The University of Akron 302 Butchel Common Akron, Ohio 44325 We have reviewed the
SOUTHEAST MISSOURI STATE UNIVERSITY FINANCIAL STATEMENTS JUNE 30, 2016
 SOUTHEAST MISSOURI STATE UNIVERSITY FINANCIAL STATEMENTS JUNE 30, 2016 Contents Page Independent Auditors Report... 1-3 Management s Discussion And Analysis... 4-13 Financial Statements Statement Of Net
NEW JERSEY CITY UNIVERSITY (A Component Unit of the State of New Jersey)
") Basic Financial Statements, Management s Discussion and Analysis and Required Supplementary Information (With Independent Auditors Report Thereon) Table of Contents Page(s) Independent Auditors Report
Basic Financial Statements, Management s Discussion and Analysis and Required Supplementary Information (With Independent Auditors Report Thereon) Table of Contents Page(s) Independent Auditors Report
DURHAM TECHNICAL COMMUNITY COLLEGE
 STATE OF NORTH CAROLINA OFFICE OF THE STATE AUDITOR BETH A. WOOD, CPA DURHAM TECHNICAL COMMUNITY COLLEGE DURHAM, NORTH CAROLINA FINANCIAL STATEMENT AUDIT REPORT FOR THE YEAR ENDED JUNE 30, 2015 A COMPONENT
SOUTHWESTERN OKLAHOMA STATE UNIVERSITY ANNUAL FINANCIAL STATEMENTS AND INDEPENDENT AUDITOR S REPORTS AS OF AND FOR THE YEAR ENDED JUNE 30, 2014
 SOUTHWESTERN OKLAHOMA STATE UNIVERSITY ANNUAL FINANCIAL STATEMENTS AND INDEPENDENT AUDITOR S REPORTS AS OF AND FOR THE YEAR ENDED JUNE 30, 2014 AUDITED FINANCIAL STATEMENTS Independent Auditors Report...
Concord University. Combined Financial Statements Years Ended June 30, 2011 and 2010 and Independent Auditors Reports
 Concord University Combined Financial Statements Years Ended June 30, 2011 and 2010 and Independent Auditors Reports TABLE OF CONTENTS INDEPENDENT AUDITORS REPORT 3-4 MANAGEMENT S DISCUSSION AND ANALYSIS
FINANCIAL STATEMENTS FISCAL YEAR 2017
 FINANCIAL STATEMENTS FISCAL YEAR 2017 REPORT OF INDEPENDENT AUDITORS AND FINANCIAL STATEMENTS JUNE 30, 2017 AND 2016 INCLUDING SINGLE AUDIT REPORTS FOR THE YEAR ENDED JUNE 30, 2017 PHOTO BY BROOKE SUTTON
CALIFORNIA STATE UNIVERSITY, POMONA. Financial Statements. June 30, (With Independent Auditors Report Thereon)
") Financial Statements (With Independent Auditors Report Thereon) Table of Contents Page Independent Auditors Report 1 Management s Discussion and Analysis (Unaudited) 3 Financial Statements: Statement of
Financial Statements (With Independent Auditors Report Thereon) Table of Contents Page Independent Auditors Report 1 Management s Discussion and Analysis (Unaudited) 3 Financial Statements: Statement of
NORTH CAROLINA AGRICULTURAL AND TECHNICAL STATE UNIVERSITY
 STATE OF NORTH CAROLINA OFFICE OF THE STATE AUDITOR BETH A. WOOD, CPA NORTH CAROLINA AGRICULTURAL AND TECHNICAL STATE UNIVERSITY GREENSBORO, NORTH CAROLINA FINANCIAL STATEMENT AUDIT REPORT FOR THE YEAR
Idaho State University
 Idaho State University Financial Statements for the Years Ended June 30, 2003 and 2002 and Independent Auditors Reports Including Single Audit Reports for the Year Ended June 30, 2003 IDAHO STATE UNIVERSITY
WESTERN KENTUCKY UNIVERSITY REPORT ON AUDIT OF INSTITUTION OF HIGHER EDUCATION IN ACCORDANCE WITH OMB CIRCULAR A-133 June 30, 2009 and 2008
 REPORT ON AUDIT OF INSTITUTION OF HIGHER EDUCATION IN ACCORDANCE WITH OMB CIRCULAR A-133 REPORT ON AUDIT OF INSTITUTION OF HIGHER EDUCATION IN ACCORDANCE WITH OMB CIRCULAR A-133 CONTENTS REPORT OF INDEPENDENT
MURRAY STATE UNIVERSITY A COMPONENT UNIT OF THE COMMONWEALTH OF KENTUCKY FINANCIAL STATEMENTS JUNE 30, 2011
 A COMPONENT UNIT OF THE COMMONWEALTH OF KENTUCKY FINANCIAL STATEMENTS JUNE 30, 2011 Contents Page Independent Auditors Report... 1-2 Management s Discussion and Analysis... 3-16 Financial Statements Statements
EAST CAROLINA UNIVERSITY
 STATE OF NORTH f CAROLINA OFFICE OF THE STATE AUDITOR BETH A. WOOD, CPA EAST CAROLINA UNIVERSITY GREENVILLE, NORTH CAROLINA FINANCIAL STATEMENT AUDIT REPORT FOR THE YEAR ENDED JUNE 30, 2017 A CONSTITUENT
WESTERN KENTUCKY UNIVERSITY Bowling Green, Kentucky
 Bowling Green, Kentucky REPORT ON AUDIT OF INSTITUTION OF HIGHER EDUCATION IN ACCORDANCE WITH UNIFORM GUIDANCE June 30, 2018 Bowling Green, Kentucky REPORT ON AUDIT OF INSTITUTION OF HIGHER EDUCATION IN
CALIFORNIA STATE UNIVERSITY, NORTHRIDGE. Financial Statements. June 30, (With Independent Auditors Report Thereon)
") Financial Statements (With Independent Auditors Report Thereon) Table of Contents Page Independent Auditors Report 1 Management s Discussion and Analysis 3 Basic Financial Statements: Statement of Net
Financial Statements (With Independent Auditors Report Thereon) Table of Contents Page Independent Auditors Report 1 Management s Discussion and Analysis 3 Basic Financial Statements: Statement of Net
MORGAN STATE UNIVERSITY. Financial Statements Together with Report of Independent Public Accounts
 Financial Statements Together with Report of Independent Public Accounts For the Years Ended JUNE 30, 2013 AND 2012 CONTENTS REPORT OF INDEPENDENT PUBLIC ACCOUNTANTS 1 MANAGEMENT S DISCUSSION AND ANALYSIS
Bergen Community College (A Component Unit of the County of Bergen)
") Basic Financial Statements, Management s Discussion and Analysis and Schedules of Expenditures of Federal and State Awards (With Independent Auditors Reports Thereon) Report on Financial Statements and
Basic Financial Statements, Management s Discussion and Analysis and Schedules of Expenditures of Federal and State Awards (With Independent Auditors Reports Thereon) Report on Financial Statements and
WESTERN KENTUCKY UNIVERSITY REPORT ON AUDIT OF INSTITUTION OF HIGHER EDUCATION IN ACCORDANCE WITH OMB CIRCULAR A-133 June 30, 2006 and 2005
 REPORT ON AUDIT OF INSTITUTION OF HIGHER EDUCATION IN ACCORDANCE WITH OMB CIRCULAR A-133 June 30, 2006 and 2005 REPORT ON AUDIT OF INSTITUTION OF HIGHER EDUCATION IN ACCORDANCE WITH OMB CIRCULAR A-133
Vincennes University. Financial Report Indiana s First College. Visit Us Online at:
 Vincennes University Financial Report 2006-2007 Indiana s First College Vincennes University 1002 North First Street Vincennes, IN 47591 Visit Us Online at: www.vinu.edu Vision Vincennes University is
Bergen Community College (A Component Unit of the County of Bergen)
") Basic Financial Statements, Management s Discussion and Analysis and Schedules of Expenditures of Federal and State Awards (With Independent Auditors Reports Thereon) Report on Financial Statements and
Basic Financial Statements, Management s Discussion and Analysis and Schedules of Expenditures of Federal and State Awards (With Independent Auditors Reports Thereon) Report on Financial Statements and
The University of Mississippi. Financial Statements. Fiscal Year 2009 Unaudited
 The University of Mississippi Financial Statements Fiscal Year 2009 Unaudited Table of Contents Management Discussion & Analysis 3 Financial Statements 13 Statement of Net Assets University of Mississippi
WESTERN KENTUCKY UNIVERSITY. REPORT ON AUDIT OF INSTITUTION OF HIGHER EDUCATION IN ACCORDANCE WITH OMB CIRCULAR A-133 June 30, 2010 and 2009
 REPORT ON AUDIT OF INSTITUTION OF HIGHER EDUCATION IN ACCORDANCE WITH OMB CIRCULAR A-133 REPORT ON AUDIT OF INSTITUTION OF HIGHER EDUCATION IN ACCORDANCE WITH OMB CIRCULAR A-133 CONTENTS REPORT OF INDEPENDENT
SONOMA STATE UNIVERSITY. Financial Statements. June 30, (With Independent Auditors Report Thereon)
") Financial Statements (With Independent Auditors Report Thereon) Table of Contents Page Independent Auditors Report 1 Management s Discussion and Analysis 3 Financial Statements: Statement of Net Assets
Financial Statements (With Independent Auditors Report Thereon) Table of Contents Page Independent Auditors Report 1 Management s Discussion and Analysis 3 Financial Statements: Statement of Net Assets
Cleveland State University (a component unit of the State of Ohio) Financial Report Including Supplemental Information June 30, 2015
 Financial Report Including Supplemental Information June 30, 2015") Cleveland State University (a component unit of the State of Ohio) Financial Report Including Supplemental Information June 30, 2015 Contents Report of Independent Auditors 1-3 Management s Discussion
Cleveland State University (a component unit of the State of Ohio) Financial Report Including Supplemental Information June 30, 2015 Contents Report of Independent Auditors 1-3 Management s Discussion
UNAUDITED FINANCIAL REPORT FOR THE YEAR ENDED
 UNAUDITED FINANCIAL REPORT FOR THE YEAR ENDED JUNE 30, 2017 JAMES MADISON UNIVERSITY UNAUDITED FINANCIAL REPORT 2016 2017 TABLE OF CONTENTS Pages MANAGEMENT S DISCUSSION AND ANALYSIS 1-11 FINANCIAL STATEMENTS:
Table of Contents. On the cover: Old Main Clock Tower University Relations
 Table of Contents Presentation Letter 3 Financial Highlights 4 Enrollment Data 8 Independent Auditor's Report 13 Management Discussion and Analysis 14 Statement of Net Assets 24 Statement of Revenue, Expenses,
SAN JOSE STATE UNIVERSITY. Financial Statements. June 30, (With Independent Auditors Report Thereon)
") Financial Statements (With Independent Auditors Report Thereon) Table of Contents Page Independent Auditors Report 1 Management s Discussion and Analysis 3 Financial Statements: Statement of Net Assets
Financial Statements (With Independent Auditors Report Thereon) Table of Contents Page Independent Auditors Report 1 Management s Discussion and Analysis 3 Financial Statements: Statement of Net Assets
Financial Statements and Reports Required by Uniform Guidance June 30, 2018 and 2017 The University of Oklahoma - Norman Campus
 Financial Statements and Reports Required by Uniform Guidance June 30, 2018 and 2017 The University of Oklahoma - Norman Campus eidebailly.com Table of Contents June 30, 2018 and 2017 Independent Auditor
THE COLLEGE OF NEW JERSEY (A Component Unit of the State of New Jersey)
") THE COLLEGE OF NEW JERSEY (A Component Unit of the State of New Jersey) Basic Financial Statements, Management s Discussion and Analysis and Schedules of Expenditures of Federal and State of New Jersey
THE COLLEGE OF NEW JERSEY (A Component Unit of the State of New Jersey) Basic Financial Statements, Management s Discussion and Analysis and Schedules of Expenditures of Federal and State of New Jersey
Kent State University (a component unit of the State of Ohio)
") Kent State University (a component unit of the State of Ohio) Financial Report Including Supplementary Information June 30, 2018 Table of Contents June 30, 2018 and 2017 Page(s) Independent Auditor s Report...
Kent State University (a component unit of the State of Ohio) Financial Report Including Supplementary Information June 30, 2018 Table of Contents June 30, 2018 and 2017 Page(s) Independent Auditor s Report...
NORTH CAROLINA AGRICULTURAL & TECHNICAL STATE UNIVERSITY
 STATE OF NORTH CAROLINA OFFICE OF THE STATE AUDITOR BETH A. WOOD, CPA NORTH CAROLINA AGRICULTURAL & TECHNICAL STATE UNIVERSITY GREENSBORO, NORTH CAROLINA FINANCIAL STATEMENT AUDIT REPORT FOR THE YEAR ENDED
Montclair State University (A Component Unit of the State of New Jersey) Basic Financial Statements and Management s Discussion and Analysis
 Basic Financial Statements and Management s Discussion and Analysis") (A Component Unit of the State of New Jersey) Basic Financial Statements and Management s Discussion and Analysis Financial Statements TABLE OF CONTENTS Page Independent Auditors Report 1-2 Management
(A Component Unit of the State of New Jersey) Basic Financial Statements and Management s Discussion and Analysis Financial Statements TABLE OF CONTENTS Page Independent Auditors Report 1-2 Management
UNIVERSITY SYSTEM OF MARYLAND. Financial Statements and Supplemental Data Together with Report of Independent Public Accountants
 Financial Statements and Supplemental Data Together with Report of Independent Public Accountants For the Years Ended June 30, 2014 and 2013 Page REPORT OF INDEPENDENT PUBLIC ACCOUNTANTS 1 MANAGEMENT'S
Connecticut State University System (The System Office, Central Connecticut State University, Eastern Connecticut State University, Southern
 Connecticut State University System (The System Office, Central Connecticut State University, Eastern Connecticut State University, Southern Connecticut State University, Western Connecticut State University,
Jacksonville State University Financial Statements September 30, 2017 and 2016
 Financial Statements September 30, 2017 and 2016 Table of Contents September 30, 2017 and 2016 PART I FINANCIAL STATEMENTS PAGE Independent Auditor s Report... 1 Management s Discussion and Analysis...
UNIVERSITY OF LOUISVILLE AND AFFILIATED CORPORATIONS. A Component Unit of the Commonwealth of Kentucky
 UNIVERSITY OF LOUISVILLE AND AFFILIATED CORPORATIONS A Component Unit of the Commonwealth of Kentucky Auditor s Report and Financial Statements June 30, 2013 and 2012 UNIVERSITY OF LOUISVILLE AND AFFILIATED
WILKES COMMUNITY COLLEGE
 STATE OF NORTH CAROLINA OFFICE OF THE STATE AUDITOR BETH A. WOOD, CPA WILKES COMMUNITY COLLEGE WILKESBORO, NORTH CAROLINA FINANCIAL STATEMENT AUDIT REPORT FOR THE YEAR ENDED JUNE 30, 2018 A COMPONENT UNIT
DURHAM TECHNICAL COMMUNITY COLLEGE
 STATE OF NORTH f CAROLINA OFFICE OF THE STATE AUDITOR BETH A. WOOD, CPA DURHAM TECHNICAL COMMUNITY COLLEGE DURHAM, NORTH CAROLINA FINANCIAL STATEMENT AUDIT REPORT FOR THE YEAR ENDED JUNE 30, 2017 A COMPONENT
JOHNSON COUNTY COMMUNITY COLLEGE FINANCIAL STATEMENTS JUNE 30, 2017
 JOHNSON COUNTY COMMUNITY COLLEGE FINANCIAL STATEMENTS JUNE 30, 2017 Contents Independent Auditor s Report 1 2 Management s Discussion and Analysis 3 13 Financial Statements Statements of net position 14
KENTUCKY STATE UNIVERSITY. FINANCIAL STATEMENTS June 30, 2010 and 2009
 FINANCIAL STATEMENTS June 30, 2010 and 2009 FINANCIAL STATEMENTS June 30, 2010 and 2009 CONTENTS REPORT OF INDEPENDENT AUDITORS... 1 MANAGEMENT S DISCUSSION AND ANALYSIS... 3 FINANCIAL STATEMENTS KENTUCKY
CALIFORNIA STATE UNIVERSITY, EAST BAY. Financial Statements. June 30, (With Independent Auditors Report Thereon)
") Financial Statements (With Independent Auditors Report Thereon) Table of Contents Page Independent Auditors Report 1 Management s Discussion and Analysis 3 Financial Statements: Statement of Net Assets
Financial Statements (With Independent Auditors Report Thereon) Table of Contents Page Independent Auditors Report 1 Management s Discussion and Analysis 3 Financial Statements: Statement of Net Assets
SOUTHEAST MISSOURI STATE UNIVERSITY FINANCIAL STATEMENTS JUNE 30, 2018
 SOUTHEAST MISSOURI STATE UNIVERSITY FINANCIAL STATEMENTS JUNE 30, 2018 Contents Page Independent Auditors Report... 1-3 Management s Discussion And Analysis... 4-11 Financial Statements Statement Of Net
BALTIMORE CITY COMMUNITY COLLEGE. Financial Statements Together with Report of Independent Public Accountants
 Financial Statements Together with Report of Independent Public Accountants For the JUNE 30, 2013 AND 2012 CONTENTS REPORT OF INDEPENDENT PUBLIC ACCOUNTANTS 1 MANAGEMENT S DISCUSSION AND ANALYSIS 3 FINANCIAL
WESTFIELD STATE UNIVERSITY (an agency of the Commonwealth of Massachusetts) FINANCIAL STATEMENTS AND MANAGEMENT S DISCUSSION AND ANALYSIS
 FINANCIAL STATEMENTS AND MANAGEMENT S DISCUSSION AND ANALYSIS") FINANCIAL STATEMENTS AND MANAGEMENT S DISCUSSION AND ANALYSIS JUNE 30, 2016 Financial Statements and Management s Discussion and Analysis June 30, 2016 C O N T E N T S Independent Auditors Report 1-2 Management
FINANCIAL STATEMENTS AND MANAGEMENT S DISCUSSION AND ANALYSIS JUNE 30, 2016 Financial Statements and Management s Discussion and Analysis June 30, 2016 C O N T E N T S Independent Auditors Report 1-2 Management
WINSTON-SALEM STATE UNIVERSITY
 STATE OF NORTH f CAROLINA OFFICE OF THE STATE AUDITOR BETH A. WOOD, CPA WINSTON-SALEM STATE UNIVERSITY WINSTON-SALEM, NORTH CAROLINA FINANCIAL STATEMENT AUDIT REPORT FOR THE YEAR ENDED JUNE 30, 2017 A
Financial Statements June 30, 2017 and 2016 The University of Oklahoma - Norman Campus
 Financial Statements June 30, 2017 and 2016 The University of Oklahoma - Norman Campus Table of Contents June 30, 2017 and 2016 Independent Auditor s Report... 1 Management's Discussion and Analysis (Unaudited)...
SOUTHWESTERN OKLAHOMA STATE UNIVERSITY
 SOUTHWESTERN OKLAHOMA STATE UNIVERSITY A DEPARTMENT OF THE REGIONAL UNIVERSITY SYSTEM OF OKLAHOMA ANNUAL FINANCIAL STATEMENTS AND INDEPENDENT AUDITOR S REPORT AS OF AND FOR THE YEAR ENDED JUNE 30, 2016
CONTENTS. INDEPENDENT AUDITOR S REPORT 1 and 2 MANAGEMENT S DISCUSSION AND ANALYSIS 3-19
 CONTENTS INDEPENDENT AUDITOR S REPORT 1 and 2 MANAGEMENT S DISCUSSION AND ANALYSIS 3-19 FINANCIAL STATEMENTS Statements of net position - University 20 Statements of financial position - Foundation 21
Kent State University. Financial Report June 30, 2010
 Kent State University Financial Report June 30, 2010 Table of Contents June 30, 2010 and 2009 Page(s) Management s Discussion and Analysis (unaudited)... 1-8 Financial Statements Report of Independent
Radford, Virginia. Audited Financial Statements
 Radford, Virginia Audited Financial Statements For the Year Ended June 30, 2009 Page Left Intentionally Blank Table of Contents Management s Discussion and Analysis...1 Financial Statements...11 Statement
Table of Contents. On the cover: Morning Clock University Relations
 University of Arkansas Annual Financial Report 2008-2009 Table of Contents Presentation Letter 3 Financial Highlights 4 Enrollment Data 8 Independent Auditor's Report 13 Management Discussion and Analysis
CALIFORNIA POLYTECHNIC STATE UNIVERSITY, SAN LUIS OBISPO. Financial Statements. June 30, (With Independent Auditors Report Thereon)
") Financial Statements (With Independent Auditors Report Thereon) Table of Contents Page Independent Auditors Report 1 Management s Discussion and Analysis 3 Financial Statements: Statement of Net Assets
Financial Statements (With Independent Auditors Report Thereon) Table of Contents Page Independent Auditors Report 1 Management s Discussion and Analysis 3 Financial Statements: Statement of Net Assets
STATE OF NORTH CAROLINA
 STATE OF NORTH CAROLINA WINSTON-SALEM STATE UNIVERSITY WINSTON-SALEM, NORTH CAROLINA FINANCIAL STATEMENT AUDIT REPORT FOR THE YEAR ENDED JUNE 30, 2010 OFFICE OF THE STATE AUDITOR BETH A. WOOD, CPA STATE
STATE OF NORTH CAROLINA
 STATE OF NORTH CAROLINA WINSTON-SALEM STATE UNIVERSITY WINSTON-SALEM, NORTH CAROLINA FINANCIAL STATEMENT AUDIT REPORT FOR THE YEAR ENDED JUNE 30, 2012 OFFICE OF THE STATE AUDITOR BETH A. WOOD, CPA STATE
Finance and Facilities Committee Meeting - Agenda
 Finance and Facilities Committee Meeting - Agenda Board of Trustees Finance and Facilities Committee Meeting December 13, 2017 8:30 a.m. President s Boardroom, Millican Hall, 3 rd floor Conference call
Montclair State University (A Component Unit of The State of New Jersey) Basic Financial Statements and Management s Discussion and Analysis and
 Basic Financial Statements and Management s Discussion and Analysis and") Basic Financial Statements and Management s Discussion and Analysis and Schedules of Expenditures of Federal and State of New Jersey Awards (With Independent Auditors Reports Thereon) Financial Statements
Basic Financial Statements and Management s Discussion and Analysis and Schedules of Expenditures of Federal and State of New Jersey Awards (With Independent Auditors Reports Thereon) Financial Statements
CALIFORNIA STATE UNIVERSITY, FULLERTON. Financial Statements. June 30, (With Independent Auditors Report Thereon)
") Financial Statements (With Independent Auditors Report Thereon) Table of Contents Page Independent Auditors Report 1 Management s Discussion and Analysis (Unaudited) 3 Financial Statements: Statement of
Financial Statements (With Independent Auditors Report Thereon) Table of Contents Page Independent Auditors Report 1 Management s Discussion and Analysis (Unaudited) 3 Financial Statements: Statement of
WORCESTER STATE UNIVERSITY (AN AGENCY OF THE COMMONWEALTH OF MASSACHUSETTS) FINANCIAL STATEMENTS AND MANAGEMENT S DISCUSSION AND ANALYSIS WITH
 FINANCIAL STATEMENTS AND MANAGEMENT S DISCUSSION AND ANALYSIS WITH") (AN AGENCY OF THE COMMONWEALTH OF MASSACHUSETTS) FINANCIAL STATEMENTS AND MANAGEMENT S DISCUSSION AND ANALYSIS WITH SUPPLEMENTARY INFORMATION, STATISTICAL INFORMATION AND OTHER REPORTS YEARS ENDED JUNE
(AN AGENCY OF THE COMMONWEALTH OF MASSACHUSETTS) FINANCIAL STATEMENTS AND MANAGEMENT S DISCUSSION AND ANALYSIS WITH SUPPLEMENTARY INFORMATION, STATISTICAL INFORMATION AND OTHER REPORTS YEARS ENDED JUNE
 Table of Contents Presentation Letter 3 Financial Highlights 4 Enrollment Data 8 Independent Auditor's Report 13 Management Discussion and Analysis 14 Statement of Net Assets 24 Statement of Revenue, Expenses,
UNIVERSITY SYSTEM OF MARYLAND. Financial Statements and Supplemental Data Together with Report of Independent Public Accountants
 Financial Statements and Supplemental Data Together with Report of Independent Public Accountants For the Years Ended June 30, 2013 and 2012 Page REPORT OF INDEPENDENT PUBLIC ACCOUNTANTS 1 MANAGEMENT'S
Financial Report
 Financial Report 2016-2017 Office of the President February 15, 2018 Chairman Michael O Malley Austin Peay State University Board of Trustees 601 College Street Clarksville, TN 37040 Dear Chairman O Malley:
Montclair State University (A Component Unit of the State of New Jersey) Basic Financial Statements and Management s Discussion and Analysis
 Basic Financial Statements and Management s Discussion and Analysis") (A Component Unit of the State of New Jersey) Basic Financial Statements and Management s Discussion and Analysis Financial Statements TABLE OF CONTENTS Page Independent Auditors Report 1-2 Management
(A Component Unit of the State of New Jersey) Basic Financial Statements and Management s Discussion and Analysis Financial Statements TABLE OF CONTENTS Page Independent Auditors Report 1-2 Management
Montgomery County Community College (A Component Unit of the County of Montgomery, Pennsylvania)
") Montgomery County Community College (A Component Unit of the County of Montgomery, Pennsylvania) Financial Statements, Required Supplementary Information, and Supplementary Information Years Ended June
Montgomery County Community College (A Component Unit of the County of Montgomery, Pennsylvania) Financial Statements, Required Supplementary Information, and Supplementary Information Years Ended June
WESTERN CAROLINA UNIVERSITY
 STATE OF NORTH ff CAROLINA OFFICE OF THE STATE AUDITOR BETH A. WOOD, CPA WESTERN CAROLINA UNIVERSITY CULLOWHEE, NORTH CAROLINA FINANCIAL STATEMENT AUDIT REPORT FOR THE YEAR ENDED JUNE 30, 2017 A CONSTITUENT
JAMES MADISON UNIVERSITY REPORT ON AUDIT FOR THE YEARS ENDED JUNE 30, 2004 AND 2003
 JAMES MADISON UNIVERSITY REPORT ON AUDIT FOR THE YEARS ENDED JUNE 30, 2004 AND 2003 AUDIT SUMMARY Our audit of James Madison University for the years ended June 30, 2004 and 2003 found: the financial statements
THE COLLEGE OF NEW JERSEY (A Component Unit of the State of New Jersey)
") THE COLLEGE OF NEW JERSEY (A Component Unit of the State of New Jersey) Basic Financial Statements, Management s Discussion and Analysis and Schedules of Expenditures of Federal and State of New Jersey
THE COLLEGE OF NEW JERSEY (A Component Unit of the State of New Jersey) Basic Financial Statements, Management s Discussion and Analysis and Schedules of Expenditures of Federal and State of New Jersey
Radford, Virginia. Audited Financial Statements
 Radford, Virginia Audited Financial Statements For the Year Ended June 30, 2011 Page Left Intentionally Blank Table of Contents Management s Discussion and Analysis...1 Financial Statements...11 Statement
BRUNSWICK COMMUNITY COLLEGE (A Component Unit of the State of North Carolina)
") BRUNSWICK COMMUNITY COLLEGE (A Component Unit of the State of North Carolina) FINANCIAL STATEMENTS As of and for the Year Ended June 30, 2015 And Independent Auditor s Report TABLE OF CONTENTS INDEPENDENT
BRUNSWICK COMMUNITY COLLEGE (A Component Unit of the State of North Carolina) FINANCIAL STATEMENTS As of and for the Year Ended June 30, 2015 And Independent Auditor s Report TABLE OF CONTENTS INDEPENDENT
WESTERN KENTUCKY UNIVERSITY Bowling Green, Kentucky
 Bowling Green, Kentucky REPORT ON AUDIT OF INSTITUTION OF HIGHER EDUCATION IN ACCORDANCE WITH UNIFORM GUIDANCE June 30, 2016 Bowling Green, Kentucky REPORT ON AUDIT OF INSTITUTION OF HIGHER EDUCATION IN
SAN JOAQUIN DELTA COMMUNITY COLLEGE DISTRICT Stockton, California. FINANCIAL STATEMENTS June 30, 2015
 SAN JOAQUIN DELTA COMMUNITY COLLEGE DISTRICT Stockton, California FINANCIAL STATEMENTS June 30, 2015 FINANCIAL STATEMENTS WITH SUPPLEMENTARY INFORMATION For the Year Ended June 30, 2015 TABLE OF CONTENTS