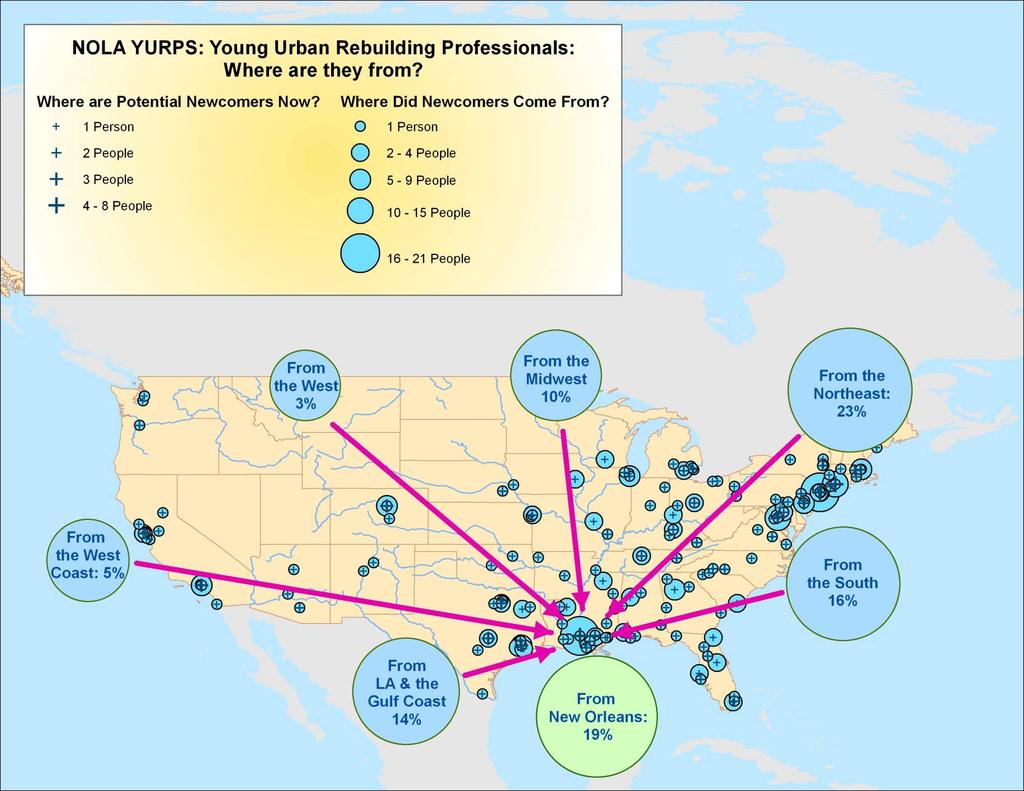
NOLA-YURP Survey July/August 2008 Preliminary Findings (N = 328 Completed Interviews) This Draft: August 23, 2008
|
|
|
- Derrick Hart
- 5 years ago
- Views:
Transcription
1 NOLA-YURP Survey July/August 2008 Preliminary Findings (N = 328 Completed Interviews) This Draft: August 23, 2008 The Samples. The NOLA-YURP Survey was conducted in July and August, 2008, of members of the professional networking website, YURP stands for Young Urban Rebuilding Professionals. There are two subsamples, people who live in Greater New Orleans, and people who live outside Greater New Orleans but are considering moving there. In this document, the first group is called NOLA YURPs and the second group is called Prospective YURPs. About three quarters of people who began the survey completed it entirely: that is, 434 people began the survey, and 328 people completed it. Although most people completed most of the survey, they did so in varying degrees. Here, we only present findings of the full completes. Of the 328 completed interviews, 263 are with NOLA YURPs, and 65 are with Prospective YURPs, for a ratio of about 80/20. The YURP samples were weighted or adjusted to approximate the joint age-gender proportions of the membership of the nolayurp.org website. Age did not change much as a result of this weighting, but gender changed from a roughly 70/30 to a 58/42 female to male ratio, which reflects the nolayurp.org membership. The sample proportion of women to men is typical of most surveys; whether the adjusted proportion accurately reflects the proportion of women among young professional newcomers is unknown. We can only say that it accurately reflects the proportion of website members. The sample is about 80 percent white, 10 percent African American, and the remainder Asian and other. There is no full information about the race of website members, so it is unknown how accurate the sample is on race; and no adjustments were made. The YURP sample is compared here to a larger sample of the general population of Greater New Orleans, of people who lived there prior to the storm. The General Sample is the result of interviewing from summer, 2006, to spring, 2008, and includes over 2,300 interviews. (This interviewing continues to the present and, with the interviews conducted over the summer of 2008, includes about 3,000 interviews. However, the recent interviews have not yet been merged into the sample.) The General Sample was collected under extremely challenging conditions, especially because telephone land lines the most common way to conduct interviews have been so incomplete and unreliable. Thus, data collection proceeded by a number of methods, including on the internet, door-to-door and face-to-face, by distribution of August 24, 2008 Page 1
2 paper questionnaires among selected groups and organizations, and including both people who have returned to Greater New Orleans and people who have not. The General Sample is also weighted or adjusted to approximate the joint age-genderrace proportions of the pre-storm population of Greater New Orleans, according to pre- Storm Census statistics. In addition, a large sample of the Jewish community was weighted down to somewhat approximate its relative size in the general community. After these adjustments, the proportion of women to men in the General sample was also about 58/42. This probably over-estimates the true number of women in the general population (true numbers are very difficult to ascertain at present), but again, it is common in almost all surveys. Finally, it should be noted that only about 3-5 percent of any of the samples are Latino. This proportion is not radically different from the pre-storm percentage of the general population, but it clearly does not capture the influx of Latinos since the Storm. There is also no systematic information about the percentage Latino of the full nolayurp.org website membership, but it probably is not dramatically higher than the sample percentage. Thus, the YURP sample represents mostly non-latino newcomers, and indeed, it probably does not capture much of the rest of the population of construction workers who have come since the Storm, whether Latino or not. The YURP sample is indeed composed of young professionals, not all young newcomers. Exact percentages and numbers of all these groups are very difficult to ascertain, and this is not attempted here. (Even the Census Bureau is struggling with this; and their best estimates for summer, 2008, will not be available for some time.) Rather, the numbers presented here give portraits of certain groups, whose absolute and relative sizes are only roughly known. August 24, 2008 Page 2
3 Age and Family Structure. As expected, the YURPs are a good deal younger than the general population. And as is typical of younger people, fewer are married or have children Age Distribution of Samples NOLA YURPs Prospective YURPs General Sample Married NOLA YURPs Prospectives General Sample August 24, 2008 Page 3
4 Number of Children One Two Three Four or more None NOLA YURPs Prospectives General Sample August 24, 2008 Page 4
5 Education and Income. The YURPs are young professionals, and they are much better educated than the general population. However, since they are just starting out and often work in nonprofits, their income is not much higher than the general population. Their income will probably rise above average as they become older and enter different occupations than they now have. Education th Grade or less High School Diploma Some College Some graduate school Some high school Vocational/Technical school College degree Graduate degree NOLA YURPs Prospectives General Sample Income NOLA YURPs Prospectives General Sample 5 45% 4 35% 3 25% 15% 1 5% Under $25,000 $25,000 to $50,000 $50,000 to $75,000 $75,000 to $100,000 $100,000 to $200,000 More than $200,000 More than $400,000 August 24, 2008 Page 5
6 Occupation and Income among the YURPs. The YURPs hold various occupations in the private, public, and nonprofit sectors; and some are students or interns. Their income varies widely, with private and public sector workers earning most, followed by those in nonprofits and the arts. Students and interns earn the least. Higher Private Sector (36%) Lower Private Sector + Government (17%) Lawyers (2%); Professor, University Admin, Scientist (3%); Business Owner (2%); Manager or Exec, Business (2%); Finance, Accounting, Advertising, Insurance, Marketing (9%); Real Estate (2%); Sales, Retail (3%); Engineer (1%); Computers, IT, Web Devel (3%); Architect, Urban Planner (2%); Analyst, Consultant, Researcher, PR (7%) Secretary, Admin Asst (2%); Service Industry (0.3%); Blue-collar worker (1%); Medical Support, Nurse (2%); Teacher, Other Educ (7%); Psychology, Social Work, Therapy (2%); Government worker (2%) Nonprofits & Arts (22%) Nonprofit, Community Organizer (14%); Artist, Musician, Actor, Writer, Journalist, Arts Business (8%) Students, Interns (17%) Student (12%); Intern, Volunteer (5%) Other (8%) Other (2%); Unemployed (5%) Income of Various Occupational Groups (YURPs only) Higher Private Sector Nonprofits & Arts Lower Private Sector + Government Students, Interns Under $15,000 $15,000 to $25,000 $25,000 to $50,000 $50,000 to $75,000 $75,000 to $100,000 $100,000 to $200,000 More than $200,000 August 24, 2008 Page 6


7 Race. A much larger percentage of the YURP samples is white than the general sample. This may also be true of the full membership of the nolayurp.org website, but it is unknown how well either reflects all young newcomers to the city. 10 Race African American White NOLA YURPs Prospectives General Sample August 24, 2008 Page 7
8 Party Preference and Ideology. Not surprisingly, the young, well-educated YURPs, many of whom work in nonprofits, are more heavily Democratic and liberal than the general population, which includes more Republicans though just as many strong Democrats and is ideologically more centrist. Party Preference NOLA YURPs Prospectives General Sample 35% 3 25% 15% 1 5% Strong Democrat Democrat Lean Democratic Independent Lean Republican Republican Strong Republican Ideology NOLA YURPs Prospectives General Sample Extremely Liberal Liberal Slightly Liberal Moderate, middle of the road Slightly Conservative Conservative Extremely Conservative August 24, 2008 Page 8
9 Religiosity. Again, not surprisingly, the young, well-educated YURPs are much more secular than the general population. As measured by attendance at services, the general population is much more religious than the YURPs. Religious Attendance Every week (or more often) Almost every week Once or twice a month A few times per year Less often than that NOLA YURPs Prospectives General Sample August 24, 2008 Page 9
10 Civic Participation. The YURPs are highly engaged in civic affairs. Civic engagement is very high in post-katrina New Orleans, and these young idealistic newcomers are generally as, or more, engaged than the general population except as parents or at their place of worship. Belong To or Participate In An adult sports club A youth organization A parents association Activities at your place of worship Belong to a Neighborhood Association A charity or social welfare organization A professional, trade, farm, or business association Any other hobby, investment, or garden clubs or societies Any other kinds of clubs or organizations NOLA YURPs General Sample August 24, 2008 Page 10

11 4 Officer of organization 35% 3 25% 15% 1 5% NOLA YURPs General Sample Attended a club meeting 10 Every week (or more often) Once or twice a month Less often than that Almost every week A few times per year Never NOLA YURPs General Sample August 24, 2008 Page 11
12 Attended any public meeting 10 Every week (or more often) Once or twice a month Less often than that Almost every week A few times per year Never NOLA YURPs General Sample August 24, 2008 Page 12
13 Social Trust. Trust is often thought to be closely related to civic engagement: trusting people feel safer to engage in civic activities. The surveys show that, in most instances, YURPs are more trusting than the general population. YURPs more often say that most people can be trusted. And they more often trust people in the public or professional realm (co-workers, people in stores, people outside their communities). However, longterm New Orleanians trust people at their church more than secular YURPs do. Most people can be trusted NOLA YURPs Prospectives General Sample Trust a Lot or Some People in your neighborhood People you work with People at your Church People who work in the stores where you shop The police in your local community People outside your community NOLA YURPs Prospectives General Sample August 24, 2008 Page 13
14 Informal Socializing. The YURPs are also very sociable. They see friends and work colleagues somewhat more than do members of the general population in a city known for its socializing. But as newcomers, they visit with relatives somewhat less often than long-term residents. Had Friends over to your Home 10 Every week (or more often) Once or twice a month Less often than that Almost every week A few times per year Never NOLA YURPs General Sample August 24, 2008 Page 14
15 Socialized with co workers outside of work 10 Every week (or more often) Once or twice a month Less often than that Almost every week A few times per year Never NOLA YURPs General Sample Visited Relatives in person or had them visit you 10 Every week (or more often) Once or twice a month Less often than that Almost every week A few times per year Never NOLA YURPs General Sample August 24, 2008 Page 15
16 Storm Recovery. Most YURPs are newcomers (some are longer-term residents), and of course, most of them moved into habitable housing. Larger percentages also moved into less damaged neighborhoods. Thus, even though they may be working on recovery, YURPs own houses and neighborhoods are better recovered than those of the general population. Recovery of Your own household Fully Recovered Mostly Recovered About Half Recovered Somewhat Recovered Not at All Recovered NOLA YURPs General Sample Recovery of Your Neighborhood Fully Recovered Mostly Recovered About Half Recovered Somewhat Recovered Not at All Recovered NOLA YURPs General Sample August 24, 2008 Page 16
17 Optimism about Recovery. Most YURPs who moved to New Orleans are optimistic about recovery, almost by definition. They certainly came with the intention of trying to help recovery. As such, they are somewhat more optimistic about the future than the general population. What is perhaps most notable is how optimistic the general population is, especially considering how much many people lost. My Neighborhood Can be Protected from Flooding Strongly believe is True Believe is True Unsure Believe is Not True Strongly believe is Not True NOLA YURPs Prospectives General Sample My Neighborhood Will be Protected from Flooding Now or Coming hurricane season Within the next five years Never In the next 12 months Someday NOLA YURPs Prospectives General Sample August 24, 2008 Page 17

18 Predict Improvement The economy in New Orleans 12 months from now The economy in New Orleans five years from now New Orleans as a place to live 12 months from now New Orleans as a place to live five years from now NOLA YURPs Prospectives General Sample August 24, 2008 Page 18
19 Ratings of Leaders. Survey after survey shows how critical people are of the government, at all levels, yet how much they approve of the efforts of nonprofits. The present surveys reflect these patterns. The YURPs are perhaps slightly less critical of state and local leaders than the general population, though more critical of President Bush. And they rate neighborhood leaders somewhat higher, though religious leaders not quite as highly (so many YURPs are secular that this may not be a reliable measure and is therefore not shown here). 10 Rate The State Government NOLA YURPs General Sample Great Good Neither Good Nor Bad Bad Terrible 10 Rate The Local Government NOLA YURPs General Sample Great Good Neither Good Nor Bad Bad Terrible August 24, 2008 Page 19
20 10 Rate President Bush NOLA YURPs General Sample Great Good Neither Good Nor Bad Bad Terrible 10 Rate Leadership of your Neighborhood Association NOLA YURPs General Sample Great Good Neither Good Nor Bad Bad Terrible August 24, 2008 Page 20


21 Intention to Stay. Significantly, the young professional newcomers to the city seem to be as committed to staying possibly more so than the general population. This cannot be an absolutely solid conclusion because of vagaries of sampling. Of course, when they consider the longer term, they are less certain, but it is significant that as many YURPs express their intention to stay as do. Stay in New Orleans Next 2 Years Very likely Somewhat likely Somewhat unlikely Very unlikely NOLA YURPs General Sample August 24, 2008 Page 21
22 10 How likely is it that you will move away from New Orleans within the next One year? Two years? Five years? Ten years? Very likely Somewhat likely Somewhat unlikely Very unlikely August 24, 2008 Page 22
23 Reasons for Staying or Leaving. We asked survey respondents their reasons for deciding whether to stay in New Orleans or leave. Unfortunately, our question wording was unintentionally ambiguous (we were trying to address both stayers and leavers and fell short). Thus, some answers are hard to interpret, and it is hard to see clear patterns. How important to you are the following in deciding whether to stay in or leave New Orleans? A major reason A reason Not a reason Despite this reason A job or business opportunity elsewhere So many family or friends have stayed Neighborhood has stayed vibrant New Orleans economic problems New Orleans crime problems Danger of more storms & flooding So many family or friends have left Church Community has stayed vibrant Neighborhood has declined Other New Orleans Problems Church Community has declined (NOLA YURPs only) August 24, 2008 Page 23
24 Other Locations Compared to New Orleans. We asked survey respondents if they think they could find another place to live they d like as well or better than New Orleans, in a variety of ways. Clearly, most people think other places have better economies and less crime; and the YURPs, who mostly came from other places, are more certain of that than are New Orleans natives. However, most people doubt that other places offer as much community closeness, including friends, family, and church. Significantly, while the YURPs have better family ties elsewhere than do native New Orleanians, they are more skeptical that they could find as a close-knit community elsewhere perhaps having experienced standard American reality intimately in the places they came from. Do you think you could find another place to live that you d like as well or better than New Orleans, In the following ways? A good economy Less crime As many family ties As many good friends A Church I like A close knit community NOLA YURPs General Sample August 24, 2008 Page 24
25 A Profile of YURP Values. We asked survey respondents what is important to them in New Orleans. A statistical method called factor analysis suggests that several realms of importance can be distinguished, in roughly this order of importance: Economic considerations, Lifestyle and Fun, Social Justice considerations, thoughts of the Long- Term Future, and Spiritual and Religious factors. How important are the following to you in New Orleans? Very Important to me Important Somewhat Important Not Very Important Not at All Important Economic Having a good job Having a good income Living in a neighborhood I like Lifestyle, Fun Enjoying good food, music, night life Having a meaningful experience while I m young Having/finding a long term intimate relationship Meeting new friends Social Justice Helping the city s recovery Social Justice; Working with the disadvantaged Working in/with a nonprofit organization Community organizing Long Term Future Seeing a long term future for myself in New Orleans Building a business; being an entrepreneur Developing skills and credentials for an eventual move away Spiritual/Religion My spiritual life Activities with church or religious organizations August 24, 2008 Page 25
26 A Profile of YURP Occupational Aspirations. We also asked survey respondents what occupations are attractive to them. Again, factor analysis suggests that several occupational areas can be distinguished, in roughly this order of attractiveness: Business and Entrepreneurial occupations, Nonprofit occupations, and the Professions and Government Service. Which occupational sectors are attractive to you? Very Attractive to me Attractive Somewhat Attractive Not Very Attractive Not at All Attractive Starting your own business, company, store Economic Business, Finance Manufacturing, Construction Nonprofits, Community work Nonprofit The Arts Education, Research Religion, spiritual Law, Politics Law, Medicine Politics, Government service August 24, 2008 Page 26
27 YURP Rebuilding Activities after the Storm. The YURPs have been very active in recovery work. Most of them have done physical rebuilding and helped raise money. Many have also performed service work with nonprofits or government agencies, either as volunteers or as interns or paid workers. Smaller numbers provided space in their own residence or provided professional or volunteer services for survivors, both in and outside Greater New Orleans. How much did you yourself do any of the following in the aftermath of the Hurricanes? A lot Some A little Did Unpaid Volunteer Work with Rebuilding Orgs Physically Worked Clearing Debris Physically Worked Repairing or Rebuilding Housing Physically Worked Gutting Housing Physical Helped Secure Resources for Survivors and Rebuilding Did Fund Raising for Survivors and Rebuilding Donated Own Money for Survivors and Rebuilding Provided Business, Financial Counseling to Survivors Financial Did Paid Work with Rebuilding Orgs Helped Provide or Distribute Information for Survivors Served in a Leadership Position with Rebuilding Orgs Worked with a Government Agency for Rebuilding Did Rebuilding Work w/ Church or Other Faith Based Org Service Provided Space in My Own Residence for Survivors Provided Transportation for Survivors and Rebuilding Provided Food and Cooked for Hurricane Survivors Provided Spiritual Support to Survivors Provided Space in Own Residence for Recovery Workers Domestic Worked w Evacuees in a Shelter or Trailer Park Outside GNO Worked with Evacuees with a Service Provider Outside GNO Have Counseling Training & Provided Counseling to Survivors Have Medical Training & Provided Med Services to Survivors Outside New Orleans August 24, 2008 Page 27
28

29
30
31
LSU Post-Hurricane Katrina Community Survey Frederick Weil, Department of Sociology, LSU -
 Are you now living in Greater New Orleans? Yes 82% 73% 88% 95% 82% 82% 92% 8% 46% 80% 82% No 18% 27% 12% 5% 18% 18% 8% 92% 54% 20% 18% What kind of housing are you now living in? Your own house or condo,
LSU Post-Hurricane Katrina Community Survey Frederick Weil, Department of Sociology, LSU -
 Are you now living in Greater New Orleans? Yes 81% 78% 85% 90% 79% 82% 95% 7% 45% No 19% 22% 15% 10% 21% 18% 5% 93% 55% What kind of housing are you now living in? Your own house or condo, which you own
Georgia - African American
 Georgia - African American 2011 53 State Survey Annotated Questionnaire 2011 Weighted n=304; Sampling Error= ±5.5% The total percent of respondents in each question may add up to more than 100% due to
Voices of 50+ Delaware: Dreams & Challenges
 2011 Voices of 50+ Delaware: Dreams & Challenges Executive Summary AARP has a strong commitment to help improve the lives of the 50+ population. As part of the Association s continuous communication with
Minnesota State Survey Annotated Questionnaire Weighted n=402; Sampling Error= ±5.0%
 S1. Are you over or under age 50? 50 and over 100% 49 or younger 0% S2. May I speak to someone in your household who is age 50 or older? Yes 100% No 0% S3. Are you a resident of... Minnesota 2011 53 State
Heartland Monitor Poll XXI
 National Sample of 1000 AMERICAN ADULTS AGE 18+ (500 on landline, 500 on cell) (Sample Margin of Error for 1,000 Respondents = ±3.1% in 95 out of 100 cases) Conducted October 22 26, 2014 via Landline and
Puerto Rico - Hispanic
 Puerto Rico - Hispanic 2011 53 State Survey Annotated Questionnaire 2011 Unweighted n=301; Sampling Error= ±5.5% The total percent of respondents in each question may add up to more than 100% due to rounding
Hunger Free Colorado
 Hunger Free Colorado Colorado Statewide Public Opinion Tracking & Issues Survey TOPLINE RESULTS December 1, 2016 Prepared By Kupersmit Research This survey of 400 telephone interviews was conducted among
Interview dates: October 23-30, 2006 Interviews: 900 black respondents, 706 registered voters, 361 likely voters (202)
") 1101 Connecticut Avenue NW, Suite 200 Washington, DC 20036 Interview dates: October 23-30, 2006 Interviews: 900 black respondents, 706 registered voters, 361 likely voters (202) 463-7300 Margin of error:
1101 Connecticut Avenue NW, Suite 200 Washington, DC 20036 Interview dates: October 23-30, 2006 Interviews: 900 black respondents, 706 registered voters, 361 likely voters (202) 463-7300 Margin of error:
Pennsylvania African American
 S1. Are you over or under age 50? 50 and over 100% 49 or younger 0% S3. Are you Black or of African American origin or descent? Yes 100% No 0% S4. May I speak to someone in your household who is age 50
New Hampshire State Survey Annotated Questionnaire Weighted n=402; Sampling Error= ±5.0%
 S1. Are you over or under age 50? New Hampshire 2011 53 State Survey Annotated Questionnaire 2011 Weighted n=402; Sampling Error= ±5.0% The total percent of respondents in each question may add up to more
Voices of 50+ Florida: Dreams & Challenges
 2011 Voices of 50+ Florida: Dreams & Challenges Executive Summary AARP has a strong commitment to help improve the lives of the 50+ population. As part of the Association s continuous communication with
Segmentation Survey. Results of Quantitative Research
 Segmentation Survey Results of Quantitative Research August 2016 1 Methodology KRC Research conducted a 20-minute online survey of 1,000 adults age 25 and over who are not unemployed or retired. The survey
S1. Our study is interested in the opinions of certain age groups. Could you please tell me your age as of your last birthday?
 2014 San Antonio, Texas Telephone Survey of Residents Age 45-64 Survey on Livable Community Annotated Questionnaire Landline and Cell phone sample n=600 Base/Representative Sample (+/- 4% maximum margin
Voices of African Americans 50+ in New York: Dreams & Challenges
 2011 Voices of African Americans 50+ in New York: Dreams & Challenges Executive Summary AARP has a strong commitment to help improve the lives of the 50+ population. As part of the Association s continuous
Louisiana African American
 S1. Are you over or under age 50? 50 and over 100% 49 or younger 0% S2. Are you Black or of African American origin or descent? Yes 100% No 0% S3. Are you a resident of... Louisiana African American 2011
Arkansas - African American
 S1. Are you over or under age 50? 50 and over 100% 49 or younger 0% S2. We are also interested in the opinions of people from different racial groups. Are you Black or of African American origin or descent?
Voices of 50+ New York:
 2011 Voices of 50+ New York: Dreams & Challenges Executive Summary AARP has a strong commitment to help improve the lives of the 50+ population. As part of the Association s continuous communication with
20% 40% 60% 80% 100% AARP
 AARP Survey of Idaho Registered Voters ages 30 64: State Health Insurance Exchange Prepared by Jennifer H. Sauer State Research, AARP State health insurance exchanges are a provision of the new health
How the Survey was Conducted Nature of the Sample: McClatchy-Marist National Poll of 1,197 Adults
 How the Survey was Conducted Nature of the Sample: McClatchy-Marist National Poll of 1,197 Adults This survey of 1,197 adults was conducted February 4 th through February 9 th, 2014 by The Marist Poll
How the Survey was Conducted Nature of the Sample: McClatchy-Marist Poll of 1,249 National Adults
 How the Survey was Conducted Nature of the Sample: McClatchy-Marist Poll of 1,249 This survey of 1,249 adults was conducted July 5 th through July 9 th, 2016 by The Marist Poll sponsored and funded in
What America Is Thinking On Energy Issues January 2015
 What America Is Thinking On Energy Issues January 2015 South Carolina Offshore Drilling Presented by: Harris Poll Interviewing: January 13-15, 2015 Respondents: 604 Registered Voters Method: Telephone
AMERICA AT HOME SURVEY American Attitudes on Homeownership, the Home-Buying Process, and the Impact of Student Loan Debt
 AMERICA AT HOME SURVEY 2017 American Attitudes on Homeownership, the Home-Buying Process, and the Impact of Student Loan Debt 1 Objective and Methodology Objective The purpose of the survey was to understand
Arkansas State Survey Annotated Questionnaire Weighted n=409; Sampling Error= ±5.0%
 Arkansas 2011 53 State Survey Annotated Questionnaire 2011 Weighted n=409; Sampling Error= ±5.0% The total percent of respondents in each question may add up to more than 100% due to rounding and multiple
Heartland Monitor Poll XXII
 National Sample of 1000 AMERICAN ADULTS AGE 18+ (500 on landline, 500 on cell) (Sample Margin of Error for 1,000 Respondents = ±3.1% in 95 out of 100 cases) Conducted February 18-22, 2015 1. Now, to start
North Carolina State Survey Annotated Questionnaire Weighted n=400; Sampling Error= ±5.0%
 S1. Are you over or under age 50? 50 and over 100% 49 or younger 0% S5. Are you a resident of... North Carolina 2011 53 State Survey Annotated Questionnaire 2011 Weighted n=400; Sampling Error= ±5.0% The
North Carolina African American
 S1. Are you over or under age 50? 50 and over 100% 49 or younger 0% S3. Are you Black or of African American origin or descent? Yes 100% No 0% S4. May I speak to someone in your household who is age 50
California - African American
 California - African American 2011 53 State Survey Annotated Questionnaire 2011 Weighted n=309; Sampling Error= ±5.5% The total percent of respondents in each question may add up to more than 100% due
California - Hispanic
 S1. Are you over or under age 50? 50 and over 100% 49 or younger 0% S2. Are you of Hispanic, Spanish, or Latino origin or descent? Yes 100% No 0% S5. Are you a resident of... California - Hispanic 2011
THE AP-GfK POLL. Conducted by GfK Roper Public Affairs & Media
 GfK Custom Research North America THE AP-GfK POLL Conducted by GfK Roper Public Affairs & Media Interview dates: September 27-30, 2008 Interviews: 1,160 adults; 808 likely voters Margin of error: +/- 2.9
What America Is Thinking Access Virginia Fall 2013
 What America Is Thinking Access Virginia Fall 2013 Created for: American Petroleum Institute Presented by: Harris Interactive Interviewing: September 24 29, 2013 Respondents: 616 Virginia Registered Voters
Topline Data Charter School Survey Prepared for the Center for Education Reform by the polling company TM, inc. Kellyanne Conway, President and CEO
 Topline Data Charter School Survey Prepared for the Center for Education Reform by the polling company TM, inc. Kellyanne Conway, President and CEO Completed Interviews: 800 Adults Nationwide (Margin of
Right direction 33% 34% Wrong track 57% 56% Neither 3% 2% Don t know / Refused 7% 7%
 Heartland Monitor Poll XIII ALLSTATE/NATIONAL JOURNAL HEARTLAND MONITOR POLL XIII National Sample of 1000 ADULTS AGE 18+ (Margin of Error = +/-3.1% in 95 out of 100 cases) Conducted May 19-23, 2012 via
LONG ISLAND INDEX SURVEY CLIMATE CHANGE AND ENERGY ISSUES Spring 2008
 LONG ISLAND INDEX SURVEY CLIMATE CHANGE AND ENERGY ISSUES Spring 2008 Pervasive Belief in Climate Change but Fewer See Direct Personal Consequences There is broad agreement among Long Islanders that global
North Carolina Survey Results
 North Carolina Survey Results Q1 Q2 Q3 Q4 In North Carolina, more than 350,000 adults, most of them working, cannot afford health insurance on the wages they are paid in industries like retail, construction,
Voices of 50+ New Hampshire: Dreams & Challenges
 2011 Voices of 50+ New Hampshire: Dreams & Challenges Executive Summary AARP has a strong commitment to help improve the lives of the 50+ population. As part of the Association s continuous communication
Voices of 50+ Hispanics in in California: Dreams & Challenges
 Voices of 50+ Hispanics in in California: Dreams & Challenges 2011 Executive Summary AARP has a strong commitment to help improve the lives of the 50+ population. As part of the Association s continuous
What America Is Thinking On Energy Issues February 2016
 What America Is Thinking On Energy Issues February 2016 South Carolina Presented by: Harris Poll Interviewing: January 22-31, 2016 Respondents: 600 Registered Voters Method: Telephone Weighting: Results
What America Is Thinking About Energy Issues February 2016 Presented by: Harris Poll
 What America Is Thinking About Energy Issues February 2016 Virginia Presented by: Harris Poll Interviewing: January 22 February 1, 2016 Respondents: 630 Registered Voters Method: Telephone Weighting: Results
MassMutual Women s Retirement Risk Study
 A P R I L 2 0 1 8 July 2018 MassMutual s Retirement Risk Study Background & Methodology Background To better understand the investment preferences and philosophies of women approaching retirement as well
Virginia registered voters age 50+ support expanding Medicaid in the state.
 2013 AARP Survey of Virginia Registered Voters Age 50+ on Medicaid Expansion Virginia registered voters age 50+ support expanding Medicaid in the state. About two-thirds (64%) of Virginia registered voters
Voices of 50+ Hispanics in New York: Dreams & Challenges
 2011 Voices of 50+ Hispanics in New York: Dreams & Challenges Executive Summary AARP has a strong commitment to help improve the lives of the 50+ population. As part of the Association s continuous communication
Marist College Institute for Public Opinion Poughkeepsie, NY Phone Fax
 Marist College Institute for Public Opinion Poughkeepsie, NY 12601 Phone 845.575.5050 Fax 845.575.5111 www.maristpoll.marist.edu Four in Ten with High Expectations For Obama s Second Term Approval Rating
Voices of 50+ Hispanics in Arizona: Dreams & Challenges
 2011 Voices of 50+ Hispanics in Arizona: Dreams & Challenges Executive Summary AARP has a strong commitment to help improve the lives of the 50+ population. As part of the Association s continuous communication
This document provides additional information on the survey, its respondents, and the variables
 This document provides additional information on the survey, its respondents, and the variables that we developed. Survey response rates In terms of the survey, its response rate for forum invitees was
Behavioral Analysis Summary for Ascension Parish During Hurricane Events
 Ascension Parish Total Population by Evacuation Phase Parish Phase 1 Evacuation Phase 2 Evacuation Phase 3 Evacuation Total Population 11,692 103,046 Ascension N/A 114,738 1 9 Total population by Evacuation
Marist College Institute for Public Opinion Poughkeepsie, NY Phone Fax
 Marist College Institute for Public Opinion Poughkeepsie, NY 12601 Phone 845.575.5050 Fax 845.575.5111 www.maristpoll.marist.edu Fewer Americans Expect Tax Refund *** Complete Tables for Poll Appended
Survey In Brief. How Well Candidates Have Explained Their Plans for Strengthening Social Security (n=398) Strengthening Medicare (n=398)
 Strengthening Medicare (n=398)") 2012 AARP Survey of New York CD 24 Registered Voters Ages 50+ on Retirement Security For more than 50 years, AARP has advocated for retirement security for all Americans. AARP in New York commissioned
2012 AARP Survey of New York CD 24 Registered Voters Ages 50+ on Retirement Security For more than 50 years, AARP has advocated for retirement security for all Americans. AARP in New York commissioned
2012 AARP Survey of New York CD 21 Registered Voters Ages 50+ on Retirement Security. Survey In Brief
 2012 AARP Survey of New York CD 21 Registered Voters Ages 50+ on Retirement Security For more than 50 years, AARP has advocated for retirement security for all Americans. AARP in New York commissioned
Marist College Institute for Public Opinion Poughkeepsie, NY Phone Fax
 Marist College Institute for Public Opinion Poughkeepsie, NY 12601 Phone 845.575.5050 Fax 845.575.5111 www.maristpoll.marist.edu NY1-Marist Poll Almost Two-Thirds Expect Another Storm NYC Will Be Ready,
Boomers at Midlife. The AARP Life Stage Study. Wave 2
 Boomers at Midlife 2003 The AARP Life Stage Study Wave 2 Boomers at Midlife: The AARP Life Stage Study Wave 2, 2003 Carol Keegan, Ph.D. Project Manager, Knowledge Management, AARP 202-434-6286 Sonya Gross
Giving, Volunteering & Participating
 2007 CANADA SURVEY OF Giving, Volunteering & Participating Lindsey Vodarek David Lasby Brynn Clarke Giving and Volunteering in Québec Findings from the Canada Survey of Giving, Volunteering, and Participating
TAXES STUDY. * = less than 1% - = question not asked/zero respondents
 FINAL DATA - April 4, 2008. Interviews conducted March 24 to April 3, 2008. Margin of sampling error for all adults: +/- 3.1 percentage points. TAXES STUDY S Q32. WHAT BEST DESCRIBES YOUR RESPONSIBILITY
Behavioral Analysis Summary for Lafourche Parish During Hurricane Events
 Lafourche Parish Total Population by Evacuation Phase Parish Phase 1 Evacuation Phase 2 Evacuation Phase 3 Evacuation Total Population 23,394 74,080 Lafourche N/A 97,474 24. 76. Total population by Evacuation
2013 AARP SURVEY OF NEW JERSEY RESIDENTS AGE 45 AND OLDER ON THE COST AND QUALITY OF ELECTRIC UTILITY SERVICES
 2013 AARP SURVEY OF NEW JERSEY RESIDENTS AGE 45 AND OLDER ON THE COST AND QUALITY OF ELECTRIC UTILITY SERVICES JUNE 2013 2013 AARP Survey of New Jersey Residents Age 45 and Older on the Cost and Quality
How the Survey was Conducted Nature of the Sample: McClatchy-Marist Poll of 1,249 National Adults
 How the Survey was Conducted Nature of the Sample: McClatchy-Marist Poll of 1,249 This survey of 1,249 adults was conducted July 22 nd through July 28 th, 2015 by The Marist Poll sponsored and funded in
CONTENTS. The National Outlook 3. Regional Economic Indicators 5. (Quarterly Focus) Volunteer Labor in Missouri
 Volunteer Labor in Missouri") The Center for Economic and Business Research S OUTHEAST MISSOURI BUSINESS INDICATORS Spring 2016 Volume 17 No. 1 CONTENTS The National Outlook 3 Regional Economic Indicators 5 (Quarterly Focus) Volunteer
The Center for Economic and Business Research S OUTHEAST MISSOURI BUSINESS INDICATORS Spring 2016 Volume 17 No. 1 CONTENTS The National Outlook 3 Regional Economic Indicators 5 (Quarterly Focus) Volunteer
TREASURE VALLEY METRO SURVEY
 TREASURE VALLEY METRO SURVEY CONDUCTED SEPTEMBER 10 22, 2016 N = 1,000 Treasure Valley Adults + Up to N=100 Owyhee County Adults Margin of Error: +/- 3.1% Table 1-1 Q1. First, to make sure we get a representative
Access and Infrastructure National April 2014
 Access and Infrastructure National April 2014 Created for: American Petroleum Institute Presented by: Nielsen Interviewing: April 3-9, 2014 Respondents: 1,003 Registered Voters Method: Telephone Sample:
Marist College Institute for Public Opinion Poughkeepsie, NY Phone Fax
 Marist College Institute for Public Opinion Poughkeepsie, NY 12601 Phone 845.575.5050 Fax 845.575.5111 www.maristpoll.marist.edu POLL MUST BE SOURCED: NBC 4 New York/Wall Street Journal/Marist Poll* Optimism
Alaska Member Opinion Survey Annotated Questionnaire
 Alaska 2012 Member Opinion Survey Annotated Questionnaire 2012 Weighted n= 599; Response Rate=24.0%; Sampling Error= ±3.9% NATIONAL 2012 Weighted n= 36,947; Response Rate=27%; Sampling Error= ±.051% Not
Women in the Labor Force: A Databook
 Cornell University ILR School DigitalCommons@ILR Federal Publications Key Workplace Documents 9-2007 Women in the Labor Force: A Databook Bureau of Labor Statistics Follow this and additional works at:
2012 AARP Survey of Minnesota Registered Voters Ages on the Development of a State Health Insurance Exchange
 2012 AARP Survey of Minnesota Registered Voters Ages 30 64 on the Development of a State Health Insurance Exchange State health insurance exchanges are a provision of the new health law passed by Congress
Arizona Member Opinion Survey Annotated Questionnaire
 Arizona 2012 Member Opinion Survey Annotated Questionnaire 2012 Weighted n= 744; Response Rate=29.7%; Sampling Error= ±3.5% NATIONAL 2012 Weighted n= 36,947; Response Rate=27%; Sampling Error= ±.051% Not
New Hampshire Member Opinion Survey Annotated Questionnaire
 New Hampshire 2012 Member Opinion Survey Annotated Questionnaire 2012 Weighted n= 685; Response Rate=27.4%; Sampling Error= ±3.7% NATIONAL 2012 Weighted n= 36,947; Response Rate=27%; Sampling Error= ±.051%
THE ASSOCIATED PRESS POLL CONDUCTED BY IPSOS-PUBLIC AFFAIRS RELEASE DATE: AUGUST 19, 2004 PROJECT # REGISTERED VOTERS/PARTY IDENTIFICATION
 1101 Connecticut Avenue NW, Suite 200 Washington, DC 20036 (202) 463-7300 Interview dates: Interviews: 1,001 adults Margin of error: +3.1 THE ASSOCIATED PRESS POLL CONDUCTED BY IPSOS-PUBLIC AFFAIRS RELEASE
Idaho Member Opinion Survey Annotated Questionnaire
 Idaho 2012 Member Opinion Survey Annotated Questionnaire 2012 Weighted n= 767; Response Rate=30.9%; Sampling Error= ±3.5% NATIONAL 2012 Weighted n= 36,947; Response Rate=27%; Sampling Error= ±.051% Not
Rhode Island Member Opinion Survey Annotated Questionnaire
 Rhode Island 2012 Member Opinion Survey Annotated Questionnaire 2012 Weighted n= 683; Response Rate=27.3%; Sampling Error= ±3.7% NATIONAL 2012 Weighted n= 36,947; Response Rate=27%; Sampling Error= ±.051%
ASSOCIATED PRESS: TAXES STUDY CONDUCTED BY IPSOS PUBLIC AFFAIRS RELEASE DATE: APRIL 7, 2005 PROJECT # REGISTERED VOTERS/ PARTY AFFILIATION
 1101 Connecticut Avenue NW, Suite 200 Washington, DC 20036 (202) 463-7300 Interview dates: Interviews: 1,001 adults Margin of error: +3.1 ASSOCIATED PRESS: TAXES STUDY CONDUCTED BY IPSOS PUBLIC AFFAIRS
Indiana Member Opinion Survey Annotated Questionnaire
 Indiana 2012 Member Opinion Survey Annotated Questionnaire 2012 Weighted n= 723; Response Rate=28.9%; Sampling Error= ±3.6% NATIONAL 2012 Weighted n= 36,947; Response Rate=27%; Sampling Error= ±.051% Not
Puerto Rico Member Opinion Survey Annotated Questionnaire
 Puerto Rico 2012 Member Opinion Survey Annotated Questionnaire 2012 Weighted n= 680; Response Rate=28.4%; Sampling Error= ±3.7% NATIONAL 2012 Weighted n= 36,947; Response Rate=27%; Sampling Error= ±.051%
ASSOCIATED PRESS: SOCIAL SECURITY STUDY CONDUCTED BY IPSOS PUBLIC AFFAIRS RELEASE DATE: MAY 5, 2005 PROJECT #
 1101 Connecticut Avenue NW, Suite 200 Washington, DC 20036 (202) 463-7300 Interview dates: Interviews: 1,000 adults, 849 registered voters Margin of error: +3.1 for all adults, +3.4 for registered voters
The National Citizen Survey
 C I T Y O F E L K G R O V E, C A 2011 Supplemental Web Survey Results 3005 30th Street 777 North Capitol Street NE, Suite 500 Boulder, CO 80301 Washington, DC 20002 ww.n-r-c.com 303-444-7863 www.icma.org
AP-AOL MONEY & FINANCE POLL
 REAL ESTATE STUDY Q17. DURING THE PAST TWO YEARS, DID YOU BUY A HOUSE OR CONDOMINIUM, OR NOT? September, 19-26 2006 YES 10% 16% NO 90% 84% Q18. HOW LIKELY IS IT THAT YOU WILL BUY A HOUSE OR CONDOMINIUM
Virginia registered voters age 50+ are more likely to vote for a candidate who prohibits lenders from charging interest rates above 36 percent.
 2013 AARP Survey of Virginia Registered Voters Age 50+ on Consumer Loans Virginia registered voters age 50+ are more likely to vote for a candidate who prohibits lenders from charging interest rates above
Women Voters Ages 50+ and the 2016 Election: Thoughts on Social Security and the Presidential Candidates
 Women Voters Ages 50+ and the 2016 Election: Thoughts on Social Security and the Presidential Candidates Annotated Questionnaire for Full Sample of 1500 Women Ages 50+ Across 15 Battleground States* (AZ,
2012 AARP Survey of New York Registered Voters Ages on the Development of a State Health Insurance Exchange
 2012 AARP Survey of New York Registered Voters Ages 30-64 on the Development of a State Health Insurance Exchange State health insurance exchanges are a provision of the new health law passed by Congress
J U N E MassMutual Retirement Income Study
 J U N E 2 0 1 8 MassMutual Retirement Income Study Background & Methodology Background To better understand the income needs and expectations of those approaching retirement as well as retirees, MassMutual
M A Y MassMutual Asian American Retirement Risk Study
 M A Y 2018 MassMutual Asian American Retirement Risk Study Background & Methodology Background To better understand the investment preferences and philosophies of those approaching retirement as well as
2016 AARP Arizona Voter Retirement Security Survey Annotation
 2016 AARP Arizona Voter Retirement Security Survey Annotation Registered Voters Age 35-70 Sampling Questions 1. Age of Respondents [35-70 Registered Voters] 35-49 37.3% 50-64 44.8% 65-70 17.9% 2. Are you
How the Survey was Conducted Nature of the Sample: MSNBC/Telemundo/Marist Poll of 1,446 National Adults
 How the Survey was Conducted Nature of the Sample: MSNBC/Telemundo/Marist Poll of 1,446 This survey of 1,446 adults was conducted March 23 rd through April 5 th, 2015 by The Marist Poll sponsored and funded
Teachers On Call. Preliminary Results of the 2005 TOC Survey November BCTF Research, TOC 2005 Survey Preliminary Findings
 Teachers On Call Preliminary Results of the 2005 TOC Survey November 2005 Survey Objectives: To map transition and work patterns; To understand employment intentions and aspirations; To document financial
Interview dates: October 23-25, 2006 Interviews: 1,000 respondents, 885 registered voters, 556 likely voters (202)
") 1101 Connecticut Avenue NW, Suite 200 Washington, DC 20036 Interview dates: Interviews: 1,000 respondents, 885 registered voters, 556 likely voters (202) 463-7300 Margin of error: +3.1 for all adults,
1101 Connecticut Avenue NW, Suite 200 Washington, DC 20036 Interview dates: Interviews: 1,000 respondents, 885 registered voters, 556 likely voters (202) 463-7300 Margin of error: +3.1 for all adults,
Random digital dial Results are weighted to be representative of registered voters Sampling Error: +/-4% at the 95% confidence level
 South Carolina Created for: American Petroleum Institute Presented by: Harris Poll Interviewing: November 18 22, 2015 Respondents: 607 Registered Voters in South Carolina Method: Telephone Sample: Random
2008 Financial Literacy Survey
 Summary Report and Topline 2008 Financial Literacy Survey Prepared by Princeton Survey Research Associates International for the National Foundation for Credit Counseling and MSN Money 04.29.08 Many economists
KEY FINDINGS. Louisiana Law Should be Changed to Cap Payday Loan APR s and Fees (n= 600 Louisiana Residents 18+)
") Summary of AARP Poll of Louisianans Age 18+: Opinions on Payday Loan Rates and Legislation, November 2013 Prepared by Aisha Bonner, AARP Research A majority of Louisianans believe that it is important
Summary of AARP Poll of Louisianans Age 18+: Opinions on Payday Loan Rates and Legislation, November 2013 Prepared by Aisha Bonner, AARP Research A majority of Louisianans believe that it is important
MILLENNIALS AND BRANDS. Prepared by: QNA May, 2016
 MILLENNIALS AND BRANDS Prepared by: QNA May, 2016 CONTENTS Background and Objectives Methodology Respondent Profile Generational Characteristics Brand Values Self-Expression Through Brand Choices Brand
Production & Offshore Drilling July 2014
 Production & Offshore Drilling July 2014 Created for: American Petroleum Institute Presented by: Nielsen Interviewing: July 10 July 13, 2014 Respondents: 1012 Registered Voters Method: Telephone Sample:
Patterns of Unemployment
 Patterns of Unemployment By: OpenStaxCollege Let s look at how unemployment rates have changed over time and how various groups of people are affected by unemployment differently. The Historical U.S. Unemployment
Americans Trust in Organizations and Individuals: An AARP Bulletin Survey
 Americans Trust in Organizations and Individuals: An AARP Bulletin Survey March 2013 Americans Trust in Organizations and Individuals: An AARP Bulletin Survey Data Collected by SSRS Report Prepared by
Women in the Labor Force: A Databook
 Cornell University ILR School DigitalCommons@ILR Federal Publications Key Workplace Documents 2-2013 Women in the Labor Force: A Databook Bureau of Labor Statistics Follow this and additional works at:
PERCEPTIONS OF EXTREME WEATHER AND CLIMATE CHANGE IN VIRGINIA
 PERCEPTIONS OF EXTREME WEATHER AND CLIMATE CHANGE IN VIRGINIA A STATEWIDE SURVEY OF ADULTS Edward Maibach, Brittany Bloodhart, and Xiaoquan Zhao July 2013 This research was funded, in part, by the National
Public Affairs Council 2017 Pulse Survey
 Public Affairs Council 2017 Pulse Survey 1. Trump and Clinton Voters Agree: Washington Can t be Trusted Nearly two-thirds (63%) of conservatives say elected officials in Washington have low honesty and
Women in the Labor Force: A Databook
 Cornell University ILR School DigitalCommons@ILR Federal Publications Key Workplace Documents 12-2011 Women in the Labor Force: A Databook Bureau of Labor Statistics Follow this and additional works at:
Public Attitudes Toward Social Security and Private Accounts
 Public Attitudes Toward Social Security and Private Accounts February 2005 Public Attitudes Toward Social Security and Private Accounts Summary of Findings Copyright by AARP, 2005 AARP Knowledge Management
Marist College Institute for Public Opinion Poughkeepsie, NY Phone Fax
 Marist College Institute for Public Opinion Poughkeepsie, NY 12601 Phone 845.575.5050 Fax 845.575.5111 www.maristpoll.marist.edu POLL MUST BE SOURCED: NBC4/Washington Post/Marist Poll* Bowser Front-Runner
How the Survey was Conducted
 How the Survey was Conducted Nature of the Sample: Exclusive Point Taken-Marist Poll of 622 This survey of 622 adults was conducted March 29 th through March 31 st, 2016 by The Marist Poll sponsored and
Rooted Flower Power Mid-scale baby boomer singles and couples rooted in established suburban communities and approaching retirement. Who We Are 93.
 L42 L L41 L42 L43 Rooted Flower Power 2.69% Bruce & Denise 2.27% Who We Are Channel Preference Head of household age Type of property 51 65 Single family 102 41 115 85.5% 296 93.7% 118 Estimated household
Marist College Institute for Public Opinion Poughkeepsie, NY Phone Fax
 Marist College Institute for Public Opinion Poughkeepsie, NY 12601 Phone 845.575.5050 Fax 845.575.5111 www.maristpoll.marist.edu Kennedy s Words Live on Fifty Years Later *** Complete Tables for Poll Appended
Financial Realities: Generational Advice. July 2010
 Financial Realities: Generational Advice July 2010 Objectives and Methodology Objectives: 1. To provide insight into Americans propensity to give advice against the backdrop of economic uncertainty. 2.