Income Inequality and the Labour Market
|
|
|
- Lucinda Willis
- 5 years ago
- Views:
Transcription
1 Income Inequality and the Labour Market Richard Blundell University College London & Institute for Fiscal Studies Robert Joyce Institute for Fiscal Studies Agnes Norris Keiller Institute for Fiscal Studies James P. Ziliak University of Kentucky & Institute for Fiscal Studies Prepared for Wages, Labour Market Policy, and the Safety Net IFS-CEP Joint Conference October 26-28, 2017
2 Motivating Issues Substantial changes in distribution of incomes have placed increased pressure on government budgets Declining employment and stagnant wages translate into reduced tax collections Increased access to and generosity of work-contingent and workeligible benefits and credits result in greater tax expenditures Latter are reinforced by changes in family structure 1
3 Background Lots of work on wage and income inequality Some papers aim for identifying causal channels o Bound and Johnson (1992); Katz and Murphy (1992); Bowlus and Robin (2004); Lemieux (2006); Autor, Katz, and Kearney (2008); Blundell, Pistaferri, Saporta-Eksten (2016) Others are more descriptive o Gosling, Machin, and Meghir (2000); Pikety and Saez (2003); Machin (2011); Burkhauser et al. (2012); Guvenen et al. (2017) Little systematic cross-country comparative work, and much less attention to the tax and transfer system in the evolution of household inequality 2
4 Our Paper We examine the labour market and welfare/tax system in its relationship with household income inequality in Great Britain and the United States spanning the 36 years from The approach we take is descriptive, but informed by structural changes in Selective labour-force participation (withdrawal in US!) Hours of work The rise of assortative mating Income insurance provided by the tax/transfer system across the wage distribution 3
5 We begin with trends in net (after-tax and transfer) income in each country and trace out Employment Þ Wages Þ Earnings Þ Family Structure Þ Household Market Income Þ Welfare Þ Gross Income Þ Taxes and Work-Based Tax Credits Þ Net Income An additional contribution is emphasis on how family structure and the tax/transfer system affect changes in incomes by fixed percentiles of the male and female wage distributions 4
6 G.B. Data Family Expenditure Survey, survey years Family Resources Survey, survey years Men and Women ages Information refers to calendar years up until 1992 and Apr-Mar financial years from 1993 onwards Taxes and transfers based on self-reported income components In base sample drop those with extreme gender-specific real average hourly wages (below 1 st percentile; above 99.9 th percentile) Reweight the data using inverse probability weight, assuming data are missing mean conditional at random 5
7 U.S. Data Current Population Survey Annual Social and Economic Supplement, survey years Men and Women ages All information refers to prior calendar year Taxes estimated via TAXSIM Drop those with imputed employment/earnings/hours or imputed whole supplement In base sample drop those with extreme gender-specific real average hourly wages (below 1 st percentile; above 99.9 th percentile) Reweight the data using inverse probability weight, assuming data are missing mean conditional at random 6
8 Trends in Net Income Net income is defined at the tax unit level, and includes earnings, nontransfer nonlabor income, transfer income, work-based tax credits, and tax payments G.B.: Transfers include all cash transfers (e.g. CTC/WTC, HB, CB, DLA, IS, ESA, JSA); tax payments include income tax, employee NICs and council tax U.S.: Transfers include SS, DI, UI, WC, SSI, TANF, SNAP; tax credits include federal and state EITC and the (additional) CTC; tax payments include federal, state, and payroll taxes Net income equivalised using modified OECD scale: { *I(spouse=1) + 0.3*#kids(< 14) + 0.5*#kids(>= 14)} 7
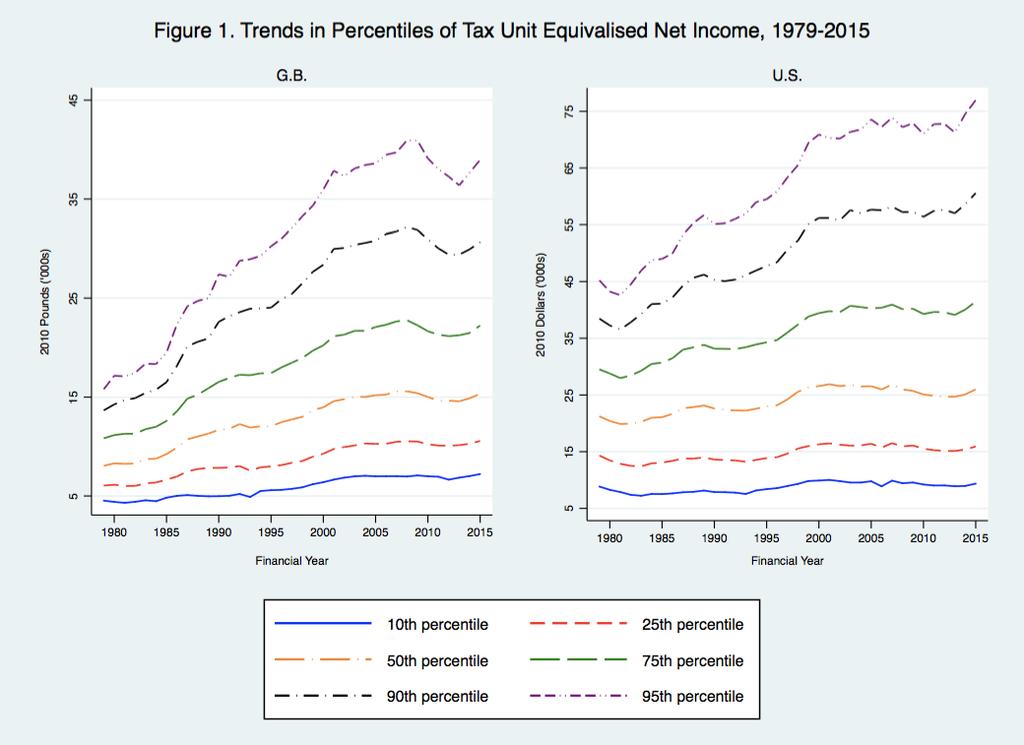
9 8

10 How do the net income trends translate into inequality? Common N.I. trends between till 2000, when GB 90/10 inequality stabilized but inequality in US continued upward. Secular rise in male earnings inequality in both countries 9
11 Unpacking Net Income Inequality Begin with trends in employment per capita by skill level G.B.: U.S.: Employment refers to survey week. Skill measured on schoolleaving age Age <= 16; Age = 17/18; Age = 19/20; Age >= 21 Employment refers to prior year. Skill measured by education attainment Less than High School; High School; Some College; College or more 10

12 Substantial education upgrading, most pronounced in G.B. 11

13 Employment lower for men in both countries at end of period, especially less skilled For women, much larger gap in US between skill groups 12
14 Wages Measure wages as median average hourly earnings prior week for G.B.; prior year for U.S. converted to real terms using CPI+ in G.B. and PCE in U.S., with 2010 base year Present both actual wages and worst-case bounds to account for possible nonrandom selection into work as seen in employment graph Implement a new procedure based on ideas from median selection rule (Neal and Johnson 1996; Chandra 2003; Blundell et al. 2007) 13
15 Bounding Wages We consider a worst case where all changes in employment in each gender and skill group relative to 1994 occur as the result of entrances and exits at the bottom of the wage distribution. This assumption implies that the bounded wage will be greater (less) than the true wage in years where the employment rate is higher (lower) than the rate in In years where the employment rate is greater than the 1994 rate, workers are re-classified as non-workers, starting with the lowest-wage first, until the employment rates align. In years where the employment rate is below the rate in the base year, randomly selected non-workers are re-classified as workers and assigned a wage equal to the 1st percentile of the gender-year wage distribution until the employment rates align. 14

16 Divergence b/t G.B. and U.S. more in evidence with wages. For all G.B. groups wages are higher in 2015 than For U.S., this is only true for skilled. 15
17 Race and the Labour Market The next two figures we disaggregate employment and wages of men and women by race Especially important in U.S. because of mass incarceration of lessskilled young black men starting in 1980s For G.B. we examine two race groups, white and non-white. Data limitations restrict attention to For U.S. we examine white and black. Other race (Asian, Pacific Islanders) suppressed as more noisy (tend to mimic white trends) 16

18 Employment rates of less-skilled non-white men in both countries is substantially lower, especially black men in U.S. No race gap for U.S. women 17

19 Wage gap of less skilled white and black men in U.S. closed greatly in mid 90s, though bounds suggest this is affected by differential labour-force withdrawal 18
20 Hours of Work In building towards earnings, we next examine trends in hours of work In G.B. we observe usual weekly hours of work In U.S. we observe both usual weekly hours worked last year, and number of weeks worked. We focus on weekly hours 19

21 Less-skilled G.B. men work much longer hours than other groups, though converged starting in late 90s. In U.S., skilled men and women work the most, though male hours declined post 2000 for all groups. G.B. women work fewest hours 20
22 Changes from For the remainder of talk the focus is on changes from We start with individual wages and earnings of men and women at the respective percentiles of own distribution, then add in cohabiting/married partners to assess role of assortative mating Wilson (1987); Blundell et al (2016); Autor et al. (2017); Kearney and Wilson (2017) 21

23 Gains across the distribution in wages and earnings in both countries. The notable exception is male earnings in G.B. reflecting the decline in work hours at the bottom of the distribution and growth in part-time work as seen in next figure 22

24 Growth of Part Time Work among Low-Wage Men in G.B. 23

25 Story for U.S. men is less rosy if extend back to Most of the gain is from

26 Big declines in marriage/cohabitation, though clearly less pronounced as move up the wage distribution. Increased presence of working partner in G.B. 25

27 And evidence of tilting in favour of assortative mating, especially in the U.S. 26
28 Changes in the Welfare State During this period there were fundamental changes to tax/transfer policy in both G.B. or U.S. Whether these are a consequence or cause of the labour market changes is not explored G.B. Large cuts in income tax rates (especially at top) during 1980s; increases in zerorate band and cuts to higher rate threshold since 2011 Expansion of work-based transfers in 1988 and (especially) 1999 and 2003 Increases in other transfers in late 1990s and early 2000s; cuts since 2011 Introduction of National Minimum Wage in 1999 U.S. Tax reforms/changes in 1981, 1986, 1990, 1993, 1997, 2001, 2003, 2009 o EITC expanded in 1986, 1990, 1993, 2009 o CTC created in 1997 Welfare reform in

29 Secular growth in transfer/credit income, and also big response to Great Recession 28
30 This growth accounts for comparable shares of gross income in both countries among less skilled, though G.B. fills more among the skilled 29
31 Putting it all together: Changes in Net Income across the Distribution At each percentile of the respective male and female wage distribution, we examine changes from in Tax unit equivalised labour income Then add in work-based tax credits Then add in other transfer and nonlabor income (Gross Income) Then subtract out tax liabilities (Net Income) First pooled, and then separated by marital status and presence of dependent children 30

32 Tax system much more accommodative in bottom half of G.B. wage distribution than in U.S., and for non-workers, the G.B. welfare state improved tax unit well being 31

33 U.S. tax system results in significant income smoothing among singles 32

34 And in both G.B. and U.S. the economic status of non-working married men has improved, and that of working women is more pronounced in U.S. in upper tail 33

35 Low-wage single men in G.B. have less growth in net income, while high-wage have higher growth compared to U.S. 34

36 Work-based tax credits, and tax-systems overall (especially GB), have lifted net incomes for families with dependent children in both countries in bottom half of the wage distribution 35
37 Conclusion 90/10 male earnings inequality rose in both countries from , but 90/10 net income inequality fell slightly in G.B., while it rose sharply in the U.S., all from upper tail changes Worst-case bounds on wages do not qualitatively change the story over the last 36 years, but align post-great Recession wage trends in G.B. and U.S. Even though there were sharp declines in hours of work among G.B. men, and declines in marriage/cohabitation, the G.B. welfare state has stabilized the economic inequality of tax units across the distribution In comparison, the U.S. tax and welfare system is less successful at counteracting changes in the labour and marriage markets that have left lowwage and less-skilled workers further behind 36
Income inequality and the labour market in Britain and the US
 Income inequality and the labour market in Britain and the US IFS Working Paper W17/25 Richard Blundell Robert Joyce Agnes Norris Keiller James P. Ziliak Income Inequality and the Labour Market in Britain
Income Inequality and the Labour Market in Britain and the US 1
 Income Inequality and the Labour Market in Britain and the US 1 Richard Blundell 2, Robert Joyce 3, Agnes Norris Keiller 4, and James P. Ziliak 5 March 2018 Abstract We study household income inequality
Income Inequality and the Labour Market in Britain and the US 1
 Income Inequality and the Labour Market in Britain and the US 1 Richard Blundell 2, Robert Joyce 3, Agnes Norris Keiller 4, and James P. Ziliak 5 March 2018 Abstract We study household income inequality
What should policy do about low earnings?
 What should policy do about low earnings? Chair: Ben Chu, The Independent Sir Richard Blundell, IFS/UCL Tito Boeri, Bocconi and FRDB Hilary Hoynes, UC Berkeley Philippe Martin, Sciences Po and Chair, Council
Tax Reform and its Implications for Inequality
 Tax Reform and its Implications for Inequality Donald Gilbert Memorial Lecture, Rochester April 25 th 2017 Richard Blundell University College London and Institute for Fiscal Studies Slide Presentation
Poverty and low pay in the UK: the state of play and the big challenges ahead
 : the state of play and the big challenges ahead Robert Joyce Agnes Norris Keiller Incomes in low paid employment Robert Joyce Hours of work have been changing narrowing earnings inequalities between women...
Poverty and low pay in the UK: the state of play and the big challenges ahead
 : the state of play and the big challenges ahead Robert Joyce Agnes Norris Keiller Poverty in the UK: past trends and future outlook Agnes Norris Keiller Measuring poverty Focus on material living standards
Effective Policy for Reducing Inequality: The Earned Income Tax Credit and the Distribution of Income
 Effective Policy for Reducing Inequality: The Earned Income Tax Credit and the Distribution of Income Hilary Hoynes, UC Berkeley Ankur Patel US Treasury April 2015 Overview The U.S. social safety net for
Poverty and income inequality
 Poverty and income inequality Jonathan Cribb Public Economics Lectures, Institute for Fiscal Studies 17 th December 2012 Overview The standard of living in the UK Income Inequality The UK income distribution
MONITORING POVERTY AND SOCIAL EXCLUSION 2013
 MONITORING POVERTY AND SOCIAL EXCLUSION 213 The latest annual report from the New Policy Institute brings together the most recent data to present a comprehensive picture of poverty in the UK. Key points
Poverty and the Safety Net After the Great Recession
 Poverty and the Safety Net After the Great Recession Deep Issues of the 2012 Elections: Equality, Liberty and Democracy, Cornell University Hilary Hoynes University of California, Davis November 2012 In
Romero Catholic Academy Gender Pay Reporting Findings
 Romero Catholic Academy Gender Pay Reporting Findings March 2018 Introduction In light of the recent Government Regulations regarding Mandatory Gender Pay Gap Reporting, Total Reward Group have been tasked
Introduction to Taxes and Transfers: Income Distribution, Poverty, Taxes and Transfers. 131 Undergraduate Public Economics Emmanuel Saez UC Berkeley
 Introduction to Taxes and Transfers: Income Distribution, Poverty, Taxes and Transfers 131 Undergraduate Public Economics Emmanuel Saez UC Berkeley 1 REMINDER: Two General Rules for Government Intervention
STATISTICS ON INCOME AND LIVING CONDITIONS (EU-SILC))
)") GENERAL SECRETARIAT OF THE NATIONAL STATISTICAL SERVICE OF GREECE GENERAL DIRECTORATE OF STATISTICAL SURVEYS DIVISION OF POPULATION AND LABOUR MARKET STATISTICS HOUSEHOLDS SURVEYS UNIT STATISTICS ON INCOME
GENERAL SECRETARIAT OF THE NATIONAL STATISTICAL SERVICE OF GREECE GENERAL DIRECTORATE OF STATISTICAL SURVEYS DIVISION OF POPULATION AND LABOUR MARKET STATISTICS HOUSEHOLDS SURVEYS UNIT STATISTICS ON INCOME
Public economics: inequality and poverty
 Agnes Norris Keiller agnes_nk@ifs.org.uk 1961 1964 1967 1970 1973 1976 1979 1982 1985 1988 1991 1994 1997 2000 2003 2006 2009 2012 2015 Real median income (2007 08 = 100) Average income at an all-time
STATE PENSIONS AND THE WELL-BEING OF
 STATE PENSIONS AND THE WELL-BEING OF THE ELDERLY IN THE UK James Banks Richard Blundell Carl Emmerson Zoë Oldfield THE INSTITUTE FOR FISCAL STUDIES WP06/14 State Pensions and the Well-Being of the Elderly
Public economics: Income Inequality
 Public economics: Income Inequality Chris Belfield Overview Measuring living standards Why do we use income? Accounting for inflation and family composition Income Inequality The UK income distribution
Women in the Labor Force: A Databook
 Cornell University ILR School DigitalCommons@ILR Federal Publications Key Workplace Documents 9-2007 Women in the Labor Force: A Databook Bureau of Labor Statistics Follow this and additional works at:
CONVERGENCES IN MEN S AND WOMEN S LIFE PATTERNS: LIFETIME WORK, LIFETIME EARNINGS, AND HUMAN CAPITAL INVESTMENT $
 CONVERGENCES IN MEN S AND WOMEN S LIFE PATTERNS: LIFETIME WORK, LIFETIME EARNINGS, AND HUMAN CAPITAL INVESTMENT $ Joyce Jacobsen a, Melanie Khamis b and Mutlu Yuksel c a Wesleyan University b Wesleyan
Living standards during the recession
 Living standards during the recession IFS Briefing Note 117 James Browne 1. Introduction Living standards during the recession James Browne Institute for Fiscal Studies 1 We are used to our incomes rising
The Gender Earnings Gap: Evidence from the UK
 Fiscal Studies (1996) vol. 17, no. 2, pp. 1-36 The Gender Earnings Gap: Evidence from the UK SUSAN HARKNESS 1 I. INTRODUCTION Rising female labour-force participation has been one of the most striking
Taxation of Earnings and the Impact on Labor Supply and Human Capital
 Taxation of Earnings and the Impact on Labor Supply and Human Capital Empirical Foundations of Supply-Side Economics BFI University of Chicago September 27 th 2013 Richard Blundell University College London
Whither Retirement Strategies?
 Whither Retirement Strategies? Discussion of Byrne & Reilly and Fitchner & Seligman papers PENSION RESEARCH COUNCIL 2017 CONFERENCE Emily Kessler, FSA, Society of Actuaries 04 May 2017 How do you prepare
Table 1 sets out national accounts information from 1994 to 2001 and includes the consumer price index and the population for these years.
 WHAT HAPPENED TO THE DISTRIBUTION OF INCOME IN SOUTH AFRICA BETWEEN 1995 AND 2001? Charles Simkins University of the Witwatersrand 22 November 2004 He read each wound, each weakness clear; And struck his
Convergences in Men s and Women s Life Patterns: Lifetime Work, Lifetime Earnings, and Human Capital Investment
 Convergences in Men s and Women s Life Patterns: Lifetime Work, Lifetime Earnings, and Human Capital Investment Joyce Jacobsen, Melanie Khamis, and Mutlu Yuksel 2 nd Version Do not cite without permission:
AN IMPORTANT POLICY ISSUE IS HOW TAX
 LONG-TERM TAX LIABILITY AND THE EFFECTS OF REFUNDABLE CREDITS* Timothy Dowd, Joint Committee on Taxation John Horowitz, Ball State University INTRODUCTION Refundable credits are increasing the level of
The Deserving Poor, the Family, and the U.S. Welfare System PAA Presidential Address
 The Deserving Poor, the Family, and the U.S. Welfare System PAA Presidential Address Robert Moffitt Johns Hopkins University May 2, 2014 Acknowledgments My wife, Emily My son, Nathan Acknowledgements Maryland
Wage Progression in the UK
 Wage Progression in the UK Monica Costa Dias Robert Joyce DWP meeting, January 2017 Outline Brief overview of recent and planned research relating to earnings progression Women: wages over the lifecycle,
Public economics: Inequality and Poverty
 Public economics: Inequality and Poverty Chris Belfield Overview Measuring living standards Why do we use income? Accounting for inflation and family composition Income Inequality The UK income distribution
Consumption and Income Inequality in the U.S. Since the 1960s* July 28, Abstract
 Consumption and Income Inequality in the U.S. Since the 1960s* July 28, 2017 Bruce D. Meyer University of Chicago and NBER and Abstract James X. Sullivan University of Notre Dame and the Wilson Sheehan
UNEMPLOYMENT RATES IMPROVING IN THE DISTRICT By Caitlin Biegler
 An Affiliate of the Center on Budget and Policy Priorities 820 First Street NE, Suite 460 Washington, DC 20002 (202) 408-1080 Fax (202) 408-8173 www.dcfpi.org UNEMPLOYMENT RATES IMPROVING IN THE DISTRICT
Gender Pay Differences: Progress Made, but Women Remain Overrepresented Among Low- Wage Workers
 Cornell University ILR School DigitalCommons@ILR Federal Publications Key Workplace Documents 10-2011 Gender Pay Differences: Progress Made, but Women Remain Overrepresented Among Low- Wage Workers Government
TRADE UNION MEMBERSHIP Statistical Bulletin
 TRADE UNION MEMBERSHIP 2016 Statistical Bulletin May 2017 Contents Introduction 3 Key findings 5 1. Long Term and Recent Trends 6 2. Private and Public Sectors 13 3. Personal and job characteristics 16
The labor market in Australia,
 GARRY BARRETT University of Sydney, Australia, and IZA, Germany The labor market in Australia, 2000 2016 Sustained economic growth led to reduced unemployment and real earnings growth, but prosperity has
GAO GENDER PAY DIFFERENCES. Progress Made, but Women Remain Overrepresented among Low-Wage Workers. Report to Congressional Requesters
 GAO United States Government Accountability Office Report to Congressional Requesters October 2011 GENDER PAY DIFFERENCES Progress Made, but Women Remain Overrepresented among Low-Wage Workers GAO-12-10
Economic Standard of Living
 DESIRED OUTCOMES New Zealand is a prosperous society, reflecting the value of both paid and unpaid work. All people have access to adequate incomes and decent, affordable housing that meets their needs.
ESTIMATING PENSION WEALTH OF ELSA RESPONDENTS
 ESTIMATING PENSION WEALTH OF ELSA RESPONDENTS James Banks Carl Emmerson Gemma Tetlow THE INSTITUTE FOR FISCAL STUDIES WP05/09 Estimating Pension Wealth of ELSA Respondents James Banks*, Carl Emmerson and
Online Appendix: Revisiting the German Wage Structure
 Online Appendix: Revisiting the German Wage Structure Christian Dustmann Johannes Ludsteck Uta Schönberg This Version: July 2008 This appendix consists of three parts. Section 1 compares alternative methods
Living standards, poverty and inequality in the UK: Jonathan Cribb Agnes Norris Keiller Tom Waters
 Living standards, poverty and inequality in the UK: 2018 Jonathan Cribb Agnes Norris Keiller Tom Waters Living standards, poverty and inequality in the UK: 2018 Jonathan Cribb Agnes Norris Keiller Tom
Trend Analysis of Changes to Population and Income in Philadelphia, using American Community Survey (ACS) Data
 Data") OFFICE OF THE PRESIDENT FINANCE AND BUDGET TEAM City Council of Philadelphia 9.22.17 Trend Analysis of Changes to Population and Income in Philadelphia, using 2010-2016 American Community Survey (ACS)
OFFICE OF THE PRESIDENT FINANCE AND BUDGET TEAM City Council of Philadelphia 9.22.17 Trend Analysis of Changes to Population and Income in Philadelphia, using 2010-2016 American Community Survey (ACS)
The Economic Case for Raising the Minimum Wage. Council of Economic Advisers
 The Economic Case for Raising the Minimum Wage Council of Economic Advisers February 12, 2014 The Inflation-Adjusted Value of the Minimum Wage Has Fallen by a Third From Its Peak Minimum Hourly Wage for
Effective Anti-poverty Programs in the U.S
 Effective Anti-poverty Programs in the U.S Hilary Hoynes, University of California, Davis SIEPR Policy Forum on Reducing Global Poverty May 2008 1 Roadmap of talk Poverty: Definitions Poverty: Facts Government
An Analysis of Public and Private Sector Earnings in Ireland
 An Analysis of Public and Private Sector Earnings in Ireland 2008-2013 Prepared in collaboration with publicpolicy.ie by: Justin Doran, Nóirín McCarthy, Marie O Connor; School of Economics, University
Economic Standard of Living
 DESIRED OUTCOMES New Zealand is a prosperous society where all people have access to adequate incomes and enjoy standards of living that mean they can fully participate in society and have choice about
ECON 361: Income Distributions and Problems of Inequality
 ECON 361: Income Distributions and Problems of Inequality David Rosé Queen s University January 29, 2018 1/1 Last class... Taxes and Transfers The Tale of the Tails Today... Assignment 1 posted Inequality
Identifying the Elasticity of Taxable Income
 Identifying the Elasticity of Taxable Income Sarah K. Burns Center for Poverty Research and Department of Economics University of Kentucky James P. Ziliak* Center for Poverty Research and Department of
Monitoring the Performance
 Monitoring the Performance of the South African Labour Market An overview of the Sector from 2014 Quarter 1 to 2017 Quarter 1 Factsheet 19 November 2017 South Africa s Sector Government broadly defined
Incomes and inequality: the last decade and the next parliament
 Incomes and inequality: the last decade and the next parliament IFS Briefing Note BN202 Andrew Hood and Tom Waters Incomes and inequality: the last decade and the next parliament Andrew Hood and Tom Waters
The labor market in South Korea,
 JUNGMIN LEE Seoul National University, South Korea, and IZA, Germany The labor market in South Korea, The labor market stabilized quickly after the 1998 Asian crisis, but rising inequality and demographic
MALTA 1 MAIN CHARACTERISTICS OF THE PENSIONS SYSTEM
 MALTA 1 MAIN CHARACTERISTICS OF THE PENSIONS SYSTEM In Malta the mandatory earning related pension scheme covers old-age pensions, survivor's benefits and invalidity pensions for employed people. It is
Redistribution under OASDI: How Much and to Whom?
 9 Redistribution under OASDI: How Much and to Whom? Lee Cohen, Eugene Steuerle, and Adam Carasso T his chapter presents the results from a study of redistribution in the Social Security program under current
Gender Differences in the Labor Market Effects of the Dollar
 Gender Differences in the Labor Market Effects of the Dollar Linda Goldberg and Joseph Tracy Federal Reserve Bank of New York and NBER April 2001 Abstract Although the dollar has been shown to influence
The impact of tax and benefit reforms by sex: some simple analysis
 The impact of tax and benefit reforms by sex: some simple analysis IFS Briefing Note 118 James Browne The impact of tax and benefit reforms by sex: some simple analysis 1. Introduction 1 James Browne Institute
Demographic and Economic Characteristics of Children in Families Receiving Social Security
 Each month, over 3 million children receive benefits from Social Security, accounting for one of every seven Social Security beneficiaries. This article examines the demographic characteristics and economic
Gabriel Zucman. Inequality: Are we really 'all in this together'? #ElectionEconomics PAPER EA030
 PAPER EA030 A series of background briefings on the policy issues in the May 2015 UK General Election Inequality: Are we really 'all in this together'? Gabriel Zucman #ElectionEconomics CEP ELECTION ANALYSIS
Unequal pay or unequal employment? A cross-country analysis of gender gaps
 Unequal pay or unequal employment? A cross-country analysis of gender gaps Claudia Olivetti Boston University Barbara Petrongolo London School of Economics CEP, CEPR and IZA First draft, March 2005 Abstract
Women in the Labor Force: A Databook
 Cornell University ILR School DigitalCommons@ILR Federal Publications Key Workplace Documents 12-2011 Women in the Labor Force: A Databook Bureau of Labor Statistics Follow this and additional works at:
EVIDENCE ON INEQUALITY AND THE NEED FOR A MORE PROGRESSIVE TAX SYSTEM
 EVIDENCE ON INEQUALITY AND THE NEED FOR A MORE PROGRESSIVE TAX SYSTEM Revenue Summit 17 October 2018 The Australia Institute Patricia Apps The University of Sydney Law School, ANU, UTS and IZA ABSTRACT
Is Government the Problem or the Solution to U.S. Labor Market Challenges?
 Is Government the Problem or the Solution to U.S. Labor Market Challenges? Jason Furman Harvard Kennedy School & Peterson Institute for International Economics Federal Reserve Bank of Minneapolis Minneapolis,
Women in the Labor Force: A Databook
 Cornell University ILR School DigitalCommons@ILR Federal Publications Key Workplace Documents 2-2013 Women in the Labor Force: A Databook Bureau of Labor Statistics Follow this and additional works at:
New Jersey Public-Private Sector Wage Differentials: 1970 to William M. Rodgers III. Heldrich Center for Workforce Development
 New Jersey Public-Private Sector Wage Differentials: 1970 to 2004 1 William M. Rodgers III Heldrich Center for Workforce Development Bloustein School of Planning and Public Policy November 2006 EXECUTIVE
The Changing Effects of Social Protection on Poverty
 The Changing Effects of Social Protection on Poverty Arbeitspapier Nr. 22 Brian Nolan, Richard Hauser, Jean-Paul Zoyem with the collaboration of Beate Hock, Mohammad Azhar Hussain, Sheila Jacobs, Charlotte
Identifying the Elasticity of Taxable Income
 Identifying the Elasticity of Taxable Income Sarah K. Burns Center for Poverty Research Department of Economics University of Kentucky James P. Ziliak* Center for Poverty Research Department of Economics
Women in the Egyptian Labor Market An Analysis of Developments from 1988 to 2006
 Women in the Egyptian Labor Market An Analysis of Developments from 1988 to 2006 1 B Y R A G U I A S S A A D P O P U L A T I O N C O U N C I L A N D F A T M A E L - H A M I D I U N I V E R S I T Y O F
Poverty, the Social Safety Net and the Great Recession
 Poverty, the Social Safety Net and the Great Recession Hilary Hoynes, University of California Berkeley IX Rodolfo Debenedetti Lecture October 15, 2014 Bocconi University Overview The Great Recession led
Understanding reductions in the gender wage differential
 Understanding reductions in the gender wage differential 1997-2003 New Zealand Conference on Pay and Employment Equity for Women Wellington, 28-29 June 2004 Sylvia Dixon Labour Market Policy Group Department
The economic impact of increasing the National Minimum Wage and National Living Wage to 10 per hour
 The economic impact of increasing the National Minimum Wage and National Living Wage to 10 per hour A report for Unite by Howard Reed (Director, Landman Economics) June 2018 Acknowledgements This research
P o v e r t y T r e n d s b y Family Type, Highlights. What do we mean by families and unattached individuals?
 NATIONAL COUNCIL OF WELFARE REPORTS No.2 P o v e r t y P r o f i l e 2 0 0 7 P o v e r t y T r e n d s b y Family Type, 1976-2007 Highlights There are noticeable differences in poverty rates and trends
NBER WORKING PAPER SERIES TRENDS IN THE LEVEL AND DISTRIBUTION OF INCOME SUPPORT. Robert A. Moffitt John Karl Scholz
 NBER WORKING PAPER SERIES TRENDS IN THE LEVEL AND DISTRIBUTION OF INCOME SUPPORT Robert A. Moffitt John Karl Scholz Working Paper 15488 http://www.nber.org/papers/w15488 NATIONAL BUREAU OF ECONOMIC RESEARCH
The Role of CPS Non-Response on Trends in Poverty and Inequality
 The Role of CPS Non-Response on Trends in Poverty and Inequality Charles Hokayem, U.S. Census Bureau James P. Ziliak, Department of Economics and Center for Poverty Research, University of Kentucky Christopher
A Single-Tier Pension: What Does It Really Mean? Appendix A. Additional tables and figures
 A Single-Tier Pension: What Does It Really Mean? Rowena Crawford, Soumaya Keynes and Gemma Tetlow Institute for Fiscal Studies Appendix A. Additional tables and figures Table A.1. Characteristics of those
Public Economics: Poverty and Inequality
 Public Economics: Poverty and Inequality Andrew Hood Overview Why do we use income? Income Inequality The UK income distribution Measures of income inequality Explaining changes in income inequality Income
Gender Pay Gap Report 2017
 Gender Pay Gap Report 2017 Pay And The Bonus Gap Pay difference between men and women HOURLY PAY BONUS PAID Mean * 14.1% 29.1% Median * 5.3% 48.8% Fig. 1. The table above shows our overall mean and median
Massachusetts Household Survey on Health Insurance Status, 2007
 Massachusetts Household Survey on Health Insurance Status, 2007 Division of Health Care Finance and Policy Executive Office of Health and Human Services Massachusetts Household Survey Methodology Administered
Program on Retirement Policy Number 1, February 2011
 URBAN INSTITUTE Retirement Security Data Brief Program on Retirement Policy Number 1, February 2011 Poverty among Older Americans, 2009 Philip Issa and Sheila R. Zedlewski About one in three Americans
Poverty and Income Inequality in Scotland: 2013/14 A National Statistics publication for Scotland
 Poverty and Income Inequality in Scotland: 2013/14 A National Statistics publication for Scotland EQUALITY, POVERTY AND SOCIAL SECURITY This publication presents annual estimates of the percentage and
Economic Standard of Living
 DESIRED OUTCOMES New Zealand is a prosperous society, reflecting the value of both paid and unpaid work. All people have access to adequate incomes and decent, affordable housing that meets their needs.
SALARY EQUITY ANALYSIS AT ARL INSTITUTIONS
 SALARY EQUITY ANALYSIS AT ARL INSTITUTIONS Quinn Galbraith, MSS & MLS - Sociology and Family Life Librarian, ARL Visiting Program Officer Michael Groesbeck, BS - Statistician Brigham R. Frandsen, PhD -
Women s pay and employment update: a public/private sector comparison
 Women s pay and employment update: a public/private sector comparison Report for Women s Conference 01 Women s pay and employment update: a public/private sector comparison Women s employment has been
Investment, Human Capital and Growth
 Investment, Human Capital and Growth Kevin Murphy, PhD 86 January 17, 2013 U.S. Real Per Capita GDP 1889-2012 10.75 10.25 Log of Real Per Capita GDP 9.75 9.25 8.75 8.25 1880 1900 1920 1940 1960 1980 2000
Public-private sector pay differential in UK: A recent update
 Public-private sector pay differential in UK: A recent update by D H Blackaby P D Murphy N C O Leary A V Staneva No. 2013-01 Department of Economics Discussion Paper Series Public-private sector pay differential
Nonlinear Persistence and Partial Insurance: Income and Consumption Dynamics in the PSID
 AEA Papers and Proceedings 28, 8: 7 https://doi.org/.257/pandp.2849 Nonlinear and Partial Insurance: Income and Consumption Dynamics in the PSID By Manuel Arellano, Richard Blundell, and Stephane Bonhomme*
ESSAYS ON INCOME VOLATILITY AND INDIVIDUAL WELL-BEING
 University of Kentucky UKnowledge University of Kentucky Doctoral Dissertations Graduate School 2011 ESSAYS ON INCOME VOLATILITY AND INDIVIDUAL WELL-BEING Bradley L. Hardy University of Kentucky, bradley.hardy@gmail.com
Appendix A. Additional Results
 Appendix A Additional Results for Intergenerational Transfers and the Prospects for Increasing Wealth Inequality Stephen L. Morgan Cornell University John C. Scott Cornell University Descriptive Results
institution Top 10 to 20 undergraduate
 Appendix Table A1 Who Responded to the Survey Dynamics of the Gender Gap for Young Professionals in the Financial and Corporate Sectors By Marianne Bertrand, Claudia Goldin, Lawrence F. Katz On-Line Appendix
Increasing the Minimum Wage to $10.10: A Win-Win for New Jersey
 April 2014 Increasing the Minimum Wage to $10.10: A Win-Win for New Jersey Measure Would Provide Greater Economic Security to Three-Quarters of a Million New Jerseyans and Give the State s Economy a Modest
Heterogeneity in the Impact of Economic Cycles and the Great Recession: Effects Within and Across the Income Distribution
 Heterogeneity in the Impact of Economic Cycles and the Great Recession: Effects Within and Across the Income Distribution Marianne Bitler Department of Economics, UC Irvine and NBER mbitler@uci.edu Hilary
Inheritances and Inequality across and within Generations
 Inheritances and Inequality across and within Generations IFS Briefing Note BN192 Andrew Hood Robert Joyce Andrew Hood Robert Joyce Copy-edited by Judith Payne Published by The Institute for Fiscal Studies
Her Majesty the Queen in Right of Canada (2017) All rights reserved
 All rights reserved") Her Majesty the Queen in Right of Canada (2017) All rights reserved All requests for permission to reproduce this document or any part thereof shall be addressed to the Department of Finance Canada. Cette
Her Majesty the Queen in Right of Canada (2017) All rights reserved All requests for permission to reproduce this document or any part thereof shall be addressed to the Department of Finance Canada. Cette
Sarah K. Burns James P. Ziliak. November 2013
 Sarah K. Burns James P. Ziliak November 2013 Well known that policymakers face important tradeoffs between equity and efficiency in the design of the tax system The issue we address in this paper informs
Empirical Evidence and Tax Reform
 Empirical Evidence and Tax Reform XXI Encuentro de Economia Publica Universitat Girona January 30 th 2014 Richard Blundell University College London and Institute for Fiscal Studies Slide Presentation
Aging Seminar Series:
 Aging Seminar Series: Income and Wealth of Older Americans Domestic Social Policy Division Congressional Research Service November 19, 2008 Introduction Aging Seminar Series Focus on important issues regarding
Random Group Variance Adjustments When Hot Deck Imputation Is Used to Compensate for Nonresponse 1
 Random Group Variance Adjustments When Hot Deck Imputation Is Used to Compensate for Nonresponse 1 Richard A Moore, Jr., U.S. Census Bureau, Washington, DC 20233 Abstract The 2002 Survey of Business Owners
Table 1 Annual Median Income of Households by Age, Selected Years 1995 to Median Income in 2008 Dollars 1
 Fact Sheet Income, Poverty, and Health Insurance Coverage of Older Americans, 2008 AARP Public Policy Institute Median household income and median family income in the United States declined significantly
Monitoring the Performance of the South African Labour Market
 Monitoring the Performance of the South African Labour Market An overview of the South African labour market from 3 of 2010 to of 2011 September 2011 Contents Recent labour market trends... 2 A brief labour
+ Is welfare reformed yet?
 + Is welfare reformed yet? A retrospective on welfare, tax-credits and parental work policy Sophie Moullin Child and Family Policy Seminar, Columbia University & Teacher s College October 16 th, 2012 +
Minimum Wages: Possible Effects on the Distribution of Income
 Fiscal Studies (1996) vol. 17no. c4 pp. 31 48 Minimum Wages: Possible Effects on the Distribution of Income AMANDA GOSLING 1 I. INTRODUCTION Since the 1980s, there has been increased interest among unions
Australian inflation & unemployment: an overview
 Australian inflation & unemployment: an overview Three main measures of inflation in Australia 1. 2. 3. The consumer price index - or CPI. This the main measure used in media and business transactions.
In 2012, according to the U.S. Census Bureau, about. A Profile of the Working Poor, Highlights CONTENTS U.S. BUREAU OF LABOR STATISTICS
 U.S. BUREAU OF LABOR STATISTICS M A R C H 2 0 1 4 R E P O R T 1 0 4 7 A Profile of the Working Poor, 2012 Highlights Following are additional highlights from the 2012 data: Full-time workers were considerably
Not Working: Demographic Changes, Policy Changes, and the Distribution of Weeks (Not) Worked
 Worked") Federal Reserve Bank of Chicago Not Working: Demographic Changes, Policy Changes, and the Distribution of Weeks (Not) Worked Lisa Barrow and Kristin F. Butcher WP 2004-23 Comments welcome Not Working:
Federal Reserve Bank of Chicago Not Working: Demographic Changes, Policy Changes, and the Distribution of Weeks (Not) Worked Lisa Barrow and Kristin F. Butcher WP 2004-23 Comments welcome Not Working: