Appendices. Appendix 1 Buy ranges for each portfolio
|
|
|
- Gervase Thomas
- 5 years ago
- Views:
Transcription
1 Appendices Appendix 1 Buy ranges for each portfolio 67
2 Appendix 2 Every recession declared by the NBER Source: The National Bureau of Economic Research 68
3 Appendix 3 Multifactor portfolio mathematics Mathematics based on Cochrane (1999, p ). The optimization problem is: min var(!! ) =!!" subject to!!!! = µμ!!1 = 1!!! =!! The Lagrangian is 1!!!"!!!!!!!!!! 1 1!!!!!!! 2 The first order condition with respect to w give! =!!!!!! + 1!! +!!! =!!!!" Where! =! 1!! =!!!!!!! =! 1!! Plugging this value of w into the constraint equations!!! =!, We get!!!!!" =!! =!!!!!!!! =!!!!!!!!! The portfolio variance is then 69!!!!
4 !"#!! =!!!" =!!!!!!!!! Or, writing out the sum of the matrix notation,!"#!! =! 1!!!!!!!!! 1!!! 7
5 Appendix 4 Descriptive statistics Big Growth BigGrowth Mean,69 Standard Error,17 Median,18 Mode -,62 Standard Deviation,544 Sample Variance,3 Kurtosis 5,623 Skewness -,6981 Range,6118 Minimum -,336 Maximum,2812 Sum 6,8358 Largest(1),2812 Smallest(1) -,336 Confidence Level(95,%), Big Neutral BigNeutral Mean,77 Standard Error,18 Median,123 Mode,25 Standard Deviation,573 Sample Variance,33 Kurtosis 1,6318 Skewness,112 Range,7417 Minimum -,3256 Maximum,4161 Sum 7,6148 Largest(1),4161 Smallest(1) -,3256 Confidence Level(95,%), Big Value BigValue Mean,87 Standard Error,23 Median,13 Mode,44 Standard Deviation,721 Sample Variance,52 Kurtosis 1,4579 Skewness,641 Range,973 Minimum -,4363 Maximum,5339 Sum 8,5465 Largest(1),5339 Smallest(1) -,4363 Confidence Level(95,%),45 71
6 Small Growth SmallGrowth Mean,72 Standard Error,25 Median,119 Mode,32 Standard Deviation,771 Sample Variance,59 Kurtosis 5,874 Skewness -,915 Range,8873 Minimum -,397 Maximum,4966 Sum 7,534 Largest(1),4966 Smallest(1) -,397 Confidence Level(95,%), Small Neutral SmallNeutral Mean,1 Standard Error,22 Median,156 Mode -,99 Standard Deviation,695 Sample Variance,48 Kurtosis 8,7396 Skewness,118 Range,866 Minimum -,3689 Maximum,4971 Sum 9,8265 Largest(1),4971 Smallest(1) -,3689 Confidence Level(95,%), Small Value SmallValue Mean,19 Standard Error,26 Median,153 Mode,55 Standard Deviation,89 Sample Variance,65 Kurtosis 9,619 Skewness,3748 Range 1,99 Minimum -,411 Maximum,5989 Sum 1,6963 Largest(1),5989 Smallest(1) -,411 Confidence Level(95,%),51 72
7 Long- term bonds LongBonds Mean,43 Standard Error,8 Median,3 Mode,21 Standard Deviation,238 Sample Variance,6 Kurtosis 4,8744 Skewness,3795 Range,261 Minimum -,1192 Maximum,1418 Sum 4,2672 Largest(1),1418 Smallest(1) -,1192 Confidence Level(95,%),15 73
8 Appendix 5 Regression attributes Model 1: OLS, using observations 1928:1-29:12 (T = 984) Dependent variable: BigGrowth const <.1 *** dummy <.1 *** Mean dependent var.6947 S.D. dependent var.5447 Sum squared resid S.E. of regression R-squared.2752 Adjusted R-squared.2662 F(1, 982) P-value(F) 2.12e-7 Log-likelihood Akaike criterion Schwarz criterion Hannan-Quinn rho Durbin-Watson Model 2: OLS, using observations 1928:1-29:12 (T = 984) Dependent variable: BigNeutral const <.1 *** dummy <.1 *** Mean dependent var.7739 S.D. dependent var Sum squared resid S.E. of regression.5654 R-squared.2613 Adjusted R-squared F(1, 982) P-value(F) 3.48e-7 Log-likelihood Akaike criterion Schwarz criterion Hannan-Quinn rho Durbin-Watson Model 3: OLS, using observations 1928:1-29:12 (T = 984) Dependent variable: BigValue const <.1 *** dummy <.1 *** Mean dependent var.8685 S.D. dependent var.7264 Sum squared resid S.E. of regression.7192 R-squared.2778 Adjusted R-squared.2679 F(1, 982) P-value(F) 1.45e-7 Log-likelihood Akaike criterion Schwarz criterion Hannan-Quinn rho Durbin-Watson
9 Model 4: OLS, using observations 1928:1-29:12 (T = 984) Dependent variable: SmallGrowth const <.1 *** dummy <.1 *** Mean dependent var.7168 S.D. dependent var.7788 Sum squared resid S.E. of regression R-squared Adjusted R-squared F(1, 982) P-value(F) 4.47e-7 Log-likelihood Akaike criterion Schwarz criterion Hannan-Quinn rho.1488 Durbin-Watson Model 5: OLS, using observations 1928:1-29:12 (T = 984) Dependent variable: SmallNeutral const <.1 *** dummy <.1 *** Mean dependent var.9986 S.D. dependent var Sum squared resid S.E. of regression R-squared Adjusted R-squared F(1, 982) P-value(F) 1.64e-7 Log-likelihood Akaike criterion Schwarz criterion Hannan-Quinn rho.1574 Durbin-Watson Model 6: OLS, using observations 1928:1-29:12 (T = 984) Dependent variable: SmallValue const <.1 *** dummy <.1 *** Mean dependent var.187 S.D. dependent var.893 Sum squared resid S.E. of regression.7997 R-squared Adjusted R-squared F(1, 982) P-value(F) 1.9e-6 Log-likelihood Akaike criterion Schwarz criterion Hannan-Quinn rho Durbin-Watson
10 Model 7: OLS, using observations 1928:1-29:12 (T = 984) Dependent variable: LongBonds const *** dummy * Mean dependent var.4337 S.D. dependent var Sum squared resid S.E. of regression R-squared.375 Adjusted R-squared.269 F(1, 982) P-value(F) Log-likelihood Akaike criterion Schwarz criterion Hannan-Quinn rho Durbin-Watson


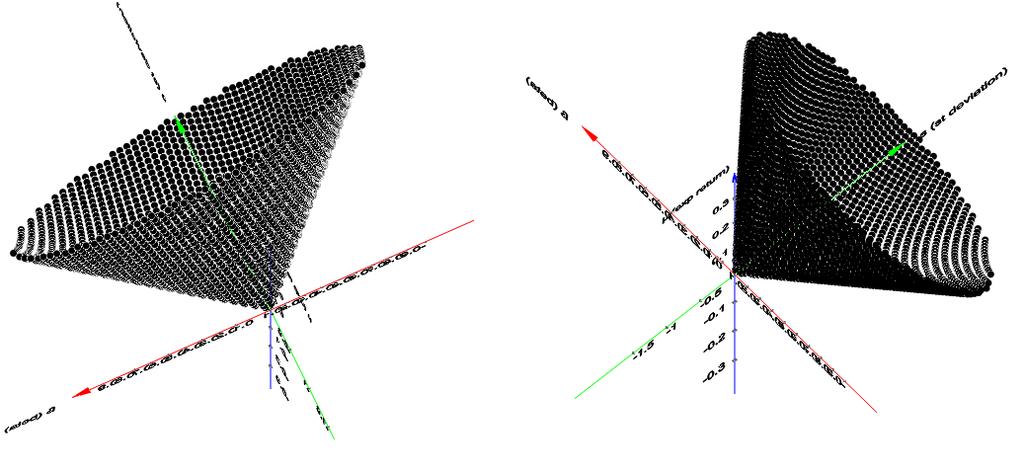
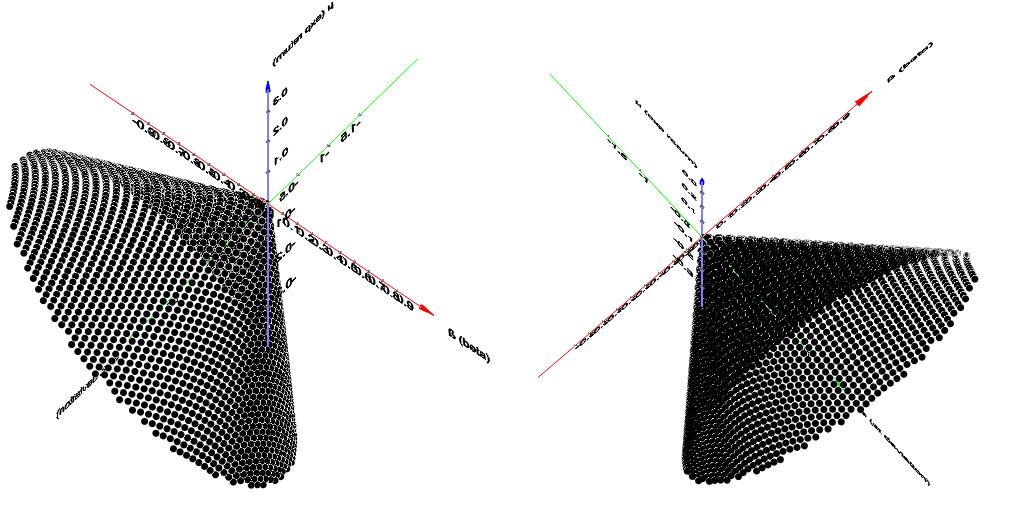
11 Appendix 6 Angles of the multifactor efficient frontier 77
12 Appendix 7 Calculation of two-funds!"#$h!!"#$%& = Example of 6/4 in market/risk-free 1!"#$!"#$%&'(,6 = 1 (,6,2) 2,,18! With a new value of the return variance in the fall of 28 (,7%) 1 (,6,2) 2,,7! =,4 (!!! )!! Equation 28 Now, 4% is invested in the market portfolio and 96% in the risk-free asset,6 = 1 2,!,2,7!! =,61 The expected return would have to increase of 61% to maintain the 6/4 in market/risk-free. 78
Appendixes Appendix 1 Data of Dependent Variables and Independent Variables Period
 Appendixes Appendix 1 Data of Dependent Variables and Independent Variables Period 1-15 1 ROA INF KURS FG January 1,3,7 9 -,19 February 1,79,5 95 3,1 March 1,3,7 91,95 April 1,79,1 919,71 May 1,99,7 955
Hasil Common Effect Model
 Hasil Common Effect Model Date: 05/11/18 Time: 06:20 C 21.16046 1.733410 12.20742 0.0000 IPM -25.74125 2.841429-9.059263 0.0000 FDI 9.11E-11 1.96E-11 4.654743 0.0000 X 0.044150 0.021606 2.043430 0.0425
Back from the Dead: the GFC and the Resurrection of Long Term Unemployment
 Back from the Dead: the GFC and the Resurrection of Long Term Unemployment Bruce Chapman* Crawford School of Economics and Government School Seminar Australian National University September 22 2009 * With
LAMPIRAN PERHITUNGAN EVIEWS
 LAMPIRAN PERHITUNGAN EVIEWS DESCRIPTIVE PK PDRB TP TKM Mean 12.22450 10.16048 14.02443 12.63677 Median 12.41945 10.09179 14.22736 12.61400 Maximum 13.53955 12.73508 15.62581 13.16721 Minimum 10.34509 8.579417
Export and Import Regressions on 2009Q1 preliminary release data Menzie Chinn, 23 June 2009 ( )
") Export and Import Regressions on 2009Q1 preliminary release data Menzie Chinn, 23 June 2009 ( mchinn@lafollette.wisc.edu ) EXPORTS Nonagricultural real exports, regressand; Real Fed dollar broad index
Export and Import Regressions on 2009Q1 preliminary release data Menzie Chinn, 23 June 2009 ( mchinn@lafollette.wisc.edu ) EXPORTS Nonagricultural real exports, regressand; Real Fed dollar broad index
Appendix. Table A.1 (Part A) The Author(s) 2015 G. Chakrabarti and C. Sen, Green Investing, SpringerBriefs in Finance, DOI /
 The Author(s) 2015 G. Chakrabarti and C. Sen, Green Investing, SpringerBriefs in Finance, DOI /") Appendix Table A.1 (Part A) Dependent variable: probability of crisis (own) Method: ML binary probit (quadratic hill climbing) Included observations: 47 after adjustments Convergence achieved after 6 iterations
Appendix Table A.1 (Part A) Dependent variable: probability of crisis (own) Method: ML binary probit (quadratic hill climbing) Included observations: 47 after adjustments Convergence achieved after 6 iterations
Brief Sketch of Solutions: Tutorial 1. 2) descriptive statistics and correlogram. Series: LGCSI Sample 12/31/ /11/2009 Observations 2596
 descriptive statistics and correlogram. Series: LGCSI Sample 12/31/ /11/2009 Observations 2596") Brief Sketch of Solutions: Tutorial 1 2) descriptive statistics and correlogram 240 200 160 120 80 40 0 4.8 5.0 5.2 5.4 5.6 5.8 6.0 6.2 Series: LGCSI Sample 12/31/1999 12/11/2009 Observations 2596 Mean
Brief Sketch of Solutions: Tutorial 1 2) descriptive statistics and correlogram 240 200 160 120 80 40 0 4.8 5.0 5.2 5.4 5.6 5.8 6.0 6.2 Series: LGCSI Sample 12/31/1999 12/11/2009 Observations 2596 Mean
LAMPIRAN 1. Retribusi (ribu Rp)
") LAMPIRAN 1 Kabupaten Kulonprogo Bantul Gunung Kidul Tahun Retribusi (ribu Rp) Obyek Wisata Wisatawan PDRB (juta Rp) 2001 6694566 8 227250 3486573.5 2002 7779217 11 211529 3630220.3 2003 9247557 7 190333
LAMPIRAN 1 Kabupaten Kulonprogo Bantul Gunung Kidul Tahun Retribusi (ribu Rp) Obyek Wisata Wisatawan PDRB (juta Rp) 2001 6694566 8 227250 3486573.5 2002 7779217 11 211529 3630220.3 2003 9247557 7 190333
LAMPIRAN-LAMPIRAN. A. Perhitungan Return On Asset
 88 LAMPIRAN-LAMPIRAN A. Perhitungan Return On Asset Tahun Perusahaan Laba Bersih Total Aset Laba/Total Aset ROA (% ) 2011 ROA_ADRO 5006470 51315458 0,09756261 9,76 ROA_AKRA 2284080 8308244 0,274917299
Lampiran 1 Lampiran 1 Data Keuangan Bank konvensional
 Lampiran 1 Lampiran 1 Data Keuangan Bank konvensional BANK YEAR Z-Score TOTAL ASET (milyar rupiah) ROA (%) NPL (%) BI RATE (%) KURS (rupiah) BNI 1.9 5.51.9 1.9.5 919.5 11 7.71 99.5.9.17 915.7 1 7.7 333.3.9.
Lampiran 1 : Grafik Data HIV Asli
 Lampiran 1 : Grafik Data HIV Asli 70 60 50 Penderita 40 30 20 10 2007 2008 2009 2010 2011 Tahun HIV Mean 34.15000 Median 31.50000 Maximum 60.00000 Minimum 19.00000 Std. Dev. 10.45057 Skewness 0.584866
Solution to Exercise E5.
 Solution to Exercise E5. The Multiple Regression Model. Estimation. Exercise E5.1. Beach umbrella rental Part I. Simple Linear Regression Model. a. Regression model: U t = β 1 + β 2 T t + u t t = 1,...,
Economics 442 Macroeconomic Policy (Spring 2015) 3/23/2015. Instructor: Prof. Menzie Chinn UW Madison
 3/23/2015. Instructor: Prof. Menzie Chinn UW Madison") Economics 442 Macroeconomic Policy (Spring 2015) 3/23/2015 Instructor: Prof. Menzie Chinn UW Madison Outline Models of Investment Assessment Uncertainty http://www.bostonfed.org/economic/neer/neer2001/neer201a.pdf
Economics 442 Macroeconomic Policy (Spring 2015) 3/23/2015 Instructor: Prof. Menzie Chinn UW Madison Outline Models of Investment Assessment Uncertainty http://www.bostonfed.org/economic/neer/neer2001/neer201a.pdf
Lampiran 1. Data Penelitian
 Lampiran 1. Data Penelitian Tahun 2008 2009 2010 Suku bunga ORI Inflasi BI Rate IHSG Bulan Deposito Rupiah % % Poin % Mei 93,00 10,38 8,25 2444,35 7,04 Jun 90,50 11,03 8,50 2349,10 7,26 Jul 90,50 11,90
Financial Econometrics: Problem Set # 3 Solutions
 Financial Econometrics: Problem Set # 3 Solutions N Vera Chau The University of Chicago: Booth February 9, 219 1 a. You can generate the returns using the exact same strategy as given in problem 2 below.
Lampiran 1. Tabulasi Data
 Lampiran 1. Tabulasi Data Tahun PDRB PDRBt-1 PAD BH DAU INF 2001:1 372696.65 372696.65 1005.61 2684.67 26072.42 0.87 2001:4 376433.52 372696.65 1000.96 2858.50 28795.27 1.08 2001:8 387533.83 376433.52
LAMPIRAN. A. Data. PAD (juta) INVESTASI (%) PDRB (juta) Kulon Progo. Bantul. Gunung Kidul. Sleman
 INVESTASI (%) PDRB (juta) Kulon Progo. Bantul. Gunung Kidul. Sleman") 82 LAMPIRAN A. Data Kabupaten Kulon Progo Bantul Gunung Kidul Sleman Tahun PDRB (juta) PAD (juta) INVESTASI (%) TINGKAT PENGANGGURAN (%) 2007 4.455.556 33.129.460 0 4.34 2008 4.665.308 36.188.575 1.82
82 LAMPIRAN A. Data Kabupaten Kulon Progo Bantul Gunung Kidul Sleman Tahun PDRB (juta) PAD (juta) INVESTASI (%) TINGKAT PENGANGGURAN (%) 2007 4.455.556 33.129.460 0 4.34 2008 4.665.308 36.188.575 1.82
Supplementary Materials for
 www.sciencemag.org/content/344/6186/851/suppl/dc1 Supplementary Materials for Income Inequality in the Developing World Martin Ravallion This PDF file includes: Fig. S1 Tables S1 to S4 E-mail: mr1185@georgetown.edu
Photovoltaic deployment: from subsidies to a market-driven growth: A panel econometrics approach
 Photovoltaic deployment: from subsidies to a market-driven growth: A panel econometrics approach Anna Créti, Léonide Michael Sinsin To cite this version: Anna Créti, Léonide Michael Sinsin. Photovoltaic
Lampiran 1. Data Penelitian
 LAMPIRAN Lampiran 1. Data Penelitian Tahun Impor PDB KURS DEVISA 1985 5.199,00 2.118.215,40 1.125,00 5.811,00 1986 5.825,00 2.242.661,60 1.641,00 5.841,00 1987 7.209,00 2.353.133,40 1.650,00 5.103,00 1988
Monetary Economics Portfolios Risk and Returns Diversification and Risk Factors Gerald P. Dwyer Fall 2015
 Monetary Economics Portfolios Risk and Returns Diversification and Risk Factors Gerald P. Dwyer Fall 2015 Reading Chapters 11 13, not Appendices Chapter 11 Skip 11.2 Mean variance optimization in practice
Lampiran I Data. PDRB (Juta Rupiah) PMA (Juta Rupiah) PMDN (Juta Rupiah) Tahun. Luas Sawit (ha)
 PMA (Juta Rupiah) PMDN (Juta Rupiah) Tahun. Luas Sawit (ha)") LAMPIRAN Lampiran I Data Tahun PDRB (Juta Rupiah) PMDN (Juta Rupiah) PMA (Juta Rupiah) Luas Sawit (ha) Angkatan Kerja (Jiwa) 1986 24698580 84581 8438 19733 1237717 1987 26991625 106279 10128 22122 1243818
LAMPIRAN Lampiran I Data Tahun PDRB (Juta Rupiah) PMDN (Juta Rupiah) PMA (Juta Rupiah) Luas Sawit (ha) Angkatan Kerja (Jiwa) 1986 24698580 84581 8438 19733 1237717 1987 26991625 106279 10128 22122 1243818
Notes on the Treasury Yield Curve Forecasts. October Kara Naccarelli
 Notes on the Treasury Yield Curve Forecasts October 2017 Kara Naccarelli Moody s Analytics has updated its forecast equations for the Treasury yield curve. The revised equations are the Treasury yields
Openness and Inflation
 Openness and Inflation Based on David Romer s Paper Openness and Inflation: Theory and Evidence ECON 5341 Vinko Kaurin Introduction Link between openness and inflation explored Basic OLS model: y = β 0
Donald Trump's Random Walk Up Wall Street
 Donald Trump's Random Walk Up Wall Street Research Question: Did upward stock market trend since beginning of Obama era in January 2009 increase after Donald Trump was elected President? Data: Daily data
LAMPIRAN. Lampiran 1. Wilayah Tahun PAD JOW PDRB JH JR Yogyakarta
 LAMPIRAN Lampiran 1 Data jumlah PAD sektor pariwisata, Jumlah Obyek Wisata, PDRB, Jumlah Hotel, dan Jumlah Restoran dan rumah makan di kabupaten/kota Daerah Istimewa Yogyakarta, Tahun 2010-2015 Wilayah
Brief Sketch of Solutions: Tutorial 2. 2) graphs. 3) unit root tests
 graphs. 3) unit root tests") Brief Sketch of Solutions: Tutorial 2 2) graphs LJAPAN DJAPAN 5.2.12 5.0.08 4.8.04 4.6.00 4.4 -.04 4.2 -.08 4.0 01 02 03 04 05 06 07 08 09 -.12 01 02 03 04 05 06 07 08 09 LUSA DUSA 7.4.12 7.3 7.2.08 7.1.04
Brief Sketch of Solutions: Tutorial 2 2) graphs LJAPAN DJAPAN 5.2.12 5.0.08 4.8.04 4.6.00 4.4 -.04 4.2 -.08 4.0 01 02 03 04 05 06 07 08 09 -.12 01 02 03 04 05 06 07 08 09 LUSA DUSA 7.4.12 7.3 7.2.08 7.1.04
Methods for A Time Series Approach to Estimating Excess Mortality Rates in Puerto Rico, Post Maria 1 Menzie Chinn 2 August 10, 2018 Procedure:
 Methods for A Time Series Approach to Estimating Excess Mortality Rates in Puerto Rico, Post Maria 1 Menzie Chinn 2 August 10, 2018 Procedure: Estimate relationship between mortality as recorded and population
UJI COMMON EFFECT MODEL
 UJI COMMON EFFECT MODEL Dependent Variable: LOG(TKI) Method: Panel Least Squares Date: 05/01/18 Time: 12:34 Sample: 2010 2016 Periods included: 7 Total panel (balanced) observations: 210 Variable Coefficient
Kabupaten Langkat Suku Bunga Kredit. PDRB harga berlaku
 Lampiran 1. Data Penelitian Tahun Konsumsi Masyarakat PDRB harga berlaku Kabupaten Langkat Suku Bunga Kredit Kredit Konsumsi Tabungan Masyarkat Milyar Rp. Milyar Rp. % Milyar Rp. Milyar Rp. 1990 559,61
DATA PENELITIAN. Pendapatan Nasional (PDB Perkapita atas Dasar Harga Berlaku) Produksi Bawang Merah Indonesia MB X1 X2 X3 X4 X5 X6
 Produksi Bawang Merah Indonesia MB X1 X2 X3 X4 X5 X6") Lampiran 1 Tahu n Volume Impor Bawang Merah Konsums i Bawang Merah Perkapit a di Indonesi a DATA PENELITIAN Pendapatan Nasional (PDB Perkapita atas Dasar Harga Berlaku) Produksi Bawang Merah Indonesia
Lampiran 1 Tahu n Volume Impor Bawang Merah Konsums i Bawang Merah Perkapit a di Indonesi a DATA PENELITIAN Pendapatan Nasional (PDB Perkapita atas Dasar Harga Berlaku) Produksi Bawang Merah Indonesia
1. A test of the theory is the regression, since no arbitrage implies, Under the null: a = 0, b =1, and the error e or u is unpredictable.
 Aggregate Seminar Economics 37 Roger Craine revised 2/3/2007 The Forward Discount Premium Covered Interest Rate Parity says, ln( + i) = ln( + i*) + ln( F / S) i i* f s t+ the forward discount equals the
A Sensitivity Analysis between Common Risk Factors and Exchange Traded Funds
 A Sensitivity Analysis between Common Risk Factors and Exchange Traded Funds Tahura Pervin Dept. of Humanities and Social Sciences, Dhaka University of Engineering & Technology (DUET), Gazipur, Bangladesh
BEcon Program, Faculty of Economics, Chulalongkorn University Page 1/7
 Mid-term Exam (November 25, 2005, 0900-1200hr) Instructions: a) Textbooks, lecture notes and calculators are allowed. b) Each must work alone. Cheating will not be tolerated. c) Attempt all the tests.
Santi Chaisrisawatsuk 16 November 2017 Thimpu, Bhutan
 Regional Capacity Building Workshop Formulating National Policies and Strategies in Preparation for Graduation from the LDC Category: Macroeconomic Modelling for SDGs in Asia and the Pacific Santi Chaisrisawatsuk
FIN 533. Autocorrelations of CPI Inflation
 FIN 533 Inflation & Interest Rates Fama (1975) AER: Expected real interest rates are (approximately) constant over time, so: E(r t F t-1 ) = R t E(r) where E(r t F t-1 ) is expected inflation given information
Okun s Law - an empirical test using Brazilian data
 Okun s Law - an empirical test using Brazilian data Alan Harper, Ph.D. Gwynedd Mercy University Zhenhu Jin, Ph.D. Valparaiso University ABSTRACT In this paper, we test Okun s coefficient to determine if
International capital flows and GDP growth
 Volume: 2, Issue: 5, 315-319 May 2015 www.allsubjectjournal.com e-issn: 2349-4182 p-issn: 2349-5979 Impact Factor: 3.762 Department of Economics, Rajeev Gandhi Tribal University, Udaipur, Rajasthan, India
Übungsblatt 4. Please examine below OLS estimation results for the log earnings of Egyptian wage workers and answer the below questions:
 Universität Ulm 89069 Ulm Germany M.Sc. Zein Kasrin Institut für Wirtschaftspolitik Fakultät für Mathematik und Wirtschaftswissenschaften Ludwig-Erhard-Stiftungsprofessur Sommersemester 2016 Übung zur
COMMONWEALTH JOURNAL OF COMMERCE & MANAGEMENT RESEARCH AN ANALYSIS OF RELATIONSHIP BETWEEN GOLD & CRUDEOIL PRICES WITH SENSEX AND NIFTY
 AN ANALYSIS OF RELATIONSHIP BETWEEN GOLD & CRUDEOIL PRICES WITH SENSEX AND NIFTY Dr. S. Nirmala Research Supervisor, Associate Professor- Department of Business Administration & Principal, PSGR Krishnammal
LAMPIRAN. Tahun Bulan NPF (Milyar Rupiah)
") LAMPIRAN Lampiran 1 Data Penelitian Non Performing Financing (NPF), Capital Adequacy Ratio (CAR), Financing to Deposit Ratio (FDR), Biaya Operasional Pendapatan Operasional (BOPO), Ukuran Bank (Size) Tahun
LAMPIRAN Lampiran 1 Data Penelitian Non Performing Financing (NPF), Capital Adequacy Ratio (CAR), Financing to Deposit Ratio (FDR), Biaya Operasional Pendapatan Operasional (BOPO), Ukuran Bank (Size) Tahun
The Relationship Between Internet Marketing, Search Volume, and Product Sales. Honors Research Thesis
 TheRelationshipBetweenInternetMarketing,SearchVolume,andProductSales HonorsResearchThesis Presentedinpartialfulfillmentoftherequirementsforgraduationwithhonors researchdistinctionineconomicsintheundergraduatecollegesoftheohiostate
Exchange Rate and Economic Growth in Indonesia ( )
") Exchange Rate and Economic Growth in Indonesia (1984-2013) Name: Shanty Tindaon JEL : E47 Keywords: Economic Growth, FDI, Inflation, Indonesia Abstract: This paper examines the impact of FDI, capital stock,
Exchange Rate and Economic Growth in Indonesia (1984-2013) Name: Shanty Tindaon JEL : E47 Keywords: Economic Growth, FDI, Inflation, Indonesia Abstract: This paper examines the impact of FDI, capital stock,
Analysis of the Influence of the Annualized Rate of Rentability on the Unit Value of the Net Assets of the Private Administered Pension Fund NN
 Year XVIII No. 20/2018 175 Analysis of the Influence of the Annualized Rate of Rentability on the Unit Value of the Net Assets of the Private Administered Pension Fund NN Constantin DURAC 1 1 University
Lampiran 1. Data PDB, Pengeluaran Pemerintah, jumlah uang beredar, pajak, dan tingkat suku bunga
 Lampiran 1. Data PDB, Pengeluaran Pemerintah, jumlah uang beredar, pajak, dan tingkat suku bunga obs PDB(milyar) GOV(milyar) M1(milyar) Tax(milyar) R(%) 1980 45446,00 5800,00 5214,00 289,70 6,00 1981 58127,00
LAMPIRAN. Null Hypothesis: LO has a unit root Exogenous: Constant Lag Length: 1 (Automatic based on SIC, MAXLAG=13)
") 74 LAMPIRAN Lampiran 1 Analisis ARIMA 1.1. Uji Stasioneritas Variabel 1. Data Harga Minyak Riil Level Null Hypothesis: LO has a unit root Lag Length: 1 (Automatic based on SIC, MAXLAG=13) Augmented Dickey-Fuller
74 LAMPIRAN Lampiran 1 Analisis ARIMA 1.1. Uji Stasioneritas Variabel 1. Data Harga Minyak Riil Level Null Hypothesis: LO has a unit root Lag Length: 1 (Automatic based on SIC, MAXLAG=13) Augmented Dickey-Fuller
POLYTECHNIC OF NAMIBIA SCHOOL OF MANAGEMENT SCIENCES DEPARTMENT OF ACCOUNTING, ECONOMICS AND FINANCE ECONOMETRICS. Mr.
 POLYTECHNIC OF NAMIBIA SCHOOL OF MANAGEMENT SCIENCES DEPARTMENT OF ACCOUNTING, ECONOMICS AND FINANCE COURSE: COURSE CODE: ECONOMETRICS ECM 312S DATE: NOVEMBER 2014 MARKS: 100 TIME: 3 HOURS NOVEMBER EXAMINATION:
Muhammad Nasir SHARIF 1 Kashif HAMID 2 Muhammad Usman KHURRAM 3 Muhammad ZULFIQAR 4 1
 Vol. 6, No. 4, October 2016, pp. 287 300 E-ISSN: 2225-8329, P-ISSN: 2308-0337 2016 HRMARS www.hrmars.com Factors Effecting Systematic Risk in Isolation vs. Pooled Estimation: Empirical Evidence from Banking,
9. Appendixes. Page 73 of 95
 9. Appendixes Appendix A: Construction cost... 74 Appendix B: Cost of capital... 75 Appendix B.1: Beta... 75 Appendix B.2: Cost of equity... 77 Appendix C: Geometric Brownian motion... 78 Appendix D: Static
Chapter-3. Sectoral Composition of Economic Growth and its Major Trends in India
 Chapter-3 Sectoral Composition of Economic Growth and its Major Trends in India This chapter deals with the first objective of the study, that is to evaluate the sectoral composition of economic growth
ANALYSIS OF CORRELATION BETWEEN THE EXPENSES OF SOCIAL PROTECTION AND THE ANTICIPATED OLD AGE PENSION
 ANALYSIS OF CORRELATION BETWEEN THE EXPENSES OF SOCIAL PROTECTION AND THE ANTICIPATED OLD AGE PENSION Nicolae Daniel Militaru Ph. D Abstract: In this article, I have analysed two components of our social
Fall 2004 Social Sciences 7418 University of Wisconsin-Madison Problem Set 5 Answers
 Economics 310 Menzie D. Chinn Fall 2004 Social Sciences 7418 University of Wisconsin-Madison Problem Set 5 Answers This problem set is due in lecture on Wednesday, December 15th. No late problem sets will
23571 Introductory Econometrics Assignment B (Spring 2017)
") 23571 Introductory Econometrics Assignment B (Spring 2017) You must attach the coversheet to your answers. Read the instructions on the coversheet. Try to keep your answers short and clear. This assignment
23571 Introductory Econometrics Assignment B (Spring 2017) You must attach the coversheet to your answers. Read the instructions on the coversheet. Try to keep your answers short and clear. This assignment
Research Article The Volatility of the Index of Shanghai Stock Market Research Based on ARCH and Its Extended Forms
 Discrete Dynamics in Nature and Society Volume 2009, Article ID 743685, 9 pages doi:10.1155/2009/743685 Research Article The Volatility of the Index of Shanghai Stock Market Research Based on ARCH and
X. Einkommensfunktion II
 Universität Ulm 8969 Ulm Germany Fakultät für Mathematik und Wirtschaftswissenschaften M. Sc. Zein Kasrin Ludwig-Erhard-Stiftungsprofessur Institut für Wirtschaftspolitik Summer term 215 Übung zur Empirischen
A PANEL DATA ANALYSIS OF MACROECONOMIC DETERMINANTS OF CORPORATE BIRTHS IN THE EU MEMBER STATES DURING
 A PANEL DATA ANALYSIS OF MACROECONOMIC DETERMINANTS OF CORPORATE BIRTHS IN THE EU MEMBER STATES DURING 2004-2012 Abstract Maruşa BECA, PhD Candidate Ileana NIȘULESCU-ASHRAFZADEH, PhD This article s goal
Business Survey and Short-Term Projection
 JOINT EUROPEAN COMMISSION OECD WORKSHOP ON INTERNATIONAL DEVELOPMENT OF BUSINESS AND CONSUMER TENDENCY SURVEYS BRUSSELS 14 15 NOVEMBER 25 Business Survey and Short-Term Projection Edita Holickova Statistical
esia/perkembangan/
 http://afghanaus.com/uanggiral/http://www.bi.go.id/web/id/sistem+pembayaran/sistem+pembayaran+di+indon esia/perkembangan/ http://id.shvoong.com/social-sciences/economics/2129762-jumlah-uang-beredar-diindonesia/
LAMPIRAN. Variable Coefficient Std. Error t-statistic Prob.
 LAMPIRAN A. Hasil Pengujian Eviews 1. Common effect Dependent Variable: K? Method: Pooled Least Squares Date: 10/25/17 Time: 12:23 Sample: 2011 2015 Included observations: 5 Cross-sections included: 38
An Examination of Seasonality in Indian Stock Markets With Reference to NSE
 SUMEDHA JOURNAL OF MANAGEMENT, Vol.3 No.3 July-September, 2014 ISSN: 2277-6753, Impact Factor:0.305, Index Copernicus Value: 5.20 An Examination of Seasonality in Indian Stock Markets With Reference to
INFLUENCE OF CONTRIBUTION RATE DYNAMICS ON THE PENSION PILLAR II ON THE
 INFLUENCE OF CONTRIBUTION RATE DYNAMICS ON THE PENSION PILLAR II ON THE EVOLUTION OF THE UNIT VALUE OF THE NET ASSETS OF THE NN PENSION FUND Student Constantin Durac Ph. D Student University of Craiova
1.4 Show the steps necessary to obtain relative PPP in growth rates.
 Kiel Institut für Weltwirthschaft Advanced Studies in International Economic Policy Research Spring 2005 Menzie D. Chinn Problem Set 1 Answers Exchange Rate Economics 1. Purchasing power parity. 1.1 Write
FBBABLLR1CBQ_US Commercial Banks: Assets - Bank Credit - Loans and Leases - Residential Real Estate (Bil, $, SA)
") Notes on new forecast variables November 2018 Loc Quach Moody s Analytics added 11 new U.S. variables to its global model in November. The variables pertain mostly to bank balance sheets and delinquency
Notes on new forecast variables November 2018 Loc Quach Moody s Analytics added 11 new U.S. variables to its global model in November. The variables pertain mostly to bank balance sheets and delinquency
Anexos. Pruebas de estacionariedad. Null Hypothesis: TES has a unit root Exogenous: Constant Lag Length: 0 (Automatic - based on SIC, maxlag=9)
") Anexos Pruebas de estacionariedad Null Hypothesis: TES has a unit root Augmented Dickey-Fuller test statistic -1.739333 0.4042 Test critical values: 1% level -3.610453 5% level -2.938987 10% level -2.607932
Anexos Pruebas de estacionariedad Null Hypothesis: TES has a unit root Augmented Dickey-Fuller test statistic -1.739333 0.4042 Test critical values: 1% level -3.610453 5% level -2.938987 10% level -2.607932
Financial Risk, Liquidity Risk and their Effect on the Listed Jordanian Islamic Bank's Performance
 Financial Risk, Liquidity Risk and their Effect on the Listed Jordanian Islamic Bank's Performance Lina Hani Warrad Associate Professor, Accounting Department Applied Science Private University, Amman,
The Study on Tax Incentive Policies of China's Photovoltaic Industry Jian Xu 1,a, Zhenji Jin 2,b,*
 3rd International Conference on Science and Social Research (ICSSR 2014) The Study on Tax Incentive Policies of China's Photovoltaic Industry Jian Xu 1,a, Zhenji Jin 2,b,* 1,2 Department of Economics and
LAMPIRAN. Lampiran I
 67 LAMPIRAN Lampiran I Data Volume Impor Jagung Indonesia, Harga Impor Jagung, Produksi Jagung Nasional, Nilai Tukar Rupiah/USD, Produk Domestik Bruto (PDB) per kapita Tahun Y X1 X2 X3 X4 1995 969193.394
IMPACT OF MACROECONOMIC VARIABLE ON STOCK MARKET RETURN AND ITS VOLATILITY
 7 IMPACT OF MACROECONOMIC VARIABLE ON STOCK MARKET RETURN AND ITS VOLATILITY 7.1 Introduction: In the recent past, worldwide there have been certain changes in the economic policies of a no. of countries.
Impact of Direct Taxes on GDP: A Study
 IOSR Journal of Business and Management (IOSR-JBM) e-issn: 2278-487X, p-issn: 2319-7668 PP 21-27 www.iosrjournals.org Impact of Direct Taxes on GDP: A Study Dr. JVR Geetanjali 1, Mr.Pr Venugopal 2 Assistant
FTSE BIRR. ftserussell.com. FTSE Russell 1
 FTSE BIRR ftserussell.com Edwin Burmeister Research Professor of Economics Emeritus, Duke University Commonwealth Professor of Economics Emeritus, University of Virginia Former President, BIRR Portfolio
Per Capita Housing Starts: Forecasting and the Effects of Interest Rate
 1 David I. Goodman The University of Idaho Economics 351 Professor Ismail H. Genc March 13th, 2003 Per Capita Housing Starts: Forecasting and the Effects of Interest Rate Abstract This study examines the
THE IMPACT OF BANKING RISKS ON THE CAPITAL OF COMMERCIAL BANKS IN LIBYA
 THE IMPACT OF BANKING RISKS ON THE CAPITAL OF COMMERCIAL BANKS IN LIBYA Azeddin ARAB Kastamonu University, Turkey, Institute for Social Sciences, Department of Business Abstract: The objective of this
Econometric Models for the Analysis of Financial Portfolios
 Econometric Models for the Analysis of Financial Portfolios Professor Gabriela Victoria ANGHELACHE, Ph.D. Academy of Economic Studies Bucharest Professor Constantin ANGHELACHE, Ph.D. Artifex University
Foreign and Public Investment and Economic Growth: The Case of Romania
 MPRA Munich Personal RePEc Archive Foreign and Public Investment and Economic Growth: The Case of Romania Cristian Valeriu Stanciu and Narcis Eduard Mitu University of Craiova, Faculty of Economics and
New York Science Journal 2016;9(11)
") The impact of the type of Growth and Value Stocks on the relationship between the tax and capal structure in listed companies in the Tehran Stock Exchange Fahimeh hatam pour *, Ghasem rekabdar 2** * Department
The impact of the type of Growth and Value Stocks on the relationship between the tax and capal structure in listed companies in the Tehran Stock Exchange Fahimeh hatam pour *, Ghasem rekabdar 2** * Department
The Credit Cycle and the Business Cycle in the Economy of Turkey
 Chinese Business Review, March 2016, Vol. 15, No. 3, 123-131 doi: 10.17265/1537-1506/2016.03.003 D DAVID PUBLISHING The Credit Cycle and the Business Cycle in the Economy of Turkey Şehnaz Bakır Yiğitbaş
Exchange Rate and Economic Performance - A Comparative Study of Developed and Developing Countries
 IOSR Journal of Business and Management (IOSR-JBM) e-issn: 2278-487X. Volume 8, Issue 1 (Jan. - Feb. 2013), PP 116-121 Exchange Rate and Economic Performance - A Comparative Study of Developed and Developing
TURKISH STOCK MARKET DEPENDENCY TO INTERNATIONAL MARKETS AND EXCHANGE RATE
 TURKISH STOCK MARKET DEPENDENCY TO INTERNATIONAL MARKETS AND EXCHANGE RATE Mustafa Koray CETIN Business Administration Department, Akdeniz University, Antalya-Turkey kcetin@akdeniz.edu.tr Abstract: In
LAMPIRAN. Universitas Sumatera Utara
 LAMPIRAN 99 Lampiran 1 Daftar Sampel Penelitian No Kode Nama Reksadana Tanggal Diluncurkan 1 BIIDINA AXA Citradinamis 05-08-1997 2 NISP Abeerdeen Indonesia Equity Fund 27-12-2007 3 000D1B BNI-AM Dana Berkembang
Forecasting the Philippine Stock Exchange Index using Time Series Analysis Box-Jenkins
 EUROPEAN ACADEMIC RESEARCH Vol. III, Issue 3/ June 2015 ISSN 2286-4822 www.euacademic.org Impact Factor: 3.4546 (UIF) DRJI Value: 5.9 (B+) Forecasting the Philippine Stock Exchange Index using Time HERO
Effect of Profitability and Financial Leverage on Capita Structure in Pakistan Textile Firms
 Effect of Profitability and Financial Leverage on Capita Structure in Pakistan Textile Firms Muzzammil Hussain Hassan shahid Muhammad Akmal Faculty of Management Sciences, University of Gujrat Abstract
SUSTAINABILITY PLANNING POLICY COLLECTING THE REVENUES OF THE TAX ADMINISTRATION
 2007 2008 2009 2010 Year IX, No.12/2010 127 SUSTAINABILITY PLANNING POLICY COLLECTING THE REVENUES OF THE TAX ADMINISTRATION Prof. Marius HERBEI, PhD Gheorghe MOCAN, PhD West University, Timişoara I. Introduction
Fiscal Policy and Economic Growth Relationship in Nigeria
 International Journal of Business and Social Science Vol. 2 No. 17 www.ijbssnet.com 244 Fiscal Policy and Economic Growth Relationship in Nigeria Sikiru Jimoh Babalola (Corresponding Author) Lecturer Department
Mathematical Model for Estimating Income Tax Revenues in the Philippines through Regression Analysis Using Matrices
 EUROPEAN ACADEMIC RESEARCH Vol. III, Issue 2/ May 2015 ISSN 2286-4822 www.euacademic.org Impact Factor: 3.4546 (UIF) DRJI Value: 5.9 (B+) Mathematical Model for Estimating Income Tax Revenues in the Philippines
Available online at ScienceDirect. Procedia Economics and Finance 10 ( 2014 )
") Available online at www.sciencedirect.com ScienceDirect Procedia Economics and Finance 1 ( 214 ) 324 329 7 th International Conference on Applied Statistics Using the Regression Model in the Analysis Financial
Available online at www.sciencedirect.com ScienceDirect Procedia Economics and Finance 1 ( 214 ) 324 329 7 th International Conference on Applied Statistics Using the Regression Model in the Analysis Financial
Investment and financing constraints in Iran
 International Journal of Economics, Finance and Management Sciences 213; 1(5): 252-257 Published online September 3, 213 (http://www.sciencepublishinggroup.com/j/ijefm) doi: 1.11648/j.ijefm.21315.17 Investment
The Causality between Revenues and Expenditure of the Federal and Provincial Governments of Pakistan
 The Pakistan Development Review 49:4 Part II (Winter 2010) pp. 651 662 The Causality between Revenues and Expenditure of the Federal and Provincial Governments of Pakistan TAHIR SADIQ * 1. INTRODUCTION
Journal of Chemical and Pharmaceutical Research, 2014, 6(6): Research Article
: Research Article") Available online www.jocpr.com Journal of Chemical and Pharmaceutical Research, 2014, 6(6):1179-1183 Research Article ISSN : 0975-7384 CODEN(USA) : JCPRC5 Empirical research on the bio-pharmaceutical listed
Available online www.jocpr.com Journal of Chemical and Pharmaceutical Research, 2014, 6(6):1179-1183 Research Article ISSN : 0975-7384 CODEN(USA) : JCPRC5 Empirical research on the bio-pharmaceutical listed
VOLATILITY. Time Varying Volatility
 VOLATILITY Time Varying Volatility CONDITIONAL VOLATILITY IS THE STANDARD DEVIATION OF the unpredictable part of the series. We define the conditional variance as: 2 2 2 t E yt E yt Ft Ft E t Ft surprise
9. Assessing the impact of the credit guarantee fund for SMEs in the field of agriculture - The case of Hungary
 Lengyel I. Vas Zs. (eds) 2016: Economics and Management of Global Value Chains. University of Szeged, Doctoral School in Economics, Szeged, pp. 143 154. 9. Assessing the impact of the credit guarantee
TRADING VOLUME REACTIONS AND THE ADOPTION OF INTERNATIONAL ACCOUNTING STANDARD (IAS 1): PRESENTATION OF FINANCIAL STATEMENTS IN INDONESIA
: PRESENTATION OF FINANCIAL STATEMENTS IN INDONESIA") TRADING VOLUME REACTIONS AND THE ADOPTION OF INTERNATIONAL ACCOUNTING STANDARD (IAS 1): PRESENTATION OF FINANCIAL STATEMENTS IN INDONESIA Beatrise Sihite, University of Indonesia Aria Farah Mita, University
TRADING VOLUME REACTIONS AND THE ADOPTION OF INTERNATIONAL ACCOUNTING STANDARD (IAS 1): PRESENTATION OF FINANCIAL STATEMENTS IN INDONESIA Beatrise Sihite, University of Indonesia Aria Farah Mita, University
THE IMPACT OF OIL REVENUES ON BUDGET DEFICIT IN SELECTED OIL COUNTRIES
 THE IMPACT OF OIL REVENUES ON BUDGET DEFICIT IN SELECTED OIL COUNTRIES Mohammadreza Monjazeb, Arezoo Choghayi and Masumeh Rezaee Economic department, University of Economic Sciences Abstract The purpose
DATA VARIABEL PENELITIAN
 68 LAMPIRAN 1 DATA VARIABEL PENELITIAN TAHUN FDI SBI PDRB UNEMP. EXPORT 1983 1834,40 12,74 5915,37 821257 10649,82 1984 1507,08 13,45 6372,17 878380 12455,86 1985 2263,20 13,82 6884,81 857564 10719,35
The Influence of Leverage and Profitability on Earnings Quality: Jordanian Case
 The Influence of Leverage and Profitability on Earnings Quality: Jordanian Case Lina Hani Warrad Accounting Department, Applied Science Private University, Amman, Jordan E-mail: l_warrad@asu.edu.jo DOI:
Effectiveness of macroeconomic policies in the context of closed and open economies
 Journal of Economics and Management ISSN 1732-1948 Vol. 25 (3) 2016 N. Kubendran School of Law Alliance University kubendran.n@alliance.edu.in Effectiveness of macroeconomic policies in the context of
Nexus between stock exchange index and exchange rates
 International Journal of Economics, Finance and Management Sciences 213; 1(6): 33-334 Published online November 1, 213 (http://www.sciencepublishinggroup.com/j/ijefm) doi: 1.11648/j.ijefm.21316.2 Nexus
Return on Assets and Financial Soundness Analysis: Case Study of Grain Industry Companies in Uzbekistan
 International Journal of Management Science and Business Adminis tration Volume 4, Issue 6, September 2018, Pages 52-56 DOI: 10.18775/ijmsba.1849-5664-5419.2014.46.1006 URL: http://dx.doi.org/10.18775/ijmsba.1849-5664-5419.2014.46.1006
What is the effect of inflation on consumer spending behaviour in Ghana?
 MPRA Munich Personal RePEc Archive What is the effect of inflation on consumer spending behaviour in Ghana? Gabriel Effah Nyamekye and Eugene Adusei Poku Sunyani Technical University 31 March 217 Online
CHAPTER 5 MARKET LEVEL INDUSTRY LEVEL AND FIRM LEVEL VOLATILITY
 CHAPTER 5 MARKET LEVEL INDUSTRY LEVEL AND FIRM LEVEL VOLATILITY In previous chapter focused on aggregate stock market volatility of Indian Stock Exchange and showed that it is not constant but changes
Proving the Relation between Stock and Interbank Markets: The Bahrain Stock Exchange
 MPRA Munich Personal RePEc Archive Proving the Relation between Stock and Interbank Markets: The Bahrain Stock Exchange Aleksandr Matveev Universidad Pontificia Comillas, Madrid, Spain, Universite Paris-Sud