Trade Costs, Pricing to Market, and International Relative Prices
|
|
|
- Todd Caldwell
- 6 years ago
- Views:
Transcription
1 Trade Costs, Pricing to Market, and International Relative Prices Andrew Atkeson and Ariel Burstein February, Abstract We extend some of the recently developed models of international trade to study their implications for the main features of the fluctuations in the relative producer andconsumerpricesoftradeableandtradedgoodsobservedinthedata. Wefind that when our model is parameterized to match some of the main features of the data on trade volumes both at the aggregate and firm level and to have reasonable implications for both the concentration of production among producers in a market and the distribution of markups of price over marginal cost, it reproduces many of the main features of the data on the fluctuations in the relative producer and consumer prices of tradeable and traded goods. We then use this model to assess the extent to which international trade costs and imperfect competition with pricing to market play essential roles in accounting for these price data. We find that international trade costs play an essential role in our model in accounting for the behavior of both producer and consumer prices for tradeable and traded goods. We find that imperfect competition with pricing to market plays an essential role in accounting for the behavior of producer prices for tradeable and traded goods, but it plays only a minor role in accounting for the behavior of consumer prices of tradeable goods. Very preliminary and incomplete. Please check the authors websites for more up to date versions of this paper. We thank V.V. Chari and Marc Melitz for very useful comments and Ricardo Pasquini and Sergio Xavier for excellent research assistance. UCLA, Federal Reserve Bank of Minneapolis, and NBER. UCLA.
2 1. Introduction The hypothesis of purchasing power parity (PPP) at least in its loosest form as the hypothesis that international trade in goods should limit the fluctuations in the relative price of tradeable goods across countries has been a central pillar of standard open-economy macroeconomic models for many years. This hypothesis of purchasing power parity appears to give a very good account of the fluctuations in the international relative prices of gold or oil or several other traded commodities the relative prices of gold or oil across countries, stated in terms of a common currency, are essentially constant. It has been clear for several decades, however, that the hypothesis of purchasing power parity gives a poor account of the fluctuations in international relative prices at the aggregate level: real exchange rates, measured in terms of consumer prices, producer prices, or relative costs of production across countries are all extremely volatile. It has been argued in the literature that consideration of international trade costs and imperfect competition leading to pricing to market 1 are likely to be key components of a successful model of these movements in international relative prices (see, for example Obstfeld and Rogoff 2 and Engel 22). In this paper, we extend some of the recently developed models of international trade to study their implications for the main features of the fluctuations in the relative producer and consumer prices of tradeable and traded goods observed in the data. In particular, our model nests versions of both the older models of trade based on specialization and monopolistic competition surveyed in Helpman and Krugman (1985) and the newly developed extensions of Dornbush, Fisher, and Samuelson s (1977) Ricardian model of international trade with a continuum of goods by authors such as Eaton and Kortum (21), Bernard, Eaton, Jensen and Kortum (23), Melitz (23), Eaton, Kortum, Kramarz (24), and Alvarez and Lucas (24). Our model follows this earlier work in providing a simple and tractable account of the patterns of international trade both at the aggregate level and at the level of the individual producer. It also includes a simple yet rich model of imperfect competition in which firms do not fully pass through changes in their marginal costs to their prices and in which exporting firms may practice pricing to market. Our model features a large number of sectors each with a finite number of firms producing differentiated products within the sector, with these firms 1 Pricing to market is defined as fluctuations in the relative price (measured in the same currency) that an exporter charges for his output in two different markets. See, for example, Dornbush (1987) and Krugman (1987) for an early discussion of this pricing practice. 2
3 engaged in quantity competition a la Cournot 2. We ask whether this model can reconcile observed patterns of international trade with fluctuations in international relative prices 3. It is important to note that our approach in this paper is partial equilibrium in the sense that we take as given movements in the relative cost of production across countries and ask what changes in the consumer and producer prices of tradeable and traded goods should result from these changes in costs. We do not address in this paper the general equilibrium question of what shocks lead to these large and persistent changes in costs and prices across countries. We find that a version of our model parameterized to match some of the main features of the data on trade volumes both at the aggregate and firm level and to have reasonable implications for both the concentration of production among producers in a market and the distribution of markups of price over marginal cost reproduces many of the main features of the data on the fluctuations in the relative producer and consumer prices of tradeable and traded goods. We then use the model to assess the extent to which international trade costs and imperfect competition with pricing to market play essential roles in accounting for these price data. We find that international trade costs play an essential role in our model in accounting for the behavior of both producer and consumer prices for tradeable and traded goods. We find that imperfect competition with pricing to market plays an essential role in accounting for the behavior of producer prices for tradeable and traded goods, but it plays only a minor role in accounting for the behavior of consumer prices of tradeable goods. We focus on two features of the data on international relative prices in particular. The first feature of the data is the observation that, for the major developed economies, the international relative producer price of manufactured (tradeable) goods is substantially more volatile than the corresponding terms of trade for manufactured goods. In our model, the international relative producer price of tradeable goods moves in response to a change in relative production costs across countries simply because each country specializes in the 2 Feenstra, Gagnon, and Knetter (1996) and Yang (1997) study related models of imperfect competiton with variable markups. Bergin and Feenstra (21) and Corsetti and Dedola (23) also present frameworks for analyzing monopolistic competition with non-constant elasticities of demand. Variable markups are also a characteristic of the literature on exchange rates and sticky prices (see for example Betts and Devereux 2 and Chari, Kehoe and McGrattan 22). Our work is distinguished from that sticky-price literature in that here prices are always set optimally and not fixed by assumption. 3 Bergin and Glick (24) and Ghironi and Melitz (24) also study versions of new models of international trade that can account for some features of fluctuations in international relative prices. Their main emphasis is on the role of the entry and exit of firms to the export markets. Here we focus on trade costs and variable markups leading to pricing to market by individual firms. 3
4 production of a distinct set of goods. What is more difficult to reproduce in the model is the observation that this change in relative production costs across countries leads to a substantially smaller movement in the terms of trade. Algebraically, this can be the case only if there are systematic fluctuations in the ratio of export prices to home country producer prices and the ratio of import prices to source country producer prices for tradeable goods. In the context of our model, this feature of the data can be explained only if there are costs of international trade and if exporting firms practice substantial pricing to market. To see this, observe that if firms set both domestic and export prices at a constant (but perhaps different) markup over marginal cost, then they do not practice pricing to market and shocks to marginal cost leave the ratio of export prices to producer prices in each country unchanged. Hence relative producer prices and the terms of trade move one-for-one with each other. Next observe that in our model, even if firms charge variable markups in that they do not raise prices one-for-one with a change in marginal cost, in the absence of international trade costs, firms face the same set of competitors when selling at home and abroad and thus choose identical markups and prices in both markets. Thus, without international trade costs, we have no pricing to market. We see the finding that our model of imperfect competition and international trade can, with reasonable parameter values, reproduce this observation about the fluctuations in the international relative producer price of tradeable and traded goods, as one of the major results of the paper. The second feature of the data that we study is the finding that for many developed economies there appears to be little or no difference in the magnitude of the fluctuations in the international relative consumer price of the basket of goods that are considered tradeable and the magnitude of the fluctuations in consumer price based real exchange rates 4. This finding has been presented as an important challenge in open economy macroeconomics since it suggests that international arbitrage through international trade plays only a very limited role in mitigating the fluctuations in international relative consumer prices at the macroeconomic level. We find, in the context of our model, that there is a simple explanation for this finding regarding the behavior of consumer prices in the data goods that are actually traded form only a small share of the cost of the CPI bundle that is considered tradeable 5. 4 This observation that the fluctuations in the international relative consumer price of tradeable goods are nearly as large as fluctuations in CPI-based real exchange rates themselves holds both at short and long horizons. See, for example, Engel (1999), Obstfeld and Rogoff (2), Chari, Kehoe, McGrattan (22), and Betts and Kehoe (24). 5 Standard models in open economy macro like those studied by Backus, Kydland, and Kehoe (1995) 4
5 This is true not only because imports are only a relatively small share of domestic output (measured at producer prices) of tradeables sectors, but also because consumer prices for tradeables include a substantial margin over producer prices accounted for by non-tradeable distribution services (see Burstein, Neves, and Rebelo 23 and Burstein, Eichenbaum, and Rebelo 24 for a related argument to explain low inflation after large devaluations). We find in our model that consideration of pricing to market under imperfect competition contributes very little to the movements in the relative consumer price of tradeable goods. This is because this pricing has two nearly offsetting effects on the consumer price of tradeables. Pricing to market leads to movements in the ratio of export and producer prices that amplify the movement in the relative consumer price of tradeables in response to a change in international relative costs. It also leads, however, to movements in the markups that firms charge for domestic sales that dampen the movement in the relative consumer price of tradeables in response to a change in international relative costs. After considering these macro implications of our model for international relative prices, we then study the implications of our model for producer prices and the terms of trade at the sectoral level. We find in sectoral data for the U.S. manufacturing sector that there is tremendous heterogeneity in the movements in the ratios of export and import to producer prices that occur even when there is a large change in the producer price based real exchange rate for the U.S. Moreover, this heterogeneity does not appear to be strongly related either to the share of sectoral output that is traded or to the Herfindahl index for the sector as a measure of its concentration. We find similar results for the sectors in our model. We find that there is considerable heterogeneity across sectors in the responses of export, import, and producer prices to our assumed change in relative costs across countries. We also find that these heterogeneous responses are not tightly linked to the share of sectoral output that is traded or to the Herfindahl index for the sector. Pricing in our model, it turns out, depends in subtle ways on the exact configuration of costs across firms in a sector, and this is true despite the relative simplicity of our formulation. The structure of our paper is as follows. We first review the observations on international relative prices that are the focus of this paper. We then present our model. Here we abstract from consideration of non-tradeable distribution costs in the consumer prices of tradeable if extended to include a non-tradeable sector and calibrated to have a small share of foreign goods in the tradeable aggregate would also be consistent with the observation that the relative consumer price of tradeables is almost as volatile as the real exchange rate. 5
6 goods to keep the model simple. We present a parameterization of the model that roughly matches micro and macro observations on the extent of trade in US manufacturing as well as data on industry concentration and firm markups and then consider the implications of this model for the relative producer and consumer prices of tradeable and traded goods in response to a change in the relative costs of production across countries. To illustrate the role of pricing to market and international trade costs in the model, we compare our results to two alternative parameterizations of the model one in which firms choose prices that are a constant markup of prices over marginal cost and another in which there are no international trade costs. We next examine the pricing implications of the model at the sectoral level and compare them to sectoral level price data from the U.S.. We then conduct a sensitivity analysis of how our quantitative results for both micro and price data depend on the parameters of the model. Here we also explore the pricing implications of our model at the firm level. Finally, we extend the model to include non-tradeable distribution costs in the pricing at the consumer level of tradeable goods. 2. Data on International Relative Prices Fact 1: The manufacturing terms of trade are significantly less volatile than the international relative price of manufactured goods The terms of trade (TOT) for a given country is the ratio of the price index for imported goods (IPI) to the price index for exported goods (EPI). One can think of these import and export price indices as trade-weighted indices of the prices of goods actually traded with that country s trading partners. In Table 1, we compare the volatility of the terms of trade for manufactured goods for a number of developed countries to the volatility of the international relative price of manufactured goods for these countries. For each country, we measure the international relative price of manufactured goods as the ratio of the producer price index for manufactured goods for that country (P M ) to a trade-weighted 6 average of the manufactured goods producer price indices for that country s trading partners, where these price indices are measured in the currency of the home country (epm). This international relative price of manufactured goods can be thought of as a PPI-based real exchange rate for manufactured goods. Manufactured import and export prices as well as manufacturing producer price indices are obtained from the OECD. We also include additional results in the table for the 6 We use trade weights obtained from the OECD. 6
7 United States using manufactured import and export price indices computed by the Bureau of Labor Statistics (BLS) 7. We use import and export price indices for manufactured goods to be consistent with our model and to avoid including oil prices which have a large impact on the volatility of the overall terms of trade for many countries (see Backus and Crucini 2). Figure 1 displays quarterly time series using BLS data, between 1985 and 24, for the U.S. terms of trade for manufactured goods and the U.S. trade weighted manufacturing PPIbased real exchange rate. Table 1 shows the relative volatility of the manufacturing terms of trade and trade weighted manufacturing PPI-based real exchange rates for a variety of countries. Volatilities in the table are measured both in terms of the standard deviation of four quarter changes in prices and in terms of the standard deviation of deviations of prices from HP-trends. It can be seen both in the table and the figure that movements in the terms of trade are significantly smaller than changes in the international relative price of manufactured goods. Algebraically, this can be the case only if there are systematic fluctuations in the ratio of export prices to home country producer prices and the ratio of import prices to source country producer prices for tradeable goods. This implication follows from the decomposition µ µ µ µ PM PM IPI EPI =. (2.1) epm EPI epm IPI In this decomposition, P M /epm is the international relative producer price of tradeable goods, P M /EP I istheratioofproducerandexportpricesfortradeablegoods,ipi/epm is the (trade weighted) ratio of import and foreign producer prices for tradeable goods, and EPI/IPI is the terms of trade 8. As is to be expected given the findings above, in our data, there are large fluctuations in the price ratios P M /EP I and IPI/ePM. We report on the magnitude of these fluctuations in 7 The Bureau of Labor Statistics (BLS) constructs import and export price indices for the United States using sampling methods similar to those that it uses to compute producer price indices. In many other countries, the prices of imports and exports are measured using unit values rather than price indices. In contrast with the BLS data, the OECD data on import and export prices is in terms of unit values. 8 This decomposition has been studied in the sticky price literature on the fluctuations in international relative prices. Obstfeld and Rogoff (2) have observed that if one assumes that nominal prices are stuck in the currency of the producing firm, then the ratio of nominal export prices to producer prices in each country is fixed and hence the relative price of tradeable goods and the terms of trade move together one for one with any movement in the nominal exchange rate. In contrast, if nominal prices are stuck in the currency of the country in which the good is sold, then a shift in the exchange rate leads to an equivalent shift in the ratio of export prices to domestic prices in each country and the terms of trade moves one-for-one, but in the opposite direction, as the relative price of tradeable goods. As noted by Campa and Goldberg (24), the data lie between these two extremes. 7
8 Table 1 as well. Figure 2 displays large fluctuations of IPI/ePM in the U.S. for manufacturing imports from Japan, the European Union, and Canada. Manufacturing price indices by locality of origin were obtained from the BLS. We think of this finding that there are systematic fluctuations in the ratio of export to domestic prices across countries as the macroeconomic analog of the finding in the literature that there is pricing to market in firm level or highly disaggregated price data. In terms of that literature Marston (199) studies the response of domestic and export prices to changes in Japan s real exchange rate, for 17 4-digit Japanese industries. On average, his estimates imply that the relative price of exports to domestic sales falls by roughly 5% of any appreciation of the real exchange rate. Knetter (199 and 1993) studies how prices of exports from U.S., UK, Japan, and Germany, response to changes in destination specific real exchange rates. He finds, for example, that the relative price that Japanese auto exporters charge for their exports in Germany relative to the U.S., change by 7% of any fluctuation in the Germany-U.S. real exchange rate. Goldberg and Knetter (1997) survey recent micro studies that suggest that pricing to market is very prevalent in the data. Fact 2: Fluctuations in CPI-real exchange rate for tradeable goods across countries are nearly as large as fluctuations in overall CPI-real exchange rates Our first fact concerns producer prices the prices that firms charge for goods that are internationally traded and goods that are sold domestically. Our second fact concerns consumer prices. Define the CPI-real exchange rate (RER) as the ratio of the consumer price indices (CPI) in two countries, measured in a common currency, and define the CPIreal exchange rate for tradeable goods as the ratio of the component of the CPI covering tradeable goods in those two countries, again measured in a common currency. Engel (1999) and Betts and Kehoe (22) propose an approach to decompose movements in the real exchange rate into two components: movements in the relative price of tradeable goods across countries, and movements in the price of non-tradeables relative to tradeables across countries: RER = P µ µ 1 P T = 1 P1 /P1 T (2.2) ep 2 ep2 T P 2 /P2 T = RER T RER N Here, Pi T denotes that component of the CPI in country i that is categorized as tradeable and e the nominal exchange rate. The term P i /Pi T is proportional to the the price of nontradeables relative to tradeables across countries. Non-tradeable goods account on average 8
9 for roughly 5 percentofthecpibasket(6% in the U.S.), and include categories like education, health, and housing. Tradeables include non-durable goods (food and beverages, apparel, etc.) and durables (private transportation, household furnishings, etc.). Work by Engel (1999), Obstfeld and Rogoff (2), Betts and Kehoe (22), and Chari, Kehoe, and McGrattan (22) find that RER T is almost as volatile as RER for a set of industrialized countries. Engel (1999) examines U.S. bilateral real exchange rates with a set of OECD countries, and finds that at short and medium horizons, RER T accounts for almost all fluctuations in the mean squared error of changes in RER. Chari, Kehoe and McGrattan (22) let country 1 be the United States, and country 2 be an aggregate of four European countries. Using a sample period from 1973 to 1998, theyfind that the standard deviation of detrended RER T is 94% as large as the standard deviation of RER. Itisimportanttonotethatamodelsuchastheonethatwestudyhasverydifferent implications for the fluctuations in the international relative price of tradeable goods as measured by producer prices and the international relative price of tradeable goods as measured by consumer prices. In our model, each country specializes in the production of a different set of commodities with that set determined by comparative advantage. If the relative cost of production across countries fluctuates, then there are fluctuations in the international relative producer prices of tradeable goods as firms change their prices in response to changes in cost. These fluctuations in the producer prices for tradeable goods occur even if the law of one price holds for each tradeable good simply because the set of goods being produced is different in each country. In contrast, in the absence of international trade costs, if the law of one price holds, there are no fluctuations in the international relative price of tradeable goods as measured by consumer prices because, in the model, the set of tradeable goods consumed in each country is identical. 3. The Model We develop a partial equilibrium model in which two symmetric countries (indexed by i =1, 2) produce and trade a continuum of goods subject to frictions in international goods markets. We first illustrate our results in a simple version of the model to keep the intuition for our results clear. In particular, we leave out until Section 8 consideration of the role of non-traded distribution costs in affecting pricing of tradeable goods. We consider aggregate shocks to the marginal cost of production as the driving force behind fluctuations in 9
10 international relative prices Aggregation of goods into sectors Our model is designed to allow us to derive implications for international relative prices both at an aggregated and disaggregated level. At the lowest level of disaggregation in our model, we consider individual firms producing what we term goods. These goods are the only commodities in our model that should be interpreted as physical objects that can be traded across international borders. We aggregate goods into categories that we term sectors. We interpret sectors in our model as corresponding to the lowest level of disaggregation of commodities used in economic censuses and price index construction. We assume that each firm in our model produces a distinct good in a specific sector. One important assumption that we make is that there are only a relatively small number of firms in each individual sector. We then further aggregate sectors into two consumption composites: one that we call tradeable consumption and the other non-tradeable consumption. We interpret the prices in our model of these two consumption composites as corresponding to the tradeable and non-tradeable components of the consumer price index in the data studied by Engel (1999) and others. Finally, at the highest level of aggregation, these two consumption composites are combined into aggregate consumption, the price of which in the model corresponds to the consumer price index in the data. We present this aggregation of goods starting at the highest level of aggregation as follows. Aggregate consumption c i is an aggregate of two consumption composites: tradeable consumption c T i,andnon-tradeable consumption c N i given by c i = c T γ i c N 1 γ i. The price of aggregate consumption at date t, which we interpret as the consumer price index, is denoted P it and is given by P i = κ Pi T γ P N 1 γ i,whereκ = γ γ (1 γ) (1 γ) and Pi T is the component of the consumer price index covering tradeable goods and Pi N is the component of the consumer price index covering non-tradeable goods. The tradeable and non-tradeable consumption composites c T i and c N i are produced by a competitive firm using the products of a continuum of sectors yij T and yij N for j [, 1] as 1
11 inputs subject to a standard CES production function Z 1 Z 1 c T i = y T 1 1/η ij dj η/(η 1) and c N i = y N 1 1/η ij dj η/(η 1). (3.1) As is standard, the tradeable and non-tradeable price indices P T i and P N i are given by P T i = Z 1 P T ij 1 η dj 1/(1 η) and P N i = Z 1 P N ij 1 η dj 1/(1 η) and the demand functions for the output of individual sectors are given by (3.2) P T ij P T i = Ã y T ij c T i! 1/η and P N ij P N i = Ã y N ij c N i! 1/η. (3.3) We finally turn to the lowest level of aggregation in the model, the aggregation of goods into sectors. In each country i and sector j, there are K domestic firms selling distinct goods in the sector. For the non-tradeable sectors, the K domestically produced goods are the only goods in these sectors. For the tradeable sectors, there are K domestic firms selling distinct goods and an additional K foreign firms that may, in equilibrium, sell goods in that sector. We use the convention that firms k =1, 2,...,K are domestic and k = K +1,K+2,...,2K are foreign. Output in each sector is given by y T ij = " 2K X k=1 # ρ/(ρ 1) ρ 1 q T ρ ijk and yij N = " K X k=1 # ρ/(ρ 1) ρ 1 q N ρ ijk (3.4) where qijk T and qn ijk are the sales in country i of firm k in tradeable (T ) and non-tradeable (N) sectors j respectively. Again, as is standard, the sectoral price indices Pij T and Pij N are given by " 2K # 1/(1 ρ) " X K # 1/(1 ρ) Pi T = P T 1 ρ X ijk and Pi N = P N 1 ρ ijk (3.5) k=1 and the demand functions for goods within a sector are given by P T ijk P T ij = Ã q T ijk y T ij! 1/ρ and P N ijk P N ij 3.2. Production and International Trade Costs = k=1 Ã q N ijk y N ij! 1/ρ. (3.6) We assume that each firm has a constant returns to scale production function that has labor as the only input. These production functions are given by zl, where z differs across 11
12 firms. Specifically, we assume that each firm draws its productivity z from a log-normal distribution, with log z N(, θ). We assume that the wage rate in country i is given by W i. Thus, the marginal costs of production for a firm with productivity z based in country i is W i /z. 9 In addition to the production costs, we assume that there are two costs of international trade. We assume that there is a fixed cost F for any firm that wishes to export any of its output to the other country. We also assume that there is an iceberg type marginal cost of exporting indexed by D 1. With this iceberg trade cost, the marginal cost for a firm with productivity z in country 1 to sell its output in country 2 is DW 1 /z. Note that with D =1, the marginal cost of sales is the same across countries. We assume that for the goods in the non-tradeable sectors j, N, D = so there is no international trade in these goods. In the model, we assume that there is an exogenously given number K of domestic firms in each sector each with idiosyncratic productivity draws z. Hence, for the non-tradeable sectors, the total number of firms in each sector is fixed at K. The total number of firms, both domestic and foreign, that sell positive amounts of their goods in each country in each tradeable sector is determined endogenously in equilibrium firms will choose to export if it is profitable for them to do so Market Structure We assume that the individual goods producing firms are engaged in imperfect competition. In most of the results that follow, we take as a baseline case a model of imperfect competition based on the following assumptions. A1) Goods are imperfect substitutes: ρ <. A2) Goods within a sector are more substitutable than goods across sectors: 1 < η < ρ. A3) Firms play a static game of quantity competition. Specifically, each firm k chooses its quantity qijk T or qn ijk taking as given the quantities chosen by the other firms in the economy, as well as the domestic wage rate W, and the aggregated prices P T i c T i and P N i and quantities and c N i. Note that under this assumption, each firm does recognize that sectoral prices Pij T and Pij N and quantities yij T and yij N vary when that firm changes its quantity qijk T or qn ijk. We solve the model under these assumptions as follows. We start with the non-tradeable sectors. For each non-traded sector j, N in country i, there are K domestic firms. We say 9 Given the partial equilibrium nature of our exercise, the labor input can be more broadly interpreted as a composite of labor and capital services at a unit cost W. 12
13 that a vector of quantities qijk N N and prices Pijk are equilibrium prices and quantities in that sector if, for each firm l =1,...K, with productivity zijl N, the quantity qn ijl and price Pijl N solve the profit maximization problem max Pq qw i/zijl N P,q subject to the demand function derived from (3.3) and (3.6) µ µ Ã! 1/ρ 1/η P q y N ij = Pi N yij N c N i with yi N given by (3.4), with qijl N = q, and the other quantities qijk N taken as given, and aggregate price Pi N and quantity c N i fixed. The vector of equilibrium prices for the sector can be found by solving the first order conditions of this profit maximization problem given the wage rate W i and firm productivities zijk N.Thesefirst order conditions give equations " # Pijk N ηρ W i =, (3.7) η(ρ 1) s N ijk (ρ η) zijk N where s N ijk = P ijk N qn ijk / P K l=1 P ijl Nqn ijl is the market share of firm k in its sector1. We use an iterative procedure to solve for the equilibrium prices and quantities for the tradeable sectors. Such a procedure is required to determine how many foreign firms pay the fixed trade cost to supply the domestic market. We illustrate this procedure for tradeable sector j, T in country 1. We first solve for the equilibrium prices and quantities under the assumption that only the lowest cost producer in sector j, T in country 2 exports his good to country 1. In this case, we solve for the K prices for the domestic firms using equation (3.7) with i =1and the one price for the lowest cost producer in country 2 (this firm is numbered K +1)using the equation " # P1jK+1 T ηρ DW 2 =. η(ρ 1) s N 1jK+1 (ρ η) z2jk+1 T 1 >From (3.5) and (3.6), these market shares can be written as a function of prices s N ijk = ³ 1 ρ Pijk N P ³ K l=1 Pijl N 1 ρ. Hence (3.7) defines K non-linear equations in the K equilibrium prices P N ijk. 13
14 Note here that the iceberg trade cost D scales up the marginal cost for this exporter. We then check whether, at these prices and quantities, this lowest cost exporter in country 2 earns enough profits to cover the fixed cost 11 F. If this lowest cost exporter does not earn enough to cover the fixed cost, then, in equilibrium, there are no firms in sector j that export their good from country 2 to country 1. If this lowest cost exporter does earn enough to cover the fixed cost, then we repeat the procedure above under the assumption that the two lowest cost firms in sector j in country 2 export to country 1. If, at these new prices, the second lowest cost firm in country 2 does not earn a profit large enough to cover the fixed cost F, then, in equilibrium, only the lowest cost firm in sector j in country 2 exports to country 1. If that second lowest cost producer in country 2 does earn a profit large enough to cover the fixed cost F, we repeat the procedure with the three lowest cost firms in sector j in country 2. We use the computer to simulate the equilibrium in a large number of tradeable and non-tradeable sectors Market Share and Markups Assumptions A1 and A2 generate two of the key features of this model of imperfect competition. The assumption A1 that ρ < implies that goods within a sector are imperfect substitutes so that each firm in a sector charges a distinct price for its product despite the fact that firms are engaged in quantity competition. With each firm charging a distinct price, we can construct in the model distinct sectoral producer price indices (covering prices that domestic producers charge for all sales), import price indices (covering prices that foreign firms charge for domestic sales), and export price indices (covering prices that domestic firms charge for foreign sales). The assumption A2 that ρ > η implies that that each firm s markup of its price over marginal cost is an increasing function of that firm s market share within its sector. This implication of the model is clearly seen in the pricing formula (3.7). In one extreme, if the firm has a market share s approaching zero, its markup approaches the standard markup ρ/(ρ 1) for a firm that perceives only the sectoral elasticity of demand. In the other extreme, if the firm has a market share s approaching one, its markup approaches the standard markup 11 We compute the equilibrium entry decisions for exporters only once with wages equal across countries. When we do so, we express the fixed cost as a percentage of the aggregate quantity F/c T i so that we calculate the equilibrium entry decisions for each sector separately. 14
15 η/(η 1) for a firm that perceives only the elasticity of demand across sectors. Firms with a sectoral market share between zero and one choose a markup that increases smoothly with that market share. It is this assumption A2 that breaks the link between prices and costs in our model and gives us the possibility that firms will not pass through changes in cost one-for-one into prices. Specifically, if a single firm or a group of firms in a sector experience an increase in marginal cost relative to the other firms in the sector, this firm or group of firms will loose market share and hence decrease their markup in equilibrium. As a result, the prices charged by this firm or group of firms will rise by less than the increase in their costs 12. Hence, the observation of incomplete pass-through of changes in costs to prices arises quite naturally in our model in the context of understanding the effects of shocks to relative costs across countries affecting the prices chosen by firms in these countries competing in a single national market. This feature of our model that generates incomplete pass through is not, by itself, enough to generate pricing to market. To get pricing to market, we must have that a change in costs for one firm or a group of firms leads to a change in markups for those firmsthatisdifferent in each market in which these firms compete. For that, we will need that this change in costs results, in equilibrium, in different changes in each firm s market share in each market in which it competes. As we will see below, the result that this model can generate pricing to market follows from very subtle nonlinearities in the model s equilibrium conditions. It is worth noting that if we make the alternative assumption that ρ = η, then our model reduces to the standard model of monopolistic competition with a constant markup of price over marginal cost given by ρ/(ρ 1). We will present results from this model with constant markups to illustrate the quantitative importance of endogenous variation in markups in our model. This model with ρ = η and hence constant markups is similar to the model studied by Ghironi and Melitz (24). Eaton and Kortum (22) and Alvarez and Lucas (24) study similar models in which it is assumed that firms set prices equal to marginal cost. Our model has similar implications for the movements in international relative prices under the assumption that ρ = η, so that markups are constant, as it does under the assumption that firms set prices equal to marginal cost. With the assumption A3 that firms engage in quantity competition, our model nests the 12 Note that if costs rise by the same amount for all firms in a sector, then prices also all rise by that amount and market shares and markups remain constant. 15
16 standard Cournot model as ρ gets large. This is because, as ρ approaches infinity, the distinct goods in a sector become perfect substitutes and there is a single price in each country for output in that sector. This Cournot model is similar to that studied in Eaton, Kortum, and Kramarz (24). In this paper, we study pricing under the assumption of quantity competition. It is straightforward to solve our model under the alternative assumption that firms engage in price competition in the sense that they choose their price and quantity to maximize profits taking the vector of prices (rather than quantities) chosen by the other firmsasgiven. Under this alternative assumption of price competition, in equilibrium firms choose a markup of price over marginal cost given by ρ s(ρ η) (ρ 1) s (ρ η) (3.8) where s is the firm s market share within the sector. Note that with ρ > η, this markup is also an increasing function of the firm s market share s, isequaltoρ/(ρ 1) with s =, and η/(η 1) with s =1. Thus, the implications of our model for markups under price competition are qualitatively similar to those under quantity competition. Under the assumption of price competition and the assumption that the fixed cost of exporting (F ) is zero, our model nests the standard Bertrand model as ρ gets large. This Bertrand model is similar to that studied in BEJK (23). Note that in our model, 1/D P1jk T /P 2jk T D. Thisisbecausemarkupsintheexport market are never larger than in the domestic market. Since equilibrium price differentials are lower than the cost of trading goods internationally, no third party has an incentive to ship goods to arbitrage these price differentials across countries. Therefore, the fact that consumers don t have incentives to arbitrage price differentials across countries is an outcome of the model, and not a consequence of assuming international market segmentation. 4. A quantitative example Here we argue that a plausibly parameterized version of our model can reproduce the main facts regarding international relative prices cited above. Specifically, we show that, in response to an exogenous shock to relative wages across countries, this model implies (i) a movement in the terms of trade that is much smaller than the movement in the relative price of tradeable goods across countries, and (ii) a movement in the relative price of tradeable 16
17 goods that is quite large relative to the overall movement in the real exchange rate. Again, wedonotmodeltheshockthatleadstothischangeinrelativewagecostsacrosscountries. One might think of it as arising from a productivity shock or from a change in the exchange rate in a model with sticky nominal wages Choosing benchmark parameters We argue that our model is plausibly parameterized because it reproduces a number of important patterns of trade, not only at the macro level, but also at the level of individual firms, as well as facts regarding the total sales and measured labor productivity of exporting versus non-exporting firms, markups of price over marginal cost, and industry concentration observed in firm-level data. Note that since the mapping between the model parameters and its implications for the facts under study is complicated and non-linear, we cannot follow the standard calibration procedure of choosing each parameter individually to match a separate fact. Instead, we have chosen directly as a benchmark one parameterization that reproduces a wide range of observations. We discuss the role of each parameter in the model by considering how the model s implications for our facts of interest change vary with each parameter from its benchmark value. In this benchmark quantitative example, we set the parameters to the following values: γ =.4, η =1.1, ρ =1, θ =.37,D =1.44,F/c T i =.3, and K =2. The model s implications in a symmetric equilibrium (W 1 = W 2 ) and the corresponding statistics from U.S. data are presented in Table 2. In terms of the model s macro implications, we consider the overall expenditure share on tradeable consumption (given by Pi T c T i /P i c i ), and the ratio of total exports plus imports to tradeable consumption. We compare these implications of the model to U.S. data on the portion of tradeable consumption in total consumer expenditure and the average of exports and imports relative to gross output in goods producing sectors 13 see Tables 3 and 6. Note that the overall expenditure share on tradeable consumption in the model is pinned 13 The source of the data on the volume of trade as a fraction of gross output is Table 15 from June 24 s Survey of Current Business: Improved Annual Industry Accounts for We define the good producing sectors aggregate as the sum of Agriculture, forestry, fishing, and hunting; Manufacturing; and Mining. Table 3 reports the value of.5 (exports + imports) / gross output for this aggregate sector between 1998 and 22. Our choice of 16.5% (which is lower than the average in this period) is consistent with the fact that the share of trade in this sector has been steadily growing over time. In the model we are abstracting from trade in services, where.5 (exports + imports) / gross output =1.3% on average in this period. 17
18 down at 4% by the parameter γ. The overall volume of trade in our model is determined by the tension between the gains from trade due to increased variety and the international trade costs 14. Since our model has two symmetric countries, in the absence of trade costs D and F, half of tradeable output in each country would be exported. With more than two symmetric countries, the share of tradeable output that is exported would be even larger. Our macro observation on the overall volume of trade can be broken down, at the firm level, into two components: the first being the fraction of firms that export any output at all, and the second being the fraction of total output that exporting firms actually export. InTable2,wecomparetheseimplicationsofthemodeltoU.S.datacitedinBernardand Jensen (24) regarding the fraction of U.S. manufacturing plants that export any output at all and data from BEJK (23) on the median fraction of total plant output that these exporting plants export 15. In our model, if F =, with ρ <, all firms producing tradeable output export some of their output. Thus, a positive fixed cost of exporting is required to match the observation that only a minority of plants export. Holding fixed the other parameters and the identity of those firms that do export, variations in the marginal trade cost D change the fraction of firm output that an exporting firm exports. In our model with trade costs, it is the firms that draw the lowest marginal costs of production that choose to pay the costs to export. In equilibrium, these firms also tend to charge lower prices in their home market, and thus to sell more output and to have a higher market share in their home sector, than the firms that do not export. Since these exporting firms tend to have a higher market share in their home sector, from (3.7), we see that in the model, exporters tend to choose a higher markup of price over marginal cost. As BEJK (23) discuss in detail, this implication that exporters choose a higher markup of price over marginal cost implies that exporters have higher labor productivity measured as sales divided by employment than non-exporters 16. We present the model s implications for the median sales and measured labor productivity of tradeable goods firms that export versus the median sales and measured labor productivity of tradeable firms that do not 14 In our model, with ρ <, the gains from trade are due entirely to increased variety since, by assumption, firms in each country produce a distinct set of goods. In the limit as ρ, the model becomes Ricardian as the distinction between goods within a sector disappears. 15 As reported in Table 1 in Bernard and Jensen (24), the fraction of exporters in total plants was 21% in 1987 and 3% in We choose an intermediate value of 25%. 16 Here we are assuming that the fixed costs to export are not counted in the calculation of labor productivity. If one were to include these costs in the calculation of labor productivity, then the model s implications for the labor productivity of exporting versus non-exporting plants would be ambiguous. 18
19 export. We compare these implications of the model to U.S. data cited in BEJK (23) regarding the median sales and measured labor productivity of U.S. manufacturing plants that export versus the median sales and measured labor productivity of U.S. manufacturing plants that do not export. Eaton, Kortum, and Kramarz (24) examine census data on theexportbehavioroffrenchfirms. They observe that these French data do not censor out small firms in the same way that the U.S. data from the census of manufactures does. They find that median sales for exporters in these French data are 28 times the median sales for non-exporters. This is much larger than the analogous figure of 4.8 from the U.S. data cited in BEJK. In our model, the parameter θ governs the dispersion of productivities across firms in a sector while the parameters η and ρ govern the extent to which this dispersion in productivities results in a dispersion of market shares and markups across firms. Here we examine the implications of these parameter choices not only for the size and productivity advantage of exporters versus non-exporters but also for the dispersion of market shares and markups across firms in a sector more generally. To summarize the dispersion of market shares across firms in a sector, we report the median Herfindahl index 17 across sectors in our model in Table 2. In the first panel of Figure 3 we show a histogram of Herfindahl indices across sectors. While we do not have comprehensive data to which to compare these implications of our model for market concentration across sectors 18, it is useful to note for comparison purposes, that the U.S. Department of Justice, in its merger guidelines 19 regards markets with a Herfindahl index below 1 to be unconcentrated, markets with a Herfindahl index between 1 and 18 as moderately concentrated, and markets with a Herfindahl index above 18 to be highly concentrated. We regard these merger guidelines as a rough guide to the level of concentration of markets at an economically meaningful level of aggregation in the U.S. economy. In Table 2, we also report the sales-weighted mean markup of price over marginal cost across firms in our model. The average markup in our model is in line with average markups 17 The Herfindahl index for a sector is the sum of the squared market shares of the firms in that sector. 18 The Census Bureau computes Herfindahl indices for manufacturing sectors down to six digit NAICS industries using data from the Census of Manufactures. In 1997, there were digit NAICS industries with 282 firms in the median industry and 7 firms on average in each industry. The median Herfindahl index across the these industries was 571 and the average of the Herfindahl indices across these industries was 737. We interpret sectors in our model as being at a lower level of aggregation than these 6-digit industries and thus expect a higher level of concentration on average within our sectors. 19 See in particular the discussion at 19
20 assumed in standard macro models (see for example Christiano, Eichenbaum, and Evans (23)). In the second panel of Figure 3 we show a histogram of firm markups of price over marginal cost Two alternative parameter settings We also study the implications of our model with two alternative sets of parameter values to illustrate the key economic forces at play in our benchmark example. These alternative parameter choices together with the model implications for these parameter choices are also presented in Table 2. In our first alternative set of parameters, we set ρ = η. From (3.7), we see that in this case, all firms choose a constant markup of price over marginal cost of ρ/(ρ 1). We refer to this parameterization of our model as the constant markup version of our model. These parameters are chosen so that, in the symmetric equilibrium, the constant markup version of our model has the same implications for the share of tradeables in consumption, the share of exports in manufacturing output and the fraction of exporting firms in the tradeable sector as the benchmark model. The value of ρ = η is roughly equal to the value used by BEJK (23). We consider this constant-markup version of our model to illustrate the role that variable markups play in shaping our model s implications for international relative prices. In the second alternative set of parameters, we set D =1and F =. In this case, there are no costs of international trade. We refer to this parameterization of our model as the frictionless trade version of our model. We consider this frictionless trade version of our model to illustrate the role that trade frictions play in shaping our model s implications for international relative prices The response of prices to a change in costs We now consider the change in equilibrium international relative prices implied by a one percent increase in wages in country 1 relative to country 2. We assume that these relative wages W 1 /W 2 are measured in a common currency 2.Thespecific shock that we consider in one in which W 1 increases by one percent and W 2 remains fixed. In Table 4 we report on our benchmark model s implications for the relative price move- 2 In this draft, for computational simplicity, we compute equilibrium at the new wage rates under the assumption that the same set of firms export as under the symmetric equilibrium. We show later that the model results do not depend in any important way on this assumption. 2
21 mentsthatarethefocusofourstudy: (i) the movement in the terms of trade as a percentage of the movement relative producer price of tradeable goods across countries, and (ii) the movement in the relative consumer price of tradeable goods as a percentage of the overall movement in the real exchange rate measured using consumer prices 21. We also include in the table the implications of the constant markup and the frictionless trade versions of our model for these same relative price movements The terms of trade and the relative producer price of tradeables In row 3 of Table 4, we see that our benchmark model produces a movement in the terms of trade that is only 54% as large as the movement in the relative producer price of tradeable goods across countries. This implication follows from the fact that firms in country 1 reduce their markups on exports to country 2 relative to their markups on domestic sales while firms in country 2 increase their markups on exports to country 1 relative to their markups on domestic sales. This variation in markups by location can be seen in the aggregate price indices in rows 1 and 2 of Table 4 where we report that the export price index for country 1 falls relative to the tradeable producer price index for country 1 whiletheimportprice index for country 1 rises relative to the tradeable producer price index for country 2. These movements in traded goods prices relative to tradeable producer prices are large in magnitude both are roughly 23% aslargeasthemovementintherelativeproducerpriceoftradeable goodsacrosscountries. In rows 4, 5, and 6 of Table 4, we report the movements in the producer price index, the export price index, and the import price index for country 1 all as a percentage of the change in wages W 1. There we see that producer prices in country 1 rise by more than export prices (thisiswhatgivesusthepricingtomarket)butthat both changes in prices are smaller than the corresponding change in domestic costs of production. Note in row 6 that the import price index also rises. This is true despite the fact that there has been no change in costs in country We measure the change in producer prices for tradeable goods in our model using an expenditure-share weighted average of the change in prices charged by domestic firms both for domestic sales and exports. Here we are following the practice of the BLS of including prices for all sales by domestic firms, including sales to foreigners, in the producer price index. Likewise, we measure the changes in export and import prices using expenditure-share weighted averages of the change in prices charged by domestic firms for their exports the change in prices for imported goods. We measure the change in consumer prices using an expenditureweighted share of the change in prices for all goods domestically consumed. For the non-tradable sectors, all of these goods are domestically produced, while for the tradeable sectors, these include domestically produced goods and imported goods. 21
22 Looking at the entries in Table 4 for the corresponding price movements for our constantmarkup and frictionless trade versions of the model, we see that we need both variable markups and trade frictions to deliver these implications for the relative producer prices for tradeable and traded goods. In both of these alternative versions of our model, the movement inthetermsoftradeisidenticaltothemovementintherelativeproducerpriceoftradeable goodsacrosscountriesandtheratioofexportpricestotradeableproducerpricesisconstant in both countries. The logic behind this finding that the terms of trade move one-for-one with the international relative producer price of tradeable goods differs across the constant markup and frictionless trade versions of our model. In the constant markup version of our model, the logic for this result is quite simple: for each firm, both domestic and export prices move one-for-one with the movement in domestic wages. Hence all changes in marginal cost are passed on fully to all prices. This feature of this constant-markup model can be seen clearly in rows 4,5, and 6 of Table 4. For the frictionless trade version of the model, the logic for this result is more subtle. In this version of the model, markups are not constant they vary with market share as described in (3.7). Thus, it is not the case that changes in marginal cost are passed on fully to prices. In fact, as is shown in rows 4 and 5 of the table there is incomplete pass-through as the firms in the country with rising wages lose market share and hence reduce their markups at home and abroad while we see in row 6 that the firms in the country with the constant wages increase their prices for exports. With no trade frictions, however, the set of firms competing in each sector is the same across countries, and this leads to the law-of-one price for each good despite imperfect competition. More specifically, each firm in a sector has the same marginal cost for sales in each country and hence each firm has identical market shares, identical markups, and identical prices in each country. This implies that, for each country, export prices remain constant relative to domestic producer prices and, thus, from our decomposition (2.1), that the terms of trade are identical to the relative producer price of tradeables across countries. Hence one can say that in the frictionless trade version of the model, there is incomplete pass through of costs to prices, but no pricing to market. Note as well that, in this model, international trade costs are not necessary for incomplete pass through but they are necessary for pricing to market. It is worth noting that in all three versions of our model, the relative producer price of 22
23 tradeable goods moves a great deal in comparison to the real exchange rate measured with consumer prices. In our benchmark parameterization of the model, the relative producer price of tradeable goods moves 87% as much as the CPI-based real exchange rate. In the constant markup version of the model, it moves 115% as much as the CPI-based real exchange rate, while in the frictionless trade version of the model, it moves by 9% as much as the CPI-based real exchange rate. These results follow directly from the fact that in our model each country specializes in the production of distinct sets of goods and hence there is no sense in which the law of one price should hold for producer prices The real exchange rate and the relative consumer price of tradeable goods We now turn to our model s implications for movements in the relative price of tradeable goods across countries when these prices are measured with consumer prices rather than producer prices. In row 7 of Table 4, we see that our benchmark model produces a movement in the relative consumer price of tradeable goods across countries that is 71% as large as the movement in the overall consumer-price real exchange rate itself. Note that our model produces this large movement in the relative consumer price of tradeable goods despite the fact that it abstracts from non-tradeable distribution costs as a component of the consumer price of tradeable goods. In Section 8, we extend the model to include these costs and obtain the results listed in row 8 of Table 4. There we find that, with them included, the model produces a movement in the relative consumer price of tradeable goods across countries that is 87% as large as the movement in the overall consumer-price real exchange rate itself. This finding in our benchmark model that the movement in the relative consumer price of tradeable goods across countries is quite large stands in stark contrast to the implications of the frictionless trade version of our model. As shown in row 7 of Table 4, in the frictionless trade version of our model, the relative consumer price of tradeable goods does not move at all. This is because in the frictionless trade version of the model, the law of one price holds for each tradeable good and consumption baskets are identical across countries. Hence, the consumer price index for tradeable goods is identical across countries. In this sense, the introduction of costs of international trade has a dramatic impact on the pricing implications of our model and moves the model much closer to the data not only in terms of its implications for traded quantities but also in terms of its implications for the relative consumer price of tradeable goods across countries. Note that this result that the consumer prices of tradeable goods are identical across 23
24 countries holds in the frictionless trade model even though, in that model, we have imperfect competition with variable markups. Recall that with imperfect competition in our model, there is incomplete pass through of foreign cost changes to import prices even in the frictionless trade version of the model. Without these international trade costs, however, the degree of pass through of costs to prices has no impact on our model s implications for the movements in the relative consumer price of tradeable goods. Now consider the implications of our constant markup version of the model for movements in the relative consumer price of tradeable goods. In row 7 of Table 4, we see that the movement in the relative consumer price of tradeable goods is now 77% of the movement in the overall consumer price real exchange rate. This movement in the constant markup version of the model is even larger than it is in our benchmark model with variable markups. This is because the pricing to market that arises in the benchmark model serves to dampen rather than amplify the movement in the relative consumer price of tradeable goods. This finding implies that while international trade costs are essential for generating movements in the relative consumer price of tradeable goods, incomplete pass through and pricing to market due to variable markups do not play an important role in generating this price movement. This finding that pricing to market in our benchmark model serves to dampen rather than amplify the movement in the relative consumer price of tradeable goods in comparison to the constant markup version of the model can be understood as follows. Take as given a change in the logarithm of relative wages across our two countries given by Ŵ 1 Ŵ 2. Let PPID d T i denote the resulting change in the logarithm in the producer price index for domestic sales of tradeable goods 22 in country i, and PPID d N i the corresponding change in the producer price index for non-tradeable goods. Let IPI d and EPI d denote the change in the logarithm of the import and export price indices for country 1. Then the change in the consumer price index for tradeable goods in country 1 is given by and that for country 2 by ˆP T 1 =(1 s M ) d PPID T 1 + s M dipi, ˆP T 2 =(1 s M ) d PPID T 2 + s M d EPI, 22 Recall that the standard producer price index includes the prices that domestic firms charge for exports as well as the price that domestic firms charge for domestic sales. We use the term producer price index for domestic sales here as a useful concept for explaining the intuition of our model. 24
25 where, with symmetry and balanced trade, s M is the share of tradeables expenditure on imports in both countries. Hence, the change in the relative consumer price of tradeable goodsisgivenby ³ RER d T =(1 s M ) PPID d T 1 PPID d ³ T 2 + s M IPI d depi. It is useful to rewrite this expression as RER d T = (1 2s M ) ³Ŵ1 Ŵ2 +(1 2s M ) ³ d PPID T 1 Ŵ 1 +s M ³ d IPI d PPID T 2 depi + PPID d T 2 + Ŵ 2 PPID d T 1. (4.1) This equality decomposes the change in the relative consumer price of tradeable goods into three components. The first component is simply the change in relative wages, which we take to be exogenous. The second component depends on the degree to which the change in relative wages, Ŵ 1 Ŵ2 is passed through to the prices paid for domestic sales in the two countries as measured by PPID d T 1 PPID d T 2. The third component depends on the degree of pricing to market as measured by the change in the relative price of exports and domestic sales for each country given by IPI d PPID d T 2 and EPI d PPID d T 1. Note that in the frictionless trade version of our model, the import share s M =1/2 so that the first two components are zero and that in this model there is no pricing to market, so the third term is zero as well. For non-tradeable goods ˆP i N = PPID d N i, so the change in the real exchange rate is given by RER d = γrer d ³ T +(1 γ) PPID d N 1 PPID d N 2, where γ is the consumption expenditure share on tradeable goods. The breakdown of the fluctuation in the relative consumer price of tradeable goods in (4.1) is reported in rows 9, 1, and 11 of Table 4. Consider first the pricing in the constant markup version of our model. In that model, all goods prices move one-for-one with movements in marginal costs. Thus, the prices charged for all domestic sales move one-for-one with domestic wages ( PPID d T i = PPID d N i = Ŵi), and the terms of trade for country 1 also ³ moves by the change in relative wages EPI d dipi = ³Ŵ1 Ŵ 2, so there is complete pass-through of cost changes to domestic prices and there is no pricing to market. Thus, the 25
26 movement intherelativeconsumerpriceoftradeable goodsisgivenbythefirst component alone RER d T =(1 2s M ) ³Ŵ1 Ŵ2. The ratio of the percentage movement in the relative consumer price of tradeables to the real exchange rate is given by RER d T RER d = (1 2s M) (1 γ2s M ) =77%. The last equality follows from our parameter choices of γ =.4 and s M =.165. Now consider pricing in our benchmark model with variable markups. For non-tradeable goods, we still have that prices move one-for-one with marginal costs so that PPID d N i = Ŵ i just as in the constant markup case. With variable markups, however, we have that the magnitude of RERT d depends on the degree of pass through of costs to domestic prices and the degree of pricing to market as measured in (4.1). We have incomplete pass-through of costs to domestic prices in our benchmark model since domestic producers in the country with rising relative costs lower their markups at home as they lose market share to imports while domestic producers in the country with falling relative costs raise their markups at home as they gain market share. Hence we have PPID d T 1 PPID d T 2 < Ŵ1 Ŵ 2, so that this second component in (4.1) is negative in our benchmark model with Ŵ 1 Ŵ 2 > as reported in row 1 of table 4. We also have pricing to market so that with Ŵ 1 Ŵ 2 >, we have dipi PPID d T 2 > and EPI d PPID d T 1 <. Therefore, the third component in (4.1) is positive as reported in row 11 of table 4. Hence, in our benchmark model, we have two offsetting effects on the relative consumer price of tradeable goods due to variable markups a negative effect due to incomplete pass through of costs to prices by domestic producers facing competition from imports, and a positive effect due to pricing to market. It is clear from our results comparing the benchmark model and the constant markup version of our model that the main reason for the movement in the international relative consumer price of tradeable goods is that the trade costs lead to a relatively low value of the import share s M. 26
27 5. Sectoral pricing In this section we compare the implications of our benchmark model for sectoral producer, export, and import prices and to some of the main features of U.S. data on these price by sector. We have obtained from the Bureau of Labor Statistics a sample of sectoral export, import, and producer price indices broken down into selected 3-6 digit sectors using the NAICS definitions of sectors 23. One of the most striking features of the data is that there is tremendous heterogeneity across sectors in terms of changes in the relative price of imports and domestic production and changes in the relative price of exports and domestic production even in periods in which there are large changes in relative producer prices across countries. In Figure 4, we present a histogram across sectors of these relative price changes ( IPI/ PPI and EPI/ PPI) for three time periods in which there was a large change in the U.S. trade weighted real exchange rate measured using manufacture producer price indices. These time periods are 1985Q3 1988Q4, 1995Q2 21Q4, and 21Q4 24Q2, and the corresponding changes in the US PPI-based real exchange rate were 38%, 23%, and 15%. We chose these time periods to isolate particularly large movements in the overall PPI based real exchange rate. During these periods, the change in the overall manufacturing import price index relative to the change in the trade weighted PPI real exchange rate was 62%, 76%, and 39% (it was 17%, 53%, and 32% for the overall export price index). The horizontal axis in Figure 4 is the change in the ratio of import to producer prices or export to producer prices over the time period as a fraction of the change in the PPI real exchange rate. As is clear from this histogram there is tremendous dispersion in these relative price changes across sectors. In the data, these changes in sectoral prices do not appear to be correlated either with trade shares or with sectoral concentration. To document this fact, in Figures 5 and 6 we show scatter plots across sectors of IPI/ PPI versus sectoral import shares, EPI/ PPI versus sectoral export shares, and these two price changes versus sectoral Herfindahl indices for the three time periods listed above. Here, again, these price changes are normalized by the change in the overall PPI based real exchange rate for each time period. Our benchmark model also produces heterogeneous movements across sectors in import and export price indices relative to producer price indices. In Figure 7 we plot a histogram 23 The BLS is in the process of producing a more complete set of sectoral price indices based on the new NAICS definitions of sectors. The data that they sent to us are early results from that project. 27
28 across sectors in our benchmark model of IPI/ PPI and EPI/ PPI in response to our assumed one percent change in costs across countries. Note that our assumption that vector of costs across firms in a sector is randomly drawn is the only reason in our model that price movements are not identical across sectors. Otherwise in our model, the parameters governing elasticities of demand and the number of firms in each sector are constant across sectors. In Figure 8, we show scatter plots across sectors from our model of IPI/ PPI for country 1 versus sectoral import shares, as well as IPI and PPI for country 1 individually versus sectoral import shares. Recall that in our experiment, wages in country 1 rise by one percent relative to wages in country 2. We see in these figures that for sectors with very small import shares, these two price indices move close to one-to-one with the changes in cost: import prices do not change, producer prices rise by one percent, so that import prices fall by one percent relative to producer prices. For sectors with larger import shares, markups change so that prices do not move one-for-one with costs: import prices rise despite the fact that costs in country 2 did not change, producer prices also rise, but now by less than the full one percent change in costs, and the relative price of imports and domestic sales falls, but by less (in absolute value) than for sectors with a very small import share. It is worth noting in these figures, however, that there is considerable variation in the response of prices in our model across sectors with the same import share. In Figure 9, we show the analogous scatter plots across sectors in our model with Herfindahl indices rather than import shares on the horizontal axis. In these figures we see that there is no close relationship in the model between sectoral concentration and price movements. As should be clear from these model scatter plots, there details of the distribution of costs across firms play an important role in determining sectoral price responses. These price responses are not neatly summarized by sectoral level data such as import shares or Herfindahl inidices. 6. Sensitivity Analysis So far, we have compared our benchmark model to two stark alternatives the constant markup version and the frictionless trade version of our model. We now consider the sensitivity of our benchmark results to changes in other parameters and assumptions. We report the results in Table 5. 28
29 6.1. Variation in θ We first consider the impact of the parameter θ governing the dispersion of productivities across firms on the implications of our model for trade and pricing. In our benchmark model, θ =.37. If we increase θ to.6, leaving the other parameters the same, we find that the volume of trade, the concentration of sales across firms in a sector, and average markups of price over marginal cost all increase. (Full results for these parameters are reported in column 2 of table 5). These changes occur because an increase in the dispersion of productivities across firms raises the gains from trade, because firm market shares are a convex function of their relative prices as given by (3.6), and because markups given by (3.7) are a convex function of firm market shares. With this change in the parameter θ, our model gives different predictions for the response of international relative prices to our one percent change in relative wages across countries. We find that our model predicts a smaller movement in the terms of trade relative to the movement in the international relative producer price of tradeables now 46% rather than the 54% in our benchmark case. This result suggests that an increase in dispersion of productivities in our model serves to increase concentration and the thus the extent of pricing to market. The relative consumer price of tradeables also moves by less relative to the overall CPI based real exchange rate now 58% rather than 71%. The finding that the relative consumer price of tradeables now moves by less as a fraction of the CPI-based real exchange rate follows from the fact that the volume of trade rises with the dispersion parameter θ. If we also increase the marginal costs D and F so that our model with θ =.6matches the trade share of 16.5%, (results are reported in column 3 of Table 5) we find that the terms of trade move by even less than before (now only 36% of the movement in the relative producer price of tradeables), but that the movement in the relative consumer price of tradeables is nearly identical to that in the benchmark model (71% of the movement in the CPI-based real exchange rate). These results indicate that an increase in concentration in our model, by itself, increases the degree of pricing to market, but does not have a substantial impact on the behavior of the relative consumer price of tradeable goods. 29
30 6.2. Variation in ρ We now consider the impact of the parameter ρ governing the elasticity of substitution across the output of firms competing within a sector. In our benchmark model, ρ =1. If we set this parameter to the higher value of ρ =2, (results are in column 4 of table 5) we find that the volume of trade falls, the concentration of production across firms in a sector increases, and the sales weighted average markup increases. Note that increasing the elasticity of substitution across goods decreases the gains from trade, holding fixed the other parameters of the model, while it makes the relationship between firm price and firm market share in (3.6) more convex. Increasing ρ has two countervailing effects on average markups the increase in concentration that comes with increasing ρ in and of itself tends to raise the average markup while the increase in ρ in the markup formula (3.7) tends to decrease the average markup. With this increase in the parameter ρ, we find again that with increased market concentration, the terms of trade move by less as a fraction of the relative producer price of tradeables than in our benchmark model. With a smaller volume of trade, the relative consumer price of tradeables moves by more as a fraction of the change in the CPI-based real exchange rate. If, when we increase ρ, we also lower the trade costs so that the model implies a trade share of 16.5%, (resultsincolumn5oftable5)weagainfind that the model produces a movement in the relative consumer price of tradeables equal to 71% of the movement in the CPI-based real exchange rate. This finding reinforces the conclusion that this movement in the relative consumer price of tradeables varies primarily with the trade share and not with the degree of pricing to market Variation in F The observation in micro data that only a minority of manufacturing plants or firms export any output at all has attracted considerable attention in the recent literature on international trade (see, for example, BEJK 23). We include a fixed cost of exporting, parameterized by F in our model, to match observations regarding the observed fraction of firms that export. If we set this fixedcosttozeroinourmodelwithρ <, we have, analytically, that all firms export some of their output. We now ask whether inclusion of this fixed cost F to match this observation regarding the fraction of firms that export has an important impact on our 3
31 pricing results. Consider now a version of our model in which we set F =and, at the same time, raise the marginal export cost D from its benchmark value so as to match again the volume of trade equal to 16.5% of tradeables production (results are in column 6 of Table 5). Now, all the firms in our model export, and trade is less than the frictionless value of 5% only because of the marginal cost of exporting D. Note that with this change in parameters, the median Herfindahl index in our model is essentially unchanged. We find that this model with the fixed cost F =gives similar implications for changes in prices as our benchmark model. The terms of trade move by more than in the benchmark. The movement in the relative consumer price of tradeables is essentially the same as in the benchmark model. This finding that consideration of fixed costs to match both the extensive and the intensive patterns of trade at the firm level is not that important for our results is useful for those looking to integrate a general equilibrium version of our model into a dynamic macroeconomic analysis of international relative prices since solving such a model with no fixed cost should be much easier that solving it with a fixed cost included Trade costs versus home bias in consumption In our model, inclusion of the marginal trade cost D allows us to match the observation that the majority of the domestic production of tradeable goods is also consumed domestically. One can match this observation in a model with no marginal trade costs if one is willing to assume home bias in the consumption of tradeable goods. We consider such a model (with the fixed cost F also equal to zero) in column 7 of table 5. We find that this model gives very similar implications as our benchmark model. 7. Firm level cost dispersion and pricing to market We have shown numerically that our benchmark model generates pricing to market at the macro level in terms of fluctuations in the ratio of export and producer prices in the aggregate. We now show that this result depends in a very subtle way on the nonlinearities of the pricing formula (3.7) linking the markups chosen by individual firms to their market shares. In particular, we first show numerically that we need dispersion in costs across firms to 24 Under the assumption that ρ =, somefirms will decide not to export even when F =. We computed this case letting the set of active exporters change as W 1 /W 2 changes. The implications on international relative prices are very similar to the case when the set of active exporters is assumed to remain constant. 31
32 generate this finding in our model. We then examine the role of dispersion by looking at the pricing decisions of individual firms as a function of market share in a version of our model with cost dispersion and no fixed costs of exporting. Consider a version of out model in which all firms have the same productivity z =1. (This corresponds to our model with θ =). Assume that there are no fixed costs of exports, and adjust the marginal export cost D to match the observed volume of trade. Results for this model are reported in column 8 of table 5. In those results we see that quantitatively, there is essentially no pricing to market the ratio of export prices to producer prices remains constant in response to the change in relative wages across countries. Note that there is incomplete pass through of costs to prices in this model. This result can be seen in the decomposition of the movements in the relative consumer price of tradeable goods this relative price moves by less than relative costs because of this incomplete pass through. Even with the marginal trade costs D>1 however, we do not find pricing to market. This result stands in stark contrast to the results for the analogous model with cost dispersion (θ > ) reported in column 6 of table 5. Themodelswithnocostdispersion(θ =)and cost dispersion (θ > ) have a similar structure in many respects. In both models, we have assumed that the fixed cost of exporting is zero so that there are 4 firms (2 from each country) competing in each sector in each country. In both models, we have set the marginal trade cost D so that in a symmetric equilibrium, the share of trade in tradeables production is 16.5%. This means that in both models, on average, firms have a substantially smaller market share when they compete in a foreign market than they do at home. The models differ only with regard to the configuration of costs, and hence market shares, across firms within a sector. In the model with no dispersion, all domestic firms in a sector havethesamemarketshare(1 s M )/2 and all foreign firms have the market share s M /2. Hence, the prices charged at home by each domestic firm are all identical and similarly for the prices charged by each firm for exports. Moreover, the response of these prices to the change in relative wages is the same across firms. As we see in column 8 of table 5, these firms each adjust their margins in response to the change in market shares, but the change in domestic and export markups are essentially the same. In contrast, in the model with cost dispersion across firms, each firm s market share depends on the exact configuration of costs across firms in the sector. In the top panel of 32
33 Figure 1, we present a scatter plot of the market shares of firms in country 1 in their home market on the horizontal axis against the market share of these same firms in the foreign market on the vertical axis. As is clear in the diagram, there is a strong positive correlation between firms market shares in these two markets. With the marginal trade costs D>1, firms have a lower market share abroad than they do at home so this scatter plot lies below the 45 degree line. In the bottom panel of Figure 1, we show the extent of pricing to market by each firm as a function of its market share. In particular, we show the market share of each of country 1 s firmsinitssectorincountry2onthehorizontalaxis. Ontheverticalaxis,weshow the change in the ratio of that firm s export to domestic sales price in response to the one percent increase in wages in country 1. Note in the figure that there are a great many firms with small market shares for whom the change in export prices relative to domestic prices is positive or zero, while for the firms with large market shares, this change in export prices relative to domestic prices is negative. Note that in the aggregate, the export price index falls rather than rises relative to the producer price index. This is because these indices compute expenditure share weighted averages of these price changes so that the large firms dominate the index. We have discovered no simple intuition for why pricing to market emerges from our benchmark model nor why dispersion is key for this result. As should be clear from Figure 1, however, is that the price responses implied by our model depend quite subtly on the nonlinearities of the model. 8. Distribution costs and consumer prices for tradeables Up to this point, we have abstracted from non-traded distribution costs and intermediate inputs to allow for a simple analysis of pricing in our model. In this simple model, we have found that the relative consumer price of tradeable goods moves roughly 3/4 as much as the CPI real exchange rate. This represents a significant advance over the implications of standard models without international trade costs. In such models, the relative price of tradeable goods does not move at all. Our simple model falls short, however, of the observation in the data that the relative price of tradeable goods is nearly as volatile as the real exchange rate. Here we add non-traded distribution costs to the model along the lines of those considered in Burstein, Neves, and Rebelo (23). 33
34 We follow Burstein, Neves and Rebelo (23) in assuming that consuming one unit of the final tradeable good requires adding distribution services in the form of non-tradeable goods. Here we model these distribution services directly as a labor input. We now write the aggregator for final consumption of tradeable Z 1 ³ c T i = y T (1 φ) ij l T φ 1 1/η ij dj η/(η 1) where lij T is the labor input required for distribution in sector j, T in country i and φ is the weight of distribution services in this production technology. Our choice of φ is based on the gap between total goods consumption at purchaser prices (from U.S. NIPA), and goods production attributed to consumption, at producer prices, as reported in the U.S. Input-Output tables. This information is summarized in Table 6. This gap is roughly 55% between 1998 and 22. It mostly reflects the presence of wholesale and retail trade, a small fraction of transportation costs, and restaurant meals which are counted as goods in the NIPA s consumption personal consumption expenditure accounts, and as services in the Input-Output tables. We choose φ =.5, which is also consistent with the shares reported by Burstein, Neves and Rebelo (23). Consideration of distribution costs do not change our model s implications for producer prices. It only changes our model s implications for the movement in the relative consumer price of tradeable goods. Results for this extended model are included in row 8 of Table Conclusion To be added. 34
35 References [1] Alvarez, Fernando and Robert E. Lucas, Jr. (24) Implications of the Eaton-Kortum Model of International Trade mimeo [2] Anderson, James and Eric van Wincoop (forthcoming) Trade Costs Journal of Economic Literature [3] Backus, David K. and Mario Crucini, (2) Oil Prices and the Terms of Trade, Journal of International Economics, 2, Vol 5., [4] Backus, David K., Patrick J. Kehoe, and Finn Kydland (1995) International Business Cycles: Theory vs. Evidence," in Thomas F. Cooley, ed., Frontiers of Business Cycle Research, Princeton University Press [5] Betts, Caroline and Timothy Kehoe (24) U.S. Real Exchange Rate Fluctuations and Relative Price Fluctuations, mimeo [6] Bergin, Paul, and Reuven Glick (24) Endogenous Tradeability and Macroeconomic Implications, mimeo [7] Bergin, Paul, and Robert Feenstra (21) Pricing-to-market, staggered prices, and real exchange rate persistence Journal of International Economics, August, pp [8] Bernard, Andrew, Jonathan Eaton, J. Bradford Jensen, and Samuel Kortum, (23) Plants and Productivity in International Trade American Economic Review, September, pp [9] Bernard, Andrew and J. Bradford Jensen, (24) Entry, Expansion, and Intensity in the U.S. Export Boom Review of International Economics [1] Betts, Caroline and Michael Devereux, (22) Exchange Rate Dynamics in a Model of Pricing to Market Journal of International Economics [11] Burstein, Ariel, Martin Eichenbaum and Sergio Rebelo, Large Devaluations and the Real Exchange Rate, forthcoming Journal of Political Economy 35
36 [12] Burstein, Ariel, Joao Neves, and Sergio Rebelo, Distribution Costs and Real Exchange Rate Dynamics During Exchange-Rate-Based Stabilizations, Journal of Monetary Economics, September 23. [13] Campa, Jose and Linda Goldberg (22) Exchange Rate Pass Through into Import Prices mimeo [14] Chari, V.V. Patrick J. Kehoe, and Ellen R. McGrattan (22) Can Sticky Price Models Generate Volatile and Persistent Real Exchange Rates? Review of Economic Studies, Vol. 69, No. 3, July 22, pp [15] Christiano, Lawrence, Martin Eichenbaum, and Charles Evans (23) Nominal Rigidities and the Dynamic Effects of a Shock to Monetary Policy mimeo [16] Corsetti, Giancarlo and Luca Dedola (23) Macroeconomics of International Price Discrimination mimeo [17] Crucini, Mario, Chris Telmer, and Marios Zachariadis (24) Understanding European Real Exchange Rates forthcoming American Economic Review [18] Dornbusch, Rudiger (1987) Exchange Rates and Prices American Economic Review 77 (March 1987) [19] Eaton, Jonathan and Samuel Kortum (22) Technology, Geography, and Trade Econometrica pp [2] Eaton, Jonathan, Samuel Kortum, and Francis Kramarz (24) An Anatomy of International Trade: Evidence from French Firms mimeo [21] Engel, Charles (1999) Accounting for U.S. Real Exchange Rate Changes Journal of Political Economy 17, June 1999, [22] Engel, Charles (22) Expenditure Switching and Exchange Rate Policy NBER Macroeconomics Annual 22, no. 17, [23] Feenstra, Robert, Joseph Gagnon, and Michael Knetter (1996) Market share and exchange rate pass-through in world automobile trade Journal of International Economics 4,
37 [24] Ghironi, Fabio and Marc Melitz (24) International Trade and Macroeconomic Dynamics with Heterogeneous Firms, mimeo [25] Goldberg, Pinelopi Koujianou and Michael Knetter (1997) Goods Prices and Exchange Rates: What Have We Learned? Journal of Economic Literature, September, vol. 35, no.3,pp [26] Helpman, E. and P.R. Krugman (1985): Market Structure and Foreign Trade, MIT Press. [27] Knetter, Michael (1989) Price Discrimination by U.S. and German Exporters American Economic Review, March 1989 [28] Knetter, Michael (1993) International Comparisons of Price-to-Market Behavior American Economic Review, June 1993 [29] Krugman, Paul (1987) Pricing to Market When the Exchange Rate Changes, in S. W. Arndt and J. Richardson, eds., Real Financial Linkages Among Open Economies (London: MIT Press) [3] Marston, Richard (199) Pricing to Market in Japanese Manufacturing Journal of International Economics, November 199 [31] Melitz, Marc, (23) The Impact of Trade on Intra-Industry Reallocations and Aggregate Industry Productivity Econometrica 71: [32] Obstfeld, Maurice and Kenneth Rogoff (2) The Six Major Puzzles in International Economics: Is there a common cause? NBER Macroeconomics Annual, 15 [33] Yang, Jiawen (1997) Exchange Rate Pass-Through in U.S. Manufacturing Industries The Review of Economics and Statistics 79:
38 Table 1 Volatility of Manufacturing Terms of Trade Relative to Manufacturing PPI-based RER Period: A: Yearly Differences (standard deviations relative to PPI / PPI* E) PPI / EPI IPI / PPI* E EPI / IPI United States, BLS (*) United States Japan Germany France Italy United Kingdom Canada B: HP Filtered Quarterly Data (standard deviations relative to PPI / PPI* E) United States, BLS (*) United States Japan Germany France Italy United Kingdom Canada PPI : Manufacturing producer price index (PPI), PPI* : Trade-weighted manufacturing PPI, E*: Trade-weighted nominal exchange rate, EPI: Manufacturing export price index, IPI: Manufacturing import price index. (*): 1985:1-24:3 Source: Source OECD and BLS
39 Table 2 Parameters and Symmetric Equilibrium Implications Benchmark Constant Frictionless Model Markup Trade Parameters K D F/c T Symmetric Equilibrium Implications US Data Source Exports / Manufacturing Gross Output 16.6% 16.4% 49.9% 16.5% US Input-Output Fraction of exporting firms in tradeable sector 25.3% 25.3% 1.% 25% Bernard - Jensen Median exporter's intensity 12.1% 24.7% 5.% < 1% BEJK Average exporter's - non-exporter's log value added per worker 12.%.% n.a. [15% - 33%] BEJK Average domestic exporter's sales / Average non exporter's sales n.a BEJK, EKK Median Herfindahl Index Average markup 27.1% 33.6% 25.3%
40 Table 3 Share of Exports and Imports in Gross Output, U.S..5 (Exports + Imports) / Gross Output Commodities Agriculture, Forestry, Fishing, Hunting 9% 9% 9% 9% 9% Mining 2% 23% 28% 24% 27% Manufacturing 18% 18% 2% 2% 2% Transportation and Warehousing 5% 7% 7% 6% 6% Wholesale Trade 5% 5% 5% 5% 5% Information 2% 2% 2% 2% 2% Finance, Insurance, Real Estate etc. 1% 1% 1% 2% 2% Professional and Business Services 2% 2% 1% 2% 2% Educational Services, Health Care, etc. % % % % % Arts, Entertainment, Recreation etc. % % % % % Other Services except Government % % % % % Government % % % % % Retail Trade % % % % % Utilities % % % 1% % Construction % % % % % Sectors Goods 17.5% 17.9% 19.6% 19.3% 19.6% Services 1.2% 1.3% 1.3% 1.3% 1.3% Goods sector: Agriculture etc., Mining, and Manufacturing Services sector: All other sectors Source: Table 15 from June 24 SCB "Improved Annual Industry Accounts for "
41 Table 4 Implications of Model: 1% increase in W1 / W Benchmark Constant Frictionless Model Markup Trade Terms of Trade and Relative Producer Price of Tradeables PPI 1 / PPI 2 decomposition (% contribution): 1 PPI 1 / EPI 1 23% % % 2 IPI 1 / PPI 2 23% % % 3 EPI 1 / IPI 2 54% 1% 1% 4 PPI T 1.86% 1.%.77% 5 EPI 1.7% 1.%.77% 6 IPI 1.31% %.23% Relative Consumer Price of Tradeable Goods 7 RER T /RER (no distribution) 71% 77% % 8 RER T /RER (with distribution) 87% 89% 63% RER T decomposition (% contribution): 9 1 2s M Ŵ 1 Ŵ 2 112% 1% n.a s M PPID T 1 Ŵ 1 PPID T 2 Ŵ 2-23% % n.a. 11 s M IPI 1 PPID T 2 EPI 1 PPID T 1 11% % n.a.
42 Table 5 Implications of Model: Sensitivity Analysis Benchmark High High High High No Fixed Home Bias Model adjust D, F adjust D, F Cost F= Parameters K D F/c T Symmetric Equilibrium Implications Exports / Manufacturing Gross Output 16.6% 24.7% 16.6% 14.3% 16.3% 16.4% 17.4% 16.6% Fraction of exporting firms in tradeable sector 25% 19% 25% 11% 25% 1% 1% 1% Median exporter's intensity 12% 17% 5% 15% 4% 4% 5% 17% Average exp. - non-exp. log value added / worker 12% 17% 15% 22% 15% n.a. n.a. n.a. Median Herfindahl Index Average markup 27% 37% 37% 28% 27% 27% 27% 14% Change in Relative Marginal Costs PPI 1 / PPI 2 decomposition (% contribution): PPI 1 / EPI 1 IPI 1 / PPI 2 EPI 1 / IPI 2 23% 27% 32% 49% 45% 21% 2% % 23% 27% 32% 5% 46% 21% 21% % 54% 46% 36% 2% 9% 58% 59% 1% RER T /RER (no distribution) 71% 58% 71% 75% 71% 7% 69% 64% RER T decomposition (% contribution): 1 2s M Ŵ 1 Ŵ 2 1 2s M PPID T 1 Ŵ 1 PPID T 2 Ŵ 2 s M IPI 1 PPID T 2 EPI 1 PPID T 1 112% 113% 112% 11% 114% 114% 114% 113% -23% -36% -26% -27% -32% -24% -25% -13% 11% 23% 15% 16% 18% 1% 11% %
43 Table 6 Share of Goods in Consumption, at Purchaser Prices and Producer Prices, U.S. Personal Consumption Expenditures, from NIPA Amounts in Billions of Dollars, AT PURCHASER PRICES Goods Services % Goods 41% 42% 42% 41% 41% Source: Bureau of Economic Analysis website, Table Personal Consumption, from IO Accounts Amounts in Billions of Dollars, at PRODUCER PRICES Goods Services % Goods 18% 18% 19% 18% 18% Source: Table 15 from 6/4 SCB "Improved Annual Industry Accounts for " 1 - Cons. of goods producer prices 56% 56% 56% 55% 57% / Cons. of goods purchaser prices
44 Figure 1: U.S., Manufacturing Terms of Trade and Manuf. PPI-based Trade-Weighted Real Exchange Rate -5 Manufacturing Terms of Trade Manufacturing PPI-based Trade-Weighted Real Exchange Rate % cumulative change
45 Figure 2: U.S. Manufacturing Import Price Pass-Through Source of Imports: Japan 4 % cumulative change Source of Imports: Europen Union % cumulative change Source of Imports: Canada % cumulative change Manufacturing PPI in source of imports, in U.S. dollars U.S. manufacturing import price index
46 Figure 3: Markups and Herfindahl Indices in Symmetric Equilibrium.8 Markups Herfindahl Indices
47 Figure 4: U.S. Histograms, EPI/ PPI and IPI/ PPI (fraction of PPI-based-RER) :3-1988:4 EPI/PPI :3-1988:4 IPI/PPI :2-21:4 EPI/PPI :2-21:4 IPI/PPI :4-24:2 EPI/PPI.2 21:4-24:2 IPI/PPI
48 Figure 5: U.S., Trade Shares, EPI/ PPI and IPI/ PPI (fraction of PPI-based-RER) EPI/ PPI EPI/ PPI 1985:3-1988:4: EPI/ PPI Export share 1995:2-21:4: EPI/ PPI Export share IPI/ PPI IPI/ PPI 1985:3-1988:4: IPI/ PPI Import share 1995:2-21:4: IPI/ PPI Import share 1 21:4-24:2: EPI/ PPI 21:4-24:2: IPI/ PPI.5.5 EPI/ PPI -.5 IPI/ PPI Export share Import share
49 Figure 6: U.S., Herfindahl Indices, EPI/ PPI and IPI/ PPI (fraction of PPI-based-RER) 1985:3-1988:4: EPI/ PPI 1985:3-1988:4: IPI/ PPI EPI/ PPI IPI/ PPI Herfindahl index 1995:2-21:4: EPI/ PPI Herfindahl index 1995:2-21:4: IPI/ PPI EPI/ PPI IPI/ PPI Herfindahl index Herfindahl index 1 21:4-24:2: EPI/ PPI 21:4-24:2: IPI/ PPI.5.5 EPI/ PPI -.5 IPI/ PPI Herfindahl index Herfindahl index
50 Figure 7: Model, Histogram of IPI1/ PPI1 and EPI1/ PPI1 (as a fraction of PPI1/ PP2).1 IPI1/ PPI1 (fraction of PPI1/ PPI2) EPI1/ PPI1 (fraction of PPI1/ PPI2)
51
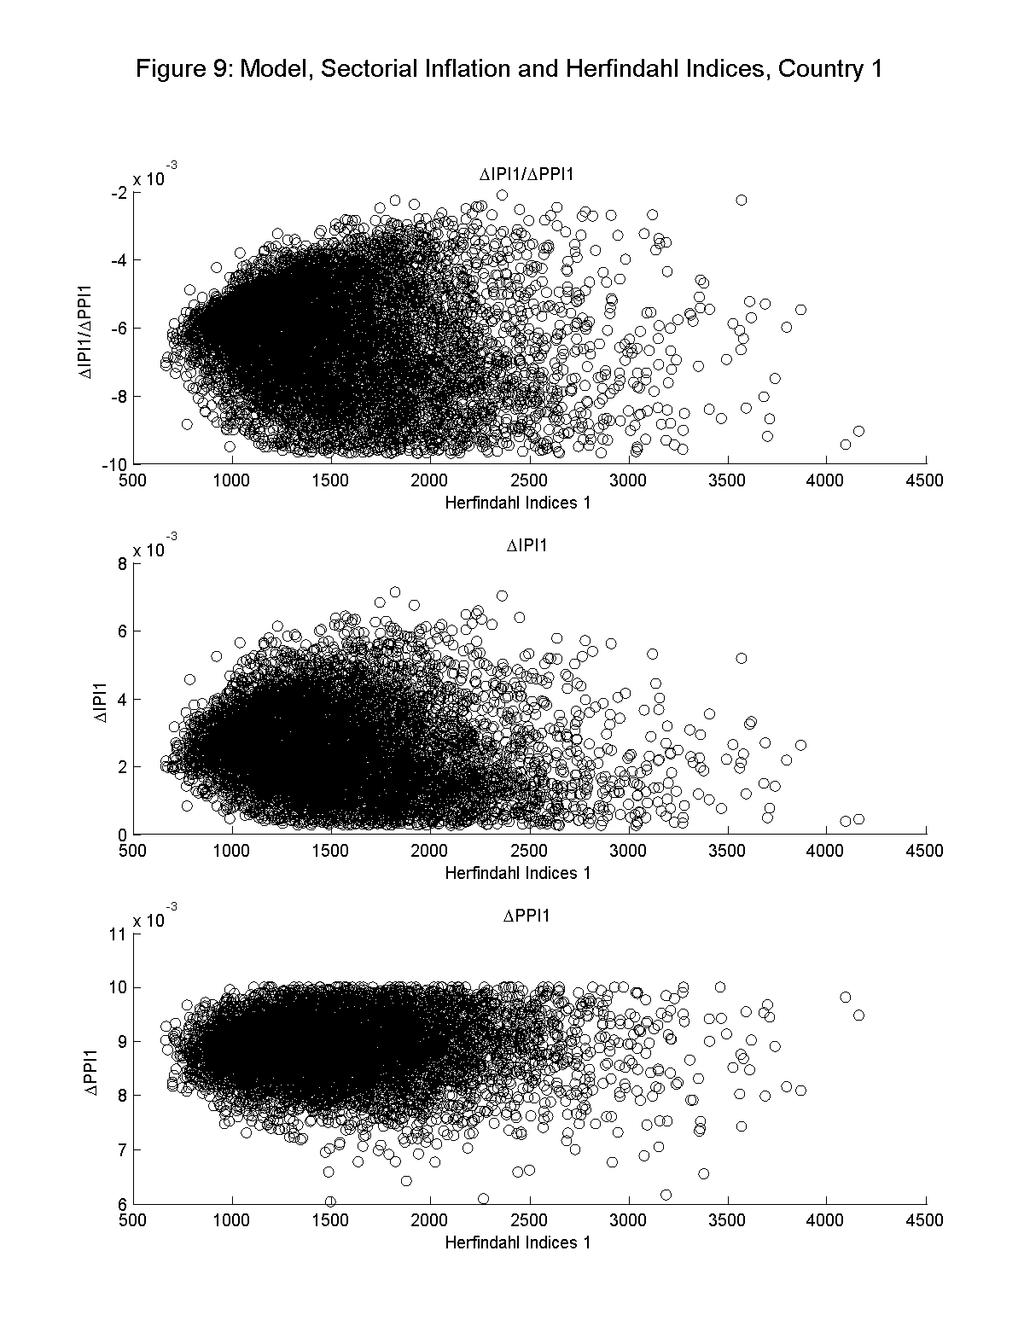
52
Trade Costs, Pricing-to-Market, and International Relative Prices
 Trade Costs, Pricing-to-Market, and International Relative Prices Andrew Atkeson and Ariel Burstein October 22, 2005 Abstract We extend some of the recently developed models of international trade to study
GT CREST-LMA. Pricing-to-Market, Trade Costs, and International Relative Prices
 : Pricing-to-Market, Trade Costs, and International Relative Prices (2008, AER) December 5 th, 2008 Empirical motivation US PPI-based RER is highly volatile Under PPP, this should induce a high volatility
Class Notes on Chaney (2008)
") Class Notes on Chaney (2008) (With Krugman and Melitz along the Way) Econ 840-T.Holmes Model of Chaney AER (2008) As a first step, let s write down the elements of the Chaney model. asymmetric countries
Class Notes on Chaney (2008) (With Krugman and Melitz along the Way) Econ 840-T.Holmes Model of Chaney AER (2008) As a first step, let s write down the elements of the Chaney model. asymmetric countries
The Margins of Global Sourcing: Theory and Evidence from U.S. Firms by Pol Antràs, Teresa C. Fort and Felix Tintelnot
 The Margins of Global Sourcing: Theory and Evidence from U.S. Firms by Pol Antràs, Teresa C. Fort and Felix Tintelnot Online Theory Appendix Not for Publication) Equilibrium in the Complements-Pareto Case
Goods Market Frictions and Real Exchange Rate Puzzles
 Goods Market Frictions and Real Exchange Rate Puzzles Qing Liu School of Economics and Management Tsinghua University Beijing, China 100084 (email: liuqing@sem.tsinghua.edu.cn) (fax: 86-10-62785562; phone:
Understanding International Prices:Customers as Capital
 Understanding International Prices: Customers as Capital Lukasz A. Drozd 1 Jaromir B. Nosal 2 1 University of Wisconsin-Madison 2 Columbia University Fundamental features of international price data Aggregate
Vertical Linkages and the Collapse of Global Trade
 Vertical Linkages and the Collapse of Global Trade Rudolfs Bems International Monetary Fund Robert C. Johnson Dartmouth College Kei-Mu Yi Federal Reserve Bank of Minneapolis Paper prepared for the 2011
Research at Intersection of Trade and IO. Interest in heterogeneous impact of trade policy (some firms win, others lose, perhaps in same industry)
") Research at Intersection of Trade and IO Countries don t export, plant s export Interest in heterogeneous impact of trade policy (some firms win, others lose, perhaps in same industry) (Whatcountriesa
Research at Intersection of Trade and IO Countries don t export, plant s export Interest in heterogeneous impact of trade policy (some firms win, others lose, perhaps in same industry) (Whatcountriesa
Endogenous Trade Participation with Incomplete Exchange Rate Pass-Through
 Endogenous Trade Participation with Incomplete Exchange Rate Pass-Through Yuko Imura Bank of Canada June 28, 23 Disclaimer The views expressed in this presentation, or in my remarks, are my own, and do
Dynamics of Firms and Trade in General Equilibrium. Discussion Fabio Ghironi
 Dynamics of Firms and Trade in General Equilibrium Robert Dekle Hyeok Jeong University of Southern California KDI School Nobuhiro Kiyotaki Princeton University, CEPR, and NBER Discussion Fabio Ghironi
Foreign Direct Investment I
 FD Foreign Direct nvestment [My notes are in beta. f you see something that doesn t look right, would greatly appreciate a heads-up.] 1 FD background Foreign direct investment FD) occurs when an enterprise
Quality, Variable Mark-Ups, and Welfare: A Quantitative General Equilibrium Analysis of Export Prices
 Quality, Variable Mark-Ups, and Welfare: A Quantitative General Equilibrium Analysis of Export Prices Haichao Fan Amber Li Sichuang Xu Stephen Yeaple Fudan, HKUST, HKUST, Penn State and NBER May 2018 Mark-Ups
Innovation, Firm Dynamics, and International Trade
 Innovation, Firm Dynamics, and International Trade Andrew Atkeson, UCLA and Minneapolis Fed Ariel Burstein, UCLA November 10, 2009 tkeson and Burstein ()Innovation, dynamics, international trade November
WORKING PAPER NO NONTRADED GOODS, MARKET SEGMENTATION, AND EXCHANGE RATES. Michael Dotsey Federal Reserve Bank of Philadelphia.
 WORKING PAPER NO. 06-9 NONTRADED GOODS, MARKET SEGMENTATION, AND EXCHANGE RATES Michael Dotsey Federal Reserve Bank of Philadelphia and Margarida Duarte Federal Reserve Bank of Richmond May 2006 Nontraded
Using a thought experiment to explore models of relative prices and trade balance:
 Lecture for Sept 16 Using a thought experiment to explore models of relative prices and trade balance: 1. suppose the United States were forced to eliminate most or all of its trade deficit 2. suppose
Heterogeneous Firm, Financial Market Integration and International Risk Sharing
 Heterogeneous Firm, Financial Market Integration and International Risk Sharing Ming-Jen Chang, Shikuan Chen and Yen-Chen Wu National DongHwa University Thursday 22 nd November 2018 Department of Economics,
Groupe de Travail: International Risk-Sharing and the Transmission of Productivity Shocks
 Groupe de Travail: International Risk-Sharing and the Transmission of Productivity Shocks Giancarlo Corsetti Luca Dedola Sylvain Leduc CREST, May 2008 The International Consumption Correlations Puzzle
PhD Topics in Macroeconomics
 PhD Topics in Macroeconomics Lecture 5: heterogeneous firms and trade, part three Chris Edmond 2nd Semester 204 This lecture Chaney (2008) on intensive and extensive margins of trade - Open economy model,
Trade Theory with Numbers: Quantifying the Welfare Consequences of Globalization
 Trade Theory with Numbers: Quantifying the Welfare Consequences of Globalization Andrés Rodríguez-Clare (UC Berkeley and NBER) September 29, 2012 The Armington Model The Armington Model CES preferences:
International Trade and Income Differences
 International Trade and Income Differences By Michael E. Waugh AER (Dec. 2010) Content 1. Motivation 2. The theoretical model 3. Estimation strategy and data 4. Results 5. Counterfactual simulations 6.
Pricing To Market, Staggered Contracts, and Real Exchange Rate Persistence
 Pricing To Market, Staggered Contracts, and Real Exchange Rate Persistence Paul R. Bergin a and Robert C. Feenstra a,b,c a Department of Economics, University of California, Davis b Haas School of Business,
Exchange Rate Pass-Through, Currency Invoicing and Trade Partners
 Exchange Rate Pass-Through, Currency Invoicing and Trade Partners Michael Devereux 1 Wei Dong 2 Ben Tomlin 2 1 University of British Columbia 2 Bank of Canada May 2013 Disclaimer: The views express in
Discussion of Charles Engel and Feng Zhu s paper
 Discussion of Charles Engel and Feng Zhu s paper Michael B Devereux 1 1. Introduction This is a creative and thought-provoking paper. In many ways, it covers familiar ground for students of open economy
Frequency of Price Adjustment and Pass-through
 Frequency of Price Adjustment and Pass-through Gita Gopinath Harvard and NBER Oleg Itskhoki Harvard CEFIR/NES March 11, 2009 1 / 39 Motivation Micro-level studies document significant heterogeneity in
Price Dispersion and International Relative Price Volatility
 August 2002 Price Dispersion and International Relative Price Volatility George Alessandria 1 Department of Economics, Ohio State University 419 Arps Hall, 1945 N. High St., Columbus, OH 43210 alessandria.1@osu.edu
The Effects of Dollarization on Macroeconomic Stability
 The Effects of Dollarization on Macroeconomic Stability Christopher J. Erceg and Andrew T. Levin Division of International Finance Board of Governors of the Federal Reserve System Washington, DC 2551 USA
Perspectives on Trade Balance Adjustment and Dynamics
 Perspectives on Trade Balance Adjustment and Dynamics Maurice Obstfeld University of California, Berkeley Lecture Notes for Econ 280C Overarching question: What is the connection between exchange rate
The Nontradable Goods Real Exchange Rate Puzzle
 The Nontradable Goods Real Exchange Rate Puzzle Lukasz A. Drozd and Jaromir B. Nosal September 15, 2009 Abstract The paper studies empirically and theoretically the decomposition of the real exchange rates
The Measurement Procedure of AB2017 in a Simplified Version of McGrattan 2017
 The Measurement Procedure of AB2017 in a Simplified Version of McGrattan 2017 Andrew Atkeson and Ariel Burstein 1 Introduction In this document we derive the main results Atkeson Burstein (Aggregate Implications
The Aggregate Implications of Innovative Investment in the Garcia-Macia, Hsieh, and Klenow Model
 The Aggregate Implications of Innovative Investment in the Garcia-Macia, Hsieh, and Klenow Model Andy Atkeson and Ariel Burstein February 2017 Abstract In this paper, we extend the model of firm dynamics
Associate reading: Krugman-Obstfeld chapter 15 p , p
 3 Lecture 3: The determinants of the real exchange rate Associate reading: Krugman-Obstfeld chapter 15 p. 369-373, p. 379-393 Intertemporal theory of the current account: what determines international
1 Non-traded goods and the real exchange rate
 University of British Columbia Department of Economics, International Finance (Econ 556) Prof. Amartya Lahiri Handout #3 1 1 on-traded goods and the real exchange rate So far we have looked at environments
HONG KONG INSTITUTE FOR MONETARY RESEARCH
 HONG KONG INSTITUTE FOR MONETARY RESEARCH EXCHANGE RATE POLICY AND ENDOGENOUS PRICE FLEXIBILITY Michael B. Devereux HKIMR Working Paper No.20/2004 October 2004 Working Paper No.1/ 2000 Hong Kong Institute
International Monetary Policy Coordination and Financial Market Integration
 An important paper that opens an important conference. In my discussion I will attempt to: cast the paper within the broader context of the current literature and debate on coordination; suggest an interpretation
Economic Development, Exchange Rates, and the Structure of Trade
 Economic Development, Exchange Rates, and the Structure of Trade Very preliminary and incomplete! István Kónya Magyar Nemzeti Bank Abstract The paper examines the effects of a changing trade and consumption
Marginal Utility and International Relative Prices
 Marginal Utility and International Relative Prices Allen C. Head, Todd D. Mattina, and Gregor W. Smith October 2000 Abstract A wide range of international macroeconomic models link the real exchange rate
1. Cash-in-Advance models a. Basic model under certainty b. Extended model in stochastic case. recommended)
") Monetary Economics: Macro Aspects, 26/2 2013 Henrik Jensen Department of Economics University of Copenhagen 1. Cash-in-Advance models a. Basic model under certainty b. Extended model in stochastic case
Monetary Economics: Macro Aspects, 26/2 2013 Henrik Jensen Department of Economics University of Copenhagen 1. Cash-in-Advance models a. Basic model under certainty b. Extended model in stochastic case
Multiproduct-Firm Oligopoly: An Aggregative Games Approach
 Multiproduct-Firm Oligopoly: An Aggregative Games Approach Volker Nocke 1 Nicolas Schutz 2 1 UCLA 2 University of Mannheim ASSA ES Meetings, Philadephia, 2018 Nocke and Schutz (UCLA &Mannheim) Multiproduct-Firm
Nontradable Goods, Market Segmentation, and Exchange Rates
 Nontradable Goods, Market Segmentation, and Exchange Rates Michael Dotsey Federal Reserve Bank of Philadelphia Margarida Duarte Federal Reserve Bank of Richmond September 2005 Preliminary and Incomplete
Real Exchange Rate Dynamics With Endogenous Distribution Costs
 Real Exchange Rate Dynamics With Endogenous Distribution Costs Millan L. B. Mulraine University of Toronto February 27 Abstract The importance of distribution costs in generating the deviation from the
Understanding International Prices: Customers as Capital
 Federal Reserve Bank of Minneapolis Research Department Staff Report 411 August 2008 Understanding International Prices: Customers as Capital Lukasz A. Drozd University of Wisconsin Madison Jaromir B.
Topic 4: Introduction to Exchange Rates Part 1: Definitions and empirical regularities
 Topic 4: Introduction to Exchange Rates Part 1: Definitions and empirical regularities - The models we studied earlier include only real variables and relative prices. We now extend these models to have
The Costs of Losing Monetary Independence: The Case of Mexico
 The Costs of Losing Monetary Independence: The Case of Mexico Thomas F. Cooley New York University Vincenzo Quadrini Duke University and CEPR May 2, 2000 Abstract This paper develops a two-country monetary
State-Dependent Fiscal Multipliers: Calvo vs. Rotemberg *
 State-Dependent Fiscal Multipliers: Calvo vs. Rotemberg * Eric Sims University of Notre Dame & NBER Jonathan Wolff Miami University May 31, 2017 Abstract This paper studies the properties of the fiscal
Real Exchange Rates Recent US experience. Charles Engel University of Wisconsin
 Real Exchange Rates Recent US experience Charles Engel University of Wisconsin US-G7 Real Exchange Rates 160 150 140 130 120 Euro C$ Yen UK 110 100 90 Jul-98 Dec-99 Apr-01 Sep-02 Jan-04 May-05 Oct-06 Feb-08
NBER WORKING PAPER SERIES INTERNATIONAL PRICES AND EXCHANGE RATES. Ariel Burstein Gita Gopinath. Working Paper
 NBER WORKING PAPER SERIES INTERNATIONAL PRICES AND EXCHANGE RATES Ariel Burstein Gita Gopinath Working Paper 18829 http://www.nber.org/papers/w18829 NATIONAL BUREAU OF ECONOMIC RESEARCH 1050 Massachusetts
Monetary Economics Final Exam
 316-466 Monetary Economics Final Exam 1. Flexible-price monetary economics (90 marks). Consider a stochastic flexibleprice money in the utility function model. Time is discrete and denoted t =0, 1,...
WORKING PAPER NO VERTICAL PRODUCTION AND TRADE INTERDEPENDENCE AND WELFARE. Kevin X.D. Huang Federal Reserve Bank of Philadelphia.
 WORKING PAPER NO. 5-15 VERTICAL PRODUCTION AND TRADE INTERDEPENDENCE AND WELFARE Kevin X.D. Huang Federal Reserve Bank of Philadelphia and Zheng Liu Emory University July 25 Working Paper No. 5-15 Vertical
Appendix: Net Exports, Consumption Volatility and International Business Cycle Models.
 Appendix: Net Exports, Consumption Volatility and International Business Cycle Models. Andrea Raffo Federal Reserve Bank of Kansas City February 2007 Abstract This Appendix studies the implications of
What Are Equilibrium Real Exchange Rates?
 1 What Are Equilibrium Real Exchange Rates? This chapter does not provide a definitive or comprehensive definition of FEERs. Many discussions of the concept already exist (e.g., Williamson 1983, 1985,
Economics 689 Texas A&M University
 Horizontal FDI Economics 689 Texas A&M University Horizontal FDI Foreign direct investments are investments in which a firm acquires a controlling interest in a foreign firm. called portfolio investments
SDP Macroeconomics Final exam, 2014 Professor Ricardo Reis
 SDP Macroeconomics Final exam, 2014 Professor Ricardo Reis Answer each question in three or four sentences and perhaps one equation or graph. Remember that the explanation determines the grade. 1. Question
Topic 6: Optimal Monetary Policy and International Policy Coordination
 Topic 6: Optimal Monetary Policy and International Policy Coordination - Now that we understand how to construct a utility-based intertemporal open macro model, we can use it to study the welfare implications
The Aggregate Implications of Innovative Investment in the Garcia-Macia, Hsieh, and Klenow Model
 The Aggregate Implications of Innovative Investment in the Garcia-Macia, Hsieh, and Klenow Model Andy Atkeson and Ariel Burstein February 2017 Abstract In this paper, we extend the model firm dynamics
Wealth E ects and Countercyclical Net Exports
 Wealth E ects and Countercyclical Net Exports Alexandre Dmitriev University of New South Wales Ivan Roberts Reserve Bank of Australia and University of New South Wales February 2, 2011 Abstract Two-country,
Essays on Exchange Rate Regime Choice. for Emerging Market Countries
 Essays on Exchange Rate Regime Choice for Emerging Market Countries Masato Takahashi Master of Philosophy University of York Department of Economics and Related Studies July 2011 Abstract This thesis includes
University of Toronto Department of Economics. How Important is the Currency Denomination of Exports in Open-Economy Models?
 University of Toronto Department of Economics Working Paper 383 How Important is the Currency Denomination of Exports in Open-Economy Models? By Michael Dotsey and Margarida Duarte November 20, 2009 How
Debt Constraints and the Labor Wedge
 Debt Constraints and the Labor Wedge By Patrick Kehoe, Virgiliu Midrigan, and Elena Pastorino This paper is motivated by the strong correlation between changes in household debt and employment across regions
Aggregate real exchange rate persistence through the lens of sectoral data
 Aggregate real exchange rate persistence through the lens of sectoral data Laura Mayoral and Lola Gadea Nashville, September 24 2010 Microeconomic Sources of Real Exchange Rate Behavior Motivation and
Habit Formation in State-Dependent Pricing Models: Implications for the Dynamics of Output and Prices
 Habit Formation in State-Dependent Pricing Models: Implications for the Dynamics of Output and Prices Phuong V. Ngo,a a Department of Economics, Cleveland State University, 22 Euclid Avenue, Cleveland,
Capital Goods Trade and Economic Development
 Capital Goods Trade and Economic Development Piyusha Mutreja B. Ravikumar Michael Sposi Syracuse U. FRB St. Louis FRB Dallas December 2014 NYU-FRBATL Conference Disclaimer: The following views are those
Sentiments and Aggregate Fluctuations
 Sentiments and Aggregate Fluctuations Jess Benhabib Pengfei Wang Yi Wen June 15, 2012 Jess Benhabib Pengfei Wang Yi Wen () Sentiments and Aggregate Fluctuations June 15, 2012 1 / 59 Introduction We construct
GAINS FROM TRADE IN NEW TRADE MODELS
 GAINS FROM TRADE IN NEW TRADE MODELS Bielefeld University phemelo.tamasiga@uni-bielefeld.de 01-July-2013 Agenda 1 Motivation 2 3 4 5 6 Motivation Samuelson (1939);there are gains from trade, consequently
Fiscal Policy and Regional Inflation in a Currency Union
 Fiscal Policy and Regional Inflation in a Currency Union Margarida Duarte Alexander L. Wolman February 25 Abstract This paper investigates the ability of a region participating in a currency union to affect
International Trade, Technology, and the Skill Premium
 International Trade, Technology, and the Skill Premium Ariel Burstein UCLA and NBER Jonathan Vogel Columbia University and NBER February 2016 Abstract What are the consequences of international trade on
International Trade: Lecture 3
 International Trade: Lecture 3 Alexander Tarasov Higher School of Economics Fall 2016 Alexander Tarasov (Higher School of Economics) International Trade (Lecture 3) Fall 2016 1 / 36 The Krugman model (Krugman
NOT FOR PUBLICATION. Theory Appendix for The China Syndrome. Small Open Economy Model
 NOT FOR PUBLICATION Theory Appendix for The China Syndrome Small Open Economy Model In this appendix, we develop a general equilibrium model of how increased import competition from China affects employment
The Extensive Margin of Trade and Monetary Policy
 The Extensive Margin of Trade and Monetary Policy Yuko Imura Bank of Canada Malik Shukayev University of Alberta June 2, 216 The views expressed in this presentation are our own, and do not represent those
Research Summary and Statement of Research Agenda
 Research Summary and Statement of Research Agenda My research has focused on studying various issues in optimal fiscal and monetary policy using the Ramsey framework, building on the traditions of Lucas
International Trade Gravity Model
 International Trade Gravity Model Yiqing Xie School of Economics Fudan University Dec. 20, 2013 Yiqing Xie (Fudan University) Int l Trade - Gravity (Chaney and HMR) Dec. 20, 2013 1 / 23 Outline Chaney
Trade Flows, Prices, and the Exchange Rate Regime
 Trade Flows, Prices, and the Exchange Rate Regime Philippe Bacchetta and Eric van Wincoop Introduction It is commonly held that trade flows are enhanced if a country switches from a floating to a fixed
In this chapter, we study a theory of how exchange rates are determined "in the long run." The theory we will develop has two parts:
 1. INTRODUCTION 1 Introduction In the last chapter, uncovered interest parity (UIP) provided us with a theory of how the spot exchange rate is determined, given knowledge of three variables: the expected
International Development and Firm Distribution
 International Development and Firm Distribution Ping Wang Department of Economics Washington University in St. Louis February 2016 1 A. Introduction Conventional macroeconomic models employ aggregate production
Entry, Trade Costs and International Business Cycles
 Entry, Trade Costs and International Business Cycles Roberto Fattal and Jose Lopez UCLA SED Meetings July 10th 2010 Entry, Trade Costs and International Business Cycles SED Meetings July 10th 2010 1 /
Technology, Geography and Trade J. Eaton and S. Kortum. Topics in international Trade
 Technology, Geography and Trade J. Eaton and S. Kortum Topics in international Trade 1 Overview 1. Motivation 2. Framework of the model 3. Technology, Prices and Trade Flows 4. Trade Flows and Price Differences
The Welfare Cost of Inflation. in the Presence of Inside Money
 1 The Welfare Cost of Inflation in the Presence of Inside Money Scott Freeman, Espen R. Henriksen, and Finn E. Kydland In this paper, we ask what role an endogenous money multiplier plays in the estimated
0. Finish the Auberbach/Obsfeld model (last lecture s slides, 13 March, pp. 13 )
") Monetary Policy, 16/3 2017 Henrik Jensen Department of Economics University of Copenhagen 0. Finish the Auberbach/Obsfeld model (last lecture s slides, 13 March, pp. 13 ) 1. Money in the short run: Incomplete
Monetary Policy, 16/3 2017 Henrik Jensen Department of Economics University of Copenhagen 0. Finish the Auberbach/Obsfeld model (last lecture s slides, 13 March, pp. 13 ) 1. Money in the short run: Incomplete
Consumption and Real Exchange Rates With Goods and Asset Markets Frictions 1
 Consumption and Real Exchange Rates With Goods and Asset Markets Frictions 1 Giancarlo Corsetti University of Rome III, Yale University and CEPR Luca Dedola Bank of Italy and University of Pennsylvania
Sentiments and Aggregate Fluctuations
 Sentiments and Aggregate Fluctuations Jess Benhabib Pengfei Wang Yi Wen March 15, 2013 Jess Benhabib Pengfei Wang Yi Wen () Sentiments and Aggregate Fluctuations March 15, 2013 1 / 60 Introduction The
Updated 10/30/13 Topic 4: Sticky Price Models of Money and Exchange Rate
 Updated 10/30/13 Topic 4: Sticky Price Models of Money and Exchange Rate Part 1: Obstfeld and Rogoff (1995 JPE) - We want to explain how monetary shocks affect real variables. The model here will do so
Pulling up the Tarnished Anchor: The End of Silver as a Global Unit of Account
 Pulling up the Tarnished Anchor: The End of Silver as a Global Unit of Account Workshop on Monetary and Financial History, Federal Reserve Bank of Atlanta/Emory University Ricardo Fernholz 1 Kris James
Quantitative Significance of Collateral Constraints as an Amplification Mechanism
 RIETI Discussion Paper Series 09-E-05 Quantitative Significance of Collateral Constraints as an Amplification Mechanism INABA Masaru The Canon Institute for Global Studies KOBAYASHI Keiichiro RIETI The
Econ 8401-T.Holmes. Lecture on Foreign Direct Investment. FDI is massive. As noted in Ramondo and Rodriquez-Clare, worldwide sales of multinationals
 Econ 8401-T.Holmes Lecture on Foreign Direct Investment FDI is massive. As noted in Ramondo and Rodriquez-Clare, worldwide sales of multinationals is on the order of twice that of total world exports.
Economic stability through narrow measures of inflation
 Economic stability through narrow measures of inflation Andrew Keinsley Weber State University Version 5.02 May 1, 2017 Abstract Under the assumption that different measures of inflation draw on the same
Oil Shocks and the Zero Bound on Nominal Interest Rates
 Oil Shocks and the Zero Bound on Nominal Interest Rates Martin Bodenstein, Luca Guerrieri, Christopher Gust Federal Reserve Board "Advances in International Macroeconomics - Lessons from the Crisis," Brussels,
Topic 4: Introduction to Exchange Rates Part 1: Definitions and empirical regularities
 Topic 4: Introduction to Exchange Rates Part 1: Definitions and empirical regularities - The models we studied earlier include only real variables and relative prices. We now extend these models to have
International Capital Flows, Returns and World Financial Integration
 International Capital Flows, Returns and World Financial Integration July 13, 2011 Martin D. D. Evans 1 Viktoria Hnatkovska Georgetown University and NBER University of British Columbia Department of Economics
Understanding International Prices: Customers as Capital
 Understanding International Prices: Customers as Capital Lukasz A. Drozd and Jaromir B. Nosal * Abstract This paper develops a new theory of pricing-to-market driven by sluggish marketshares. Our key innovation
International Finance: Reading List Economics 642: Winter 2004 Linda Tesar
 International Finance: Reading List Economics 642: Winter 2004 Linda Tesar This is a doctoral level course in international finance and macroeconomics. Topics covered in the course include the intertemporal
International Trade and Macroeconomic Dynamics with Heterogeneous Firms
 International Trade and Macroeconomic Dynamics with Heterogeneous Firms The Harvard community has made this article openly available. Please share how this access benefits you. Your story matters Citation
Sluggish responses of prices and inflation to monetary shocks in an inventory model of money demand
 Federal Reserve Bank of Minneapolis Research Department Staff Report 417 November 2008 Sluggish responses of prices and inflation to monetary shocks in an inventory model of money demand Fernando Alvarez
Real Exchange Rate Dynamics With Endogenous Distribution Services (Preliminary and Incomplete)
") Real Exchange Rate Dynamics With Endogenous Distribution Services (Preliminary and Incomplete) Millan L. B. Mulraine First Version: December 25 Current Version: December 25 Abstract This paper demonstrates
Real Exchange Rate Dynamics With Endogenous Distribution Services (Preliminary and Incomplete) Millan L. B. Mulraine First Version: December 25 Current Version: December 25 Abstract This paper demonstrates
Understanding International Prices: Customers as Capital
 Understanding International Prices: Customers as Capital Lukasz A. Drozd University of Wisconsin Madison Jaromir B. Nosal Columbia University and Federal Reserve Bank of Minneapolis September 14, 2008
International Shocks and Domestic Prices: How Large Are Strategic Complementarities?
 International Shocks and Domestic Prices: How Large Are Strategic Complementarities? Mary Amiti Mary.Amiti@NY.FRB.ORG Oleg Itskhoki Itskhoki@Princeton.EDU September 22, 2015 Jozef Konings Joep.Konings@KULeuven.BE
Macroeconomic impacts of limiting the tax deductibility of interest expenses of inbound companies
 Macroeconomic impacts of limiting the tax deductibility of interest expenses of inbound companies Prepared on behalf of the Organization for International Investment June 2015 (Page intentionally left
The Liquidity-Augmented Model of Macroeconomic Aggregates FREQUENTLY ASKED QUESTIONS
 The Liquidity-Augmented Model of Macroeconomic Aggregates Athanasios Geromichalos and Lucas Herrenbrueck, 2017 working paper FREQUENTLY ASKED QUESTIONS Up to date as of: March 2018 We use this space to
Bias in Reduced-Form Estimates of Pass-through
 Bias in Reduced-Form Estimates of Pass-through Alexander MacKay University of Chicago Marc Remer Department of Justice Nathan H. Miller Georgetown University Gloria Sheu Department of Justice February
DURABLES IN OPEN ECONOMY MACROECONOMICS
 DURABLES IN OPEN ECONOMY MACROECONOMICS by Phacharaphot Nuntramas A dissertation submitted in partial fulfillment of the requirements for the degree of Doctor of Philosophy (Economics) in The University
Keynesian Views On The Fiscal Multiplier
 Faculty of Social Sciences Jeppe Druedahl (Ph.d. Student) Department of Economics 16th of December 2013 Slide 1/29 Outline 1 2 3 4 5 16th of December 2013 Slide 2/29 The For Today 1 Some 2 A Benchmark
Not All Oil Price Shocks Are Alike: A Neoclassical Perspective
 Not All Oil Price Shocks Are Alike: A Neoclassical Perspective Vipin Arora Pedro Gomis-Porqueras Junsang Lee U.S. EIA Deakin Univ. SKKU December 16, 2013 GRIPS Junsang Lee (SKKU) Oil Price Dynamics in