Business Statstcs 1 MTU 07203
|
|
|
- Martin Holland
- 5 years ago
- Views:
Transcription
1 THE INSTITUTE OF FINANCE MANAGEMENT (IFM) Department of Mathematics Business Statstcs 1 MTU INDEX NUMBERS
2 Topic content 1) Define index numbers 2) Explain the uses of index numbers 3) Explain the problems in index number construction 4) Compute the unweighted index numbers 5) Define Laspeyres index, Paasche index and Fisher s ideal index 6) Compute the Weighted Index numbers (Laspeyres, Paasche index and Fisher s Ideal index)
3 Index Number Defniton An index number is, in part, a rato of a measure taken during one tme frame to that same measure taken during another tme frame. Or An Index number is a number that expresses the relatve change in price, quantty, or value compared to a base period.
4 Example of Index Number Examples of specific indexes are a. Employment cost index b. Price index for construction c. Index of manufacturing capacity d. Producer price index e. Consumer price index f. Dow Jones industrial average g. Index of output etc.
5 Characteristics of Index numbers The Index Number a. Usually expressed in terms of a base of 100 b. Has a base period c. Is a ratio often multiplied by 100 d. Expressed as a percentage that serve as an alternative to compare raw numbers.
6 Uses of Index Number Index numbers are descriptve measures that are used to Compare phenomena from one tme period to another (comparison between two diferent periods). Relate informaton about stock markets, infaton, sales, exports and imports, agriculture etc.
7 Problems in Index Number Constructon i. Collection of data The availability and comparability of data to get the correct data is very difficult as we know that the primary data which are always the appropriate ones is costly and time consuming ii. Selection of Base time Period In the calculation of index number we have two important periods; a. The base period where the reference is to be made b. The current period period whose data compared to those of base year
8 iii. The choice of the suitable formula There are several methods in which the index number can be derived. Different method gives different index numbers. The choice among the different formulae should depend on the particular use to be made on it iv. Selection of component commodity For the single item or commodity it is easier to get a price index, but if the index is of general purpose i.e. to compare the cost of link, here the selection of item to be included should be properly made considering the place, habit and time.
9 The equation for computing a simple index number is as follows where; X 0 is the quantity, price, or cost in the base year X t is the quantity, price, or cost in the year of interest I t is the index number for the year of interest
10 Price Relative (PR) Price Relative is the ratio of the price of the single commodity in a given period called current period to its price in another period called base period. where, P t is the price for current period P o is the price for base period
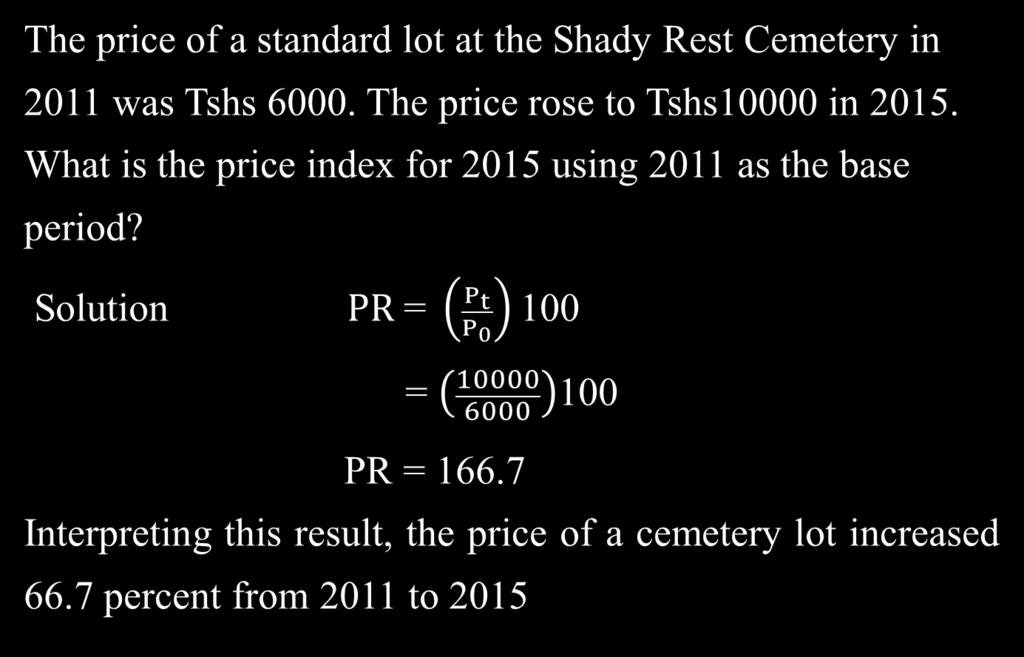
11 Example
12 Example 2 The following table shows the average price of one liter of petrol in Dar es Salaam from 2005 to 2010 Year Tshs Using the as the base year, find the price relatives of one liter of petrol compounding to all the given years
13 Solution The arithmetic mean of the price for the year , Year Tshs Price relative

14 Simple Average of Relatve Price Index
15 Example 3: The price for five commodities for two years, 2000 and 2010 and their consumed quantities by a certain family is given by the following table below Item Price Po (Tshs) Eggs(dozen) Milk (liter) mangoes (500g) Orange juice (355ml) Tea bags (500g) Price Pt (Tshs) Calculate the simple average of relative price index use 2000 as a base period
16 Solution: Item Simple Index Price Po (Tshs) Price Pt (Tshs) Eggs(dozen) Milk (liter) mangoes (500g) Orange juice (355ml) Tea bags (500g) Total P t P
17

18 Simple Aggregate Index (SAI)
19 Characteristcs of Simple Aggregate Index Simple Aggregate Index i. Is the sum the prices (rather than the indexes) for the two periods ii. Determine the index based on the totals. iii. Is constructed by collecting a number of similar items.
20 Example 4 The average price in Tshs ( 000 ) for stone, cement, sand and building block for the two years 2005 and 2010 are given in table below Item ton Stone ton cement ton building block ton sand Calculate the simple aggregate price index for the year 2010 using 2005 as a base.

21 Soluton Item P 0 (2005) P n (2010) 1 ton Stone ton cement ton building block ton sand 67 35
22 Disadvantage of the Simple Aggregate Index The method do not put in considerations the unity used to give the weight of the difference commodities It assumes equal qualities have been used on each commodity
23 Exercises 1. Statistics Canada results show that the number of farms in Canada dropped from in 1996, to an estimated in What is the index for the number of farms in 2001 based on the number in 1996? 2. Suppose the whole sales price of maize, wheat flour and rice per bag varies as here below Commodity Price in Tshs per bag Maize Wheat flour Rice Calculate the simple average of relative price index use 2000 as base year.
24 3. The average price in Tshs for rice, maize and sugar for the two years 2000 and 2011 are given in table Item kg rice kg maize kg sugar Calculate the simple aggregate price index for the year 2011 using 2000 as a base.
25 Weighted Index Number There two main types of weighted aggregate indexes we will discuss in this course i. Laspeyre s ii. Paasche s The two methods of computing a weighted price index they differ only in the period used for weighting.
26 Laspeyre s index The Laspeyres method uses base-period weights that is, the original prices and quanttes of the items bought to fnd the percent change over a period of tme in either price or quantty consumed depending on the problem.


27 Laspeyre s Price Index Laspeyre s Quantty Index
28 Example 5 The price for six commodities for two years, 2000 and 2010 and their consumed quantities by a certain family is given by the following table below. Use 2000 as a base year to calculate Laspeyre s Price Index and Laspeyre s Quantity Index Item Price Po (Tshs) Quantity (q o ) Price Pt (Tshs) Brown bread (loaf) Eggs(dozen) Milk (liter) mangoes (500g) Orange juice (355ml) Tea bags (500g) Quantity (q n )
29 Soluton Item p o q o p t q o p o q t Price P o (Tshs) Quantity (q o ) price P t (Tshs) Quantity (q t ) Brown bread (loaf) Eggs(dozen) Milk (liter) mangoes (500g) Orange juice (355ml) Tea bags (500g) Total po q o pt q o P q t
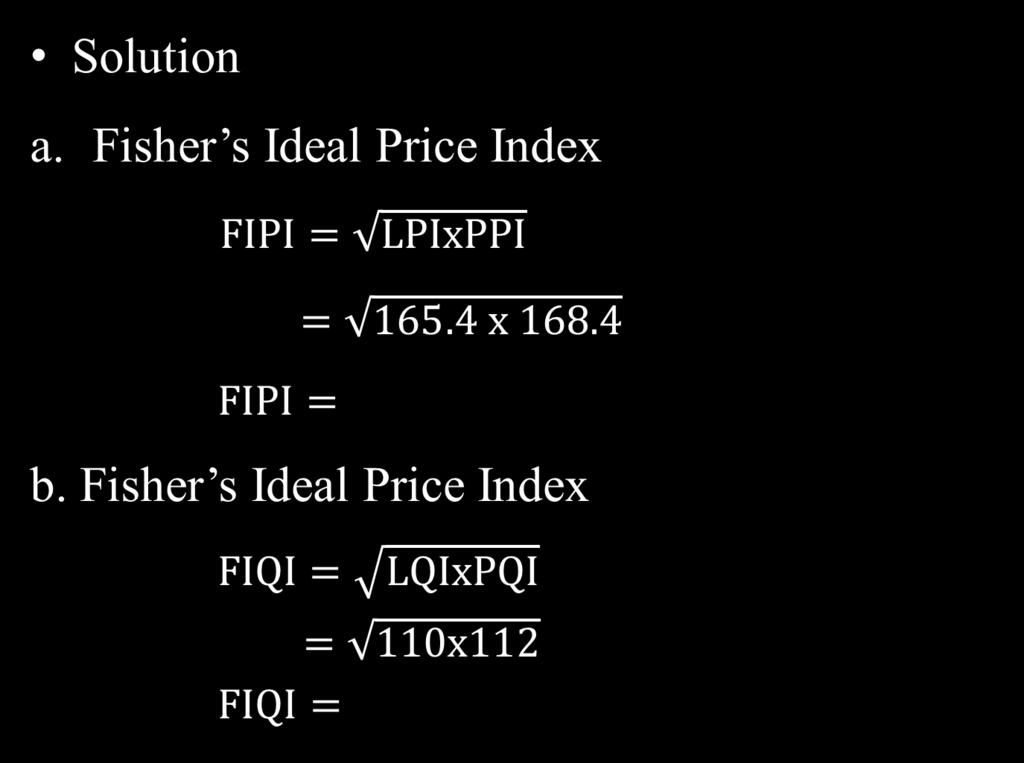
30 Laspeyre s Price Index LPI LPI P q t P o q o o LPI Based on this analysis we conclude that the price of this group of items has increased 65.4 percent in the ten year period.
31 Laspeyre s Quantity Index LQI q q t o p p o LQI LQI 110 Based on this analysis we conclude that the quantity of this group of items has increased 10 percent in the ten year period

32 Paasche s Index The Paasche s method uses current - year weights for the denominator of the weighted index. Paasche s Price Index This is the type of weighted aggregate index number considering the quantity of the current year s period as weights. It is defined as;

33 Paasche s Quantty Index
34 Example 6: Use example 5 Item Price p o Quantity Price p t (Tshs) (q o ) (Tshs) Quantity q n p o q t P t q t q o p t Brown bread (loaf) Eggs(dozen) Milk (liter) Mangoes (500g) Orange juice (355ml) Tea bags (500g) p o q t p q t t q o P t 55590
35 Paasche s Price Index PPI PPI P q P 100 Paasche s Quantty Index t o q t t PPI PQI PQI q q t o p p PQI 112 t t
36 The Paasche index is more reflective of the current situation. It should be noted that the Laspeyres index is more widely used. The Consumer Price Index, the most widely reported index, is an example of a Laspeyres index.
37 Advantage and disadvantages of Laspeyres and Paasche s Laspeyres Advantages Disadvantages Requires quantity data from only the base period. This allows a more meaningful comparison over time. The changes in the index can be attributed to changes in the price. Does not reflect changes in buying patterns over time. Also, it may overweight goods whose prices increase. Paasche s Advantages Disadvantages Because it uses quantities from the current period, it reflects current buying habits. Disadvantages It requires quantity data for each year, which may be difficult to obtain. Because different quantities are used each year, it is impossible to attribute changes in the index to changes in price alone. It tends to overweight the goods whose prices
38 Advantage of Weighted over the Simple Aggregate In weighted index the weight of each of the items is considered.
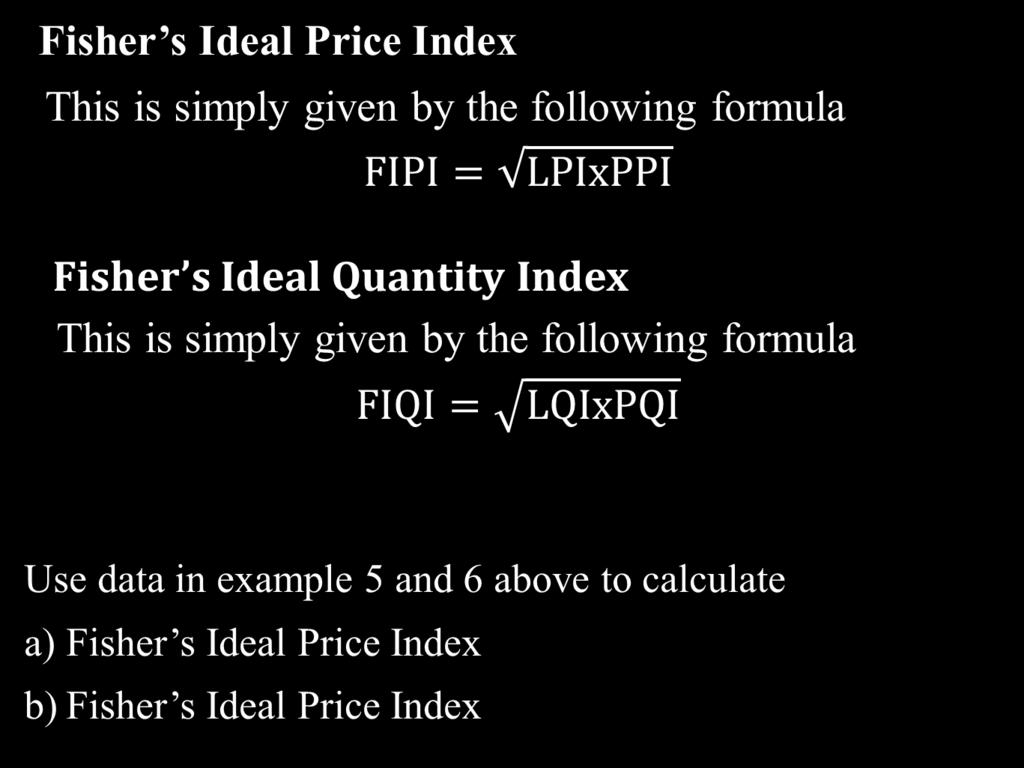
39 Fisher s index It is the geometric mean of the Laspeyres and Paasche indexes. It is determined by taking the kth root of the product of k positive numbers Fisher s index combines the best features of both Laspeyres and Paasche. That is, it balances the effects of the two indexes.
40
41
Index Numbers. Chapter 15
 Index Numbers Chapter 15 McGraw-Hill/Irwin The McGraw-Hill Companies, Inc. 2008 GOALS Describe the term index. Understand the difference between a weighted and an unweighted index. Construct and interpret
1. Describe the term index. 3. Construct and interpret a Laspeyres price index. 4. Construct and interpret a Paasche price index.
 Index Numbers Chapter 15 GOALS 1. Describe the term index. 2. Understand the difference between a weighted and an unweighted index. 3. Construct and interpret a Laspeyres price index. 4. Construct and
Index Numbers. Chapter 15
 Index Numbers Chapter 15 Learning Objectives Compute and interpret a simple index. Descried the difference between a weighted and an unweighted index. Compute and interrupt a Laspeyres price index. Compute
Price and Volume Measures
 Price and Volume Measures 1 Third Intermediate-Level e-learning Course on 2008 System of National Accounts May - July 2014 Outline 2 Underlying Concept Deflators Price indices Estimation and SNA Guidelines
2. Proportion When two ratios are equal, the four quantities are said to form a proportion.
 SESSION 2: RATIO, PROPORTION, RATES AND PERCENTAGES KEY CONCEPTS: Ratio Proportion Rates Percentages X-PLANATION 1. Ratio: A ratio is a comparison of two numbers (called terms of the ratio). Ratios have
Econ 311 Intermediate Macroeconomics Professor Eschker. Fall 2014
 Econ 311 Intermediate Macroeconomics Professor Eschker Fall 2014 Today s Topics Finish math refresher GDP Deflator Chain Weighting News CBO Projection: Budget Deficits in Future Years to be Smaller than
Price and Volume Measures Rebasing & Linking
 Regional Course on 2008 SNA (Special Topics): Improving Exhaustiveness of GDP coverage 31 August 4 September 2015 Daejeon, Republic of Korea Price and Volume Measures Rebasing & Linking Alick Nyasulu Statistical
A Note on Reconciling Gross Output TFP Growth with Value Added TFP Growth
 1 A Note on Reconciling Gross Output TFP Growth with Value Added TFP Growth Erwin Diewert 1 Discussion Paper 14-12, School of Economics, University of British Columbia, Vancouver, B.C., Canada, V6N 1Z1.
EXAMINATIONS OF THE HONG KONG STATISTICAL SOCIETY
 EXAMINATIONS OF THE HONG KONG STATISTICAL SOCIETY HIGHER CERTIFICATE IN STATISTICS, 2014 MODULE 7 : Time series and index numbers Time allowed: One and a half hours Candidates should answer THREE questions.
Country Presentation Statistics Mauritius. Item 17: Calculation of Export and Import Price Indices
 ESA/STAT/AC.142.23 UNITED NATIONS DEPARTMENT OF ECONOMIC AND SOCIAL AFFAIRS STATISTICS DIVISION UNITED NATIONS ECONOMIC COMMISSION FOR AFRICA International Workshop on Country Practices in Compilation
Foundations of Economics for International Business Selected Solutions to Assignment 1
 Foundations of Economics for International Business Selected Solutions to Assignment 1 INSTRUCTOR: XIN TANG Department of World Economics Economics and Management School Wuhan University Fall 2015 1 MULTIPLE
EXAMINATIONS OF THE ROYAL STATISTICAL SOCIETY
 EXAMINATIONS OF THE ROYAL STATISTICAL SOCIETY HIGHER CERTIFICATE IN STATISTICS, 2010 MODULE 7 : Time series and index numbers Time allowed: One and a half hours Candidates should answer THREE questions.
CHAPTER 7. Price level and Inflation. Measuring the Price Level. What is price level? Def. Price level is the cost of a given market basket
 CHAPTER 7 Price level and Inflation What is price level? Def. Price level is the cost of a given market basket Sasan Fayazmanesh What is price index? Def. Price index is the ratio of the cost of a given
2016 EXAMINATIONS ACCOUNTING TECHNICIAN PROGRAMME PAPER TC 3: BUSINESS MATHEMATICS & STATISTICS
 EXAMINATION NO. 16 EXAMINATIONS ACCOUNTING TECHNICIAN PROGRAMME PAPER TC : BUSINESS MATHEMATICS & STATISTICS WEDNESDAY 0 NOVEMBER 16 TIME ALLOWED : HOURS 9.00 AM - 12.00 NOON INSTRUCTIONS 1. You are allowed
CHAPTERS 1-5 (Blanchard)
") CHAPTERS 1-5 (Blanchard) National Accounts Question 1: In Economics, GDP per capita is often used as a measure of the welfare of an economy. Discuss its advantages and disadvantages. Question 2: a) Discuss
CHAPTERS 1-5 (Blanchard) National Accounts Question 1: In Economics, GDP per capita is often used as a measure of the welfare of an economy. Discuss its advantages and disadvantages. Question 2: a) Discuss
Quantitative Aptitude 10. PROFIT AND LOSS
 10. PROFIT AND LOSS Cost Price: The price at which an article is purchased, is called the cost price or CP. Selling Price: The price at which an article is sold is called the selling price or SP. Formulae:
2. Index Number. ECON304 (Economic Statistics) Pairach Piboonrugnroj, PhD (CMU) Faculty of Economics, Chiang Mai University me (at) pairach (dot) com
 Pairach Piboonrugnroj, PhD (CMU) Faculty of Economics, Chiang Mai University me (at) pairach (dot) com") 2. Index Number ECON304 (Economic Statistics) Pairach Piboonrugnroj, PhD Faculty of Economics, Chiang Mai University me (at) pairach (dot) com Semester 1 2016 This course is a part of Bachelor of Economics
2. Index Number ECON304 (Economic Statistics) Pairach Piboonrugnroj, PhD Faculty of Economics, Chiang Mai University me (at) pairach (dot) com Semester 1 2016 This course is a part of Bachelor of Economics
BUSINESS MATHEMATICS & QUANTITATIVE METHODS
 BUSINESS MATHEMATICS & QUANTITATIVE METHODS FORMATION 1 EXAMINATION - AUGUST 2009 NOTES: You are required to answer 5 questions. (If you provide answers to all questions, you must draw a clearly distinguishable
Understanding Unit Rates
 LESSON Understanding Unit Rates UNDERSTAND A rate is a ratio that compares two quantities with different units of measure. A unit rate is a rate in which the second measurement or amount is unit. Three
Inflation. Lecture 8. Robb T. Koether. Hampden-Sydney College. Fri, Sep 9, 2016
 Inflation Lecture 8 Robb T. Koether Hampden-Sydney College Fri, Sep 9, 2016 Robb T. Koether (Hampden-Sydney College) Inflation Fri, Sep 9, 2016 1 / 17 1 Inflation 2 Increase in Prices 3 Decrease in Purchasing
Answer Key to Problem Set 1. Fall Total: 15 points 1.(2.5 points) Identify the variables below as a flow or stock variable :
 Identify the variables below as a flow or stock variable :") Answer Key to Problem Set 1 Fall 2011 Total: 15 points 1.(2.5 points) Identify the variables below as a flow or stock variable : (a) stock (b) stock (c) flow (d) flow (e) stock 2.(4 points) a. i. Nominal
Answer Key to Problem Set 1 Fall 2011 Total: 15 points 1.(2.5 points) Identify the variables below as a flow or stock variable : (a) stock (b) stock (c) flow (d) flow (e) stock 2.(4 points) a. i. Nominal
Chapter 9. Updating CPI Weights and Linking New to Previous CPI Series
 Chapter 9. Updating CPI Weights and Linking New to Previous CPI Series 1. In Chapter 3, recommendations are made to update the weights used in the CPI compilation on a periodic basis. The preferred interval
Macroeconomics, 3e (Williamson) Chapter 2 Measurement
 Chapter 2 Measurement") Macroeconomics, 3e (Williamson) Chapter 2 Measurement 1) The principal printed source for reporting the US National Income and Product Accounts is called the A) Monthly Labor Review B) Survey of Current
Macroeconomics, 3e (Williamson) Chapter 2 Measurement 1) The principal printed source for reporting the US National Income and Product Accounts is called the A) Monthly Labor Review B) Survey of Current
Inflation. Lecture 7. Robb T. Koether. Hampden-Sydney College. Mon, Sep 4, 2017
 Inflation Lecture 7 Robb T. Koether Hampden-Sydney College Mon, Sep 4, 2017 Robb T. Koether (Hampden-Sydney College) Inflation Mon, Sep 4, 2017 1 / 18 1 Inflation 2 Increase in Prices 3 Decrease in Purchasing
1. The economic statistic used to measure the level of prices is: A) GDP. B) CPI. C) GNP. D) real GDP.
 GDP. B) CPI. C) GNP. D) real GDP.") 1. The economic statistic used to measure the level of prices is: A) GDP. B) CPI. C) GNP. D) real GDP. 2. The statistic used by economists to measure the value of economic output is: A) the CPI. B) GDP.
1. The economic statistic used to measure the level of prices is: A) GDP. B) CPI. C) GNP. D) real GDP. 2. The statistic used by economists to measure the value of economic output is: A) the CPI. B) GDP.
Diploma Part 2. Quantitative Methods. Examiner s Suggested Answers
 Diploma Part 2 Quantitative Methods Examiner s Suggested Answers Question 1 (a) The binomial distribution may be used in an experiment in which there are only two defined outcomes in any particular trial
Index Numbers. Price Relatives. Chapter 17. Price Relatives. Gasoline. Price of. for a given item compares to a base period price per
 s by JOHN LOUCKS St. Edward s University Chapter 17 ndex Numbers Price Relatives Aggregate Price ndexes Computing an Aggregate Price ndex from Price Relatives Some mportant Price ndexes Deflating a Series
Chapter 21: Savings Models Lesson Plan
 Lesson Plan For All Practical Purposes Arithmetic Growth and Simple Interest Geometric Growth and Compound Interest Mathematical Literacy in Today s World, 8th ed. A Limit to Compounding A Model for Saving
Inflation. Lecture 7. Robb T. Koether. Hampden-Sydney College. Mon, Jan 29, 2018
 Inflation Lecture 7 Robb T. Koether Hampden-Sydney College Mon, Jan 29, 2018 Robb T. Koether (Hampden-Sydney College) Inflation Mon, Jan 29, 2018 1 / 18 1 Inflation 2 Increase in Prices 3 Decrease in Purchasing
SAMPLE. MODULE 4 Applications of financial mathematics
 C H A P T E R 21 MODULE 4 Applications of financial mathematics How do we calculate income tax? What do we mean by capital gains tax, stamp duty, GST? How do we calculate the interest earned on our bank
Alternative Measures of Change in Real Output and Prices
 32 SURVEY OF CURRENT BUSINESS April 1992 Alternative Measures of Change in Real Output and Prices By Allan H. Young This article and the one that follows it, Economic Theory and BEA s Alternative Quantity
BUSINESS MATHEMATICS & QUANTITATIVE METHODS
 BUSINESS MATHEMATICS & QUANTITATIVE METHODS FORMATION 1 EXAMINATION - APRIL 2010 NOTES: You are required to answer 5 questions. (If you provide answers to all questions, you must draw a clearly distinguishable
EXTERNAL TRADE INDICES
 EXTERNAL TRADE INDICES MD. Shahabuddin Sarker Deputy Director National Accounting Wing Bangladesh Bureau of Statistics StatCaB Training Programme of SESRIC on Price Statistics Brunei, July 18-20, 2017
Shahid H Kardar: Understanding inflation and SBP s monetary policy stance
 Shahid H Kardar: Understanding inflation and SBP s monetary policy stance Address by Mr Shahid H Kardar, Governor of the State Bank of Pakistan, to the Federation of Pakistan Chamber of Commerce and Industry,
Measuring Interest Rates
 Measuring Interest Rates Economics 301: Money and Banking 1 1.1 Goals Goals and Learning Outcomes Goals: Learn to compute present values, rates of return, rates of return. Learning Outcomes: LO3: Predict
Global Macroeconomics Measurement
 Global Macroeconomics Measurement Action items Complete problem set #0 Due September 15 Economic Outlook Forum Tonight! 5:00-6:30, Paulson Auditorium Economic and market outlook Economists from: Nomura,
2. Examine Figure 5.1. Is the text using the small country model? Explain the interpretation of each of the areas a, b, c, and d in this figure.
 Study Questions for Week 5 1. What is the small country assumption? What is the large country assumption? Is the US a small country in the international oil market? In the international tea market? In
June Economic and budgetary effects of fiscal reforms 2015
 June 2015 Economic and budgetary effects of fiscal reforms 2015 2 1. Introduction In March 10, 2014 Government of Kosovo (GoK) decided that from April 1, 2014 wages and salaries of public administration
Aggregate Indices and Their Corresponding Elementary Indices
 Jens Mehrhoff* Deutsche Bundesbank 11 th Ottawa Group Meeting *This presentation represents the author s personal opinion and does not necessarily reflect the *view of the Deutsche Bundesbank or its staff.
HIGHER SECONDARY I ST YEAR STATISTICS MODEL QUESTION PAPER
 HIGHER SECONDARY I ST YEAR STATISTICS MODEL QUESTION PAPER Time - 2½ Hrs Max. Marks - 70 PART - I 15 x 1 = 15 Answer all the Questions I. Choose the Best Answer 1. Statistics may be called the Science
Lecture 11. Index Numbers. Another example
 Lecture 11 Index Numbers Laspeyres, Paasche & Fischer Indices Useful Irish Applications of Indices Not covered in textbook will provide readings where necessary. Slide 1 Index Numbers A price index is
Inflation. Lecture 7. Robb T. Koether. Hampden-Sydney College. Mon, Sep 10, 2018
 Inflation Lecture 7 Robb T. Koether Hampden-Sydney College Mon, Sep 10, 2018 Robb T. Koether (Hampden-Sydney College) Inflation Mon, Sep 10, 2018 1 / 19 1 Inflation 2 Increase in Prices 3 Decrease in Purchasing
Class 8: Time Series and Index Numbers. Statistics
 Class 8: Time Series and Index Numbers Statistics Motivation Thus far, we have studied the characteristics of a sample of data. However, in many situations, these characteristics can change over time:
Diploma in Business Administration Part 2. Quantitative Methods. Examiner s Suggested Answers
 Cumulative frequency Diploma in Business Administration Part Quantitative Methods Examiner s Suggested Answers Question 1 Cumulative Frequency Curve 1 9 8 7 6 5 4 3 1 5 1 15 5 3 35 4 45 Weeks 1 (b) x f
IE 343 Midterm Exam 1
 IE 343 Midterm Exam 1 Feb 17, 2012 Version A Closed book, closed notes. Write your printed name in the spaces provided above on every page. Show all of your work in the spaces provided. Interest rate tables
according to the (+)ve and the (-)ve signs respectively.
ve and the (-)ve signs respectively.") Profit & Loss Cost Price: The price for which an article is purchased is called the Cost Price (C.P.) Selling price : The price at which an article is sold is called the Selling Price (S.P.) Profit (Gain)
Profit & Loss Cost Price: The price for which an article is purchased is called the Cost Price (C.P.) Selling price : The price at which an article is sold is called the Selling Price (S.P.) Profit (Gain)
ECON 222, Spring 2009 Assignment #1, Answer Key
 ECON 222, Spring 2009 Assignment #, Answer Key Question (30 marks) a) This question asks to nd the contributions of the transactions to 2009 s GDP. ou must explain your reasoning behind each of the contributions
Recall from Econ 200:
 Chapter 2: The Data of Macroeconomics Recall from Econ 200: Macroeconomics is the study of the economy a whole, including growth in incomes, changes in price, and the rate of unemployment. Macroeconomists
Macroeconomics 5th Edition Williamson Test Bank Full Download:
 Macroeconomics 5th Edition Williamson Test Bank Full Download: http://testbanklive.com/download/macroeconomics-5th-edition-williamson-test-bank/ Macroeconomics, 5e (Williamson) Chapter 2 Measurement 1)
Adding and Subtracting Fractions
 Adding and Subtracting Fractions Adding Fractions with Like Denominators In order to add fractions the denominators must be the same If the denominators of the fractions are the same we follow these two
A GUIDE TO THE TIMOR-LESTE CONSUMER PRICE INDEX
 Direcção Geral de Estatística Ministério de Finanças A GUIDE TO THE TIMOR-LESTE CONSUMER PRICE INDEX Series 2 A GUIDE TO THE TIMOR-LESTE CONSUMER PRICE INDEX, 2013 ii Contents SECTION 1: INTRODUCTION...
Export Import Price Index Manual 24. Measuring the Effects of Changes in the Terms of Trade
 1 Export Import Price Index Manual 24. Measuring the Effects of Changes in the Terms of Trade A. Introduction A.1 Chapter Overview July 26, 2008 draft. A terms of trade index is generally defined as an
a) 6 sandal soaps for $66.00 b) 5 rose soaps for $40.00 c) 8 almond soaps for $70.00 d) 4 cream soaps for $50.00
 6 sandal soaps for $66.00 b) 5 rose soaps for $40.00 c) 8 almond soaps for $70.00 d) 4 cream soaps for $50.00") Percentage as a Rate per Hundred - Step-by-Step Lesson Lesson 1 Percentage Problem: 1) Which soap is the best buy? a) 6 sandal soaps for $66.00 b) 5 rose soaps for $40.00 c) 8 almond soaps for $70.00 d)
Percentage as a Rate per Hundred - Step-by-Step Lesson Lesson 1 Percentage Problem: 1) Which soap is the best buy? a) 6 sandal soaps for $66.00 b) 5 rose soaps for $40.00 c) 8 almond soaps for $70.00 d)
Agricultural Finance. From Crops to Land, Water and Infrastructure. Helyette Geman
 Agricultural Finance From Crops to Land, Water and Infrastructure Helyette Geman WILEY Table of Contents Acknowledgments About the Author Preamble xiii xv xvii 1 Physical and Financial Agricultural Markets
Full file at
 MULTIPLE CHOICE Choose the one alternative that best completes the statement or answers the question 1) Gross domestic product is defined as 1) A) the total market value of the final goods and services
Chapter. International Trade CHAPTER IN PERSPECTIVE
 International Trade Chapter 34 CHAPTER IN PERSPECTIVE In Chapter 34 we see that all countries can benefit from free trade but, despite this fact, countries nevertheless restrict trade. Describe the patterns
macroeconomics The Data of Macroeconomics N. Gregory Mankiw CHAPTER TWO PowerPoint Slides by Ron Cronovich fifth edition
 CHAPTER TWO The Data of Macroeconomics macroeconomics fifth edition N. Gregory Mankiw PowerPoint Slides by Ron Cronovich 2002 Worth Publishers, all rights reserved Learning objectives In this chapter,
Unemployment Rate = 1. A large number of economic statistics are released regularly. These include the following:
 CHAPTER The Data of Macroeconomics Questions for Review 1. GDP measures the total income earned from the production of the new final goods and services in the economy, and it measures the total expenditures
1. A large number of economic statistics are released regularly. These include the following:
 CHAPTER The Data of Macroeconomics Questions for Review 1. GDP measures the total income earned from the production of the new final goods and services in the economy, and it measures the total expenditures
1 This series was normalized to equal 1 in December 1997 so that it would be comparable to the other
 31.1. An additional conclusion from Chapter 22 was that chained indices would usually reduce the spread between the Laspeyres (P L ) and Paasche (P P ) indices. In Table 3 below we compare the spread between
Unemployment Rate = 1. A large number of economic statistics are released regularly. These include the following:
 CHAPTER The Data of Macroeconomics Questions for Review 1. GDP measures the total income earned from the production of the new final goods and services in the economy, and it measures the total expenditures
WJEC (Wales) Economics A-level
 Economics A-level") WJEC (Wales) Economics A-level Macroeconomics Topic 2: Macroeconomic Objectives 2.3 Inflation and deflation Notes Inflation is the sustained rise in the general price level over time. This means that the
WJEC (Wales) Economics A-level Macroeconomics Topic 2: Macroeconomic Objectives 2.3 Inflation and deflation Notes Inflation is the sustained rise in the general price level over time. This means that the
Nominal spending: Jimmy spent $ ($1.75*75+$1.25*100) in the first year and $ ($1.25*150+$2.25*80) in the second year.
 in the first year and $ ($1.25*150+$2.25*80) in the second year.") 1. Use the model of supply and demand to explain how a fall in the price of frozen yogurt would affect the price of ice cream and the quantity of ice cream sold. In your explanation, identify the exogenous
1. Use the model of supply and demand to explain how a fall in the price of frozen yogurt would affect the price of ice cream and the quantity of ice cream sold. In your explanation, identify the exogenous
Chapter 3. Elasticities. 3.1 Price elasticity of demand (PED) Price elasticity of demand. Microeconomics. Chapter 3 Elasticities 47
 Price elasticity of demand. Microeconomics. Chapter 3 Elasticities 47") Microeconomics Chapter 3 Elasticities Elasticity is a measure of the responsiveness of a variable to changes in price or any of the variable s determinants. In this chapter we will examine four kinds of
Microeconomics Chapter 3 Elasticities Elasticity is a measure of the responsiveness of a variable to changes in price or any of the variable s determinants. In this chapter we will examine four kinds of
1.) (10 points) Use the quantity theory of money equation to solve the following problem:
 (10 points) Use the quantity theory of money equation to solve the following problem:") Exam #2 (ANSWERS) ECNS 303 Name 1.) (10 points) Use the quantity theory of money equation to solve the following problem: Consider the market for bread. Suppose 50 loaves of bread are sold in a year at
Exam #2 (ANSWERS) ECNS 303 Name 1.) (10 points) Use the quantity theory of money equation to solve the following problem: Consider the market for bread. Suppose 50 loaves of bread are sold in a year at
A Course in Macroeconomics Introduction to Key Macroeconomic Variables David Prescott, University of Guelph, Ontario, Canada
 A Course in Macroeconomics Introduction to Key Macroeconomic Variables David Prescott, University of Guelph, Ontario, Canada An Introduction to Essential Macroeconomic Variables Macroeconomics is the study
UNIT-V INDEX NUMBERS, TIME SERIES AND FORECASTING
 Index Numbers: An index number is an economic data figure reflecting price or quantity compared with a standard or base value. OF INDEX NUMBERS Index numbers are names after the activity they measure.
1. The economic statistic used to measure the level of prices is the: A) GDP. B) CPI. C) GNP. D) real GDP.
 GDP. B) CPI. C) GNP. D) real GDP.") 1. The economic statistic used to measure the level of prices is the: A) GDP. B) CPI. C) GNP. D) real GDP. 2. The statistic used by economists to measure the value of economic output is the: A) CPI. B)
1. The economic statistic used to measure the level of prices is the: A) GDP. B) CPI. C) GNP. D) real GDP. 2. The statistic used by economists to measure the value of economic output is the: A) CPI. B)
 3 Financial arithmetic 3.1 Kick off with CAS 3.2 Percentage change 3.3 Financial applications of ratios and percentages 3.4 Simple interest applications 3.5 Compound interest applications 3.6 Purchasing
(AA12) QUANTITATIVE METHODS FOR BUSINESS
 QUANTITATIVE METHODS FOR BUSINESS") All Rights Reserved ASSOCIATION OF ACCOUNTING TECHNICIANS OF SRI LANKA AA1 EXAMINATION - JULY 2016 (AA12) QUANTITATIVE METHODS FOR BUSINESS Instructions to candidates (Please Read Carefully): (1) Time
All Rights Reserved ASSOCIATION OF ACCOUNTING TECHNICIANS OF SRI LANKA AA1 EXAMINATION - JULY 2016 (AA12) QUANTITATIVE METHODS FOR BUSINESS Instructions to candidates (Please Read Carefully): (1) Time
Market Price Support in Large Developing Countries
 Tackling Agriculture in the Post-Bali Context - A collection of short essays 147 Market Price Support in Large Developing Countries By Raul Montemayor In the run-up to the Bali Ministerial Meeting in December
STUDY PARTNER, BANGALORE (An Institute for Competitive Exams) Contact Details: Mobile No:
 Contact Details: Mobile No:") 1. An article is sold at a loss of 29%. Had it been sold for Rs. 84 more, the profit would have been 11%. The cost price of the article must be a. 210 b. 200 c. 180 d. 170 Ans: a Suppose C.P. = Rs. K k
1. An article is sold at a loss of 29%. Had it been sold for Rs. 84 more, the profit would have been 11%. The cost price of the article must be a. 210 b. 200 c. 180 d. 170 Ans: a Suppose C.P. = Rs. K k
EXAMINATIONS OF THE HONG KONG STATISTICAL SOCIETY
 EXAMINATIONS OF THE HONG KONG STATISTICAL SOCIETY HIGHER CERTIFICATE IN STATISTICS, 2016 MODULE 7 : Time series and index numbers Time allowed: One and a half hours Candidates should answer THREE questions.
UNCORRECTED PAGE PROOFS
 3 Financial arithmetic 3.1 Kick off with CAS 3.2 Percentage change 3.3 Financial applications of ratios and percentages 3.4 Simple interest applications 3.5 Compound interest applications 3.6 Purchasing
Index Numbers and Moving Averages
 5 Index Numbers and Moving Averages 5.1 INDEX NUMBERS The value of money is going don, e hear everyday. This means that since prices of things are going up, e get lesser and lesser quantities of the same
Multiple Choice Questions Solutions are provided directly when you do the online tests.
 SOLUTIONS Multiple Choice Questions Solutions are provided directly when you do the online tests. Numerical Questions 1. Nominal and Real GDP Suppose than an economy consists of only types of products:
14.02 Principles of Macroeconomics Problem Set # 1, Questions
 14.02 Principles of Macroeconomics Problem Set # 1, Questions Posted during Week # 2, due on the last day of Week # 3. If you staple a copy of this front page on your problem set you will get 3 points
Year 2010 Year 2015 Nominal GDP $1000 $3000 Real GDP $1000 $2000. (P 0 Q t ) i. Nominal GDP t = i
 i. Nominal GDP t = i") Economics 285 Chris Georges Help With Practice Problems 1 1. Chapter 2. Problems and Applications 2,6: 1.2. $6 has been added to GDP in this example. We don t want to double-count the value of the wheat
Economics 285 Chris Georges Help With Practice Problems 1 1. Chapter 2. Problems and Applications 2,6: 1.2. $6 has been added to GDP in this example. We don t want to double-count the value of the wheat
NBER WORKING PAPER SERIES AGGREGATION ISSUES IN INTEGRATING AND ACCELERATING BEA S ACCOUNTS: IMPROVED METHODS FOR CALCULATING GDP BY INDUSTRY
 NBER WORKING PAPER SERIES AGGREGATION ISSUES IN INTEGRATING AND ACCELERATING BEA S ACCOUNTS: IMPROVED METHODS FOR CALCULATING GDP BY INDUSTRY Brian Moyer Marshall Reinsdorf Robert Yuskavage Working Paper
Answers to Questions Arising from the RPI Consultation. February 1, 2013
 1 Answers to Questions Arising from the RPI Consultation W. Erwin Diewert 1 Discussion Paper 13-04 School of Economics University of British Columbia Vancouver, Canada, V6T 1Z1 Email: diewert@econ.ubc.ca
Week-7. Dr. Ahmed. Domestic Firms International Firms Multinational Firms Global Firms
 FINC 5880 Dr. Ahmed Week-7 Name Domestic Firms International Firms Multinational Firms Global Firms Factors that make multinational financial management different Exchange rates and trading International
Chapter 1: The Data of Macroeconomics
 Chapter 1: The Data of Macroeconomics Econ206 - Francesc Ortega August 31, 2011 Outline 1. The GDP 2. The inflation rate 3. The unemployment rate Reading: Mankiw 7e, chapter 2 Definition The Gross Domestic
CHAPTER 1 A Brief History of Risk and Return
 CHAPTER 1 A Brief History of Risk and Return I. DEFINITIONS TOTAL RETURN 1. The total dollar return on an equity investment is defined as the: a. increase in value of a share of stock over a period of
Percentage. 5. Two numbers are respectively 20% and 25% of a third number, what percentage is the first of the second? 3 rd = 100
 1. Express 87 % as a fraction. 87 1 2 17 = = 2 7 8 2. Express the fraction as a percentage. 1 2 = = 12 1 % 8 2 2 3. Express 200 as a percentage of 00. 200 = 40% 00 4. In a school there are 300 boys and
NATIONAL INCOME AND RELATED AGGREGATES
 NATIONAL INCOME AND RELATED AGGREGATES The modern concept of National Income is more dynamic in the content than earlier concepts. The National Income Committee of India defined national income as: A National
Ch 2. National Income Accounting ECO 402
 Ch 2. National Income Accounting ECO 402 Key Words The circular flow Three approaches to measuring national income Production Income Expenditure Value added Final goods and intermediate goods Gross domestic
UNU-Wider authors workshop
 UNU-Wider authors workshop Smokestack-free industries in the East African Community Working draft Stephen Karingi, Ottavia Pesce, Lily Sommer Economic Commission for Africa, Addis Ababa, Ethiopia Helsinki,
The Data of Macroeconomics
 C H A P T E R 2 MACROECONOMICS SIXTH EDITION N. GREGORY MANKIW PowerPoint Slides by Ron Cronovich 2008 Worth Publishers, all rights reserved In this chapter, you will learn the meaning and measurement
Name: Econ 112 Test 2
 Name: Econ 112 Test 2 Spring 2005 Dr. Raymond ************************************************************************************************* Part One: Explain the following questions in a clear, very
Hedonic Regressions: A Review of Some Unresolved Issues
 Hedonic Regressions: A Review of Some Unresolved Issues Erwin Diewert University of British Columbia, Vancouver, Canada The author is indebted to Ernst Berndt and Alice Nakamura for helpful comments. 1.
Modelling Economic Variables
 ucsc supplementary notes ams/econ 11a Modelling Economic Variables c 2010 Yonatan Katznelson 1. Mathematical models The two central topics of AMS/Econ 11A are differential calculus on the one hand, and
TANZANIAN GOVERNMENT BUDGET 2015/2016- KEY HIGHLIGHTS
 TANZANIAN GOVERNMENT BUDGET 2015/2016- KEY HIGHLIGHTS CONTENTS TAX HIGHLIGHTS 1. Amendments to the Income Tax (Employees & Presumptive Income); 2. Amendments to the Skill Development Levy Act; 3. Amendments
TAX PRINCIPLES WORKSHOP Inflation adjustment (indexation) Presentation by:
 Presentation by:") TAX PRINCIPLES WORKSHOP Inflation adjustment (indexation) Presentation by: Lydia Ndirangu Senior Manager, Ernst and Young LLP Friday, 26 th January 2018 Uphold public interest Presentation agenda 1. What
TAX PRINCIPLES WORKSHOP Inflation adjustment (indexation) Presentation by: Lydia Ndirangu Senior Manager, Ernst and Young LLP Friday, 26 th January 2018 Uphold public interest Presentation agenda 1. What
HOW THE CHAIN-ADDITIVITY ISSUE IS TREATED IN THE U.S. ECONOMIC ACCOUNTS. Bureau of Economic Analysis, U.S. Department of Commerce
 For Official Use STD/NA(2000)25 Organisation de Coopération et de Développement Economiques OLIS : 11-Sep-2000 Organisation for Economic Co-operation and Development Dist. : 12-Sep-2000 Or. Eng. STATISTICS
 - PDF Download Topics : 1. Simplification 2. Number Series 3. Percentage 4. Profit and Loss 5. Simple Interest and Compound Interest 6. Ratio and Proportion 7. Time and Work 8. Time Speed and Distance
ANSWERS AND EXPLANATIONS EXERCISE 1
 www.tarainstitute.in 1 ANSWERS AND EXPLANATIONS EXERCISE 1 1. (a) Percentage profit 0% 1. (c) CP 0 15 + 0 1 ` 60 SP 4 of 60 1 50 ` 18.40. (a) Let the cost price of the article be ` x. Then, (84 x) 6 x
is the root of all evil.
 Money Money is the root of all evil. Money is the root of all evil. makes the world go round. Money is the root of all evil. makes the world go round. can t buy you love. Money is the root of all evil.
is the root of all evil.
 Money Money is the root of all evil. Money is the root of all evil. makes the world go round. Money is the root of all evil. makes the world go round. can t buy you love. Money is the root of all evil.
LEAD CITY UNIVERSITY Faculty of Social and Management Sciences Department of Economics
 LEAD CITY UNIVERSITY Faculty of Social and Management Sciences Department of Economics COURSE PARTICULARS Course Code: ECO 214 Course Title: Applied Statistics II Number of Units: 2 Status: Compulsory
The need to change the WTO rules to promote local food markets in West Africa and East Africa (EAC)
") WTO Public Forum 2017 ROPPA-SEATINI Uganda-SOL Addressing the imbalances in the WTO rules to promote local food systems in West and Eastern Africa in line with the Sustainable Development Goals (SDGs)
WTO Public Forum 2017 ROPPA-SEATINI Uganda-SOL Addressing the imbalances in the WTO rules to promote local food systems in West and Eastern Africa in line with the Sustainable Development Goals (SDGs)