Important Notice. April 2016 Seven Generations Energy Ltd. 2
|
|
|
- Whitney Pierce
- 5 years ago
- Views:
Transcription
1
2 Important Notice General Advisory The information contained in this presentation does not purport to be all-inclusive or contain all information that readers may require. Prospective investors are encouraged to conduct their own analysis and review of Seven Generations Energy Ltd. ( Seven Generations, 7G, or the Company ) and of the information contained in this presentation. Without limitation, prospective investors should read the entire record of publicly filed documents relating to the Company, consider the advice of their financial, legal, accounting, tax and other professional advisors and such other factors they consider appropriate in investigating and analyzing the Company. An investor should rely only on the information provided by the Company and is not entitled to rely on parts of that information to the exclusion of others. The Company has not authorized anyone to provide investors with additional or different information, and any such information, including statements in media articles about Seven Generations, should not be relied upon. In this presentation, unless otherwise indicated, all dollar amounts are expressed in Canadian dollars. An investment in the securities of Seven Generations is speculative and involves a high degree of risk that should be considered by potential purchasers. Seven Generations business is subject to the risks normally encountered in the oil and gas industry and, more specifically, the relatively new shale and tight liquids-rich natural gas sector of the oil and natural gas industry, and certain other risks that are associated with Seven Generations early stage of development. An investment in the Company s securities is suitable only for those purchasers who are willing to risk a loss of some or all of their investment and who can afford to lose some or all of their investment. Non-IFRS Measures Advisory In addition to using financial measures prescribed by International Financial Reporting Standards ( IFRS ), references are made in this presentation to netbacks, operating netback, available funding, funds from operations and/or adjusted working capital, which are measures that do not have any standardized meaning as prescribed by IFRS. Accordingly, the Company s use of such terms may not be comparable to similarly defined measures presented by other entities. For further details about operating netback, available funding and funds from operations, see Non-IFRS Financial Measures in the Company s Management s Discussion and Analysis for year ended December 31, 2015, which is available on the SEDAR website at Adjusted working capital is a financial measure not presented in accordance with IFRS and is equal to working capital adjusted for risk management assets and liabilities. The Company uses adjusted working capital to assess short term liquidity, and it should not be considered an alternative to, or more meaningful than, working capital as determined in accordance with IFRS. Forward-Looking Information Advisory This presentation contains certain forward-looking information and statements that involves various risks, uncertainties and other factors. The use of any of the words anticipate, continue, estimate, expect, may, will, should, believe, plans, and similar expressions are intended to identify forward-looking information or statements. In particular, but without limiting the foregoing, this presentation contains forward-looking information and statements pertaining to the following: the Company s objectives, strategies and competitive strengths; profitable growth; achievement of positive free cash flow; ability to earn a return on capital across the entire commodity cycle; application of innovation and technology to remain among North America s lowest supply-cost unconventional gas developers; forecast production, production sustainability, production growth and liquids yields; production declines expected to be replaced; rig counts; estimated number of wells drilled and new producing wells; projected capital investment; maintenance capital required to replace production declines; anticipated drilling and completion costs, facilities costs, land costs and other costs; increased production per dollar of capital investment; market access options; forecasted half-cycle and full-cycle economics, including forecasted NPVs, IRRs, price sensitivities and break-even prices; estimated future costs, supply costs, cost reductions and cost performance; forecasted well economics; type curves; forecasted decline rates; estimated number of undeveloped drilling locations; opportunities for optimization, innovation and increased efficiency; estimated recoveries; ability to fulfill the Company s transportation commitments through 2022 and beyond with Nest 2 resources; growth plans and rate of growth; drilling inventory and the timeline for the development of the Company s assets; potential from conventional zones and emerging tight targets and commingling potential; opportunities from further lateral delineation of the upper Montney; pressure, thickness, geology and temperature estimates in the Montney formation; anticipated completions techniques, frac spacing and proppant tonnage; expected return on investment; and transportation capacity. In addition, references to reserves and resources are deemed to be forward-looking information, as they involve the implied assessment, based on certain estimates and assumptions, that the reserves and resources described exist in the quantities predicted or estimated. With respect to forward-looking information contained in this presentation, assumptions have been made regarding, among other things: future oil, natural gas liquids and natural gas prices; the Company s ability to obtain qualified staff and equipment in a timely and cost efficient manner; the Company s ability to market production of oil, NGLs and natural gas successfully to customers; the Company s future production levels; the applicability of technologies for the Company s reserves; future capital investments by the Company; future cash flows from production; future sources of funding for the Company s capital program; the Company s future debt levels; geological and engineering estimates in respect of the Company s reserves and resources estimates, the geography of the areas in which the Company is conducting exploration and development activities, and the access, economic and physical limitations to which the Company may be subject from time to time; the impact of competition on the Company; and the Company s ability to obtain financing on acceptable terms. Actual results could differ materially from those anticipated in forward-looking information as a result of the risks and risk factors that are set forth in the Company s Annual Information Form dated March 8, 2016 (the AIF ), which is available on SEDAR at including, but not limited to: volatility in market prices and demand for oil, NGLs and natural gas and hedging activities related thereto; general economic, business and industry conditions; variance of the Company s actual capital costs, operating costs and economic returns from those anticipated; risks related to the exploration, development, production and transportation of oil and natural gas reserves and resources; negative public perception of oil sands development, oil and natural gas development and transportation, hydraulic fracturing and fossil fuels; actions by governmental authorities, including changes in government regulation, royalties and taxation; the management of the Company s growth; the availability, cost or shortage of rigs, equipment, raw materials, supplies or qualified personnel; the absence or loss of key employees; uncertainty associated with estimates of oil, NGLs and natural gas reserves and resources and the variance of such estimates from future production; dependence upon compressors, gathering lines, pipelines and other facilities, certain of which the Company does not control; shortage or lack of available of pipeline capacity or other transportation facilities; the ability to satisfy obligations under the Company s firm commitment transportation arrangements; uncertainties related to the Company s identified drilling locations; the concentration of the Company s assets in the Kakwa area; unforeseen title defects; Aboriginal claims; failure to accurately estimate abandonment and reclamation costs; changes in the interpretation and enforcement of applicable laws and regulations; terrorist attacks or armed conflicts; weather conditions, natural disasters and fires; reassessment by taxing authorities of the Company s prior transactions and filings; variations in foreign exchange rates and interest rates; third-party credit risk including risk associated with counterparties in risk management activities related to commodity prices and foreign exchange rates; sufficiency of insurance policies; potential for litigation; variation in future calculations of non-ifrs measures; sufficiency of internal controls; impact of expansion into new activities on risk exposure; risks related to the senior unsecured notes and other indebtedness, including: potential inability to comply the covenants in the credit agreement related to the Company s credit facilities and/or the covenants in the indentures in respect of the senior secured notes; seasonality of the Company s activities and the Canadian oil and gas industry; and extensive competition in the Company s industry. Financial outlook and future-oriented financial information contained in this presentation regarding prospective financial performance, financial position or cash flows is based on assumptions about future events, including economic conditions and proposed courses of action, based on management s assessment of the relevant information that is currently available. Projected operational information contains forward-looking information and is based on a number of material assumptions and factors, as are set out above. These projections may also be considered to contain future oriented financial information or a financial outlook. The actual results of the Company s operations for any period will likely vary from the amounts set forth in these projections, and such variations may be material. Actual results will vary from projected results. Readers are cautioned that any such financial outlook and future-oriented financial information contained herein should not be used for purposes other than those for which it is disclosed herein. The forward-looking statements included in this presentation are expressly qualified by the foregoing cautionary statements and are made as of the date of this presentation. The Company does not undertake any obligation to publicly update or revise any forward-looking statements except as required by applicable securities laws. No assurance can be given that these expectations will prove to be correct and such forward-looking statements included in this presentation should not be unduly relied upon. April 2016 Seven Generations Energy Ltd. 2
3 Important Notice Presentation of Oil and Gas Information Estimates of the Company s reserves, contingent resources and prospective resources and the net present value of future net revenue attributable to the Company s reserves, contingent resources and prospective resources are based upon the reports prepared by McDaniel & Associates Consultants Ltd. ( McDaniel ), the Company s independent qualified reserves evaluator, as at the effective dates that are specified in this presentation. The estimates of reserves, contingent resources and prospective resources provided in this presentation are estimates only and there is no guarantee that the estimated reserves, contingent resources and prospective resources will be recovered. Actual reserves, contingent resources and prospective resources may be greater than or less than the estimates provided in this in this presentation and the differences may be material. Estimates of net present value of future net revenue attributable to the Company s reserves, contingent resources and prospective resources do not represent fair market value and there is uncertainty that the net present value of future net revenue will be realized. There is no assurance that the forecast price and cost assumptions applied by McDaniel in evaluating Seven Generations reserves, contingent resources and prospective resources will be attained and variances could be material. There is no certainty that any portion of the prospective resources will be discovered. If discovered, there is no certainty that it will be commercially viable to produce any portion of the prospective resources. There is also uncertainty that it will be commercially viable to produce any part of the contingent resources. Risked and unrisked estimates of net present value of future net revenue from contingent resources and prospective resources are preliminary in nature and are provided to assist the reader in reaching an opinion on the merit and likelihood of the Company proceeding with the required investment. Such estimates include contingent resources and prospective resources that are considered too uncertain with respect to the chance of development and chance of discovery to be classified as reserves. Readers should refer to the AIF for a discussion of the significant factors relevant to the estimates of prospective resources and contingent resources, a description of the Kakwa River Project, including estimated costs and timelines and the specific contingencies which prevent the classification of the Company s contingent resources as reserves. This presentation includes contingent resources estimates that are un-risked as to chance of development and prospective resources estimates that are un-risked as to both chance of discovery and chance of development (i.e. the level of risk associated with the chance of discovery and chance of development was not assessed by McDaniel as part of the evaluations that were conducted effective as at December 31, 2014 and for earlier periods). Such un-risked estimates have been provided herein for comparison purposes. This presentation also includes estimates of contingent resources and prospective resources, as at December 31, 2015, that have been risked by McDaniel for the probability of loss or failure in accordance with the COGE Handbook. For contingent resources, the risk component relating to the likelihood that an accumulation will be commercially developed is referred to as the chance of development. For contingent resources the chance of commerciality is equal to the chance of development. The contingent resources evaluated by McDaniel, as at December 31, 2015, were classified in the development pending project maturity sub-class and are considered to have the highest chance of commerciality of all resources other than reserves. In its December 31, 2015 evaluations, McDaniel evaluated the risks and contingencies that were relevant to the contingent resources, as are described herein and in the AIF, and determined that a 95% chance of development was appropriate for the contingent resources that were assigned to the development pending project maturity sub-class. The risked contingent resource volumes and associated net present value, as at December 31, 2015, was determined by multiplying the un-risked volumes and values by the associated chance of development that was estimated by McDaniel (i.e. 95%). Prospective resources have both an associated chance of discovery and a chance of development. Not all exploration projects will result in discoveries. The chance that an exploration project will result in the discovery of petroleum is referred to as the chance of discovery. Thus, for an undiscovered accumulation, the chance of commerciality is the product of two risk components the chance of discovery and the chance of development. McDaniel has sub-classified the prospective resources that were evaluated, as at December 31, 2015, by maturity status, consistent with the requirements of the COGE Handbook. The prospective resources associated with the upper Montney, as at December 31, 2015, were sub-classified as prospect and the prospective resources associated with the lower Montney were sub-classified as lead. Through an evaluation of the risks that were relevant to the upper Montney prospective resources, which are described herein and in the AIF, McDaniel determined that an 85% chance of discovery and a 60% chance of development was appropriate for the prospective resources assigned to the upper Montney, as at December 31, The corresponding chance of commerciality was estimated to be 50% by McDaniel. Through an evaluation of the risks that were relevant to the lower Montney prospective resources, which are described herein and in the AIF, McDaniel determined that an 80% chance of discovery and a 50% chance of development was appropriate for the prospective resources assigned to the lower Montney, as at December 31, The corresponding chance of commerciality was 40%. The risked prospective resource volumes and associated net present values were determined by McDaniel by multiplying the estimated un-risked volumes and values, as at December 31, 2015, by the associated chance of commerciality. Risks that could impact the chance of discovery and chance of development are described in the AIF and include: geological uncertainty and uncertainty regarding individual well drainage areas; uncertainty regarding the consistency of productivity that may be achieved from lands with attributed resources; potential delays in development due to product prices, access to capital, availability of markets and/or take-away capacity; and uncertainty regarding potential flow rates from wells and the economics of those wells. Significant factors that may change the prospective resources and contingent resources estimates are described in the AIF and include further delineation drilling, which could change the estimates either positively or negatively, future technology improvements, which would positively affect the estimates, and additional transportation and processing capacity that could affect the volumes recoverable or type of production. Additional facility design work, development plans, reservoir studies and delineation drilling is expected to be completed by the Company in accordance with its long-term resource development plan. Unless otherwise specified, in this presentation, all production is reported on the basis of the Company s working interest (operating and non-operating) before the deduction of royalties payable. Seven Generations has adopted the standard of 6 Mcf:1 bbl when converting natural gas to oil equivalent. Condensate and other NGLs are converted to oil equivalent at a ratio of 1 bbl:1 bbl. Boes may be misleading, particularly if used in isolation. A boe conversion ratio of 6 Mcf:1 bbl is based roughly on an energy equivalency conversion method primarily applicable at the burner tip and does not represent a value equivalency at 7G s sales points. Given the value ratio based on the current price of oil as compared to natural gas is significantly different from the energy equivalency of 6 Mcf: 1 bbl, utilizing a conversion ratio at 6 Mcf: 1 bbl may be misleading as an indication of value. The reserves and resources information contained in this presentation should be reviewed in conjunction with the AIF, which contains important additional information regarding the independent reserve, contingent resource and prospective resource evaluations that were conducted by McDaniel and a description of, and important information about, the reserves and resources terms used in this presentation. The AIF is available on the SEDAR website at Note Regarding Type-Curves The type curves that are provided in this presentation have been estimated by Seven Generations using a combination of a statistical approaches to early-life production from its Nest 2 wells, matched to volumetric estimates that are attributable to properties in the Company s Nest 2 area, based on known reservoir parameters. Early-life statistics use data from the Company s producing Nest 2 wells, adjusted for stage count and lateral length on a producing rate versus time basis, a cumulative volume versus time basis, and a producing rate versus cumulative volume basis, to ensure a reasonable fit. Recoverable hydrocarbon calculations use forecasted EUR factors applied to volumetric estimates, and decline curves are used to align early statistical results with forecasted EURs. The Company s historical drilling in its Nest 2 area has predominantly been in the upper and middle intervals of the Montney formation, with 41 wells providing the statistical basis for anticipated future well results. The only Nest 2 wells that were excluded from the analysis were wells that were completed using experimental completions techniques. The Company s type curves are very similar to those used in the reports that were prepared by McDaniel, evaluating the Company s reserves, effective as at December 31, 2015, and the variances between the Company s type-curves and McDaniel s type-curves are immaterial. The Company has opted to provide its own type-curve forecasts in this presentation, since they are what the Company has used to determine its 2016 production guidance, 2016 capital budget and development plans. April 2016 Seven Generations Energy Ltd. 3
4 Important Notice Oil and Gas Definitions best estimate is a classification of estimated resources described in the Canadian Oil and Gas Evaluation Handbook, which is considered to be the best estimate of the quantity that will actually be recovered. It is equally likely that the actual quantities recovered will be greater or less than the best estimate. Resources in the best estimate case have a 50% probability that the actual quantities recovered will equal or exceed the estimate. COGE Handbook means the Canadian Oil and Gas Evaluation Handbook maintained by the Society of Petroleum Evaluation Engineers (Calgary Chapter), as amended from time to time. contingent resources are the quantities of petroleum estimated, as of a given date, to be potentially recoverable from known accumulations using established technology or technology under development, but which are not currently considered to be commercially recoverable due to one or more contingencies. Contingencies are conditions that must be satisfied for a portion of contingent resources to be classified as reserves that are: (a) specific to the project being evaluated; and (b) expected to be resolved within a reasonable timeframe. Contingencies may include factors such as economic, legal, environmental, political and regulatory matters or a lack of markets. It is also appropriate to classify as contingent resources the estimated discovered recoverable quantities associated with a project in the early evaluation stage. developed producing reserves are those reserves that are expected to be recovered from completion intervals open at the time of the estimate. These reserves may be currently producing or, if shut in, they must have previously been on production, and the date of resumption of production must be known with reasonable certainty. developed reserves are those reserves that are expected to be recovered from existing wells and installed facilities or, if facilities have not been installed, that would involve a low expenditure (for example, when compared to the cost of drilling a well) to put the reserves on production. The developed category may be subdivided into producing and non-producing. development pending is a sub-classification of contingent resources estimates based upon project maturity which is appropriate where resolution of the final conditions for development is being actively pursued (high chance of development). gross means: (i) in relation to the Company s interest in production, reserves, contingent resources or prospective resources, its company gross production, reserves, contingent resources or prospective resources, which are the Company s working interest (operating or non-operating) share before deduction of royalties and without including any royalty interests of the Company; (ii) in relation to wells, the total number of wells in which a company has an interest; and (iii) in relation to properties, the total area of properties in which the Company has an interest. lead is a sub-classification of prospective resources estimates based upon project maturity which is appropriate where a potential accumulation is within a play requires more data acquisition and/or evaluation in order to be classified as a prospect. liquids refers to oil, condensate and other NGLs. net means: (i) in relation to the Company s interest in production or reserves, the Company s working interest (operating or non-operating) share after deduction of royalty obligations, plus the Company s royalty interest in production or reserves; (ii) in relation to the Company s interest in wells, the number of wells obtained by aggregating the Company s working interest in each of its gross wells; and (iii) in relation to the Company s interest in a property, the total area in which the Company has an interest multiplied by the working interest owned by the Company. probable reserves are those additional reserves that are less certain to be recovered than proved reserves. It is equally likely that the actual remaining quantities recovered will be greater or less than the sum of the estimated proved plus probable reserves. prospect is a sub-classification of prospective resources estimates based upon project maturity which is appropriate where a potential accumulation within a play that is sufficiently well defined to present a viable drilling target. prospective resources means quantities of petroleum estimated, as of a given date, to be potentially recoverable from undiscovered accumulations by application of future development projects. Prospective resources have both an associated chance of discovery and a chance of development. proved reserves are those reserves that can be estimated with a high degree of certainty to be recoverable. It is likely that the actual remaining quantities recovered will exceed the estimated proved reserves. reserves are estimated remaining quantities of oil and natural gas and related substances anticipated to be recoverable from known accumulations, as of a given date, based on: (i) analysis of drilling, geological, geophysical and engineering data; (ii) the use of established technology; and (iii) specified economic conditions, which are generally accepted as being reasonable. Reserves are classified according to the degree of certainty associated with the estimates. risked means adjusted for the probability of loss or failure in accordance with the COGE Handbook. unrisked or un-risked means not risked. April 2016 Seven Generations Energy Ltd. 4
5 7G Key Value Drivers High Quality Asset Large Resource Base Corporate liquids yields of approximately 230 bbls/mmcf 1 Priority development block type curve ( Nest 2 type curve ) with half-cycle supply cost (the price required for an incremental well investment to earn a 20% before tax IRR) < US$ 1.00/MMBtu at US $45 WTI or < US$ 0.00/MMbtu supply cost at US $60 WTI 2 431,000 net acres or 673 square miles of land with over 3,100 potential undeveloped locations MMboe of PDP reserves (55% liquids), MMBoe of 1P reserves (52% liquids) and MMboe of 2P reserves (52% liquids) 4 Location and Market Access 100 km south of Grande Prairie, a major Canadian natural gas industry service, supply and expertise hub Available nearby access to rail and two transcontinental gas pipelines, major liquids gathering pipeline, local sweet and sour gas gathering and processing facilities Control Over Operations Average 99% working interest on ~650 net Montney sections 100% working interest in facilities and gathering systems, a key driver in well optimization, production growth and capital program control Proven Execution Ability A proven management team with a track record of rapid, well-managed, profitable resource play aggregation, commercialization, development and value enhancement within a competitive environment Focused on value growth through operating efficiency and innovation 1) Liquids ratio is 2015 full year average. 2) Assuming 20% IRR and 0.76 CAD/USD; based on half-cycle economics as shown on individual well economics slide. Management estimate. 3) Potential undeveloped locations based upon the reports prepared by McDaniel & Associates Consultants Ltd. ( McDaniel ) evaluating the Company s reserves, contingent resources and prospective resources, respectively, as at December 31, 2015; Net acreage as of December 31, Approximately 18% of these potential drilling locations have attributed 2P reserves, 27% have attributed best estimate contingent resources and 55% have attributed best estimate prospective resources. 4) Company gross reserves based on McDaniel s reports, effective as at Dec 31, For important information regarding the Company s estimated reserves, contingent resources and prospective resources, please refer to the Important Notice at the beginning of this presentation. April 2016 Seven Generations Energy Ltd. 5

6 The Seven Generations Strategy Supply Cost Combine resource selection with innovation, technology and efficiency to remain among North America s lowest supply cost unconventional gas developers Financial Sustainability Profitable growth to achieve free cash flow Earn a full cycle return on capital employed across the entire commodity cycle Focused capital deployment on highest return opportunities with hedgedeconomics Market Access Seek out and position in gathering, processing, transportation and marketing opportunities Leverage market access into superior realized pricing for the Company s production Stakeholder Interests Enhance social license by differentiating with key stakeholders as prescribed in the Company s Level 1 Policy Statement (Code of Conduct) In a competitive world, only those who best serve their stakeholders can expect long term survival April 2016 Seven Generations Energy Ltd. 6
7 Stakeholder Differentiation We see ourselves as being in the service business, serving the needs of our stakeholders. We seek satisfaction for all stakeholders. Differentiation is imperative. We support an open and competitive business environment, recognizing in that competitive world only those who best serve their stakeholders can expect the support required to survive for the longer term. Specifically, in acceptance of this challenge to differentiate with all stakeholders, we acknowledge: The need of society for us to conduct our business in a way that protects the natural beauty of the environment and preserves the capacity of the earth to meet the needs of present and future generations, The need of Canada and Alberta for us to obey all regulations and to proactively assist with the formulation of new policy that enables our company and our industry to better serve society, The need of the communities, where we operate, to be engaged in the planning of our projects and to participate in the benefits arising from them as they are built and operated, The need of our business partners and infrastructure customers to be treated fairly and attentively, The need of our suppliers and service providers to be treated fairly and paid promptly for equipment and services provided to us and to receive feedback from us that can help them to be competitive and thrive in their businesses, The need of our employees to be compensated fairly and provided a safe, healthy and happy work environment including a healthy work life outside life balance, and, The need of our shareholders to have their investment managed responsibly and ethically and to earn strong returns. Third Annual Seven Generations Charity Golf Tournament 2015 Stakeholder Initiative Highlights More than $800,000 raised since tournament s inception in support of the Grande Prairie Regional Hospital Foundation 7G Winter Warmth Drive Distributed 3,000 toques, mitts and scarves over 3 years to local community and regional school children Horse Lake First Nation Transportation Initiative Pilot Working with local groups to launch transportation service to community members commuting to early-career jobs April 2016 Seven Generations Energy Ltd. 7
8 Seven Generations Overview & 2016 Guidance Capitalization 2016E Guidance Initial Public Offering Closed November 5, 2014 Production (% Liquids) (Mboe/d) (55-60%) Ticker symbol TSX: VII Rig Count (#) 5-6 Basic Market Cap (1) $5.4 billion New Producing Wells (#) Enterprise Value (2) Available Funding (3) $6.3 billion > $1.4 billion 2016E Capital Investment Drilling & Completions ($MM) Q Operating Highlights Facilities ($MM) 320 Q Production 77,699 boe/d Land/Other ($MM) 30 Q Funds From Operations (4) $106 MM Total ($MM) (1) Based on March 31, 2016 share price of $19.55 and million common shares. (2) Basic Market Cap + US$ 1.125B in senior unsecured notes converted at $0.77 USD/CAD less adjusted net working capital as of December 31, 2015 of $306MM and net proceeds of $285MM from the February 24, 2016 private placement. (3) Adjusted net working capital as of December 31, 2015 of $306MM plus available credit facility capacity of $812MM and net proceeds of $285MM from the February 24, 2016 private placement. (4) Non-IFRS Financial Measure. April 2016 Seven Generations Energy Ltd. 8
9 7G: Strong Track Record of Consistent Performance & Growth Production (boe/d) Condensate Production (bbls/d) Natural Gas Production (1) (MMcf/d) 120, ,000 80,000 60,000 40,000 20, , ,000 60,403 31,110 2,715 4,180 7, E 25,000 20,000 15,000 10,000 5, ,204 11,061 2, Funds From Operations ($MM) PDP Reserves (MMboe) (2) 2P Reserves (MMboe) (2) $500 $400 $300 $200 $100 $ ,000 $ $ $25.9 $36.4 $ Demonstrated track record with profitable high growth (1) Marketed gas volumes. (2) Based upon McDaniel reports with effective dates: March 31, 2012; March 31, 2013; December 31, 2013; December 31, 2014; and December 31, Please refer to the Important Notice at the beginning of the presentation. April 2016 Seven Generations Energy Ltd. 9

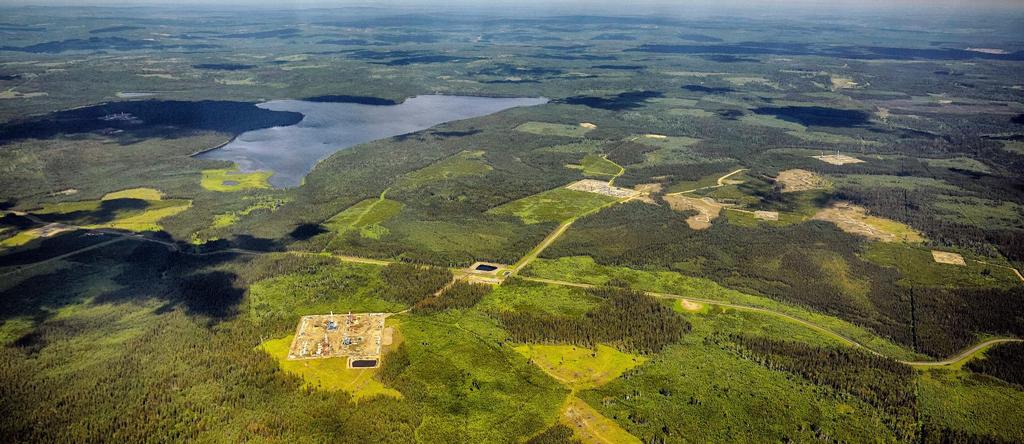
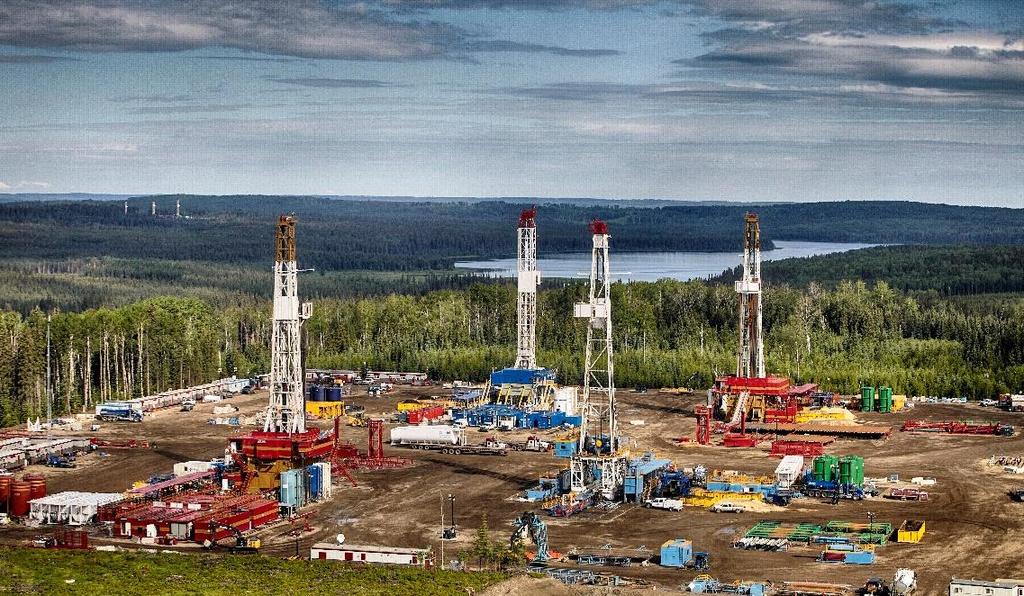
10 Montney: Multiple Market Access Options Montney Location Summary Pipeline connected Multiple transcontinental natural gas pipelines Regional liquids gathering system Regional sour gas gathering and processing Close proximity to oil sands Condensate demand Rail connection near 7G land 100 km south of Grande Prairie Major industry service, supply and expertise hub 7G operations head office April 2016 Seven Generations Energy Ltd. 10

11 The Boot Diagram: Ranking Project Competitiveness NYMEX ($USD/MMbtu) Breakeven* Price by Play 2015 NYMEX Henry Hub Price Range * Assumes a 15% IRR, US$40/bbl WTI, WTI less US$5/bbl for Edmonton Par, US$0.50/MMbtu AECO basis and FX of 0.75 (US$/C$) Source: Credit Suisse Equity Research February 1, 2016 Combining high quality resources with technology to be among the lowest cost supply April 2016 Seven Generations Energy Ltd. 11


12 2015: Continued Operational Excellence 2016 Forecast Production Growth of ~ 80% ~ 30% Reduction in Annual Capital in 2016 Average 2015 = 60,400 BOE/d (59% Liquids) Efficiency gains in drilling have increased well count per rig by 33% (8 wells per year vs. 6 previously) Well cost reductions combined with longer lateral lengths increase return on investment Type curve improvement based on well optimization, higher liquids ratios & flatter declines More Production Per Capital Dollar Invested Note: Guidance volumes, capital spending and commodity weightings represent the mid-point of their respective guidance ranges. April 2016 Seven Generations Energy Ltd. 12

13 Maintenance Capital vs. Growth 2015 Corporate Declines of 30 35% Running Room to Grow Average December 2015 production of ~ 87,000 BOE/d ~ 30,000 boe/d of declines expected to be replaced Current Nest IP 365 s of ~1,000 boe/d (1) 30 new wells to be $12MM/well = ~$360MM of maintenance capital > 900 drilling locations (2) within the Nest new producing wells expected in 2016 > 12 years of drilling inventory within the nest 1) Based upon observed averages of producing Nest Montney wells, see slide #27. 2) Based upon the reports prepared by McDaniel evaluating the Company s reserves, contingent resources and prospective resources, respectively, as at December 31, 2015; with 54% of those potential drilling locations having reserves attributed to them and 46% to have contingent resources attributed to them. April 2016 Seven Generations Energy Ltd. 13
 MMBOE NPV10 ($MM) PDP 73.3 55% $877.8 115% 60% 1P 424.0 52% $2,936.9 1% -7% 2P 859.1 52% $6,506.9 9% -8% 2C - Risked 771.")


14 Resource to Reserve to Production Conversions Resource to Reserve Conversion (% of Total Volumes) (1) March 31, 2013 December 31, 2014 December 31, 2015 December 31, 2015 YoY Category MMBOE % Liquids NPV10 ($MM) MMBOE NPV10 ($MM) PDP % $ % 60% 1P % $2, % -7% 2P % $6, % -8% 2C - Risked % $2,790.0 n/a n/a 2C - Unrisked % $2, % -32% Prosp. Res. - Risked % $1,071.0 n/a n/a Prosp. Res. - Unrisked % $2, % -34% *NPV10 values are before tax. 2P Reserves have been recognized on ~15% of 7G lands with Best Estimate Contingent resources recognized on a further ~20% (1) Based upon reports prepared by McDaniel, the Company s independent qualified reserves evaluator, evaluating the reserves, contingent resources and prospective resources, attributable to the Company s properties effective as at March 31, 2013, December 31, 2014 and December 31, 2015, respectively. Un-risked volumes have been provided herein for comparison purposes. For details regarding the risked and un-risked estimates that are provided herein and for other important information regarding the Company s independently evaluated reserves, contingent resources and prospective resources, please refer to the Important Notice at the beginning of this presentation. April 2016 Seven Generations Energy Ltd. 14

15 Infrastructure to Support Improved Well Results Within the Nest Number of Wells Gas (MMcf/d) Condensate (bbls/d) Total (boe/d) - Rates are raw gas and condensate and are field estimates as of Feb 1st, 2016 and are not normalized for lateral length. - Producing days only include days that a well had some quantity of gas or condensate production. Condensate Yield (bbls/mmcf) Jan 16 Nov 14 Jan 16 Nov 14 Jan 16 Nov 14 Jan 16 Nov 14 Jan 16 Nov 14 IP ,537 1, IP ,444 1, IP ,221 1, IP , IP , April 2016 Seven Generations Energy Ltd. 15
16 Upgraded Nest 2 Type Curves Flatter decline profiles due to intentional choking during flowback ( slowback ) Higher liquids yield over first year in upgraded curves (118 vs. 92 bbls/mmcf condensate-gas ratio) Lateral length increased to 2450m from 2200m Number of stages and proppant tonnage per stage held static at 28 stages and 120 tonnes respectively Sustainability through flatter declines and higher liquids yields Key assumptions: - Non-producing days have been removed. All data is normalized to 28 stages. Normalization assumes directly proportional relationship between completed stage number and productivity. - Wells with significant deviation in completions techniques have been excluded. - All data is raw well head data; condensate has been adjusted for composition. Note: For important information regarding type curves shown in this presentation please refer to the Important Notice at the beginning of this presentation. April 2016 Seven Generations Energy Ltd. 16
17 Exit 1st year (12th mth avg) Average 1st Year Inputs Supply cost (NPV15) NPV10 IRR Individual Well Economics: Upgraded Nest 2 Type Curve Flat pricing: $50 US/bbl WTI, $2.80 US/MMBTU NYMEX, $0.76 USD/CAD, all pre-tax 2014 Nest 2 type curve Upgraded base type curve 2015 Nest 2 type curve YOY + higher tonnage + tighter frac stage spacing Combined = high intensity INDIVIDUAL WELL ECONOMICS 1 (A) (B) (A+B) WELL ASSUMPTIONS Production sensitivities using new base type curve Half-cycle 2 (%) 57% 87% +53% 102% 128% 131% Full-cycle 3 (%) 15% 42% 50% 62% 59% Half-cycle 2 ($MM) % Full-cycle 3 ($MM) Half-cycle 2 (US$/MMBTU) $1.24 $ % $0.00 <$0.00 <$0.00 Full-cycle 3 (US$/MMBTU) $2.80 $1.71 $1.46 $1.33 $1.50 Lateral Length (m) 2,200 2, % 2,700 2,700 2,700 Stage Count (#) % Tonnage (Tonnes/stage) % EUR (Mboe) 1,768 1, % 2,122 2,122 2,122 Well cost (drill & complete) ($MM) $12.0 $11.0-8% $12.0 $12.0 $13.3 Well cost (tie & equip) ($MM) $1.00 $1.00 0% $1.00 $1.00 $1.00 Condensate Gas Ratio (bbls/mmcf) % Condensate Production (bbls/d) % Raw Gas Production (mcf/d) 4,502 3,986-11% 4,576 5,130 5,858 Condensate Gas Ratio (bbls/mmcf) % Condensate Production (bbls/d) % Raw Gas Production (mcf/d) 2,625 2, % 3,372 3,781 4,317 1) Price assumptions: $50 US/bbl WTI, $2.80 US/MMbtu NYMEX HH and $0.76 USD/CAD. NGL s as % of WTI: C3 35%, C4 50%, Alberta C5+ 93%. Chicago gas discount $0.01 to NYMEX HH. Unit transportation costs: sales gas US$0.92/Mcf. Recovered liquids: $5.80/bbl. Average opex (first 3 years) = $3.88/boe. $6.8 MM natural gas deep drilling credit for 2,450m lateral. 15% raw gas shrink. Supply cost is the NYMEX Henry Hub price required for a 15% pre-tax IRR. 2) Half-cycle economics: include only the cost to drill, complete, tie & equip a well. No costs for central processing, regional gathering, condensate stabilization, other infrastructure, land acquisition, corporate overhead (G&A), financing or corporate taxes are included. These economics are intended to represent the marginal return of a single well investment on an existing super pad. 3) Full-cycle economics: include the following additional cost assumptions: 5% higher well costs to carry a 1-in-20 chance of mechanical failure on a well. $4.10/boe burden to carry infrastructure costs including central plant processing (NGL extraction), super pad build, regional gathering & sales pipelines and condensate stabilization. $0.90/boe burden to carry corporate overhead (G&A). Land acquisition, financing costs and corporate taxes have been excluded. Time value for sunk investments has also been excluded; the period of time required to acquire, test and delineate the lands prior to commercial development has not been factored into this analysis. It assumes a forward-looking development with existing knowledge of the risk profile of 7G s Nest lands, including but not limited to reservoir deliverability, liquid-gas ratios, H2S content, gas and liquids compositions, and also assumes available pipeline transportation capacity with firm gas and liquids transportation. Note: For important information regarding type curves shown in this presentation please refer to the Important Notice at the beginning of this presentation. April 2016 Seven Generations Energy Ltd. 17
18 Individual Well Economics: IRR Sensitivities (half-cycle, pre-tax) Current Hedge Position Assumptions: - NGL s as % of WTI: C3 35%, C4 50%, Alberta C5+ 93%. Chicago gas discount $0.01 to NYMEX HH. Unit transportation costs: sales gas US$0.92/Mcf. Recovered liquids: $5.80/bbl. Average opex (first 3 years) = $3.88/boe. $6.8 MM natural gas deep drilling credit pool for 2450m lateral. 15% raw gas shrink. - Half-cycle economics: include only the cost to drill, complete, tie & equip a well. No costs for central processing, regional gathering, condensate stabilization, other infrastructure, land acquisition, corporate overhead (G&A), financing or corporate taxes are included. Ongoing commitment to reducing gas supply costs April 2016 Seven Generations Energy Ltd. 18


19 Drilling & Completions Cost Performance Average Drilling & Completion Costs Drilling Costs & Lateral Length Completion Costs per Tonne Drilling Costs per Lateral Metre Note: Only includes Montney Nest wells. Improving unit cost performance through optimization and efficiency April 2016 Seven Generations Energy Ltd. 19
20 Drilling Improvements: Avg. Well Cost & Time vs. Depth 40% increase in lateral length with approximately 35% lower drill cost Reduced drilling time from 67 days to 31 days for a 13% longer measured depth Resulting improvement of 55% from $4,240/m lateral to $1,915/m lateral Recent 7G pacesetter record well #7 on Pad 23 established a new cost benchmark of $1,590/m lateral. This equates to $3.5 MM for a 2,200 m lateral, and $4.8 MM for a 3,000m lateral. Continued improvement in drilling efficiencies April 2016 Seven Generations Energy Ltd. 20
 Additional firm capacity with TransCanada in 2018 2015 rich gas averaging ~45% of total corporate production Enough Nest 2 resource to fulfill the")
21 Production Growth Plans: Transportation and Processing Arrangements Transporting rich gas production on the Alliance pipeline system with Aux Sable processing arrangement McDaniel estimated 2016 avg 2P gas volumes (Dec 31, 2015 reserve report) Additional firm capacity with TransCanada in rich gas averaging ~45% of total corporate production Enough Nest 2 resource to fulfill the transportation commitments through 2022 and beyond *McDaniel estimates representing volumes at Alliance receipt point Firm transportation agreements paving the way to profitable growth April 2016 Seven Generations Energy Ltd. 21
 Chicago gas sales (B) Dehydrated gas via 7G s gathering system Rich gas via")
 Production (% of Total Production) Sales")
 Sales Gas (MMcf/d) 197 149 79 (42%) (41%) (42%) (C)")
 (E) Chicago NGLs (bbl/d) 14,948 11,971 6,152 (19%) (20%) (20%) Total Production (boe/d) 77,699")
 130 142 140 AB condensate sales (C) - NGL Yield (bbl/mmcf) 97 96 88 AB NGL sales (D) -")
22 Efficiently Delivering Resource to Markets 7G Super Pad 7G Lator Shallow Cut Processing Aux Sable Chicago Processing (A) Chicago gas sales (B) Dehydrated gas via 7G s gathering system Rich gas via Alliance Pipeline Chicago NGL sales (Conway Pricing) (E) Wellhead liquids via 7G gathering system NGLs from stabilizer Condensate + portion of NGLs (truck & pipeline) Production (% of Total Production) Sales Streams Q (A) Rich Gas (MMcf/d) G Condensate Stabilizer Condensate to Pembina via 7G gathering system & trucks Pembina (B) Sales Gas (MMcf/d) (42%) (41%) (42%) (C) Condensate (bbl/d) 25,572 21,204 11,061 (33%) (35%) (35%) (D) AB NGLs (bbl/d) 4,288 2, (6%) (4%) (3%) (E) Chicago NGLs (bbl/d) 14,948 11,971 6,152 (19%) (20%) (20%) Total Production (boe/d) 77,699 60,403 31,217 Sales Yields Q Cond. Yield (bbl/mmcf) AB condensate sales (C) - NGL Yield (bbl/mmcf) AB NGL sales (D) - Process Shrink % April 2016 Seven Generations Energy Ltd. 22
23 APPENDIX
24 Seven Generations - Level 1 Corporate Policy Statement We believe that Companies have only the rights given to them by society. While people have a natural entitlement to basic rights, corporations are an instrument created by society to provide its needs and ought to have no expectation of basic entitlements other than equitable rights with other corporations, including those wholly owned by a person. We recognize that rights, sufficient to build and operate an energy project, can be granted and taken away by society. Over the longer term, companies can only expect to thrive if they serve the legitimate needs of society in which they exist. To thrive, companies must differentiate; rise above the pack, standout as being among the best with all of their stakeholders. At Seven Generations Energy Ltd., we acknowledge this granted entitlement and accept from our stakeholders a duty to thrive and an understanding of the need to differentiate. Specifically, in acceptance of this challenge to differentiate with all stakeholders, we acknowledge: The need of society for us to conduct our business in a way that protects the natural beauty of the environment and preserves the capacity of the earth to meet the needs of present and future generations; The need of Canada and Alberta for us to obey all regulations and to proactively assist with the formulation of new policy that enables our company and our industry to better serve society, The need of the communities, where we operate, to be engaged in the planning of our projects and to participate in the benefits arising from them as they are built and operated, The need of our business partners and infrastructure customers to be treated fairly and attentively, The need of our suppliers and service providers to be treated fairly and paid promptly for equipment and services provided to us and to receive feedback from us that can help them to be competitive and thrive in their businesses, The need of our employees to be compensated fairly and provided a safe, healthy and happy work environment including a healthy work life outside life balance, and, The need of our shareholders to have their investment managed responsibly and ethically and to earn strong returns. We see ourselves as being in the service business, serving the needs of our stakeholders. We seek satisfaction for all stakeholders. Differentiation is imperative. We support an open and competitive business environment, recognizing in that competitive world, only those who best serve their stakeholders can expect the support required to survive for the longer term. April 2016 Seven Generations Energy Ltd. 24
25 Selected Financial and Operational Information OPERATING Q Q Q Q Q Q Q Q YE 2015 YE 2014 Average daily production Condensate & oil (bbls/d) 25,572 22,606 20,702 15,810 14,747 12,580 9,264 7,554 21,204 11,061 NGLs (bbls/d) 19,236 14,094 11,914 12,042 10,783 8,289 4,741 4,054 14,341 6,989 Natural gas (MMcf/d) Total (boe/d) 77,699 60,600 54,219 48,768 44,178 35,820 23,999 20,231 60,403 31,136 Realized prices Condensate & oil (C$/bbl) NGLs (C$/bbl) Natural gas (C$/mcf) FINANCIAL Condensate & oil revenues ($ 000) 110, , ,592 67,707 94, ,628 82,049 62, , ,512 NGLs revenues ($ 000) 20,532 10,362 10,608 9,413 21,329 19,416 10,418 10,307 52,781 61,470 Natural gas revenues ($ 000) 47,796 37,083 30,983 31,420 39,181 35,920 28,282 25, , ,851 Total revenues ($ 000) 178, , , , , , ,749 98, , ,833 Royalties ($ 000) (12,127) (17,704) (12,886) (15,181) (16,145) (20,925) (9,434) (5,386) (57,898) (51,890) Operating expense ($ 000) (29,378) (26,819) (23,537) (21,454) (18,966) (14,245) (9,659) (11,391) (101,188) (54,261) Transportation expense ($ 000) (23,984) (13,493) (9,893) (12,966) (13,237) (7,277) (7,693) (6,626) (60,336) (34,833) Netback prior to hedging ($ 000) 112,989 91, ,867 58, , ,517 93,963 75, , ,849 Realized hedging gain (loss) ($ 000) 22,980 35,262 41,683 50,655 22,163 (148) (6,873) (5,405) 150,580 9,737 Netback after hedging ($ 000) 135, , , , , ,369 87,090 69, , ,586 General and administrative expense ($ 000) (7,128) (5,450) (5,136) (6,629) (7,393) (4,457) (5,233) (3,175) (24,343) (20,258) Interest, processing and other ($ 000) (22,810) (26,625) (18,619) (16,076) (20,302) (6,618) (15,885) (12,590) (84,130) (55,395) Funds from operations (1) ($ 000) 106,031 94, ,795 86, , ,294 65,972 54, , ,933 Netbacks (1) Oil and natural gas revenue ($/boe) Royalties ($/boe) (1.70) (3.18) (2.61) (3.46) (3.97) (6.35) (4.32) (2.96) (2.63) (4.57) Operating expense ($/boe) (4.11) (4.81) (4.77) (4.89) (4.67) (4.32) (4.42) (6.26) (4.59) (4.77) Transportation expense ($/boe) (3.36) (2.42) (2.00) (2.95) (3.26) (2.21) (3.52) (3.64) (2.74) (3.06) Operating netback prior to hedging ($/boe) Realized hedging gain (loss) ($/boe) (0.04) (3.15) (2.97) Operating netback (1) ($/boe) General and administrative expense ($/boe) (1.00) (0.98) (1.04) (1.52) (1.82) (1.35) (2.4) (1.74) (1.10) (1.78) Interest, processing and other ($/boe) (3.19) (4.78) (3.77) (3.66) (5.00) (2.01) (7.27) (6.91) (3.82) (4.87) Cash flow netback ($/boe) Capital investments Land ($ 000) 2,169 1, ,200 1,408 30,057 9,019 5,138 48,684 Drilling and completions ($ 000) 181, , , , , , , , , ,019 Facilities and equipment ($ 000) 114, , , , ,610 90,447 34,172 65, , ,035 Other ($ 000) 3,719 3,084 3,299 2,018 1,948 1,689 1,531 1,430 12,100 6,598 Total capital investments (2) ($ 000) 301, , , , , , , ,549 1,308,973 1,120,336 1) See Non-IFRS Measures Advisory on page 2 2) Before dispositions April 2016 Seven Generations Energy Ltd. 25
26 Hedge Position as of March 31st, 2016 Hedge Position March 31, Q Q Q Q FY 2016 Q Q Q Q FY 2017 Q Q Q Q FY 2018 Liquids Hedging WTI Hedged (bbl/d)** 12,000 13,000 14,000 14,000 13,250 12,000 9,000 9,000 9,000 9,750 10,000 10,000 5,000 4,000 7,250 Average Floor (CAD/bbl) $ $ $ $ $ $ $ $ $ $ $ $ $ $ $ Average Ceiling (CAD/bbl) $ $ $ $ $ $ $ $ $ $ $ $ $ $ $ Gas Hedging Gas Hedged (MMbtu/d) 120, , , , , , ,000 90,000 90, ,000 60,000 50,000 40,000 40,000 47,500 Average Chi CG Swap (USD/MMbtu) $ 3.20 $ 3.20 $ 3.20 $ 3.18 $ 3.19 $ 3.20 $ 3.17 $ 2.99 $ 2.99 $ 3.10 $ 2.85 $ 2.81 $ 2.76 $ 2.76 $ 2.80 Average Swap (CAD/MMbtu)* $ 4.01 $ 4.01 $ 4.01 $ 4.01 $ 4.01 $ 4.03 $ 4.04 $ 3.95 $ 3.95 $ 4.00 $ 3.87 $ 3.84 $ 3.81 $ 3.81 $ 3.83 FX Hedging USD Notional Hedged (MM) $ $ $ $ $ $ $ $ $ $ $ $ $ $ $ Average Rate $ $ $ $ $ $ $ $ $ $ $ $ $ $ $ * Chicago Citygate converted to Average CAD/USD hedge rate **Includes 2,000 bbl/d of sold $40/bbl puts on 3-way collars for both Apr17-Dec18 and FY April 2016 Seven Generations Energy Ltd. 26
27 Well Results within the Nest Nest 2 Gas C5+ Total C5 +Yield Wells Mcf/d bbls/d boe/d bbl/mmcf (#) IP30 4, , IP90 4, , IP180 4, , IP270 4, , IP365 4, , Nest 1 Gas C5+ Total C5 +Yield Wells Mcf/d bbls/d boe/d bbl/mmcf (#) 2, , , , , , Rates are raw gas and condensate and are field estimates as of Feb 1st, 2016 and are not normalized for lateral length. - Producing days only include days that a well had some quantity of gas or condensate production. April 2016 Seven Generations Energy Ltd. 27


28 Inventory of Nest 1 and Nest 2 Montney Wells Nest 1 Drilling Phase Completion Phase Tie-in Phase In Progress Well Inventory Producing Wells Wells down due to Concurrent Ops July 1, October 1, January 1, Nest 2 Drilling Phase Completion Phase Tie-in Phase In Progress Well Inventory Producing Wells Wells down due to Concurrent Ops July 1, October 1, January 1, Total Nest Drilling Phase Completion Phase Tie-in Phase In Progress Well Inventory Producing Wells Wells down due to Concurrent Ops July 1, October 1, January 1, *Well activity shown includes only Upper/Middle Montney wells in the Nest Area. April 2016 Seven Generations Energy Ltd. 28
29 Nest 2 Type Curve Raw Gas Production vs. Producing Wells Key assumptions: - Non-producing days have been removed. All data is normalized to 28 stages. Normalization assumes directly proportional relationship between completed stage number and productivity. - Wells with significant deviation in completions technique have been excluded. - All data is raw well head data; condensate has been adjusted for composition. Note: For important information regarding type curves shown in this presentation please refer to the Important Notice at the beginning of this presentation. April 2016 Seven Generations Energy Ltd. 29

30 Nest 2 Type Curve Wellhead Condensate vs. Producing Wells Key assumptions: - Non-producing days have been removed. All data is normalized to 28 stages. Normalization assumes directly proportional relationship between completed stage number and productivity. - Wells with significant deviation in completions technique have been excluded. - All data is raw well head data; condensate has been adjusted for composition. Note: For important information regarding type curves shown in this presentation please refer to the Important Notice at the beginning of this presentation. April 2016 Seven Generations Energy Ltd. 30


, BC Ministry of Energy &")
 April 2016 Lands as of 4/30/15 Seven")
31 Sweet Spot of the Montney Over Pressured High Productivity Brittle Rock High Recovery Factor Thickness Large Resources in Place Lower Temperature High Liquids Content Sources: Canadian Discovery & GDGC (2008, 2011), & Steven Burnie (2011), BC Ministry of Energy & Mines, Alberta Geological Survey (modified by RBC & 7G) April 2016 Lands as of 4/30/15 Seven Generations Energy Ltd. 31
32 Diaber Woodbend Smoky Paleozoic Devonian Mesozoic Triassic Sch ooler Ck. Jurrassic Fernie B u llh e a d Fort St. John Cretaceous Upside Potential from Upper Montney Extension and Secondary Targets Badheart Muskiki Cardium Kaskapau (1WS + 2WS) Dunvegan* Base of Fish Scales Paddy Cadotte* Harmon Notikewin Falher* Wilrich Bluesky Gething* Cadomin* Nikanassin Fernie Nordegg Charlie Lake* Halfway* Doig Montney (Siltstone) Ireton Duvernay Majeau Lake Cardium 1WS 2WS Dunvegan* Cadotte* Falher* Wilrich Gething* Cadomin* Nikanassin Nordegg Zone Charlie Lake* Upper Montney 422,240 Lower 7G ACREAGE HELD BY ZONE (March 31, 2016) Gross Gross Net Net Acres Acres Sections Sections Average WI 62,080 57, % 65,280 60, % 65,280 60, % 59,200 54, % 74,080 69, % 72,160 68, % 72,160 68, % 97,280 94, % 94,400 91, % 330, , % 335, , % 399, , % 416, % Duvernay 256, , % TOTAL ACREAGE (1) 440, , % Note: For illustrative purposes, not to scale. *Commingling Potential Sandstones/Siltstones Organic Rich Shales/Shales Carbonates (1) Totals are not additive due to overlapping rights. Source: Company Data Significant additional potential from conventional zones and emerging tight targets exist across 7G s land base in addition to the opportunity presented by the further lateral delineation of its extensive Upper Montney position April 2016 Seven Generations Energy Ltd. 32
 Testing wells with 80")


33 Next Steps in Well Optimization: High Intensity Completions Tighter frac stage spacing 2015 average stage spacing of metres (28 stages per 2800m 3000m well) Testing wells with 80 metre stage spacing (35 38 stages per 2800m 3000m well) in late 2015 & Budget includes extra costs to test. Larger proppant tonnages Historical frac intensity of 120 tonnes per stage 2016 capital guidance assumes higher tonnage completions of 160 tonnes per stage for all wells Wider spacing: 4 stages per every 400m (1300 ) of lateral Tighter spacing: 5 stages per every 400m (1300 ) of lateral Larger stimulated reservoir volume cloud with more proppant placed Increased return on investment through tighter spacing and higher proppant tonnages April 2016 Seven Generations Energy Ltd. 33
34 Important Notice Abbreviations: AB AECO bcf avg bbl or bbls boe Btu CAD or C$ CAGR C3 C4 C5+ d EUR ft FX FY GJ H1 H2 H2S HH Hz IP 30 IP 90 IP 180 IP 270 IP 365 IPO IRR km Alberta physical storage and trading hub for natural gas on the TransCanada Alberta transmission system which is the delivery point for various benchmark Alberta index prices billion cubic feet average barrels or barrels barrels of oil equivalent British thermal units Canadian dollars compound annual growth rate propane butane pentanes plus day estimated ultimate recovery, based on a minimum production cutoff feet foreign exchange rate full year Gigajoules first half of the year second half of the year hydrogen sulfide Henry Hub horizontal initial production for the first 30 days initial production for the first 90 days initial production for the first 180 days initial production for the first 270 days initial production for the first 365 days initial public offering internal rate of return kilometres kpa m Mboe Mcf mth MM MMboe MMbtu MMcf Nest Nest 1 Nest 2 NGL NPV NPV10 NPV15 NYMEX OPEX PDP Prospectus psi P50 Pros. Res. scf USD or US$ WI WTI YOY YTD 1P 2P 2C $MM or MM$ Δ Kilopascals metres thousands of barrels of oil equivalent thousand cubic feet month million million barrels of oil equivalent millions British thermal units million cubic feet Both the Nest 1 and Nest 2 areas combined The area that is contained within the primary development block of the Kakwa River Project that is shown as Nest 1 on slide 14 The higher return prospects that are contained within the primary development block of the Kakwa River Project that is shown as Nest 2 on slide 14 natural gas liquids net present value net present value discounted at an annual 10% discount rate net present value discounted at an annual 15% discount rate New York Mercantile Exchange operating expense proved developed producing reserves supplemented PREP Prospectus filed by the company on October 29, 2014 pounds per square inch An estimated probability of 50% gross prospective resources (best estimate) standard cubic foot United Stated dollars working interest West Texas Intermediate year over year year to date gross total proved reserves gross total proved plus probable reserves gross contingent resources (best estimate) millions of dollars change April 2016 Seven Generations Energy Ltd. 34

35
Corporate Presentation
 TSX: VII.TO Corporate Presentation January 2017 Important Notice General Advisory The information contained in this presentation does not purport to be allinclusive or contain all information that readers
Corporate Presentation
 TSX: VII.TO Corporate Presentation March 2017 Important Notice General Advisory The information contained in this presentation does not purport to be allinclusive or contain all information that readers
Corporate Presentation
 TSX: VII.TO Corporate Presentation January 2017 Important Notice General Advisory The information contained in this presentation does not purport to be all-inclusive or contain all information that readers
Seven Generations board approves $1.25 billion capital budget in 2019
 JANUARY 10, 2019 TSX: VII Seven Generations board approves $1.25 billion capital budget in 2019 Includes $1.1 billion to maintain production and $150 million for infrastructure and delineation projects
Seven Generations sharpens focus on returns in multi-year, fully-funded organic growth plan with expanded core drilling inventory
 NEWS RELEASE TSX: VII Seven Generations sharpens focus on returns in multi-year, fully-funded organic growth plan with expanded core drilling inventory Capital investment drives 7G towards 100,000 boe/d
Corporate Presentation
 Corporate Presentation April 2017 TSX: VII.TO Overview & 2017 Guidance Ticker symbol Capitalization TSX: VII 2017 Guidance Production (% Liquids) (Mboe/d) 180 190 (55-60%) Average Daily Trading Volume
Corporate Presentation
 TSX: VII.TO Corporate Presentation May 2017 Overview & 2017 Guidance Ticker symbol Capitalization TSX: VII 2017 Guidance Production (% Liquids) (Mboe/d) 180 190 (55-60%) Average Daily Trading Volume (1)
CEQUENCE ENERGY ANNOUNCES OPERATIONAL UPDATE AND 2014 RESERVES AND FINANCIAL AND OPERATING RESULTS
 CEQUENCE ENERGY ANNOUNCES OPERATIONAL UPDATE AND 2014 RESERVES AND FINANCIAL AND OPERATING RESULTS CALGARY, March 5, 2015 Cequence Energy Ltd. ("Cequence" or the "Company") (TSX: CQE) is pleased to announce
CEQUENCE ENERGY LTD. ANNOUNCES OVER 36 % GROWTH IN RESERVES AND RESERVE VALUE AND FOURTH QUARTER AND YEAR END 2011 RESULTS
 CEQUENCE ENERGY LTD. ANNOUNCES OVER 36 % GROWTH IN RESERVES AND RESERVE VALUE AND FOURTH QUARTER AND YEAR END 2011 RESULTS CALGARY, March 8, 2012 Cequence Energy Ltd. ("Cequence" or the "Company") (TSX:
CHINOOK ENERGY INC. ANNOUNCES FOURTH QUARTER 2016 RESULTS AND PROVIDES OPERATIONAL UPDATE
 CHINOOK ENERGY INC. ANNOUNCES FOURTH QUARTER 2016 RESULTS AND PROVIDES OPERATIONAL UPDATE CALGARY, ALBERTA March 23, 2017 Chinook Energy Inc. ("our", "we", or "us") (TSX: CKE) is pleased to announce its
CEQUENCE ENERGY ANNOUNCES 35% GROWTH IN RESERVES AND 2012 FINANCIAL AND OPERATING RESULTS
 CEQUENCE ENERGY ANNOUNCES 35% GROWTH IN RESERVES AND 2012 FINANCIAL AND OPERATING RESULTS CALGARY, March 7, 2013 Cequence Energy Ltd. ("Cequence" or the "Company") (TSX: "CQE") is pleased to announce its
September 28, 2018 SEPTEMBER PRESENTATION
 September 28, 2018 SEPTEMBER PRESENTATION BIGSTONE PROLIFIC, LIQUIDS RICH MONTNEY Pure play MONTNEY E&P company with WORLD CLASS ASSETS: Successful delineation drilling to the west and south Growing condensate
Year-end 2017 Reserves
 Year-end 2017 Reserves Baytex's year-end 2017 proved and probable reserves were evaluated by Sproule Unconventional Limited ( Sproule ) and Ryder Scott Company, L.P. ( Ryder Scott ), both independent qualified
DELPHI ENERGY RELEASES YEAR END 2015 RESERVES
 DELPHI ENERGY RELEASES YEAR END 2015 RESERVES CALGARY, ALBERTA February 29, 2016 Delphi Energy Corp. ( Delphi or the Company ) is pleased to report its crude oil and natural gas reserves information for
CEQUENCE ENERGY ANNOUNCES 2015 INDEPENDENT RESERVES EVALUATION
 CEQUENCE ENERGY ANNOUNCES 2015 INDEPENDENT RESERVES EVALUATION CALGARY, February 22, 2016 Cequence Energy Ltd. ("Cequence" or the "Company") (TSX: CQE) is pleased to announce the results of its year end
May 2018 HIGH-MARGIN, LIQUIDS-RICH PRODUCTION IN THE WORLD- CLASS MONTNEY BIGSTONE REGION
 May 2018 HIGH-MARGIN, LIQUIDS-RICH PRODUCTION IN THE WORLD- CLASS MONTNEY BIGSTONE REGION WHY OWN DELPHI. Pure play MONTNEY E&P company with WORLD CLASS ASSETS: Robust well economics driven by: High condensate
Q First Quarter Report
 Q1 2017 First Quarter Report Financial and Operating Highlights 2017 2016 Financial ($000, except as otherwise indicated) Sales including realized hedging $ 72,957 $ 41,625 Funds from operations $ 53,972
BAYTEX REPORTS 2016 RESULTS, STRONG RESERVES GROWTH IN THE EAGLE FORD AND RESUMPTION OF DRILLING ACTIVITY IN CANADA
 BAYTEX REPORTS 2016 RESULTS, STRONG RESERVES GROWTH IN THE EAGLE FORD AND RESUMPTION OF DRILLING ACTIVITY IN CANADA CALGARY, ALBERTA (March 7, 2017) - Baytex Energy Corp. ("Baytex")(TSX, NYSE: BTE) reports
2017 Annual Report. Financial and Operating Highlights
 2017 Annual Report Financial and Operating Highlights Three months ended 2017 2016 2017 2016 Financial ($000, except as otherwise indicated) Sales including realized hedging $ 65,779 $ 71,090 $ 259,611
January 2018 HIGH-MARGIN, LIQUIDS-RICH PRODUCTION IN THE WORLD- CLASS MONTNEY BIGSTONE REGION
 January 2018 HIGH-MARGIN, LIQUIDS-RICH PRODUCTION IN THE WORLD- CLASS MONTNEY BIGSTONE REGION WHY OWN DELPHI. Pure play MONTNEY E&P company with WORLD CLASS ASSETS: Robust well economics driven by: High
BAYTEX ANNOUNCES CLOSING OF STRATEGIC COMBINATION WITH RAGING RIVER, UPDATED 2018 GUIDANCE AND CONFIRMATION OF PRELIMINARY 2019 PLANS
 BAYTEX ANNOUNCES CLOSING OF STRATEGIC COMBINATION WITH RAGING RIVER, UPDATED 2018 GUIDANCE AND CONFIRMATION OF PRELIMINARY 2019 PLANS CALGARY, ALBERTA (August 22, 2018) Baytex Energy Corp. ( Baytex )(TSX,
Athabasca Oil Corporation Announces 2018 Year end Results
 FOR IMMEDIATE RELEASE March 6, 2019 Athabasca Oil Corporation Announces 2018 Year end Results CALGARY Athabasca Oil Corporation (TSX: ATH) ( Athabasca or the Company ) is pleased to provide its 2018 year
A SPRINGBOARD FOR GROWTH
 A SPRINGBOARD FOR GROWTH May 2011 1 TSX:PXX OMX:PXXS www.blackpearlresources.ca Cautionary Statements FORWARD LOOKING STATEMENTS This presentation contains certain forward looking statements and forward
Corporate Presentation. August 2016
 Corporate Presentation August 2016 Future Oriented Information (See additional advisories at the end of this document) In the interest of providing information regarding Paramount Resources Ltd. ("Paramount"
Corporate Presentation. April, 2017
 Corporate Presentation April, 2017 Future Oriented Information (See additional advisories at the end of this document) In the interest of providing information regarding Paramount Resources Ltd. ("Paramount"
Bank of America Merrill Lynch 2016 Energy Credit Conference
 Bank of America Merrill Lynch 2016 Energy Credit Conference New York, New York, June 8, 2016 Rod Gray Chief Financial Officer Advisory Forward-Looking Statements In the interest of providing Baytex's shareholders
CEQUENCE ENERGY ANNOUNCES OPERATIONAL UPDATE, 2016 FINANCIAL AND OPERATING RESULTS AND RESERVES
 CEQUENCE ENERGY ANNOUNCES OPERATIONAL UPDATE, 2016 FINANCIAL AND OPERATING RESULTS AND RESERVES CALGARY, March 13, 2017 Cequence Energy Ltd. ("Cequence" or the "Company") (TSX: CQE) is pleased to provide
April 2018 HIGH-MARGIN, LIQUIDS-RICH PRODUCTION IN THE WORLD- CLASS MONTNEY BIGSTONE REGION
 April 2018 HIGH-MARGIN, LIQUIDS-RICH PRODUCTION IN THE WORLD- CLASS MONTNEY BIGSTONE REGION WHY OWN DELPHI. Pure play MONTNEY E&P company with WORLD CLASS ASSETS: Robust well economics driven by: High
Corporate Presentation. March 2017
 Corporate Presentation March 2017 Future Oriented Information (See additional advisories at the end of this document) In the interest of providing information regarding Paramount Resources Ltd. ("Paramount"
SURVIVE TO THRIVE 2016 CAPP SCOTIABANK INVESTMENT SYMPOSIUM
 SURVIVE TO THRIVE 2016 CAPP SCOTIABANK INVESTMENT SYMPOSIUM April 12, 2016 1 CORPORATE PROFILE Corporate Summary Q4/2015 Avg. Daily Production 67,934 boe/d Production Mix 1 ~60% liquids/40% gas Corporate
2011 Annual Report. Non-Consolidated Financial and Operating Highlights (1) Year ended December 31, Three months ended December 31, 2010
 Year ended December 31, Three months ended December 31, 2010") 2011 Annual Report Non-Consolidated Financial and Operating Highlights (1) Three months ended December 31, 2011 Three months ended December 31, 2010 December 31, 2011 December 31, 2010 Financial ($000,
2011 Annual Report Non-Consolidated Financial and Operating Highlights (1) Three months ended December 31, 2011 Three months ended December 31, 2010 December 31, 2011 December 31, 2010 Financial ($000,
May 22, 2018 AGM PRESENTATION
 May 22, 2018 AGM PRESENTATION BIGSTONE PROLIFIC, LIQUIDS RICH MONTNEY Pure play MONTNEY E&P company with WORLD CLASS ASSETS: Successful delineation drilling to the west and south Growing condensate production
Advantage Announces 2011 Year End Financial Results and Provides Interim Guidance
 Press Release Page 1 of 10 Advantage Oil & Gas Ltd Advantage Announces 2011 Year End Financial Results and Provides Interim Guidance (TSX: AAV, NYSE: AAV) CALGARY, ALBERTA, March 22, 2012 ( Advantage or
DELPHI ENERGY CORP. REPORTS 2018 YEAR END RESERVES
 DELPHI ENERGY CORP. REPORTS 2018 YEAR END RESERVES CALGARY, ALBERTA March 4, 2019 Delphi Energy Corp. ( Delphi or the Company ) is pleased to announce its crude oil and natural gas reserves information
BELLATRIX ANNOUNCES 2018 YEAR END RESERVES HIGHLIGHTED BY 13% RESERVE GROWTH AND LOW COST RESERVE ADDITIONS
 For Immediate Release Calgary, Alberta TSX: BXE BELLATRIX ANNOUNCES 2018 YEAR END RESERVES HIGHLIGHTED BY 13% RESERVE GROWTH AND LOW COST RESERVE ADDITIONS CALGARY, ALBERTA (March 14, 2019) Bellatrix Exploration
NEWS RELEASE MARCH 1, 2018 VERMILION ENERGY INC. ANNOUNCES 2017 YEAR-END SUMMARY RESERVES AND RESOURCE INFORMATION
 NEWS RELEASE MARCH 1, 2018 VERMILION ENERGY INC. ANNOUNCES 2017 YEAR-END SUMMARY RESERVES AND RESOURCE INFORMATION Vermilion Energy Inc. ( Vermilion, the Company, We or Our ) (TSX, NYSE: VET) is pleased
TSXV: TUS September 8, 2015
 TSXV: TUS September 8, 2015 TSXV: TUS SEPTEMBER 8, 2015 2 Why Buy Tuscany Now? Tuscany has built a large inventory of horizontal oil locations on properties with significant potential oil in place 80 to
INPLAY OIL CORP. ANNOUNCES 2016 YEAR END RESERVES AND AN OPERATIONS UPDATE
 March 14, 2017 INPLAY OIL CORP. ANNOUNCES 2016 YEAR END RESERVES AND AN OPERATIONS UPDATE CALGARY, ALBERTA (March 14, 2017) InPlay Oil Corp. ("InPlay" or the "Company") (TSX:IPO) is pleased to present
ANNUAL INFORMATION FORM. For the Year Ended December 31, 2014
 ANNUAL INFORMATION FORM For the Year Ended December 31, 2014 March 10, 2015 TABLE OF CONTENTS CONVENTIONS... 2 EXCHANGE RATE INFORMATION... 2 FORWARD-LOOKING STATEMENTS... 2 ACCESS TO DOCUMENTS... 7 NOTE
Corporate Presentation. March 2018
 Corporate Presentation March 218 Advisory Regarding Forward-Looking Information and Statements This presentation contains forward-looking statements and forward-looking information within the meaning of
DELPHI ENERGY ANNOUNCES CLOSING OF DISPOSITION OF WAPITI ASSETS
 DELPHI ENERGY ANNOUNCES CLOSING OF DISPOSITION OF WAPITI ASSETS CALGARY, ALBERTA July 22, 2015 Delphi Energy Corp. ( Delphi or the Company ) is pleased to report that it has closed the previously announced
Corporate Presentation. January 2017
 Corporate Presentation January 2017 Future Oriented Information (See additional advisories at the end of this document) In the interest of providing information regarding Paramount Resources Ltd. ("Paramount"
BAYTEX REPORTS 2017 RESULTS WITH 26% INCREASE IN ADJUSTED FUNDS FLOW, 6% INCREASE IN RESERVES AND STRONG EAGLE FORD PERFORMANCE
 BAYTEX REPORTS 2017 RESULTS WITH 26% INCREASE IN ADJUSTED FUNDS FLOW, 6% INCREASE IN RESERVES AND STRONG EAGLE FORD PERFORMANCE CALGARY, ALBERTA (March 6, 2018) - Baytex Energy Corp. ("Baytex")(TSX, NYSE:
For Immediate Release Granite Oil Corp. Announces 2017 Record Year End Reserve Metrics and Operational Update
 For Immediate Release Granite Oil Corp. Announces 2017 Record Year End Reserve Metrics and Operational Update CALGARY, ALBERTA (Marketwired March 7, 2018) GRANITE OIL CORP. ( Granite or the Company ) (TSX:GXO)(OTCQX:GXOCF)
Premium Pipestone Asset Acquisition. August 9, 2018
 Premium Pipestone Asset Acquisition August 9, 2018 READER ADVISORY GENERAL A final short form prospectus containing important information relating to the offering (the "Offering") of subscription receipts
DELPHI ENERGY CORP. REPORTS 2017 YEAR END RESULTS AND RESERVES AND PROVIDES OPERATIONS UPDATE
 DELPHI ENERGY CORP. REPORTS 2017 YEAR END RESULTS AND RESERVES AND PROVIDES OPERATIONS UPDATE CALGARY, ALBERTA March 7, 2018 Delphi Energy Corp. ( Delphi or the Company ) is pleased to announce its financial
BAYTEX ANNOUNCES 2019 BUDGET
 BAYTEX ANNOUNCES 2019 BUDGET CALGARY, ALBERTA (December 17, 2018) - Baytex Energy Corp. ( Baytex ) (TSX, NYSE: BTE) announces that its Board of Directors has approved a 2019 capital budget of $550 to $650
DELPHI ENERGY CORP. REPORTS 2018 YEAR END RESULTS
 DELPHI ENERGY CORP. REPORTS 2018 YEAR END RESULTS CALGARY, ALBERTA March 13, 2019 Delphi Energy Corp. ( Delphi or the Company ) is pleased to announce its financial and operational results for the year
CEQUENCE ENERGY ANNOUNCES 2015 FINANCIAL AND OPERATING RESULTS
 CEQUENCE ENERGY ANNOUNCES 2015 FINANCIAL AND OPERATING RESULTS CALGARY, March 29, 2015 Cequence Energy Ltd. ("Cequence" or the "Company") (TSX: CQE) is pleased to announce its operating and financial results
Heavy Oil. Gems. November TSX:PXX; OMX:PXXS
 Heavy Oil TSX:PXX; OMX:PXXS November 2010 Gems www.blackpearlresources.ca 1 Introduction Corporate: Symbol: PXX, PXXS Exchanges: TSX, OMX Shares Outstanding (MM): Basic (1) 282.9 Fully Diluted(options
Seven Generations delivers $1.67 billion of adjusted funds flow, or $4.60 per share, up 36 percent in 2018
 FEBRUARY 28, 2019 Seven Generations delivers $1.67 billion of adjusted funds flow, or $4.60 per share, up 36 percent in 2018 Proved plus probable reserves valued at $12.3 billion by independent reserve
Record Q Production & Three Year Plan to Accelerate Pipestone Condensate Development
 Record Q3 2018 Production & Three Year Plan to Accelerate Pipestone Condensate Development Investor Presentation TSX: AAV December 2018 ADVANTAGE AT A GLANCE TSX 52 week trading range $1.82 $5.73 Shares
1 BIRCHCLIFF ENERGY LTD.
 BIRCHCLIFF ENERGY LTD. ANNOUNCES STRONG THIRD QUARTER 2018 RESULTS, STRATEGIC MONTNEY LAND ACQUISITION IN POUCE COUPE AND PRELIMINARY 2019 PLANS November 14, 2018, Calgary, Alberta Birchcliff Energy Ltd.
Obsidian Energy. Corporate Presentation. January 2018
 Obsidian Energy Corporate Presentation January 2018 Important Notices to the Readers This presentation should be read in conjunction with the Company's audited consolidated financial statements, management's
BELLATRIX EXPLORATION LTD. ANNOUNCES FOURTH QUARTER 2018 AND YEAR END FINANCIAL AND OPERATING RESULTS
 For Immediate Release TSX: BXE BELLATRIX EXPLORATION LTD. ANNOUNCES FOURTH QUARTER 2018 AND YEAR END FINANCIAL AND OPERATING RESULTS CALGARY, ALBERTA (March 14, 2019) - Bellatrix Exploration Ltd. ( Bellatrix,
RMP Energy Provides Second Quarter 2012 Financial and Operating Results
 NEWS RELEASE August 9, 2012 RMP Energy Provides Second Quarter 2012 Financial and Operating Results Calgary, Alberta RMP Energy Inc. ( RMP or the Company ) (TSX:RMP) today provided its financial and operating
Corporate Presentation. May 2016
 Corporate Presentation May 2016 Future Oriented Information (See additional advisories at the end of this document) In the interest of providing information regarding Paramount Resources Ltd. ("Paramount"
PETRUS RESOURCES ANNOUNCES FOURTH QUARTER AND YEAR END 2017 FINANCIAL & OPERATING RESULTS AND YEAR END RESERVE INFORMATION
 PETRUS RESOURCES ANNOUNCES FOURTH QUARTER AND YEAR END 2017 FINANCIAL & OPERATING RESULTS AND YEAR END RESERVE INFORMATION CALGARY, ALBERTA, Thursday, March 8 th, 2018 Petrus Resources Ltd. ( Petrus or
Driving New Growth TSX:PGF. Peters & Co Presentation September 11, 2018
 Driving New Growth Peters & Co Presentation September 11, 2018 Advisories Caution Regarding Forward Looking Information: This presentation contains forward-looking statements within the meaning of securities
Accelerating Condensate Development in the Heart of the Montney While Retaining Capital Flexibility
 Accelerating Condensate Development in the Heart of the Montney While Retaining Capital Flexibility Investor Presentation TSX: AAV March 2019 ADVANTAGE AT A GLANCE TSX 52-week trading range $1.80 - $4.80
Q First Quarter Report
 Q1 2018 First Quarter Report Financial and Operating Highlights 2018 2017 Financial ($000, except as otherwise indicated) Sales including realized hedging $ 73,378 $ 72,957 Net income and comprehensive
Q Second Quarter Report
 Q2 2018 Second Quarter Report Financial and Operating Highlights 2018 2017 2018 2017 Financial ($000, except as otherwise indicated) Sales including realized hedging (3) $ 45,319 $ 69,169 $ 118,697 $ 142,126
GMP FirstEnergy - Energy Growth Conference November 15, 2016 Toronto, Ontario. Senior Vice President, Capital Markets & Public Affairs
 GMP FirstEnergy - Energy Growth Conference November 15, 2016 Toronto, Ontario Brian Ector Senior Vice President, Capital Markets & Public Affairs Advisory Forward-Looking Statements In the interest of
TSX V: HME. Achieved a two year average F&D cost of $9.22/boe (including changes in FDC) for a recycle ratio of 1.8.
 for a recycle ratio of 1.8.") HEMISPHERE ENERGY INCREASES PROVED PLUS PROBABLE RESERVE VALUE BY 77% TO $116.6 MILLION (DISCOUNTED AT 10%), AND NET ASSET VALUE BY 68% TO $1.12 PER SHARE TSX V: HME Vancouver, British Columbia, March
HEMISPHERE ENERGY INCREASES PROVED PLUS PROBABLE RESERVE VALUE BY 77% TO $116.6 MILLION (DISCOUNTED AT 10%), AND NET ASSET VALUE BY 68% TO $1.12 PER SHARE TSX V: HME Vancouver, British Columbia, March
AMENDED RELEASE: BAYTEX REPORTS Q RESULTS
 AMENDED RELEASE: BAYTEX REPORTS Q1 2016 RESULTS CALGARY, ALBERTA (May 3, 2016) This release corrects and replaces the release sent for Baytex Energy Corp. at 7:30 AM EDT on May 3, 2016. The AECO Fixed
2016 Results and 2017 Outlook
 2016 Results and 2017 Outlook March 2, 2017 Cautionary Statement Regarding Forward-Looking Statements This presentation includes certain forward-looking statements and projections of EP Energy. EP Energy
PAINTED PONY ANNOUNCES A 52% INCREASE IN PROVED PLUS PROBABLE RESERVES TO 1.7 TCFE WITH A NET PRESENT VALUE DISCOUNTED AT 10% OF $1.
 1 FOR IMMEDIATE RELEASE March 4, 2014 PAINTED PONY ANNOUNCES A 52% INCREASE IN PROVED PLUS PROBABLE RESERVES TO 1.7 TCFE WITH A NET PRESENT VALUE DISCOUNTED AT 10% OF $1.5 BILLION March 4, 2014 Calgary,
CORPORATE STRATEGY PRESENTATION. March 2017
 CORPORATE STRATEGY PRESENTATION FORWARD-LOOKING STATEMENTS AND IMPORTANT NOTES The presentation contains forward-looking statements and forward-looking information within the meaning of applicable Canadian
CHINOOK ENERGY INC. ANNOUNCES SECOND QUARTER 2017 RESULTS
 CHINOOK ENERGY INC. ANNOUNCES SECOND QUARTER 2017 RESULTS CALGARY, ALBERTA August 10, 2017 Chinook Energy Inc. ("our", "we", or "us") (TSX: CKE) is pleased to announce its second quarter 2017 financial
CORPORATE PRESENTATION
 TSX: VII.TO CORPORATE PRESENTATION November 2018 7G CORPORATE PROFILE Corporate Highlights Premier Alberta Montney Pure-Play Canada s Largest Condensate Producer 87 Mbbl/d of condensate sales in Q3 2018
RMP Energy Reports Second Quarter 2017 Results and Provides Initial Elmworth Production Information
 RMP Energy Reports Second Quarter 2017 Results and Provides Initial Elmworth Production Information CALGARY, Alberta, Aug. 14, 2017 (GLOBE NEWSWIRE) -- RMP Energy Inc. ( RMP or the Company ) (TSX:RMP)
Encana reports fourth quarter and full-year 2018 financial and operating results
 Encana reports fourth quarter and full-year 2018 financial and operating results February 28, 2019 Sustainable model delivered free cash flow, strong growth in proved reserves and high-margin liquids Fourth
BUILT TO LAST. April 2016
 BUILT TO LAST April 2016 Built to Last Low Debt Low Decline Strong Capital Efficiencies 2 Cardinal Energy Profile Shares Outstanding (1) TSX: CJ Basic 65,124,209 ergy Ltd. Fully Diluted 67,595,248 Annual
FORM F1 STATEMENT OF RESERVES DATA AND OTHER OIL AND GAS INFORMATION. Year Ended December 31, 2016
 FORM 51-101F1 STATEMENT OF RESERVES DATA AND OTHER OIL AND GAS INFORMATION Year Ended December 31, 2016 March 2, 2017 TABLE OF CONTENTS DATE OF STATEMENT AND RELEVANT DATES... 1 DISCLOSURE OF RESERVES
Obsidian Energy. Peters & Co. Annual Energy Conference. January 2018
 Obsidian Energy Peters & Co. Annual Energy Conference January 2018 Important Notices to the Readers This presentation should be read in conjunction with the Company's audited consolidated financial statements,
CRESCENT POINT ANNOUNCES STRATEGIC CONSOLIDATION ACQUISITION OF CORAL HILL ENERGY LTD. AND UPWARDLY REVISED 2015 GUIDANCE
 PRESS RELEASE CRESCENT POINT ANNOUNCES STRATEGIC CONSOLIDATION ACQUISITION OF CORAL HILL ENERGY LTD. AND UPWARDLY REVISED 2015 GUIDANCE July 2, 2015 CALGARY, ALBERTA. Crescent Point Energy Corp. ( Crescent
Annual and Special Shareholder Meeting May 17, 2018
 Annual and Special Shareholder Meeting May 17, 2018 2017 in Review Mandate: Increase light oil exposure Increase netbacks Reduce operating Costs Maintain dividend 2 Grande Prairie Acquisition (March 2017)
NEWS RELEASE NOVEMBER 7, 2018
 NEWS RELEASE NOVEMBER 7, 2018 TOURMALINE DELIVERS STRONG Q3 EARNINGS AND CASH FLOW GROWTH, INCREASES 2018 EXIT AND 2019 PRODUCTION ESTIMATES AND REDUCES 2019 CAPITAL PROGRAM Calgary, Alberta - Tourmaline
TSX-V: BBI February 2018
 February 2018 A Confluence of Positive Factors BLACKBIRD LIFE CYCLE MARKET CONDITIONS BLACKBIRD VALUE PROPOSITION Social License LARGE, CONTIGUOUS LAND BLOCK 134 GROSS SECTIONS Alberta Jurisdiction CASH
TD Securities Duvernay Overview October 8, 2013
 TD Securities Duvernay Overview October 8, 2013 Forward-Looking Statement This presentation contains forward-looking information that involves various risks, uncertainties and other factors. All information
Tuscany has built a large inventory of horizontal oil locations
 TSXV: TUS June 2015 TSXV: TUS June 2015 2 Why Buy Tuscany Now? Tuscany has built a large inventory of horizontal oil locations 80 to 191 potential locations in eight areas (1) 34 of potential locations
Accelerating Condensate Development in the Heart of the Montney While Retaining Capital Flexibility
 Accelerating Condensate Development in the Heart of the Montney While Retaining Capital Flexibility Investor Presentation TSX: AAV April 2019 ADVANTAGE AT A GLANCE TSX 52-week trading range $1.80 - $4.80
TRAVERSE ENERGY LTD. MANAGEMENT'S DISCUSSION AND ANALYSIS FOR THE YEAR ENDED DECEMBER 31, 2015
 This management's discussion and analysis ("MD&A") dated April 14, 2016 should be read in conjunction with the audited financial statements and accompanying notes of Traverse Energy Ltd. ("Traverse" or
CORPORATE STRATEGY PRESENTATION DECEMBER 2016
 CORPORATE STRATEGY PRESENTATION DECEMBER 216 FORWARD-LOOKING STATEMENTS AND IMPORTANT NOTES The presentation contains forward-looking statements and forward-looking information within the meaning of applicable
Liquids sales comprised 59 percent of total revenue and 40 percent of total sales volumes in the second quarter of 2015.
 PARAMOUNT RESOURCES LTD. ANNOUNCES SECOND QUARTER 2015 RESULTS; SALES VOLUMES INCREASE 107% TO 42,604 BOE/D; LIQUIDS SALES VOLUMES INCREASE 320% TO 16,877 BBL/D August 5, 2015 Calgary, Alberta OIL AND
Corporate Presentation September 2017
 Corporate Presentation September 2017 Disclaimers General Advisory The information contained in this presentation does not purport to be all-inclusive or contain all information that readers may require.
RMP Energy Announces $80 Million Disposition of Assets and Name Change
 RMP Energy Announces $80 Million Disposition of Assets and Name Change CALGARY, Alberta, Sept. 01, 2017 (GLOBE NEWSWIRE) -- RMP Energy Inc. ( RMP or the Company ) (TSX:RMP) is pleased to announce that
Predictable & Sustainable Per Share Growth
 Predictable & Sustainable Per Share Growth January 23, 2018 T V E : T S X www.tamarackvalley.ca 1 Disclaimers Forward Looking Statements Certain information included in this presentation constitutes forward-looking
FIRST QUARTER REPORT 2014
 FIRST QUARTER REPORT 2014 HIGHLIGHTS ($ thousands, except per share and per unit amounts) 2014 2013 % Change Operating Petroleum and natural gas sales 40,893 32,201 27 Production: Oil (bbl/d) 1,337 1,727
2018 Annual Report. Financial and Operating Highlights. Financial Highlights
 2018 Annual Report Financial and Operating Highlights Three months ended Year ended Financial Highlights ($000, except as otherwise indicated) 2018 2017 2018 2017 Financial Statement Highlights Sales including
Strategic Transactions Review. July 2017
 Strategic Transactions Review July 2017 Future Oriented Information In the interest of providing information regarding Paramount Resources Ltd. ("Paramount", "PRL" or the "Company") and its future plans
Tamarack Valley Energy Ltd. Announces Record 2017 Financial and Operating Results and a 53% Increase in Proved Developed Producing Reserves
 TSX: TVE Tamarack Valley Energy Ltd. Announces Record 2017 Financial and Operating Results and a 53% Increase in Proved Developed Producing Reserves Calgary, Alberta March 6, 2018 Tamarack Valley Energy
Seven Generations delivers $381 million of funds from operations in first quarter of 2018
 NEWS RELEASE TSX: VII Seven Generations delivers $381 million of funds from operations in first quarter of 2018 Return on capital employed of 10.4% CALGARY, May 3, 2018 Seven Generations delivered funds
HEMISPHERE ENERGY ANNOUNCES 2017 FOURTH QUARTER AND YEAR-END FINANCIAL AND OPERATING RESULTS
 HEMISPHERE ENERGY ANNOUNCES 2017 FOURTH QUARTER AND YEAR-END FINANCIAL AND OPERATING RESULTS TSX-V: HME Vancouver, British Columbia, April 26, 2018 Hemisphere Energy Corporation (TSX-V: HME) ("Hemisphere"
April 2017 ACCELERATING HIGH-MARGIN, LIQUIDS-RICH PRODUCTION IN THE WORLD-CLASS MONTNEY BIGSTONE REGION
 ACCELERATING HIGH-MARGIN, LIQUIDS-RICH PRODUCTION IN THE WORLD-CLASS MONTNEY BIGSTONE REGION FORWARD-LOOKING STATEMENTS AND IMPORTANT NOTES The presentation contains forward-looking statements and forward-looking
indicated) per share ( per boe , , ,487 41, , , ,390 80,
 per share ( per boe , , ,487 41, , , ,390 80,") 2010 Annual Report Financial ($000, except as otherwise indicated) Revenue before royalties (1) (2) per share ( per boe Funds from operations (2) per share ( per boe Net income (loss) (2) per share ( Expenditures
2010 Annual Report Financial ($000, except as otherwise indicated) Revenue before royalties (1) (2) per share ( per boe Funds from operations (2) per share ( per boe Net income (loss) (2) per share ( Expenditures
HEMISPHERE ENERGY ANNOUNCES Q FINANCIAL AND OPERATING RESULTS
 HEMISPHERE ENERGY ANNOUNCES Q2 2017 FINANCIAL AND OPERATING RESULTS TSX V: HME Vancouver, British Columbia, August 23, 2017 Hemisphere Energy Corporation (TSX V: HME) ("Hemisphere" or the "Company") announces
POSITIONED FOR SUCCESS
 POSITIONED FOR SUCCESS CORPORATE PRESENTATION November 2018 TSX: BNE 1 Forward Looking Information Certain statements contained in this Presentation include statements which contain words such as anticipate,
Disposition of Non-Core Assets
 Press Release Page 1 of 5 Advantage Oil & Gas Ltd Advantage Announces Disposition of Non-core Assets, Glacier Montney Update, Appointment of Financial Advisors and Natural Gas Hedging for 2013 (TSX: AAV,
SUSTAINABLE DIVIDEND & GROWTH May 2018
 SUSTAINABLE DIVIDEND & GROWTH May 2018 Cardinal Profile Shares Outstanding TSX: CJ Basic (1) Fully Diluted (excluding debentures) 110.8 MM 114.0 MM 2018 Annual Dividend ($/share) $0.42 2018 Average Production