Concentration Risk. Where we are. Miguel A Iglesias Global Association of Risk Professionals. September 2014
|
|
|
- Meryl Page
- 5 years ago
- Views:
Transcription

1 Concentration Risk Where we are Miguel A Iglesias Global Association of Risk Professionals September 2014
2 The views expressed in the following material are the author s and do not necessarily represent the views of the Global Association of Risk Professionals (GARP), its Membership or its Management. 2
3 Concentration Risk Risk concentrations are arguably the single most important cause of major problems in banks (see BCBS (2006a, 770))
4 Concentration Risk: where we are 1. Diversification: what is it worth? 2. Loss Distribution- Based Risk Measures. Economic Capital 3. Concentration Risk. Main current Approaches I. Basel Approach to Concentration Risk II. Rating Agency Approach to Concentration Risk III. Multifactor Models and Concentration Risk 4. Some Conclusions
5 1. Diversification: what is it worth?
6 Concentration Risk Risk And Return of Portfolios N i 1 Corr WiE ( Ri) AB A E( Rp) Cov( RA, R B B ) The Expected Return (ER) of a portfolio is the Weighted Average of the ER of the securities. The Variance of Returns (VR) of a portfolio depends on how returns move together: Covariance of Returns (CR) and Correlation Coefficient. Harry Markowitz: the variance of a portfolio is less than a weighted average of the individual variances of the portfolio securities (Correlation is between +1 and -1). Lower Correlation results in greater diversification benefits. 2 P 2 P W 2 A 2 A 2 A 2 A W 2 B 2 B 2 B 2 B 2W W Cov( R W W 2W W A A B B Corr Risk that disappears in a well-diversified portfolio is called Diversifiable Risk. the risk that remains is called Systematic Risk. AB A, R A B ) B 6

7 Concentration Risk

8 Diversification. What is it worth?
9 Diversification. What is it worth? Sharpe E( R p ) R f p Treynor E( R p ) R f p
10 2. Loss Distribution- Based Risk Measures. Economic Capital
11 Diversification Invest 1MM in one Asset Class: 100% BBVA shares. Invest 1MM in one Asset Class: 50% BBVA and 50% Santander shares. Invest 1MM in two Asset Classes: 25% BBVA. 25% Santander. 50% Pistachos. Solvency: How much Capital do you need to get a Rating level? Three drivers that work together: asset volatility, financial leverage and solvency rating.

12 Merton Model (I) A borrower defaults when its asset value falls below a threshold defined by its liabilities. Initial Asset value Asset Value after one year Non Default Scenarios Debt Default Scenario: Debt > Asset value
13 Counterparty 1 Merton Model (II) Correlation between borrowers defaults arise from correlation between their asset values. r 78.8% The Basel II approach is based on the Merton Model No Defaults Counterparty 1 Defaults Counterparty Both Counterparties default -0.20
14 Loss Distribution- Based Risk Measures Quantity risk measures: the distribution of Losses over a specified time horizon. Different approaches: Expected losses (EL). Standard Deviation. Value at Risk (VaR). Expected Shortfall (evar). Economic Capital (EC). + The most flexible and accurate method. + It can be calculated for any level of granularity. + It can be aggregated along any dimension. + It does not reduce information to a single number. + It allows for netting or diversification effects. + It allows to measure and aggregate the risk of derivative instruments. - The development of models can be challenging, and the data availability and estimation of parameters can be as well. - Furthermore, the suitability of models and measures will have to be verified by performing backtesting exercises on a regular basis..
15 Expected Shortfall Expected shortfall (ES): the expected loss conditional on the real loss exceeding VaR, overcoming VaR main weakness as it is not sub additive (a merger of two portfolios does not generate additional risk).
. Choice of type of calculation Stand Alone vs Marginal EC.")
16 Economic Capital: Some Choices Choice of a Time Horizon Credit risk, a time horizon of one year is commonly used. Trading risk: the 1-day or 10-day VaR. Choice of the Confidence Level Link with the Risk appetite and the level of solvency (AAA-D). Choice of type of calculation Stand Alone vs Marginal EC. Allocation methods.
17 Economic Capital Purpose Capital fulfils the purposes of shielding the bank against unexpectedly high realizations of risks (credit losses from defaults or downgrades, a fall in the value of market instruments, or processing errors) and, potentially, bankruptcy. Banks commonly create buffers in the form of general provisions for losses that might be reasonably expected to occur. However, actual losses are often different from expectations, and capital is held to cover unforeseen possibilities. EC therefore explicitly links the risk appetite of the shareholders to the actual risk assumed by the bank. Economic capital is a key tool for the risk management function in understanding and quantifying the risk undertaken so as to support capital adequacy and value-based management. Economic Capital is an indispensable concept because it allows banks to measure and manage the overall risks of a bank in a common currency. It is a Portfolio Measure: it takes into consideration correlations. 17
18 3. Concentration Risk. Main current Approaches I. Basel Approach to Concentration Risk II. Rating Agency Approach to Concentration Risk. An example with S&P III. Multifactor Models and Concentration Risk
19 Concentration Risk Significant improvements in understanding and measuring of Concentration Risk in credit portfolios. Single-name, Industry and Country concentrations are major risks and constraining rating factors for many financial institutions.
20 Concentration Risk The measurement of Concentration Risk in credit portfolios is necessary for : Determining regulatory capital under Pillar II of Basel II. Rating Agencies recognize single-name concentration in their ratings methodologies and highlight Concentration Risk as potential ratings negative. Concentration Risk measurement is important for managing portfolios internally and allocating economic capital.
21 3. Concentration Risk. Main current Approaches I. Basel Approach to Concentration Risk
22 Basel Approach The Basel II formula for measuring the VaR of credit portfolios is based on the so-called asymptotic single risk factor (ASRF) framework as explained in Gordy (2003). The portfolio is infinitely fine grained and thus it consists of a nearly infinite number of credits with small exposures; Only one systematic risk factor influences the default risk of all loans in the portfolio.
23 Basel II, Assumptions The first assumption implies that there are no name concentrations within the portfolio, thus all idiosyncratic risk is diversified completely. The second assumption implies that there are no sector concentrations such as industry- or country-specific risk concentrations. These are idealizations that can be problematic for real-world portfolios. Since it is difficult to incorporate credit risk concentrations into analytic approaches, in Basel II there is no quantitative approach mentioned for how to deal with risk concentrations. Instead, it is only qualitatively demanded in Pillar II of Basel II that Banks should have in place effective internal policies, systems and controls to identify, measure, monitor, and control their credit risk concentrations (see BCBS (2006a, 773)). Supervisors interpret concentration risk as a positive or negative deviation from Pillar I minimum capital requirements derived by a framework that does not account explicitly for concentration risk (see BCBS (2006b)). Pillar I capital rules were calibrated on well-diversified portfolios with low name and low sector concentration risk (see BCBS (2006b) and CEBS (2006, 18)).
24 Basel and Concentration Risk For well diversified portfolios the Basel II formula is a good approximation of the true risk.
25 Basel II. RC. IRB Formula Corporates, Sovereigns y Banks K=LGD*N[(1-R)^(-0.5)*G(PD)+(R/(1-R))^(0.5)*G(0.999)-PD*LGD]*(1-1,5*b(PD))^-1* (1+(M-2,5)*b(PD)) R= 0.12*(1-exp(-50*PD))/(1-exp(-50))+0.24*[1-(1-exp(-50*PD))/(1-exp(-50))] b= (0, ,05478*log(PD))^2) RWA= K*12,5*EAD N(x) denotes the standard normal cumulative distribution function G(y) stands for the inverse of the standard normal cumulative distribution function No Concentration Risk parameters
26 Basel II. RC. Enfoque IRB 16 Charge, per cent LGD=45% HVCRE Corporate 12 8 SME (turnover 5 mill.) % 2% 4% 6% 8% 10% PD
27 Basel II on Credit Risk Concentration Basel II under its Pillar II mandates that banks should conduct an internal capital adequacy assessment to cover all type of risks including credit concentration risk. Provided no methodology for measuring credit concentration risk. Basel created a Research Task Force to study credit risk concentration and examine the tools fit for its quantification.
28 3. Concentration Risk. Main current Approaches II. Rating Agency Approach to Concentration Risk
29 Standard & Poors Calculating the RAC Ratio


30 S&P- Risk Adjusted Capital

31 S&P. Total Adjusted Capital (TAC)
32 S&P. Risk-Weighted Assets (RWA) S&P obtains the risk weights by dividing the RAC charge by 8%, which is equivalent to multiplying the RAC charge by They use the risk weights to adjust the value of a bank's assets relative to our view of their riskiness and potential for default, in a method similar to that broadly used in the industry. This helps them make comparisons between the RAC ratio and regulatory-based capital ratios. The framework breaks credit risk down into six categories: governments, financial sector, corporate sector, retail and personal sector, counterparty risk, and securitizations. It then accounts for the impact of collateral and other risk mitigation on the RWA.
33 S&P. RWAs. Governments Governments: They apply different risk weights according to the rating on the sovereign issuer. Those risk weights for sovereign and local authority exposures are based on S&P s foreign currency credit rating on the sovereign, except for domestic government securities in local currency that are based on the local currency rating.
34 S&P. RWAs. Financial Sector Financial sector: Financial exposures fall into two categories, financial institutions and covered bonds. The framework applies risk weights according to BICRA score for the country in which the exposures are domiciled.
35 S&P. RWAs. Corporates Corporate sector: Corporate exposures fall into two categories: corporate, and construction and real estate development. It applies risk weights according to the economic risk score from BICRA analysis.
36 S&P. RWAs. Retail Retail and personal: they classify retail exposures into five categories: prime residential mortgages, auto loans, credit cards, self-certified mortgages, and other unsecured/retail lending to SMEs. S&P applies risk weights according to the economic risk score from the BICRA analysis.
37 S&P. RWAs
38 S&P- RWAs. Collateral and other credit risk mitigation It is accounted through a combination of different risk weights, reduction of exposure amounts, recognition of credit substitution, and by making standard adjustments. We may lower our risk weights to reflect our view of the effects of credit risk mitigation, which may take the form of: Financial collateral; Guarantees from a financial institution or a sovereign; or Credit default swaps.
39 S&P. Market Risk Trading activities: S&P applies a risk weight for market risk from trading activities, which is a multiple of the regulatory risk weight, derived either from a value-at-risk (VAR) calculation validated by regulators, the Basel standardized approach, or a combination of the two. Equity investments: The S&P applies risk weights to three different types of equity investments: listed securities, unlisted securities, and investments in unconsolidated subsidiaries. It classifies listed equity investments into four equity market groups by country, based on the volatility we have observed in that country's main stock market index over the past 30 years.

40 S&P. Market Risk For unlisted equities, they add 10% (equivalent to a 125% risk weight add-on) to the charge we apply for listed equity investments. The RAC charges apply to the fair value of equity holdings.

41 Operational risk and associated Risk Weights S&P applies risk weights to all business lines according to either their revenue contribution or the size of assets under management or custody. If a breakdown of revenues by business line is not available, S&P applies a 188% risk weight to the highest annual revenue of the past three year.
42 S&P. Other Risks Not Covered S&P framework is not intended to capture risks such as: Interest rate and currency risk in the banking book; Volatility of pension funding; Funding risk; Reputation risk; or Strategic risk. Such risks are covered qualitatively in other areas of the methodology.

43 Standard & Poors Calculating The RAC Ratio
44 S&P. Risk Concentration/ Diversification S&P also quantifies the potential impact of risk concentration or diversification on RWA. S&P s framework takes into account single-name concentration (the aggregate of large exposures to a single borrower or counterparty), as well as the correlation of risk by geography, sector type, and business line.
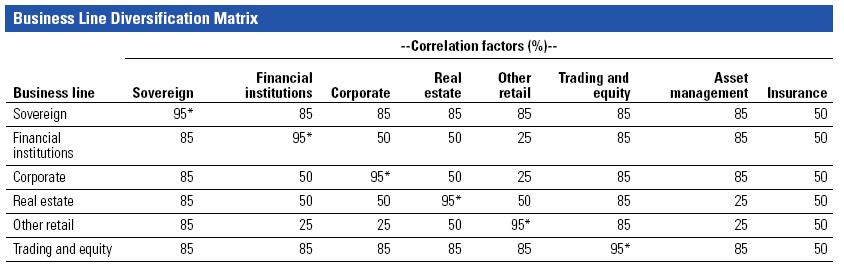
45 S&P. Risk Concentration S&P calculates an adjustment to RWA to reflect the impact of concentration or diversification of risks. Adjustment to RWA in corporate exposures for correlations among different industries; Adjustment to total RWA for correlations among country or regional exposures; Adjustment to total RWA for correlations among different business lines; Add-on to total corporate RWA to capture single-name concentrations in the corporate book using the largest 20 named corporate exposures. S&P sets a cap on the overall benefit of concentration and diversification adjustments to 30% for the most diversified global financial institutions.
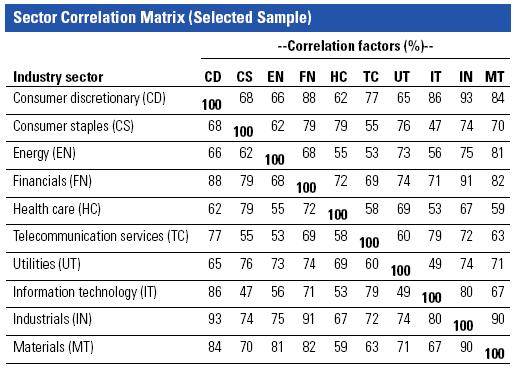
46 S&P. Risk Concentration Industry sector, geographic, and business line methodology: A concentration multiplier to RWA, then they determine the aggregate RWA for the various portfolios using a correlation matrix (based on the Markowitz covariance/variance formula): Where: Ki is the RAC charge for either the industry sector, geographic region, or business line (i) in order to compute the total risk weight adjusted for industry sector, geographic region, business line concentration, or diversification; Ci is the Concentration factor for the industry sector, geographic region, or business line (i); and Ri,j is the Correlation coefficient between the industry sectors, geographic regions, or business lines) i and j.

47 Industry Sector Concentration Factors S&P calculates the concentration factors using the volatility of the respective MSCI sector stock market index. The volatility is calculated as the standard deviation of the monthly log returns over the past 20 years.
48 Geographic Region Concentration Factors S&P uses a multiplier based on the logarithm of the GDP of the country in which the bank is located. In practice, the concentration multiplier diminishes by a constant factor each time the GDP doubles. This concentration factor reflects the view that, in general, the smaller an economy is, the less diversified it is.
49 Correlation Matrices For correlations by geographic regions and industry sectors, S&P uses the MSCI stock indexes. MSCI stock indexes: monthly returns of the index as a compromise between stability and the number of data points from 1987 to S&P first computed Pearson correlations of these MSCI index returns, then they stressed the results to capture more fat-tail risks. To do so, They use a Fisher transformation and stress the resulting value to a confidence interval of 99.5%. Business line correlations are based on analytical judgment.
50 Correlation Matrices
51 Single-Name Concentration Adjustment S&P calculates the concentration charge for exposures to single names in the corporate exposures using a model based on the granularity adjustment described and tested by Gordy and Lütkebohmert (2007). They apply the model to a bank's total corporate exposures and largest 20 corporate exposures. The methodology is derived as a first-order asymptotic approximation for the effect of diversification in large portfolios within the CreditRisk+ methodology for calculating the distribution of possible credit losses from a portfolio, developed by Credit Suisse. The theoretical tools for this analysis were proposed first by Gordy (2004) and refined significantly by Martin and Wilde (2003).
52 Single-Name Concentration Adjustment In practice, S&P derives an addon from the breakdown of the top 20 corporate exposures, according to this formula, which is a quadratic scaled version of the formula proposed as upperbound by Gordy and Lütkebohmert:
53 Single-Name Concentration Adjustment A number of academic studies provide either direct or indirect estimates of the importance of granularity risk for bank portfolios. The effect is clearly more pronounced for smaller portfolios. An indicative calculation of the upper boundary of the contribution of idiosyncratic risk to economic capital can be performed by reference to a portfolio having the maximum permissible concentration under the EU's large-exposure rules. Such calculations give estimates of 13% to 21% higher portfolio value-at-risk for this highly concentrated portfolio versus a perfectly granular one that is comparable in all other dimensions. For portfolios that are more typical for an "actual" bank (as opposed to a theoretical portfolio with the maximum concentration that EU large-exposure rules would allow), the impact of name concentration is substantially lower. Gordy and Lütkebohmert (2007) use characteristics of loans from the German credit register to compare the effect of name concentration on loan portfolios of the size that can be found in actual banks. For large credit portfolios of more than 4,000 exposures, they estimate that name concentration can contribute about 1.5% to 4% of portfolio value at risk. For smaller portfolios (with 1,000 to 4,000 loans), they estimate that a range between 4% and 8% is more likely.
54 Gordy s vs S&P Approach Michael Gordy s Upper bound estimate formula for the heterogeneous case: m i m m i i i upper m R R K K s Q C s K GA 1 * * * * 2 * S&P s formula for concentration on non-sovereign operations (Bank Capital Methodology, December 2010): m i m m i i i m i m m i i i R R K K s Q C s K R R K K s Q C s K on Add 1 * * * * 2 * 2 1 * * * * 2 * Michael Gordy s formula alone is complicated enough. The revision introduced by S&P made the formula much more opaque. For single name concentration, the approaches developed by (i) Gordy and Lüthkebohmert and (ii) Emmer and Tasche are reasonable..
55 3. Concentration Risk. Main current Approaches III. Multifactor Models and Concentration Risk
56 Multifactor Models The measurement and management of risk concentrations are not only important for the determination of regulatory but also for the measurement of the true portfolio risk: Economic Capital. Name concentrations, as well as sector ans Country concentrations, have already been analyzed in the literature. The theoretical derivation of the so-called granularity adjustment that accounts for name concentrations was done by Wilde (2001) and improved by Pykhtin and Dev (2002) and Gordy (2003). The adjustment formulas are derived in a more straightforward approach by Martin and Wilde (2002), Rau-Bredow (2002) and Gordy (2004). Furthermore, the adjustment is extended and numerically analyzed in detail by Gürtler et al (2008). An approach related to Wilde (2001) is the granularity adjustment from Gordy and Lütkebohmert (2007). In contrast, the semi-asymptotic approach from Emmer and Tasche (2005) refers to name concentrations due to a single name, while the rest of the portfolio remains infinitely granular. Thus, this type can be called individual name concentration.
57 Multifactor Models There also exist analytic and semi-analytic approaches that account for sector concentrations. One rigorous analytical approach is Pykhtin (2004) that is based on a similar principle as in Martin and Wilde (2002). An alternative is the semianalytical model from Cespedes et al (2006) that derives an approximation formula through a complex numerical mapping procedure. Another approach from Düllmann (2006) extends the binomial extension technique (BET) model from Moody s. Tasche (2006) suggests an ASRF-extension in an asymptotic multi-factor setting. Some numerical work on the performance of the Pykhtin model has been done by Düllmann and Masschelein (2007). Furthermore, Düllmann (2007) presented a first comparison of different approaches on sector concentration risk.
58 Multifactor Models The problem is that the derivation and the application of the approaches are often inconsistent with the Basel II framework, which is critical. Gürtler, Hibbeln, Vöhringer (2010) suggest that Pykhtin model provides a methodology to perform multi-factor models that are able to measure concentration risk in credit portfolios in terms of economic capital and still deliver results that are consistent with Basel II. Gürtler, Hibbeln, Vöhringer (2010) proposed a methodology to perform multi-factor models that are able to measure concentration risk in credit portfolios in terms of economic capital and still deliver results that are consistent with Basel II. They applied that methodology to different multi-factor approaches (Montecarlo Siumulation, Pykhtin (2004) and Cespedes et al (2006)) and compared their performance showing that it is possible to achieve good approximations in a reasonable time when the approaches are adjusted in the proposed way.
59 Multifactor Models They chose input parameters, especially the inter- and intra-sector correlations, in a way that the results are comparable with the regulatory Pillar I capital. Hence, it is possible to directly consider the extent of credit risk concentrations in the assessment of capital adequacy under Pillar II. Using these modifications, They performed an extensive numerical study similar to Cespedes et al (2006) to obtain a closed-f orm approximation formula. This allows to compute the Pykhtin formula much faster than Monte Carlo simulations even for a high number of credits. Following this methodology they detected that the Pykhtin model leads to very good results for homogeneous as well as heterogeneous PDs when EADs are homogeneous. The performance is slightly lower for heterogeneous EADs. The results of the Cespedes model have a high accuracy throughout. Interestingly, the approach works better for heterogeneous portfolios. In general, both models can be used for approximating the economic capital in a multi-factor setting when adjusted in the proposed way. The main advantage of the Pykhtin model is that it can be directly applied to an arbitrary portfolio type, whereas the approach of Cespedes et al (2006) should not be used without initially performing the demonstrated extensive numerical work.
60 4. Some Conclusions
61 Conclusions Existing approaches for measuring Concentration Risk are mostly not fully consistent with the new capital adequacy framework (Basel II, BCBS (2006a)). Basel II under its Pillar II mandates that banks should conduct an internal capital adequacy assessment to cover all type of risks including credit concentration risk. It provides no methodology for measuring credit concentration risk. S&P s approach for concentration seems theoretically and practically too punitive. Basel does not recommend an approach since their IRB approach assumes a perfectly granular portfolio which fully diversifies away idiosyncratic risk. Neither Moody s nor Fitch provide alternatives. Some alternatives from the academic literature, ex. Emmer and Tasche, may be difficult to implement. For single name concentration, the approaches developed by (i) Gordy and Lüthkebohmert and (ii) Emmer and Tasche are reasonable. Gürtler, Hibbeln, Vöhringer (2010) suggest that Pykhtin model provides a methodology to perform multi-factor models that are able to measure concentration risk in credit portfolios in terms of economic capital and still deliver results that are consistent with Basel II. A good approach would be intuitive, fair and transparent.
62 Some Partial Solutions Limits The case for limits makes intuitive sense, but The choice of any particular limit may be arbitrary. No account taken of correlations among borrowers. Need to balance financial with business objectives. Stress Testing Also an intuitive approach, but The choice of stress tests is arbitrary. The same test may yield very different results based on implementation technique. The most stressful tests are also the most implausible. So difficult to serve as a basis for policy.
63 Thanks!
64 C r e a t i n g a c u l t u r e o f r i s k a w a r e n e s s Global Association of Risk Professionals 111 Town Square Place 14th Floor Jersey City, New Jersey U.S.A nd Floor Bengal Wing 9A Devonshire Square London, EC2M 4YN U.K (0) About GARP The Global Association of Risk Professionals (GARP) is a not-for-profit global membership organization dedicated to preparing professionals and organizations to make better informed risk decisions. Membership represents over 150,000 risk management practitioners and researchers from banks, investment management firms, government agencies, academic institutions, and corporations from more than 195 countries and territories. GARP administers the Financial Risk Manager (FRM ) and the Energy Risk Professional (ERP ) Exams; certifications recognized by risk professionals worldwide. GARP also helps advance the role of risk management via comprehensive professional education and training for professionals of all levels Global Association of Risk Professionals. All rights reserved.
Dependence Modeling and Credit Risk
 Dependence Modeling and Credit Risk Paola Mosconi Banca IMI Bocconi University, 20/04/2015 Paola Mosconi Lecture 6 1 / 53 Disclaimer The opinion expressed here are solely those of the author and do not
Effective Computation & Allocation of Enterprise Credit Capital for Large Retail and SME portfolios
 Effective Computation & Allocation of Enterprise Credit Capital for Large Retail and SME portfolios RiskLab Madrid, December 1 st 2003 Dan Rosen Vice President, Strategy, Algorithmics Inc. drosen@algorithmics.com
In various tables, use of - indicates not meaningful or not applicable.
 Basel II Pillar 3 disclosures 2008 For purposes of this report, unless the context otherwise requires, the terms Credit Suisse Group, Credit Suisse, the Group, we, us and our mean Credit Suisse Group AG
Solvency II update. Shirley Beglinger Shires Partnership Ltd Global Association of Risk Professionals. December 2014
 Solvency II update Shirley Beglinger Shires Partnership Ltd Global Association of Risk Professionals December 2014 The views expressed in the following material are the author s and do not necessarily
Basel II Pillar 3 disclosures 6M 09
 Basel II Pillar 3 disclosures 6M 09 For purposes of this report, unless the context otherwise requires, the terms Credit Suisse Group, Credit Suisse, the Group, we, us and our mean Credit Suisse Group
Basel II Pillar 3 disclosures
 Basel II Pillar 3 disclosures 6M10 For purposes of this report, unless the context otherwise requires, the terms Credit Suisse, the Group, we, us and our mean Credit Suisse Group AG and its consolidated
PILLAR 3 DISCLOSURES
 . The Goldman Sachs Group, Inc. December 2012 PILLAR 3 DISCLOSURES For the period ended December 31, 2014 TABLE OF CONTENTS Page No. Index of Tables 2 Introduction 3 Regulatory Capital 7 Capital Structure
PILLAR 3 DISCLOSURES
 The Goldman Sachs Group, Inc. December 2012 PILLAR 3 DISCLOSURES For the period ended June 30, 2014 TABLE OF CONTENTS Page No. Index of Tables 2 Introduction 3 Regulatory Capital 7 Capital Structure 8
Basel III Pillar 3 disclosures 2014
 Basel III Pillar 3 disclosures 2014 In various tables, use of indicates not meaningful or not applicable. Basel III Pillar 3 disclosures 2014 Introduction 2 General 2 Regulatory development 2 Location
The Goldman Sachs Group, Inc. PILLAR 3 DISCLOSURES
 The Goldman Sachs Group, Inc. PILLAR 3 DISCLOSURES For the period ended September 30, 2017 TABLE OF CONTENTS Page No. Index of Tables 1 Introduction 2 Regulatory Capital 5 Capital Structure 6 Risk-Weighted
CREDIT PORTFOLIO SECTOR CONCENTRATION AND ITS IMPLICATIONS FOR CAPITAL REQUIREMENTS
 131 Libor Holub, Michal Nyklíček, Pavel Sedlář This article assesses whether the sector concentration of the portfolio of loans to resident and non-resident legal entities according to information from
The Goldman Sachs Group, Inc. PILLAR 3 DISCLOSURES
 The Goldman Sachs Group, Inc. PILLAR 3 DISCLOSURES For the period ended December 31, 2016 TABLE OF CONTENTS Page No. Index of Tables 1 Introduction 2 Regulatory Capital 5 Capital Structure 6 Risk-Weighted
Market Risk Disclosures For the Quarter Ended March 31, 2013
 Market Risk Disclosures For the Quarter Ended March 31, 2013 Contents Overview... 3 Trading Risk Management... 4 VaR... 4 Backtesting... 6 Total Trading Revenue... 6 Stressed VaR... 7 Incremental Risk
The Goldman Sachs Group, Inc. PILLAR 3 DISCLOSURES
 The Goldman Sachs Group, Inc. PILLAR 3 DISCLOSURES For the period ended June 30, 2015 TABLE OF CONTENTS Page No. Index of Tables 1 Introduction 2 Regulatory Capital 5 Capital Structure 6 Risk-Weighted
Regulatory Capital Pillar 3 Disclosures
 Regulatory Capital Pillar 3 Disclosures December 31, 2016 Table of Contents Background 1 Overview 1 Corporate Governance 1 Internal Capital Adequacy Assessment Process 2 Capital Demand 3 Capital Supply
Citigroup Inc. Basel II.5 Market Risk Disclosures As of and For the Period Ended December 31, 2013
 Citigroup Inc. Basel II.5 Market Risk Disclosures and For the Period Ended TABLE OF CONTENTS OVERVIEW 3 Organization 3 Capital Adequacy 3 Basel II.5 Covered Positions 3 Valuation and Accounting Policies
ECONOMIC AND REGULATORY CAPITAL
 ECONOMIC AND REGULATORY CAPITAL Bank Indonesia Bali 21 September 2006 Presented by David Lawrence OpRisk Advisory Company Profile Copyright 2004-6, OpRisk Advisory. All rights reserved. 2 DISCLAIMER All
Goldman Sachs Group UK (GSGUK) Pillar 3 Disclosures
 Pillar 3 Disclosures") Goldman Sachs Group UK (GSGUK) Pillar 3 Disclosures For the year ended December 31, 2013 TABLE OF CONTENTS Page No. Introduction... 3 Regulatory Capital... 6 Risk-Weighted Assets... 7 Credit Risk... 7
Goldman Sachs Group UK (GSGUK) Pillar 3 Disclosures For the year ended December 31, 2013 TABLE OF CONTENTS Page No. Introduction... 3 Regulatory Capital... 6 Risk-Weighted Assets... 7 Credit Risk... 7
A simple model to account for diversification in credit risk. Application to a bank s portfolio model.
 A simple model to account for diversification in credit ris. Application to a ban s portfolio model. Juan Antonio de Juan Herrero Metodologías de Riesgo Corporativo. BBVA VI Jornada de Riesgos Financieros
The Goldman Sachs Group, Inc. PILLAR 3 DISCLOSURES
 The Goldman Sachs Group, Inc. PILLAR 3 DISCLOSURES For the period ended December 31, 2015 TABLE OF CONTENTS Page No. Index of Tables 1 Introduction 2 Regulatory Capital 5 Capital Structure 6 Risk-Weighted
Specific Issues of Economic Capital Management: Economic vs. Regulatory Capital and Business Risk
 Specific Issues of Economic Capital Management: Economic vs. Regulatory Capital and Business Risk Corinne Neale Managing Director, Capital Management Regulatory Capital The Pillar 1 Model Managing IRB
The Goldman Sachs Group, Inc. PILLAR 3 DISCLOSURES
 The Goldman Sachs Group, Inc. PILLAR 3 DISCLOSURES For the period ended March 31, 2018 TABLE OF CONTENTS Page No. Index of Tables 1 Introduction 2 Regulatory Capital 5 Capital Structure 6 Risk-Weighted
Basel III: Comparison of Standardized and Advanced Approaches
 Risk & Compliance the way we see it Basel III: Comparison of Standardized and Advanced Approaches Implementation and RWA Calculation Timelines Table of Contents 1. Executive Summary 3 2. Introduction 4
Preprint: Will be published in Perm Winter School Financial Econometrics and Empirical Market Microstructure, Springer
 STRESS-TESTING MODEL FOR CORPORATE BORROWER PORTFOLIOS. Preprint: Will be published in Perm Winter School Financial Econometrics and Empirical Market Microstructure, Springer Seleznev Vladimir Denis Surzhko,
From Financial Risk Management. Full book available for purchase here.
 From Financial Risk Management. Full book available for purchase here. Contents Preface Acknowledgments xi xvii CHAPTER 1 Introduction 1 Banks and Risk Management 1 Evolution of Bank Capital Regulation
Regulatory Capital Pillar 3 Disclosures
 Regulatory Capital Pillar 3 Disclosures June 30, 2015 Table of Contents Background 1 Overview 1 Corporate Governance 1 Internal Capital Adequacy Assessment Process 2 Capital Demand 3 Capital Supply 3 Capital
GRANULARITY ADJUSTMENT FOR DYNAMIC MULTIPLE FACTOR MODELS : SYSTEMATIC VS UNSYSTEMATIC RISKS
 GRANULARITY ADJUSTMENT FOR DYNAMIC MULTIPLE FACTOR MODELS : SYSTEMATIC VS UNSYSTEMATIC RISKS Patrick GAGLIARDINI and Christian GOURIÉROUX INTRODUCTION Risk measures such as Value-at-Risk (VaR) Expected
Pillar 3 and regulatory disclosures Credit Suisse Group AG 2Q17
 Pillar 3 and regulatory disclosures Credit Suisse Group AG 2Q17 For purposes of this report, unless the context otherwise requires, the terms Credit Suisse, the Group, we, us and our mean Credit Suisse
Regulatory Capital Disclosures Report. For the Quarterly Period Ended March 31, 2014
 REGULATORY CAPITAL DISCLOSURES REPORT For the quarterly period ended March 31, 2014 Table of Contents Page Part I Overview 1 Morgan Stanley... 1 Part II Market Risk Capital Disclosures 1 Risk-based Capital
Wells Fargo & Company. Basel III Pillar 3 Regulatory Capital Disclosures
 Wells Fargo & Company Basel III Pillar 3 Regulatory Capital Disclosures For the quarter ended June 30, 2018 1 Table of Contents Disclosure Map.. 3 Introduction... 6 Executive Summary... 6 Company Overview
The Goldman Sachs Group, Inc. PILLAR 3 DISCLOSURES
 The Goldman Sachs Group, Inc. PILLAR 3 DISCLOSURES For the period ended September 30, 2016 TABLE OF CONTENTS Page No. Index of Tables 1 Introduction 2 Regulatory Capital 5 Capital Structure 6 Risk-Weighted
Comparative analysis of the Regulatory Capital calculation across major European jurisdictions. April 2013
 Comparative analysis of the Regulatory Capital calculation across major European jurisdictions April 2013 CONFIDENTIALITY Our clients industries are extremely competitive, and the maintenance of confidentiality
Credit VaR: Pillar II Adjustments
 Credit VaR: Adjustments www.iasonltd.com 2009 Indice 1 The Model Underlying Credit VaR, Extensions of Credit VaR, 2 Indice The Model Underlying Credit VaR, Extensions of Credit VaR, 1 The Model Underlying
Wells Fargo & Company. Basel III Pillar 3 Regulatory Capital Disclosures
 Wells Fargo & Company Basel III Pillar 3 Regulatory Capital Disclosures For the quarter ended September 30, 2018 1 Table of Contents Disclosure Map.. 3 Introduction... 6 Executive Summary... 6 Company
Wells Fargo & Company. Basel III Pillar 3 Regulatory Capital Disclosures
 Wells Fargo & Company Basel III Pillar 3 Regulatory Disclosures For the quarter ended March 31, 2018 1 Table of Contents Disclosure Map Introduction Executive Summary Company Overview Basel III Overview
Regulatory Capital Pillar 3 Disclosures
 Regulatory Capital Pillar 3 Disclosures June 30, 2014 Table of Contents Background 1 Overview 1 Corporate Governance 1 Internal Capital Adequacy Assessment Process 2 Capital Demand 3 Capital Supply 3 Capital
Basel III Pillar 3 Disclosures Report. For the Quarterly Period Ended December 31, 2015
 BASEL III PILLAR 3 DISCLOSURES REPORT For the quarterly period ended December 31, 2015 Table of Contents Page 1 Morgan Stanley... 1 2 Capital Framework... 1 3 Capital Structure... 2 4 Capital Adequacy...
2 Modeling Credit Risk
 2 Modeling Credit Risk In this chapter we present some simple approaches to measure credit risk. We start in Section 2.1 with a short overview of the standardized approach of the Basel framework for banking
UNITED STATES SECURITIES AND EXCHANGE COMMISSION Washington, D.C FORM 6-K
 UNITED STATES SECURITIES AND EXCHANGE COMMISSION Washington, D.C. 20549 FORM 6-K REPORT OF FOREIGN PRIVATE ISSUER PURSUANT TO RULE 13a-16 OR 15d-16 UNDER THE SECURITIES EXCHANGE ACT OF 1934 Date: August
In various tables, use of indicates not meaningful or not applicable.
 Basel II Pillar 3 disclosures 2012 For purposes of this report, unless the context otherwise requires, the terms Credit Suisse, the Group, we, us and our mean Credit Suisse Group AG and its consolidated
Santander UK plc Additional Capital and Risk Management Disclosures
 Santander UK plc Additional Capital and Risk Management Disclosures 1 Introduction Santander UK plc s Additional Capital and Risk Management Disclosures for the year ended should be read in conjunction
Competitive Advantage under the Basel II New Capital Requirement Regulations
 Competitive Advantage under the Basel II New Capital Requirement Regulations I - Introduction: This paper has the objective of introducing the revised framework for International Convergence of Capital
Basel III Pillar 3 Disclosures Report. For the Quarterly Period Ended June 30, 2016
 BASEL III PILLAR 3 DISCLOSURES REPORT For the quarterly period ended June 30, 2016 Table of Contents Page 1 Morgan Stanley... 1 2 Capital Framework... 1 3 Capital Structure... 2 4 Capital Adequacy... 2
Basel II Pillar 3 disclosures
 Basel II Pillar 3 disclosures 6M12 For purposes of this report, unless the context otherwise requires, the terms Credit Suisse, the Group, we, us and our mean Credit Suisse Group AG and its consolidated
Measurement of Market Risk
 Measurement of Market Risk Market Risk Directional risk Relative value risk Price risk Liquidity risk Type of measurements scenario analysis statistical analysis Scenario Analysis A scenario analysis measures
Market Risk Disclosures For the Quarterly Period Ended September 30, 2014
 Market Risk Disclosures For the Quarterly Period Ended September 30, 2014 Contents Overview... 3 Trading Risk Management... 4 VaR... 4 Backtesting... 6 Stressed VaR... 7 Incremental Risk Charge... 7 Comprehensive
Wells Fargo & Company. Basel III Pillar 3 Regulatory Capital Disclosures
 Wells Fargo & Company Basel III Pillar 3 Regulatory Capital Disclosures For the quarter ended December 31, 2017 1 Table of Contents Disclosure Map... 3 Introduction... 5 Executive Summary... 5 Company
Basel II Pillar 3 Disclosures Year ended 31 December 2009
 DBS Group Holdings Ltd and its subsidiaries (the Group) have adopted Basel II as set out in the revised Monetary Authority of Singapore Notice to Banks No. 637 (Notice on Risk Based Capital Adequacy Requirements
Market Risk Capital Disclosures Report. For the Quarterly Period Ended June 30, 2014
 MARKET RISK CAPITAL DISCLOSURES REPORT For the quarterly period ended June 30, 2014 Table of Contents Page Part I Overview 1 Morgan Stanley... 1 Part II Market Risk Capital Disclosures 1 Risk-based Capital
IV SPECIAL FEATURES ASSESSING PORTFOLIO CREDIT RISK IN A SAMPLE OF EU LARGE AND COMPLEX BANKING GROUPS
 C ASSESSING PORTFOLIO CREDIT RISK IN A SAMPLE OF EU LARGE AND COMPLEX BANKING GROUPS In terms of economic capital, credit risk is the most significant risk faced by banks. This Special Feature implements
Stress Testing of Credit Risk Portfolios
 Stress Testing of Credit Risk Portfolios Session 1: Systemic stress Discussion by Antonella Foglia Bank of Italy BCBS and De Nederlandsche Bank Amsterdam, 7 March 2008 The discussion represents my personal
Quantitative and Qualitative Disclosures about Market Risk.
 Item 7A. Quantitative and Qualitative Disclosures about Market Risk. Risk Management. Risk Management Policy and Control Structure. Risk is an inherent part of the Company s business and activities. The
2016 RISK AND PILLAR III REPORT SECOND UPDATE AS OF JUNE 30, 2017
 2016 RISK AND PILLAR III REPORT SECOND UPDATE AS OF JUNE 30, 2017 NATIXIS - 2016 Risk & Pillar III Report second update as of June 30, 2017 2 TABLE OF CONTENTS Update by chapter of the Risk and Pillar
Wells Fargo & Company. Basel III Pillar 3 Regulatory Capital Disclosures
 Wells Fargo & Company Basel III Pillar 3 Regulatory Capital Disclosures For the quarter ended September 30, 2017 1 Table of Contents Disclosure Map... 3 Introduction... 6 Executive Summary... 6 Company
Wells Fargo & Company. Basel III Pillar 3 Regulatory Capital Disclosures
 Wells Fargo & Company Basel III Pillar 3 Regulatory Capital Disclosures For the quarter ended June 30, 2017 1 Table of Contents Disclosure Map... 3 Introduction... 6 Executive Summary... 6 Company Overview...
Correlation and Diversification in Integrated Risk Models
 Correlation and Diversification in Integrated Risk Models Alexander J. McNeil Department of Actuarial Mathematics and Statistics Heriot-Watt University, Edinburgh A.J.McNeil@hw.ac.uk www.ma.hw.ac.uk/ mcneil
Capital Management in commercial and investment banking Back to the drawing board? Rolf van den Heever. ABSA Capital
 Capital Management in commercial and investment banking Back to the drawing board? Rolf van den Heever ABSA Capital Contents Objectives Background Existing regulatory and internal dispensation to meet
A note on the adequacy of the EU scheme for bank recovery, resolution and deposit insurance in Spain
 A note on the adequacy of the EU scheme for bank recovery, resolution and deposit insurance in Spain Pilar Gómez-Fernández-Aguado is a Senior Lecturer at the Department of Financial Economics and Accounting,
Pillar 3 Regulatory Disclosure (UK) As at 31 December 2012
 As at 31 December 2012") Morgan Stanley INTERNATIONAL LIMITED Pillar 3 Regulatory Disclosure (UK) As at 31 December 2012 1 1. Basel II Accord 3 2. Background to Pillar 3 Disclosures 3 3. Application of the Pillar 3 Framework 3
Morgan Stanley INTERNATIONAL LIMITED Pillar 3 Regulatory Disclosure (UK) As at 31 December 2012 1 1. Basel II Accord 3 2. Background to Pillar 3 Disclosures 3 3. Application of the Pillar 3 Framework 3
Analytical Pricing of CDOs in a Multi-factor Setting. Setting by a Moment Matching Approach
 Analytical Pricing of CDOs in a Multi-factor Setting by a Moment Matching Approach Antonio Castagna 1 Fabio Mercurio 2 Paola Mosconi 3 1 Iason Ltd. 2 Bloomberg LP. 3 Banca IMI CONSOB-Università Bocconi,
Direction. On a solo basis: Abbey National plc (the "principal firm(s)") Abbey National Treasury Services plc ("ANTS")
) Abbey National Treasury Services plc (ANTS)") Direction To: On a solo basis: Abbey National plc (the "principal firm(s)") Abbey National Treasury Services plc ("ANTS") On a consolidated basis: Abbey National plc Cater Allen Ltd Abbey Stockbrokers
Direction To: On a solo basis: Abbey National plc (the "principal firm(s)") Abbey National Treasury Services plc ("ANTS") On a consolidated basis: Abbey National plc Cater Allen Ltd Abbey Stockbrokers
COPYRIGHTED MATERIAL. Bank executives are in a difficult position. On the one hand their shareholders require an attractive
 chapter 1 Bank executives are in a difficult position. On the one hand their shareholders require an attractive return on their investment. On the other hand, banking supervisors require these entities
Dependence Modeling and Credit Risk
 Dependence Modeling and Credit Risk Paola Mosconi Banca IMI Bocconi University, 20/04/2015 and 27/04/2015 Paola Mosconi Lecture 6 1 / 112 Disclaimer The opinion expressed here are solely those of the author
Disclosure Report as at 30 June. in accordance with the Capital Requirements Regulation (CRR)
") Disclosure Report as at 30 June 2018 in accordance with the Capital Requirements Regulation (CRR) Contents 3 Introduction 4 Equity capital, capital requirement and RWA 4 Capital structure 8 Connection
Disclosure Report as at 30 June 2018 in accordance with the Capital Requirements Regulation (CRR) Contents 3 Introduction 4 Equity capital, capital requirement and RWA 4 Capital structure 8 Connection
Risk e-learning. Modules Overview.
 Risk e-learning Modules Overview Risk Sensitivities Market Risk Foundation (Banks) Understand delta risk sensitivity as an introduction to a broader set of risk sensitivities Explore the principles of
Support for the SME supporting factor? Empirical evidence for France and Germany*
 DRAFT Support for the SME supporting factor? Empirical evidence for France and Germany* Michel Dietsch (ACPR), Klaus Düllmann (ECB), Henri Fraisse (ACPR), Philipp Koziol (ECB), Christine Ott (Deutsche
Linking Stress Testing and Portfolio Credit Risk. Nihil Patel, Senior Director
 Linking Stress Testing and Portfolio Credit Risk Nihil Patel, Senior Director October 2013 Agenda 1. Stress testing and portfolio credit risk are related 2. Estimating portfolio loss distribution under
Deutsche Bank Annual Report 2017 https://www.db.com/ir/en/annual-reports.htm
 Deutsche Bank Annual Report 2017 https://www.db.com/ir/en/annual-reports.htm in billions 2007 2008 2009 2010 2011 2012 2013 2014 2015 2016 2017 Assets: 1,925 2,202 1,501 1,906 2,164 2,012 1,611 1,709 1,629
Statement of Policy The PRA s methodologies for setting Pillar 2 capital. December (Updating October 2017)
") Statement of Policy The PRA s methodologies for setting Pillar 2 capital December 2017 (Updating October 2017) Prudential Regulation Authority 20 Moorgate London EC2R 6DA Statement of Policy The PRA s
Statement of Policy The PRA s methodologies for setting Pillar 2 capital December 2017 (Updating October 2017) Prudential Regulation Authority 20 Moorgate London EC2R 6DA Statement of Policy The PRA s
Basel III Pillar 3 Disclosures Report. For the Quarterly Period Ended September 30, 2016
 Basel III Pillar 3 Disclosures Report For the Quarterly Period Ended September 30, 2016 BASEL III PILLAR 3 DISCLOSURES REPORT For the quarterly period ended September 30, 2016 Table of Contents Page 1
THE ASSET CORRELATION ANALYSIS IN THE CONTEXT OF ECONOMIC CYCLE
 THE ASSET CORRELATION ANALYSIS IN THE CONTEXT OF ECONOMIC CYCLE Lukáš MAJER Abstract Probability of default represents an idiosyncratic element of bank risk profile and accounts for an inability of individual
Basel II and Financial Stability: Singapore s Experience
 Basel II and Financial Stability: Singapore s Experience Bank Indonesia Seminar on Financial Stability 22 September 2006 Chia Der Jiun Executive Director, Prudential Policy Monetary Authority of Singapore
Regulatory Disclosures 30 June 2017
 Regulatory Disclosures 30 June 2017 CONTENTS PAGE 1. Key ratio 1 2. Overview of 2 3. Credit risk for non-securitization exposures 3 4. Counterparty credit risk 15 5. Securitization exposures 20 6. Market
CAPITAL MANAGEMENT - THIRD QUARTER 2010
 CAPITAL MANAGEMENT - THIRD QUARTER 2010 CAPITAL MANAGEMENT The purpose of the Bank s capital management practice is to ensure that the Bank has sufficient capital at all times to cover the risks associated
Investigating implied asset correlation and capital requirements: empirical evidence from the Italian banking system
 Investigating implied asset correlation and capital requirements: empirical evidence from the Italian banking system AUTHORS ARTICLE INFO JOURNAL FOUNDER Domenico Curcio Igor Gianfrancesco Antonella Malinconico
Fubon Bank (Hong Kong) Limited. Pillar 3 Regulatory Disclosures
 Limited. Pillar 3 Regulatory Disclosures") Fubon Bank (Hong Kong) Limited Pillar 3 Regulatory Disclosures Table of Contents Table OVA: Overview of risk management...- 2 - Template LI1: Differences between accounting and regulatory scopes of consolidation
Fubon Bank (Hong Kong) Limited Pillar 3 Regulatory Disclosures Table of Contents Table OVA: Overview of risk management...- 2 - Template LI1: Differences between accounting and regulatory scopes of consolidation
Capital Management 4Q Saxo Bank A/S Saxo Bank Group
 Capital Management 4Q 2013 Contents 1. INTRODUCTION... 3 NEW REGULATION IN 2014... 3 INTERNAL CAPITAL ADEQUACY ASSESSMENT PROCESS (ICAAP)... 4 BUSINESS ACTIVITIES... 4 2. CAPITAL REQUIREMENTS, PILLAR I...
CHINA CONSTRUCTION BANK (ASIA) CORPORATION LIMITED. Regulatory Disclosures For the year ended 31 December 2017 (Unaudited)
 CORPORATION LIMITED. Regulatory Disclosures For the year ended 31 December 2017 (Unaudited)") CHINA CONSTRUCTION BANK (ASIA) CORPORATION LIMITED For the year ended 31 December 2017 (Unaudited) Table of contents Page Key capital ratios 1 Template OVA: Overview of Risk Management 2 Template OV1:
CHINA CONSTRUCTION BANK (ASIA) CORPORATION LIMITED For the year ended 31 December 2017 (Unaudited) Table of contents Page Key capital ratios 1 Template OVA: Overview of Risk Management 2 Template OV1:
Deutsche Bank s response to the Basel Committee on Banking Supervision consultative document on the Fundamental Review of the Trading Book.
 EU Transparency Register ID Number 271912611231-56 31 January 2014 Mr. Wayne Byres Secretary General Basel Committee on Banking Supervision Bank for International Settlements Centralbahnplatz 2 Basel Switzerland
Supplementary Notes on the Financial Statements (continued)
") The Hongkong and Shanghai Banking Corporation Limited Supplementary Notes on the Financial Statements 2014 Contents Supplementary Notes on the Financial Statements (unaudited) Page Introduction... 2 1
The Hongkong and Shanghai Banking Corporation Limited Supplementary Notes on the Financial Statements 2014 Contents Supplementary Notes on the Financial Statements (unaudited) Page Introduction... 2 1
Basel III Pillar 3 Disclosures Report. For the Quarterly Period Ended June 30, 2017
 Basel III Pillar 3 Disclosures Report For the Quarterly Period Ended June 30, 2017 BASEL III PILLAR 3 DISCLOSURES REPORT For the quarterly period ended June 30, 2017 Table of Contents Page 1 Morgan Stanley
Northern Trust Corporation
 Northern Trust Corporation Pillar 3 Regulatory Disclosures For the quarterly period ended June 30, 2014 Northern Trust Corporation PILLAR 3 REGULATORY DISCLOSURES For the quarterly period ended June 30,
Supplementary Notes on the Financial Statements (continued)
") The Hongkong and Shanghai Banking Corporation Limited Supplementary Notes on the Financial Statements 2013 Contents Supplementary Notes on the Financial Statements (unaudited) Page Introduction... 2 1
The Hongkong and Shanghai Banking Corporation Limited Supplementary Notes on the Financial Statements 2013 Contents Supplementary Notes on the Financial Statements (unaudited) Page Introduction... 2 1
Basel III Pillar 3 disclosures
 Basel III Pillar 3 disclosures 6M14 In various tables, use of indicates not meaningful or not applicable. Basel III Pillar 3 disclosures 6M14 List of abbreviations 2 Introduction 3 General 3 Additional
Regulatory Capital Disclosures
 The Goldman Sachs Group, Inc. Regulatory Capital Disclosures For the quarterly period ended September 30, 2013 0 P age Introduction The Goldman Sachs Group, Inc. (Group Inc.) is a leading global investment
INTRODUCTION. This document is not audited and should be read in conjunction with our Q Quarterly Report to Shareholders and 2017 Annual Report.
 INTRODUCTION This document is not audited and should be read in conjunction with our Q3 2018 Quarterly Report to Shareholders and 2017 Annual Report. Effective November 1, 2012, Canadian banks are subject
BASEL II PILLAR 3 DISCLOSURE
 2012 BASEL II PILLAR 3 DISCLOSURE HALF YEAR ENDED 31 MARCH 2012 APS 330: CAPITAL ADEQUACY & RISK MANAGEMENT IN ANZ Important notice This document has been prepared by Australia and New Zealand Banking
Regulatory Capital Disclosures
 The Goldman Sachs Group, Inc. Regulatory Capital Disclosures For the period ended December 31, 2013 0 Page Introduction The Goldman Sachs Group, Inc. (Group Inc.) is a leading global investment banking,
Superseded document. Basel Committee on Banking Supervision. Consultative Document. The New Basel Capital Accord. Issued for comment by 31 July 2003
 Basel Committee on Banking Supervision Consultative Document The New Basel Capital Accord Issued for comment by 31 July 2003 April 2003 Table of Contents Part 1: Scope of Application... 1 A. Introduction...
2018 HSBC Bank Canada Regulatory Capital and Risk Management Pillar 3 Supplemental Disclosures as at March 31, 2018
 218 HSBC Bank Canada Regulatory Capital and Risk Management Pillar 3 Supplemental Disclosures as at March 31, 218 Index & Notes to Users Index Page Index Page Regulatory Capital Risk-Weighted Assets Exposure
Finalising Basel II: The Way from the Third Consultative Document to Basel II Implementation
 Finalising Basel II: The Way from the Third Consultative Document to Basel II Implementation Katja Pluto, Deutsche Bundesbank Mannheim, 11 July 2003 Content Overview Quantitative Impact Studies The Procyclicality
Regulatory Disclosures 30 June 2017
 Regulatory Disclosures 30 June 2017 CONTENTS PAGE Key ratio - Capital ratio 1 - Leverage ratio 1 Overview of RWA 2 Credit risk for non-securitization exposures 3 Counterparty credit risk 12 Securitization
Supervisory Views on Bank Economic Capital Systems: What are Regulators Looking For?
 Supervisory Views on Bank Economic Capital Systems: What are Regulators Looking For? Prepared By: David M Wright Group, Vice President Federal Reserve Bank of San Francisco July, 2007 Any views expressed
Liquidity Coverage Ratio Information (Consolidated) Sumitomo Mitsui Financial Group, Inc. and Subsidiaries
 Sumitomo Mitsui Financial Group, Inc. and Subsidiaries") Liquidity Coverage Ratio Information (Consolidated), Inc. and Subsidiaries Since, 2015, the Liquidity Coverage Ratio (hereinafter referred to as LCR ), the liquidity regulation under the Basel III, has
Liquidity Coverage Ratio Information (Consolidated), Inc. and Subsidiaries Since, 2015, the Liquidity Coverage Ratio (hereinafter referred to as LCR ), the liquidity regulation under the Basel III, has
Basel Committee on Banking Supervision. Basel III counterparty credit risk - Frequently asked questions
 Basel Committee on Banking Supervision Basel III counterparty credit risk - Frequently asked questions November 2011 Copies of publications are available from: Bank for International Settlements Communications
Basel III Pillar 3 disclosures
 Basel III Pillar 3 disclosures 6M13 For purposes of this report, unless the context otherwise requires, the terms Credit Suisse, the Group, we, us and our mean Credit Suisse Group AG and its consolidated
Goldman Sachs Group Holdings UK ( GSGHUK ) Pillar 3 Disclosures
 Pillar 3 Disclosures") Goldman Sachs Group Holdings UK ( GSGHUK ) Pillar 3 Disclosures Introduction The Goldman Sachs Group, Inc. (Group Inc.) is a leading global investment banking, securities and investment management firm
Goldman Sachs Group Holdings UK ( GSGHUK ) Pillar 3 Disclosures Introduction The Goldman Sachs Group, Inc. (Group Inc.) is a leading global investment banking, securities and investment management firm
Risk management. VaR and Expected Shortfall. Christian Groll. VaR and Expected Shortfall Risk management Christian Groll 1 / 56
 Risk management VaR and Expected Shortfall Christian Groll VaR and Expected Shortfall Risk management Christian Groll 1 / 56 Introduction Introduction VaR and Expected Shortfall Risk management Christian
2017 HSBC Bank Canada Regulatory Capital and Risk Management Pillar 3 Supplemental Disclosures as at June 30, 2017
 217 HSBC Bank Canada Regulatory Capital and Risk Management Pillar 3 Supplemental Disclosures as at June 3, 217 Index & Notes to Users Index Page Index Page Regulatory Capital Risk-Weighted Assets Exposure
2017 HSBC Bank Canada Regulatory Capital and Risk Management Pillar 3 Supplemental Disclosures as at March 31, 2017
 217 HSBC Bank Canada Regulatory Capital and Risk Management Pillar 3 Supplemental Disclosures as at March 31, 217 Index & Notes to Users Index Page Index Page Regulatory Capital Risk-Weighted Assets Exposure