Financial Overview for Fiscal Year ended December 2017
|
|
|
- Liliana Osborne
- 5 years ago
- Views:
Transcription

1 0 Financial Overview for Fiscal Year ended December 2017 February 6, 2018 Akihiro Kobayashi President & Chief Operating Officer Kobayashi Pharmaceutical Co., Ltd.
2 Table of Contents 1/37 11 Consolidated Results for Fiscal Year Ended December 31, 2017 Forecasts for Year Ending December 2018 Returns to Shareholders Progress of the Medium-Term Management Plan for 2017 to 2019 New Growth Investments Activities for ESG
3 2/37 2 Consolidated Results for Fiscal Year Ended December 31, 2017
4 Consolidated Results for Fiscal Year Ended December 31, /37 33 Achieved significant year-on-year growth in both revenue and income FY2017 (Jan. to Dec. 2017) Amount (million yen) Margin (%) Comparable period in 2016 (Jan. to Dec. 2016) Amount (million yen) Percentage (%) Published forecasts (published on February 1, 2017) Amount (million yen) Percentage (%) Net sales 156, , % 150, % Operating income Ordinary income 22, % 18, % 24, % 20, % 20, % 21, % Net income 15, % 15, % 15, % *Comparable period in 2016: Results for January to December 2016 were totaled for the purpose of comparison with FY2017.
")

5 Achieved increases in net income for 20 consecutive years 4/37 44 (100 million yen) August 2000 Listed on TSE April 1999 Listed on OSE 50 0 Mar Dec. 2017
6 Decreases Increases Highlights of Consolidated Results [Net sales] <Increases/decreases in net sales (change from the comparable period in 2016)> 5/37 55 (1) Increased revenues from overseas business (+4 billion yen) (2) Contribution of new products (+5.4 billion yen) (3) Increase in sales of existing products in Japan (+1 billion yen) (4) Increase in inbound demand (+2 billion yen) (5) Growth in direct marketing business (+0.6 billion yen) (1) Decreased sales in Other Businesses (-1.1 billion yen) * Including decreased revenues in the medical-related business (-1.4 billion yen) Year-on-year change 108.3% *Comparable period in 2016: Results for January to December 2016 were totaled for the purpose of comparison with FY2017.
7 Operating income for Jan. to Dec Sales increase Cost reduction Loss on disposal of inventory Price increase Other costs Advertising expenses Sales promotion expenses R&D expenses Physical distribution costs Other expenses Operating income for Jan. to Dec Highlights of Consolidated Results [Operating income] Assisted growth by actively investing in advertisements and achieved a sharp increase in income. (Unit: 100 million yen) /37 Year-on-year change 124.3% Factor for increase Factor for decrease Production costs SGA expenses *Comparable period in 2016: Results for January to December 2016 were totaled for the purpose of comparison with FY2017.
8 Segment Results 7/37 77 The three major businesses (Domestic Consumer Products, Overseas Consumer Products, and Direct Marketing Businesses) achieved sales increases. Domestic Consumer Products Business (Sales at stores in Japan and Kiribai Chemical) Amount (million yen) Year-on-year change (%) Overseas Consumer Products Business Amount (million yen) Year-on-year change (%) Direct Marketing Business Amount (million yen) Year-on-year change (%) Net sales 123,494 *113, % *106.6% 21, % 10, % Operating income 21,323 *20, % *117.8% % -75 Comparable period in * Net income and operating income excluding Kiribai Chemical *Comparable period in 2016: Results for January to December 2016 were totaled for the purpose of comparison with FY2017.


9 8/37 8 Domestic Consumer Products Business (Sales at stores in Japan and Kiribai Chemical)
10 Performance of Domestic Business 9/37 99 Net sales : billion yen (107.3% year on year) Operating income: 21.3billion yen (119.1% year on year) (100 million yen) 1500 <Net sales> 1,150 1,234 <Operating income> (100 million yen) (%) Operating income Operating margin % 17.3% Jan. to Dec Jan. to Dec Jan. to Dec Jan. to Dec Jan. to Dec Jan. to Dec Jan. to Dec Jan. to Dec Jan. to Dec. Jan. to Dec * The results for each period are prepared using the actual results for the corresponding periods in the past.
11 Sales by Business Category Net sales increased significantly, supported by strong sales of both new and existing products. 10/ FY2017 (Jan. to Dec. 2017) Comparable period in 2016 (Jan. to Dec. 2016) Amount (million yen) Amount (million yen) Difference (million yen) Percentage (%) Healthcare products 58,127 53,494 4, % Household products 52,352 50,334 2, % Skin care products 6,047 5, % Body warmers 6,965 5,873 1, % Total 123, ,090 8, % *Comparable period in 2016: Results for January to December 2016 were totaled for the purpose of comparison with FY2017.
 A significant increase in revenues cannot be expected because sales in the comparable period in 2016 were very high.")
. Increase in inbound demand (+0.8 billion yen) Year-on-year change 108.")
12 Reasons for Strong Sales Initial forecast (Year-on-year change) Reasons for strong sales 11/37 Results 111 First Half (Jan. to Jun. 2017) A significant increase in revenues cannot be expected because sales in the comparable period in 2016 were very high. In line with the projection Customer demand shifted to high value-added products Sales of new products, which were launched three to four years ago, were strong. Better than projected The increase in advertising expenses led to robust sales (especially of pharmaceutical products). Increase in inbound demand (+0.8 billion yen) Year-on-year change 108.1% In line with the projection Second Half (Jul. to Dec. 2017) An increase in revenues is expected but there are some uncertainties in body warmers and some other products. Customer demand shifted to high value-added products Sales of new products, which were launched three to four years ago, were strong. Better than projected The increase in advertising expenses led to robust sales (especially of pharmaceutical products). Year-on-year change 106.7% Strong sales of Kiribai body warmers Increase in inbound demand (+1.2 billion yen)


")


13 Inbound Demand 12/ Inbound demand is estimated to be 7.5 billion yen (up 2 billion yen year on year) <Estimated inbound demand> (100 million yen) "Twelve Supreme Drugs You Must Buy When You Visit Japan" Source: Sofu (Chinese social media) (Oct. 17, 2014) 19 Jan. to Dec Jan. to Dec Jan. to Dec Jan. to Dec OTC Pharmaceuticals Supplements Household products
14 Contribution of New Product Sales (excluding the Direct Marketing business) Both the initial year contribution rate and the four year contribution rate declined due to the launch of fewer new products in autumn 2016 and spring in 2017, and strong sales growth of existing products. (%) Red: Four year contribution rate Blue: Initial year contribution rate / Year ended Mar Year ended Mar Year ended Mar Year ended Mar Year ended Mar Year ended Dec (nine months) Year ended Dec. 2017
15 Values of Contribution by New Products 14/ Net sales of four-year new products* increased, supported by the development of new products (100 million yen) Red: Net sales of Four year new products Blue: Net sales of Initial year new products *Four-year new products: New products launched over the past four years Year ended Mar Year ended Mar Year ended Mar Year ended Mar Year ended Mar Year ended Dec (nine months) Year ended Dec. 2017


16 15/37 15 Overseas Consumer Products Business


 (100 million yen) <Net sales> Net sales")


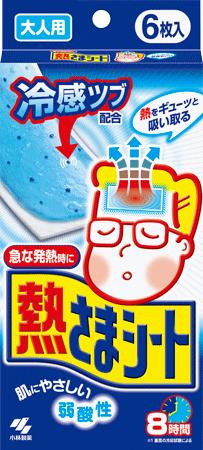
17 Performance of Overseas Business 16/ Body warmers sold well in the U.S., while sales of Netsusama Sheet grew in China and Southeast Asia. Net sales : 21.7 billion yen (122.8% year on year) Operating income: 0.9 billion yen (302.4% year on year) (100 million yen) <Net sales> Net sales Overseas sales ratio (%) % 13.9% Jan. to Dec Jan. to Dec Jan. to Dec. Jan. to Dec. Jan. to Dec * The results for each period are prepared using the actual results for the corresponding periods in the past.


18 17/37 17 Direct Marketing Business


 Operating loss: 0.")


19 Performance of Direct Marketing Business 18/ A V-shaped recovery in net sales continued from the previous year thanks to active investment in advertisements. Net sales : 10.1 billion yen (106.9% year on year) Operating loss: 0.07 billion yen (an operating loss of 0.28 billion yen in the comparable period in 2016) (100 million yen) <Net sales> Supplements Skin care products Year-on-year change 105% 0 Jan. to Dec Jan. to Dec Year-on-year change 113% Jan. to Dec Jan. to Dec Jan. to Dec * The results for each period are prepared using the actual results for the corresponding periods in the past.
20 19/37 19 Forecasts for Year Ending December 2018
21 Highlights of Forecasts for Consolidated Results The Company aims to achieve the 21st consecutive term of growth with increased net sales and increased operating income. 20/ FY2018 forecasts (Jan. to Dec. 2018) Amount (million yen) Margin (%) FY2017 results (Jan. to Dec. 2017) Amount (million yen) Percentage (%) Medium-term Management Plan for (announced on November 1, 2016) Amount (million yen) Net sales 163, , % 165,000 Operating income Ordinary income 23, % 22, % 24, % 24, % 23,000 - Net income 17, % 15, % ROE % - 17,000 Over 10.0%
22 21/37 21 Returns to Shareholders
23 Mar Dec Dec forecast Changes in Dividend Payment 22/ (yen) Achieved an increase in dividend payment for 19 consecutive terms (Interim dividend 28 yen + Year-end dividend 30 yen (+4 yen increase) = Annual dividend 58 yen per share). The aim is to achieve an increase in dividend payment for 20 consecutive terms in FY2018, with an increase of 2 yen/share. Dividend amount Dividend pay-out ratio Interim dividend: 28 yen (paid in Sept. 2017) Year-end dividend: 30 yen (to be paid in March 2018) (%) % 27.9%
24 23/37 23 Progress of the Medium-Term Management Plan for 2017 to 2019
25 Outline of the Medium-Term Management Plan for 2017 to 2019 <Future goals> <Consolidated financial targets> Announced on November 1, 2016 Theme: Growth with real strength To further improve the ability of new product development and cultivation, achieve growth with real strength, and become the No. 1 company in new market creation that can solve customers problems 24/ FY2019 targets *1 Comparable period in 2016 results *2 Year on year change *3 Net sales 165 billion yen billion yen 114% Operating income 23 billion yen 18.4 billion yen 124% Net income 17 billion yen 15 billion yen 113% ROE 10% 10% - *1: The financial targets are minimum targets; the Company will aim for higher results. *2: The results of the comparable period in 2016 are the total of the results for January to December *3: Comparison to results for January to December 2016
26 Outline of the Medium-Term Management Plan for 2017 to 2019 <Outline of strategies> 25/ Promote the four growth businesses* 2. Invest in growth for the future 3. Develop and cultivate new market creator products 4. Aim to be a company where employees can feel growth * Four growth businesses: Overseas, Direct Marketing, Skincare, and Kampo
27 Outline of strategies: Promote the Four Growth Businesses Overseas business Strengthen the OTC Pharmaceuticals business mainly in North America and China. Cultivate products such as Netsusama Sheet, Anmeltz and body warmers. Direct Marketing business Develop new high-profile products that would lead to new customer acquisition. Develop brands by mixing sales at stores and by direct marketing. Skincare business Create a brand that would become the third pillar after Keshimin and Eau de Muge. Kampo business FY2019 target amount 27 billion yen FY2019 target amount 12 billion yen FY2019 target amount 9 billion yen FY2019 target amount 26/ Change from the comparable period in 2016* 150% Change from the comparable period in 2016* 126% Change from the comparable period in 2016* 167% Change from the comparable period in 2016* Continue to pursue the development of products that are easier for customers to choose, depending on their constitution and symptoms 12.5 billion yen 113% * Comparison to results for January to December 2016
28 Progress of the Four Growth Businesses 27/ FY2016 results FY2017 results FY2019 target Overseas business 17.7 billion yen 21.7 billion yen Progress rate 44% 27 billion yen Direct marketing business 9.5 billion yen 10.1 billion yen Progress rate 27% 12 billion yen Skincare business 5.4 billion yen 6 billion yen Progress rate 17% 9 billion yen Kampo business 11.2 billion yen 12.7 billion yen Progress rate 124% 12.5 billion yen Achieved the target * The progress rates are based on the results for Jan. to Dec. 2016, compared with the target values for FY2019.


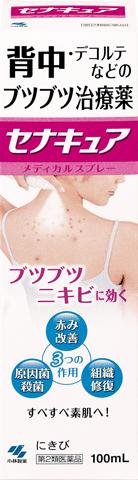
29 Four Growth Businesses (Overseas Business) 28/ What the Company is striving to achieve: FY2019 target amount FY2017 results progress rate Evaluation Strengthen product marketing, such as body warmers and Netsusama Sheet in North America, China, and Southeast Asia. Strengthen the OTC Pharmaceuticals business. 27 billion yen 21.7 billion yen 44% [Actions in the U.S.] Strengthen the OTC Pharmaceuticals business Renewed the package for MAX FREEZE in Nov Introduced MAX HEAT (Anmeltz in the U.S.) to the U.S. market in fiscal Package renewal New Product Before renewal After renewal
![Four Growth Businesses (Overseas Business) [Actions in China] Expand](/docs-images/83/88911644/images/30-0.jpg "sales Brand recognition of Kobayashi Pharmaceutical is high;")


 N=1,248 Sales at stores (Jan. to Dec.")
30 Four Growth Businesses (Overseas Business) [Actions in China] Expand sales Brand recognition of Kobayashi Pharmaceutical is high; deliverability has been strengthened. Sales increased significantly in both sales at stores and sales via EC. Brand recognition of Kobayashi Pharmaceutical Brand recognition of Kobayashi Pharmaceutical is very high compared to other Japanese competitors. Don t know the brand 16% Have heard of the brand name 36% Know the Kobayashi brand very well 48% Quantitative survey in May 2017 Males and females in the age bracket 20 to 39, monthly income of 6,000 RMB or higher Six cities (Beijing, Shanghai, Guangzhou, Chengdu, Hangzhou, and Suzhou) N=1,248 Sales at stores (Jan. to Dec. 2017) Year-on-year change 150% Sales via EC (Jan. to Dec. 2017) Year-on-year change 163% EC website 29/
 FY2019 target amount 12 billion yen FY2017 results progress rate 30/37 Evaluation 10.")
31 Sales at stores Direct marketing Four Growth Businesses (Direct Marketing Business) What the Company is striving to achieve: Develop brands by mixing sales at stores and by direct marketing (example: Salacia) FY2019 target amount 12 billion yen FY2017 results progress rate 30/37 Evaluation 10.1 billion yen 27% 3030 Cultivate the Salacia brand both by direct marketing and at stores TV CM Brand website Academic study Symposium, etc. Expanded sales both by direct marketing and at stores Net sales: 0.3 billion yen (Year-on-year change 605%) Net sales: 0.2 billion yen (Year-on-year change 205%)
 What the")


32 Four Growth Businesses (Skincare Business) What the Company is striving to achieve: Cultivate Madame Juju and Bioil brands Develop and cultivate the brands and establish their unique market positions FY2019 target amount 9 billion yen Third pillar FY2017 results progress rate 31/37 Evaluation 6 billion yen 17% Fourth pillar 3131 First pillar Second pillar Keshimin Eau de Muge Madame Juju Bioil


33 Four Growth Businesses (Kampo Business) 32/ What the Company is striving to achieve: FY2019 target amount FY2017 results progress rate Evaluation The Company continues the development and marketing of new products under an easy-to-understand concept billion yen 12.7 billion yen 124% Achieved the target New products The Company launched three new products in Existing products Sales of existing products expanded sharply thanks to advertisements under an easy-to-understand concept.


34 Growth of Domestic Business 33/ What the Company is striving to achieve: Health care products Expansion of the medicated skin care products market Brand development in cooperation with the direct marketing business Efforts to develop switch OTC pharmaceuticals Expansion of the product line of foods with function claims Progress toward the target Household products Launch of high value-added products Development of healthcareconscious household products Attempts to create new markets
35 34/37 34 New Growth Investments
36 Invest in Growth for the Future 35/ Medium-Term Management Plan for 2017 to 2019 Invest in Growth for the Future Announced in November 2016 M&A Items R&D and new businesses Investment budget ( ) 30 billion yen 3 billion yen Schedule new large-scale investments in view of the global development of OTC drugs Challenges Increasing production capacity to respond to the expected increase in demand Manufacturing in compliance with global standards (PIC/S) Expansion of the brands to overseas markets, and actions to cope with the global risks Capacity shortage in the current Central R&D Laboratory Actions Build a new production plant Trade mark management in individual countries, security control and other measures Relocation of the Central R&D Laboratory Maximum investment budget (within four to seven years) 30 billion yen * These proposed investments are still in the review stage and not final decisions.
37 36/37 36 Activities for ESG

38 Activities for ESG 37/ E S G Strengthen the functions of the Group Environment Committee Strengthen the PDCA cycle for energy saving Social activities Develop human resources Visualize the growth of employees Establish an assessment council of the Board of Directors (Three outside directors and two outside corporate auditors)


39 <Note> Of the Company s current business performance, plans and strategies included in this material, items that are not historical facts are outlooks on future performance, which are based on the judgment of the Company s management according to currently available information. Therefore, please note that actual performance may differ significantly from the future outlook described in this material due to changes in various factors. 38
Six months of FY ending December 31, (0.4) (1.9) 22.5 (0.4) (0.3) (0.4) (0.1) (0.4) (0.7) (2.0) 0.9 (1.
 (1.9) 22.5 (0.4) (0.3) (0.4) (0.1) (0.4) (0.7) (2.0) 0.9 (1.") November 11, ISEKI & CO., LTD. Supplementary Information to Consolidated Financial Results (April 1, September 30, ) I. Consolidated business results for the six months ended September 30, (Billions of
November 11, ISEKI & CO., LTD. Supplementary Information to Consolidated Financial Results (April 1, September 30, ) I. Consolidated business results for the six months ended September 30, (Billions of
Yamaha Corporation Analyst and Investor Briefing on the Third Quarter of Fiscal Year Ending March 31, 2017 (FY2017.3) February 6, 2017
 February 6, 2017") Yamaha Corporation Analyst and Investor Briefing on the Third Quarter of Fiscal Year Ending March 31, 2017 () February 6, 2017 Overview of Performance in the First Three Quarters of (Nine Months) 2 Results
Yamaha Corporation Analyst and Investor Briefing on the Third Quarter of Fiscal Year Ending March 31, 2017 () February 6, 2017 Overview of Performance in the First Three Quarters of (Nine Months) 2 Results
Summary of Financial Statements (Japanese GAAP) (Consolidated) Financial Results for the Fiscal Year Ended December 31, 2016 February 1, 2017
 (Consolidated) Financial Results for the Fiscal Year Ended December 31, 2016 February 1, 2017") Summary of Financial Statements (Japanese GAAP) (Consolidated) Financial Results for the Fiscal Year Ended December 31, 2016 February 1, 2017 Listed exchanges Listed company name : Tokyo : Kobayashi Pharmaceutical
Summary of Financial Statements (Japanese GAAP) (Consolidated) Financial Results for the Fiscal Year Ended December 31, 2016 February 1, 2017 Listed exchanges Listed company name : Tokyo : Kobayashi Pharmaceutical
Analyst and Investor Briefing on the Third Quarter of Fiscal Year Ending March 31, 2016 (FY2016.3) February 5, 2016
 February 5, 2016") Yama ha Corporati on Analyst and Investor Briefing on the Third Quarter of Fiscal Year Ending March 31, 2016 (FY2016.3) February 5, 2016 Overview of Performance in the Third Quarter (October-December)
Yama ha Corporati on Analyst and Investor Briefing on the Third Quarter of Fiscal Year Ending March 31, 2016 (FY2016.3) February 5, 2016 Overview of Performance in the Third Quarter (October-December)
1Q of FY ending December 31, (0.2) (1.9) 11.3 (0.2) (0.2) (0.2) (0.2) (1.2) (89.2) 0.1
 (1.9) 11.3 (0.2) (0.2) (0.2) (0.2) (1.2) (89.2) 0.1") August 6, ISEKI & CO., LTD. Supplementary Information to Consolidated Financial Results (April 1, June 30, ) I. Consolidated business results for the three months ended June 30, (Billions of yen, %) Year-on
August 6, ISEKI & CO., LTD. Supplementary Information to Consolidated Financial Results (April 1, June 30, ) I. Consolidated business results for the three months ended June 30, (Billions of yen, %) Year-on
Results for the Nine Months of Fiscal 2011: Supplementary Materials POLA ORBIS HOLDINGS INC. DIRECTOR OF FINANCE/MANAGEMENT PLANNING DIV.
 Results for the Nine Months of Fiscal 2011: Supplementary Materials POLA ORBIS HOLDINGS INC. DIRECTOR OF FINANCE/MANAGEMENT PLANNING DIV. Naoki Kume This report contains projections of performance and
Summary of Financial Statements (Japanese GAAP) (Consolidated) Financial Results for the 3rd Quarter of the Fiscal Year Ending March 31, 2016
 (Consolidated) Financial Results for the 3rd Quarter of the Fiscal Year Ending March 31, 2016") Summary of Financial Statements (Japanese GAAP) (Consolidated) Financial Results for the 3rd Quarter of the Fiscal Year Ending March 31, 2016 Listed exchanges : Tokyo Listed company name : Kobayashi Pharmaceutical
Summary of Financial Statements (Japanese GAAP) (Consolidated) Financial Results for the 3rd Quarter of the Fiscal Year Ending March 31, 2016 Listed exchanges : Tokyo Listed company name : Kobayashi Pharmaceutical
Summary of Financial Statements (Japanese GAAP) (Consolidated) Financial Results for the 2nd Quarter of the Fiscal Year Ending December 31, 2018
 (Consolidated) Financial Results for the 2nd Quarter of the Fiscal Year Ending December 31, 2018") Summary of Financial Statements (Japanese GAAP) (Consolidated) Financial Results for the 2nd Quarter of the Fiscal Year Ending December 31, 2018 Listed exchanges : Tokyo Listed company name : Kobayashi
Summary of Financial Statements (Japanese GAAP) (Consolidated) Financial Results for the 2nd Quarter of the Fiscal Year Ending December 31, 2018 Listed exchanges : Tokyo Listed company name : Kobayashi
Results of Operations Half Year Ended September 30, 2009 KITO CORPORATION. TSE 1 st Section
 Results of Operations Half Year Ended September 30, 2009 KITO CORPORATION TSE 1 st Section November 19, 2009 Content 1. First Half of FY 2010 Financial Results 2. Second Half of FY 2010 Financial Outlook
FY ended March 31, 2015 Restated *1. Year-on year change. Difference (forecast/ actual) FY ended December 31, December 31, 2015 Forecast *2
 FY ended December 31, December 31, 2015 Forecast *2") February 12, 2016 ISEKI & CO., LTD. Supplementary Information to Consolidated Financial Results (April 1, ) I. Consolidated business results for the fiscal year ended (Billions of yen, %) March 31, Restated
February 12, 2016 ISEKI & CO., LTD. Supplementary Information to Consolidated Financial Results (April 1, ) I. Consolidated business results for the fiscal year ended (Billions of yen, %) March 31, Restated
GS Yuasa Corporation Consolidated Earnings Report for the. (Japanese GAAP)
") GS Yuasa Corporation Consolidated Earnings Report for the December 31, 2017 (Japanese GAAP) February 2, 2018 Stock listing: Tokyo Stock Exchange Securities code: 6674 URL: http://www.gs-yuasa.com/en Representative:
GS Yuasa Corporation Consolidated Earnings Report for the December 31, 2017 (Japanese GAAP) February 2, 2018 Stock listing: Tokyo Stock Exchange Securities code: 6674 URL: http://www.gs-yuasa.com/en Representative:
Summary of Financial Statements (Japanese GAAP) (Consolidated) Financial Results for the 2nd Quarter of the Fiscal Year Ending December 31, 2016
 (Consolidated) Financial Results for the 2nd Quarter of the Fiscal Year Ending December 31, 2016") Summary of Financial Statements (Japanese GAAP) (Consolidated) Financial Results for the 2nd Quarter of the Fiscal Year Ending December 31, 2016 Listed exchanges : Tokyo Listed company name : Kobayashi
Summary of Financial Statements (Japanese GAAP) (Consolidated) Financial Results for the 2nd Quarter of the Fiscal Year Ending December 31, 2016 Listed exchanges : Tokyo Listed company name : Kobayashi
First Quarter Results and Outlook
 SHISEIDO Co., Ltd. FY2013 First Quarter Results and Outlook July 31, 2013 In this document, statements other than historical facts are forward-looking statements that reflect our plans and expectations.
Financial Results for the First Nine Months of 2018
 Financial Results for the First Nine Months of Lion Corporation November 5, 1 1. Financial Results for the Nine Months Ended September 30, (IFRS) (Billions of yen) Jan. Sep. 2017 Y-o-Y change Amount %
FY11. Financial Results T.HASEGAWA T.HASEGAWA CO., LTD. R&D Center
 FY11 Financial Results T.HASEGAWA CO., LTD. R&D Center 1 Caution with Respect to Forward-Looking Statements: This material contains forward-looking statements about the future performance of T. Hasegawa,
FY2016 First Half Results and Full-Year Forecast
 FY2016 First Half Results and Full-Year Forecast August 9, 2016 Masahiko Uotani President and Group CEO FY2016 1H Results 1 FY2016 1H Results: Executive Summary Back on growth track, with zero growth behind
FY2016 First Half Results and Full-Year Forecast. August 9, Masahiko Uotani. President and Group CEO. FY2016 1H Results
 First Half Results and Full-Year Forecast August 9, 2016 Masahiko Uotani President and Group CEO 1H Results 1 1H Results: Executive Summary Back on growth track, with zero growth behind us Sustained growth
Sales Operating profit Ordinary income. Nine months ended Dec. 31, Nine months ended Dec. 31,
 February 5, 2016 Summary of Consolidated Financial Results for the Third Quarter of the Fiscal Year Ending March 31, 2016 (Nine Months Ended December 31, 2015) [Japanese GAAP] Company name: AOKI Holdings
KADOKAWA DWANGO CORPORATION Financial Results for the Fiscal Year Ended March 31, 2016
 KADOKAWA DWANGO CORPORATION Financial Results for the Fiscal Year March 31, 2016 0 Contents 1 1. Review of the Fiscal Year March 31, 2016 2. Policies for the Fiscal Year Ending March 31, 2017 3. Medium-Term
Q1 Results for FY 2018 Earnings Results July 1, September 30, 2017
 Don Quijote Holdings. Co., Ltd. Q1 Results for FY 2018 Earnings Results July 1, - September 30, November 6, 0 Earnings summary 3 months to Sep. 3 months to Sep. 2016 (Millions of yen) Actual Share YoY
Executive Summary of Consolidated Financial Results for the year ended March 31,2018. Yakult Honsha Co., Ltd.
 Executive Summary of Consolidated Financial Results for the year ended March 31,2018 Yakult Honsha Co., Ltd. May 10 th 2018 General outline of Consolidated financial results Total Increase in sales and
Business Results for the ended Nov. 31, 2015
 Business Results for the ended Nov. 31, 2015 Jan. 27, 2016 Outline 1 of Results & Progress of Mid-term Business Plan. 212 2 Results & FY2016 Forecast 1325 Full-Year Results FY2014 Full Year Full Year In
Summary of Financial Statements (Japanese GAAP) (Consolidated) Financial Results for the 2nd Quarter of the Fiscal Year Ending March 31, 2016
 (Consolidated) Financial Results for the 2nd Quarter of the Fiscal Year Ending March 31, 2016") Summary of Financial Statements (Japanese GAAP) (Consolidated) Financial Results for the 2nd Quarter of the Fiscal Year Ending March 31, 2016 Listed exchanges : Tokyo Listed company name : Kobayashi Pharmaceutical
Summary of Financial Statements (Japanese GAAP) (Consolidated) Financial Results for the 2nd Quarter of the Fiscal Year Ending March 31, 2016 Listed exchanges : Tokyo Listed company name : Kobayashi Pharmaceutical
Financial Results for the First Half of the Fiscal Year Ending March 31, 2017
 Second Quarter Financial Results for the First Half of the Fiscal Year Ending March 31, 2017 NOK CORPORATION (7240 / TSE1) November 9, 2016 Disclaimer Any plans, targets, forecasts, strategies, policies
Financial Results for the Fiscal Year Ended December, Lion Corporation Itsuo Hama Representative Director and President, Executive Officer
 February 10, 2017 Financial Results for the Fiscal Year Ended December, 2016 Lion Corporation Itsuo Hama Representative Director and President, Executive Officer Contents Financial Results for 2016 Financial
Presentation Materials
 Azbil Corporation RIC: 6845.T, Sedol: 6985543 Presentation Materials For the First Quarter of the Fiscal Year Ending March 31, 2018 (Based on Japanese GAAP) Human-centered Automation 1. Financial
Presentation Materials
 Azbil Corporation RIC: 6845.T, Sedol: 6985543 Presentation Materials For the Third Quarter of the Fiscal Year Ending March 31, 2018 (Based on Japanese GAAP) Human-centered Automation 1. Financial
Supplemental Documents for Fiscal Year May 15, 2015 Nippon Suisan Kaisha, Ltd.
 Supplemental Documents for Fiscal Year 214 May 15, 215 Nippon Suisan Kaisha, Ltd. Overview of FY214 Both revenue and income increased in Marine Products and Food Products. Revenue and income decreased
Trend Micro FY Q / Annual Results. Mahendra Negi, CFO, Representative director February 4, 2003
 Trend Micro FY2002. 4Q / Annual Results Mahendra Negi, CFO, Representative director February 4, 2003 1 Forward Looking Statements Certain statements that we make in this presentation are forward-looking
Financial Summary. Mitsui Chemicals, Inc. February 5, Results for 3 rd Quarter of FY2018 & Outlook for FY2018
 Financial Summary Results for 3 rd Quarter of FY2018 & Outlook for FY2018 Mitsui Chemicals, Inc. February 5, 2019 FY2018 indicates the period from April 1, 2018 to March 31, 2019. Contents 1.
Results for Year Ended March 2013 Outlook for Year Ending March 2014
 SHISEIDO Co., Ltd. Results for Year Ended March 2013 Outlook for Year Ending March 2014 2013-4-26 In this document, statements other than historical facts are forward-looking statements that reflect our
Singapore Exchange Limited Building Tomorrow s Market, Today
 Singapore Exchange Limited Building Tomorrow s Market, Today Singapore Exchange SGX: Building Tomorrow s Market, Today SGX: Our Fundamentals FY2002 Half Year Results Going Forward SGX: Building Tomorrow
FY ended December 31, 2015 Restated basis *1. Year-on-year change. FY ended December 31, 2016 Forecast *2. Difference (forecast/ actual)
") February 14, 2017 ISEKI & CO., LTD. Supplementary Information to Consolidated Financial Results (January 1, ) I. Consolidated business results for the fiscal year ended (Billions of yen, %) 2015 Restated
February 14, 2017 ISEKI & CO., LTD. Supplementary Information to Consolidated Financial Results (January 1, ) I. Consolidated business results for the fiscal year ended (Billions of yen, %) 2015 Restated
New Medium and Long-term Business Plan
 To Everyone February 10, 2017 Company Name: NICCA CHEMICAL CO., LTD. Representative: Yasumasa Emori, President (Stock Exchange Code: 4463 TSE 1 st Section and NSE 1 st Section) Inquiries: Shoya Sawasaki
ANNOUNCEMENT OF PRELIMINARY RESULTS
 The leading high service distributor to engineers worldwide ANNOUNCEMENT OF PRELIMINARY RESULTS YEAR ENDED 31 MARCH 2009 29 May 2009 Agenda Overview and current trading Ian Mason Financial performance
242, , , , , , , ,
 Summary of Consolidated Financial Results For the Third Quarter of the Fiscal Year Ending March 31, 2012 (Nine Months Ended December 31, 2011) February 3, 2012 Company name: Nippon Shokubai Co., Ltd. Listing:
FY2017 Third Quarter Results and Full-Year Forecast
 Third Quarter Results and Full-Year Forecast November 9, 2017 Norio Tadakawa Corporate Officer, CFO Shiseido Company, Limited In this document, statements other than historical facts are forward-looking
Consolidated Financial Results for 3Q FY2018
 Consolidated Financial Results for 3Q FY2018 February 1, 2019 Fuji Electric Co., Ltd. 2019 Fuji Electric Co., Ltd. All rights reserved. 1 Summary of Consolidated Financial Results for (Apr. - Dec.) FY2018
Consolidated Financial Results for FYE 2018
 Consolidated Financial Results for SUBARU CORPORATION Toshiaki Okada Corporate Executive Vice President & CFO May 11 th, 20180 0 Summary Consolidated Financial Results for Net sales and global unit sales
Mazda Motor Corporation FY2003 RESULTS & FY2004 PROJECTIONS
 Mazda Motor Corporation FY2003 RESULTS & FY2004 PROJECTIONS May 13, 2004 1 FY2003 Results & FY2004 Projections OUTLINE Highlights FY2003 Results FY2004 Projections U.S. Market Actions Close 2 FY2003 Results
Operating Results and Financial Position
 SHIMADZU CORPORATION IR Group Corporate Strategy Planning Department 1 Nishinokyo-Kuwabaracho, Nakagyo-ku Kyoto 604-8511 Japan http://www.shimadzu.com/ Tel: +81 75-823-1128 August 5, 2009 Operating Results
FY2014 First Half Results
 は FY2014 First Half s October 31, 2014 Norio Tadakawa Corporate Officer, CFO Shiseido Co., Ltd. In this document, statements other than historical facts are forward-looking statements that reflect our
Financial Report for 3 rd Quarter of FY (April 2010 December 2010)
") Financial Report for 3 rd Quarter of FY2011.3 (April 2010 December 2010) January 2011 Osaka Gas Co., Ltd. 1 1 I. Business Results for 3 rd Quarter of FY2011.3 Management information is available on Osaka
Financial Report for 3 rd Quarter of FY2011.3 (April 2010 December 2010) January 2011 Osaka Gas Co., Ltd. 1 1 I. Business Results for 3 rd Quarter of FY2011.3 Management information is available on Osaka
Fuji Heavy Industries Ltd.
 President & CEO, Yasuyuki Yoshinaga Fuji Heavy Industries Ltd. May 9, 2014 0 Business Results for the FYE2014 ( 100M) Consolidated automobile sales FYE2013 FYE2014 YoY 724,000 825,000 High +13.9 % Net
Financial Results for the Fiscal Year Ended March 31, 2018
 Fiscal Year Financial Results for the Fiscal Year Ended March 31, 2018 NOK CORPORATION (7240 / TSE1) May 10, 2018 Disclaimer Any plans, targets, forecasts, strategies, policies and opinions relating to
2Q of FY ended December 31, 2015 Restated basis *1. Year-on year change (Restated basis) 2Q of FY ending December 31, 2016 Forecast
 2Q of FY ending December 31, 2016 Forecast") August 10, 2016 ISEKI & CO., LTD. Supplementary Information to Consolidated Financial Results (January 1, 2016 June 30, 2016) I. Consolidated business results for the six months ended June 30, 2016 (Billions
August 10, 2016 ISEKI & CO., LTD. Supplementary Information to Consolidated Financial Results (January 1, 2016 June 30, 2016) I. Consolidated business results for the six months ended June 30, 2016 (Billions
Supplemental Documents for 1 st Quarter of FY2017. August 4, 2017 Nippon Suisan Kaisha, Ltd.
 Supplemental Documents for 1 st Quarter of FY2017 August 4, 2017 Nippon Suisan Kaisha, Ltd. Overview of the 1 st Quarter of FY2017 Increase both in revenue and income thanks to significant recovery of
Financial Summary for the Nine Months Ended December 31, 2009 (From April 1 to December 31, 2009) February 10, 2010 Dentsu Inc.
 February 10, 2010 Dentsu Inc.") Financial Summary for the Nine Months Ended December 31, 2009 (From April 1 to December 31, 2009) February 10, 2010 Dentsu Inc. 1 Cautionary Statement This document contains forward-looking statements
Financial Summary for the Nine Months Ended December 31, 2009 (From April 1 to December 31, 2009) February 10, 2010 Dentsu Inc. 1 Cautionary Statement This document contains forward-looking statements
Renesas Electronics Reports Full Year 2017 Financial Results
 Renesas Electronics Reports Full Year 2017 Financial Results Significant Increase in Full Year Sales Year-On-Year Driven by Growth Mainly in Automotive and Industrial Businesses and Integration of Intersil.
Consolidated Financial Results for the 1 st Half of FYE 2019
 Consolidated Financial Results for the 1 st Half of SUBARU CORPORATION Toshiaki Okada Corporate Executive Vice President & CFO November 5 th, 2018 1 Summary Consolidated Financial Results for the 1 st
Financial Summary. Mitsui Chemicals, Inc. Aug 2, Results of the 1 st Quarter of FY2018 & Outlook for FY2018
 Financial Summary Results of the 1 st Quarter of FY2018 & Outlook for FY2018 Mitsui Chemicals, Inc. Aug 2, 2018 FY2018 indicates the period from April 1, 2018 to March 31, 2019. Contents 1. Results
Financial Highlights for the Fiscal Year ended March 31, 2012
 (Note) This document has been translated from the Japanese original for reference purposes only. In the event of any discrepancy between this translation and the Japanese original, the original shall prevail.
CONTENTS. Kobayashi Pharmaceutical Co., Ltd. Annual Report
 C r e a t i v i t y a n d I n n o v a t i o n CONTENTS 2 3 5 7 9 11 13 18 21 22 23 25 63 64 1 Kobayashi Pharmaceutical Co., Ltd. Annual Report.12 Kobayashi Pharmaceutical Co., Ltd. Annual Report.12 2 A
FYE March 2017 Second Quarter Financial Briefing
 FYE March 2017 Second Quarter Financial Briefing November 25, 2016 Conte nts Contents FYE March 2017 Second Quarter Results P.3 FYE March 2017 Earnings Projections P.13 Progress of Mid-Term Management
Don Quijote Holdings Co., Ltd. Results for FY 2018
 Don Quijote Holdings Co., Ltd. Results for FY 2018 Earnings Results July 1, 2017 - June 30, 2018 August 10, 2018 Earnings summary 12 months to June 2018 12 months to June 2017 Actual Share YoY Actual Share
Investor Presentation For the Six Months Ended September 30, 2006
 Investor Presentation For the Six Months Ended September 30, 2006 November 15, 2006 Information Development Co., Ltd 1 Today s Presentation 1. Performance Overview 2. Industry Trends and ID s Operating
Performance Summary. Copyright 2018 Harmonic Drive Systems Inc.
 Performance Summary 2 1st-half consolidated results (versus original forecasts for the period) Original forecasts (announced May 11) 1st-half FY ending Mar.31,2019 Vs. original forecasts for the period
Toridoll. corporation FY2014 (2Q) Financial Result. Nov. 5, 2014
 Financial Result. Nov. 5, 2014") Toridoll. corporation FY2014 (2Q) Financial Result Nov. 5, 2014 1 Financial Result Digest FY2014(2Q) 2 Financial summary Consolidated Net sales: 43.2bn. yen (+9.0% vs. last 2Q) Consolidated Ordinary income:
Toridoll. corporation FY2014 (2Q) Financial Result Nov. 5, 2014 1 Financial Result Digest FY2014(2Q) 2 Financial summary Consolidated Net sales: 43.2bn. yen (+9.0% vs. last 2Q) Consolidated Ordinary income:
Financial Results for the First Half of the Fiscal Year Ending March 31, 2015
 Financial Results for the First Half of the Fiscal Year Ending March 31, 2015 NOK CORPORATION (7240 / TSE1) November 2014 Disclaimer Any plans, targets, forecasts, strategies, policies and opinions relating
Financial Results FY2014 2Q. Benefit One Inc. Listed on second section of TSE (2412) November 6,
 November 6,") FY2014 2Q Financial Results Benefit One Inc. Listed on second section of TSE (2412) November 6, 2014 http://www.benefit-one.co.jp Financial Highlights for FY2014 2Q (year-to-date) Sales 9.93 billion yen
FY2014 2Q Financial Results Benefit One Inc. Listed on second section of TSE (2412) November 6, 2014 http://www.benefit-one.co.jp Financial Highlights for FY2014 2Q (year-to-date) Sales 9.93 billion yen
the March Ending contains Page 1 of 17
 Consolidated Financial Statements for Third Quart ter of the Fiscal Year Ending March 31, 2016 the April 1, 2015 to This document has been translated from the original Japanese as a guide for non-japanese
Q3 Results for FY 2018 Earnings Results July 1, March 31, 2018
 Don Quijote Holdings. Co., Ltd. Q3 Results for FY 2018 Earnings Results July 1, 2017 - March 31, 2018 May 8,2018 0 Earnings summary 9 months to Mar. 2018 9 months to Mar. 2017 (Millions of yen) Actual
Consolidated Financial Results for the 3rd Quarter of the Fiscal Year Ending March 31, 2010
 February 5, 2010 Consolidated Financial Results for the 3rd Quarter of the Fiscal Year Ending March 31, 2010 NIHON KOHDEN CORPORATION (6849) Stock Exchange Listing: Head Office: Representative: Contact:
Renesas Electronics Reports Third Quarter 2018 Financial Results
 Renesas Electronics Reports Third Quarter 2018 Financial Results Third Quarter Sales Decreased Year-on-Year, from Weakening End Demand Mainly in Industrial Business. Temporary Decrease in Gross Margin
Highlights of Consolidated Results for the Nine Months and the Third Quarter of Fiscal Year ending March 31, 2017
 February 8, 2017 Highlights of Consolidated Results for the Nine Months and the Third Quarter of Fiscal Year ending March 31, 2017 (except for per share amounts) Nine months ended Nine months ended December
Financial Results for the Second Quarter Fiscal Year Ending March 2015 Investor Relations Presentation Materials ISEKI & CO., LTD.
 Financial Results for the Second Quarter Fiscal Year Ending March 2015 Investor Relations Presentation Materials ISEKI & CO., LTD. Noriyuki Kimura, President November 14, 2014 Index 1. Outline of Financial
Renesas Electronics Reports First Quarter 2018 Financial Results
 Renesas Electronics Reports First Quarter 2018 Financial Results Increase in Q1 Sales Year-On-Year Driven by Growth Mainly from Integration of Intersil and Industrial Business. Achieved Gross Margin Improvement
Japanese Policy and Implementation on PFI
 Japanese Policy and Implementation on PFI The 3rd Annual Meeting for PPP/PFI Promotion between Japan and Korea October 9th, 2008 History Chart Jul. 1999 Enactment of PFI Law Oct. 1999 Creation of The Committee
First Quarter of the Fiscal Year Ending December 31, 2015 Unicharm Presentation Materials for Investor Meeting
 First Quarter of the Fiscal Year Ending December 31, 2015 Unicharm Presentation Materials for Investor Meeting May 8, 2015 Takahisa Takahara President and CEO Unicharm Corporation Projections stated herein
Business Results for the year ended Nov. 31, 2016
 Business Results for the year ended Nov. 31, 2016 Jan. 26, 2017 Outline 1 of Results & Progress of Medium-Term Business Plan 2~9 2 Results & FY2017 Forecast 10~21 Results Full Year Full Year Change Net
Yamaha Corporation Analyst and Investor Briefing on the Third Quarter of Fiscal Year Ending March 31, 2018 (FY2018.3) February 6, 2018
 February 6, 2018") Yamaha Corporation Analyst and Investor Briefing on the Third Quarter of Fiscal Year Ending March 31, 2018 () February 6, 2018 Overview of Performance in the First Three Quarters of (Nine Months) 2 Results
Yamaha Corporation Analyst and Investor Briefing on the Third Quarter of Fiscal Year Ending March 31, 2018 () February 6, 2018 Overview of Performance in the First Three Quarters of (Nine Months) 2 Results
FY2016 Financial Results. May 12, 2017
 FY2016 Financial Results May 12, 2017 Contents 1 1. FY2016 Full-Year Results FY2016 Highlights Segment Performance Advanced Materials Chemicals Plastics & Other Operations Difference from FY2016 Projection
Brief Report of Financial Statements for the Year Ended March 31, 2012 [JGAAP] (Consolidated Basis)
![Brief Report of Financial Statements for the Year Ended March 31, 2012 [JGAAP] (Consolidated Basis)](/thumbs/94/119025550.jpg "Brief Report of Financial Statements for the Year Ended March 31, 2012 [JGAAP] (Consolidated Basis)") Brief Report of Financial Statements for the Year Ended March 31, 2012 [JGAAP] (Consolidated Basis) Listed exchanges: Tokyo, Osaka Listed company name: Kobayashi Pharmaceutical Co. Ltd. Code: 4967 URL:
Brief Report of Financial Statements for the Year Ended March 31, 2012 [JGAAP] (Consolidated Basis) Listed exchanges: Tokyo, Osaka Listed company name: Kobayashi Pharmaceutical Co. Ltd. Code: 4967 URL:
Gulliver International Co., Ltd.
 Gulliver International Co., Ltd. Consolidated Results Fiscal 2005 (March 1, 2005 to February 28, 2006) This document is a translation of sections of the original Japanese as a guide for non-japanese investors.
Supplemental Document for 2 nd Quarter of Fiscal Year November 4, 2016 Nippon Suisan Kaisha, Ltd.
 Supplemental Document for 2 nd Quarter of Fiscal Year 2016 November 4, 2016 Nippon Suisan Kaisha, Ltd. Overview of the 2 nd Quarter of FY2016 Despite the grim profit forecast in 1 st half, operating income
Name of Listed Company. Contact
 NEWS RELEASE Name of Listed Company Representative Contact TSUMURA & CO. Terukazu Kato September 22, 2017 President & Representative Director (Code: 4540 First Section of the Tokyo Stock Exchange) Noboru
Results for FY 2016 Earnings Results July 1, June 30, 2016
 Don Quijote Holdings. Co., Ltd. Results for FY 2016 Earnings Results July 1, 2015 - June 30, 2016 August 17, 2016 0 Earnings summary 12 months to Jun. 2016 12 months to Jun. 2015 Actual Share YoY Actual
Fully diluted net income per share
 Summary of Consolidated Financial Results For the Third Quarter of the Fiscal Year Ending March 31, 2009 (Nine Months Ended December 31, 2008) February 6, 2009 Company name: Nippon Shokubai Co., Ltd. Listing:
Yamaha Corporation Analyst and Investor Briefing on the Second Quarter of the Fiscal Year Ending March 31, 2014 (FY2014.3) November 1, 2013
 November 1, 2013") Yamaha Corporation Analyst and Investor Briefing on the Second Quarter of the Fiscal Year Ending March 31, 2014 () November 1, 2013 Overview of Performance in the First Half of (Six Months) Results Summary
Yamaha Corporation Analyst and Investor Briefing on the Second Quarter of the Fiscal Year Ending March 31, 2014 () November 1, 2013 Overview of Performance in the First Half of (Six Months) Results Summary
Sales Operating profit Ordinary income. Three months ended Jun. 30, Three months ended Jun. 30,
 August 5, 2016 Summary of Consolidated Financial Results for the First Quarter of the Fiscal Year Ending March 31, 2017 (Three Months Ended June 30, 2016) [Japanese GAAP] Company name: AOKI Holdings Inc.
FY2017, FY2018, FY2019 Economic Outlook - Firm outlook on both domestic and overseas economic growth remains unchanged -
 REVISED to reflect the 2 nd QE for the Oct-Dec Qtr of 2017 FY2017, FY2018, FY2019 Economic Outlook - Firm outlook on both domestic and overseas economic growth remains unchanged - March 8, 2018 Copyright
Consolidated Financial Results for 3Q FY2017
 Consolidated Financial Results for 3Q FY2017 January 30, 2018 Fuji Electric Co., Ltd. 2018 Fuji Electric Co., Ltd. All rights reserved. 1 Summary of Consolidated Financial Results for (Apr.- Dec.) FY2017
Q1 Results for FY 2017 Earnings Results July 1, September 30, 2016
 Don Quijote Holdings. Co., Ltd. Q1 Results for FY 2017 Earnings Results July 1, 2016 - September 30, 2016 November 4, 2016 0 Earnings summary 3 months to Sep. 2016 3 months to Sep. 2015 (Millions of yen)
Summary of Consolidated Financial Results for Second Quarter of FY2017
 Summary of Consolidated Financial Results for Second Quarter of FY2017 Nov 1, 2017 Mitsui Chemicals, Inc. 1. Summary of Income Statement Net sales Operating income Ordinary income Profit attributable to
Recent Economic Developments
 Recent Economic Developments March 28, 219 Cabinet Office Government of Japan Contact for inquiries: Directorate General for Economic Research +81-3-6257-1567
Brief Report of Financial Statements for the Year Ended March 31, 2011 [JGAAP] (Consolidated Basis)
![Brief Report of Financial Statements for the Year Ended March 31, 2011 [JGAAP] (Consolidated Basis)](/thumbs/95/124909003.jpg "Brief Report of Financial Statements for the Year Ended March 31, 2011 [JGAAP] (Consolidated Basis)") Brief Report of Financial Statements for the Year Ended March 31, 2011 [JGAAP] (Consolidated Basis) Listed exchanges: Tokyo, Osaka Listed company name: Kobayashi Pharmaceutical Co. Ltd. Code: 4967 URL:
Brief Report of Financial Statements for the Year Ended March 31, 2011 [JGAAP] (Consolidated Basis) Listed exchanges: Tokyo, Osaka Listed company name: Kobayashi Pharmaceutical Co. Ltd. Code: 4967 URL:
Q3 Results for FY 2017 Earnings Results July 1, March 31, 2017
 Don Quijote Holdings. Co., Ltd. Q3 Results for FY 2017 Earnings Results July 1, 2016 - March 31, 2017 May 8,2017 0 Earnings summary 9 months to Mar. 2017 9 months to Mar. 2016 (Millions of yen) Actual
Q3 Results for FY 2016 Earnings Results July 1, March 31, 2016
 Don Quijote Holdings. Co., Ltd. Q3 Results for FY 2016 Earnings Results July 1, 2015 - March 31, 2016 May 9,2016 0 Earnings summary 9 months to Mar. 2016 9 months to Mar. 2015 (Millions of yen) Actual
(3) Consolidated Cash flow Position Cash flows from Operating activities Cash flows from investing activities Cash flows from Financing activities Cas
 Consolidated Cash flow Position Cash flows from Operating activities Cash flows from investing activities Cash flows from Financing activities Cas") Note; This document is a partial translation of "Kessan Tanshin" for the Fiscal Year Ended December 31, 2017 and is provided solely for reference purposes. In the event of any inconsistency between the
Note; This document is a partial translation of "Kessan Tanshin" for the Fiscal Year Ended December 31, 2017 and is provided solely for reference purposes. In the event of any inconsistency between the
Presentation of Business Results for the 1st Quarter of FYE 2014
 Presentation of Business Results for the 1st Quarter of FYE 2014 Director of the Boards & CFO, Mitsuru Takahashi July 31, 2013 0 0 Summary Financial results for the 1st quarter of FYE March 2014 Propelled
Summary of Financial Results For the Fiscal Year Ended December 31, 2016 (Consolidated)
") Summary of Financial Results For the Fiscal Year Ended December 31, 2016 (Consolidated) These financial statements have been prepared in accordance with accounting principles and practices generally accepted
Summary of Financial Results For the Fiscal Year Ended December 31, 2016 (Consolidated) These financial statements have been prepared in accordance with accounting principles and practices generally accepted
FOR IMMEDIATE RELEASE
 FOR IMMEDIATE RELEASE Kurita Water Industries Reports Earnings for the Three Months Ended June 30, 2017 Tokyo, Japan, July 31, 2017 Kurita Water Industries Ltd. (TSE Securities Code 6370) announced net
Brief Report on the Settlement of Accounts (Consolidated) for the Three Months Ended June 30, 2017 (J-GAAP)
 for the Three Months Ended June 30, 2017 (J-GAAP)") Member, Financial Accounting Standards Foundation Brief Report on the Settlement of Accounts (Consolidated) for the Three Months Ended June 30, 2017 August 8, 2017 Name of Listed Company:
Member, Financial Accounting Standards Foundation Brief Report on the Settlement of Accounts (Consolidated) for the Three Months Ended June 30, 2017 August 8, 2017 Name of Listed Company:
Net income expanded by 73.0% to JPY55.3 billion.
 1 2 3 Exchange rates were JPY113.0 per USD, JPY133.2 per EUR, and JPY17.0 per RMB. JPY depreciated against USD, EUR and RMB, compared to the corresponding period a year ago. JPY also depreciated against
Summary of Financial Results For the Fiscal Year Ended December 31, 2015 (Consolidated)
") Summary of Financial Results For the Fiscal Year Ended December 31, 2015 (Consolidated) These financial statements have been prepared in accordance with accounting principles and practices generally accepted
Summary of Financial Results For the Fiscal Year Ended December 31, 2015 (Consolidated) These financial statements have been prepared in accordance with accounting principles and practices generally accepted
Yamaha Corporation Analyst and Investor Briefing on the First Quarter of Fiscal Year Ending March 31, 2018 (FY2018.
 Yamaha Corporation Analyst and Investor Briefing on the First Quarter of Fiscal Year Ending March 31, 2018 () August 2, 2017 Overview of Performance in the First Quarter (April-June) of 2 Results Summary
NAGASE & CO., LTD. Contents. 1. FYE March 2015 Results P FYE March 2016 Earnings Projections P. 13. Management Plan P. 19
 NAGASE & CO., LTD. Contents 1. FYE March 2015 Results P. 3 2. FYE March 2016 Earnings Projections P. 13 3. Mid-Term Management Plan Overview/Long-Term Management Plan P. 19 4. (Reference) Information by
FY12 Financial Results
 T.HASEGAWA CO., LTD. FY12 Financial Results T.HASEGAWA CO., LTD. Index T.HASEGAWA CO., LTD. 1 Ⅰ.Summary of the Consolidated Financial Settlement Highlights of the Consolidated Results Consolidated Results
Earnings of 3Q FY2011/3
 Earnings of 3Q FY2011/3 (April 1 December 31, 2010) January 28, 2011 FORWARDLOOKING STATEMENTS Forwardlooking statements such as those relating to earnings forecasts and other projections contained in
Ferrotec Corporation Results for the 1 st half of the fiscal year ended March 31, 2014
 Ferrotec Corporation Results for the 1 st half of the fiscal year ended March 31, 2014 November 27, 2013 (JASDAQ 6890) http://www. ferrotec. co. jp/ 1. This 1st half results cover six months period from