Comprehensive Annual Financial Report
|
|
|
- Bennett Jacobs
- 5 years ago
- Views:
Transcription


1 CALIFORNIA Comprehensive Annual Financial Report FOR THE FISCAL YEAR ENDED JUNE 30, 2008 OFFICE OF THE CONTROLLER Laura N. Chick, City Controller

2 City of Los Angeles California Comprehensive Annual Financial Report For the Fiscal Year Ended June 30, 2008 Prepared by the Office of the Controller Laura N. Chick, City Controller
3 City of Los Angeles California Comprehensive Annual Financial Report For the Fiscal Year Ended June 30, 2008 Prepared by the City of Los Angeles Controller s Office William E. Lamb - Director of Financial Analysis & Reporting Lyndon O. Salvador - Financial Management Specialist V GAAP Compliance Section Anita S. Gregorio - Financial Management Specialist IV Helen P. Lee - Fiscal Systems Specialist I Julieta A. Barba - Principal Accountant I Ursula T. Villanueva - Principal Accountant I Almer G. Colorado - Senior Accountant II Marie A. De Los Reyes - Senior Accountant II Louella O. Ubaldo - Senior Accountant II Assistance Provided by General Accounting and Special Projects Sections
4 COMPREHENSIVE ANNUAL FINANCIAL REPORT For the Fiscal Year Ended June 30, 2008 TABLE OF CONTENTS Page INTRODUCTORY SECTION Letter of Transmittal.... Organizational Chart... City Officials.... City Controller.. GFOA Certificate of Achievement for Excellence in Financial Reporting i viii ix x xi FINANCIAL SECTION Independent Auditor's Report 1 Management's Discussion and Analysis (Required Supplementary Information) 3 BASIC FINANCIAL STATEMENTS Government-wide Financial Statements Statement of Net Assets 31 Statement of Activities 32 Fund Financial Statements Balance Sheet - Governmental Funds 33 Reconciliation of the Balance Sheet of Governmental Funds to the Statement of Net Assets 35 Statement of Revenues, Expenditures, and Changes in Fund Balances - Governmental Funds 36 Reconciliation of the Statement of Revenues, Expenditures, and Changes in Fund Balances of Governmental Funds to the Statement of Activities 38 Statement of Revenues, Expenditures, and Changes in Fund Balances - Budget and Actual (Non-GAAP Budgetary Basis) - General Fund 39 Statement of Revenues, Expenditures, and Changes in Fund Balances - Budget and Actual (Non-GAAP Budgetary Basis) - Building and Safety Permit Fund 40 Statement of Revenues, Expenditures, and Changes in Fund Balances (Deficit) - Budget and Actual (Non-GAAP Budgetary Basis) - Community Development Fund 41 Statement of Revenues, Expenditures, and Changes in Fund Balances - Budget and Actual (Non-GAAP Budgetary Basis) - Proposition A Local Transit Assistance Fund 42 Statement of Revenues, Expenditures, and Changes in Fund Balances - Budget and Actual (Non-GAAP Budgetary Basis) - Solid Waste Resources Fund 43 Continued
5 COMPREHENSIVE ANNUAL FINANCIAL REPORT For the Fiscal Year Ended June 30, 2008 TABLE OF CONTENTS (Continued) Fund Financial Statements (continued) Statement of Fund Net Assets - Proprietary Funds 44 Statement of Revenues, Expenses, and Changes in Fund Net Assets - Proprietary Funds 48 Statement of Cash Flows - Proprietary Funds 50 Statement of Fiduciary Net Assets - Fiduciary Funds 54 Statement of Changes in Fiduciary Net Assets - Fiduciary Funds 55 Notes to the Basic Financial Statements (Index Page 56) 57 REQUIRED SUPPLEMENTARY INFORMATION (OTHER THAN MD&A) Page Schedule of Funding Progress - Benefit Pension Plans 183 Schedule of Funding Progress - Other Postemployment Benefits Healthcare Plans Schedule of Funding Progress - Community Redevelopment Agency 184 Condition Rating for City Bridges 184 COMBINING AND INDIVIDUAL FUND FINANCIAL STATEMENTS AND SCHEDULES Combining Balance Sheet - Other Governmental Funds 188 Combining Statement of Revenues, Expenditures, and Changes in Fund Balances - Other Governmental Funds 189 General Fund Supplemental Schedule of Budget Appropriations, Expenditures, and Other Financing Uses By Function - Budget and Actual (Non-GAAP Budgetary Basis) Supplemental Schedule of Budget Appropriations, Expenditures, and Other Financing Uses By Function and Object - Budget and Actual (Non-GAAP Budgetary Basis) Special Revenue Funds Combining Balance Sheet - Nonmajor Special Revenue Funds 202 Combining Statement of Revenues, Expenditures, and Changes in Fund Balances (Deficit) - Nonmajor Special Revenue Funds 206 Budgetary Comparison Schedule (Non-GAAP Budgetary Basis) - Annually Budgeted Nonmajor Special Revenue Funds 210 Reconciliation of Operations on Budgetary Basis to the GAAP Basis - Nonmajor Special Revenue Funds 251 Continued
6 COMPREHENSIVE ANNUAL FINANCIAL REPORT For the Fiscal Year Ended June 30, 2008 TABLE OF CONTENTS (Continued) Page Special Revenue Funds (continued) Supplemental Schedule of Appropriations, Expenditures, and Other Financing Uses - Budget and Actual (Non-GAAP Budgetary Basis) - All Budgeted Special Revenue Funds 252 Debt Service Funds Combining Balance Sheet - Nonmajor Debt Service Funds 259 Combining Statement of Revenues, Expenditures, and Changes in Fund Balances - Nonmajor Debt Service Funds Budgetary Comparison Schedule - (Non-GAAP Budgetary Basis) - Annually Budgeted Nonmajor Debt Service Funds Reconciliation of Operations on Budgetary Basis to the GAAP Basis - Nonmajor Debt Service Funds 278 Capital Projects Funds Combining Balance Sheet - Nonmajor Capital Projects Funds 280 Combining Statement of Revenues, Expenditures, and Changes in Fund Balances - Nonmajor Capital Projects Funds. 282 Budgetary Comparison Schedule (Non-GAAP Budgetary Basis) - Annually Budgeted Nonmajor Capital Projects Funds 284 Reconciliation of Operations on Budgetary Basis to the GAAP Basis - Nonmajor Capital Projects Funds 288 Supplemental Schedule of Appropriations, Expenditures, and Other Financing Uses - Budget and Actual (Non-GAAP Budgetary Basis) - All Budgeted Capital Projects Funds Fiduciary Funds Combining Statement of Fiduciary Net Assets - Pension and Other Employee Benefits Trust Funds 292 Combining Statement of Changes in Fiduciary Net Assets - Pension and Other Employee Benefits Trust Funds 293 Combining Statement of Fiduciary Net Assets - Pension Trust Funds 294 Combining Statement of Changes in Fiduciary Net Assets - Pension Trust Funds 295 Combining Statement of Fiduciary Net Assets - Other Employee Benefits Trust Funds 296 Combining Statement of Changes in Fiduciary Net Assets - Other Employee Benefits Trust Funds 297 Continued
7 COMPREHENSIVE ANNUAL FINANCIAL REPORT For the Fiscal Year Ended June 30, 2008 TABLE OF CONTENTS (Continued) Page STATISTICAL SECTION Fiduciary Funds (continued) Combining Statement of Fiduciary Assets and Liabilities - Agency Funds 298 Combining Statement of Changes in Fiduciary Assets and Liabilities - Agency Funds 299 Financial Trends Information Net Assets by Category- Accrual Basis of Accounting - Last Seven Fiscal Years 302 Changes in Net Assets- Accrual Basis of Accounting - Last Seven Fiscal Years 304 Fund Balances- Governmental Funds- Modified Accrual Basis of Accounting Last Ten Fiscal Years 308 Changes in Fund Balances- Governmental Funds - Modified Accrual Basis of Accounting - Last Ten Fiscal Years 310 Tax Revenues By Source- Governmental Funds- Modified Accrual Basis of Accounting - Last Ten Fiscal Years 312 Revenue Capacity Information Assessed and Estimated Actual Value of Property - Last Ten Fiscal Years. 315 Direct and Overlapping Property Tax Rates- Tax Rate Area No. 4 - Last Ten Fiscal Years 316 Ten Largest Property Taxpayers- Secured Assessed Valuation - Current and Nine Years Ago 317 Property Tax Levies and Collections - Last Ten Fiscal Years 318 Energy Sold by Type of Customer- Power Enterprise Fund - Last Ten Fiscal Years 319 Average Number of Customers for Energy Sales- Power Enterprise Fund - Last Ten Fiscal Years 319 Debt Capacity Information Ratios of Outstanding Debt By Type - Last Ten Fiscal Years 322 Ratios of Net General Bonded Debt to Assessed Value and Per Capita Last Ten Fiscal Years 324 Direct and Overlapping Governmental Activities Debt 325 Ratios of General Bonded Debt Outstanding and Legal Debt Margin Last Ten Fiscal Years 326 Pledged Revenue Coverage - Last Ten Fiscal Years 328 Demographic and Economic Information Demographic and Economic Statistics - Last Ten Fiscal Years 331 Principal Employers - Current Year and Nine Years Ago 332 Operating Information Number of City Government Employees by Function/Program- Full-Time Equivalent Last Ten Fiscal Years 334 Operating Indicators by Function/Program - Last Ten Fiscal Years 338 Capital Asset Information - Last Ten Fiscal Years 348
8
9
10
11
12
13
14
15
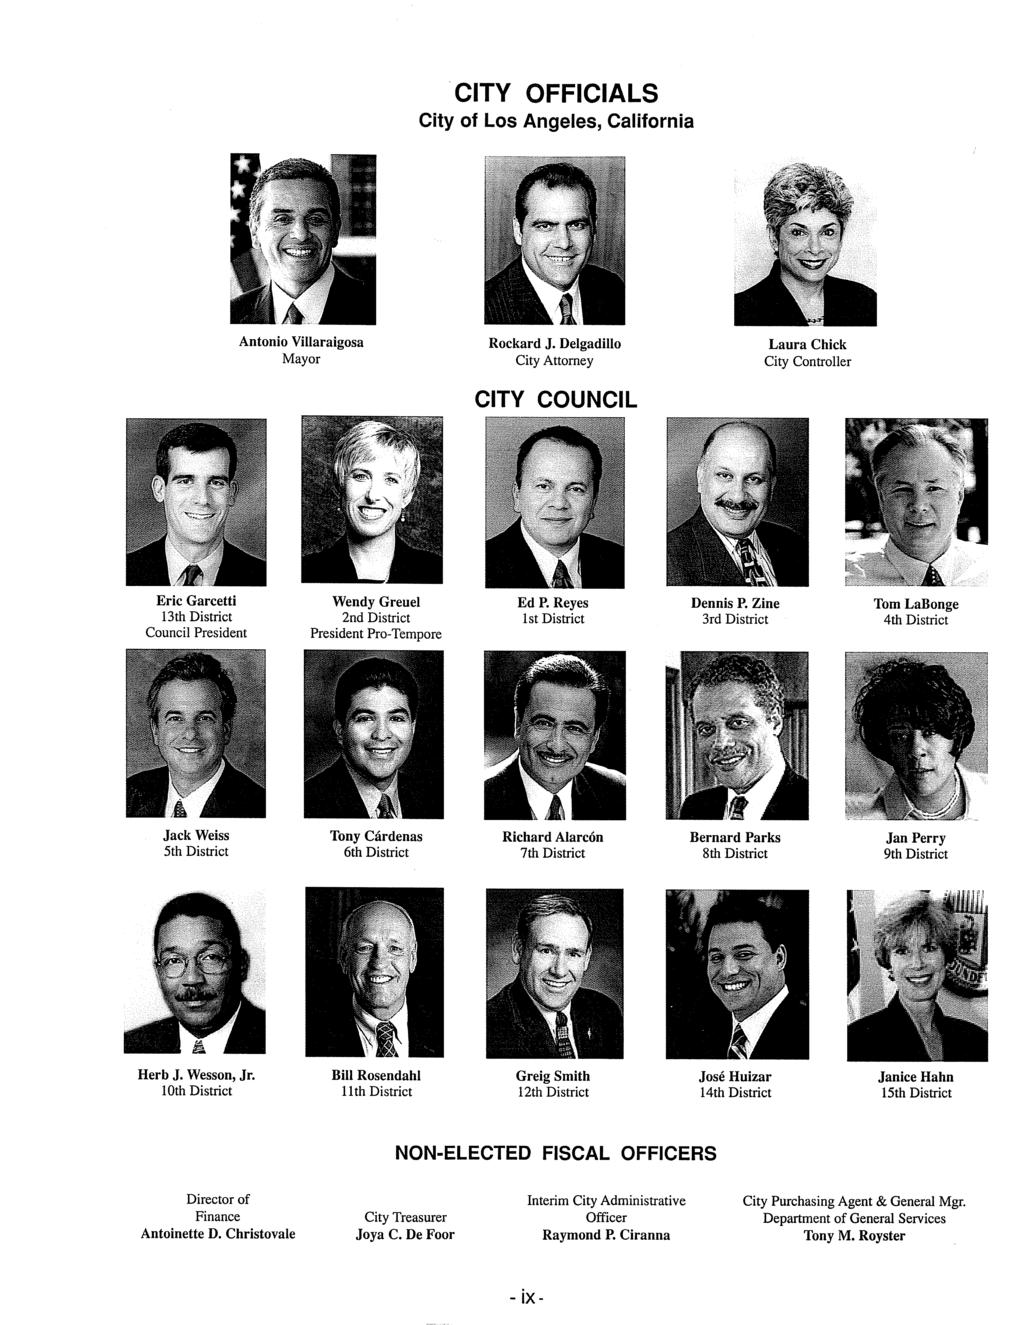
16 ORGANIZATION OF THE CITY OF LOS ANGELES FY ELECTORATE KEY Operating ELECTED OFFICIALS COUNCIL 15 Member Governing Body MAYOR Chief Executive CITY ATTORNEY CONTROLLER Support CHARTER OFFICES AND CHARTER DEPARTMENTS HEADED BY COMMISSIONS Chief Legislative Analyst City Administrative Officer City Clerk Finance Fire (Commission) Police (Commission) Ethics Commission (Commission) City Treasurer Operating & Support CHARTER DEPARTMENTS WITH CITIZEN COMMISSIONS Personnel Planning Neighborhood Empowerment ORDINANCE DEPARTMENTS Community Development Information Technology Agency Employee Relations Board General Services Housing Aging Emergency Preparedness ORDINANCE DEPARTMENTS WITH CITIZEN COMMISSIONS Building & Safety Commission on the Status of Women Commission for Children, Youth and Their Families El Pueblo Environmental Affairs Cultural Affairs Convention Center Transportation Human Relations Commission Zoo Animal Services Disability INDEPENDENT CHARTER DEPARTMENTS HEADED BY CITIZEN COMMISSIONS Los Angeles World Airports Harbor Department of Water & Power Library Recreation & Parks City Employees Retirement System Fire & Police Pension System STATE LAW DEPARTMENTS HEADED BY CITY COMMISSIONS Community Redevelopment Agency Housing Authority CHARTER DEPARTMENT WITH FULL-TIME COMMISSION Board of Public Works Bureau of Contract Administration Bureau of Engineering Bureau of Sanitation Bureau of Street Lighting Bureau of Street Services
17
18
19
20 This page intentionally left blank - xii -
21
22
23
24
25 Management s Discussion and Analysis This section of the Comprehensive Annual Financial Report of the City of Los Angeles (the City) presents a narrative overview and discussion of the City s financial activities for the fiscal year ended June 30, We encourage readers to consider the information presented here in conjunction with additional information that we have presented in the letter of transmittal of this report. We hope that the information and the discussions will provide readers with a clear picture of the City s overall financial condition. FINANCIAL HIGHLIGHTS The assets of the City exceeded liabilities at the close of the fiscal year by $18.4 billion. The net assets of $18.4 billion consisted of: $12.8 billion investment in capital assets, net of related debt; $4.5 billion (restricted net assets) represents resources that are subject to certain restrictions on how they may be used; $2.5 billion (unrestricted net assets) may be used to meet the City s obligations for its business-type activities; and $1.4 billion deficit of governmental activities. The City s financial activities during the fiscal year resulted in an increase in total net assets of $830.4 million. Governmental activities increased by $128.2 million while the business-type activities increased by $702.2 million. As of June 30, 2008, the aggregate ending fund balance of the City s governmental funds was $3.6 billion, a decrease of $400 million from June 30, Of the combined fund balances of $3.6 billion, 59.8% or $2.1 billion is available to meet the City s current and future needs (unreserved fund balances). At the end of the fiscal year, the unreserved fund balance of the General Fund (which includes the Reserve Fund and other accounts that have General Fund type activity) was $418.7 million, or 10.1% of total expenditures. The City s bonded debt and long-term notes payable at June 30, 2008 totaled $14.9 billion, a net increase of $678.4 million from the prior year s balance of $14.2 billion. OVERVIEW OF THE FINANCIAL STATEMENTS This annual report consists of management s discussion and analysis (MD&A), basic financial statements, including the accompanying notes to the basic financial statements, required supplementary information, and combining statements and schedules for the nonmajor governmental and the fiduciary funds. The basic financial statements comprise three components: 1) government-wide financial statements, 2) fund financial statements, and 3) notes to the basic financial statements. Government-wide Financial Statements are designed to provide readers with a broad overview of the City s finances and are made up of the following two statements: the Statement of Net Assets and the Statement of Activities. Both of these statements were prepared using accounting methods similar to those used by private-sector businesses, which is the economic resources measurement focus and the accrual basis of accounting. The statement of net assets presents information on all of the City s assets and liabilities, with the difference between the two reported as net assets. Over time, increases or decreases in net assets may serve as a useful indicator of whether the financial position of the City is improving or deteriorating
26 Management s Discussion and Analysis (Continued) The statement of activities presents information showing how the City s net assets changed during the most recent fiscal year. All changes in net assets are reported as soon as the underlying event giving rise to the change occurs, regardless of the timing of related cash flows. Thus, revenues and expenses are reported in this statement for some items that will result in cash flows in future fiscal periods, such as revenues pertaining to uncollected taxes and expenses pertaining to earned but unused compensated absences, and incurred but unpaid workers compensation claims. Both of these government-wide financial statements distinguish functions of the City that are principally supported by taxes and intergovernmental revenues (governmental activities) from other functions that are intended to recover all or in part a portion of their costs through user fees and charges (business-type activities). The governmental activities of the City include general government, protection of persons and property, public works, health and sanitation (other than sewer services), transportation, cultural and recreational services, and community development. The business-type activities of the City include airports, harbor, power, water, sewer and convention center services. The government-wide financial statements reflect not only the activities of the City itself (known as the primary government), but also those of the legally separate Community Redevelopment Agency (CRA) presented discretely. The Los Angeles Convention and Exhibition Center Authority, the Los Angeles Harbor Improvement Corporation, and the Municipal Improvement Corporation of Los Angeles, although legally separate, have been included as an integral part of the primary government because their sole purpose is to provide services entirely to or exclusively for the City, or the City Council is their governing body. Fund Financial Statements are designed to report information about groupings of related accounts that are used to maintain control over resources that have been segregated for specific activities or objectives. The City, like other state and local governments, uses fund accounting to ensure and demonstrate finance-related legal compliance. All of the funds of the City can be divided into three categories: governmental funds, proprietary funds and fiduciary funds. Governmental funds are used to account for essentially the same functions reported as governmental activities in the government-wide financial statements. However, unlike the government-wide financial statements, governmental funds financial statements focus on near-term inflows and outflows of spendable resources, as well as on balances of spendable resources available at the end of the fiscal year. Such information may be useful in determining what financial resources are available in the near future to finance the City s programs. The governmental funds financial statements are made up of the following: the balance sheet and the statement of revenues, expenditures and changes in fund balances. Both of these statements were prepared using the current financial resources measurement focus and the modified accrual basis of accounting. The budgetary basis statement of revenues, expenditures and changes in fund balances is prepared on a modified cash basis of accounting that is different from generally accepted accounting principles. (Please see Note 3B of the Notes to the Basic Financial Statements beginning on page 75 for additional information on the basis difference.) Because the focus of governmental funds is narrower than that of the government-wide financial statements, it is useful to compare the information presented for governmental activities in the government-wide financial statements. By doing so, readers may better understand the long-term impact of the government s near-term financing decisions. Both the governmental funds balance sheet and the governmental funds statement of revenues, expenditures, and changes in fund balances provide a reconciliation to facilitate this comparison between governmental funds and governmental activities
27 Management s Discussion and Analysis (Continued) The City maintains several individual governmental funds organized according to their type (general, special revenue, debt service, and capital projects funds). Information is presented separately in the governmental funds balance sheet and in the governmental funds statement of revenues, expenditures, and changes in fund balances for the General Fund, Building and Safety Permit Fund, Community Development Fund, Municipal Improvement Corporation Special Revenue and Debt Service Funds, Proposition A Local Transit Assistance Fund, Recreation and Parks Fund, and Solid Waste Resources Fund, which are considered to be major funds. Data from the remaining governmental funds are combined into a single, aggregated presentation. Individual fund data for each of these nonmajor governmental funds is provided in the form of combining statements and schedules elsewhere in this report. Non-GAAP budgetary basis statements of revenues, expenditures and changes in fund balances have been provided for the General Fund and four other budgeted major funds to demonstrate compliance with the annually appropriated budget. The other budgeted major funds are: Building and Safety Permit, Community Development, Proposition A Local Transit Assistance, and Solid Waste Resources. Proprietary funds are generally used to account for services for which the City charges customers either outside customers, or other departments/funds of the City. The proprietary funds financial statements provide the same type of information as shown in the government-wide financial statements, only in more detail. The City maintains the following type of proprietary funds: Enterprise funds are used to report the same functions presented as business-type activities in the government-wide financial statements. The City uses enterprise funds to account for the airports, harbor, power, water, sewer, and convention center operations. All of the City s enterprise funds, except the convention center, are considered major funds. Fiduciary funds are used to account for resources held for the benefit of parties outside the City. The City s pension trust, other employee benefits trust, and agency funds are reported under the fiduciary funds. Since the resources of these funds are not available to support the City s own programs, they are not reflected in the government-wide financial statements. The accounting used for fiduciary funds is much like that used for proprietary funds. Notes to the Basic Financial Statements provide additional information that is essential to a full understanding of the data provided in the government-wide and fund financial statements. Required Supplementary Information, other than MD&A, is presented concerning the City s progress in funding its obligation to provide pension and other postemployment benefits to City employees. Also included in this section is the condition assessment for City bridges. The combining and individual fund statements and schedules referred to earlier provide information for nonmajor governmental funds and fiduciary funds and are presented immediately following the required supplementary information. GOVERNMENT-WIDE FINANCIAL ANALYSIS Analysis of Net Assets: As noted earlier, net assets may serve over time as a useful indicator of a government s financial position. In the case of the City, assets exceeded liabilities by $18.4 billion at the close of fiscal year
28 Management s Discussion and Analysis (Continued) The following table is a condensed summary of the City s government-wide net assets: CITY OF LOS ANGELES Condensed Statement of Net Assets (amounts expressed in thousands) Governmental Business-type Activities Activities Total FY 2008 FY 2007 FY 2008 FY 2007 FY 2008 FY 2007 Assets: Current and other assets $ 5,103,275 $ 5,471,560 $ 8,130,388 $ 7,672,842 $ 13,233,663 $ 13,144,402 Capital assets 6,422,612 5,748,452 19,890,062 18,913,854 26,312,674 24,662,306 Total assets 11,525,887 11,220,012 28,020,450 26,586,696 39,546,337 37,806,708 Liabilities: Current and other liabilities 1,069,580 1,210,947 2,313,320 2,224,139 3,382,900 3,435,086 Long-term liabilities 6,418,650 6,099,593 11,326,226 10,683,871 17,744,876 16,783,464 Total liabilities 7,488,230 7,310,540 13,639,546 12,908,010 21,127,776 20,218,550 Net assets: Invested in capital assets, net of related debt 3,415,049 3,189,365 9,372,493 8,974,991 12,787,542 12,164,356 Restricted 2,078,145 1,943,230 2,480,495 2,392,245 4,558,640 4,335,475 Unrestricted (1,455,537) (1,223,123) 2,527,916 2,311,450 1,072,379 1,088,327 Total net assets $ 4,037,657 $ 3,909,472 $ 14,380,904 $ 13,678,686 $ 18,418,561 $ 17,588,158 Notes: Rounding off difference may occur in the discussion. By far, the largest portion of the City s net assets ($12.8 billion or 69.4%) reflects its investment in capital assets (e.g., land, infrastructure, buildings, facilities and equipment) less any related outstanding debt used to acquire those assets. The City uses these capital assets to provide services to its citizens; consequently, these assets are not available for future spending. Although the City s investment in capital assets is reported net of related debt, it should be noted that the resources to repay this debt must be provided from other sources since the capital assets themselves cannot be used to liquidate the debt. An additional portion of the City s net assets ($4.5 billion or 24.7%) represents resources that are subject to various restrictions on how they may be used. The remaining balance of $1.1 billion (5.9%) is the net amount of the governmental activities deficit of $1.4 billion and $2.5 billion unrestricted net assets that may be used to meet the City s obligations for its business-type activities. At the end of fiscal year , the City reported positive balances in all three categories of net assets for the City as a whole. While the business-type activities reported a positive balance of $2.5 billion in unrestricted net assets, the governmental activities reported a deficit of $1.4 billion. The deficit balance shown for the governmental activities unrestricted net assets reflected an increase of $232.4 million (19%) from the prior year s deficit balance
29 Management s Discussion and Analysis (Continued) The deficit should not be considered, of itself, evidence of economic or financial difficulties. The deficit reflects the extent to which the City has deferred to future periods the financing of certain liabilities (i.e. claims and judgments, workers compensation, compensated absences). While accounting is primarily concerned with when a liability is incurred, financing focuses on when a liability will be paid. The City, like many other governments, raises and budgets resources needed to liquidate a liability during the year in which the liability is to be liquidated rather than during the year in which the liability is incurred. Key changes in the statement of net assets are as follows: Capital assets increased by $1.6 billion or 6.7%. The net increase for governmental activities was $674.2 million while for the business-type activities the net increase was $976.2 million. For the governmental activities, the increase was primarily due to various projects under construction for police, library, recreational, zoo, stormwater, streets, traffic, transportation and various other improvements to City facilities. Construction work in progress at the airports and harbor as well as ongoing improvements to sewer facilities and power and water utility plants caused the increase for business-type activities. Current and other assets had a net increase of $89.3 million or 0.7%. Governmental activities decreased by $368.3 million, while business-type activities increased by $457.5 million. The decrease of $368.3 million was primarily due to the decrease in cash, pooled and other investments of $571.2 million offset by an increase of $187.2 million in receivables. Long term debt issuances in fiscal year 2008 were less than the prior year while the increased capital expenditures mainly for the construction, acquisition and renovation of certain facilities were paid from previously issued debt. Increases in ambulance services and false alarm fees, and higher accruals that include estimates for delinquent business taxes were the main reasons for the increase in receivables. For business-type activities, the primary factors for the $457.5 million increase were increased cash and investments and restricted assets from issuance of revenue bonds and commercial paper notes, and increased capital contributions. Long-term liabilities for bonded debt and notes payable increased to $14.9 billion from $14.2 billion in the prior year. The total issuances for the year were $488.7 million for governmental activities and $1.5 billion for business-type activities, while principal retirements totaled $458.9 million for governmental activities and $874.5 million for business-type activities. The City s other long-term liabilities increased by $283 million, while current and other liabilities decreased by $52.2 million. The increase in other long-term liabilities of $283 million was due mainly to net increases in provisions for claims and judgments, and accruals for compensated absences. The decrease of $52.2 million in current and other liabilities was primarily due to the decrease in obligations under securities lending transactions. The City s securities lending programs are discussed in Note 4A of the notes to the financial statements beginning on page 78. The increase of $223.2 million in restricted net assets was composed of $134.9 million for governmental activities and $88.3 million for business type activities. Of the $134.9 million, $99.6 million or 73.9% related to public works and sanitation, transportation, community development and housing programs. For the business-type activities, key changes were an increase on restrictions for passenger facility charges of $89.1 million for current and future airports related projects, and an increase of $118.4 million for the Power and Water Funds pensions and other postemployment benefits. As explained in more detail in the subsequent pages, the governmental activities deficit increased by $232.4 million while the business-type activities unrestricted net assets increased by $216.5 million
30 Management s Discussion and Analysis (Continued) Analysis of Activities: The following table presents condensed information showing how the City s net assets changed during the most recent fiscal year. As previously stated, all changes in net assets are reported as soon as the underlying event giving rise to the change occurs, regardless of the timing of related cash flows. CITY OF LOS ANGELES Condensed Statement of Activities (amounts expressed in thousands) Governmental Business-type Activities Activities Total FY 2008 FY 2007 FY 2008 FY 2007 FY 2008 FY 2007 Revenues Program Revenues Charges for Services $ 1,469,440 $ 1,323,338 $ 5,759,738 $ 5,325,242 $ 7,229,178 $ 6,648,580 Operating Grants and Contributions 979, ,809 10,490 11, , ,585 Capital Grants and Contributions 100,994 94, , , , ,598 General Revenues Property Taxes 1,602,386 1,501, ,602,386 1,501,605 Utility Users Taxes 631, , , ,624 Business Taxes 534, , , ,353 Other Taxes 497, , , ,410 Unrestricted Grants and Contributions 369, , , ,479 Unrestricted Investment Earnings 80,538 72, ,538 72,559 Other Revenues 64,285 34, ,285 34,367 Total Revenues 6,329,701 5,823,151 5,971,527 5,488,009 12,301,228 11,311,160 Expenses General Government 1,570,377 1,429, ,570,377 1,429,922 Protection of Persons and Property 2,741,492 2,414, ,741,492 2,414,058 Public Works 261, , , ,817 Health and Sanitation 381, , , ,730 Transportation 392, , , ,198 Cultural and Recreational Services 446, , , ,523 Community Development 405, , , ,700 Interest on Long-term Debt 217, , , ,925 Airports , , , ,839 Harbor , , , ,368 Power ,658,634 2,462,202 2,658,634 2,462,202 Water , , , ,181 Sewer , , , ,377 Convention Center ,753 35,741 38,753 35,741 Total Expenses 6,416,923 5,801,873 5,053,902 4,627,708 11,470,825 10,429,581 Excess (Deficit) of Revenues Over Expenses (87,222) 21, , , , ,579 Transfers 215, ,667 (215,407) (204,667) Increase in Net Assets 128, , , , , ,579 Net Assets Beginning of Year 3,909,472 3,683,527 13,678,686 13,023,052 17,588,158 16,706,579 Net Assets End of Year $ 4,037,657 $ 3,909,472 $ 14,380,904 $ 13,678,686 $ 18,418,561 $ 17,588,158 Governmental Activities For the year ended June 30, 2008, the total expenses for governmental activities of $6.4 billion were $615 million (10.6%) more than the prior year. Total revenues, which were $87.2 million less than expenses, grew by $506.5 million or 8.7% from $5.8 billion in fiscal year Of the $6.4 billion total expenses, 58.9% was funded by taxes and other general revenues, and the remaining 41.1% was funded by program revenues and transfers from business-type funds. Program revenues are resources obtained from parties outside of the City. They include: (a) amounts received from those who purchase, use or directly benefit from a program; (b) grants and contributions that are restricted to specific programs; and (c) investment earnings that are legally restricted for a specific program
31 Management s Discussion and Analysis (Continued) The following charts show a graphical comparison of governmental revenues by source. FY 2008 Total Revenues: $6.33 Billion FY 2007 Total Revenues: $5.82 Billion Other Taxes 7.9% Business Tax 8.4% Utility Users Tax 10.0% Unrestricted Grants and Contributions 5.8% Property Tax 25.3% Other 2.3% Charges for Services 23.2% Operating Grants and Contributions 15.5% Capital Grants and Contributions 1.6% Unrestricted Other Grants and 1.9% Contributions Other Taxes 6.7% 8.8% Business Tax 8.0% Utility Users Tax 10.4% Property Tax 25.8% Charges for Services 22.7% Operating Grants and Contributions 14.1% Capital Grants and Contributions 1.6% Revenues from property tax, charges for services, and operating grants and contributions are the three largest revenue sources for governmental activities. Together, they account for 64% of the total revenues and posted an increase of $405.3 million as compared to fiscal year The $100.8 million increase in property tax reflects the prior years growth in property values. Revenues from charges for services increased by $146.1 million due primarily to the second of a four-year phased waste disposal fee rate increase imposed on all single and multiple unit dwellings for which the City provides refuse collection services, and higher fees collected from traffic and other code enforcement fines. The increase of $158.4 million in operating grants is largely due to increase in federal homeland security grants related to urban areas security initiative and national urban search and rescue program, funding of reprogrammed community block grant projects, funding for the purchase of buses, and federal awards for low income housing projects. Unrestricted investment income increased slightly by $8 million. Increase in the rate of return of the Treasury Pool reserve portfolio of 7.93% in fiscal year 2008 from 5.64% in fiscal year 2007 was offset by the decrease in the core portfolio s rate of return of 4.31% in fiscal year 2008 compared to 5.46% in fiscal year The following chart shows a graphical comparison of the City s governmental expenses by function. FY 2008 Total Expenses: $6.42 Billion FY 2007 Total Expenses: $5.80 Billion In Millions $3,000 $2,500 $2,000 $1,500 $1,000 $500 $0 $1,570 $2,741 $2,414 $1,430 $262 $381 $393 $446 $406 $217 $301 $403 $367 $383 $309 $196 General Government Protection of Persons and Property Public Works Health and Sanitation Transportation Cultural and Recreational Services Community Development Interest on Debt - 9 -
32 Management s Discussion and Analysis (Continued) For fiscal year 2008, the overall expenses for governmental activities increased by 10.6% or $615 million as compared to fiscal year Rising costs of health benefits under the civilian FLEX programs and increase in provision for long-term claims and judgments were the primary factors for the increase in expenses for general government of $140.5 million. The increase of $327.4 million in expenses for protection of persons and property is reflective of increased expenditures for the expansion of police department, calamities (firestorms) and inspection costs for the enforcement of rental property codes. Business-type Activities The City has six business-type activities: airports, harbor, power, water, sewer and convention center services. The combined operating revenues from their customers and ratepayers of $5.3 billion were 15.7% ($716.5 million) more than the $4.6 billion combined operating costs. Since the proprietary funds provide the same type of information found in the government-wide statements, a more detailed discussion of the activities of the City s business-type activities is found in the financial analysis of the City s funds. FINANCIAL ANALYSIS OF THE CITY S FUNDS As noted earlier, the City uses fund accounting to ensure and demonstrate compliance with financerelated legal requirements. Governmental Funds The focus of the City s governmental funds is to provide information on near-term inflows, outflows and balances of resources that are available for spending. Such information is useful in assessing the City s financial requirements. In particular, the unreserved fund balance may serve as a useful measure for the City s net resources available for spending at the end of the fiscal year. At June 30, 2008, the City s governmental funds reported combined fund balances of $3.6 billion. Of the $3.6 billion, the amount available for spending at the City s discretion (unreserved fund balance) totaled $2.1 billion. The remaining fund balances are reserved to indicate that they are not available for new spending because they have been committed: (1) to pay debt service - $371 million; (2) to reflect loans, inventories, and the amount due from other funds that are long-term in nature and thus do not represent available spendable resources - $504.5 million; (3) to liquidate contractual commitments of the period - $544 million; and (4) for certain other restricted purposes - $6.8 million. Overall, revenues for governmental functions totaled $6.3 billion, while expenditures totaled $7.4 million. Although total revenues were $1.1 billion less than total expenditures, other financing sources bridged the gap. Other financing sources include proceeds from issuance of debt and transfers from enterprise funds. The General Fund is the general operating fund of the City and it includes transactions of the Reserve Fund and other accounts that have General Fund type activity for GAAP reporting purposes. At June 30, 2008, the unreserved fund balance of the General Fund was $418.7 million while total fund balance was $597.9 million. The unreserved fund balance includes $125.2 million designated for emergencies and $37.6 million for advances and other budget adjustments. As a measure of the General Fund s liquidity, it may be useful to compare both unreserved fund balance and total fund balance to total fund expenditures. Unreserved fund balance represents 10.1% of the total General Fund expenditures of $4.2 billion, while total fund balance represents 14.4% of that same amount
33 Management s Discussion and Analysis (Continued) The following table presents the summary of revenues and expenditures of the General Fund: City of Los Angeles Summary of Revenues, Expenditures and Other Financing Sources and Uses- General Fund (dollar amounts expressed in thousands) Revenues FY 08 FY 07 % Change FY 08 FY 07 Expenditures Property Taxes $ 1,412,037 $ 1,305, % General Government $ 1,238,638 $ 1,207, % Sales Taxes 337, , Protection of Persons Utility Users Taxes 617, , and Property 2,238,683 2,055, Business Taxes 465, ,353 (0.0) Public Works 214, ,827 (6.0) Other Taxes 422, ,984 (9.0) Health and Sanitation 164, ,990 (26.5) Licenses and Permits 25,139 20, Transportation 151, , Intergovernmental 23,773 56,340 (57.8) Cultural and Recreational Charges for Services 417, , Services 68,394 66, Services to Enterprise Community Funds 273, , Development 47,262 49,175 (3.9) Fines 140, , Capital Outlay 34,222 30, Special Assessments 2,713 2, Debt Service- Cost Investment Earnings 81,731 75, of Issuance (2.4) Other 64,413 39, Total Revenues 4,283,638 4,141, Total Expenditures 4,157,545 3,997, Other Financing Other Financing Sources Uses Transfers In 239, ,272 (5.0) Transfers Out 475, , Total Revenues and Revenues and Other Financing Sources Expenditures and Other Financing Uses Total Expenditures and % Change Other Financing Other Financing Sources $ 4,523,396 $ 4,394, % Uses $ 4,633,460 $ 4,473, % Excess of Revenues Over Expenditures.. $ 126,093 $ 144,553 (13) % Net Change in Fund Balance $ (110,064) $ (79,077) 39.2 % The General Fund continued to benefit from the previous years growth in assessed property values as reflected by the increase of $106.6 million or 8.2% in property tax revenues. However, the slump in real estate sales activity has impacted the General Fund s revenue from documentary transfer taxes (a component of other taxes). Business and sales tax revenues had a combined modest increase of $3.7 million indicative of the weak sales in fiscal year A significant decrease in accruals of receipts from state mandated programs and a decrease in the state motor vehicle license fee were the main reasons for the $32.6 million or 57.8% drop in intergovernmental revenue. Increased revenue from emergency ambulance services and related cost reimbursements from other city funds were the primary reasons for the $35.7 million or 9.4% increase in charges for services. Reimbursements from Airports and Harbor for security and legal services were the main reasons for the $18.2 million increase in revenues from services to enterprise funds
34 Management s Discussion and Analysis (Continued) Receipts from enforcement of parking regulations contributed to the $5.5 million increase in revenues from fines. The increase of $25.4 million or 64.9% in other revenues was primarily due to the tenant rent income and parking fees from a newly acquired City building which is still partially occupied by commercial tenants and receipt of partial payment for the sale of fiber optic network assets to another City enterprise department. The General Fund accounts for the plurality of participating funds in the City s general investment pool. As mentioned earlier, the rates of return of the Treasury Pool s portfolios for fiscal year 2008 trended higher as compared to fiscal year This resulted in the increase in investment earnings. Total General Fund expenditures for fiscal year 2008 were $4.2 billion, an increase of $160.2 million or 4%, from $4 billion in fiscal year Expenditures for general government, protection of persons and property, and transportation accounted for most of the increase, $31 million, $183 million, and $16.3 million, respectively. The remaining expenditure categories had a net decrease of $70.1 million. For governmental activities, increased funding was incurred for the following programs/projects: City Attorney for police-related litigation and gang prosecution program; General Services for increased security, maintenance and custodial services for City owned parks and other facilities, and increased cost of petroleum products due to high fuel prices; and central costs for workers compensation, litigation and employee health and dental benefits. The increase in expenditures for protection of persons and property is aligned with the City s continued focus on public safety. Additional funding was incurred for the following: police officers and firefighters recruitment, training, sworn overtime for anti-gang police activities, modernization of crime and firefighting equipment, and vehicle replacement. Payment for settlement costs for a personal injury case related to a traffic accident against the City is the main reason for the increase in expenditures for transportation. Overall, General Fund revenues exceeded expenditures by $126.1 million, down $18.5 million from $144.6 million in fiscal year Transfers in from other funds amounted to $239.8 million, while transfers out amounted to $475.9 million. The Power Enterprise Fund transfer of $182 million accounted for majority (75.9%) of the total transfers in. As discussed further in the notes to the financial statements (see page 155), the Water transfer of $33.4 million is held in abeyance until a judicial resolution is obtained validating the legality of the transfer. Debt service and lease payments to the City s financing authority accounted for 23.8% of the total transfers out while the General Fund s support for the operations of City libraries, zoo, parks and recreational facilities, and arts and cultural facilities accounted for 45.6%. The above factors resulted in a year end fund balance of $597.9 million, a decrease of $110 million from the prior year s fund balance of $707.9 million. The following charts show graphical comparison of General Fund revenues by source and expenditures by function
35 Management s Discussion and Analysis (Continued) General Fund Revenues by Source: $4.28 Billion Fiscal Year Ended June 30, % 3.3% 6.4% 9.7% 0.5% 0.6% 9.9% 1.9% 1.5% 33.0% 10.9% 14.3% 7.9% Property Taxes (33.0%) Sales Taxes (7.9%) Utility Users Taxes (14.3%) Business Taxes (10.9%) Other Taxes (9.9%) Licenses and Permits (0.6%) Intergovernmental (0.5%) Charges for Services (9.7%) Services to Enterprise Funds (6.4%) Fines (3.3%) Special Assessments (0.1%) Investment Earnings (1.9%) Other (1.5%) General Fund Revenues by Source: $4.14 Billion Fiscal Year Ended June 30, % 9.2% 0.1% 3.3% 6.2% 1.8% 0.9% 31.5% 0.5% 11.2% 11.2% 14.6% 8.1% Property Taxes (31.5%) Sales Taxes (8.1%) Utility Users Taxes (14.6%) Business Taxes (11.2%) Other Taxes (11.2%) Licenses and Permits (0.5%) Intergovernmental (1.4%) Charges for Services (9.2%) Services to Enterprise Funds (6.2%) Fines (3.3%) Special Assessments (0.1%) Investment Earnings (1.8%) Other (0.9%)
36 Management s Discussion and Analysis (Continued) General Fund Expenditures by Function: $4.16 Billion Fiscal Year Ended June 30, % 3.6% 4.0% 5.2% 1.1% 0.8% 29.8% 53.8% General Government (29.8%) Protection of Persons and Property (53.8%) Public Works (5.2%) Health and Sanitation (4.0%) Transportation (3.6%) Cultural and Recreational Services (1.7%) Community Development (1.1%) Capital Outlay (0.8%) General Fund Expenditures by Function: $4.00 Billion Fiscal Year Ended June 30, % 1.7% 3.4% 5.6% 1.2% 0.8% 30.2% 51.4% General Government (30.2%) Protection of Persons and Property (51.4%) Public Works (5.7%) Health and Sanitation (5.6%) Transportation (3.4%) Cultural and Recreational Services (1.7%) Community Development (1.2%) Capital Outlay (0.8%)
37 Management s Discussion and Analysis (Continued) The Building and Safety Permit Fund accounts for the fees collected for plan check, permitting, and inspection of new construction in the City; testing of construction materials and methods; and examining the licensing of welders, equipment operators, and registered deputy building inspectors. At June 30, 2008, the Fund s unreserved fund balance was $74.1 million, while the total fund balance was $78.1 million, which reflected a minimal increase of $0.2 million from the previous fiscal year. The continued decline in construction activities that was directly impacted by the economic downturn has resulted in reduced applications for new building permits. The Community Development Fund accounts for federal grant funds for community and economic development within the City. At June 30, 2008, the Fund s unreserved fund balance reflected a deficit of $14 million, while the total fund balance was $190.1 million, which reflected an increase of $7.8 million. Federal block grant revenues of $124.8 million were up $27.7 million while the expenditures were higher as compared to the prior fiscal year due to acquisition and improvement of community facilities and new housing programs. The Municipal Improvement Corporation Funds account for the activities of the City s public financing entity, Municipal Improvement Corporation of Los Angeles (MICLA). Acquisition of certain properties and equipment, and construction of buildings and other improvements are financed through the issuance of MICLA certificates of participation and revenue bonds. The Debt Service Fund s aggregate principal and interest expenditures for the year were $280.2 million, while lease payments from the General Fund and certain Special Revenue Funds were $136.2 million. Investment earnings and available fund balance of the MICLA Debt Service Fund and transfers of available funds from the MICLA Special Revenue Fund funded the difference of $144 million. The Proposition A Local Transit Assistance Fund accounts for the City s 25% share of the additional one-half cent sales tax within the County of Los Angeles for public transit programs. At June 30, 2008, the Fund s unreserved fund balance was $123.6 million, while the total fund balance was $133 million, which reflected an increase of $26.9 million from the previous fiscal year. The increase was mainly due to reimbursements from the Federal Transit Administration (FTA) and Metropolitan Transportation Authority (MTA) for the purchase of buses, and increase in ridership and commuter transit fares. The Recreation and Parks Fund accounts for the City s recreation programs and park services. At June 30, 2008, the Fund s unreserved fund balance was $201 million, while the total fund balance was $214.2 million. The Fund s total expenditures exceeded its revenues by $122.4 million. As discussed earlier, transfers from the General Fund and available fund balance financed the deficiency of revenues. The Solid Waste Resources Fund accounts for the solid waste collection, transfer, recycling, recovery of waste resources, and disposal fees imposed on all single dwellings in the City and on multiple unit dwellings for which the City provides refuse collection services. The Fund was formerly known as Sanitation Equipment Charge Fund. At June 30, 2008, the Fund s unreserved fund balance was $74.6 million, while the total fund balance was $103 million, which reflected a decrease of $7 million from the previous fiscal year. Revenues during the fiscal year were higher due to the increases in rates to $22 for single family residences and $14.52 for multi-family residences, while expenditures for the collection and disposal of household refuse and solidwaste at landfills were also higher compared to the prior fiscal year. The increase in disposal fee rate was implemented for the Fund s full cost recovery program, thereby, eliminating the General Fund support to the City s solid waste collection activities
38 Management s Discussion and Analysis (Continued) Proprietary Funds The City s proprietary funds provide the same type of information in the business-type activities column of the government-wide financial statements. The following table summarizes the operating results of the City s six enterprise funds: Business-type Activities Change in Net Assets For the Fiscal Year Ended June 30, 2008 (amounts expressed in thousands) Other- Convention Airports Harbor Power Water Sewer Center Total Operating Revenues $ 774,288 $ 426,345 $ 2,781,324 $ 744,036 $ 526,686 $ 26,088 $ 5,278,767 Operating Expenses (732,835) (300,047) (2,457,597) (599,986) (433,106) (38,724) (4,562,295) Operating Income (Loss) 41, , , ,050 93,580 (12,636) 716,472 Net Nonoperating Revenues (Expenses) 186,351 (1,285) (19,668) (71,469) (94,120) 45 (146) Capital Contributions 125,292 14,161 17,601 25,615 18, ,299 Transfers In Transfers Out (182,004) (33,425) (215,429) Change in Net Assets $ 353,096 $ 139,174 $ 139,656 $ 64,771 $ 18,090 $ (12,569) $ 702,218 Business-type Activities Change in Net Assets For the Fiscal Year Ended June 30, 2007 (amounts expressed in thousands) Other- Convention Airports Harbor Power Water Sewer Center Total Operating Revenues $ 659,025 $ 417,161 $ 2,600,055 $ 668,501 $ 505,142 $ 26,435 $ 4,876,319 Operating Expenses (663,317) (251,881) (2,266,236) (514,340) (389,526) (35,714) (4,121,014) Operating Income (Loss) (4,292) 165, , , ,616 (9,279) 755,305 Net Nonoperating Revenues (Expenses) 165,748 (32,863) (22,474) (60,569) (95,824) (13) (45,995) Capital Contributions 82,088 4,145 19,719 17,970 27, ,991 Transfers In Transfers Out (174,747) (29,931) (204,678) Change in Net Assets $ 243,544 $ 136,562 $ 156,317 $ 81,631 $ 46,861 $ (9,281) $ 655,634 Airports Airports Enterprise Fund accounts for the operation, maintenance and development of City airports namely: Los Angeles International Airport, Ontario International Airport, Van Nuys Airport, and Palmdale Regional Airport. For the fiscal year ended June 30, 2008, the Airports operating revenues increased by $115.3 million (17.5%), to $774.3 million, due primarily to increases in concession revenues of $51 million, building rentals of $35.8 million and landing fees of $21.3 million. The increase in concession revenues is due to the increase in enplaned passengers from 34.3 million to 34.7 million in the City s airports,
39 Management s Discussion and Analysis (Continued) and $25 million revenue from the new on-airport customer facilities charges, a fee collected from customers per vehicle rental. Fiscal year 2008 operating expenses increased $69.5 million (10.5%) from fiscal year Significant variances were posted in the following categories: $40.6 million increase in salaries and benefits due to increase in staffing level, retirement contribution, employee health benefit cost and cost of living adjustment; $11.2 million increase in contractual services due to new parking and transportation contracts, $8.1 million increase in utilities offset by a $5 million decrease in materials and supplies. The major nonoperating activities of the Airports Enterprise Fund for fiscal year 2008 included: $129.1 million passenger facility charges that increased by $3.6 million; $78.8 million interest and investment income that included a net increase in the fair value of investments at June 30, 2008 of $24.1 million; $22.5 million interest expense that increased by $1.6 million; and $125.3 million capital grants that increased by $43.2 million attributable largely to security-related federal reimbursement program. As a result of the above financial changes, the Airports Enterprise Fund s change in net assets for fiscal year 2008 amounted to $353.1 million, up $109.6 million from fiscal year Harbor The Harbor Enterprise Fund accounts for the operations of the Port of Los Angeles. It provides for the needs of commerce, navigation, and fishery for the citizens of California. For the fiscal year ended June 30, 2008, operating revenues of the Port of Los Angeles (the Port) rose to $426.3 million, reflecting a 2.2% increase from prior year revenues of $417.2 million. This increase is principally attributed to the $8.8 million increase in net revenue from wharfage (fee charged against merchandise for passage over wharf premises, between vessels, onto or from barges) and the $4.4 million increase in land rental income. The Port moved 8.1 million twenty-foot equivalent units (TEUs) in container volume during fiscal year 2008, or a 6.3% drop from the prior year. Operating expenses before depreciation of $221.8 million increased by $58 million from $163.8 million, a 35.4% increase over the prior fiscal year. The increase reflected the $20.7 million increase in provision for litigation and settlement expenses. Salaries and benefits expense increased by $21.1 million due to scheduled employee pay adjustments, continued expansion of the Port s workforce and a one time payment of $5.2 million to the City s Fire and Police Pension System (Pensions) for the transfer of Port police pension from the civilian pension plan. In addition, cost of outside services increased by $4.7 million. Depreciation expense in fiscal year 2008 was $9.8 million less than the prior fiscal year. Prior year s depreciation charges were higher due to an upward adjustment for certain depreciable capital assets placed in service before Significant changes in the net nonoperating items were as follows: $10.9 million increase in interest and investment income due to additional cash available for investing in fiscal year 2008 as compared to 2007; $12 million decrease in interest expense due to a $13.5 million interest expense recognized in fiscal year 2007 for bond refunding and lower principal balances on long-term debt than the last fiscal year; $2.6 million decrease in revenues from delinquent charges and $5.6 million decrease in capital grants. As a result of the above financial changes, the Harbor Enterprise Fund s change in net assets for fiscal year 2008 amounted to $139.2 million, up $2.6 million from fiscal year
40 Management s Discussion and Analysis (Continued) Power and Water. The Power and Water Enterprise Funds account for the operations of the Department of Water and Power in supplying the City and its inhabitants with water and electric power by constructing, operating, and maintaining facilities located throughout the City and in Inyo and Mono counties. Power During fiscal year 2008, operating revenues posted a net increase of $181.3 million (7%) from fiscal year Retail revenues increased by $193.9 million while wholesale revenues decreased by $12.6 million. The increase in retail revenue is due to the increase in base rates, increase in costs that are recoverable through the energy cost adjustment billing factor and a 1% increase in retail consumption. The decrease in wholesale revenue is due to the deferral of $23.6 million to the rate stabilization account. Fiscal year 2008 operating expenses increased by $191.4 million as compared to fiscal year Fuel for generation increased $102.6 million due to the higher cost of natural gas. Other operating costs increased by $94.6 million and were offset by a decrease in maintenance expense of $8.2 million. The increase in other operating costs was primarily due to $45 million in distribution expenses, $18 million in public benefits, and $18 million in transmission and other production expenses. The decrease in maintenance costs was mostly related to decreased maintenance expenses for distribution plant. The major nonoperating activities of the Power Fund for fiscal year 2008 included the transfer of $182 million to the City s General Fund, interest income earned on investments of $159.3 million, and $195.6 million in debt expenses. The transfer to the General Fund is based on 7% of the previous year s operating revenues. Investment income increased $6.4 million due to additional cash available for investing in fiscal year 2008 as compared to The increase in debt expense of $4.5 million is due to having 8.5 months interest expense on the 2007 series debt issued in October 2007 offset by lower interest rates on variable rate debt. The variable rate bonds daily and weekly rate range decreased from 3.70% to 3.76% as of June 30, 2007 to 1.55% to 1.65% as of June 30, As a result of the above financial changes, including capital contributions of $17.6 million, the Power Enterprise Fund s increase in net assets for fiscal year 2008 amounted to $139.7 million, down $16.7 million from fiscal year Water During fiscal year 2008, operating revenues increased by $75.5 million (11.3%) from fiscal year The increase was due to an increase in qualified pass-through expenditures, primarily purchased water expense. The pass-through rate, which is the adjustable portion of the water rate, is in place to recover the cost of specific expenses that include purchased water, water quality, reclaimed water, demand-side management, and water security. The inclusion of the pass-through rate can increase or decrease revenue from one year to the next based on the costs incurred in these expense categories. The operating expenses for fiscal year 2008 were $85.6 million higher as compared to the prior year. The increase was due to increased purchased water costs of $64.8 million, an increase in other operating costs of $18.9 million, an increase in depreciation charges of $5 million and a decrease in maintenance costs of $3 million. The Water System purchased 41 billion more gallons of water during The increase was due to drier than normal weather conditions, resulting in increased demand for purchased water
41 Management s Discussion and Analysis (Continued) The increase in other operating costs of $18.9 million was mostly due to a $4.3 million increase in water purification and distribution expenses, a $1.3 million increase in allocated property taxes, and a $0.5 million increase in marketing expenses. The maintenance expense decrease of $3 million mostly related to maintenance of mains, dams and reservoirs. The major nonoperating activities of the Water Fund for fiscal year 2008 includes declaring a transfer of $33.4 million to the City s General Fund, $99 million in debt expenses, and capital contributions of $25.6 million. The transfer to the General Fund is based on 5% of the previous year s operating revenues. The legality of the transfer is currently in litigation and the Water System is holding the actual transfer until a judicial resolution is obtained validating the legality of the transfer. The increase in debt expense of $99 million is due to a full year interest expense on the 2007 series debt. The interest rates on the variable rate debt decreased from 3.75% to 5.38% as of June 30, 2007 to 1.60% to 2.60% as of June 30, As a result of the above financial changes, the Water Enterprise Fund s increase in net assets for fiscal year 2008 was $64.8 million, down $16.9 million from fiscal year Sewer The Sewer Enterprise Fund accounts for the construction, operation and maintenance of the City s wastewater collection and treatment system. Total operating revenues of the Sewer Fund for fiscal year 2008 amounted to $526.7 million, a $21.5 million (4.3%) increase from the prior year. The increase in revenues was primarily due to a $23.9 million increase in sewer service charges as a result of a 7% rate increase effective July 1, Total operating expenses amounted to $433.1 million, an 11.2% or $43.6 million increase from the prior year s operating expenses of $389.5 million. Expenses for operations and maintenance accounted for the majority of the increase due mainly to increased General Fund cost reimbursements and a $20 million reclassification of capital expenditures. As a result of the above financial changes, including capital contributions of $18.6 million, the Sewer Enterprise Fund s net assets for fiscal year 2008 increased by $18.1 million, down $28.8 million from fiscal year The following charts show a graphical comparison of the enterprise funds/business-type activities operating revenues. FY 2008 Operating Revenues: $5.28 Billion FY 2007 Operating Revenues: $4.88 Billion Water 14.1 % Sewer 10.0 % Convention Center 0.5% Airports 14.6 % Harbor 8.1 % Water 13.7% Sewer 10.4% Convention Center 0.5% Airports 13.5% Harbor 8.6% Power 52.7% Power 53.3%
42 Management s Discussion and Analysis (Continued) The following chart shows graphical comparison of the enterprise funds/business-type activities operating expenses. $2,500 $2,000 FY 2008 Operating Expenses: $4.56 Billion $2,458 FY 2007: Operating Expenses: $4.12 Billion $2,266 In Millions $1,500 $1,000 $500 $733 $300 $600 $433 $39 $663 $252 $514 $390 $36 $0 Airports (FY08 - $733; FY07- $663) Harbor (FY08 - $300; FY07- $252) Power (FY08 - $2,458; FY07- $2,266) Water (FY08 - $600; FY07- $514) Sewer (FY08 - $433; FY07- $390) Convention Center (FY08 - $39; FY07- $36) GENERAL FUND BUDGETARY HIGHLIGHTS For fiscal year , the City budgeted for two General Fund accounts- the General Fund Operating Account and the Vehicle License Fee Gap Loan Financing Proceeds Account. Transactions between these two accounts (e.g. transfers in and out) were eliminated in the consolidated financial data. For purposes of the budget, General Fund Operating Account and the Vehicle License Fee Gap Loan Financing Proceeds Account are legal entities that are separate and distinct from the non-budgeted Reserve Fund and other accounts that are classified by the City as having General Fund type activity for GAAP reporting purposes. At fiscal year end, the unreserved and undesignated fund balance of the General Fund Operating Account is transferred to the Reserve Fund and reported as Reversion to Reserve Fund. The General Fund ended the year spending less than budgeted while actual revenues ended lower than the estimates. The following table summarizes the operating results on a budgetary basis of the City s General Fund consolidated accounts as described above
43 Management s Discussion and Analysis (Continued) City of Los Angeles Budgetary Operating Results- General Fund Fiscal Year Ended June 30, 2008 (amounts expressed in thousands) Variance With Budgeted Amounts Actual Final Budget Original Final Amounts Positive (Negative) Revenues and Other Financing Sources Taxes $ 3,294,53 8 $ 3,29 4,5 38 $ 3,242,408 $ (52,130 ) Licenses, Permits, Fees and Fines 746, , ,153 (4,566) Intergovernmental 43, ,800 37,955 (5,845) Interest 49, ,990 57,736 7,746 Other 11,872 11,872 12, Total Revenues... 4,146,919 4,146,919 4,092,830 (54,089) Power Transfers 184, , ,004 (2,596) Reserve Fund Transfers 85, ,840 71,229 (14,611 ) Transfers from Other Funds 809,67 2 1,06 5, ,439 (102,514) Loa ns from Other Fu nds ,440 16,909 Total Revenues and Other Financing Sources 5,227,031 5,483,843 5,326,942 (156,901) Expenditures and Other Financing Uses General Government 1,394,83 5 1,43 7,2 03 1,348,621 88,582 Protection of Persons and Property 1,872,398 1,936,263 1,918,714 17,549 Public Works.. 312, , ,786 24,094 Health and Sanitation 251, , ,525 6,378 Transportation.. 140, , ,564 10,389 Cultural and Recreational Services 73,064 75,373 73,520 1,853 Community Development 106, , ,353 8,644 Pension and Retirement Contributions 15,384 15,384 15, Capital Outlay 1,065 35,623 14,430 21,193 Total Expenditures.. 4,168,088 4,400,579 4,221, ,707 Transfers to Other Funds 1,084,11 5 1,10 8,4 36 1,108,433 3 Payment o f Loa ns to Othe r Funds ,908 (18,908 ) Total Expenditures and Other Financing Uses 5,252,203 5,509,015 5,349, ,802 Excess (Deficiency) of R evenues and Other Financing Sources Over Expenditures and Oth er Fin ancin g U se s (25,172) (2 5,1 72) (22,271 ) 2,901 Fund Balance, July 1 25,172 25,172 24,777 (395) Encumbrances lapsed ,435 37,435 Reversion to Reserve Fund (39,434 ) (39,434) Fund Balance, June 30 $ -- $ -- $ 507 $ 507 During fiscal year 2008, the City faced financial challenges. This is evidenced by actual revenues and other financing resources falling below budgetary estimates by $156.9 million or 2.9%. Residential development and documentary transfer taxes was down $1.1 million or 26.2% and $24.1 million or 15.3%, respectively. The economic downturn negatively impacted sales tax receipts which decreased by $13.3 million or 3.8%. Other tax revenues were $13.6 million below budget. The $4.6 million decrease in licenses, permits, fees and fines is mainly due to the decreased reimbursements from other funds for services provided by the General Fund. Interest income is $7.7 million higher than budget due to the slight net increase of 1.1% in the rates of return of the City s pooled investments. Intergovernmental revenue is $5.8 million lower compared to budget mainly due to the decrease in state motor vehicles license fees
44 Management s Discussion and Analysis (Continued) During the course of FY 2008, the Mayor, the Council and City departments adopted measures to maintain the City s fiscal integrity. Some of the actions implemented were managed hiring process, voluntary furloughs, suspension of non-emergency overtime, controlled contract expenditures, and delays on equipment purchases. As a result, actual expenditures were below the final budget amounts. Overall, the fiscal year ended with a $39.4 million reversion to Reserve Fund. LONG-TERM DEBT At June 30, 2008 the City s bonded indebtedness and long-term notes payable totaled $14.9 billion as follows: City of Los Angeles Summary of Bonded Debts and Long-Term Notes Payable (amounts expressed in thousands) Governmental Activities Business-type Activities Total FY 2008 FY 2007 FY 2008 FY 2007 FY 2008 FY 2007 Debt backed by the City General Obligation Bonds $ 1,336,040 $ 1,446,530 $ -- $ -- $ 1,336,040 $ 1,446,530 Judgment Obligation Bonds 9,195 15, ,195 15,340 Special Assessment Debt 29,390 31, ,390 31,025 Debt Secured by Specified Revenue Sources Certificates of Participation and Lease Revenue Bonds 1,840,024 1,638, ,840,024 1,638,484 Revenue Bonds and Notes Payable 626, ,651 11,010,836 10,362,230 11,637,614 10,988,881 Loans Payable to U.S. Department of Housing and Urban Development 76, , , ,657 Total $ 3,917,482 $ 3,887,687 $ 11,010,836 $ 10,362,230 $ 14,928,318 $ 14,249,917 Significant new issuances during the year are the following: $328 million MICLA lease revenue bonds to finance the costs of acquisition of an office building complex and parking structure and certain capital equipments. $204.6 million Airports commercial paper notes to reimburse cash used for airfield improvements and to fund deposits placed into revocable escrow accounts used as an interim step toward maintaining the required IRS non-taxable definition for long-term financing of certain defeased outstanding bonds. $653.8 million Power Fund revenue bonds to be used for capital improvements. $34.8 million loan from the California Department of Water Resources to fund water quality capital improvement projects. $444.6 million Sewer Enterprise subordinate revenue bonds refunding series 2008 A-H to current refund $289 million of the outstanding 2001 series A-D and $315.8 million of the outstanding 2006 series A-D subordinate revenue bonds, and $160 million commercial paper notes as a bridge financing to refund a portion of the 2001 series A-D subordinate revenue bonds
45 Management s Discussion and Analysis (Continued) More detailed information on the City s bonds and other long-term debt can be found in Note 4I of the Notes to the Basic Financial Statements beginning on page 111. As of June 30, 2008, there were no changes in the ratings of the outstanding bonds and the City is in compliance with its bond covenants. The City s Debt Management Policy establishes guidelines for the structure and management of the City's governmental activities debt obligations. These guidelines include target and ceiling levels for certain debt ratios to be used for financial planning purposes. The policy places certain restrictions on the types of items that can be financed, limiting financing only to those items with a useful life of six years or more. In accordance with this policy, the ratio of annual debt payments cannot exceed 15% of General Fund revenues for voter-approved and non-voter approved debt overall, and cannot exceed 6% of General Fund revenues for non-voter approved debt alone. The 6% ceiling for nonvoter approved debt may be exceeded, only if there is a guaranteed new revenue stream for the debt payments and the additional debt will not cause the ratio to exceed 7.5%, or there is no guaranteed revenue stream but the 6% ceiling shall not be exceeded for more than one year. In addition, the policy specifies that the City's debt shall not exceed certain other ratios as defined by Moody's Investors Service, which are listed in the City Debt Policy Statement section of the City Budget. The City s Variable Rate Debt policy sets forth the purposes and the criteria for using variable rate debt, and the factors to be considered in determining the appropriate amount of the variable rate debt. It also requires diversification of remarketing agents and counterparties. Budgeting, monitoring and reporting requirements are also included in the policy. The City s Interest Rate Risk Mitigation Policy provides guidelines for the use of interest rate mitigation products such as swaps, caps, floors, collars and options in connection with the incurrence of debt. While the use of these financing products can reduce the City s exposures to risks inherent to certain types of debts, careful monitoring is required to preserve the City s credit strength and budget flexibility. As of June 30, 2008, the City is in compliance with the aforementioned policies. In order to protect against potential rising of interest rates, the City entered into pay-fixed, receivevariable interest rate swap agreements on the $235.5 million Convention Center variable rate lease revenue refunding bonds and on the $316.8 million Sewer Enterprise Fund Subordinate Variable Revenue Bonds. The swap agreements were effective June 1, 2004 and April 6, 2006, respectively. The costs associated with the swap are less than what the City would have paid to issue fixed rate debt. Terms, fair values, and credit risks associated with the swap agreements are discussed in Note 4M of the Notes to the Basic Financial Statements beginning on page 131. Information related to the City s legal debt margin is found on pages 326 and 327. Pledged revenue bond coverage for the City s enterprise funds is found on pages 328 and
46 Management s Discussion and Analysis (Continued) CAPITAL ASSETS The City s investment in capital assets for its governmental and business-type activities as of June 30, 2008 amounted to $26.3 billion (net of accumulated depreciation). This investment in capital assets, which accounts for 66.5% of the City s total assets, includes land, buildings, facilities, equipment, infrastructure, and construction in progress. The following table presents the City s capital assets (in thousands): City of Los Angeles Summary of Capital Assets Used in Operations (amounts expressed in thousands) Governmental Activities Business-type Activities Total Not Depreciated Land $ 659,732 $ 608,242 $ 2,211,756 $ 2,178,122 $ 2,871,488 $ 2,786,364 Infrastructure 147, , , ,079 Construction in Progress 1,695,011 1,350,367 3,124,325 2,643,227 4,819,336 3,993,594 Subtotal 2,502,257 2,104,688 5,336,081 4,821,349 7,838,338 6,926,037 Depreciated, Net Buildings, Facilities and Equipment 2,180,580 2,006,075 14,292,175 13,839,031 16,472,755 15,845,106 Infrastructure 1,739,775 1,637, ,739,775 1,637,689 Subtotal 3,920,355 3,643,764 14,292,175 13,839,031 18,212,530 17,482,795 Natural Gas Field, Net , , , ,163 Nuclear Fuel at Amortized Cost ,982 18,311 32,982 18,311 Total $ 6,422,612 $ 5,748,452 $ 19,890,062 $ 18,913,854 $ 26,312,674 $ 24,662,306 As of June 30, 2008, the condition of City bridges is compliant with the City s policy. Seventy two percent of all City bridges are rated B or better and no bridge is rated less than D. The planned costs for preservation and maintenance was $35.1 million, but $35.8 million was actually spent. The required supplementary information for bridges is presented on pages 184 and 185. Major capital assets activities during the year are as follows: Governmental Activities Completed building construction and various improvements amounted to $249 million that included $183 million acquisition, construction and improvement costs for various municipal facilities; and $66 million for library, recreation and parks, and zoo facilities. Capitalized charges for various projects under construction totaled $518.1 million. These projects are for police, library, recreational, zoo, stormwater, streets, traffic, transportation and various other City facilities and infrastructure projects. Capitalized expenses for infrastructure assets totaled $154 million
47 Management s Discussion and Analysis (Continued) Acquisition of machinery and equipment that were capitalized totaled $100.9 million, while those retired, salvaged, deleted or sold amounted to $45.8 million. Business-type Activities The Airports Enterprise Fund added $59.9 million, including transfers from construction in progress, to its depreciable capital assets. Of the $59.9 million, $46.1 million, or 77.1%, related to improvements to various facilities that include LAX noise mitigation projects, Southside Airfield projects, interior improvements at the Tom Bradley International Terminal, and in-line baggage screening systems. The Harbor Enterprise Fund capitalized $176.8 million in fiscal year 2008, including transfers from construction in progress. The majority of the capitalized expenses were terminal development and dredging. Other significant capital outlays were related to commercial development and environmental enhancements. The Power Enterprise Fund capitalized $434 million of additions, including transfers from construction in progress, to depreciable utility plant in service. Of the $434 million, $313 million, or 72.2%, related to distribution plant assets. In addition, the Fund had a net decrease of $85 million for transmission plant due to retirement of assets from the Sylmar Converter Station. Construction in progress increased by $116 million in fiscal year The increase is mostly attributable to the Pinetree Wind Project, Generation System, Underground Transmission and Automated Meter Reading. The Water Enterprise Fund capitalized $274 million of additions to depreciable utility plant in service. Of the $274 million, $93 million, or 33.8% related to distribution utility plant assets, and $116 million went to source of supply assets. Additions to distribution utility plant assets comprised the completion of various major reservoir and trunk line projects. Additions to source of supply assets include structures and improvements to the aqueduct system. The remaining additions were incurred for normal capital activities to maintain and support general plant, pumping, and purification systems. The Sewer Enterprise Fund put into service $357.6 million of additions, including transfers from construction in progress, to utility plant in service. Of the $357.6 million, $196.3 million or 54.9% related to the collection system and $155.5 million or 43.5% related to treatment plants and equipment. Charges to construction in progress totaled $159.3 million. These projects are driven by regulatory requirements. Significant commitments that include construction contracts are discussed in Note 5B of the Notes to the Basic Financial Statements on page 162. The City s policy affecting capital assets can be found in Note1E of the Notes to the Basic Financial Statements on pages Additional information can be found in Note 4F on pages
48 Management s Discussion and Analysis (Continued) ECONOMIC FACTORS AFFECTING NEXT YEAR S BUDGET The City s fiscal year adopted budget is $7.1 billion. Of this amount, $3.9 billion, or 54.4%, is appropriated for departmental expenditures. The remainder of $3.2 billion is appropriated for nondepartmental expenditures. Estimated general receipts of $4.6 billion, special receipts of $2.1 billion, and available balances of $0.4 billion fund the budget. The $4.6 billion budgeted receipts of the General Fund operating account project a $190.8 million (or 4.4%) net increase from fiscal year actual receipts as follows (dollar amounts in millions): FY FY Increase (Decrease) Budget Receipts Amount % Taxes $ 3,333.2 $ 3,242.4 $ % Licenses, permits, fees and fines % Intergovernmental (0.2) -0.5% Interest (25.5) -44.2% Other % Transfers from other funds (a) (71.9) -26.3% Total $ 4,553.7 $ 4,362.9 $ % (a) Other funds include Reserve, Tax Reform, Power and Telecommunications Liquidated Damages Funds. Receipts from all tax categories except documentary transfer tax and residential development tax are expected to increase slightly compared to prior year s receipts. Property tax is still the City s largest General Fund revenue source. The amount of property tax received is determined by complex Proposition 13 related factors including inflation, the real estate market, new construction activity, assessment appeals and restorations to the tax rolls. For fiscal year , property tax receipts are projected to increase by $34.2 million. This reflects a modest net growth of $16.4 million or 1.7% in the 1% general property tax category. A 4.8% growth is projected for the secured property tax component but there is an anticipated 50% reduction in the supplemental property tax receipts. The supplemental tax on properties sold and improved after the lien date is expected to have a downward trend. The other two components are property tax in-lieu of sales tax and vehicle license fee (VLF) replacement. The sales tax replacement is based on taxable sales; therefore, no growth is projected. The VLF replacement is estimated to increase by 6%, same as the projected rate of increase in local property tax valuation. The slump in real estate sales activity is expected to continue in fiscal year and declines in documentary transfer tax and residential development tax of $12.9 million and $1 million, respectively, are projected. Receipts for licenses, permits, fees and fines from fee recovery and related cost reimbursements from other funds and parking fines are budgeted to be $196 million higher in fiscal year Implementation of state-of-the-art parking meter technology for 15% of the meters will supplement City revenues in the next fiscal year. The budgeted transfer from Power Revenue Fund is $197.4 million which is $15.4 million higher than fiscal year
49 Management s Discussion and Analysis (Continued) The prolonged real estate downturn, rising foreclosures, reduced international travel and uncertainty in economic recovery will continue to have a negative impact on City revenues. In view of existing volatile economic conditions, and the uncertainty of their duration, the City faces serious financial challenges. A review of recent economic performance and forecasts by leading economists provides important insight into the region s economic outlook and of the City s revenue base. Employment in Los Angeles County has fluctuated over the last ten years, growing by 1.8% annually between 1998 and 2000, and then falling by 1.1% in 2002 and This fall was followed by slow growth, less than 1% in 2004, 2005 and 2007, and a 1.7% growth in For 2008 and 2009, the Los Angeles County Economic Development Corporation (LAEDC) projects growth of 0.06% and 0.61%, respectively. Another indicator of the local economy is the change in personal income. Personal income growth in the Los Angeles County area averaged 6.5% from 2004 through 2006 and 5.79% in LAEDC anticipates growth to increase by 4.5% in 2008 for the state and 5% for the county, and UCLA forecasts a slowdown of about 0.1% to -0.6% going into Employment is the primary determining factor of income and income determines the ability of consumers to make purchases. However, in the third quarter of 2007, the State s taxable sales declined 1.8% while income rose 6.1%, a distinctive break from the long-term trend of taxable sales growing at rates faster than incomes during times of stronger economic growth. The City s sales tax budget estimate for fiscal year is consistent with LAEDC s projection of 0.6% decline in taxable sales during calendar years 2007 and Other matters that are affecting and will affect the City s current and future operations are as follows: Contract negotiations with unions representing City civilian employees occurred in fiscal year Each 1% salary increase granted will cost the City approximately $12 million. Contracts for the majority of civilian employees provide for a 3% increase on July 1, 2008 and 3% increase on July 1, Contract negotiations for unions representing police officers and firefighters will expire on June 30, The full effect of salary increase for sworn employees will not be known until the conclusion of contract negotiations. The City s General Fund contributions to the civilian retirement, and fire and police pension systems has increased from $183 million in fiscal year to $680 million in fiscal year The credit crisis and instability in the financial markets could result in reduced investment returns which would increase the City s future contributions. While there was a substantial reduction of the transfer to budget in fiscal year 2008, the beginning Reserve Fund balance for fiscal year 2009 is not at its anticipated 4.5% of budgeted General Fund receipts. The Contingency Reserve Account is below budget. Problems in the national, state, and local economies may weaken future revenues, making it difficult to restore the Reserve Fund balance to the desired level. The City Administrative Officer (CAO) normally prepares a five-year budget forecast that is submitted to the Mayor and City Council in various reports during the year based on the premise that revenues are consistent with the Adopted Budget. The latest CAO report projected deficits of $432.9 million in Fiscal Year , and $550.6 million in Fiscal Year The Mayor and Council are aware of the projected deficits. Items being considered to bring ongoing expenditures in line with ongoing revenues include revenue enhancements, tax amnesty, voluntary retirement incentives, involuntary workforce reductions and prioritizing City core services
50 Management s Discussion and Analysis (Continued) COMMUNITY REDEVELOPMENT AGENCY OF THE CITY OF LOS ANGELES The Community Redevelopment Agency is a component unit that is legally separate from the City. It is discretely presented because its governing board is not substantially the same as the City s governing body and it provides services directly to the citizenry rather than to the City government. The following schedule provides condensed data from the CRA s statement of net assets: Community Redevelopment Agency Condensed Statement of Net Assets (amounts expressed in thousands) FY 2008 FY 2007 Current and other assets $ 882,633 $ 676,662 Capital assets 98,518 98,670 Total assets 981, ,332 Current and other liabilities 78,534 70,564 Long-term liabilities 842, ,656 Net assets: Total liabilities 921, ,220 Invested in capital assets, net of related debt 56,843 56,364 Restricted 616, ,576 Deficit (613,789) (588,828) Total net assets $ 59,951 $ (57,888) At June 30, 2008, the CRA s total assets exceeded its total liabilities by $60 million or an increase of $117.8 million from the previous year s deficit of $57.9 million. The increase is due to increases in tax increment revenues and capital grants and contributions which generated more resources for CRA s programs. The deficit in unrestricted net assets is primarily due to the issuance of debt, secured and to be paid for by future incremental property taxes. Debt proceeds are used to finance redevelopment activities that benefit the community and increase the project areas taxable base. The redevelopment activities do not necessarily result in CRA assets; if they do, such assets are carried in the CRA s books at substantially below cost. The CRA also provides gap financing on certain redevelopment activities and any equity assumed in these projects is significantly less than the financing provided. For the fiscal year ended June 30, 2008, the CRA incurred additional bonded debt and notes payable totaling $92.6 million, while retirements and defeasances totaled $20.7 million. Proceeds of the debt issuances increased cash and investment, a component of current and other assets
51 Management s Discussion and Analysis (Continued) At June 30, 2008, the CRA s net long-term debt amounted to $842.7 million. Of this amount, 81.6% or $687.5 million are tax allocation bonds. The CRA issues tax allocation bonds to finance certain redevelopment programs. Receipts from incremental property taxes are used to pay debt service on the tax allocation bonds. Incremental property taxes are collected from the excess of property taxes levied and collected each year on a redevelopment project over the amount that is levied and collected on the base year property tax assessment. The following table presents the operating results of the CRA: Community Redevelopment Agency Condensed Statement Activities (amounts expressed in thousands) FY 2008 FY 2007 Program Revenues Charges for Services $ 9,702 $ 8,796 Capital Grants and Contributions 44,990 29,387 General Revenues Incremental Property Taxes 211, ,300 Interest Income 24,459 24,747 Other 16,452 12,187 Total Revenues 307, ,417 Program Expenses Housing 58,057 46,747 Community and Economic Development 36,141 29,471 Public Improvement 14,393 11,242 Project General 37,831 31,496 Parking facilities 5,223 5,137 Interest on Long-term Debt 37,610 35,600 Total Program Expenses 189, ,693 Change in Net Assets $ 117,839 $ 76,724 For the fiscal year ended June 30, 2008, the CRA s revenues totaled $307.1 million, a $70.7 million (29.9%) improvement from the prior fiscal year. Incremental property taxes contributed $50.2 million to the overall revenue growth. The CRA benefited from the robust real estate market in the prior years that spurred the growth in assessed valuation. Total program expenses, other than interest on long-term debt, had a net increase of $27.6 million or 22.2%. The $2 million increase in interest expense is due to the additional bonds and notes issued during the fiscal year. As a result of the above financial changes, the CRA s increase in net assets for fiscal year 2008 was $117.8 million, up $41.1 million from fiscal year Among the measures that the State of California has adopted to alleviate its budget deficit is to require redevelopment agencies to shift tax increment revenues to K-12 schools and community colleges. During fiscal year 2009, CRA s commitment is $14.6 million
52 Management s Discussion and Analysis (Continued) REQUEST FOR INFORMATION This financial report is designed to provide our citizens, taxpayers, customers, creditors, and other users with a general overview of the City s finances. Questions concerning any of the information provided in this report or requests for additional financial information should be addressed to the Office of the City Controller, 200 North Main Street, City Hall East Room 300, Los Angeles, CA
53
54 Statement of Net Assets June 30, 2008 (amounts expressed in thousands) Component Unit- Primary Government Community Governmental Business-type Redevelopment Activities Activities Total Agency ASSETS Cash and Pooled Investments $ 3,759,709 $ 1,733,379 $ 5,493,088 $ 137,959 Other Investments 62, , , ,011 Receivables, Net 1,122,104 2,084,956 3,207, ,012 Loans Receivable from Component Unit 78, , Inventories 18, , ,684 96,200 Prepaid Items and Other Assets 26, , ,462 32,057 Restricted Assets 6,175 2,791,588 2,797, ,394 Internal Balances 29,908 (29,908) Investment in Joint Ventures -- 12,255 12, Net Pension Assets , , Net Other Postemployment Benefits Assets , , Capital Assets Not Depreciated 2,502,257 5,336,081 7,838,338 67,965 Depreciated, Net 3,920,355 14,292,175 18,212,530 30,553 Natural Gas Field, Net , , Nuclear Fuel, at Amortized Cost -- 32,982 32, TOTAL ASSETS 11,525,887 28,020,450 39,546, ,151 LIABILITIES Accounts Payable and Accrued Expenses 431, ,442 1,317,215 9,234 Obligations Under Securities Lending Transactions 523, ,878 1,039, Matured Bonds and Interest Payable Accrued Interest Payable 62, , ,949 22,208 Deposits and Advances 19,775 76,635 96,410 43,592 Other Liabilities 16, , ,968 3,500 Advances from Fiduciary Funds 15, , Non-current Liabilities Due Within One Year 495, , ,632 23,642 Due In More Than One Year 5,923,284 10,884,960 16,808, ,786 Loans Payable to Primary Government (including $301 due within one year) ,238 TOTAL LIABILITIES 7,488,230 13,639,546 21,127, ,200 NET ASSETS Invested In Capital Assets, Net of Related Debt 3,415,049 9,372,493 12,787,542 56,843 Restricted for: Capital Projects 132, , , ,837 Debt Service 209, , ,390 89,645 Public Safety 244, , Public Works and Sanitation 229, , Transportation Programs 579, , Culture and Recreation Activities 248, , Community Development and Housing 396, , ,415 Passenger Facility Charges , , Pension and Other Postemployment Benefits , , Other Purposes 36, , , Unrestricted (Deficit) (1,455,537) 2,527,916 1,072,379 (613,789) TOTAL NET ASSETS $ 4,037,657 $ 14,380,904 $ 18,418,561 $ 59,951 The notes to the financial statements are an integral part of this statement
55
56 Balance Sheet Governmental Funds June 30, 2008 (amounts expressed in thousands) Municipal Improvement Building Corporation and Safety Community Special Debt General Permit Development Revenue Service ASSETS Cash and Pooled Investments $ 814,965 $ 85,860 $ 6,010 $ 179,664 $ 72,897 Other Investments ,602 Taxes Receivable (Net of Allowance for Uncollectibles of $416,052) 380, Accounts Receivable (Net of Allowance for Uncollectibles of $514,466) 208,232 1, Special Assessments Receivable (Net of Allowance for Uncollectibles of $2,299) 3, Investment Income Receivable 6, Intergovernmental Receivable (Net of Allowance for Uncollectibles of $42,216) 19, , Loans Receivable (Net of Allowance for Uncollectibles of $698,587) , Due from Other Funds 98,403 4,553 2, Loans Receivable from Component Unit (Net of Allowance for Uncollectibles of $500) , Inventories 18, Prepaid Items and Other Assets , Advances to Other Funds 11, Restricted Assets TOTAL ASSETS $ 1,560,687 $ 92,642 $ 202,167 $ 183,103 $ 135,882 LIABILITIES AND FUND BALANCES LIABILITIES Accounts, Contracts and Retainage Payable $ 78,700 $ 1,212 $ 5,912 $ 26,337 $ -- Obligations Under Securities Lending Transactions 197,215 11, Accrued Salaries and Overtime Payable 185, Accrued Compensated Absences Payable 3, Estimated Claims and Judgments Payable 19, Intergovernmental Payable Due to Other Funds 38, ,134 2, Deferred Revenue and Other Credits 386,086 1,114 3, Deposits and Advances 5, Matured Bonds and Interest Payable Advances from Other Funds 32, Other Liabilities 15, TOTAL LIABILITIES 962,740 14,539 12,052 30, FUND BALANCES Reserved for: Encumbrances 148,305 3,996 19,645 53, Assets Not Available for Appropriation 30, ,550 2, Debt Service ,882 Special Purposes Unreserved: Designated for Special Purposes 162, Undesignated: General Fund 255, Special Revenue Funds -- 74,107 (14,080) 97, Capital Projects Funds TOTAL FUND BALANCES 597,947 78, , , ,882 TOTAL LIABILITIES AND FUND BALANCES $ 1,560,687 $ 92,642 $ 202,167 $ 183,103 $ 135,882 Continued
57 Balance Sheet - (Continued) Governmental Funds June 30, 2008 (amounts expressed in thousands) Proposition A Recreation Solid Other Local Transit and Waste Governmental Assistance Parks Resources Funds Total ASSETS Cash and Pooled Investments $ 154,767 $ 267,072 $ 92,444 $ 2,086,030 $ 3,759,709 Other Investments ,400 Taxes Receivable (Net of Allowance for Uncollectibles of $416,052) , ,598 Accounts Receivable (Net of Allowance for Uncollectibles of $514,466) ,137 10, ,760 Special Assessments Receivable (Net of Allowance for Uncollectibles of $2,299) ,846 20,270 Investment Income Receivable 998 1, ,073 25,121 Intergovernmental Receivable (Net of Allowance for Uncollectibles of $42,216) 15, , ,813 Loans Receivable (Net of Allowance for Uncollectibles of $698,587) , ,542 Due from Other Funds 375 1,956 13,143 17, ,876 Loans Receivable from Component Unit (Net of Allowance for Uncollectibles of $500) ,238 Inventories ,683 Prepaid Items and Other Assets ,405 Advances to Other Funds , ,217 Restricted Assets ,175 6,175 TOTAL ASSETS $ 171,302 $ 270,703 $ 110,510 $ 2,568,811 $ 5,295,807 LIABILITIES AND FUND BALANCES LIABILITIES Accounts, Contracts and Retainage Payable $ 13,900 $ 6,099 $ 2,103 $ 96,464 $ 230,727 Obligations Under Securities Lending Transactions 20,806 35,896 5, , ,535 Accrued Salaries and Overtime Payable -- 10, , ,756 Accrued Compensated Absences Payable ,662 Estimated Claims and Judgments Payable ,582 Intergovernmental Payable ,290 Due to Other Funds ,666 73,947 Deferred Revenue and Other Credits 3, , ,685 Deposits and Advances -- 1, ,277 19,775 Matured Bonds and Interest Payable Advances from Other Funds -- 1, , ,652 Other Liabilities ,260 TOTAL LIABILITIES 38,285 56,540 7, ,373 1,741,402 FUND BALANCES Reserved for: Encumbrances 9,381 13,186 28, , ,025 Assets Not Available for Appropriation , ,476 Debt Service , ,973 Special Purposes ,175 6,776 Unreserved: Designated for Special Purposes ,827 Undesignated: General Fund ,876 Special Revenue Funds 123, ,977 74, ,749 1,233,119 Capital Projects Funds , ,333 TOTAL FUND BALANCES 133, , ,017 1,949,438 3,554,405 TOTAL LIABILITIES AND FUND BALANCES $ 171,302 $ 270,703 $ 110,510 $ 2,568,811 $ 5,295,807 The notes to the financial statements are an integral part of this statement
58 Reconciliation of the Balance Sheet of Governmental Funds to the Statement of Net Assets June 30, 2008 (amounts expressed in thousands) Total Fund Balances - Governmental Funds $ 3,554,405 Amounts reported for Governmental Activities in the Statement of Net Assets are different because: Capital assets used in governmental activities are not financial resources and, therefore, are not reported in the funds. 6,422,612 Other long-term assets are not available to pay for current-period expenditures and, therefore, are deferred in the funds. 494,685 Long-term liabilities, including bonds payable, are not due and payable in the current period and, therefore, are not reported in the funds. (6,434,045) Net Assets of Governmental Activities $ 4,037,657 The notes to the financial statements are an integral part of this statement
59 Statement of Revenues, Expenditures and Changes in Fund Balances Governmental Funds For the Fiscal Year Ended June 30, 2008 (amounts expressed in thousands) Municipal Improvement Building Corporation and Safety Community Special Debt General Permit Development Revenue Service REVENUES Property Taxes $ 1,412,037 $ -- $ -- $ -- $ -- Sales Taxes 337, Utility Users Taxes 617, Business Taxes 465, Other Taxes 422, Licenses and Permits 25,139 30, Intergovernmental 23, , Charges for Services 417,051 77, Services to Enterprise Funds 273, Fines 140, Special Assessments 2, Investment Earnings 81,731 5, ,961 6,016 Program Income , Other 64, , TOTAL REVENUES 4,283, , ,561 11,961 6,016 EXPENDITURES Current: General Government 1,238, Protection of Persons and Property 2,238, , Public Works 214, Health and Sanitation 164, Transportation 151, Cultural and Recreational Services 68, Community Development 47, , Capital Outlay 34, , Debt Service: Principal ,010 Interest ,162 Cost of Issuance , Advance Refunding Loan Escrow TOTAL EXPENDITURES 4,157, , , , ,515 EXCESS (DEFICIENCY) OF REVENUES OVER EXPENDITURES 126, ,166 (466,992) (274,499) OTHER FINANCING SOURCES (USES) Transfers In 239, , ,953 Transfers Out (475,915) -- (15,724) (106,808) -- Issuance of Long-term Debt , Premium on Issuance of Long-term Debt , Proceeds of Refunding Loan Payment for Current Refunding of Loan TOTAL OTHER FINANCING SOURCES (USES) (236,157) 125 (5,326) 357, ,953 NET CHANGE IN FUND BALANCES (110,064) 209 7,840 (109,086) (31,546) FUND BALANCES, JULY 1 707,910 77, , , ,428 INCREASE IN RESERVE FOR INVENTORIES FUND BALANCES, JUNE 30 $ 597,947 $ 78,103 $ 190,115 $ 152,723 $ 135,882 Continued
60 Statement of Revenues, Expenditures and Changes in Fund Balances - (Continued) Governmental Funds For the Fiscal Year Ended June 30, 2008 (amounts expressed in thousands) Proposition A Recreation Solid Other Local Transit and Waste Governmental Assistance Parks Resources Funds Total REVENUES Property Taxes $ -- $ -- $ -- $ 173,192 $ 1,585,229 Sales Taxes ,313 Utility Users Taxes ,199 Business Taxes ,124 Other Taxes , ,431 Licenses and Permits -- 1, ,646 61,047 Intergovernmental 89, , ,376 Charges for Services 11,639 78, , , ,313 Services to Enterprise Funds ,153 1, ,391 Fines , ,600 Special Assessments , ,782 Investment Earnings 7,918 14,734 6, , ,254 Program Income ,451 20,402 Other 1, , ,162 TOTAL REVENUES 109,773 95, ,902 1,344,588 6,296,623 EXPENDITURES Current: General Government ,533 1,268,572 Protection of Persons and Property ,660 2,573,006 Public Works , ,026 Health and Sanitation ,375 64, ,152 Transportation 93, , ,301 Cultural and Recreational Services , , ,727 Community Development , ,768 Capital Outlay ,697 9, , ,999 Debt Service: Principal , ,585 Interest , ,675 Cost of Issuance ,604 Advance Refunding Loan Escrow ,311 41,311 TOTAL EXPENDITURES 93, , ,872 1,739,757 7,376,726 EXCESS (DEFICIENCY) OF REVENUES OVER EXPENDITURES 16,573 (122,389) 23,030 (395,169) (1,080,103) OTHER FINANCING SOURCES (USES) Transfers In 14, ,516 5, ,234 1,021,078 Transfers Out (3,691) -- (35,028) (168,505) (805,671) Issuance of Long-term Debt ,035 Premium on Issuance of Long-term Debt ,596 Proceeds of Refunding Loan ,110 24,110 Payment for Current Refunding of Loan (24,110) (24,110) TOTAL OTHER FINANCING SOURCES (USES) 10, ,516 (30,017) 207, ,038 NET CHANGE IN FUND BALANCES 26,882 10,127 (6,987) (187,440) (400,065) FUND BALANCES, JULY 1 106, , ,004 2,136,878 3,954,369 INCREASE IN RESERVE FOR INVENTORIES FUND BALANCES, JUNE 30 $ 133,017 $ 214,163 $ 103,017 $ 1,949,438 $ 3,554,405 The notes to the financial statements are an integral part of this statement
61 Reconciliation of the Statement of Revenues, Expenditures, and Changes in Fund Balances of Governmental Funds to the Statement of Activities For the Fiscal Year Ended June 30, 2008 (amounts expressed in thousands) Net Change in Fund Balances - Total Governmental Funds $ (400,065) Amounts reported for Governmental Activities in the Statement of Activities are different because: Governmental funds report capital outlays as expenditures. However, in the statement of activities, the cost of those assets is allocated over their estimated useful lives and reported as depreciation expense. This is the amount by which capital outlays exceeded depreciation in the current period. Revenues in the statement of activities that do not provide current financial resources are not reported as revenues. The issuance of long-term debt (e.g. bonds) provides current financial resources to the governmental funds, while the repayment of the principal of long-term debt consumes the current financial resources of governmental funds. Neither transaction, however, has any effect on net assets. Also, governmental funds report the effect of issuance costs, premiums, discounts, and similar items when debt is first issued, whereas, these amounts are deferred and amortized in the statement of activities. This amount is the net effect of these differences in the treatment of long-term debt and related items. 674, ,003 (30,966) Some expenses reported in the statement of activities do not require the use of current financial resources and, therefore, are not reported as expenditures in the governmental funds. (296,048) Increase in reserve for inventory 101 Change in Net Assets of Governmental Activities $ 128,185 The notes to the financial statements are an integral part of this statement
62 Statement of Revenues, Expenditures, and Changes in Fund Balances Budget and Actual (Non-GAAP Budgetary Basis) General Fund For the Fiscal Year Ended June 30, 2008 (amounts expressed in thousands) Actual Variance With Amounts Final Budget Budgeted Amounts (Budgetary Positive Original Final Basis) (Negative) REVENUES Taxes $ 3,294,538 $ 3,294,538 $ 3,242,408 $ (52,130) Licenses, Permits, Fees and Fines 746, , ,153 (4,566) Intergovernmental 43,800 43,800 37,955 (5,845) Interest 49,990 49,990 57,736 7,746 Other 11,872 11,872 12, TOTAL REVENUES 4,146,919 4,146,919 4,092,830 (54,089) EXPENDITURES Current General Government 1,394,835 1,437,203 1,348,621 88,582 Protection of Persons and Property 1,872,398 1,936,263 1,918,714 17,549 Public Works 312, , ,786 24,094 Health and Sanitation 251, , ,525 6,378 Transportation 140, , ,564 10,389 Cultural and Recreational Services 73,064 75,373 73,520 1,853 Community Development 106, , ,353 8,644 Pension and Retirement Contributions 15,384 15,384 15, Capital Outlay 1,065 35,623 14,430 21,193 TOTAL EXPENDITURES 4,168,088 4,400,579 4,221, ,707 EXCESS (DEFICIENCY) OF REVENUES OVER EXPENDITURES (21,169) (253,660) (129,042) 124,618 OTHER FINANCING SOURCES (USES) Transfers from Other Funds 1,080,112 1,336,393 1,216,672 (119,721) Loans from Other Funds ,440 16,909 Transfers to Other Funds (1,084,115) (1,108,436) (1,108,433) 3 Payment of Loans to Other Funds (18,908) (18,908) TOTAL OTHER FINANCING SOURCES (USES) (4,003) 228, ,771 (121,717) EXCESS (DEFICIENCY) OF REVENUES AND OTHER FINANCING SOURCES OVER EXPENDITURES AND OTHER FINANCING USES (25,172) (25,172) (22,271) 2,901 FUND BALANCES, JULY 1 25,172 25,172 24,777 (395) Encumbrances Lapsed ,435 37,435 Reversion to Reserve Fund (39,434) (39,434) FUND BALANCES, JUNE 30 $ -- $ -- $ 507 $ 507 The notes to the financial statements are an integral part of this statement
63 Statement of Revenues, Expenditures, and Changes in Fund Balances Budget and Actual (Non-GAAP Budgetary Basis) Building and Safety Permit Fund For the Fiscal Year Ended June 30, 2008 (amounts expressed in thousands) Actual Variance With Amounts Final Budget Budgeted Amounts (Budgetary Positive Original Final Basis) (Negative) REVENUES Charges for Services $ 118,000 $ 118,000 $ 108,685 $ (9,315) Interest 2,000 2,000 3,962 1,962 Other TOTAL REVENUES 120, , ,670 (7,330) EXPENDITURES Current Protection of Persons and Property 110, ,012 43,374 94,638 EXCESS (DEFICIENCY) OF REVENUES OVER EXPENDITURES 9,323 (18,012) 69,296 87,308 OTHER FINANCING SOURCES (USES) Transfers from Other Funds Transfers to Other Funds (70,750) (84,131) (72,200) 11,931 TOTAL OTHER FINANCING SOURCES (USES) (70,750) (84,131) (72,075) 12,056 EXCESS (DEFICIENCY) OF REVENUES AND OTHER FINANCING SOURCES OVER EXPENDITURES AND OTHER FINANCING USES (61,427) (102,143) (2,779) 99,364 FUND BALANCES, JULY 1 61,427 61,427 69,053 7,626 Appropriation of Fund Balance and Carryforward Appropriations -- 40, (40,716) Encumbrances Lapsed ,269 2,269 FUND BALANCES, JUNE 30 $ -- $ -- $ 68,543 $ 68,543 The notes to the financial statements are an integral part of this statement
64 Statement of Revenues, Expenditures, and Changes in Fund Balances (Deficit) Budget and Actual (Non-GAAP Budgetary Basis) Community Development Fund For the Fiscal Year Ended June 30, 2008 (amounts expressed in thousands) Actual Variance With Amounts Final Budget Budgeted Amounts (Budgetary Positive Original Final Basis) (Negative) REVENUES Intergovernmental $ 32,522 $ 95,551 $ 137,768 $ 42,217 Charges for Services Interest Program Income ,874 16,874 Other ,261 1,249 TOTAL REVENUES 32,522 95, ,965 60,402 EXPENDITURES Current Community Development 7, , ,203 58,249 EXCESS (DEFICIENCY) OF REVENUES OVER EXPENDITURES 24,559 (78,889) 39, ,651 OTHER FINANCING SOURCES (USES) Transfers from Other Funds ,784 3,784 Transfers to Other Funds (24,559) (43,876) (35,952) 7,924 TOTAL OTHER FINANCING SOURCES (USES) (24,559) (43,876) (32,168) 11,708 EXCESS (DEFICIENCY) OF REVENUES AND OTHER FINANCING SOURCES OVER EXPENDITURES AND OTHER FINANCING USES -- (122,765) 7, ,359 FUND BALANCES (DEFICIT), JULY (42,461) (42,461) Appropriation of Fund Balance and Carryforward Appropriations , (122,765) Encumbrances Lapsed ,928 14,928 FUND BALANCES (DEFICIT), JUNE 30 $ -- $ -- $ (19,939) $ (19,939) The notes to the financial statements are an integral part of this statement
65 Statement of Revenues, Expenditures, and Changes in Fund Balances Budget and Actual (Non-GAAP Budgetary Basis) Proposition A Local Transit Assistance Fund For the Fiscal Year Ended June 30, 2008 (amounts expressed in thousands) Actual Variance With Amounts Final Budget Budgeted Amounts (Budgetary Positive Original Final Basis) (Negative) REVENUES Intergovernmental $ 89,682 $ 89,682 $ 90,998 $ 1,316 Charges for Services 9,564 14,573 11,781 (2,792) Interest 3,300 3,300 5,854 2,554 Other 2,268 2,268 1,184 (1,084) TOTAL REVENUES 104, , ,817 (6) EXPENDITURES Current Transportation 146, ,405 87, ,223 EXCESS (DEFICIENCY) OF REVENUES OVER EXPENDITURES (41,246) (206,582) 22, ,217 OTHER FINANCING SOURCES (USES) Transfers from Other Funds Transfers to Other Funds (10,330) (14,763) (485) (14,278) TOTAL OTHER FINANCING SOURCES (USES) (10,330) (14,743) (465) (14,278) EXCESS (DEFICIENCY) OF REVENUES AND OTHER FINANCING SOURCES OVER EXPENDITURES AND OTHER FINANCING USES (51,576) (221,325) 22, ,495 FUND BALANCES, JULY 1 51,576 51,576 83,315 31,739 Appropriation of Fund Balance and Carryforward Appropriations , (169,749) Encumbrances Lapsed ,769 4,769 FUND BALANCES, JUNE 30 $ -- $ -- $ 110,254 $ 110,254 The notes to the financial statements are an integral part of this statement
66 Statement of Revenues, Expenditures, and Changes in Fund Balances Budget and Actual (Non-GAAP Budgetary Basis) Solid Waste Resources Fund For the Fiscal Year Ended June 30, 2008 (amounts expressed in thousands) Actual Variance With Amounts Final Budget Budgeted Amounts (Budgetary Positive Original Final Basis) (Negative) REVENUES Charges for Services $ 190,668 $ 190,668 $ 192,548 $ 1,880 Interest 2,312 2,312 6,647 4,335 Other TOTAL REVENUES 193, , ,882 6,626 EXPENDITURES Current Health and Sanitation 20,292 27,311 26, Debt Service Principal 23,612 23,612 23, Interest 17,388 21,044 15,517 5,527 TOTAL EXPENDITURES 61,292 71,967 65,869 6,098 EXCESS OF REVENUES OVER EXPENDITURES 131, , ,013 12,724 OTHER FINANCING USES Transfers from Other Funds -- 5,610 5, Transfers to Other Funds (146,848) (148,822) (148,197) (625) TOTAL OTHER FINANCING SOURCES (USES) (146,848) (143,212) (142,528) 684 EXCESS (DEFICIENCY) OF REVENUES OVER EXPENDITURES AND OTHER FINANCING USES (14,884) (21,923) (8,515) 13,408 FUND BALANCES, JULY 1 14,884 14,884 14,338 (546) Appropriation of Fund Balance and Carryforward Appropriations -- 7, (7,039) Encumbrances Lapsed FUND BALANCES, JUNE 30 $ -- $ -- $ 5,901 $ 5,901 The notes to the financial statements are an integral part of this statement
67 Statement of Fund Net Assets Proprietary Funds June 30, 2008 (amounts expressed in thousands) ASSETS Business-type Activities - Enterprise Funds Airports Harbor Power Water CURRENT ASSETS Cash, Pooled and Other Investments Unrestricted $ 468,833 $ 488,893 $ 513,823 $ 105,318 Restricted , , ,231 Investments Held by Escrow and Fiscal Agents 101, , Notes Receivable (Net of Allowance for Uncollectibles of $22) , Accounts Receivable Accounts Receivable (Net of Allowance for Uncollectibles of $31,605) 15,717 38, ,531 69,207 Accrued Unbilled Revenue 21, ,585 61,673 Investment Income Receivable 4,594 5,148 14,072 3,244 Intergovernmental Receivable -- 8,340 40,635 6,706 Due from Other Funds -- 4, ,450 Inventories 2,046 2, ,847 14,947 Prepaid Items and Other Assets 3,185 3, ,113 23,733 TOTAL CURRENT ASSETS 618, ,134 2,007, ,509 NONCURRENT ASSETS Restricted Assets Pooled and Other Investments 888,698 7, Investments Held by Escrow and Fiscal Agents 34,489 2, ,346 36,569 Investment Income Receivable 4, Passenger Facility Charge Receivable 18, Total Restricted Assets 945,997 9, ,346 36,569 Long-term Investment Investment in Joint Ventures -- 12, Capital Assets Land 751,992 1,012, , ,344 Buildings, Facilities and Equipment 2,197,803 2,425,235 10,024,329 4,803,497 Leased Property and Improvements 184, Accumulated Depreciation (1,251,877) (1,058,157) (5,119,238) (1,722,486) Construction in Progress 948, , , ,620 Natural Gas Field, Net , Nuclear Fuel, at Amortized Cost , Total Capital Assets 2,830,640 2,758,500 6,211,830 3,825,975 Other Noncurrent Assets Loans Receivable - Notes ,107, Advances to Other Funds -- 32, Net Pension Assets ,479 45,831 Net Other Postemployment Benefits Assets , ,752 Other Assets 3,351 8, , Total Other Noncurrent Assets 3,351 41,614 1,842, ,583 TOTAL NONCURRENT ASSETS 3,779,988 2,821,984 8,777,960 4,083,127 TOTAL ASSETS $ 4,398,140 $ 3,531,118 $ 10,785,519 $ 4,638,636 Continued
68 ASSETS CITY OF LOS ANGELES Statement of Fund Net Assets - (Continued) Proprietary Funds June 30, 2008 (amounts expressed in thousands) Business-type Activities - Enterprise Funds Other- Convention Sewer Center Total CURRENT ASSETS Cash, Pooled and Other Investments Unrestricted $ 153,334 $ 3,178 $ 1,733,379 Restricted 61, ,981 Investments Held by Escrow and Fiscal Agents ,189 Notes Receivable (Net of Allowance for Uncollectibles of $22) ,084 Accounts Receivable Accounts Receivable (Net of Allowance for Uncollectibles of $31,605) 50,417 2, ,369 Accrued Unbilled Revenue 33, ,973 Investment Income Receivable 1, ,369 Intergovernmental Receivable 47, ,681 Due from Other Funds ,543 Inventories 11, ,001 Prepaid Items and Other Assets -- 2, ,774 TOTAL CURRENT ASSETS 359,079 7,910 4,257,343 NONCURRENT ASSETS Restricted Assets Pooled and Other Investments 89, ,559 Investments Held by Escrow and Fiscal Agents 19, ,177 Investment Income Receivable ,503 Passenger Facility Charge Receivable ,368 Total Restricted Assets 109, ,824,607 Long-term Investment Investment in Joint Ventures ,255 Capital Assets Land 43, ,592 2,211,756 Buildings, Facilities and Equipment 5,748, ,714 25,794,866 Leased Property and Improvements -- 9, ,359 Accumulated Depreciation (2,347,545) (197,747) (11,697,050) Construction in Progress 271, ,124,325 Natural Gas Field, Net ,824 Nuclear Fuel, at Amortized Cost ,982 Total Capital Assets 3,715, ,495 19,890,062 Other Noncurrent Assets Loans Receivable - Notes ,108,147 Advances to Other Funds 2, ,030 Net Pension Assets ,310 Net Other Postemployment Benefits Assets ,214 Other Assets 12, ,963 Total Other Noncurrent Assets 15, ,123,664 TOTAL NONCURRENT ASSETS 3,840, ,495 23,850,588 TOTAL ASSETS $ 4,199,113 $ 555,405 $ 28,107,931 Continued
69 Statement of Fund Net Assets - (Continued) Proprietary Funds June 30, 2008 (amounts expressed in thousands) LIABILITIES Business-type Activities - Enterprise Funds Airports Harbor Power Water CURRENT LIABILITIES Accounts, Contracts and Retainage Payable $ 121,559 $ 62,613 $ 411,006 $ 77,499 Obligations Under Securities Lending Transactions 183,701 73, ,703 18,782 Accrued Salaries and Overtime Payable 6,504 1,969 23,665 9,464 Accrued Compensated Absences Payable 3,087 7,842 50,425 24,157 Due to Other Funds ,450 63,356 Deferred Revenue and Other Credits 50 1, ,528 Deposits and Advances ,635 Capital Lease Obligations - Current Portion 1, Interest Payable 1,883 16,251 90,682 42,433 Bonds and Notes Payable - Current Portion 16,135 23, ,455 59,849 Advances from Other Funds Other Current Liabilities 9,324 82, TOTAL CURRENT LIABILITIES 343, ,706 1,009, ,703 LONG-TERM LIABILITIES Capital Lease Obligations - Noncurrent Portion 49, Bonds and Notes Payable - Noncurrent Portion (Net of Unamortized Debt Related Costs of $768) 609, ,097 4,801,728 2,097,721 Net Pension Liability 9,459 2, Other Long-term Liabilities 155,263 23, ,865 14,684 TOTAL LONG-TERM LIABILITIES 824, ,369 5,368,593 2,112,405 TOTAL LIABILITIES 1,167,598 1,054,075 6,377,979 2,500,108 NET ASSETS Invested in Capital Assets, Net of Related Debt 2,259,002 1,985,653 1,489,096 1,830,980 Restricted for: Capital Projects , Debt Service 33, ,283 26,991 Passenger Facility Charges 503, Pension and Other Postemployment Benefits , ,583 Other Purposes 217, ,604 20,167 Unrestricted 216, ,381 1,612,382 39,807 TOTAL NET ASSETS $ 3,230,542 $ 2,477,043 $ 4,407,540 $ 2,138,528 Continued
70 LIABILITIES CITY OF LOS ANGELES Statement of Fund Net Assets - (Continued) Proprietary Funds June 30, 2008 (amounts expressed in thousands) Business-type Activities - Enterprise Funds Other- Convention Sewer Center Total CURRENT LIABILITIES Accounts, Contracts and Retainage Payable $ 54,150 $ 1,860 $ 728,687 Obligations Under Securities Lending Transactions ,878 Accrued Salaries and Overtime Payable ,823 Accrued Compensated Absences Payable -- 1,964 87,475 Due to Other Funds 5, ,472 Deferred Revenue and Other Credits -- 2,266 19,709 Deposits and Advances ,635 Capital Lease Obligations - Current Portion ,197 Interest Payable 11, ,657 Bonds and Notes Payable - Current Portion 61, ,138 Advances from Other Funds Other Current Liabilities 38, ,388 TOTAL CURRENT LIABILITIES 170,634 7,199 2,189,068 LONG-TERM LIABILITIES Capital Lease Obligations - Noncurrent Portion ,518 Bonds and Notes Payable - Noncurrent Portion (Net of Unamortized Debt Related Costs of $768) 2,407, ,674,698 Net Pension Liability ,630 Other Long-term Liabilities 42, ,113 TOTAL LONG-TERM LIABILITIES 2,449, ,537,959 TOTAL LIABILITIES 2,620,068 7,199 13,727,027 NET ASSETS Invested in Capital Assets, Net of Related Debt 1,260, ,495 9,372,493 Restricted for: Capital Projects 4, ,428 Debt Service 104, ,318 Passenger Facility Charges ,948 Pension and Other Postemployment Benefits ,524 Special Purposes 41, ,277 Unrestricted 167, ,527,916 TOTAL NET ASSETS $ 1,579,045 $ 548,206 $ 14,380,904 The notes to the financial statements are an integral part of this statement
71 Statement of Revenues, Expenses, and Changes in Fund Net Assets Proprietary Funds For the Fiscal Year Ended June 30, 2008 (amounts expressed in thousands) Business-type Activities - Enterprise Funds Airports Harbor Power Water OPERATING REVENUES Charges for Services $ 216,334 $ 374,878 $ 2,781,324 $ 744,036 Rent, Concessions and Royalties 555,492 45, Other Operating Revenues 2,462 5, TOTAL OPERATING REVENUES 774, ,345 2,781, ,036 OPERATING EXPENSES Fuel for Generation , Purchased Power/Water , ,750 Maintenance and Repairs , ,063 Operating and Administrative 627, , , ,844 Depreciation and Amortization 105,762 78, ,541 76,329 TOTAL OPERATING EXPENSES 732, ,047 2,457, ,986 OPERATING INCOME (LOSS) 41, , , ,050 NONOPERATING REVENUES (EXPENSES) Investment Income 54,704 31, ,218 26,272 Increase in Fair Value of Investments 24,123 7,633 6, Interest Expense (22,474) (38,052) (195,574) (99,042) Other Income (Expenses), Net 129,998 (2,536) 16, TOTAL NONOPERATING REVENUES (EXPENSES) 186,351 (1,285) (19,668) (71,469) INCOME (LOSS) BEFORE CAPITAL CONTRIBUTIONS AND TRANSFERS 227, , ,059 72,581 Capital Contributions 125,292 14,161 17,601 25,615 Transfers In Transfers Out (182,004) (33,425) CHANGE IN NET ASSETS 353, , ,656 64,771 NET ASSETS, JULY 1 2,877,446 2,337,869 4,267,884 2,073,757 NET ASSETS, JUNE 30 $ 3,230,542 $ 2,477,043 $ 4,407,540 $ 2,138,528 Continued
72 Statement of Revenues, Expenses, and Changes in Fund Net Assets (Continued) Proprietary Funds For the Fiscal Year Ended June 30, 2008 (amounts expressed in thousands) Business-type Activities - Enterprise Funds Other- Convention Sewer Center Total OPERATING REVENUES Charges for Services $ 522,503 $ 7,055 $ 4,646,130 Rent, Concessions and Royalties -- 10, ,206 Other Operating Revenues 4,183 8,843 21,431 TOTAL OPERATING REVENUES 526,686 26,088 5,278,767 OPERATING EXPENSES Fuel for Generation ,814 Purchased Power/Water ,950 Maintenance and Repairs -- 2, ,398 Operating and Administrative 276,508 24,292 1,973,680 Depreciation and Amortization 156,598 11, ,453 TOTAL OPERATING EXPENSES 433,106 38,724 4,562,295 OPERATING INCOME (LOSS) 93,580 (12,636) 716,472 NONOPERATING REVENUES (EXPENSES) Investment Income 16, ,260 Increase in Fair Value of Investments ,205 Interest Expense (111,051) -- (466,193) Other Income (Expenses), Net 200 (29) 144,582 TOTAL NONOPERATING REVENUES (EXPENSES) (94,120) 45 (146) INCOME (LOSS) BEFORE CAPITAL CONTRIBUTIONS AND TRANSFERS (540) (12,591) 716,326 Capital Contributions 18, ,299 Transfers In Transfers Out (215,429) CHANGE IN NET ASSETS 18,090 (12,569) 702,218 NET ASSETS, JULY 1 1,560, ,775 13,678,686 NET ASSETS, JUNE 30 $ 1,579,045 $ 548,206 $ 14,380,904 The notes to the financial statements are an integral part of this statement
73 Statement of Cash Flows Proprietary Funds For the Fiscal Year Ended June 30, 2008 (amounts expressed in thousands) Business-type Activities - Enterprise Funds Airports Harbor Power Water CASH FLOWS FROM OPERATING ACTIVITIES Receipts from Customers and Users $ 791,448 $ 440,393 $ 2,588,207 $ 728,696 Receipts for Interfund Services , ,110 Payments to Suppliers (210,076) (54,460) (1,622,551) (290,576) Payments to Employees (326,721) (97,592) (464,543) (235,207) Payments for Interfund Services (56,101) (35,443) (448,367) (347,309) NET CASH PROVIDED BY (USED FOR) OPERATING ACTIVITIES 198, , , ,714 CASH FLOWS FROM NONCAPITAL FINANCING ACTIVITIES Transfers In Transfers Out (182,004) -- Amounts Transferred to Retiree Health Benefits Plan (68,000) (32,000) Amounts Received on Advances to Other Funds -- 3, Interest Paid on Noncapital Revenue Bonds (14,182) -- Noncapital Grants Received -- 1, NET CASH PROVIDED BY (USED FOR) NONCAPITAL FINANCING ACTIVITIES -- 5,952 (264,186) (32,000) CASH FLOWS FROM CAPITAL AND RELATED FINANCING ACTIVITIES Acquisition and Construction of Capital Assets (557,147) (124,552) (568,469) (229,141) Receipts from Passenger Facility Charges 130, Proceeds from Sale of Bonds and Notes 151, ,136 34,829 Payments on Capital Leases - Interest (1,754) Payments on Capital Leases - Principal (1,140) Payments on Bonds and Notes - Interest (23,245) (38,849) (184,326) (91,647) Payments on Bonds and Notes - Principal (15,149) (22,501) (43,033) (76,286) Deposits to Refunded Debt Escrow Account Capital Contributions/Grants Received 125,390 7,353 24,425 21,848 NET CASH USED FOR CAPITAL AND RELATED FINANCING ACTIVITIES (191,053) (178,549) (97,267) (340,397) CASH FLOWS FROM INVESTING ACTIVITIES Investment Income Received 59,637 25, ,273 25,987 Increase in Fair Value of Investments 24,123 7,633 6, Cash Collateral Received (Paid) Under Securities Lending Transactions (18,134) 4,440 1,757 (16,990) Purchase of Investment Securities (1,299,739) (186,902) Proceeds from Maturities of Investment Securities ,245, ,570 Proceeds from Notes Receivable , NET CASH PROVIDED BY (USED FOR ) INVESTING ACTIVITIES 65,626 38, ,287 (6,411) Continued
74 Statement of Cash Flows - (Continued) Proprietary Funds For the Fiscal Year Ended June 30, 2008 (amounts expressed in thousands) Business-type Activities - Enterprise Funds Other- Convention Sewer Center Total CASH FLOWS FROM OPERATING ACTIVITIES Receipts from Customers and Users $ 512,010 $ 26,394 $ 5,087,148 Receipts for Interfund Services 1, ,432 Payments to Suppliers (90,999) (5,189) (2,273,851) Payments to Employees -- (16,209) (1,140,272) Payments for Interfund Services (174,861) (5,881) (1,067,962) NET CASH PROVIDED BY (USED FOR) OPERATING ACTIVITIES 248,030 (885) 1,332,495 CASH FLOWS FROM NONCAPITAL FINANCING ACTIVITIES Transfers In Transfers Out (182,004) Amounts Transferred to Retiree Health Benefits Plan (100,000) Amounts Received on Advances to Other Funds 3, ,220 Interest Paid on Noncapital Revenue Bonds (14,182) Noncapital Grants Received 2, ,912 NET CASH PROVIDED BY (USED FOR) NONCAPITAL FINANCING ACTIVITIES 6, (284,032) CASH FLOWS FROM CAPITAL AND RELATED FINANCING ACTIVITIES Acquisition and Construction of Capital Assets (219,260) (758) (1,699,327) Receipts from Passenger Facility Charges ,621 Proceeds from Sale of Bonds and Notes 68, ,635 Payments on Capital Leases - Interest (1,754) Payments on Capital Leases - Principal (1,140) Payments on Bonds and Notes - Interest (111,303) -- (449,370) Payments on Bonds and Notes - Principal (58,837) -- (215,806) Deposits to Refunded Debt Escrow Account (1,412) -- (1,412) Capital Contributions/Grants Received 18, ,428 NET CASH USED FOR CAPITAL AND RELATED FINANCING ACTIVITIES (304,101) (758) (1,112,125) CASH FLOWS FROM INVESTING ACTIVITIES Investment Income Received 19, ,431 Increase in Fair Value of Investments ,205 Cash Collateral Received (Paid) Under Securities Lending Transactions (28,927) Purchase of Investment Securities (1,486,641) Proceeds from Maturities of Investment Securities ,415,672 Proceeds from Notes Receivable ,847 NET CASH PROVIDED BY (USED FOR ) INVESTING ACTIVITIES 19, ,587 Continued
75 Statement of Cash Flows - (Continued) Proprietary Funds For the Fiscal Year Ended June 30, 2008 (amounts expressed in thousands) Business-type Activities - Enterprise Funds Airports Harbor Power Water NET INCREASE (DECREASE) IN CASH AND CASH EQUIVALENTS $ 73,123 $ 118,436 $ 240,022 $ (214,094) CASH AND CASH EQUIVALENTS, JULY 1 1,386, , , ,643 CASH AND CASH EQUIVALENTS, JUNE 30 $ 1,459,311 $ 647,662 $ 1,123,744 $ 357,549 CASH AND CASH EQUIVALENTS COMPONENTS: Unrestricted Cash, Pooled and Other Investments $ 468,833 $ 488,893 $ 513,823 $ 105,318 Restricted Cash, Pooled and Other Investments 888, , , ,231 Investments Held by Escrow and Fiscal Agents 101, , TOTAL CASH AND CASH EQUIVALENTS, JUNE 30 $ 1,459,311 $ 647,662 $ 1,123,744 $ 357,549 RECONCILIATION OF OPERATING INCOME (LOSS) TO NET CASH PROVIDED BY (USED FOR) OPERATING ACTIVITIES Operating Income (Loss) $ 41,453 $ 126,298 $ 323,727 $ 144,050 Adjustments to Reconcile Operating Income (Loss) to Net Cash Provided by Operating Activities: Depreciation and Amortization 105,762 78, ,541 76,329 Depletion , Bad Debts Provision (Recovery) (857) -- 12,653 3,155 Cash Provided By Other Nonoperating Income 468 5,169 22,035 5,878 Cash Used in Other Nonoperating Expenses (5,463) (5,501) Decrease (Increase) in Assets: Accounts Receivable Accounts Receivable 4,390 8,878 (58,267) (13,678) Accrued Unbilled Revenue 11, (6,250) (4,273) Due from Other Funds (14,605) Inventories -- (338) (16,497) 6,146 Prepaid Items and Other Current Assets (1,278) (2,333) (181,968) (55) Other Assets ,412 (14,750) Increase (Decrease) in Liabilities: Accounts, Contracts and Retainage Payable 16,574 23, ,170 (1,597) Accrued Salaries and Overtime Payable 1, (14,812) (7,354) Accrued Compensated Absences Payable 16,390 (2,151) 3, Due to Other Funds , Deferred Revenue and Other Credits (50) 21,120 3, Deposits and Advances (3,399) Other Liabilities 3,145 (5,253) (210,530) (6,227) TOTAL ADJUSTMENTS 157, , ,461 20,664 NET CASH PROVIDED BY (USED FOR) OPERATING ACTIVITIES $ 198,550 $ 252,898 $ 469,188 $ 164,714 NONCASH CAPITAL AND RELATED FINANCING ACTIVITIES Net proceeds of refunding bonds and notes deposited in an irrevocable trust account $ -- $ -- $ -- $ -- Acquisition of capital assets included in accounts and contracts payable 51,949 7, Continued
76 Statement of Cash Flows - (Continued) Proprietary Funds For the Fiscal Year Ended June 30, 2008 (amounts expressed in thousands) Business-type Activities - Enterprise Funds Other- Convention Sewer Center Total NET INCREASE (DECREASE) IN CASH AND CASH EQUIVALENTS $ (29,997) $ (1,565) $ 185,925 CASH AND CASH EQUIVALENTS, JULY 1 334,531 4,743 3,710,053 CASH AND CASH EQUIVALENTS, JUNE 30 $ 304,534 $ 3,178 $ 3,895,978 CASH AND CASH EQUIVALENTS COMPONENTS: Unrestricted Cash, Pooled and Other Investments $ 153,334 $ 3,178 $ 1,733,379 Restricted Cash and Other Investments 151, ,945,410 Investments Held by Escrow and Fiscal Agents ,189 TOTAL CASH AND CASH EQUIVALENTS, JUNE 30 $ 304,534 $ 3,178 $ 3,895,978 RECONCILIATION OF OPERATING INCOME (LOSS) TO NET CASH PROVIDED BY (USED FOR) OPERATING ACTIVITIES Operating Income (Loss) $ 93,580 $ (12,636) $ 716,472 Adjustments to Reconcile Operating Income (Loss) to Net Cash Provided by Operating Activities: Depreciation and Amortization 156,598 11, ,453 Depletion ,079 Bad Debts Provision (Recovery) 1, ,214 Cash Provided By Other Nonoperating Income ,550 Cash Used in Other Nonoperating Expenses (8,333) (29) (19,326) Decrease (Increase) in Assets: Accounts Receivable Accounts Receivable (11,070) 594 (69,153) Accrued Unbilled Revenue Due from Other Funds (10) -- (14,615) Inventories (411) -- (11,100) Prepaid Items -- (315) (185,949) Other Assets ,662 Increase (Decrease) in Liabilities: Accounts, Contracts and Retainage Payable 10, ,097 Accrued Salaries and Overtime Payable (20,862) Accrued Compensated Absences Payable ,848 Due to Other Funds 5,878 (437) 20,046 Deferred Revenue and Other Credits -- (288) 24,541 Deposits and Advances (3,399) Other Liabilities -- (16) (218,881) TOTAL ADJUSTMENTS 154,450 11, ,023 NET CASH PROVIDED BY (USED FOR) OPERATING ACTIVITIES $ 248,030 $ (885) $ 1,332,495 NONCASH CAPITAL AND RELATED FINANCING ACTIVITIES Net proceeds of refunding bonds and notes deposited in an irrevocable trust account $ 603,408 $ -- $ 603,408 Acquisition of capital assets included in accounts and contracts payable ,413 The notes to the financial statements are an integral part of this statement
77 Statement of Fiduciary Net Assets Fiduciary Funds June 30, 2008 (amounts expressed in thousands) Pension and Other Employee Benefits Agency Trust Funds Funds ASSETS Cash and Pooled Investments $ 2,870 $ 352,803 Investments: Temporary 1,605,117 2,035 U.S. Government Agencies Securities 2,302, Domestic Corporate Bonds 3,556, International Bonds 226, Opportunistic Debt 103, Domestic Stocks 12,817, International Stocks 6,415, Mortgage-backed Securities 2,381, Real Estate 2,047, Venture Capital and Alternative Investments 2,051, Security Lending Collateral 5,134, Accounts Receivable 46, Special Assessments Receivable -- 2,377 Investment Income Receivable 111, Intergovernmental Receivable Due from Brokers 1,109, Advances to Other Funds -- 15,414 Capital Assets (Net of Accumulated Depreciation of $301) TOTAL ASSETS 39,912,589 $ 373,025 LIABILITIES Accounts, Contracts and Retainage Payable 81,015 $ -- Fiduciary Liabilities ,707 Obligations Under Securities Lending Transactions 5,134,045 5,448 Advances from Other Funds Deposits and Advances ,870 Loans Payable - Current Portion 40, Loans Payable - Noncurrent Portion 262, Due to Brokers 1,958, TOTAL LIABILITIES 7,476,959 $ 373,025 NET ASSETS Net Assets Held in Trust for Pension and Other Employee Benefits Benefit Pension Plans 29,626,545 Disability Plan 39,636 Death Benefit Plan 22,095 Postemployment Healthcare Plans 2,747,354 TOTAL NET ASSETS $ 32,435,630 The notes to the financial statements are an integral part of this statement
78 Statement of Changes in Fiduciary Net Assets Fiduciary Funds For the Fiscal Year Ended June 30, 2008 (amounts expressed in thousands) Pension and Other Employee Benefits Trust Funds ADDITIONS Contributions Employer $ 1,067,828 Plan Member 262,175 Other 2,840 Total Contributions 1,332,843 Investment Income Net Depreciation in Fair Value of Investments (2,626,119) Interest Income 478,610 Dividend Income 368,579 Securities Lending Income 58,496 Other Investment Income 19,756 Real Estate Operating Income, Net 69,601 Investment Loss (1,631,077) Investment Expense (101,955) Securities Lending Expense (31,056) Net Investment Loss (1,764,088) Return of Excess Reserve 11,000 TOTAL ADDITIONS (420,245) DEDUCTIONS Benefit Payments 1,811,139 Refunds of Member Contributions 24,150 Administrative Expenses 31,381 TOTAL DEDUCTIONS 1,866,670 CHANGE IN NET ASSETS Benefit Pension Plans (2,280,982) Disability Plan 4,111 Death Benefit Plan (2,570) Postemployment Healthcare Plans (7,474) TOTAL CHANGE IN NET ASSETS (2,286,915) Net Assets Held in Trust for Pension and Other Employee Benefits, July 1 Benefit Pension Plans 31,907,527 Disability Plan 35,525 Death Benefit Plan 24,665 Postemployment Healthcare Plans 2,754,828 NET ASSETS HELD IN TRUST FOR PENSION AND OTHER EMPLOYEE BENEFITS, JUNE 30 $ 32,435,630 The notes to the financial statements are an integral part of this statement
79 Notes to the Basic Financial Statements The Notes to the Basic Financial Statements include disclosures considered necessary for a better understanding of the accompanying financial statements. An index to the Notes follows: Page Note 1 - Summary of Significant Accounting Policies A. General 57 B. Reporting Entity 57 C. Government-wide and Fund Financial Statements 60 D. Measurement Focus, Basis of Accounting, and Financial Statement Presentation 60 E. Assets, Liabilities and Net Assets or Equity 63 Note 2 - Reconciliation of Government-wide and Fund Financial Statements A. Explanation of Certain Difference Between the Governmental Funds Balance Sheet and the Government-wide Statement of Net Assets 71 B. Explanation of Certain Differences Between the Governmental Funds Statement of Revenues, Expenditures, and Changes in Fund Balances and the Government-wide Statement of Activities 71 Note 3 - Stewardship, Compliance, and Accountability A. Budgets and Budgetary Basis of Accounting 73 B. Reconciliation of Operations on Budgetary Basis to the GAAP Basis 75 C. Fund Balances - Reserves, Designations and Deficit 77 Note 4 - Detailed Notes on All Funds A. Cash, Deposits and Investments 78 B. Receivables 100 C. Loans Receivable from Component Unit 101 D. Restricted Assets 102 E. Joint Ventures 103 F. Capital Assets 104 G. Interfund Receivables, Payables and Transfers 108 H. Accounts Payable and Accrued Expenses 111 I. Long-term Liabilities 111 J. Current and Advance Refunding of Debt K. Prior Years Defeasance of Debt 130 L. Tax and Revenue Anticipation Notes 131 M. Interest Rate Swaps 131 N. Leases 135 O. Risk Management - Estimated Claims and Judgments Payable 139 P. Accrued Landfill Liability 140 Q. Power Enterprise Fund Derivative Instruments 141 R. Community Redevelopment Agency Derivative Instrument 143 Note 5 - Other Information A. Pension and Other Postemployment Benefit Plans 144 B. Commitments and Contingencies 155 C. Third-Party Obligations 170 D. Other Matters 171 E. Subsequent Events
80 NOTES TO THE BASIC FINANCIAL STATEMENTS Fiscal Year Ended June 30, 2008 NOTE 1 SUMMARY OF SIGNIFICANT ACCOUNTING POLICIES A. General The City of Los Angeles (City) was incorporated in 1850 under the provisions of a City Charter. The current Charter was approved by the electorate on June 8, 1999 and became operative on July 1, The City operates under a Mayor-Council form of government. As Executive Officer, the Mayor supervises the administrative process of the City and works with the Council in matters relating to legislation, budget, and finance. As governing body of the City, the 15-member full-time Council enacts ordinances, levies taxes, approves utility rates, authorizes contracts and public improvements, adopts zoning and other land use controls, and provides the necessary resources for the budgetary departments and offices of the City. Council action is subject to the approval or veto of the Mayor and Council may override a Mayoral veto by a two-thirds vote. The Charter provides for an independently elected City Attorney and independently elected City Controller. Public services provided by the City include: police; fire and paramedics; residential refuse collection and disposal, wastewater collection and treatment, street maintenance, and other public works functions; enforcement of ordinances and statutes relating to building safety; public libraries; recreation and parks; community development; housing and aging services; planning; airports; harbor; power and water services; and convention center. B. Reporting Entity For financial reporting purposes, the City (the primary government) consists of the funds, departments, agencies, boards, and commissions for which the City is financially accountable. Criteria indicating financial accountability include, but are not limited to, the following: Appointment by the City of a majority of voting members of the governing body of an organization, and ability of the City to impose its will on the daily operations of an organization, such as power to remove appointed members at will; to modify or approve budgets, rates or fees; or to make other substantive decisions; or provision by the organization of specific financial benefits to the City; or imposition by an organization of specific financial burdens on the City, such as assumption of deficits or provision of support, or Fiscal dependency by the organization on the City such as lack of authority to determine a budget, approve rates or issue its own bonded debt without City approval. Blended Component Units Although the following are legally separate from the City, they are reported as if they are part of the City because their sole purpose is to provide services entirely to or exclusively for the City or the City Council is the governing body
81 NOTES TO THE BASIC FINANCIAL STATEMENTS Fiscal Year Ended June 30, 2008 NOTE 1 SUMMARY OF SIGNIFICANT ACCOUNTING POLICIES (Continued) Los Angeles Convention and Exhibition Center Authority The Authority was formed under a joint powers agreement between the City and the County of Los Angeles for the purpose of constructing and operating a convention and exhibition hall and related facilities within the City s boundary. The Authority is composed of 15 members, 10 are appointed by the City Mayor and 5 are appointed by the County Board of Supervisors. Capital financing activities are included in the Other Governmental Funds. Completed capital assets are contributed to the Convention Center Enterprise Fund. Los Angeles Harbor Improvement Corporation The Corporation is a nonprofit, public benefit corporation organized for the sole purpose of assisting the City, acting through the Board of Harbor Commissioners, in providing financing for the acquisition, construction, replacement, or expansion of improvements to the facilities within the area controlled by the Port of Los Angeles (Port). The Corporation is a component unit of the Port and is included in the Harbor Enterprise Fund. Municipal Improvement Corporation of Los Angeles The Municipal Improvement Corporation of Los Angeles (the MICLA) was formed for the purpose of rendering assistance to the City for financing the acquisition of properties and equipment, and the construction of buildings and other improvements, for the benefit of City residents, through the issuance of certificates of participation and revenue bonds. The MICLA is reported as a major special revenue and debt service fund. Discretely Presented Component Unit The Community Redevelopment Agency of the City of Los Angeles (the CRA) is a governmental entity that is legally separate from the City. It was created by the City to remove blight in accordance with Section of the California Health and Safety Code that authorized municipal agencies to form redevelopment areas and agencies. Under the Code, the local legislative body is required to approve the annual budgets and their amendments of such redevelopment agencies, when the local legislative body is not the governing body of the redevelopment agency. The Council as the governing body of the City reviews certain actions of the CRA that have significant policy or fiscal effect on the Agency, other City departments, policies, programs, or the public. A Board consisting of seven members appointed by the Mayor and confirmed by a majority vote of the City Council governs the CRA. Either the Mayor or the City Council, as joint appointing officers, may remove members pursuant to Section of the California Health and Safety Code. The CRA is discretely presented because its governing body is not substantially the same as the City s governing body and it does not provide services entirely or exclusively to the City government. The Community Redevelopment Financing Authority of the City of Los Angeles (CRFA) is included as a blended component unit in the CRA financial statements. The financial statements of the CRA reflect the aggregated amounts of financial data for the CRA governmental and business-type activities, presented discretely on the statement of net assets and statement of activities
82 NOTES TO THE BASIC FINANCIAL STATEMENTS Fiscal Year Ended June 30, 2008 NOTE 1 SUMMARY OF SIGNIFICANT ACCOUNTING POLICIES (Continued) Investment in Joint Ventures The following entities are joint ventures of the Department of Harbor: Intermodal Container Transfer Facility Joint Powers Authority (ICTF) Alameda Corridor Transportation Authority (ACTA) Excluded Organizations Joint Venture The Los Angeles Memorial Coliseum Commission (Commission) was created by a joint powers agreement between the City, Los Angeles County, and the California Museum of Science and Industry, an institution of the State of California. Its purpose is to provide for the operation and maintenance of the Coliseum and Sports Arena. The Commission is not a City function and operates independent of City oversight and financial accountability. The City appointees comprise 33% of the Commission. Related Organization The Housing Authority of the City of Los Angeles is an organization for which the City has appointed the voting majority of the members of the governing body but for which the City is not financially accountable. The City retains and exercises its authority over the entity only as provided by the municipal code and Federal laws. The entity is fiscally independent from the City. The City is unable to impose its will on the daily operations of the entity. The City's accountability to this entity is limited to removal of a commissioner by the Mayor or the entire board by the City Council for cause and under due process. Separate Audited Financial Statements Separate audited financial statements may be obtained through the Office of the City Controller, 200 North Main Street, Room 300, Los Angeles, California 90012, for the following City departments and component units: Department of Airports Department of Harbor Department of Water and Power (DWP) Sewer Construction and Maintenance Fund Los Angeles City Employees' Retirement System Fire and Police Pension System Water and Power Employees' Retirement, Disability and Death Benefit Insurance Plan Municipal Improvement Corporation of Los Angeles Community Redevelopment Agency of the City of Los Angeles
83 NOTES TO THE BASIC FINANCIAL STATEMENTS Fiscal Year Ended June 30, 2008 NOTE 1 SUMMARY OF SIGNIFICANT ACCOUNTING POLICIES (Continued) C. Government-wide and Fund Financial Statements The government-wide financial statements (i.e., the statement of net assets and the statement of activities) report information on all of the nonfiduciary activities of the primary government and its component units. For the most part, the effect of interfund activity has been removed from these statements. Governmental activities, which normally are supported by taxes and intergovernmental revenues, are reported separately from business-type activities, which rely, to a significant extent on fees and charges for support. Likewise, the primary government is reported separately from its legally separate component unit, which is presented discretely. The statement of activities demonstrates the degree to which the direct expenses of a given function or program are offset by program revenues. Direct expenses are those that are clearly identifiable with a specific function or program. Included in the direct expenses are indirect costs, such as fringe benefits, administrative overhead, and liability claims, which were automatically allocated to the specific function or program. Charges for workers compensation, information technology services, telephone, postage, and fleet services are not allocated and are included as part of the general government functional activity. Program revenues include 1) charges to customers or applicants who purchase, use, or directly benefit from goods, services, or privileges provided by a given function or segment and 2) grants and contributions that are restricted to meeting operational or capital requirements of a particular function or segment. Taxes and other items not included among program revenues are reported instead as general revenues. Separate financial statements are provided for governmental funds, proprietary funds, and fiduciary funds, even though the latter are excluded from the government-wide financial statements. Major individual governmental funds and individual enterprise funds are reported as separate columns in the fund financial statements. D. Measurement Focus, Basis of Accounting, and Financial Statement Presentation The government-wide financial statements are reported using the economic resources measurement focus and the accrual basis of accounting, as are the proprietary fund and pension trust fund financial statements. Revenues are recognized when earned and expenses are recognized when a liability is incurred, regardless of the timing of related cash flows. The governmental fund financial statements are reported using the current financial resources measurement focus and the modified accrual basis of accounting. Revenues are recognized as soon as they are both measurable and available. Revenues are considered to be available when they are collectible within the current period or soon enough thereafter to pay liabilities of the current period. For this purpose, the City considers revenues to be available if they are collected within 60 days of the end of the current fiscal year. Expenditures generally are recorded when liability is incurred, as under accrual accounting. However, debt service expenditures are recorded only when payment is due, while expenditures related to compensated absences, claims and judgments, and landfill closure and postclosure care costs are recognized to the extent that they are normally expected to be liquidated with expendable available resources and are due and payable at year-end
84 NOTES TO THE BASIC FINANCIAL STATEMENTS Fiscal Year Ended June 30, 2008 NOTE 1 SUMMARY OF SIGNIFICANT ACCOUNTING POLICIES (Continued) Revenues susceptible to accrual are property taxes, business taxes, sales taxes, utility users taxes, transient occupancy tax, charges for services, special assessments, franchise income, licenses and permits, and interest income. In applying the susceptible to accrual concept to Federal and State grants and subventions, revenues are recognized when applicable eligibility requirements, including time requirements, are met and the resources are available. The City reports the following major governmental funds: The General Fund is the primary operating fund of the City. It is used to account for all financial resources of the general government, except those required to be accounted for in other funds. The Building and Safety Permit Fund accounts for the fees collected for plan check, permitting, and inspection of new construction in the City; testing of construction materials and methods; and examining the licensing of welders, equipment operators, and registered deputy building inspectors. The fees collected are used to finance all programs, services and support functions relating to those services for which the fees are imposed. The Community Development Fund accounts for the Block Grant funds allocated by the United States Department of Housing and Urban Development (HUD) for the development of viable urban communities, including: decent housing and suitable living environment; expanding economic opportunities, principally for persons of low and moderate income; and physical improvements to communities accompanied by supportive social services. The Municipal Improvement Corporation Funds account for the activity of the City s public financing entity component unit which finances the acquisition of properties and equipment, the construction of buildings, and other improvements for the benefit of City residents. The assets acquired or constructed by the Corporation are leased to the City under long-term capital lease agreements and become property of the City at the termination of the lease. The effects of the capital lease arrangements have been eliminated from the basic financial statements. The Proposition A Local Transit Assistance Fund accounts for the City s 25% share of the additional one-half cent sales tax within the County of Los Angeles to (a) improve and expand existing public transit Countywide, including reduction of transit fares, (b) construct and operate a rail rapid transit system, and (c) more effectively use State and Federal funds, benefit assessments, and fares. The Recreation and Parks Fund accounts for the revenues and expenditures of the Department of Recreation and Parks in operating and maintaining parks, playgrounds, swimming pools, public golf courses, recreation centers, recreation camps and educational facilities, and structures of historical significance. The Solid Waste Resources Fund accounts for the solid waste collection, transfer, recycling, recovery of waste resources, and disposal fee imposed on all single dwellings in the City and on multiple unit dwellings for which the City provides refuse collection services. The fees collected are to cover all costs associated with the City s solid waste collection, recycling and disposal activities. The Fund was formerly known as Sanitation Equipment Charge Fund
85 NOTES TO THE BASIC FINANCIAL STATEMENTS Fiscal Year Ended June 30, 2008 NOTE 1 SUMMARY OF SIGNIFICANT ACCOUNTING POLICIES (Continued) The City reports the following major proprietary funds: The Airports Fund accounts for the operation, maintenance and development of City airports, namely: Los Angeles International Airport, Ontario International Airport, Van Nuys Airport and Palmdale Regional Airport. The Harbor Fund accounts for the operations of the Port of Los Angeles, including operations of a pilotage service, lease of land and facilities and production of oil in the Harbor District. The Power and Water Funds account for the operations of the Department of Water and Power in supplying the City and its inhabitants with water and electric power by constructing, operating, and maintaining facilities located throughout the City and Inyo and Mono Counties. The Sewer Fund accounts for the construction, operations and maintenance of the City s wastewater collection and treatment system. Additionally, the City reports the following fund types: The Pension Trust Funds account for the activities of the City s three single-employer defined benefit pension plans namely: Fire and Police Pension System (Pensions); Los Angeles City Employees Retirement System (LACERS); and Water and Power Employees Retirement, Disability and Death Benefit Insurance Plan (DWP Retirement Plan). The Other Postemployment Benefits Trust Funds account for the activities of the City s three single-employer defined benefit postemployment healthcare plans provided through the defined benefit pension plans namely: Fire and Police Health Subsidy Plan, Los Angeles City Employees Postemployment Healthcare Plan, and Water and Power Employees Retiree Health Benefits Plan. The Agency Funds account for assets held by the City as an agent for others, for example: Federal and State income taxes withheld from employees; and assessments for payments of certain conduit debt. Private-sector standards of accounting and financial reporting issued prior to December 1, 1989, generally are followed in both the government-wide and proprietary fund financial statements to the extent that those standards do not conflict with or contradict guidance of the Governmental Accounting Standards Board (GASB). Governments also have the option of following subsequent private-sector guidance for their business-type activities and enterprise funds subject to this same limitation. The City has elected not to follow subsequent private-sector guidance. As a general rule, the effect of interfund activity has been eliminated from the government-wide financial statements. Exceptions to this general rule are charges between the City s business-type activities and certain other governmental functions. Elimination of these charges would distort the direct costs and program revenues reported for the various functions concerned
86 NOTES TO THE BASIC FINANCIAL STATEMENTS Fiscal Year Ended June 30, 2008 NOTE 1 SUMMARY OF SIGNIFICANT ACCOUNTING POLICIES (Continued) Amounts reported as program revenues include 1) charges to customers or applicants for goods, services, or privileges provided, 2) operating grants and contributions, and 3) capital grants and contributions, including special assessments. Revenues that do not meet the criteria to be reported as program revenues are reported as general revenues. All taxes, even those levied for specific purpose, are reported as general revenues. Proprietary funds distinguish operating revenues and expenses from nonoperating items. Operating revenues and expenses generally result from providing services in connection with a proprietary fund s principal ongoing concern operations. The principal operating revenues of the City s enterprise funds are charges to customers for sales and services while operating expenses include cost of sales and services, administrative expenses, and depreciation on capital assets. All revenues and expenses not meeting this definition are reported as nonoperating revenues and expenses. When both restricted and unrestricted resources are available for use, it is the City s policy to use restricted resources first, and then unrestricted resources, as they are needed. E. Assets, Liabilities and Net Assets or Equity Cash and Cash Equivalents For purposes of the statement of cash flows, all Proprietary Fund cash and pooled investments with the City Treasurer, cash deposits and other short-term investments that are both readily convertible to known amounts of cash and have maturities of three months or less at the time of purchase, are considered to be cash and cash equivalents. At June 30, 2008, the Proprietary Funds investments held by escrow and fiscal agents of $816.2 million and other investments of $7.1 million have maturities beyond three months and therefore are not considered cash and cash equivalents. Inventories Inventories for materials and supplies, valued at average cost for the governmental activities and governmental funds, consist of expendable supplies held for consumption and are recorded as expenditures when purchased in the fund financial statements, but are recorded as expenses when consumed in the governmental activities statement of activities. For the business-type activities and proprietary funds, inventories for materials and supplies are stated at average cost. Fuel is recorded at lower of cost or market on average cost basis. The CRA land inventory, which is reported at cost, is acquired for eventual disposition for housing and commercial redevelopment projects. Restricted Assets The restricted assets for governmental activities and governmental funds are related to the State mandated deposit with a trustee bank to finance solid waste landfill closure and postclosure care costs, and donated resources for the renovation of the Griffith Observatory
87 NOTES TO THE BASIC FINANCIAL STATEMENTS Fiscal Year Ended June 30, 2008 NOTE 1 SUMMARY OF SIGNIFICANT ACCOUNTING POLICIES (Continued) For the business-type activities and proprietary funds, amounts are reserved for accumulated resources for debt service payments, nuclear decommissioning trust funds, postretirement healthcare benefits trust fund, collected but unexpended passenger facility charges and accrued interest thereon, a self-insurance reserve, deposits from service users, and retention guarantees from contractors. For the CRA, included in this account are investments, maintained with bond fiscal agents and trustees, pledged for payment of principal and interest on tax allocation and parking revenue bonds. Capital Assets Capital assets, which include property, plant, equipment, and infrastructure assets (e.g. streets and bridges) are reported in the applicable governmental or business-type activities columns in the government-wide statement of net assets. Generally, assets with an individual cost of at least $5,000 and an estimated useful life of more than one year are capitalized. Purchased or constructed capital assets are valued at historical cost or estimated historical cost if actual historical cost is not available. Assets acquired by donation are recorded at estimated fair value on the date received. The costs of normal maintenance and repairs that do not add to the value of the asset or materially extend assets lives are not capitalized. Major outlays for capital assets and improvements are capitalized as projects are constructed. The business-type activities and proprietary funds capitalize interest costs, or in the case of the Power and Water Enterprise Funds, provide an "allowance for funds used during construction (AFUDC)." Interest and AFUDC capitalized during the year ended June 30, 2008 were $3.4 million and $17.4 million, respectively. Depreciation, which includes amortization of assets under capital leases, is computed using the straight-line method over the estimated useful or service lives of the related assets, except as noted below. Depreciation for the Power Enterprise Fund facilities completed prior to July 1, 1973 is computed by the 5% sinking fund method based on estimated service lives. Decommissioning of a nuclear power plant, in which the City has an ownership interest, is expected to commence subsequent to the year The total cost to decommission the City s interest in the nuclear plant is estimated to be $117 million in 2007 dollars. During fiscal year 2000, DWP suspended contributing additional amounts to the decommissioning trust funds, as management believes that contribution to date combined with reinvested earnings, will be sufficient to fully fund DWP s share of decommissioning costs. As of June 30, 2008, Power Enterprise Fund has recorded $129.8 million to accumulated depreciation to provide for the decommissioning liability. The Power Enterprise Fund s nuclear fuel is amortized and charged to operating expenses- fuel for generation on the basis of actual thermal energy produced relative to total thermal energy expected to be produced over the life of the fuel
88 NOTES TO THE BASIC FINANCIAL STATEMENTS Fiscal Year Ended June 30, 2008 NOTE 1 SUMMARY OF SIGNIFICANT ACCOUNTING POLICIES (Continued) In July 2005, the Power Enterprise Fund acquired approximately a 74.5% ownership interest in gas properties located in Pinedale, Wyoming. The Fund uses the successful efforts method of accounting for its investment in gas producing properties. Costs to acquire the mineral interest in gas properties, to drill and equip exploratory wells that find proven reserves, and to drill and equip development wells are capitalized. Costs to drill exploratory wells that do not find proven reserves are expensed. Capitalized costs of producing gas properties are depleted by the unit-of-production method based on the estimated future production of the proved developed producing wells. Depletion expense related to the gas field is recorded as a component of operating expenses- fuel for generation. During fiscal year 2008, the Fund recorded $7.4 million of depletion expense. The estimated useful lives of the primary government s capital assets are as follows: Useful Life Governmental Business-type Category Activities Activities Infrastructure years -- Buildings and facilities years years Equipment and vehicles 3-20 years 3-20 years Wastewater collection system years Landplane ports years Treatment and pumping plants years Wharves and sheds years The City s collection of artwork, certain scientific equipment, and zoo animals are not capitalized or depreciated. These capital assets are maintained for public exhibition, education or research and are being preserved for future generations. The proceeds from sales of any pieces of the collection are used to purchase other items for collection. The City s infrastructure assets and the reporting methods the City has elected are as follows: Infrastructure Bridges Stormwater system Streets Traffic signals Automated traffic signal and control Bikepaths Fiber optic telecommunication system Street lighting system Street pavement markings Traffic signs Reporting Method Modified Depreciation Depreciation Depreciation Depreciation Depreciation Depreciation Depreciation Depreciation Depreciation The Pension Trust Funds capital assets consist primarily of office furniture and equipment of the City Employees Retirement System. Capital assets acquisitions of at least $5,000 are capitalized and depreciated over five years
89 NOTES TO THE BASIC FINANCIAL STATEMENTS Fiscal Year Ended June 30, 2008 NOTE 1 SUMMARY OF SIGNIFICANT ACCOUNTING POLICIES (Continued) The CRA capital assets are stated at cost. Capital assets acquisitions of at least $150 are capitalized. Additions and improvements that extend the useful lives of capital assets are capitalized. Depreciation is provided over the estimated useful lives ranging from 3 to 40 years using the straight-line method. Compensated Absences Vacation Pay Eligible employees accumulate vacation leave up to a maximum of 400 hours depending on the length of service. Sworn employees of the Police and Fire Departments accumulate from 256 hours to 400 hours. All employees are paid the accumulated leave upon termination or retirement. All vacation pay is accrued when incurred in the government-wide, proprietary and fiduciary fund financial statements. For the Governmental Funds, earned vacation is recorded as expenditures to the extent that they are normally expected to be liquidated with expendable available resources and are due and payable at year-end. Also, for governmental activities, earned vacation is generally liquidated by the General Fund. Sick Pay City employees (except those of the DWP) are entitled to 96 hours of sick leave at full pay and 40 hours at 75% of full pay for each calendar year of employment. Employees may accumulate sick leave up to 800 hours at full pay and 800 hours at 75% of full pay. The City pays 50% of the excess over the maximum accumulated 800 hours at full pay in the subsequent calendar year. Upon retirement, the City pays 50% of the accumulated sick time at full pay. There is no provision for the payment of the accumulated sick time at 75% of full pay. Firefighters under Memorandums of Understanding (MOU) 22 and 23 may accumulate 896 hours at full pay. Accrued and accumulated sick leave at 50% of full pay was frozen for any credits or withdrawals. However, the City will pay 25% of the balance upon retirement. DWP employees accumulate 40 hours of sick leave per year to a maximum of 80 hours. Any excess over the maximum is paid to the employee at 100% of their current salary rate. The employee goes on disability after taking 2 consecutive days of sick leave. Governmental activities accrue the estimated value of sick leave (vested and probable of being vested), which may be used in subsequent years, or paid upon retirement up to a set maximum accumulated balance. The Proprietary and Pension Trust Funds accrue sick leave in the fiscal year earned. For the Governmental Funds, earned sick leave is recorded as expenditures to the extent that they are normally expected to be liquidated with expendable available resources and are due and payable at year-end. Also, for governmental activities, accrued sick leave is generally liquidated by the General Fund. Employees of the CRA accumulate 96 hours per fiscal year to a maximum of 800 hours. The CRA pays 50% of the accumulated sick leave hours to any employee who retires or has a balance in excess of 800 hours
90 NOTES TO THE BASIC FINANCIAL STATEMENTS Fiscal Year Ended June 30, 2008 NOTE 1 SUMMARY OF SIGNIFICANT ACCOUNTING POLICIES (Continued) Accumulated Compensated Time-Off The MOU with the union representing police officers at the rank of Lieutenant and below provides that officers will accrue compensated time-off for accumulated overtime to certain limits. Whenever an employee resigns, retires or is discharged from the Police Department, the employee shall be paid in cash for all compensated time-off due. In case of death, payment will be made to the estate. Accrued compensated time-off is reported in the government-wide financial statements. For the Governmental Funds, expenditures are recognized to the extent that they are normally expected to be liquidated with expendable available resources and are due and payable at year-end. Also, for governmental activities, accrued compensated time-off is generally liquidated by the General Fund. Risk Management The City is self-administered and self-funded for workers compensation, most property damage and the majority of tort liability exposures. Commercial insurance is used where it is legally required, contractually required or judged to be the most effective way to finance risk. Indemnity and insurance protection is also required from all City contractors, vendors, lessees and permit holders. Claims and judgments are recorded when it is probable that an asset has been impaired or a liability has been incurred and the amount of loss can be reasonably estimated. The recorded estimated liability for claims and judgments includes a provision for Incurred But Not Reported (IBNR) liabilities for workers compensation, tort cases and liabilities for allocated expenses. For the Governmental Funds, only the portion of the liability is recognized to the extent that they are normally expected to be liquidated with expendable available resources and are due and payable at year-end. Also, for governmental activities, liability for claims and judgments is generally liquidated by the General Fund. Deferred Revenue Deferred revenue in the governmental funds arises when potential revenue does not meet both the measurable and available criteria for recognition. Deferred revenue also arises when the City receives resources before it has a legal claim to them. In subsequent periods, when both the revenue criteria are met, or when the City has a legal claim to the resources, the deferred revenue is removed from the balance sheet/statement of net assets and revenue is recognized. Long-term Obligations In the government-wide financial statements, and proprietary fund types in the fund financial statements, long-term debt and other long-term obligations are reported as liabilities in the applicable governmental activities, business-type activities, or proprietary fund type statement of net assets. Bond premiums, discounts and deferred losses on refundings as well as issuance costs are deferred and amortized over the life of the bonds. Bonds payable are reported net of the applicable bond premium or discount and deferred losses on refundings. Bond issuance costs are reported as deferred charges and amortized over the term of the related debt
91 NOTES TO THE BASIC FINANCIAL STATEMENTS Fiscal Year Ended June 30, 2008 NOTE 1 SUMMARY OF SIGNIFICANT ACCOUNTING POLICIES (Continued) In the fund financial statements, governmental fund types recognize bond premiums and discounts, as well as bond issuance costs, during the current period. The face amount of the debt issued is reported as other financing sources. Premiums received on debt issuances are reported as other financing sources while discounts on debt issuances are reported as other financing uses. Issuance costs, whether or not withheld from the actual debt proceeds received, are reported as debt service expenditures. Property Taxes Secured property taxes are levied on or before the first business day of September of each year. They become a lien on real property on January 1 preceding the fiscal year for which taxes are levied. These tax payments can be made in two equal installments; the first is due November 1 and delinquent with penalties after December 10; the second is due February 1 and delinquent with penalties after April 10. Secured property taxes that are delinquent and unpaid as of June 30 are declared to be tax defaulted and are subject to redemption penalties, costs, and interest when paid. If the delinquent taxes are not paid at the end of five (5) years, the property can be sold at public auction. The proceeds are used to pay the delinquent amounts due, and any excess is remitted, if claimed, to the taxpayer. Additional tax liens are created when there is a change in ownership of property or upon completion of new construction. Tax bills for these new tax liens are issued throughout the fiscal year and contain various payments and delinquent dates but are generally due within one year. Unsecured personal property taxes are not a lien against real property. These taxes are due on January 1 and become delinquent, if unpaid, on August 31. The County of Los Angeles assesses, bills, and collects property taxes for all jurisdictions within its borders and remits the applicable portion less an administrative fee to the City throughout the year. Payments are normally remitted on the 20 th day of the month. Interfund Transactions Interfund transactions are reflected as loans, services provided, reimbursements, or transfers. Loans are reported as receivables and payables as appropriate and are subject to elimination upon consolidation. Services provided are treated as revenues and expenditures/expenses. Reimbursements are when one fund incurs a cost, charges the appropriate benefiting fund and reduces its related cost as a reimbursement. All other interfund transactions are treated as transfers. Transfers between governmental or proprietary funds are netted as part of the reconciliation to the government-wide columnar presentation. Fund Equity In the fund financial statements, governmental funds report reservations of fund balance for amounts that are not available for appropriation or are legally restricted by outside parties for use for a specific purpose. Designations of fund balance represent tentative management plans that are subject to change
92 NOTES TO THE BASIC FINANCIAL STATEMENTS Fiscal Year Ended June 30, 2008 NOTE 1 SUMMARY OF SIGNIFICANT ACCOUNTING POLICIES (Continued) Net Assets The government-wide financial statements utilize net assets presentation. Net assets are categorized as follows: Invested in capital assets, net of related debt - This category groups all capital assets into one component of net assets. Accumulated depreciation and the outstanding balances of debt that are attributable to the acquisition, construction, or improvement of these assets reduce the balance in this category. Restricted net assets This category consists of net assets with constraints placed on their use, either externally or internally. Constraints include those imposed by creditors (such as through bond covenants), grants or laws and regulations of other governments, or by law through constitutional provisions or enabling legislation. Unrestricted net assets This category represents net assets of the City that are not restricted for any project or other purposes. Use of Estimates The preparation of the financial statements in conformity with generally accepted accounting principles requires management to make estimates and assumptions that affect the amounts in the financial statements and accompanying notes. Actual results could differ from the estimates. Reclassifications Certain reclassifications have been made to amounts reported in the separately audited financial statements of certain Enterprise Funds, Pension Trust Funds, Other Postemployment Benefits Trust Funds, and other component units to conform to the City reporting entity's report format and to account for transactions between the City's reporting entity and such entities in accordance with GAAP. Adoption of New GASB Pronouncements The primary government adopted the following: GASB Statement No. 45, Accounting and Financial Reporting by Employers for Postemployment Benefits Other Than Pensions. Issued in June 2004, this statement addresses how state and local governments should account for and report their costs and obligations related to postemployment healthcare and other nonpension benefits, collectively referred to as other postemployment benefits (OPEB). The statement generally requires that state and local governmental employers account for and report the annual cost of OPEB and the outstanding obligations and commitments related to OPEB in essentially the same manner as they currently do for pensions. The City implemented this standard beginning in fiscal year
93 NOTES TO THE BASIC FINANCIAL STATEMENTS Fiscal Year Ended June 30, 2008 NOTE 1 SUMMARY OF SIGNIFICANT ACCOUNTING POLICIES (Continued) GASB Statement No. 48, Sales and Pledges of Receivables and Future Revenues and Intra-Entity Transfers of Assets and Future Revenues. Issued in September 2006, this statement provides criteria that governments will use to ascertain whether the proceeds from the exchange of interest in expected cash flows, from collecting specific receivables or specific future revenues for immediate cash payments, should be regarded as a sale or as a collateralized borrowing resulting in a liability. This statement also provides additional guidance for transfers of capital assets, financial assets, and future revenues within the same financial reporting entity. This statement is effective for the City beginning fiscal year GASB Statement No. 50 Pension Disclosures- An amendment of GASB Statements No. 25 and No. 27. Issued in May 2007, the objective of this statement is to amend note disclosure and required supplementary information standards of Statement No. 25, Financial Reporting for Defined Benefit Pension Plans and Note Disclosures for Defined Contribution Plans, and Statement No. 27, Accounting for Pensions by State and Local Government Employers, to conform with applicable changes adopted in GASB Statement Nos. 43 and 45. GASB 50 is intended to improve transparency and decision usefulness of reported information about pensions by state and local government plans and employers. The City implemented this standard beginning in fiscal year Recent GASB Pronouncements GASB Statement No. 49, Accounting and Financial Reporting for Pollution Remediation Obligations. Issued in December 2006, this statement requires governments to estimate their expected outlays for pollution remediation if they know a site is polluted and any of the recognition triggers set by the standard occur. Liabilities would be estimated using an expected cash flows measurement technique, which is used by environmental professionals but will be employed for the first time by governments. Governments are required to disclose information about their pollution obligations associated with clean up efforts in the notes to the financial statements. GASB 49 will be effective for the City beginning fiscal year GASB Statement No. 51, Accounting and Financial Reporting for Intangible Assets. Issued in June 2007, this statement establishes standards for accounting and financial reporting for intangible assets, for all state and local governments. Types of assets that may be considered intangible assets include easements, water rights, timber rights, patents, trademarks, and computer software. GASB 51 will be effective for the City beginning fiscal year Retroactive reporting is required. GASB Statement No. 52, Land and Other Real Estate Held as Investments by Endowments. Issued in November 2007, this statement establishes standards for accounting and financial reporting for land and other real estate held as investments by endowments. Endowments include permanent term endowments, and permanent funds. GASB 52 will be effective for the City beginning fiscal year GASB Statement No. 53, Accounting and Financial Reporting for Derivative Instruments. Issued in June 2008, this statement requires governments to measure most derivative instruments at fair value in their financial statements that are prepared using the economic resources measurement focus and the accrual basis of accounting. The statement also addresses hedge accounting requirements. GASB 53 will be effective for the City beginning fiscal year
94 NOTES TO THE BASIC FINANCIAL STATEMENTS Fiscal Year Ended June 30, 2008 NOTE 1 SUMMARY OF SIGNIFICANT ACCOUNTING POLICIES (Continued) GASB Technical Bulletin , Determining the Annual Required Contribution Adjustment for Postemployment Benefits. Issued in November 2008, this technical bulletin clarifies that use of known amounts for purposes of the annual required contribution (ARC) adjustment is consistent with the intent of the ARC adjustment and encourages use of the known amount in place of the estimation procedure in GASB Statements 27 and 45. The technical bulletin will be effective for the City beginning fiscal year NOTE 2 RECONCILIATION OF GOVERNMENT-WIDE AND FUND FINANCIAL STATEMENTS A. Explanation of Certain Difference Between the Governmental Funds Balance Sheet and the Government-wide Statement of Net Assets The governmental funds balance sheet includes reconciliation between total fund balancesgovernmental funds and net assets of governmental activities as reported in the government-wide statement of net assets. One element of that reconciliation explains that long-term liabilities, including bonds payable, are not due and payable in the current period and therefore are not reported in the funds. The details of this $6,434,045 difference are as follows (in thousands): Bonds, Certificates of Participation, and Notes $ 3,777,690 Add: Issuance Premium (to be amortized as interest income) 90,193 Less: Deferred Charge on Refunding (to be amortized as interest expense) (26,456) Less: Deferred Charge for Cost of Issuance (to be amortized over the life of the debt) (23,653) HUD Loans 76,055 Accrued Interest Payable 62,292 Accrued Compensated Absences 497,575 Estimated Claims and Judgments Payable 1,843,099 Accrued Landfill Liability 47,550 Net Pension Liability 68,342 Net OPEB Liability 21,358 Net adjustments to reduce governmental fund balance to arrive at governmental activities net assets $ 6,434,045 B. Explanation of Certain Differences Between the Governmental Funds Statement of Revenues, Expenditures, and Changes in Fund Balances and the Government-wide Statement of Activities The governmental funds statement of revenues, expenditures, and changes in fund balances includes reconciliation between net change in fund balances-total governmental funds and change in net assets of governmental activities as reported in the government-wide statement of activities. One element of that reconciliation explains that governmental funds report capital outlays as expenditures. However in the statement of activities, the cost of those assets is allocated over their estimated useful lives and reported as depreciation expense. The details of this $674,160 difference are as follows (in thousands):
95 NOTES TO THE BASIC FINANCIAL STATEMENTS Fiscal Year Ended June 30, 2008 NOTE 2 RECONCILIATION OF GOVERNMENT-WIDE AND FUND FINANCIAL STATEMENTS (Continued) Capital Outlay $ 899,888 Less: Depreciation expense (225,728) Net adjustments to increase net change in fund balances of governmental funds to arrive at change in net assets of governmental activities $ 674,160 Another element of that reconciliation states that the issuance of long-term debt provides current financial resources to the governmental funds while the repayment of the principal of long-term debt consumes the current financial resources of governmental funds. Neither transaction, however, has any effect on net assets. Also governmental funds report the effect of issuance costs, premiums, discounts, and similar items when debt is first issued, whereas, these amounts are deferred and amortized in the statement of activities. The details of this $30,966 difference are as follows (in thousands): Debt issued or incurred: Certificates of Participation, Revenue Bonds, and Notes $ 461,035 Add: Issuance Premium 3,596 Less: Deferred Charge for Cost of Issuance (2,080) HUD Loans 24,110 Principal repayments and bond refunding: General and Judgment Obligation Bonds (115,008) Certificates of Participation, Revenue Bonds, and Notes (262,975) HUD Loans (77,712) Net adjustments to decrease net change in fund balances of governmental funds to arrive at change in net assets of governmental activities $ 30,966 Another element of that reconciliation states that some expenses reported in the statement of activities do not require the use of current financial resources and therefore are not reported as expenditures in governmental funds. The details of this $296,048 difference are as follows (in thousands): Increase in Accrued Compensated Absences $ 14,040 Increase in Estimated Claims and Judgments 254,684 Decrease in Accrued Landfill Liability (2,032) Decrease in Net Pension Liability (2,911) Increase in Net OPEB Liability 21,358 Increase in Accrued Interest 5,159 Amortization of Deferred Charge on Refunding 3,928 Amortization of Deferred Charge for Cost of Issuance 1,822 Net adjustments to decrease net change in fund balances of governmental funds to arrive at change in net assets of governmental activities $ 296,
96 NOTES TO THE BASIC FINANCIAL STATEMENTS Fiscal Year Ended June 30, 2008 NOTE 3 STEWARDSHIP, COMPLIANCE, AND ACCOUNTABILITY A. Budgets and Budgetary Basis of Accounting Under the City Charter, the Mayor is required each year to submit to the Council a Proposed Budget by April 20 for the forthcoming fiscal year commencing July 1. The Proposed Budget is based on the Mayor's budget priorities, the responses of the City Administrative Officer and City Departments to the Mayor's budget policy letter, which is distributed early in the fiscal year, and estimates of receipts from the City's various revenue sources. The Council's Budget and Finance Committee reviews the Mayor's Proposed Budget and reports its recommendations to the full Council. The Council must legally adopt the Mayor's Proposed Budget, as modified by the Council, by June 1. The Mayor has five working days after adoption to approve or veto any items modified by the Council. The Council then has five working days to override by a two-thirds vote any items changed by the Mayor. The City Council adopts an annual operating budget for 39 City departments, bureaus, commissions and offices. The annual budget is essentially prepared on a departmental basis, with budgeted receipts and appropriations provided for the General Fund and certain Special Revenue, Debt Service, and Capital Projects Funds. Budgets are generally limited to funds, which in addition to the General Fund finance the operations of the City departments. Furthermore, the budgeted receipts and appropriations for the Allocations from Other Governmental Agencies Special Revenue Fund (which includes Bicycle License, Bus Bench Advertising, Business Improvement, Coastal Transportation Corridor Trust, Community Based Services Program AB2800, City Planning Systems Development, Cultural Affairs Trust, Curbside Recycling Trust, Fire Hydrant Installation and Main Replacement, First and Broadway Childcare, General Services Trust, Integrated Solid Waste Management, Pershing Square Project, Street Banners, UDAG Miscellaneous, Used Oil Collection, Ventura/Cahuenga Boulevard Corridor Specific Plan, Warner Center Transportation Improvement, and West LA Transportation Improvement and Mitigation Special Revenue Funds) is not all-inclusive because the budget provides for only the portion of fund receipts that are expended to finance City department operations. The City does not budget for the financial activities of all its Governmental Funds. The following Governmental Funds are not included in the City's legally adopted annual operating budget: General Fund Reserve and certain other account components Special Revenue Major Funds: Municipal Improvement Corporation Recreation and Parks Nonmajor Funds: Automated Traffic Surveillance and Control Economic Development Section 108 Loan Program Grant Seismic Bond Reimbursement Transportation Grant Certain Other Nonmajor Grant Funds Certain Other Nonmajor Special Revenue Funds
97 NOTES TO THE BASIC FINANCIAL STATEMENTS Fiscal Year Ended June 30, 2008 NOTE 3 STEWARDSHIP, COMPLIANCE, AND ACCOUNTABILITY (Continued) Debt Service Major Fund: Municipal Improvement Corporation Nonmajor Funds: Certain Convention Center Accounts Solid Waste Resources Certain Other Debt Service Funds Capital Projects Nonmajor Funds: General Obligation Bonds Series 2001-A General Obligation Bonds Series 2002-A General Obligation Bonds Series 2003-A General Obligation Bonds Series 2004-A General Obligation Bonds Series 2005-A General Obligation Bonds Series 2006-A Recreation and Parks Grant Parks Assessment Certain Other Capital Projects Funds For the majority of the funds listed above, expenditure authority is approved by Council action during the fiscal year. The City's original adopted budget is subject to revision to reflect the changes in revenue projections and to make necessary adjustments to appropriations. Transfers of appropriations are approved by the Mayor subject to the following limitations and conditions. Funds appropriated in the general City budget or thereafter by the Council may be transferred to the Reserve Fund or Unappropriated Balance of the General Fund, or appropriated for the same or other purposes amending the budget and other spending authority, upon approval of the Mayor provided the amounts do not exceed $50,000 and required notices are made by the City Clerk to the President of the Council, Controller and City Administrative Officer. Intra-Department transfers from one appropriated item to another may be approved by the Mayor provided the amount does not exceed the greater of $35,000 or 1% of the budget for the account receiving the transfer but not exceeding $100,000. The $35,000 limit is subject to adjustment based on the consumer price index. For fiscal year ended June 30, 2008, the adjusted amount was $44,327. Transfers that exceed the amount limits require the approval of the City Council. During the fiscal year, additional appropriations of $255.2 million and capital related appropriations of $97.1 million that were reappropriated from prior budget years were included in the current annual operating budget. Transfers from the Reserve Fund (a nonbudgeted General Fund component), unanticipated receipts, and available fund balances that carried forward from the prior budget year financed these additional appropriations. In addition, non-capital related appropriations of $1,144.2 million were automatically carried forward from the prior budget year. Unused and unencumbered appropriations lapse at year-end except for non-capital related continuing appropriations for certain Special Revenue and Capital Projects Funds that are carried forward to the next budget year. Capital related appropriations that are unused and unencumbered at year-end are re-appropriated in the subsequent budget year
98 NOTES TO THE BASIC FINANCIAL STATEMENTS Fiscal Year Ended June 30, 2008 NOTE 3 STEWARDSHIP, COMPLIANCE, AND ACCOUNTABILITY (Continued) The legal level of budgetary control (the level at which expenditures may not legally exceed appropriations) is as follows: The General Fund is by line item within each object by department, except for capital improvement program expenditures which are controlled by projects. Object levels of expenditures are salaries, expense, equipment, special, capital outlay, and transfers. For the Special Revenue Funds, Debt Service Funds and Capital Projects Funds, the line items consist of departments, projects, debt service, equipment and programs. Because of the large volume of detail, the budget and actual schedules on a budgetary basis have been aggregated by fund, function and object level. A separate budget and actual report by line item has been prepared. The budgetary documents are available to the general public in the Office of the City Controller. The City's annual budget is prepared on a modified cash basis of accounting, which is different from GAAP. Revenues are recognized when cash is received, and expenditures include both cash disbursements and current year encumbered appropriations that had not been paid at the end of the budget year. Where no appropriation is adopted, payments of interfund borrowings (or payment of loans to other funds) though recorded as a component of other financing uses, are not treated as budgetary transactions and are excluded in the separate budget and actual report. Encumbrance accounting, under which purchase orders, contracts and other commitments for the expenditure of monies are recorded in order to reserve that portion of the applicable appropriation, is used in the Governmental Funds, except for certain Special Revenue and Capital Projects Funds whose assets are managed by a third party trustee. Encumbrances outstanding at year-end are reported as reservations of fund balances since they do not constitute expenditures or liabilities. These commitments will be honored in subsequent year carryforward appropriations. B. Reconciliation of Operations on Budgetary Basis to the GAAP Basis The actual results of operations on a budgetary basis compared to the appropriations adopted by the City Council for budgeted major governmental funds are included in the fund financial statements. The comparisons of actual results with the budget for non-major funds are presented as supplemental information in the combining schedules. Because accounting principles applied for purposes of developing data on a budgetary basis differ from those used to present financial information in accordance with GAAP, a reconciliation of the resultant basis and perspective differences on operations for the year ended June 30, 2008 is presented in the following pages for the City s budgeted major funds. The dollar amounts are expressed in thousands
99 NOTES TO THE BASIC FINANCIAL STATEMENTS Fiscal Year Ended June 30, 2008 NOTE 3 STEWARDSHIP, COMPLIANCE, AND ACCOUNTABILITY (Continued) General Fund Building and Safety Permit Fund Deficiency of Revenues and Other Financing Sources Over Expenditures and Other Financing Uses - Budgetary Basis $ (22,271) $ (2,779) Basis Differences Adjustments for net changes to accrued assets and liabilities. The GAAP basis operating statement recognizes revenues as soon as they are both measurable and available, and expenditures generally are recorded when liability is incurred and is due and payable; whereas, the budgetary basis operating statement reflects revenues when received and expenditures when paid. Interfund borrowings are recorded in the debtor fund as an other financing source "Loans from Other Funds" and in the creditor fund as an other financing use "Loans to Other Funds" (budgetary) as opposed to "Due to Other Funds" in the debtor fund and "Due from Other Funds" in the creditor fund (GAAP). 9,151 1,516 1, Encumbrances, which represent commitments to acquire goods and services, are recorded as the equivalent of expenditures in the budget year incurred (budgetary), as opposed to a reservation of fund balance (GAAP). Encumbrances reported as budgetary expenditures 356,169 4,404 Prior year encumbrances expended in current year (342,189) (2,932) Perspective Difference For purposes of the budget, the General fund is a legal entity that is separate and distinct from the Reserve Fund and other accounts that are classified to have General fund activity for GAAP purposes. (112,391) -- Net Change in Fund Balances - GAAP Basis $ (110,064) $
100 NOTES TO THE BASIC FINANCIAL STATEMENTS Fiscal Year Ended June 30, 2008 NOTE 3 STEWARDSHIP, COMPLIANCE, AND ACCOUNTABILITY (Continued) Proposition A Solid Community Local Transit Waste Development Assistance Resources Fund Fund Fund Excess (Deficiency) of Revenues and Other Financing Sources Over Expenditures and Other Financing Uses - Budgetary Basis $ 7,594 $ 22,170 $ (8,515) Basis Differences Adjustments for net changes to accrued assets and liabilities. The GAAP basis operating statement recognizes revenues as soon as they are both measurable and available, and expenditures generally are recorded when liability is incurred and is due and payable; whereas, the budgetary basis operating statement reflects revenues when received and expenditures when paid. (5,620) 15 13,732 Encumbrances, which represent commitments to acquire goods and services, are recorded as the equivalent of expenditures in the budget year incurred (budgetary), as opposed to a reservation of fund balance (GAAP). Encumbrances reported as budgetary expenditures 18,126 17,599 6,053 Prior year encumbrances expended in current year (25,247) (12,902) (8,861) Grant funded loans are recorded as expenditures when disbursed and as program income when repaid (budgetary), as opposed to adjustments to the Loans Receivable account balance (GAAP). 12, Perspective Difference Unbudgeted accounts (9,396) Net Change in Fund Balances - GAAP Basis $ 7,840 $ 26,882 $ (6,987) C. Fund Balances- Reserves, Designations and Deficit Certain portions of the fund balance are segregated for specific future uses. For the General Fund, the reservation of $0.6 million is substantially related to police hiring; while for the Other Governmental Funds, the reservations are for the following purposes: $5.9 million for landfill postclosure maintenance, and $0.3 million for improvements at the Griffith Observatory. Fund designations indicate tentative plans for future utilization of financial resources. The designated fund balance in the General Fund of $162.8 million consists of advances and budget adjustments totaling $37.6 million, and an emergency reserve of $125.2 million. The Workforce Investment Act Special Revenue Fund has a deficit fund balance of $3 million because eligible government expenditures were incurred with amounts recorded as deferred revenue that will be recognized as future revenues when available
101 NOTES TO THE BASIC FINANCIAL STATEMENTS Fiscal Year Ended June 30, 2008 NOTE 4 DETAILED NOTES ON ALL FUNDS A. Cash, Deposits and Investments Summary of Cash and Investments At June 30, 2008, the summary of cash, pooled and other investments for governmental and business-type activities, and fiduciary funds is as follows (in thousands): All City Funds Business- Governmental type Fiduciary Activities Activities Funds Total Cash and Pooled Investments $ 3,759,709 $ 1,733,379 $ 355,673 $ 5,848,761 Other Investments 62, ,189 38,644,132 38,923,721 Restricted Assets (Note 4D page 102) 6,175 2,768, ,774,892 Total $ 3,828,284 $ 4,719,285 $ 38,999,805 $ 47,547,374 Other Cash and Investments Pension Trust Cash and and Other Investments Postemployment With City Benefits Treasurer Trust Other Total Cash and Pooled Investments $ 5,693,729 $ -- $ 155,032 $ 5,848,761 Other Investments -- 38,642, ,661 38,923,721 Restricted Assets 1,952, ,038 2,774,892 Total $ 7,646,583 $ 38,642,060 $ 1,258,731 $ 47,547,374 Summary of Deposits and Investments The carrying amount of cash on hand, deposits and investments at June 30, 2008, is as follows (in thousands): Cash on Hand $ 1,080 Deposits 283,699 Investments Pooled 7,393,533 Other 39,869,062 Total $ 47,547,
102 NOTES TO THE BASIC FINANCIAL STATEMENTS Fiscal Year Ended June 30, 2008 NOTE 4 DETAILED NOTES ON ALL FUNDS (Continued) Deposits At June 30, 2008, the book balance of the City's deposits was $283.7 million and the balance per various financial institutions was $277.6 million. The difference of $6.1 million represents primarily deposits in transit and other reconciling items. Of the bank balance, $1.3 million was covered by Federal depository insurance and $276.3 million was uninsured. The uninsured deposits of $276.3 million are held by financial institutions that are legally required by the California Government Code to collateralize the City s deposits by pledging government securities or first trust deed mortgage notes. The market value of the pledged government securities and first trust deed mortgage notes must be at least 110% and 150% of the City's deposits, respectively. The collateral is held by the pledging financial institution's trust department and is considered held in the City's name. Pooled Investments The cash balances of substantially all funds on deposit in the City Treasury are pooled and invested by the City Treasurer for the purpose of maximizing interest earnings through pooled investment activities but safety and liquidity still take precedence over return. Interest earned on pooled investments is allocated to the participating funds based on each fund's average daily deposit balance during the allocation period with all remaining interest allocated to the General Fund. Investments in the City Treasury are stated at fair value based on quoted market prices except for money market investments that have remaining maturities of one year or less at time of purchase, which are reported at amortized cost. Pursuant to California Government Code Section and the Los Angeles City Council File No , the City Treasury provides an Annual Statement of Investment Policy (the Policy) to the City Council. The Policy governs the City s pooled investment practices. The Policy addresses soundness of financial institutions in which the Treasurer will deposit funds and types of investment instruments permitted by California Government Code Sections and Examples of investments permitted by the City s pooled investment policy are obligations of the U.S. Treasury and government agencies, commercial paper notes, negotiable certificates of deposit, guaranteed investment contracts, bankers acceptances, medium term corporate notes, money market accounts, and the State of California Local Agency Investment Fund. The Investment Advisory Committee (IAC) reviews investment performance and strategy. The IAC is composed of the City Treasurer as chairperson, the Office of the Mayor, City Controller, Chief Legislative Analyst, City Administrative Officer, Director of Office of Finance, and an external investment advisor
103 NOTES TO THE BASIC FINANCIAL STATEMENTS Fiscal Year Ended June 30, 2008 NOTE 4 DETAILED NOTES ON ALL FUNDS (Continued) At June 30, 2008, the investments held in the City Treasury's General and Special Investment Pool Programs and their maturities are as follows (in thousands): Type of Investments Investment Maturities 1 to to to Days Amount Days Days Days To 5 Years U.S. Treasury Notes $ 1,619,055 $ -- $ -- $ -- $ 1,619,055 U.S. Sponsored Agency Issues 1,530, , , , ,378 Medium Term Notes 1,186, , ,107 Commercial Paper 1,984,742 1,450, , , Guaranteed Investment Contracts 135, , Certificates of Deposit 8, , Short Term Investment Funds State of California LAIF Securities Lending Cash Collateral U.S. Treasury Notes 918, ,758 U.S. Sponsored Agency Issues 10, ,721 Total General and Special Pools $ 7,393,533 $ 1,816,525 $ 560,876 $ 733,113 $ 4,283,019 Interest Rate Risk. The City s pooled investment policy limits the maturity of its investments to a maximum of five years for U.S. Treasury and federal agency securities, medium term corporate notes, and bonds issued by local agencies; 270 days for commercial paper; and 32 days for repurchase agreements. Credit Risk. The City s pooled investment policy requires that for all classes of investments, except linked banking program certificates of deposits, the issuers minimum credit ratings shall be Standard and Poor s Corporation (S&P) A-1/A or Moody s Investor Services (Moody s) P-1/A2 and, if available, Fitch IBCA F1/A. In addition, domestic banks are limited to those with a current Fitch Ratings BankWatch of B/C or better and an A-1 short-term rating. The City Treasurer is granted the authority to specify approved California banks with a Fitch Ratings BankWatch of C or better and an A-2 rating where appropriate. In addition to a AAA rating for country risk, foreign banks with domestic licensed offices must be rated B or better and TBW-1 short-term rating by Fitch Ratings BankWatch. Domestic savings banks must be rated B/C or better and a TBW-1 shortterm rating by Fitch Ratings BankWatch. Medium term notes must be issued by corporations operating within the United States and having total assets in excess of $500 million. Commercial paper issuers must meet the preceding requirement or must be issued by corporations organized in the United States as a special purpose corporation, trust or limited liability company having program-wide credit enhancements. The City s $1.53 billion investments in U.S. government sponsored enterprises consist of securities issued by the Federal Home Loan Bank - $594.5 million, Federal National Mortgage Association - $293.8 million, Federal Home Loan Mortgage Corporation - $537.2 million, and Federal Farm Credit Bank - $105.5 million. As of June 30, 2008, these securities carried the highest ratings of AAA (S&P) and Aaa (Moody s)
104 NOTES TO THE BASIC FINANCIAL STATEMENTS Fiscal Year Ended June 30, 2008 NOTE 4 DETAILED NOTES ON ALL FUNDS (Continued) The City s $1.19 billion investments in medium term notes consist of securities issued by banks and corporations that comply with the requirements discussed above and were rated A or better by S&P and A3 or better by Moody s. The City s $1.98 billion investments in commercial paper comply with the requirements discussed above and were rated AAA/A-1/A-1+ by S&P and Aaa/P-1 by Moody s. The issuers of the guaranteed investment contracts, certificates of deposits, and the State of California Local Agency Investment Fund (LAIF) are not rated. Concentration of Credit Risk. The City s investment policy does not allow more than 10% of its investments portfolio, except U.S. Treasury and U.S. sponsored agency issues, to be invested in securities of a single issuer including its related entities. The City s investment policy further provides for a maximum concentration limit of 30% on any individual federal agency or governmentsponsored entity. The City s pooled investments comply with these requirements. GAAP requires disclosure of certain investments in any one issuer that represent 5% or more of total investments. Of the City s total pooled investments as of June 30, 2008, $594.5 million (8%) was invested in securities issued by the Federal Home Loan Bank and $537.2 million (7%) was invested in securities issued by Federal Home Loan Mortgage Corporation. General Investment Pool Securities Lending Program. Securities lending is permitted and limited under provisions of California Government Code Section The City Council approved the Securities Lending Program (the SLP) on October 22, 1991 under Council File No , which complies with the California Government Code. The objectives of the SLP in priority order are: safety of loaned securities; and prudent investment of cash collateral to enhance revenue from the investment program. The SLP is governed by a separate policy and guidelines, with oversight responsibility of the Investment Advisory Committee. The City s custodial bank acts as the securities lending agent. In the event a counterparty defaults by reason of an act of insolvency, the bank shall take all actions which it deems necessary or appropriate to liquidate permitted investment and collateral in connection with such transaction and shall make a reasonable effort for two business days (Replacement Period) to apply the proceeds thereof to the purchase of securities identical to the loaned securities not returned. If during the Replacement Period the collateral liquidation proceeds are insufficient to replace any of the loaned securities not returned, the bank shall, subject to payment by the City of the amount of any losses on any permitted investments, pay such additional amounts as necessary to make such replacement. Under the provisions of the SLP, and in accordance with the California Government Code, no more than 20% of the market value of the General Investment Pool (the Pool) is available for lending. The City receives cash as collateral on loaned securities, which is reinvested in securities permitted under the Policy. In accordance with the California Government Code, the securities lending agent marks to market the value of both the collateral and the reinvestments daily. Except for open loans where either party can terminate a lending contract on demand, term loans have a maximum life of 90 days. Earnings from securities lending accrue to the Pool and are allocated on a pro-rata basis to all Pool participants
105 NOTES TO THE BASIC FINANCIAL STATEMENTS Fiscal Year Ended June 30, 2008 NOTE 4 DETAILED NOTES ON ALL FUNDS (Continued) At June 30, 2008, the assets and liabilities arising from the reinvested cash collateral were recognized in the respective participants financial statements. During the fiscal year, collateralizations on all loaned securities were compliant with the required 102% of market value. The City can sell collateral securities only in the event of borrower default. The lending agent provides indemnification for borrower default. There were no violations of legal or contractual provisions and no borrower or lending agent default losses during the year. There was no credit risk exposure to the City because the amounts owed to the borrowers exceeded the amounts borrowed. Loaned securities are held by the City s agents in the City s name and are not subject to custodial credit risk. Other Investments Other deposits and investments maintained outside the City Treasury are invested pursuant to policies adopted by the boards of commissioners of the City s pension systems and Water and Power, governing bond covenants or California Government Code provisions. Investments made under these provisions are reported as follows. Investments are stated at fair value. Pensions and other postemployment benefits investments are reported in accordance with GASB Statement Nos. 25 and 43, respectively. Real estate investments are recorded in the financial statements under the equity method, and are carried at lower of cost or market value. Investments denominated in foreign currencies are translated to the U.S. dollar at the rate of exchange in effect at the statement of net assets date, with resulting gains and losses recorded in the statement of changes in fiduciary net assets. The stated fair value of securities investments are generally based on published market prices or quotations from major investment dealers. Real estate values are taken from recent appraisals, purchase prices and reports of investment advisors. The fair values of venture capital and alternative investments are estimated based on audited financial statements provided by the individual fund managers. The City s other investments as of June 30, 2008 are as follows (in thousands): Department of Water and Power $ 875,324 Fire and Police Pension and Health Subsidy Plans 17,482,466 Los Angeles City Employees' Retirement and Postemployment Healthcare Plans 12,473,640 Water and Power Employees' Retirement, Disability, and Death Benefit Insurance; and Retiree Health Benefits Plans 8,685,954 Others 351,678 Total $ 39,869,
106 NOTES TO THE BASIC FINANCIAL STATEMENTS Fiscal Year Ended June 30, 2008 NOTE 4 DETAILED NOTES ON ALL FUNDS (Continued) Department of Water and Power The City Charter grants the Board of Water and Power Commissioners control over the investments of all financial assets of the Department of Water and Power (DWP). The $875.3 million investments not included in the City s investment pool program are as follows (in thousands): Power Water Total Debt reduction trust funds $ 528,988 $ -- $ 528,988 Nuclear decommissioning trust fund 110, ,234 Natural gas trust fund 25, ,133 SCPPA Palo Verde investment 34, ,594 Power Rate Stabilization Fund 24, ,397 Water expense stabilization fund -- 36,569 36,569 DWP securities lending program 115, ,409 Total $ 838,755 $ 36,569 $ 875,324 At June 30, 2008, the investments of the Power and Water Enterprise Funds outside of the City s investment pool programs and their maturities are as follows (in thousands): Type of Investments Investment Maturities 1 to to to Days Over Amount Days Days Days To 5 Years 5 Years U.S. Agencies $ 421,953 $ 8,739 $ 11,766 $ 67,467 $ 277,162 $ 56,819 Medium Term Notes 184,853 4,999 32,551 88,465 58, Commercial Paper 69,294 51, , Banker's Acceptances 1,998 1, Negotiable Certificates of Deposit 44,217 13,200 2,000 29, Money Market Funds 3,006 3, Securities Lending Cash Collateral Repurchase Agreements 86,000 86, Commercial Paper 15,936 15, Money Market Funds 13,473 13, SCPPA Palo Verde Investment 34,594 34, Total $ 875,324 $ 233,227 $ 46,317 $ 202,961 $ 336,000 $ 56,819 Interest Rate Risk. DWP s investment policy limits the maturity of its investments to a maximum of 30 years for U.S. government agency securities; 5 years for medium-term corporate notes; 270 days for commercial paper; 397 days for negotiable certificates of deposits; 180 days for banker s acceptances; and 45 days for repurchase agreements purchased with cash collateral from securities lending agreements
107 NOTES TO THE BASIC FINANCIAL STATEMENTS Fiscal Year Ended June 30, 2008 NOTE 4 DETAILED NOTES ON ALL FUNDS (Continued) Credit Risk. Under its investment policy and the State of California Government Code, DWP is subject to prudent investor standard of care in managing all aspects of its portfolios. The prudent investor standard requires that DWP shall act with care, skill, prudence, and diligence under the circumstances then prevailing, including, but not limited to, the general economic conditions and the anticipated needs of the agency, which a prudent person acting in a like capacity and in familiarity with those matters would use in the conduct of funds of a like character and with like aims, to safeguard the principal and maintain the liquidity needs of the agency. The U.S. government agency securities in the portfolio consist of securities issued by governmentsponsored enterprises, which are not explicitly guaranteed by the U.S. government. As of June 30, 2008, the U.S. government agency securities in the portfolio carried the highest possible credit rating by the Nationally Recognized Statistical Rating Organizations (NRSRO s) that rated them. DWP s investment policy specifies that medium-term corporate note must be rated in a rating category of A or its equivalent or better by a NRSRO. As of June 30, 2008, DWP s investments in corporate notes were rated as follows: $25.2 million was rated AAA, $75.1 million was rated AA, and $84.5 million was rated A by at least one NRSRO. DWP s investment policy specifies that commercial paper must be of the highest ranking or of the highest letter and number rating as provided for by at least two NRSROs. As of June 30, 2008, all of DWP s investments in commercial paper were rated with at least the highest letter and number rating as provided by at least two NRSROs. DWP s investment policy specifies that negotiable certificates of deposit must be of the highest ranking or letter and number rating as provided for by at least two NRSROs. As of June 30, 2008, all of DWP s investments in negotiable certificates of deposit were rated with at least the highest letter and number rating as provided by at least two NRSROs. DWP s investment policy specifies that money market funds may be purchased as allowed under the State of California Government Code ( Code ), which requires that the fund must have either 1) attained the highest ranking or highest letter and numerical rating provided by not less than two nationally recognized statistical rating organizations ( NRSRO ), or 2) retained an investment advisor registered or exempt from registration with the Securities and Exchange Commission with not less than five years experience managing money market mutual funds with assets under management in excess of $500 million. As of June 30, 2008, the money market funds in the portfolios have attained the highest possible ratings by three NRSROs specifically AAAm by S&P, Aaa by Moody s, and AAA by Fitch. Concentration of Credit Risk. DWP s investment policy specifies that there is no percentage limitation on the amount that can be invested in U.S. government agency securities, except that a maximum of 30 percent of the cost value of the portfolio may be invested in the securities of any single U.S. government agency issuer. Of DWP s total investments as of June 30, 2008, $136.2 million (16%) was invested in securities issued by the Federal Home Loan Bank; $108.8 million (12%) was invested in securities issued by the Federal National Mortgage Association; and $148.2 million (17%) was invested in securities issued by the Federal Home Loan Mortgage Corporation
108 NOTES TO THE BASIC FINANCIAL STATEMENTS Fiscal Year Ended June 30, 2008 NOTE 4 DETAILED NOTES ON ALL FUNDS (Continued) For overnight or open repurchase agreements, DWP s securities lending policy does not limit the percentage of cash collateral that may be invested with one particular counterparty. Of DWP s total investments as of June 30, 2008, cash collateral received from securities lending transactions of $85 million (10%) was invested in an overnight repurchase agreement with Morgan Stanley and $5 million (1%) was invested in a medium-term corporate note issued by Morgan Stanley for a total investment of $90 million (11%) in securities issued by Morgan Stanley. DWP Securities Lending Program. DWP s securities lending cash collateral investment policy specifies that repurchase agreement transactions shall be limited to broker/dealers or banks for which a securities lending line has been approved by the securities lending agent. Approved counterparties must be primary dealers in U.S. government securities that work directly with the Federal Reserve Bank of New York. Repurchase agreements must be adequately collateralized based on the margin requirements for the type of security listed in the investment policy. As of June 30, 2008, the counterparty to the repurchase agreement was an approved primary dealer rated with the highest short-term ratings as provided by two NRSROs. The collateral for the repurchase agreement consisted of mortgage-backed securities issued by U.S. government agencies that had minimum credit ratings of AAA with a margin of 102% of the repurchase agreements. DWP s securities lending cash collateral investment policy specifies that commercial paper must be of the highest ranking or of the highest letter and number rating as provided for by at least two NRSROs. As of June 30, 2008, all of the commercial paper purchased with cash collateral had the highest rating provided by two NRSROs. DWP s securities lending cash collateral investment policy specifies that money market funds may be purchased with cash collateral as allowed under the Code. As of June 30, 2008, the money market fund purchased with cash collateral was in compliance with the Code by having attained the highest possible ratings by three NRSROs, specifically AAAm by S&P, Aaa by Moody s, and AAA by Fitch. Fire and Police Pension and Health Subsidy Plans At June 30, 2008, the Fire and Police Pension and Health Subsidy Plans (Pensions) investments are as follows (in thousands): Pension Health Subsidy Investment Type Plan Plan Total Short-term Investments $ 592,016 $ 32,034 $ 624,050 U.S. Government Obligations 1,321,650 71,513 1,393,163 Domestic Corporate Bonds 1,737,183 93,997 1,831,180 International Bonds 31,352 1,696 33,048 Domestic Stocks 5,519, ,671 5,818,459 International Stocks 2,748, ,728 2,897,399 Real Estate 1,223,473 66,201 1,289,674 Alternative Investments 1,007,954 54,539 1,062,493 Securities Lending Collateral 2,402, ,023 2,533,000 Total $ 16,585,064 $ 897,402 $ 17,482,
109 NOTES TO THE BASIC FINANCIAL STATEMENTS Fiscal Year Ended June 30, 2008 NOTE 4 DETAILED NOTES ON ALL FUNDS (Continued) Interest Rate Risk. Pensions manages its exposure to interest rate risk by requiring fixed income managers to maintain the effective duration of their portfolio within a specified range of the Lehman Brothers Aggregate Index for core fixed income investments, the Lehman Brothers Long Term Government/Corporate Index for long duration investments, and the First Boston High Yield Index for high yield investments. The longer the duration, the greater the sensitivity to interest rate changes. Information about the sensitivity of Pensions investments to interest rate fluctuations is provided in the following table that shows the weighted average effective duration of Pensions fixed income investments by investment type (in thousands): Weighted Average Effective Duration Investment Type Amount (In Years) Asset Backed Securities $ 37, Commercial Mortgages 124, Corporate Bonds 922, Government Agencies Bonds 49, Government Bonds 297, Government Mortgage Backed Securities 399, Index Linked Government Bonds 667, Nongovernment Backed Collateralized Mortgage Obligations 9, Bond Index Fund 749, Total $ 3,257,392 Investments that are highly sensitive to interest rate risk at June 30, 2008 are as follows (in thousands): Investment Type Amount Asset Backed Securities $ 37,677 Commercial Mortgages 124,835 Government Agencies Bonds 49,662 Government Mortgage Backed Securities 399,342 Index Linked Government Bonds 667,107 Nongovernment Backed Collateralized Mortgage Obligations 9,801 Total $ 1,288,
110 NOTES TO THE BASIC FINANCIAL STATEMENTS Fiscal Year Ended June 30, 2008 NOTE 4 DETAILED NOTES ON ALL FUNDS (Continued) Credit Risk. Pensions seeks to maintain a diversified portfolio of fixed income securities in order to obtain the highest total return at an acceptable level of risk within this asset class. As of June 30, 2008, the quality ratings of Pensions fixed income investments are as follows (dollars in thousands): Quality Rating Amount Percentage AAA $ 1,103, % AA 53, % A 107, % BBB 213, % BB 141, % B 180, % CCC 74, % CC 2, % Not Rated 911, % Subtotal 2,789, % U.S. Government Issued or Guaranteed Securities 468,100 Total Fixed Income Investments $ 3,257,392 Concentration of Credit Risk. As of June 30, 2008, Pensions investment portfolio has no concentration of investments of 5% or more of the total investment portfolio in any one entity except those issued or guaranteed by the U.S. Government. Custodial Credit Risk. Custodial credit risk for deposits is the risk that, in the event of a financial failure of a depository financial institution, Pensions deposits and collateral securities in the possession of an outside party would not be recoverable. Deposits are exposed if they are not insured or are not collateralized. As of June 30, 2008, Pensions exposure to such risk was $42 million comprised of foreign currencies held outside the custodial bank. For investment securities, custodial risk is the risk that, in the event of the failure of the counterparty, Pensions will not be able to recover the value of its investments or collateral securities that are in the possession of an outside party. Investment securities are exposed to custodial risk if they are not insured, or not registered in Pensions name, and held by the counterparty. Pensions investments are not exposed to custodial risk since they are held by the custodial and registered in the Pensions name. As of June 30, 2008, Pensions other investments are exposed to custodial risk such as hedge fund of $460.8 million, private equity of $601.7 million, and commingled real estate fund of $424.8 million
111 NOTES TO THE BASIC FINANCIAL STATEMENTS Fiscal Year Ended June 30, 2008 NOTE 4 DETAILED NOTES ON ALL FUNDS (Continued) Foreign Currency Risk. The Pensions asset allocation policy sets a target of 18% of the total portfolio for non-u.s. equity investments. The majority of Pensions currency exposure comes from its holdings of foreign stocks. Pensions foreign investment holdings, including foreign currencies in temporary investments at June 30, 2008 are as follows (in thousands): Foreign Currency Amount Australian Dollar $ 132,664 Brazilian Real 77,054 British Pound Sterling 465,378 Canadian Dollar 70,642 Chilean Peso 508 Czech Koruna 24,896 Danish Krone 24,090 Egyptian Pound 7,247 Euro Currency Unit 921,773 Hong Kong Dollar 82,989 Hungarian Forint 10,971 Indonesian Rupiah 20,886 Japanese Yen 602,632 Malaysian Ringgit 6,691 Mexican Peso 14,404 New Israeli Shekel 11,194 New Taiwan Dollar 47,044 New Zealand Dollar 7,428 Norwegian Krone 27,019 Polish Zloty 13,284 Singapore Dollar 13,882 South African Rand 24,431 South Korean Won 55,966 Swedish Krona 43,996 Swiss Franc 201,216 Thai Baht 11,648 Turkish New Lira 8,445 United Arab Emirates Dirham 2,069 Total $ 2,930,447 Securities Lending Transactions. Pensions has entered into various short-term arrangements with its custodian, whereby investments are loaned to various brokers, as selected by the custodian. The lending arrangements are collateralized by cash, letters of credit and marketable securities, held on Pensions behalf by the custodian. These agreements provide for the return of the investments and for a payment of a fee when the collateral is marketable securities or letters of credit, or interest earned when the collateral is cash on deposit
112 NOTES TO THE BASIC FINANCIAL STATEMENTS Fiscal Year Ended June 30, 2008 NOTE 4 DETAILED NOTES ON ALL FUNDS (Continued) Upon direction of the Pensions Board, the custodian may loan securities to brokers or dealers or other borrowers upon such terms and conditions, as it deems advisable. The minimum required collateralization is 102% of market value plus any accrued interest of the borrowed U.S. securities and 105% of market value plus any accrued interest for non-u.s. securities. At year-end, Pensions had no credit risk exposure to borrowers because the amounts Pensions owes the borrowers exceed the amounts the borrowers owe Pensions. Borrowers of Pensions securities have all incidents of ownership with respect to borrowed securities and collateral including the right to vote and transfer or loan borrowed securities to others. Pensions is entitled to receive all distributions, which are made by the issuer of the borrowed securities, directly from the borrower. Under the lending agreements, the custodian will indemnify Pensions as a result of the custodian s failure to: (1) make a reasonable determination of the creditworthiness of a potential borrower before lending and, during the term of the loan or loans, the borrower files a petition for bankruptcy or similar action, (2) demand adequate collateral, or (3) otherwise maintain the securities lending program in compliance with the Federal Financial Institutions Examinations Council Supervisory Policy on Securities Lending. Los Angeles City Employees Retirement and Postemployment Healthcare Plans At June 30, 2008, the Los Angeles City Employees Retirement and Postemployment Healthcare Plans (LACERS) investments are as follows (in thousands): Investment Type Postemployment Retirement Healthcare Plan Plan Total Short-term Investments (non-u.s. of $326,807) $ 395,608 $ 56,142 $ 451,750 Commercial Paper 157,614 22, ,982 Futures Initial Margin 13,484 1,914 15,398 U.S. Government/Agencies Securities 294,760 41, ,590 Municipal Bonds 1, ,192 Domestic Corporate Bonds 837, , ,621 International Bonds 163,622 23, ,842 Opportunistic Debt 90,381 12, ,207 Domestic Stocks 3,410, ,960 3,894,200 International Stocks 1,917, ,064 2,189,167 Mortgages 733, , ,061 Real Estate 556,071 78, ,985 Venture Capital and Alternative Investments 763, , ,722 Security Lending Collateral 1,589, ,554 1,814,923 Total $ 10,923,451 $ 1,550,189 $ 12,473,640 Interest Rate Risk. LACERS manages its exposure to interest rate risk by requiring the fixed income investment managers to maintain their portfolio effective duration within a specified range of the Lehman U.S. Universal Bond Index, the Lehman Intermediate Government Credit Index, or the Lehman Aggregate Bond Index, depending on the LACERS Board s mandate. The effective duration is a measure, in years, of interest rate sensitivity in debt investments
113 NOTES TO THE BASIC FINANCIAL STATEMENTS Fiscal Year Ended June 30, 2008 NOTE 4 DETAILED NOTES ON ALL FUNDS (Continued) Information about the sensitivity of the fair values of LACERS investments to market interest rate fluctuations is provided by the following table that shows the weighted average effective duration of fixed income investments (in thousands): Investment Type Amount Weighted Average Effective Duration (In Years) Asset Backed Securities $ 50, Commercial Mortgage Backed Securities 121, Corporate Bonds 971, Government Agencies 110, Government Bonds 239, Government Mortgage Backed Securities 714, Government-Issued Commercial Mortgage Backed Securities Index Linked Government Bonds 28, Municipal/Provincial Bonds 2, Nongovernment Backed Collateralized Mortgage Obligations 77, Opportunistic Debt 103, Total $ 2,421,513 Credit Risk. LACERS seeks to maintain a diversified portfolio of fixed income investments in order to obtain the highest total return for the fund at an acceptable level of risk within this asset class. The credit quality ratings in fixed income securities by a nationally recognized statistical rating organization as of June 30, 2008 are as follows (in thousands): Credit Rating Amount Percentage AAA $ 1,017, % AA 70, % A 268, % BBB 334, % BB 120, % B 100, % CCC 23, % Not Rated 215, % Subtotal 2,151, % U.S. Government Guaranteed Securities 270,292 Total Fixed Income Investments $ 2,421,513 Concentration of Credit Risk. LACERS investment portfolio as of June 30, 2008 has no concentration of investments in any one entity that represented 5% or more of the total investment portfolio
114 NOTES TO THE BASIC FINANCIAL STATEMENTS Fiscal Year Ended June 30, 2008 NOTE 4 DETAILED NOTES ON ALL FUNDS (Continued) Custodial Credit Risk. Custodial credit risk for deposits is the risk that, in the event of a financial failure of depository financial institution, LACERS would not be able to recover its deposits or would not be able to recover collateral securities that are in the possession of an outside party. Deposits are exposed to custodial credit risk if they are not insured or are not collateralized. As of June 30, 2008, LACERS has exposure to such risk in the amount of $14.1 million or 0.63% of the fair value of the total international investments. The amount represents non-invested cash denominated in foreign currencies, managed by 14 different investment managers, and held outside of LACERS custodial bank. LACERS policy requires each individual publicly traded equities investment managers to hold no more than 10% of their portfolios in the form of cash. LACERS is in compliance with the policy. Custodial credit risk for investments is the risk that, in the event of the failure of the counterparty to a transaction, LACERS would not be able to recover the value of the investment or collateral securities that are in the possession of an outside party. Investment securities are exposed to custodial credit risk if the securities are not insured, or are not registered in LACERS name, and held by the counterparty. LACERS investments are not exposed to custodial credit risk if they are insured or registered in LACERS name. LACERS investments are not exposed to custodial credit risk since all securities are held by LACERS custodial bank in LACERS name. Foreign Currency Risk. The Asset Allocation policy of LACERS sets a target of 20% of the total portfolio for foreign investments in equities. In addition, fixed income, real estate and alternative investment managers may hold foreign investments depending on their individual mandates. Forward currency contracts and currency futures are permitted primarily to reduce the foreign currency risk. Non-U.S. investment holdings as of June 30, 2008, which represents 19% of fair value of total investments, are as follows (in thousands): Foreign Currency Amount Argentine Peso $ 365 Australian Dollar 111,528 Brazilian Real 10, 486 British Pound Sterling 358, 469 Canadian Dollar 59, 249 Chilean Peso 1, 968 Czech Koruna 988 Danish Krone 21, 128 Egyptian Pound 769 Euro Currency Unit 691,609 Hong Kong Dollar 96, 415 Hungarian Forint 1, 447 Indian Rupee 14, 849 Indonesian Rupiah 6,164 Japanese Yen 364,337 Malaysian Ringgit 13, 231 Mexican Peso 22, 146 New Israeli Shekel 1, 822 New Taiwan Dollar 50,762 New Zealand Dollar 761 Subtotal Forwarded $ 1,828,
115 NOTES TO THE BASIC FINANCIAL STATEMENTS Fiscal Year Ended June 30, 2008 NOTE 4 DETAILED NOTES ON ALL FUNDS (Continued) Foreign Currency Amount Subtotal Forwarded $ 1,828,493 Norwegian Krone 42,680 Peruvian Nuevo Sol 513 Philippine Peso 23,012 Polish Zloty 8,365 Russian Ruble 544 Singapore Dollar 63,235 South African Rand 15,531 South Korean Won 64,634 Swedish Krona 24,482 Swiss Franc 145,186 Thai Baht 28,558 Turkish New Lira 3,333 Total $ 2,248,566 Highly Sensitive Investments. Highly sensitive investments are certain debt investments whose terms may cause their fair value to be highly sensitive to market interest rate changes. Terms include such information as embedded options, coupon multipliers, benchmark indexes, and reset dates. The asset-backed investments of LACERS have embedded prepayment options that will typically cause prepayments by the obligees of the underlying investments when interest rates fall. Prepayments eliminate the stream of future interest payments and, therefore, diminish the fair value of the asset-backed investment. As of June 30, 2008, the fair value of LACERS asset-backed investments by investment type are as follows (in thousands): Type of Investment Amount Asset Backed Securities $ 50,679 Commercial Mortgage Backed Securities 121,874 Government Agencies 110,870 Government Mortgage Backed Securities 714,995 Government Issued Commercial Mortgage Backed Securities 191 Nongovernment Backed Collateralized Mortgage Obligations 77,263 Total $ 1,075,872 Securities Lending Transactions. The LACERS has entered into various short-term arrangements with its custodian whereby securities are loaned to various brokers. The custodian determines which lenders accounts to lend securities from, by using an impartial sequential system that matches loan requests with various lenders accounts. All lenders are deemed to have relatively equal opportunity to profit from the lending of securities. Therefore, should a collateral deficiency occur beyond the custodian s responsibilities, the deficiency is allocated pro rata among all lenders
116 NOTES TO THE BASIC FINANCIAL STATEMENTS Fiscal Year Ended June 30, 2008 NOTE 4 DETAILED NOTES ON ALL FUNDS (Continued) Minimum required collateralization is 102% of fair value of the borrowed U.S. securities and 105% for international securities. Collateral consists of cash, government securities and irrevocable bank letters of credit. The cash collateral may be invested separately or pooled in a separate fund for investing in money market or cash equivalent investments. LACERS cannot pledge or sell noncash collateral unless the borrower defaults. The cash collateral values of securities on loan to brokers are shown at fair value in the statement of fiduciary net assets. During the fiscal year, LACERS had no losses due to borrower default. There was no credit risk exposure at year-end because the amounts owed the borrowers exceeded the amounts the borrowers owed LACERS. Water and Power Employees Retirement, Disability, and Death Benefit Insurance; and Retiree Health Benefits Plans At June 30, 2008, the Water and Power Employees Retirement, Disability, and Death Benefit Insurance; and Retiree Health Benefits Plans (DWP Plans) investments are as follows (in thousands): Investment Type Retirement, Disability, and Retiree Death Benefit Health Benefits Insurance Plan Plan Total Domestic Stocks $ 2,696,035 $ 408,417 $ 3,104,452 International Stocks 1,329, ,329,345 Mortgage and Asset Backed Securities 1,320, ,744 1,544,230 Domestic Corporate Debts 609,170 55, ,030 International Corporate Debts 6, ,730 Municipal Bonds 4, ,341 Medium Term Notes 35,782 3,631 39,413 Preferred Securities/Convertible Bonds 11, ,763 Hedge Funds 117, ,780 Real Estate 123, ,299 U.S. Agencies and Other General Obligations 15,984 1,184 17,168 U.S. Treasuries 506,223 43, ,762 Money Market Mutual Funds 370,038 16, ,519 Securities Lending Short-term Collateral Investment Pool 746,102 40, ,122 Total $ 7,893,078 $ 792,876 $ 8,685,
117 NOTES TO THE BASIC FINANCIAL STATEMENTS Fiscal Year Ended June 30, 2008 NOTE 4 DETAILED NOTES ON ALL FUNDS (Continued) Interest Rate Risk. As of June 30, 2008, the Plans exposure to interest rate risk is as follows (amounts in thousands): Investment Type Amount Weighted Average Maturity (Y ears) Mortgage and Asset Backed Securities $ 1,544, Domestic Corporate Debts 665, U.S. Treasuries 511, Mutual Funds 386, Medium Term Notes 39, U.S. Treasury TIPS 38, U.S. Agency Notes 17, Preferred Securities/ Convertible Bonds 11, International Corporate Debts 6, Municipal Bonds 4, Total $ 3,224, The Plans have a long-term investment horizon and utilize an asset allocation, which encompasses a long-run perspective of capital markets. The Plans maintain the interest rate risk consistent with its long-term investment horizon. Credit Risk. The Plans investment policy is to apply the prudent-person standards. Investments are made with care, skill, prudence, and diligence under the circumstances then prevailing that a prudent person acting in a like capacity and familiar with such matters would use in the conduct of an enterprise of a like character and with like aims. The Plans investment policy has been designed to produce the most favorable long-term total portfolio return consistent with reasonable levels of risks. Prudent risk-taking is warranted within the context of overall portfolio diversification. The Plans investment policy for fixed income allows investment grade and high yield securities with minimum credit ratings of BBB- or Baa3 by Moody s, S&P and Fitch. Investment managers shall notify the plans management of subsequent declines in ratings and shall develop an investment strategy for investments rated below Baa3 or BBB-. Active high yield fixed income investments are composed primarily of non-investment grade securities. If a bond is rated by all three rating agencies (Moody s, S&P and Fitch) then it must be graded BB or Ba1 by at least two rating agencies. If a bond is rated by two rating agencies, it must be rated below investment-grade by at least one rating agency
118 NOTES TO THE BASIC FINANCIAL STATEMENTS Fiscal Year Ended June 30, 2008 NOTE 4 DETAILED NOTES ON ALL FUNDS (Continued) The credit quality ratings of the Plans investments at June 30, 2008 are as follows (in thousands): Credit Rating Amount Percentage AAA $ 655, % A or better 242, % BBB 1, % BB or better 11, % B or better 371, % C or better 39, % Not Rated 1,336, % Subtotal 2,658, % U.S. Government Guaranteed Securities 566,930 Total Fixed Income Investments $ 3,224,956 Concentration of Credit Risk. According to the Plans investment policy, except for investment in fixed income asset class where no more than 10% of investments shall be invested in any one issue, no more than 5% of investments shall be invested in any one issue. United States Treasury and United States Agency issues are exempted from this limitation. As of June 30, 2008, there are no investment holdings of more than 5% in any one issue in each of the plan s net assets or in the Plans aggregate, except investments issued or guaranteed by the U.S. Government and investments in commingled funds. Foreign Currency Risk. The Plans investment policy permits a maximum of 15% of the total portfolio for investments in foreign currency-denominated securities. As of June 30, 2008, the Plans position is 8.14% as follows (in thousands): Foreign Currency Amount Australian Dollar $ 12,624 Brazilian Real 1,762 British Pound Sterling 133,319 Canadian Dollar 20,193 Columbian Peso 184 Danish Krone 5,634 Euro Currency Unit 217,672 Hong Kong Dollar 21,934 Indonesian Rupiah 2,056 Japanese Yen 184,133 Mexican Peso 3,412 New Zealand Dollar 325 Norwegian Krone 5,667 South African Rand 572 Subtotal Forwarded $ 609,
119 NOTES TO THE BASIC FINANCIAL STATEMENTS Fiscal Year Ended June 30, 2008 NOTE 4 DETAILED NOTES ON ALL FUNDS (Continued) Foreign Currency Amount Subtotal Forwarded $ 609,487 Singapore Dollar 5,298 Swedish Krona 22,959 Swiss Franc 68,879 Uruguayan Peso 421 Total $ 707,044 Securities Lending Transactions. The Plans custodial bank manages its securities lending. The Plans or the borrowers can terminate the contract with advance notice. The lending arrangements are collateralized by cash and marketable securities (guaranteed by the full faith and credit of the U.S. Government) at (i) 102% with respect to U.S. securities; (ii) 105% with respect to foreign securities; or (iii) a percentage mutually agreed of the underlying securities market value. These arrangements provide for the return of the investments and a share of the interest earned on the collateral. The securities on loan to brokers remain the property of the Plans and continue to be included in their respective accounts on the statement of plan net assets. At year-end, the Plans had no credit risk exposure to borrowers because the amounts the Plans owed the borrowers exceeded the amounts the borrowers owed the Plans. During the year, the Plans did not incur losses due to borrowers default. The Plans custodian is the authorized agent to handle the Plans securities lending activity. The custodian may invest the cash collateral received in connection with loaned securities in investments permitted by the Plans. The Plans bears sole risk of all losses of the invested collateral, including losses incurred in the event of liquidation of the permitted investments. The custodial bank is responsible for the return of loaned securities from the borrowers. The Plans do not have the ability to pledge or sell collateral assets unless the borrower is in default of its obligation. In lending domestic securities, cash collateral is invested in the lending agent s shortterm investment pool, which at June 30, 2008, has an average maturity of 20 days. Others Other investments are generally those required to be deposited in accounts established under various bond indentures and will be held, invested and reinvested by the trustees/fiscal agents in permitted investments as defined in the indentures. Investment maturities are scheduled to coincide with bond retirement and interest payments. At June 30, 2008, other investments are as follows (in thousands): Type of Investments Investment Maturities 1 to to to Days Amount Days Days Days To 5 Years U.S. Treasury Notes $ 36,140 $ 8,041 $ -- $ 16,082 $ 12,017 U.S. Treasury Bills 26,397 26, U.S. Government Agencies 11,077 5, , Mutual Funds 124, , Money Market Funds 119, , Short-term Investment Funds Guaranteed Investment Contracts 33, ,503 Total $ 351,678 $ 284,679 $ -- $ 21,479 $ 45,
120 NOTES TO THE BASIC FINANCIAL STATEMENTS Fiscal Year Ended June 30, 2008 NOTE 4 DETAILED NOTES ON ALL FUNDS (Continued) Credit Risk. At June 30, 2008, the investments in mutual and money market funds have attained the highest possible ratings as follows: AAAm by S&P and Aaa by Moody s. The short-term investment funds and guaranteed investment contracts were not rated. Community Redevelopment Agency At June 30, 2008, cash and investments of the CRA are as follows (in thousands): Deposits Investments Total Cash and Pooled Investments $ 7,302 $ 130,657 $ 137,959 Other Investments , ,011 Restricted Assets , ,394 Total $ 7,302 $ 638,062 $ 645,364 The CRA s deposits are maintained with various banks within redevelopment project areas or banks that benefit redevelopment activities. At June 30, 2008, the book balance of the deposits was $7.3 million while the bank balances totaled $16.2 million. The difference of $8.9 million represents primarily outstanding checks and other reconciling items. Of the bank balance, $0.2 million was covered by Federal depository insurance and $16 million was fully collateralized as required by State law and reported to the State Administrator of Local Agency Security to ensure the safety of public deposits. State law requires a financial institution to secure deposits in excess of $100,000 made by state or local government units by pledging government securities or first trust deed mortgage notes. The market value of the pledged government securities and first trust deed mortgage notes must be at least 110% and 150% of the deposits, respectively. The collateral is held by the pledging financial institution s trust department and is considered held in the CRA s name. The CRA s investments at June 30, 2008 consist of the following investment types (in thousands): Weighted Average Maturity Investment Type Amount (Years) Investments Held by the CRA Treasury Securities $ 36, Federal Securities 442, Commercial Paper 9, Local Agency Investment Fund 67, Certificates of Deposits 100 N/A Subtotal 555,688 Investments Held by Fiscal Agent or Trustee Treasury Securities 79, Repurchase Agreement 3, Subtotal 82,374 Total $ 638,062 Portfolio weighted average maturity for investments held by the CRA
121 NOTES TO THE BASIC FINANCIAL STATEMENTS Fiscal Year Ended June 30, 2008 NOTE 4 DETAILED NOTES ON ALL FUNDS (Continued) The CRA s general investment policy is to apply the prudent-person rule. Investments are made as a prudent person would exercise in the management of his own affairs, not for speculation, but for investment considering the general economic conditions and the anticipated needs of the agency. The objective is to minimize the interest rate risk and credit risk of each investment. In addition, in order to minimize the total volatility of the portfolio, the CRA shall maintain a diversified portfolio of investments. Interest Rate Risk. The CRA manages its exposure to declines in fair values by limiting the weighted average maturity of its investment portfolio to not more than two years, excluding those investments held by trustees, fiscal agents or escrow banks in connection with a CRA bond, note or certificate of participation issue. Credit Risk. Under the California Government code, investments in commercial paper are limited to ratings of A-1 or higher by NRSROs. At June 30, 2008, the CRA s investments in commercial paper are rated A-1 or better. The State of California administered LAIF is not rated. During the year, the CRA recorded an allowance for default on certain commercial paper investments totaling $4 million in principal and interest due on October 4, These investments, at the time of purchase were rated A-1+. However, they were subsequently frozen by the trustee bank due to a failed key collateral test by the commercial paper issuer causing nonpayment of principal and interest due to investors. Investors have been informed that a restructuring of the commercial paper is in process. Local Agency Investment Fund As of June 30, 2008, the CRA s investments in the State of California Local Agency Investment Fund (LAIF) total $67.3 million, while the City has minimal amount invested. The total amount invested by all public agencies in LAIF at that date is $25.2 billion. The LAIF is part of the State s Pooled Money Investment Account (PMIA). As of June 30, 2008, the investments in the PMIA totaled $70 billion, of which 85.3% is invested in non-derivative financial products and 14.7% in structured notes and asset-backed securities. The Local Investment Advisory Board (the Board) has oversight responsibility for LAIF. The Board consists of five members as designated by State statute. The Pooled Money Investment Board whose members are the State Treasurer, Director of Finance, and State Controller, has oversight responsibility for PMIA. The value of the pool shares in LAIF, which may be withdrawn at any time, is determined on a historical cost basis, which is different than the fair value of the City s and CRA s position in the pool. Futures and Forward Contracts LACERS and Pensions use derivative financial instruments primarily to manage portfolio risk. Futures contracts are used to provide equity exposure for uninvested cash, and forward contracts are used to hedge against fluctuation in foreign currency denominated assets primarily in trade settlements. Futures and forward contracts are marked to market and are recorded in the statement of plan net assets at fair value. Futures contracts have little credit risk, as organized exchanges are the guarantors. Forward agreements are subject to the creditworthiness of the counterparties, which are principally large financial institutions. Due to the level of risk associated with derivative instruments, it is reasonably possible that changes in the values of these investments will occur in the near term and that such changes could materially affect the amount reported in the financial statements
122 NOTES TO THE BASIC FINANCIAL STATEMENTS Fiscal Year Ended June 30, 2008 NOTE 4 DETAILED NOTES ON ALL FUNDS (Continued) At June 30, 2008, LACERS had outstanding futures contracts for foreign currencies and the Standard and Poor s 500 Index with an aggregate notional amount of $13.6 million. In addition, at June 30, 2008, LACERS had outstanding forward purchase commitments with a notional amount of $108.1 million and offsetting forward sales commitments with notional amount of $108.1 million that expire through September LACERS maintains margin collateral on the positions with brokers, consisting of cash and U.S. Treasury Bills. The total collateral margin was $15.4 million as of June 30, The realized gain on foreign currency translation was $122 million for the year ended June 30, At June 30, 2008, Pensions had notional value of $129.5 million exposure in futures and forward contracts in foreign currency exchange transactions with an unrealized loss of $0.3 million. At June 30, 2008, Pensions held other futures and forward contracts with a notional value of $74.6 million with a minimal unrealized gain. Overdraft Limit The City has $100 million Authorized Overdraft Limit with a bank that maintains the City's operating account. At its sole discretion, the bank may allow an overdraft to occur in the City s account. Such overdraft, including any charges, must be repaid immediately without demand, except when the City and the bank agree otherwise or when the bank advises otherwise in writing
123 NOTES TO THE BASIC FINANCIAL STATEMENTS Fiscal Year Ended June 30, 2008 NOTE 4 DETAILED NOTES ON ALL FUNDS (Continued) B. Receivables Primary Government The primary government s net receivables at June 30, 2008 are as follows (in thousands): Governmental Business-type Activities Activities Gross Receivables Taxes $ 825,650 $ -- Accounts 739, ,280 Special Assessments 22, Investment Income 25,121 28,369 Intergovernmental 186, ,681 Loans and Notes 997,129 1,122,253 Total 2,795,724 2,116,583 Allowance for Uncollectibles Taxes (416,052) -- Accounts (514,466) (31,605) Special Assessments (2,299) -- Intergovernmental (42,216) -- Loans and Notes (698,587) (22) Total (1,673,620) (31,627) Net Receivables $ 1,122,104 $ 2,084,956 Net Receivables not scheduled for collection during the subsequent year: Accounts $ -- $ 116,333 Loans and Notes 274,357 1,108,147 Of the $416.1 million allowance for uncollectible taxes, $138.6 million relates to valuation allowance for estimated business taxes receivable. The majority of the governmental activities loans consist of grant funded loans provided as follows: a) to property owners for the upgrading and rehabilitation of residential or rental properties to eliminate the spread of slums and blight and repair earthquake damage; b) to businesses to carry out economic development projects; and c) to community based organizations to acquire, construct or improve existing public facilities. Interest rates ranged from 0.5% to 14% for interest bearing loans. The principal and interest are paid either monthly, quarterly, annually (amortizing loans), or when residual receipts are generated in accordance with the loan agreements (residual receipts loans), or deferred until maturity, transfer of title or sale of property occurs (deferred loans)
124 NOTES TO THE BASIC FINANCIAL STATEMENTS Fiscal Year Ended June 30, 2008 NOTE 4 DETAILED NOTES ON ALL FUNDS (Continued) The governmental activities loans include a $14 million HUD Section 108 loan provided to the CRA in fiscal year The CRA used the loan proceeds to partially fund the acquisition and relocation costs of a redevelopment project. The loan agreement allows CRA to assign the loan to the project developer. In September 2005, the assignment was effected. Although the loan was assigned to the developer, the CRA will maintain its pledge to the City of area-wide tax increment as security of the loan. However, the area-wide tax increment pledge is subordinate to existing and future lien bonds of the project area. The loan is further secured by an unconditional guaranty of payment not to exceed $12.3 million. A company that is a party related to the project developer issued the guaranty. The business-type activities loans include the Power Enterprise Fund s long-term notes of $1.12 billion from Intermountain Power Agency (see Note 5B on page 164), and $0.7 million long-term Harbor notes receivable. Component Unit The $109 million net receivables of the CRA at June 30, 2008 consisted of $22.4 million property taxes, $4.3 million intergovernmental, $2.2 million investment income, $79.4 million loans, and $0.7 million other. The CRA net loans receivable of $79.4 million reflected an allowance for market value write-down and uncollectibles of $512.8 million. To enhance the redevelopment process, the CRA grants below-market" interest rate loans primarily for the rehabilitation and development of low and moderate-income housing and the development of commercial properties. Since these loans are generated to assist various redevelopment areas, repayment terms are structured to meet requirements established by the CRA and the specific project areas. Deferred Receivables Governmental funds report deferred revenue in connection with receivables for revenues that are not considered to be available to liquidate liabilities of the current period. At June 30, 2008, the various components of deferred revenue reported in the governmental funds were as follows (in thousands): Taxes $ 222,244 Accounts 181,012 Intergovernmental 86,788 Special Assessments 2,374 Investment Income 2,267 Total Deferred Revenue for Governmental Funds $ 494,685 C. Loans Receivable from Component Unit The City has recorded non-interest bearing, no-fixed term loans of $50.7 million, and 20-year loans totaling $17.2 million. These loans are to be repaid by the CRA from certain sources such as tax increment revenues of the respective redevelopment projects as defined in the contracts, and applicable program income. The $17.2 million loans bear 5% interest with final maturity date of June
125 NOTES TO THE BASIC FINANCIAL STATEMENTS Fiscal Year Ended June 30, 2008 NOTE 4 DETAILED NOTES ON ALL FUNDS (Continued) Additionally, the City has recorded loans of $0.7 million with a 3% interest rate and $4.3 million with a 5.5% interest rate that will mature in April 2012 and December 2022, respectively. The $0.7 million loan is secured by site-specific tax increments that are subordinate to project area s bond and tax increment commitments. The $4.3 million promissory note will be repaid by making City approved block grant qualifying expenditures in the redevelopment project. The City s Special Parking Revenue Fund extended a loan of $1 million to the CRA for the design and construction of public parking spaces in the Beacon Street Redevelopment Project area. The loan matures in July Repayment of the loan will come from surplus profits as described in the development agreement or from tax increment revenues from the project area. If surplus profits are insufficient to repay the loan, the balance will be amortized over a ten-year period at the City s pooled fund interest rate. In February 2008, the City extended a float funded loan of $4.5 million to CRA that will act as a conduit to lend and provide assistance to a developer of a certain project. The float loan is a 30-month non-interest bearing note due in a single lump sum payment on August 14, The float loan is guaranteed by the CRA and will be paid with a pledge of $4.5 million project area tax increment funds. D. Restricted Assets The primary government s restricted assets are composed of the following at June 30, 2008 (in thousands): Governmental Business-type Activities Activities Total Cash and Investments Cash and Pooled Investments With City Treasurer $ 314 $ 1,952,540 $ 1,952,854 Other Investments 5, , ,038 Subtotal 6,175 2,768,717 2,774,892 Other Restricted Assets Investment Income Receivable -- 4,503 4,503 Passenger Facility Charge Receivable -- 18,368 18,368 Total $ 6,175 $ 2,791,588 $ 2,797,763 The restricted assets for governmental activities are related to the State mandated deposit with a trustee bank to finance solidwaste landfill closure and postclosure care costs, and donated resources for the renovation of the Griffith Observatory. For the business-type activities, the restricted amounts are for accumulated resources for debt service payments, nuclear decommissioning trust funds, collected but unexpended passenger facility charges and accrued interest thereon, a self-insurance reserve, deposits from service users, and retention guarantees from contractors. The restricted cash and investments are included in the discussion in Note 4A
126 NOTES TO THE BASIC FINANCIAL STATEMENTS Fiscal Year Ended June 30, 2008 NOTE 4 DETAILED NOTES ON ALL FUNDS (Continued) The CRA s restricted assets totaling $126.4 million consist primarily of investments maintained with fiscal agents that are pledged as collateral for the payment of principal and interest on tax allocation and parking revenue bonds. E. Joint Ventures Intermodal Container Transfer Facility Joint Powers Authority The harbor departments of the City of Los Angeles (the Harbor) and the City of Long Beach, California (Port of Long Beach) entered into a joint exercise of powers agreement to form the Intermodal Container Transfer Facility Joint Powers Authority (ICTF) for the purpose of financing and constructing a facility to transfer cargo containers between trucks and railroad cars. The Harbor contributed $2.5 million to the ICTF as part of the agreement. The facility, which began operations in December 1986, was developed by Southern Pacific Transportation Company (SPTC, subsequently wholly owned subsidiary of Union Pacific Corporation), which operates the facility under a long-term lease agreement. The Harbor appoints two members of the ICTF s fivemember governing board and accounts for its investment using the equity method. Both the Harbor and the Port of Long Beach share income and equity distributions equally. Pursuant to an indenture of trust dated November 1, 1984, the ICTF issued $53.9 million bonds (1984 Bonds) on behalf of the SPTC to construct the facility. In 1989, the ICTF issued $52.3 million refunding bonds (1989 Bonds) on behalf of SPTC to advance refund all of the 1984 Bonds. In 1999, the ICTF, on behalf of the SPTC, again issued $42.9 million refunding bonds (1999 Bonds) to advance refund all of the 1989 Bonds. The 1999 Bonds are payable solely from payments by the SPTC under the lease agreement for use of the facility. The nature of the bonds is such that the indebtedness is that of the SPTC and not of the ICTF, nor the Harbor, nor the Port of Long Beach. The ICTF s operations are financed by lease revenues. The ICTF is empowered to perform those acts necessary for the development of its facilities and related facilities, including acquiring, constructing, leasing, and selling any of its property. The Harbor s share of the ICTF s net assets at June 30, 2008 is $12.3 million. Separate financial statements for the ICTF may be obtained from the Executive Director, Port of Long Beach, 925 Harbor Plaza, Long Beach, California Alameda Corridor Transportation Authority In August 1989, the Harbor and the Port of Long Beach entered into a joint exercise of powers agreement and formed the Alameda Corridor Transportation Authority (ACTA) for the purpose of establishing a comprehensive transportation corridor and related facilities consisting of street and railroad rights-of-way, and an improved highway and railroad network along Alameda Street between the Santa Monica Freeway and the Ports of Los Angeles and Long Beach in San Pedro Bay linking the two ports to the central Los Angeles area. The Harbor and the Port of Long Beach share income and equity distributions equally. During fiscal year 1995, the Harbor and the Port of Long Beach purchased railroad rights-of-way and other assets totaling approximately $370 million along the proposed corridor route
127 NOTES TO THE BASIC FINANCIAL STATEMENTS Fiscal Year Ended June 30, 2008 NOTE 4 DETAILED NOTES ON ALL FUNDS (Continued) At June 30, 1998, the Harbor had advanced a total of $13.3 million to the ACTA to fund its share of planning and other costs incurred to date. During fiscal year 1999, the ACTA reimbursed the Harbor for all amounts advanced plus approximately $3.2 million of interest on the advances out of debt or grant financing proceeds. In addition, the ACTA reimbursed the Harbor for approximately $81.7 million of capital assets directly related to the ACTA's mission, which the Harbor had previously included in construction in progress. Of the capital assets transferred, approximately $22.2 million had been funded by capital grants, which the Harbor had previously included in contributions/land valuation equity. The Harbor has no share of the ACTA's operations and net assets at June 30, Separate financial statements for ACTA may be obtained from the Chief Financial Officer, Alameda Corridor Transportation Authority, One Civic Plaza Drive, Suite 350, Carson, California F. Capital Assets Governmental Activities Capital asset activity for Governmental Activities for the year ended June 30, 2008 is as follows (in thousands): Balance Additions/ Deductions/ Balance Governmental Activities June 30, 2007 Transfers Transfers June 30, 2008 Capital Assets Not Depreciated Land $ 608,242 $ 51,753 $ (263) $ 659,732 Infrastructure 146,079 1, ,514 Construction in Progress 1,350, ,057 (173,413) 1,695,011 Total Capital Assets Not Depreciated 2,104, ,245 (173,676) 2,502,257 Capital Assets Depreciated Buildings and Improvements 2,296, ,868 (4,536) 2,540,910 Machinery, Furniture and Equipment 1,173, ,855 (45,751) 1,228,248 Infrastructure 2,535, ,596 (945) 2,687,301 Total Capital Assets Depreciated 6,005, ,319 (51,232) 6,456,459 Less: Accumulated Depreciation Buildings and Improvements (718,157) (66,229) 4,536 (779,850) Machinery, Furniture and Equipment (745,490) (108,988) 45,751 (808,727) Infrastructure (897,961) (50,511) 945 (947,527) Total Accumulated Depreciation (2,361,608) (225,728) 51,232 (2,536,104) Total Capital Assets Depreciated, Net 3,643, , ,920,355 Governmental Activities Capital Assets, Net $ 5,748,452 $ 847,836 $ (173,676) $ 6,422,
128 NOTES TO THE BASIC FINANCIAL STATEMENTS Fiscal Year Ended June 30, 2008 NOTE 4 DETAILED NOTES ON ALL FUNDS (Continued) Depreciation expense was charged to functions/programs of the governmental activities as follows (in thousands): Function/Program Amount General Government $ 32,922 Protection of Persons and Property 27,535 Public Works 47,381 Health and Sanitation 45,554 Transportation 34,870 Cultural and Recreational Services 35,716 Community Development 1,750 Total Depreciation Expense - Governmental Activities $ 225,728 Business-type Activities Capital asset activity for Business-type Activities for the year ended June 30, 2008 is as follows (in thousands): Balance Additions/ Deductions/ Balance Business-type Activities June 30, 2007 Transfers Transfers June 30, 2008 Capital Assets Not Depreciated Land $ 2,178,122 $ 33,634 $ -- $ 2,211,756 Construction in Progress 2,643,227 1,215,400 (734,302) 3,124,325 Total Capital Assets Not Depreciated 4,821,349 1,249,034 (734,302) 5,336,081 Capital Assets Depreciated Buildings, Facilities and Equipment 24,846,081 1,177,650 (228,865) 25,794,866 Leased Property and Improvements 194, ,359 Total Capital Assets Depreciated 25,040,105 1,177,985 (228,865) 25,989,225 Less: Accumulated Depreciation Buildings, Facilities and Equipment (11,105,469) (730,649) 239,223 (11,596,895) Leased Property and Improvements (95,605) (4,550) -- (100,155) Total Accumulated Depreciation (11,201,074) (735,199) 239,223 (11,697,050) Capital Assets Depreciated, Net 13,839, ,786 10,358 14,292,175 Natural Gas Field, Net 235,163 1,071 (7,410) 228,824 Nuclear Fuel at Amortized Cost 18,311 20,340 (5,669) 32,982 Business-type Activities Capital Assets, Net $ 18,913,854 $ 1,713,231 $ (737,023) $ 19,890,
129 NOTES TO THE BASIC FINANCIAL STATEMENTS Fiscal Year Ended June 30, 2008 NOTE 4 DETAILED NOTES ON ALL FUNDS (Continued) Additions to accumulated depreciation are accounted for as follows (in thousands): Depreciation expense charged to functions of business-type activities: Airports $ 105,762 Harbor 78,295 Power 281,541 Water 76,329 Sewer 156,598 Other Enterprise Fund 11,928 Capitalized depreciation expense: Power 16,461 Water 8,285 Total $ 735,199 The Power Enterprise Fund has direct interests in several electrical generating stations and transmission systems that are jointly owned with other utilities. The Fund will incur certain minimal operating costs related to the jointly owned facilities, regardless of the amount or its ability to take delivery of its share of energy generated. The Fund s proportionate share of the operating costs of the joint plants is included as part of operating expenses. The following schedule shows the ownership interest in each jointly owned utility plant as included in capital assets in the statement of net assets at June 30, 2008 (dollar amounts in thousands): Share of Plant in Service Ownership Capacity Accumulated Interest (megawatts) Cost Depreciation Palo Verde Nuclear Generating Station 5.7% 228 $ 567,538 $ 318,491 Navajo Generating Station 21.2% , ,955 Mohave Generating Station 10.0% -- 57,913 56,851 Pacific Intertie DC Transmission Line 40.0% 1, ,623 40,678 Other Transmission Systems various various 81,167 43,544 $ 1,184,219 $ 729,
130 NOTES TO THE BASIC FINANCIAL STATEMENTS Fiscal Year Ended June 30, 2008 NOTE 4 DETAILED NOTES ON ALL FUNDS (Continued) Component Unit Capital assets activity for the CRA for the year ended June 30, 2008 is as follows (in thousands): Balance Additions/ Deductions/ Balance June 30, 2007 Transfers Transfers June 30, 2008 Capital Assets Not Depreciated Land $ 67,965 $ -- $ -- $ 67,965 Capital Assets Depreciated Buildings and Improvements 41, ,360 Equipment 13,379 1,962 (20) 15,321 Total Capital Assets Depreciated 54,739 1,962 (20) 56,681 Less - Accumulated Depreciation (24,034) (2,114) 20 (26,128) Capital Assets Depreciated, Net 30,705 (152) -- 30,553 Total Capital Assets, Net $ 98,670 $ (152) $ -- $ 98,518 The CRA allocated the depreciation expense of $2.1 million to its various projects
131 NOTES TO THE BASIC FINANCIAL STATEMENTS Fiscal Year Ended June 30, 2008 NOTE 4 DETAILED NOTES ON ALL FUNDS (Continued) G. Interfund Receivables, Payables, and Transfers The following tables are summaries of the City s interfund balances at June 30, 2008 (in thousands): Due From/To Other Funds Receivable Fund Payable Fund Amount General Building and Safety Permit $ 648 Community Development 2,134 MICLA Special Revenue 2,833 Proposition A Local Transit Assistance 324 Recreation and Parks 469 Solid Waste Resources 59 Other Governmental Funds 23,034 Water 63,356 Sewer 5,475 Other Enterprise Fund 71 98,403 Building and Safety Permit General 4,548 Recreation and Parks 2 Other Governmental Funds 2 Sewer 1 4,553 Community Development General 6 Other Governmental Funds 2,599 2,605 Proposition A Local Transit Assistance General 375 Recreation and Parks General 1 Other Governmental Funds 1,955 1,956 Solid Waste Resources General 13,126 Recreation and Parks 10 Sewer 7 13,143 Other Governmental Funds General 16,607 Building and Safety Permit 6 MICLA Special Revenue 41 Other Governmental Funds 1,075 Sewer ,841 Harbor General 4,084 Water Power 18,450 Sewer Recreation and Parks 8 Other Governmental Funds 1 9 Total $ 161,
132 NOTES TO THE BASIC FINANCIAL STATEMENTS Fiscal Year Ended June 30, 2008 NOTE 4 DETAILED NOTES ON ALL FUNDS (Continued) The receivable balance of the General Fund from the various governmental funds resulted from transfers from the Reserve Account as short-term loan to cover tardy receipts of revenues, while the payable balance is composed primarily of encumbered and unexpended budgetary transfers for certain costs allocated to the various funds. The General Fund s receivable from the Water Enterprise Fund is related to an interfund transfer held in abeyance as discussed in Note 5B on page 155. The Water Enterprise Fund s receivable from the Power Enterprise Fund is related to outstanding costs of certain administrative functions shared by the funds. The payable balance of the General Fund to the Harbor Enterprise Fund is related to the current portion of a litigation settlement discussed in Note 5B on page160. Advances To/From Other Funds Receivable Fund Payable Fund Amount General Other Governmental Funds $ 11,646 Other Enterprise Fund 9 11,655 MICLA Special Revenue Other Governmental Funds 750 Other Governmental Funds Recreation and Parks 1,121 Other Governmental Funds 93,691 94,812 Harbor General 32,265 Sewer Other Governmental Funds 2,765 Agency Funds General 80 Other Governmental Funds 15,334 15,414 Total $ 157,661 The above balances represent interfund borrowings payable beyond one year. The payable balance of the General Fund to the Harbor Enterprise Fund is related to the noncurrent portion of a litigation settlement discussed in Note 5B on page
133 NOTES TO THE BASIC FINANCIAL STATEMENTS Fiscal Year Ended June 30, 2008 NOTE 4 DETAILED NOTES ON ALL FUNDS (Continued) Interfund Transfers Transfers In Transfers Out Amount General Solid Waste Resources $ 487 Other Governmental Funds 23,842 Power 182,004 Water 33, ,758 Building and Safety Permit Other Governmental Funds 125 Community Development Other Governmental Funds 10,398 MICLA Special Revenue General 83 MICLA Debt Service General 113,255 MICLA Special Revenue 106,804 Solid Waste Resources 2,587 Other Governmental Funds 20, ,953 Proposition A Local Transit Assistance Improvement Other Governmental Funds 14,000 Recreation and Parks General 132,372 MICLA Special Revenue 4 Other Governmental Funds ,516 Solid Waste Resources Other Governmental Funds 5,011 Other Governmental Funds General 230,205 Community Development 15,724 Proposition A Local Transit Assistance 3,691 Solid Waste Resources 31,954 Other Governmental Funds 94, ,234 Other Enterprise Fund Other Governmental Funds 22 Total $ 1,021,100 Transfers are used to (a) move revenues from the fund that statute or budget requires to collect them to the fund that statute or budget requires to expend them, (b) move receipts restricted to debt service from the funds collecting the receipts to the debt service fund as debt service payments become due, (c) use unrestricted revenues collected in the General Fund to finance various programs accounted for in other funds in accordance with budgetary authorizations, and (d) move unrestricted revenues collected in certain enterprise funds to partially finance various programs in the General Fund in accordance with budgetary authorizations
134 NOTES TO THE BASIC FINANCIAL STATEMENTS Fiscal Year Ended June 30, 2008 NOTE 4 DETAILED NOTES ON ALL FUNDS (Continued) H. Accounts Payable and Accrued Expenses The primary government s accounts payable and accrued expenses at June 30, 2008 are broken down as follows (in thousands): Governmental Activities Business-type Activities Accounts, Contracts and Retainage Payable $ 230,727 $ 728,687 Accrued Salaries and Overtime Payable 199,756 41,823 Intergovernmental Payable 1, Other Current Liabilities ,932 Total $ 431,773 $ 885,442 I. Long-term Liabilities Governmental Activities Changes in Long-term Liabilities The changes in the governmental activities long-term liabilities for the year ended June 30, 2008 are as follows (in thousands): Balance Balance Due Within June 30, 2007 Additions Deductions June 30, 2008 One Year General Obligation Bonds $ 1,411,898 $ -- $ (108,863) $ 1,303,035 $ 105,950 Judgment Obligation Bonds 15, (6,145) 9,195 3,900 Certificates of Participation and Lease Revenue Bonds 1,624, ,035 (129,575) 1,822, ,015 Commercial Paper Notes 176, ,000 (109,000) 200, Special Assessment and Revenue Bonds 466, (24,400) 442,520 23,950 Subtotal Bonds and Notes 3,694, ,035 (377,983) 3,777, ,815 Add: Unamortized Net Premium and Deferred Charges 63,392 3,596 (3,251) 63, Total Bonds and Notes 3,758, ,631 (381,234) 3,841, ,815 Loans Payable to HUD 129,657 24,110 (77,712) 76,055 3,913 Compensated Absences 486,573 26,430 (11,766) 501,237 39,798 Claims and Judgments 1,604, ,923 (167,740) 1,862, ,586 Landfill Liability 49, (2,032) 47, Net Pension Liability 71, (2,911) 68, Net OPEB Liability -- 21, , Governmental Activities Long-term Liabilities $ 6,099,593 $ 962,452 $ (643,395) $ 6,418,650 $ 495,
135 NOTES TO THE BASIC FINANCIAL STATEMENTS Fiscal Year Ended June 30, 2008 NOTE 4 DETAILED NOTES ON ALL FUNDS (Continued) General Obligation Bonds (GO Bonds) The voter authorizations for general obligation bonds are summarized as follows (in thousands): Amount Amount Election Amount Issued as of Authorized Date Project Authorized June 30, 2008 But Unissued April 1989 Branch Library Facilities $ 53,400 $ 53,400 $ -- April 1989 Police Facilities 176, , April 1989 Fire Safety Facilities 60,000 60, June 1990 Seismic Safety Projects 376, , November 1998 Library Facilities 178, , November 1998 Zoo Facilities 47,600 47, November 2000 Fire, Paramedic, Helicopter and Animal Shelter Projects 532, , March 2002 Emergency Operations, Fire, Dispatch and Police Facilities 600, , November 2004 Stormwater Projects 500,000 45, ,000 Total $ 2,523,948 $ 2,068,948 $ 455,000 The bonds are general obligations of the City payable as to principal and interest from proceeds of ad valorem taxes that may be levied, without limitation as to rate or amount, upon property subject to taxation by the City. The GO bonds outstanding as of June 30, 2008 and the original amounts issued are as follows (in thousands): Final Original Outstanding Maturity Interest Rates Amount Balance Series 1998-A, Refunding 9/01/ % % $ 119,990 $ 96,110 Series 1999-A, Refunding 9/01/ % % 97,320 52,895 Series 1999-B 9/01/ % % 60,000 6,000 Series 2000-A 9/01/ % % 88,330 13,950 Series 2001-A 9/01/ % % 201,290 90,575 Series 2002-A 9/01/ % % 262, ,650 Series 2002-B, Refunding 9/01/ % % 79,055 69,550 Series 2003-A 9/01/ % % 233, ,705 Series 2003-B, Refunding 9/01/ % % 77,345 30,425 Series 2004-A 9/01/ % % 360, ,465 Series 2005-A 9/01/ % % 126, ,120 Series 2005-B, Refunding 9/01/ % % 73,080 72,900 Series 2006-A 9/01/ % % 71,023 66,690 Total $ 1,850,338 $ 1,303,
136 NOTES TO THE BASIC FINANCIAL STATEMENTS Fiscal Year Ended June 30, 2008 NOTE 4 DETAILED NOTES ON ALL FUNDS (Continued) Annual debt service requirements to maturity for the general obligation bonds are as follows (in thousands): Fiscal Year Principal Interest Total 2009 $ 105,950 $ 58,330 $ 164, ,085 53, , ,745 49, , ,510 45, , ,185 41, , , , , ,890 58, , ,790 4,925 85,715 Subtotal 1,303, ,018 1,759,053 Net Unamortized Premium and Deferred Charges 33, ,005 Total $ 1,336,040 $ 456,018 $ 1,792,058 Judgment Obligation Bonds (JOBs) The City issued JOBs in April 2000 and August 2000 to pay for judgments related to claims under the Fair Labor Standards Act. The judgment obligation bonds outstanding at June 30, 2008, and the original amounts issued are as follows (in thousands): Final Original Outstanding Maturity Interest Rates Amount Balance Series 2000-A 4/01/ % % $ 25,000 $ 5,000 Series 2000-B 8/01/ % % 13,995 4,195 Total $ 38,995 $ 9,195 Annual debt service requirements to maturity for the judgment obligation bonds are as follows (in thousands): Fiscal Year Principal Interest Total 2009 $ 3,900 $ 399 $ 4, , , , ,426 Total $ 9,195 $ 646 $ 9,
137 NOTES TO THE BASIC FINANCIAL STATEMENTS Fiscal Year Ended June 30, 2008 NOTE 4 DETAILED NOTES ON ALL FUNDS (Continued) Certificates of Participation and Lease Revenue Bonds In 1984, the Mayor and the City Council directed that a lease-purchase program for equipment be established. This program was subsequently expanded to include real property projects. A nonprofit corporation, the Municipal Improvement Corporation of Los Angeles (MICLA) was created to serve as the lessor. The City and MICLA have entered into a number of lease-purchase programs funded through the sale of certificates of participation and lease revenue bonds. During the year, MICLA lease revenue bonds totaling $328 million were issued to: (a) finance the costs associated with the acquisition of an office building complex and parking structure, and (b) refinance, through the redemption of outstanding commercial notes, costs associated with the acquisition of certain equipment. The aggregate outstanding balance at June 30, 2008 and the aggregate original amount issued for MICLA s certificates of participation and lease revenue bonds are as follows (in thousands): Final Original Outstanding M a tu rity In t e res t R a te s Am o u nt Ba la n ce MICLA Various Projects Various dates 2.00% % $ 1,895,645 $ 1,309,510 through 2037 The City has pledged, as security for bonds issued by MICLA, revenues consisting of basic lease payments pursuant to the equipment lease agreements and earnings from investment of money held. The City includes all necessary MICLA lease payments in its annual budget appropriations. Principal and interest paid by MICLA for the current year totaled $167.5 million, while revenue from leases received and investment earnings totaled $170.2 million. Annual debt service requirements to maturity for MICLA certificates of participation and lease revenue bonds are as follows (in thousands): Fiscal Year Principal Interest Total 2009 $ 92,650 $ 61,082 $ 153, ,335 56, , ,915 53, , ,180 49, , ,340 46, , , , , , , , , , , ,280 59, , ,135 18, ,893 Subtotal 1,309, ,460 2,103,970 Net Unamortized Premium and Deferred Charges 26, ,843 Total $ 1,336,353 $ 794,460 $ 2,130,813 The City entered into a lease-purchase agreement with the Los Angeles Convention and Exhibition Center Authority, a joint powers authority between the City and the County, for the construction and expansion of the Los Angeles Convention Center. Certificates of participation debt was issued to provide funding for the expansion of the Los Angeles Convention Center which is owned and operated by the City. The Authority also issued lease revenue bonds to partially finance the City s share for the development of the Staples Center
138 NOTES TO THE BASIC FINANCIAL STATEMENTS Fiscal Year Ended June 30, 2008 NOTE 4 DETAILED NOTES ON ALL FUNDS (Continued) Bond payments are secured primarily by revenues from base rental payments. Principal and interest paid for the current year and revenues were $43.3 million and $69.5 million, respectively. The Convention Center certificates of participation and lease revenue bonds outstanding at June 30, 2008, and the original amounts issued are as follows (in thousands): Final Original Outstanding Maturity Interest Rates Amount Balance 1993 Series A, Refunding 8/15/ % % $ 503,870 $ 51, Series A 8/15/ % % 45,580 37, Series A, Refunding 8/15/ % % 226, , Series B through F, Refunding 8/15/21 variable 235, ,520 Total $ 1,011,015 $ 513,430 The variable rate refunding bonds of $235.5 million currently accrue interest based on the Weekly Rate Mode ( % weighted average rate for period beginning June 30, 2008). Under the indenture agreement, the bonds may be converted to a Daily Rate Mode, a Weekly Rate Mode, an Auction Rate Mode, a Commercial Paper Mode, a Term Rate, or a Fixed Rate Mode. The remarketing agent determines the applicable interest rates. Bonds in the Daily Rate Mode or the Weekly Rate Mode will be subject to optional tender for purchase. The bonds are also subject to mandatory tender for purchase upon the occurrence of certain events. The purchase price of tendered bonds are payable from the proceeds of remarketing the bonds. To the extent that the remarketing proceeds are insufficient or not available therefore to pay the tendered bonds, payment shall be drawn from a liquidity facility provided under a Standby Bond Purchase Agreement entered into by the City, the Tender Agent and certain financial institutions on June 4, The extended liquidity facility agreement expires on June 4, Annual debt service requirements to maturity for the Convention Center lease revenue bonds are as follows (in thousands): Fiscal Year Principal Interest Total 2009 $ 23,365 $ 29,032 $ 52, ,735 27,981 54, ,905 26,680 56, ,040 24,921 56, ,435 23,474 56, ,330 95, , ,575 29, , , ,556 Subtotal 513, , ,740 Net Unamortized Premium and Deferred Charges (9,759) -- (9,759) Total $ 503,671 $ 257,310 $ 760,981 The above schedule includes interest requirements for the $235.5 million Convention Center variable rate refunding bonds using the % weighted average rate for the period beginning June 30,
139 NOTES TO THE BASIC FINANCIAL STATEMENTS Fiscal Year Ended June 30, 2008 NOTE 4 DETAILED NOTES ON ALL FUNDS (Continued) Commercial Paper Notes In April 2004, the Mayor and City Council approved a $200 million MICLA Commercial Paper Lease Financing Program. This program supplements the MICLA equipment and real property lease program, and allows MICLA to access financial markets quickly; to obtain flexible, short-term maturities; to borrow only those amounts needed as invoices are received; and to borrow at more favorable rates. The notes issued mature at a specific time between one and 270 days of issuance. Upon maturity, they are either re-sold in the open market or refinanced with longer-term bonds. As a security to the notes, the City and MICLA entered into an asset-transfer lease agreement on certain capital assets with a carrying net book value as of June 30, 2008 of $131.5 million and estimated fair value of $211.5 million. The payment of principal and interest on the notes is further supported by an irrevocable direct letter of credit issued by a commercial bank pursuant to the terms of a reimbursement agreement among MICLA, the City, and the commercial bank. At June 30, 2008, outstanding commercial paper notes amounted to $200 million with interest rates ranging from 0.85% to 2.92%. Special Assessment and Revenue Bonds The special assessment and revenue bonds outstanding at June 30, 2008, and the original amounts issued are as follows (in thousands): Final Original Outstanding Maturity Interest Rates Amount Balance Special Assessment Bonds 2000 Series 3/01/ % % $ 14,355 $ 6, Series 3/01/ % % 10,305 7, Series 3/01/ % % 19,630 15,275 Subtotal 44,290 29,390 Parking System Revenue Bonds 1999-A Series 5/01/ % % 80,975 69, A Series 5/01/ % % 39,630 31,695 Subtotal 120, ,965 Solid Waste Resources Revenue Bonds 2001-A Series 2/01/ % % 86,640 54, A Series 2/01/ % % 47,825 47, B Series 2/01/ % % 61,120 61, A Series 2/01/ % 56,230 44, A Series 2/01/ % 45,750 45, A Series 2/01/ % % 58,370 58,370 Subtotal 355, ,165 Total $ 520,830 $ 442,
140 NOTES TO THE BASIC FINANCIAL STATEMENTS Fiscal Year Ended June 30, 2008 NOTE 4 DETAILED NOTES ON ALL FUNDS (Continued) The special assessment bonds were issued to finance the acquisition and construction of, and improvements to certain park, recreation and community facilities owned by the City. The City levies annual assessments on the parcels located within the City in an amount sufficient to provide for the debt service of the bonds. The assessments, which constitute fixed liens on the parcels, are pledged to the payment of the bonds. The City has covenanted to take all steps necessary to assure the timely collection of the assessments, including without limitation, the enforcement of delinquent assessments. Principal and interest paid for the current year and revenue from assessments excluding interest earnings were $3.1 million and $20.2 million, respectively. Annual debt service requirements to maturity for the special assessment bonds are as follows (in thousands): Fiscal Year Principal Interest Total 2009 $ 1,705 $ 1,384 $ 3, ,775 1,314 3, ,815 1,241 3, ,885 1,164 3, ,970 1,082 3, ,310 3,974 15, ,930 1,026 9,956 Total $ 29,390 $ 11,185 $ 40,575 The parking revenue bonds were issued to finance the acquisition and construction of, and improvements to certain City parking facilities. The bonds are payable from and secured by a pledge of the parking revenues generated from parking facilities owned by the City. Principal and interest paid for the current year and parking revenues were $8.6 million and $43.3 million, respectively. Annual debt service requirements to maturity for the parking revenue bonds are as follows (in thousands): Fiscal Year Principal Interest Total 2009 $ 3,670 $ 4,935 $ 8, ,830 4,773 8, ,000 4,607 8, ,175 4,428 8, ,355 4,250 8, ,045 17,974 43, ,700 11,115 39, ,065 4,917 26, , ,394 Total $ 100,965 $ 57,268 $ 158,
141 NOTES TO THE BASIC FINANCIAL STATEMENTS Fiscal Year Ended June 30, 2008 NOTE 4 DETAILED NOTES ON ALL FUNDS (Continued) The solid waste resources (formerly sanitation equipment charge) revenue bonds were issued to finance the acquisition of certain equipment and construction of certain facilities for the refuse collection and disposal system of the City. The bonds are payable from and secured by a pledge of revenues, which include the Solid Waste Collection, Transfer, Recycling, Recovery of Waste Resources and Disposal Fees, received by the Solid Waste Resources Revenue Fund. Principal and interest paid for the current year and total solid waste resources revenue were $34.9 million and $204.5 million, respectively. Annual debt service requirements to maturity for the solid waste resources revenue bonds are as follows (in thousands): Fiscal Year Principal Interest Total 2009 $ 18,575 $ 14,685 $ 33, ,150 13,834 35, ,745 12,776 34, ,720 11,779 34, ,710 10,759 34, ,170 35, , ,985 8,773 62, ,670 1,572 13, , ,512 Subtotal 312, , ,261 Unamortized Premium 13, ,648 Total $ 325,813 $ 110,096 $ 435,909 Loans Payable to HUD The Loans Payable to HUD consists of $60 million fixed-rate loans and $16.1 million interim financing loans. The loans will be repaid from program income generated by HOME and Community Development Block Grant entitlements and the Section 108 Loan Program Funds. The debt service requirements to maturity are as follows (in thousands): Fiscal Year Principal Interest Total 2009 $ 3,913 $ 2,554 $ 6, ,268 2,780 9, ,640 2,513 9, ,115 2,256 8, ,892 2,013 7, ,972 6,014 34, ,754 2,407 16, , ,778 Total $ 76,055 $ 20,814 $ 96,869 The interest rates on the fixed-rate loans range from 2.92% to 7.21% and have maturity dates through The interim financing loans bear interest payable quarterly at 20 basis points above the applicable London Interbank Offered Rate (LIBOR). The loans mature on various dates through The interest rate in effect (LIBOR + 0.2%) as of June 30, 2008 of 2.46% was used in the debt service requirement schedule
142 NOTES TO THE BASIC FINANCIAL STATEMENTS Fiscal Year Ended June 30, 2008 NOTE 4 DETAILED NOTES ON ALL FUNDS (Continued) Business-type Activities Changes in Long-term Liabilities The changes in the business-type activities long-term liabilities for the year ended June 30, 2008 are as follows (in thousands): Balance Balance Due Within June 30, 2007 Additions Deductions June 30, 2008 One Year Airports Revenue Bonds and Notes $ 482,420 $ 204,599 $ (68,246) $ 618,773 $ 16,135 Harbor Revenue Bonds and Loans 793, (22,501) 770,521 23,655 Power Services Revenue Bonds and Revenue Certificates 4,341, ,755 (43,033) 4,951, ,455 Water Services Revenue Bonds and Loans 2,195,391 34,829 (76,287) 2,153,933 59,849 Wastewater System Revenue Bonds, Notes, and Loans 2,575, ,700 (663,657) 2,516,595 61,044 Subtotal Revenue Bonds and Notes 10,387,445 1,497,883 (873,724) 11,011, ,138 Less: Unamortized Net Discount and Deferred Charges (25,215) 25,191 (744) (768) -- Net Revenue Bonds and Notes 10,362,230 1,523,074 (874,468) 11,010, ,138 Capital Lease Obligations 51,855 1,197 (2,337) 50,715 1,197 Compensated Absences 113, ,479 (168,507) 102,768 87,475 Claims and Judgments 145,521 16,043 (11,287) 150,277 16,456 Net Pension Liability 10,469 1, , Business-type Activities Long-term Liabilities $ 10,683,871 $ 1,698,954 $ (1,056,599) $ 11,326,226 $ 441,266 Airports Revenue Bonds and Notes Revenue bonds, refunding revenue bonds, and commercial paper notes outstanding at June 30, 2008 are summarized as follows (dollar amounts in thousands): Final Original Outstanding Maturity Interest Rates Amount Balance Fixed rate revenue bonds % % $ 625,005 $ 207,445 Variable rate revenue bonds 2020 variable 81,100 81,100 Commercial paper notes -- variable 383, ,228 Subtotal $ 1,089, ,773 Net unamortized premiums, discounts, and debt related costs 7,280 Net revenue bonds and notes $ 626,053 Revenue bonds were issued by the Airports for various improvement projects. Future revenues are pledged as security of the bonds
143 NOTES TO THE BASIC FINANCIAL STATEMENTS Fiscal Year Ended June 30, 2008 NOTE 4 DETAILED NOTES ON ALL FUNDS (Continued) Principal and interest paid for the current year and net revenue were $27.8 million and $189.4 million, respectively. Information on Airport s pledged revenue coverage is found in the Statistical Section-Debt Capacity on page 328. During the year, the Airports issued additional $204.6 million commercial paper notes. The proceeds were used to: (a) reimburse available cash used for improvements on the south airfield and improvements to the international terminal, and (2) fund deposits placed into revocable escrow accounts used as an interim step toward maintaining the required IRS non-taxable definition for long-term financing of certain defeased outstanding bonds. Scheduled annual principal maturities and interest are as follows (in thousands): Fiscal Year Principal Interest Total 2009 $ 16,135 $ 12,049 $ 28, ,475 11,316 27, ,565 10,488 28, ,435 9,620 28, ,365 8,699 28, ,120 29, , ,515 10,432 77, ,935 2,047 21,982 Subtotal 288,545 93, ,458 Net Unamortized Premium, Discount, and Deferred Charges 7, ,280 Total $ 295,825 $ 93,913 $ 389,738 Interest requirements include those of the variable rate debt interest rates in effect as of June 30, 2008 that range from 1.35% to 2.87%. The schedule does not include the commercial paper notes that are assumed to be renewed or refinanced on a long-term basis. Harbor Revenue Bonds and Loans Revenue bonds, revenue refunding bonds, and loans outstanding at June 30, 2008 are summarized as follows (dollar amounts in thousands): Final Original Outstanding Maturity Interest Rates Amount Balance Fixed rate revenue bonds % - 5.5% $ 806,765 $ 767,250 Loans from CDBW % 8,000 3,271 Subtotal $ 814, ,521 Net unamortized premiums, discounts, and debt related costs 11,231 Net revenue bonds and notes $ 781,
144 NOTES TO THE BASIC FINANCIAL STATEMENTS Fiscal Year Ended June 30, 2008 NOTE 4 DETAILED NOTES ON ALL FUNDS (Continued) Revenue bonds and refunding bonds are collateralized by the future revenues of the Harbor Enterprise Fund. Principal and interest paid for the current year and net revenue were $60 million and $204.6 million, respectively. Information on Harbor s pledged revenue coverage is found in the Statistical Section-Debt Capacity on page 328. The outstanding loans were obtained from the California Department of Boating and Waterways (CDBW). The Harbor s obligation with respect to paying such loans is subordinate to the lien of the Harbor s Parity Obligations on the revenue bonds. Scheduled annual principal maturities and interest are as follows (in thousands): Fiscal Year Principal Interest Total 2009 $ 23,655 $ 38,235 $ 61, ,075 37,004 62, ,386 35,709 62, ,673 34,357 62, ,111 32,944 62, , , , ,595 92, , ,175 33, , ,825 9,670 35, ,826 2,572 28,398 Subtotal 770, ,666 1,227,187 Net Unamortized Premium, Discount, and Deferred Charges 11, ,231 Total $ 781,752 $ 456,666 $ 1,238,418 Power Services Bonds and Revenue Certificates Long-term debt outstanding as of June 30, 2008 consists of revenue bonds and refunding revenue bonds due serially in varying annual amounts and are summarized as follows (dollar amounts in thousands): Final Original Outstanding Maturity Interest Rates Amount Balance Fixed rate revenue bonds % % $ 3,902,541 $ 3,657,482 Variable rate revenue bonds 2042 variable 1,134,100 1,094,300 Revenue certificates -- variable 200, ,000 Subtotal $ 5,236,641 4,951,782 Net unamortized premiums, discounts, and debt related costs 25,401 Net revenue bonds and notes $ 4,977,
145 NOTES TO THE BASIC FINANCIAL STATEMENTS Fiscal Year Ended June 30, 2008 NOTE 4 DETAILED NOTES ON ALL FUNDS (Continued) Revenue bonds are generally callable 10 years after issuance. DWP has agreed to certain covenants with respect to bonded indebtedness. Significant covenants include the requirement that the Power Enterprise Fund s net income, as defined, will be sufficient to pay certain amounts of future annual bond interest and of future annual aggregate bond interest and principal maturities. Revenue bonds and refunding bonds are collateralized by the future revenues of the Power Enterprise Fund. In October 2007, the Power system issued $653.8 million of Power System Revenue bonds. The net proceeds of $679 million from the transaction, which included a premium of $25.2 million, were deposited into the construction fund to be used for capital improvements. The variable rate bonds currently bear interest at daily and weekly rates (ranging from 1.55% to 1.65% as of June 30, 2008). The Power System can elect to change the interest rate period of the bonds with certain limitations. The bondholders have the right to tender the bonds to the tender agent on any business day with seven days prior notice. The revenue certificates bear interest at an average rate of 1.71%. The Power System has entered into standby and line-of-credit agreements with a syndicate of commercial banks in an initial amount of $580.8 million, $388.5 million, and $200 million to provide liquidity for the variable rate bonds and revenue certificates. The extended standby agreements expire in January 2010 for the $580.8 million issue and on July 2, 2009 for the $388.5 million issue. The $200 million line-of-credit agreement for the revenue certificates expires in September Bonds purchased under the agreements will bear interest that is payable quarterly at the greater of the Federal Funds Rate plus 0.50% or the bank s announced base rate, as defined. The unpaid principal of bonds purchased is payable in ten equal semiannual installments, commencing after the termination of the agreement. At its discretion, the Power System has the ability to convert the outstanding bonds to fixed rate obligations, which cannot be tendered by the bondholders. These bonds have been classified as long-term on the statement of net assets as the liquidity facilities give the Power System the ability to refinance on a long-term basis and the Power System intends to either renew the facility or exercise its right to tender the debt as a long-term financing. The portion that would be due in the next fiscal year in the event that the outstanding variable rate bonds were tendered and purchased by the commercial banks under the standby agreements has been included in the current portion of long-term debt and was $116.9 million at June 30, Principal and interest paid for the current year and net revenue were $248 million and $813.7 million, respectively. Information on Power s pledged revenue coverage is found in the Statistical Section-Debt Capacity on page
146 NOTES TO THE BASIC FINANCIAL STATEMENTS Fiscal Year Ended June 30, 2008 NOTE 4 DETAILED NOTES ON ALL FUNDS (Continued) Scheduled annual principal maturities and interest are as follows (in thousands): Fiscal Year Principal Interest Total 2009 $ 58,525 $ 195,159 $ 253, , , , , , , , , , , , , , ,596 1,383, , ,181 1,371, , ,266 1,286, , ,261 1,207, ,915 92, , ,899 18, ,280 Subtotal 4,751,782 3,031,608 7,783,390 Net Unamortized Premium, Discount, and Deferred Charges 25, ,401 Total $ 4,777,183 $ 3,031,608 $ 7,808,791 The maturity schedule presented above reflects the scheduled debt service requirements for the Power Enterprise Fund s revenue bonds. The schedule is presented assuming that the tender options on the variable rate bonds, as previously discussed, will not be exercised and that the full amount of the revenue certificates will be renewed. Should the bondholders exercise the tender options and the Power System convert all of the revenue certificates under the line of credit, the Power System would be required to redeem the $1,169.3 million in variable rate bonds outstanding over the next six years, as follows: $ million in fiscal year 2009, $ million in each of the fiscal years 2010 through 2013, and $ million in fiscal year Accordingly, the statement of net assets includes the possibility of the exercise of the tender options and reflects the $ million that could be due in fiscal year 2009 as a current portion of long-term debt payable. Interest requirements include those of the variable rate bonds, using the variable debt interest rate in effect at June 30, 2008 of 1.27%. Water Services Bonds and Loans Long-term debt outstanding as of June 30, 2008 consists of revenue bonds and refunding revenue bonds due serially in varying annual amounts, and other long-term debt as follows (dollar amounts in thousands): Final Original Outstanding Maturity Interest Rates Amount Balance Fixed rate revenue bonds % % $ 1,798,965 $ 1,724,696 Variable rate revenue bonds 2036 variable 439, ,420 Loans payable to CDWR % % 73,129 69,817 Subtotal $ 2,311,514 2,153,933 Net unamortized premiums, discounts, and debt related costs 3,637 Net revenue bonds, notes and loans $ 2,157,
147 NOTES TO THE BASIC FINANCIAL STATEMENTS Fiscal Year Ended June 30, 2008 NOTE 4 DETAILED NOTES ON ALL FUNDS (Continued) Revenue bonds generally are callable ten years after issuance. DWP has agreed to certain covenants with respect to bonded indebtedness. Significant covenants include the requirement that Water Enterprise Fund s net income, as defined, will be sufficient to pay certain amounts of future annual bond interest and of future annual aggregate bond interest and principal maturities. Revenue bonds and refunding bonds are collateralized by the future revenues of the Water Enterprise Fund. In February 2007, DWP entered into a loan agreement with the California Department of Water Resources (CDWR). The loan agreement allows for a total maximum loan of $36.4 million, at a fixed interest rate of 2.45%. In September 2007, DWP received $34.8 million under the agreement. The proceeds are being used to fund water quality capital improvements. The remaining $1.6 million under the loan agreement is expected to be received during fiscal year The Water Enterprise Fund is required to begin making principal payments under this arrangement beginning in fiscal year The variable rate bonds currently bear interest at daily and weekly rates (ranging from 1.6% to 2.6% as of June 30, 2008). DWP can elect to change the interest rate period of the bonds, with certain limitations. The bondholders have the right to tender the bonds to the tender agent on any business day with seven days prior notice. DWP has entered into standby agreements with a syndicate of commercial banks in an initial amount of $34.4 million, $225 million and $100 million to provide liquidity for these bonds. The initial and extended standby agreements expire in April 2009, February 2010, and October 2010, respectively. Bonds purchased under the agreements will bear interest that is payable quarterly at the greater of the Federal Funds Rate plus 0.50% or the bank s announced base rate, as defined. The unpaid principal of bonds purchased is payable in ten equal semiannual installments, commencing after the termination of the agreement. At its discretion, DWP has the ability to convert the outstanding bonds to fixed-rate obligations, which cannot be tendered by the bondholders. These bonds have been classified as long-term on the statement of net assets as the liquidity facilities give DWP the ability to refinance on a long-term basis and DWP intends to either renew the facilities or exercise its right to tender the debt as a long-term financing. That portion, which would be due in the next fiscal year in the event that the outstanding variable rate bonds were tendered and purchased by the commercial banks under the standby agreements, has been included in the current portion of long-term debt and was $35.9 million as of June 30, Principal and interest paid for the current year and net revenue were $119.1 million and $276 million, respectively. Information on Water s pledged revenue coverage is found in the Statistical Section-Debt Capacity on page
148 NOTES TO THE BASIC FINANCIAL STATEMENTS Fiscal Year Ended June 30, 2008 NOTE 4 DETAILED NOTES ON ALL FUNDS (Continued) Scheduled annual principal maturities and interest are as follows (in thousands): Fiscal Year Principal Interest Total 2009 $ 23,909 $ 90,937 $ 114, ,463 90, , ,884 88, , ,307 87, , ,364 86, , , , , , , , , , , , , , , , , , , , ,981 3, ,056 Subtotal 2,153,933 2,201,824 4,355,757 Net Unamortized Premium, Discount, and Deferred Charges 3, ,637 Total $ 2,157,570 $ 2,201,824 $ 4,359,394 The maturity schedule presented above reflects the scheduled debt service requirements for all of the Water Enterprise Fund s long-term debt. The schedule is presented assuming that the tender options on the variable rate bonds, as previously discussed, will not be exercised. Should the bondholders exercise the tender options, the Water System could be required to redeem the $359.4 million in variable rate bonds outstanding over the next six fiscal years, as follows: $35.94 million in fiscal year 2009, $71.88 million in each of the fiscal years 2010 through 2013, and $35.94 million in fiscal year Accordingly, the statement of net assets recognizes the possibility of the exercise of the tender options and reflect the $35.94 million that could be due in fiscal year 2009 as a current portion of long-term debt payable. The above schedule includes interest requirements for the variable rate debt over the regularly scheduled maturity period at the interest rate in effect at June 30, 2008 of 1.29% and 2.48%, for tax-exempt bonds and taxable bonds, respectively. Should the tender options be exercised, the interest would be payable at the rate in effect at the time the standby agreements are activated
149 NOTES TO THE BASIC FINANCIAL STATEMENTS Fiscal Year Ended June 30, 2008 NOTE 4 DETAILED NOTES ON ALL FUNDS (Continued) Wastewater System Revenue Bonds, Notes, and Loans Revenue bonds, refunding revenue bonds, commercial paper notes, and loans outstanding at June 30, 2008 are summarized as follows (dollar amounts in thousands): Final Original Outstanding Maturity Interest Rates Amount Balance Fixed rate revenue bonds % % $ 2,030,465 $ 1,595,270 Variable rate revenue bonds 2032 variable 444, ,600 Loans payable to SWRCB % 219, ,625 Commercial paper notes -- variable 280, ,100 Subtotal $ 2,974,246 2,516,595 Net unamortized premiums, discounts, and debt related costs (48,317) Net revenue bonds and notes $ 2,468,278 Wastewater revenue bonds and notes are issued under Senior Lien and Subordinate Lien General Resolutions dated November 10, 1987 and March 26, 1991, respectively, with a total authorization of $3.5 billion. Proceeds of wastewater revenue bonds and notes are restricted for the funding of the costs of construction, replacement, and improvement of the sewerage system of the City. Under the terms of the General Resolution, the City pledged the Sewer Enterprise Fund s revenues, as defined, to secure payment of the bonds. Certain bond agreements provide for the early redemption of the revenue bonds at various dates. In April 2008, the Sewer Enterprise Fund issued $444.6 million variable rate refunding bonds and $160 million commercial paper notes to current refund certain outstanding bonds totaling $604.6 million. The net proceeds of the refunding bonds and commercial paper notes, including available debt service reserve fund monies, were deposited in irrevocable trust with an escrow agent to provide debt service payments on the refunded bonds. Please see Note 4J on page 130 for additional information. The outstanding variable rate revenue bonds of $444.6 million currently bear interest on a weekly mode. The weighted average variable rate for the bonds at June 30, 2008 was 1.37%. The bonds may accrue interest at the daily rate, weekly rate, bond interest term rate, long rate, or fixed interest rate. Rate conversion is determined by the City in accordance with the provisions of the Paying Agent Agreement. As of June 30, 2008, the interest rate of the outstanding commercial paper notes was 1.79%. Principal and interest paid for the current year and net revenue were $152.9 million and $267 million, respectively. Information on Wastewater s pledged revenue coverage is found in the Statistical Section-Debt Capacity on page 329. In May 2003, the Mayor and City Council adopted a resolution authorizing a $264.6 million revolving fund loan from the State Water Resources Control Board (SWRCB). The loan will assist in financing a project that fulfills certain requirements of the Cease and Desist Order issued by the Regional Water Quality Control Board. The loan balance of $196.6 million is payable from the Sewer Enterprise Fund s revenues but are subordinate to the revenue bonds and commercial paper notes
150 NOTES TO THE BASIC FINANCIAL STATEMENTS Fiscal Year Ended June 30, 2008 NOTE 4 DETAILED NOTES ON ALL FUNDS (Continued) Scheduled annual principal maturities and interest are as follows (in thousands): Fiscal Year Principal Interest Total 2009 $ 61,044 $ 92,909 $ 153, ,490 94, , ,774 91, , ,346 88, , ,807 86, , , , , , , , , , , ,095 86, , ,190 9, ,773 Subtotal 2,236,495 1,434,549 3,671,044 Net Unamortized Premium, Discount, and Deferred Charges (48,317) -- (48,317) Total $ 2,188,178 $ 1,434,549 $ 3,622,727 Interest requirements include those of the variable rate debt interest rate of 1.37% in effect as of June 30, The schedule does not include the commercial paper notes that are assumed to be renewed or refinanced on a long-term basis. Fiduciary Funds The notes payable of the Fire and Police Pension System are secured by real estate. Interest rates range from 4.35% to 7.5%. Final maturity of the notes is in June The debt service payments to maturity for these notes are as follows (in thousands): Fiscal Year Principal Interest Total 2009 $ 40,810 $ 16,584 $ 57, ,674 14,728 37, ,724 13,468 49, ,812 12,377 15, ,008 10,988 38, ,796 28, , ,866 13,124 30, ,743 7,332 24, ,205 1,484 13,689 Total $ 303,638 $ 118,813 $ 422,
151 NOTES TO THE BASIC FINANCIAL STATEMENTS Fiscal Year Ended June 30, 2008 NOTE 4 DETAILED NOTES ON ALL FUNDS (Continued) Component Unit The changes in the CRA s long-term liabilities for the year ended June 30, 2008 are as follows (in thousands): Balance Balance Due Within June 30, 2007 Additions Deductions June 30, 2008 One Year Tax Allocation Bonds, Project Notes, and Revenue Bonds and Notes $ 688,711 $ 92,614 $ (20,668) $ 760,657 $ 21,872 Less: Unamortized Net Discount and Deferred Charges (2,751) (1,972) -- Net Bonds and Notes 685,960 92,908 (20,183) 758,685 21,872 Compensated Absences 2,864 1,669 (1,394) 3,139 1,770 OPEB Liability -- 2, , Subtotal 688,824 97,181 (21,577) 764,428 23,642 Loans Payable to Primary Government 73,832 4,500 (94) 78, CRA Long-term Liabilities $ 762,656 $ 101,681 $ (21,671) $ 842,666 $ 23,943 At June 30, 2008 balances and the original amounts of the CRA s bonds and notes are as follows (in thousands): Final Interest Original Outstanding Maturity Rates Amount Balance Tax Allocation Bonds Fixed Rate % % $ 780,540 $ 687,545 Project Notes Fixed Rate % % 7,889 5,115 Variable Rate 2014 variable 16,476 14,712 No fixed term % 9,043 8,493 Parking System Revenue Bonds and Notes % % 48,772 44,792 Subtotal $ 862, ,657 Unamortized Premium, Discount, and Deferred Charges, Net (1,972) Bonds and Notes 758,685 Loans Payable to Primary Government Community Development Block Grant Loans $ 50,671 50,671 CDBG 20-year and Float Loans % % 22,960 21,694 BGIF Loan % UDAG Loan % 4,250 4,250 City Department of Transportation (DOT) Loan 2016 variable Loans $ 79,776 78,238 Total Bonds, Notes, and Loans $ 836,
152 NOTES TO THE BASIC FINANCIAL STATEMENTS Fiscal Year Ended June 30, 2008 NOTE 4 DETAILED NOTES ON ALL FUNDS (Continued) The CRA has pledged a portion of its future tax increment revenues to repay $687.5 million in outstanding tax allocation bonds which had been issued to finance various redevelopment projects. These bonds are payable solely from individual redevelopment project s tax increment. Total principal and interest remaining on these bonds is $1.2 billion, payable through fiscal year Principal and interest paid for the current year and total tax increment revenue net of county administrative fees and other pass-through payments were $51.7 million and $207 million, respectively. Project site-specific and area-wide tax increment revenues have also been pledged on various CRA debt instruments that were issued to finance various redevelopment projects. These pledges are subordinate to senior-lien tax allocation bonds and CRA liability is limited to the amount available. Payments for the year on these various debt instruments totaled $1 million. In addition, certain program income has been pledged on two interest bearing bank notes with an aggregate outstanding principal balance of $7.4 million. The proceeds of the loan were used to finance various redevelopment projects. At the interest rates prevailing on June 30, 2008, total principal and interest remaining on these notes is $8.5 million, payable through fiscal year Principal and interest paid for the current year and program income realized were $2.1 million and $9.5 million, respectively. The debt service requirements to maturity for the CRA s bonds, notes, and loans to be paid from incremental property taxes and certain special revenues are as follows (in thousands): Fiscal Year Principal Interest Total 2009 $ 22,173 $ 43,905 $ 66, ,824 42,633 68, ,640 45,893 97, ,220 42,212 76, ,817 38,542 67, , , , , , , ,509 69, , ,900 28, , ,545 6,832 46, , ,895 Subtotal 788, ,911 1,387,135 Unamortized Discount (1,972) -- (1,972) Net 786, ,911 1,385,163 Non-interest bearing, no fixed term loan 50, ,671 Total $ 836,923 $ 598,911 $ 1,435,834 Interest requirements include those of the variable rate debt using interest rate in effect as of June 30, 2008 as follows: Project Notes 4.959% and % and DOT Loan %
153 NOTES TO THE BASIC FINANCIAL STATEMENTS Fiscal Year Ended June 30, 2008 NOTE 4 DETAILED NOTES ON ALL FUNDS (Continued) J. Current and Advance Refunding of Debt The following debt refunding activities occurred during the fiscal year that resulted in the defeasance of certain outstanding obligations. The proceeds from the advance refunding issues and amounts available from the debt service funds of the refunded bonds were deposited into irrevocable trusts with escrow agents. The refunding activities represent in-substance defeasance such that the refunded debts were removed from the accompanying financial statements. (Dollar amounts in thousands, except when indicated.) Cash Flow Economic Refunding Debt Refunded Debt Savings Gain Governmental Activities Loans Payable to HUD Loans Payable to HUD $24,110 $24, % % 4.32% % $ 3,381 $ 1,563 Current resources were used Loans Payable to HUD to refund the debt. See page $40, for additional discussion. 5.83% % $ 10,590 $ 2,539 Business-type Activities Wastewater Revenue Bonds Wastewater Revenue Bonds Refunding Series 2008 A-H Series 2001 A-D $444,600 $289,000 variable rate variable rate and and Wastewater Commercial Wastewater Revenue Bonds Paper Notes Series 2006 A-D $160,000 $315,820 variable rate variable rate (see note below) The primary purpose of the refunding is to control increasing interest costs that resulted from credit rating downgrade of the bond insurers. The theoretical cash flow savings and economic gain based on interest rates in effect when the refunding transactions occurred are not presented because both the refunding and refunded issues are variable-rate debts. The average interest rates in effect at the time of the issuance of the refunding bonds were as follows: 2.6% for the refunding bonds, 5.9% for the refunded bonds, and 1.9% for the commercial paper notes. The above refunding transactions for business-type activities resulted in a total net loss for accounting purposes of $29.1 million, which is deferred and amortized through K. Prior Years Defeasance of Debt In prior years, the City and CRA defeased certain bonds by placing the proceeds of the new bonds in irrevocable trusts to provide for all future debt service payments on the old bonds. Accordingly, the trust account assets and the liability for the defeased bonds are not included in the City's financial statements
154 NOTES TO THE BASIC FINANCIAL STATEMENTS Fiscal Year Ended June 30, 2008 NOTE 4 DETAILED NOTES ON ALL FUNDS (Continued) At June 30, 2008, the following bonds are considered defeased (in thousands): Outstanding Balance June 30, 2008 Governmental Activities General Obligation Bonds $ 126,805 Business-type Activities Harbor Revenue Bonds $ 84,665 Power Revenue Bonds 50,950 Water Revenue Bonds 334,405 Total $ 470,020 Component Unit Community Redevelopment Agency $ 42,620 L. Tax and Revenue Anticipation Notes At the beginning of the fiscal year, the City issued tax and revenue anticipation notes in advance of property tax and other revenue collections, depositing the proceeds in a General Fund account. The notes are issued to pay the City s annual contributions to the Fire and Police Pension System and the Los Angeles City Employees Retirement System at the beginning of the fiscal year and to provide effective cash flow management of the General Fund. The additional interest earned by the pension funds from these early payments is used to discount the required City contribution without reducing the pension funds annual receipts. Short term debt activity for the fiscal year ended June 30, 2008 was as follows (in thousands): Beginning Ending Balance Issued Redeemed Balance Tax and Revenue Anticipation Notes $ -- $ 909,725 $ (909,725) $ -- M. Interest Rate Swaps Convention Center Variable Rate Lease Revenue Refunding Bonds Objective of the swaps. In May 2003, in order to protect against the potential rising of interest rates, the City entered into two separate pay-fixed, receive-variable interest rate swap agreements on the $235.5 million Convention Center variable-rate lease revenue refunding bonds. The costs associated with the swaps are less than what the City would have paid to issue fixed-rate debt
155 NOTES TO THE BASIC FINANCIAL STATEMENTS Fiscal Year Ended June 30, 2008 NOTE 4 DETAILED NOTES ON ALL FUNDS (Continued) Terms, fair values, and credit risks. The terms, including the fair values and credit ratings of the outstanding swaps as of June 30, 2008 are as follows (dollar amounts in thousands): Swap Notional Effective Fixed Rate Variable Rate Termination Counterparty Amount Date Paid Received Fair Value Date Credit Rating (1) $ 117,760 June 1, % 65% of LIBOR (2) $ 343 August 2021 Aaa/AAA/AAA 117,760 June 1, % 65% of LIBOR (2) 296 August 2021 Aa2/AA-/AA- $ 235,520 $ 639 (1) Moody's Investors Service, Standard & Poor's, and Fitch Ratings, respectively. (2) One-month LIBOR reset monthly. One-month LIBOR as of June 30, 2008 was 2.46%. The notional amounts of the swaps match the principal amount of the associated debt. The swap agreements contain scheduled reductions to outstanding notional amounts that follow scheduled reductions in the associated debt. Fair Values. Because interest rates were higher on June 30, 2008 than the date the swaps were entered into, the swaps have a positive fair value as of June 30, The fair values were estimated using the zero-coupon method. This method calculates the future net settlement payments required by the swap agreements, assuming that the current forward rates implied by the yield curve correctly anticipate future spot interest rates. These payments are then discounted using the spot rates implied by the current yield curve for hypothetical zero-coupon bonds due on the date of each future net settlement on the swaps. Credit risk. The fair values of the swaps represented the City s credit exposure to the swap counterparties as of June 30, If the counterparties to these transactions failed to perform according to the terms of the swap contracts, and the City chose to terminate the swap, the City would be owed a termination payment by the counterparty. If the swaps had a negative fair value at the time the counterparty failed to perform, the City would be required to make payment to the counterparty. To mitigate credit risk, a counterparty must fully collateralize the fair value of the swap with U.S. government securities if two of its credit ratings fall below Moody s Investors Service Aa3, or AA- of Standard & Poor s or Fitch Ratings. Collateral would be posted with a thirdparty custodian. Basis risk. The City is exposed to basis risk on the swaps when the relationship between 65% of LIBOR and the actual rates on the associated variable rate bonds diverge. In this situation the expected savings may not be realized. As of June 30, 2008, the weighted average rate on the variable bonds was 7.304% while 65% of the LIBOR was 1.601%. Termination risk. The City or the counterparties may terminate the swap if the other party fails to perform under the terms of the contract. If at the time of the termination the swap has a negative fair value, the City would be liable to the counterparty for a payment equal to that value. If any of the swaps were terminated and not replaced, the City would not receive a payment from the counterparty to offset its variable interest expense on the associated variable rate bonds
156 NOTES TO THE BASIC FINANCIAL STATEMENTS Fiscal Year Ended June 30, 2008 NOTE 4 DETAILED NOTES ON ALL FUNDS (Continued) Swap payments and associated debt. Using rates as of June 30, 2008, net swap payments and debt service requirements of the associated variable-rate debt are as follows (in thousands): Variable-Rate Bonds Interest Rate Fiscal Year Principal Interest Swaps, Net Total 2009 $ -- $ 17,203 $ 3,073 $ 20, ,203 3,073 20, ,203 3,073 20, ,203 3,073 20, ,203 3,073 20, ,850 80,662 14, , ,670 24,069 5, ,092 Total $ 235,520 $ 190,746 $ 35,606 $ 461,872 As rates vary, variable-rate bond interest payments and net swap payments will vary. Wastewater System Subordinate Variable Rate Revenue Refunding Bonds Objective of the swaps. In April 2006, in order to protect against the potential rising of interest rates, the City entered into two separate pay-fixed, receive-variable interest rate swap agreements on the $316.8 million Wastewater System Refunding Series 2006 A through D Subordinate Variable Rate Bonds. In June 2008, the City issued $444.6 million Wastewater System Refunding Series 2008 A through H Subordinate Variable Rate Bonds. The proceeds of this issue, together with moneys attributed to the refunded bonds, were used to current refund certain outstanding bonds that included the outstanding balance of the $316.8 million issue referred to in the preceding paragraph. On the date the $444.6 million refunding bonds were issued, pursuant to federal regulations, the swap agreements were treated as terminated for tax purposes. As neither of the swap agreements were actually terminated by the City and its counterparties, the City issued a certificate to reassociate the swap agreements with series 2008 A through F1 (of the $444.6 million issue) aggregating $314.8 million. As of the date of the certificate, the aggregate notional amount of the swap agreements was reduced to $314.8 million. The reduction is equal to the amount of principal of the refunded bonds that would have been due and payable had the refunded bonds remained outstanding through such date. The reduced aggregate notional amount of the swap agreements matches the aggregate principal amount of the underlying reassociated bonds
157 NOTES TO THE BASIC FINANCIAL STATEMENTS Fiscal Year Ended June 30, 2008 NOTE 4 DETAILED NOTES ON ALL FUNDS (Continued) Terms, fair values, and credit risks. The terms, including the fair values and credit ratings of the outstanding swaps as of June 30, 2008 are as follows (dollar amounts in thousands): Swap Notional Effective Fixed Rate Variable Rate Termination Counterparty Amount Date Paid Received Fair Value Date Credit Rating (1) $ 157,412.5 April 6, % 64.1% of LIBOR (2) $ (5,298) June 2028 Aaa/AA/AA- 157,412.5 April 6, % 64.1% of LIBOR (2) (5,298) June 2028 Aa1/AA/AA+ $ 314,825.0 $ (10,596) (1) Moody's Investors Service, Standard & Poor's, and Fitch Ratings, respectively. (2) One-month LIBOR reset monthly. One-month LIBOR as of June 30, 2008 is 2.46%. The swap agreements contain scheduled reductions to outstanding notional amounts that follow scheduled reductions in the reassociated debt. Fair Values. Because interest rates were lower on June 30, 2008 than the date the swaps were entered into, the swaps have a negative fair value as of June 30, The fair values were estimated using the zero-coupon method. This method calculates the future net settlement payments required by the swap agreements, assuming that the current forward rates implied by the yield curve correctly anticipate future spot interest rates. These payments are then discounted using the spot rates implied by the current yield curve for hypothetical zero-coupon bonds due on the date of each future net settlement on the swaps. Credit risk. The fair values of the swaps represented the City s credit exposure to the swap counterparties as of June 30, If the counterparties to these transactions failed to perform according to the terms of the swap contracts, and the City chose to terminate the swap, the City would be owed a termination payment by the counterparty. If the swaps had a negative fair value at the time the counterparty failed to perform, the City would be required to make payment to the counterparty. To mitigate credit risk, a counterparty must fully collateralize the fair value of the swap with U.S. government securities if two of its credit ratings fall below Moody s Investors Service Aa3, or AA- of Standard & Poor s or Fitch Ratings. Collateral would be posted with a thirdparty custodian. Basis risk. The City is exposed to basis risk on the swaps when the relationship between 64.1% of LIBOR and the actual rates on the associated variable rate bonds diverge. In this situation the expected savings may not be realized. As of June 30, 2008, the weighted average rate on the variable bonds was 1.371% while 64.1% of the LIBOR was 1.578%. Termination risk. The City or the counterparties may terminate the swap if the other party fails to perform under the terms of the contract. If at the time of the termination the swap has a negative fair value, the City would be liable to the counterparty for a payment equal to that value. If any of the swaps were terminated and not replaced, the City would not receive a payment from the counterparty to offset its variable interest expense on the associated variable rate bonds
158 NOTES TO THE BASIC FINANCIAL STATEMENTS Fiscal Year Ended June 30, 2008 NOTE 4 DETAILED NOTES ON ALL FUNDS (Continued) Swap payments and associated debt. Using rates as of June 30, 2008, net swap payments and debt service requirements of the associated variable-rate debt are as follows (in thousands): Variable-Rate Bonds Interest Rate Fiscal Year Principal Interest Swaps, Net Total 2009 $ 1,025 $ 4,317 $ 5,546 $ 10, ,065 4,303 5,528 10, ,095 4,288 5,509 10, ,135 4,273 5,490 10, ,170 4,257 5,470 10, ,750 20,568 26, , ,035 13,380 17, , ,550 7,424 9, ,511 Total $ 314,825 $ 62,810 $ 80,694 $ 458,329 As rates vary, variable-rate bond interest payments and net swap payments will vary. N. Leases Governmental Activities The City leases a significant amount of property and equipment under operating leases. Total rental expenditures, incurred primarily in the General Fund, on the operating leases for the fiscal year ended June 30, 2008 were approximately $23.9 million. The future lease payments under noncancelable operating lease agreements are as follows (in thousands): Fiscal Year Ending June $ 10, , , , , , , , , , , , , Total $ 116,
159 NOTES TO THE BASIC FINANCIAL STATEMENTS Fiscal Year Ended June 30, 2008 NOTE 4 DETAILED NOTES ON ALL FUNDS (Continued) The City also leases certain property and equipment under capital leases with the following component units/funds. Municipal Improvement Corporation The MICLA was formed to finance certain capital improvement projects of the City and enter into long-term capital lease agreements with the City. Under the lease agreements, title transfers to the City at the end of the lease term. If the City defaults under the Lease and Trust Agreements, the Trustee may terminate the lease and re-let the properties. Since MICLA is included in the City's reporting entity, the lease payments by the City are accounted for in the fund financial statements as transfers from the General Fund and certain Special Revenue Funds to the MICLA Debt Service Fund. The leases have been eliminated in the government-wide financial statements. Los Angeles Convention and Exhibition Center Authority Pursuant to a Facility Lease between the City and the Los Angeles Convention and Exhibition Center Authority (Authority), the Authority issued certificates of participation to provide financing for the acquisition and construction of certain improvements for the Los Angeles Convention Center, and taxable lease revenue bonds to finance the City s share of the development of the Staples Center. Under the lease, the City is obligated to make rental payments sufficient to pay the debt service requirements on the certificates and bonds. The City s General Fund made rental payments during fiscal year ended June 30, Since the Authority is included within the City's reporting entity, the lease payments by the City are accounted for in the fund financial statements as transfers from the General Fund to the Convention Center Debt Service Fund. The leases were eliminated in the government-wide financial statements. Business-type Activities Airports Airports has entered into various lease agreements with certain airlines. These agreements are classified as capital leases and are for certain public areas at the Los Angeles International Airport. The agreements generally provide for the payment of amounts over various terms between 27 and 35 years, with interest at the rate incurred by the lessor on their related borrowings, which include improvement bonds. The property capitalized under these lease agreements at June 30, 2008, was $184.4 million. Accumulated depreciation with respect to such property at June 30, 2008, was $100.2 million
160 NOTES TO THE BASIC FINANCIAL STATEMENTS Fiscal Year Ended June 30, 2008 NOTE 4 DETAILED NOTES ON ALL FUNDS (Continued) Estimated future minimum lease payments under these agreements are as follows (in thousands): Fiscal Year Ending June $ 3, , , , , , , ,327 Total mimimum lease payments 72,470 Less - Portion representing interest (21,755) Present value of minimum lease payments $ 50,715 The Airports currently uses rental credits to finance its obligations on capital leases with certain airlines. These rental credits are applied as an offset of amounts owed to the Airports by such airlines for terminal leases and landing fees. Harbor A substantial portion of the Harbor Department's land and facilities is leased to others. The majority of these leases provide for cancellation on a 30-day notice by either party and for retention of ownership by the Harbor or restoration of the property at the expiration of the agreement. Accordingly, no leases are considered capital leases for purposes of financial reporting. These lease agreements are intended to be long-term in nature (up to 30 years) and to provide the Harbor with a firm tenant commitment for a minimum fixed income stream. Many agreements also provide for additional payment beyond the fixed portion based upon tenant usage, revenues or volume. These agreements are also generally subject to periodic inflationary escalation of base amounts due to the Harbor. For the year ended June 30, 2008, revenues from such agreements aggregated approximately $259.5 million. The property on lease at June 30, 2008 consists of the following (in thousands): Wharves and sheds $ 660,308 Cranes/bulk facilities 56,640 Municipal warehouses 10,647 Port pilot facilities and equipment 6,116 Buildings and other facilities 740,359 Cabrillo Marina 41,772 Total 1,515,842 Less - Accumulated depreciation (690,974) Net $ 824,
161 NOTES TO THE BASIC FINANCIAL STATEMENTS Fiscal Year Ended June 30, 2008 NOTE 4 DETAILED NOTES ON ALL FUNDS (Continued) Assuming that current agreements are carried to contractual termination, minimum tenant commitments due to the Harbor over the next five years are as follows (in thousands): Fiscal Year Ending June 30: 2009 $ 260, , , , ,852 Total $ 1,309,979 Water The Water Enterprise Fund utilizes an advanced wastewater treatment facility owned by the Water System but is operated by and located on a property leased by a separate City department. The use of this facility is accounted for as an operating lease. Estimated expenditures for fiscal year 2008 are approximately $2 million to operate and maintain this asset. There are no minimum rental payments that the Water Enterprise Fund has to make. However, the Water Enterprise Fund is obligated to reimburse the other City department for that department s operating and maintenance costs to operate the facility, estimated to be about $2 million per year, for a term of 25 years. The Water Enterprise Fund will also pay additional monies to the other City department, if revenues generated by the Water Enterprise Fund exceed the costs of operation and maintenance as defined by the agreement. The Water Enterprise Fund does not expect to pay such additional amounts as it does not expect that a net operating profit will be achieved based on current demand of recycled water. Fiduciary Funds The Fire and Police Pension System leases an office space under an operating lease agreement that expires on April 14, Lease payments for the fiscal year ended June 30, 2008 were $0.9 million. Future minimum lease payments under the agreement are as follows (in thousands): Fiscal Year Ending June 30: 2009 $ 1, , , ,155 Total $ 4,
162 NOTES TO THE BASIC FINANCIAL STATEMENTS Fiscal Year Ended June 30, 2008 NOTE 4 DETAILED NOTES ON ALL FUNDS (Continued) Community Redevelopment Agency The CRA leases office spaces under operating lease agreements that expire through Lease payments for the fiscal year ended June 30, 2008 were $2.1 million. Future minimum lease payments under the agreements are as follows (in thousands): Fiscal Year Ending June 30: 2009 $ 2, Total $ 3,155 O. Risk Management - Estimated Claims and Judgments Payable Governmental Activities As discussed in the summary of significant accounting policies (Note 1E), the City recognizes a liability for claims and judgments when it is probable that an asset has been impaired or a liability has been incurred and the amount of the loss can be reasonably estimated. Included in the account are amounts for tort liability and workers compensation, which include Incurred But Not Reported (IBNR) liabilities, and provision for allocated expenses. As of June 30, 2008, a number of lawsuits and claims were pending against the City that arose in the normal course of the City's general governmental operations. The City estimates the amount of tort and non-tort liabilities to be probable of occurring as of June 30, 2008 at approximately $375.8 million. Of this amount, approximately $76 million is estimated to be payable in the next fiscal year. The City Attorney also estimates that certain pending lawsuits and claims have a reasonable possibility of resulting in additional General Fund liability totaling $142 million. However, no amount has been accrued in the accompanying financial statements because it is not probable that a loss has been incurred as of June 30, The City s liability for tort cases was actuarially estimated. The total of the present value of the estimated outstanding losses and loss adjustment expenses was used to record the City s liability for tort cases. The present value of the estimated outstanding losses and loss adjustment expenses was calculated based on a 4% yield on investments. The liability for workers compensation was recorded using the present value of the actuarially estimated outstanding losses, which were based on an analysis of the City s historical loss and allocated loss adjustment expenses (ALAE). The present value of the estimated outstanding losses was calculated based on a 4% yield on investments. At June 30, 2008, the City estimates its workers compensation liability at $1,486.8 million. Of this amount, $125.6 million is estimated to be payable in the next fiscal year
163 NOTES TO THE BASIC FINANCIAL STATEMENTS Fiscal Year Ended June 30, 2008 NOTE 4 DETAILED NOTES ON ALL FUNDS (Continued) Business-type Activities The Enterprise Funds estimated claims and judgments payable of $150.3 million consists of $57.3 million long-term litigation-type claims and $93 million workers compensation liability. The amount estimated to be payable in the next fiscal year is approximately $16.5 million. The City has never purchased excess insurance over specific retention and therefore is responsible for the full amount of every claim. The City does not anticipate purchasing excess insurance for the fiscal accident year. During the last three fiscal years, insurance claims have not exceeded commercial insurance coverages. Claim Changes The changes in the City's total estimated claims and judgments liability are as follows (in thousands): Unpaid Claims, July 1 $ 1,750,019 $ 1,640,043 Provisions for current year's events and changes in provision for prior years' events 441, ,229 Claims payments (179,027) (222,253) Unpaid Claims, June 30 $ 2,012,958 $ 1,750,019 P. Accrued Landfill Liability Until July 1996, the City operated the Lopez Canyon Sanitary Landfill under a Conditional Use Permit (CUP), which expired on July 1, State and Federal laws required the City to close the landfill upon expiration of the CUP, and to monitor and maintain the site for thirty years after closure. The City recognized a portion of the estimated closure and postclosure care costs in each fiscal year based on landfill capacity used. As of June 30, 2008, the City s liability of $47.6 million represents 100% of the estimated closure and postclosure care costs of the landfill. The estimated costs of closure and postclosure care are subject to changes due to inflation, changes in laws and regulations, or changes in technology. As required by the California Integrated Waste Management Board (CIWMB), the City makes annual contributions to a trust fund to finance closure construction. The City is in compliance with the State requirements, and, at June 30, 2008, investments of $5.9 million are held for these purposes and are reported as Restricted Assets. The City is not currently required to advance fund postclosure care costs. The City owns or operated other landfills that were already closed before the State and Federal requirements became enforceable. Therefore, no liability was included in the financial statements for these landfills (Toyon Canyon, Gaffey, Branford, Bishops Canyon and Sheldon-Arleta). The Landfill Closure and Post-closure Maintenance Special Revenue Fund was set up to defray the closure and postclosure maintenance costs of City landfills
164 NOTES TO THE BASIC FINANCIAL STATEMENTS Fiscal Year Ended June 30, 2008 NOTE 4 DETAILED NOTES ON ALL FUNDS (Continued) Q. Power Enterprise Fund Derivative Instruments In accordance with GASB Technical Bulletin 03-01, the Power Enterprise fund does not record its derivative instruments on the financial statements, but instead discloses the derivatives in the notes to the financial statements and records the impact upon settlement of the derivatives. The Fund had three main types of derivative instruments as of June 30, 2008: electricity swaps, forward contracts, and financial natural gas hedges. As of June 30, 2008, the fair values of these outstanding derivative instruments were $213.4 million. Objective of electricity swaps. In order to obtain the highest market value on energy that is sold into the wholesale market, DWP monitors the sales price of energy which varies based on which hub the energy is to be delivered. There are three primary hubs within DWP s transmission region: Palo Verde, California-Oregon Border and Mead. DWP enters into various locational swap transactions with other electric utilities in order to effectively utilize its transmission capacity and to achieve the most economical exchange of energy purchased and sold. A call option is the right, but not the obligation, to buy energy at a fixed price on or before a specific date. Because the DWP has excess electric generation available at certain times during the year, it sells call options for a premium to other utilities. If the buyer calls the option, DWP is obligated to sell the energy for a specified dollar amount and deliver it to a specific delivery point. If the buyer does not call the option, DWP has no obligation to deliver energy, but does retain the premium collected. DWP does not enter into forward and option agreements for trading purposes. DWP is exposed to risk of nonperformance if the counterparties default or if the swap agreements are terminated. Objective of forward contracts. DWP enters into forward contracts in order to meet the electricity requirements to serve its customers. Objective of financial natural gas hedges. DWP enters into natural gas hedging contracts in order to stabilize the cost of gas needed to produce electricity to serve its customers
165 NOTES TO THE BASIC FINANCIAL STATEMENTS Fiscal Year Ended June 30, 2008 NOTE 4 DETAILED NOTES ON ALL FUNDS (Continued) Terms, fair value, and credit risks. As of June 30, 2008, the Power Enterprise Fund had the following derivatives which were not recorded in the statement of net assets: Cash Paid at First Last Fair Derivative Total Contract Contract Price Effective Termination Value Inception Description Quantities Range $ Per Unit Date Date (in thousands) (in thousands) Electricity swaps Purchases 309,120 MW $ /1/08 12/31/08 $ 193 $ -- Sales 309,120 MW /1/08 12/31/ Forward contracts Electricity 2,041,968 MW /1/08 12/31/11 37, Natural gas 584,000 MMBtu /1/08 9/30/ Financial natural gas hedges* 78,738,500 MMBtu /1/08 6/30/17 175,060 (81) * Financial hedges were variable to fixed rate swaps that serve to lock in a fixed cost of natural gas. Fair value. All fair values were estimated using forward market prices available from broker quotes and exchanges. Credit Risk. The Power Enterprise Fund is exposed to credit risk related to nonperformance by its wholesale counterparties under the terms of these contractual agreements. In order to limit the risk of counterparty default, DWP has implemented a Wholesale Marketing Counterparty Evaluation Policy, which was amended and renamed as Counterparty Evaluation Credit Policy (the Policy), and was approved on May 6, Under the new policy, the scope has been expanded beyond physical power to include transmission, physical natural gas, and financial natural gas. Also, the credit limit structure has been categorized into short-term and long-term structures where the shortterm structure is applicable to transactions with terms of up to 18 months and the long-term structure to cover transactions beyond 18 months. The Policy includes provisions to limit risk including: the assignment of internal credit ratings to all DWP counterparties based on counterparty and/or debt ratings; the use of expected default frequency equivalent credit rating for short-term transactions; the requirement for credit enhancements (including advance payments, irrevocable letters of credit, escrow trust accounts, and parent company guarantees) for counterparties that do not meet an acceptable level of risk; and the use of standardized agreements which allow for the netting of positive and negative exposures associated with a single counterparty. As of June 30, 2008, the twelve financial natural gas hedge counterparties were rated by Moody s as follows: three at Aaa, five at Aa1, two at Aa3, and two at A1. The counterparties were rated by S&P as follows: two at AA+, four at AA, three at AA-, one at A+, and two at A. Based on the International Swap Dealers Association agreements, DWP obtains collateral to support derivatives subject to credit risk in the form of cash, negotiable debt instruments (other than interest-only and principal-only securities), or eligible letters of credit. Collateral posted by a counterparty is held by a custodian
166 NOTES TO THE BASIC FINANCIAL STATEMENTS Fiscal Year Ended June 30, 2008 NOTE 4 DETAILED NOTES ON ALL FUNDS (Continued) As discussed in Note 5B on page 158, during fiscal year 2001, the Power Enterprise Fund experienced nonperformance and material counterparty default with the California Independent System Operator (CAISO) and the California Power Exchange (CPX). The Power Enterprise Fund does not anticipate nonperformance by any other of its counterparties and has no reserves related to nonperformance at June 30, Apart from the events discussed in Note 5B, the Power Enterprise Fund did not experience any material counterparty default during fiscal year Basis Risk. DWP mitigates basis risk through long-term physical transportation contracts. Termination Risk. The Power Enterprise Fund or its counterparties may terminate the contractual agreements if the other party fails to perform under the terms of the contract. No termination events have occurred and there are no out-of-the-ordinary termination events contained in contractual documents. R. Community Redevelopment Agency Derivative Instrument Objective. In April 2008, in order to protect against the potential rising of interest rates, the CRA entered into an Interest Rate Cap Agreement on its variable rate $10.5 million Crown Coach Development Project Note. The cost associated with the agreement was limited to $65,000 upfront premium. An interest-rate cap is a derivative that protects the holder (in this case, the CRA) when the underlying interest rate (the variable interest rate of the $10.5 million note) exceeds a specified strike rate called the cap. Terms, fair value, and credit risks. The terms, including the fair value and credit rating of the counterparty, as of June 30, 2008 are as follows (dollar amounts in thousands): Notional Effective Fixed Rate Termination Counterparty Amount Date Paid Fair Value Date Credit Rating (1) $ 10,502 April 15, % $ 131 May 1, 2011 Aa3/A+ (1) Moody's Investors Service and Standard & Poor's, respectively. Fair Value. The fair value was estimated based on the projected future cash flows related to the cap. Market interest rates and market volatility were used to determine forward rates and zero coupon rates were used as discount factors for determining present value of future cash flows. Credit Risk. The cap s fair value represented the CRA s credit exposure to the counterparty as of June 30, To mitigate the credit risk, if at any time the rating of the long term debt, claims paying ability or financial strength of the counterparty falls below A+ or A1 as determined by S&P or by Moody s, respectively, the counterparty shall procure, at the counterparty s own expense, a replacement cap from a rate cap provider acceptable to S&P with the appropriate credit rating
167 NOTES TO THE BASIC FINANCIAL STATEMENTS Fiscal Year Ended June 30, 2008 NOTE 4 DETAILED NOTES ON ALL FUNDS (Continued) Termination Risk. The CRA or the counterparty may terminate the interest rate cap if the other party fails to perform under the terms of the agreement. The cap may be terminated by the CRA if the counterparty s credit quality rating falls below A- and A3 by S&P and Moody s, respectively, and the counterparty is unable to procure, at its own expense, a replacement interest rate cap from a cap provider acceptable to S&P with the appropriate credit rating. NOTE 5 OTHER INFORMATION A. Pension and Other Postemployment Benefit Plans Plan Descriptions The City of Los Angeles contributes to three single-employer defined benefit pension plans: Fire and Police Pension Plan (Pensions), Los Angeles City Employees Retirement Plan (LACERS), and Water and Power Employees Retirement, Disability and Death Benefit Insurance Plan (DWP Retirement Plan). Pensions and LACERS provide retirement benefits to sworn and civilian (other than DWP) employees, respectively. The DWP Retirement Plan provides retirement, disability, and death benefits to Department of Water and Power (DWP) employees. The City also provides three single-employer substantive other postemployment benefits (OPEB) healthcare plans through the aforementioned defined benefit plans: Fire and Police Health Subsidy Plan (Pensions OPEB), Los Angeles City Employees Postemployment Healthcare Plan (LACERS OPEB), and Water and Power Employees Retiree Health Benefits Plan (DWP OPEB). The City Charter assigns the administration of the plans to the Board of Administration/Commissioners of each plan. Subject to Council and Mayor approvals, the Boards implement amended benefit provisions. Each plan issues a publicly available financial report that includes financial statements and required supplementary information for that plan. Those reports may be obtained by writing or calling the plans. Department of Fire and Police Pensions Los Angeles City Employees 360 E. Second Street, Suite 400 Retirement System Los Angeles, CA E. Second Street, 2 nd floor (213) Los Angeles, CA (213) Department of Water and Power Retirement Office 111 N. Hope Street, Room 357 Los Angeles, CA (213)
168 NOTES TO THE BASIC FINANCIAL STATEMENTS Fiscal Year Ended June 30, 2008 NOTE 5 OTHER INFORMATION (Continued) Funding Policy The City s annual cost for each plan is calculated based on the annual required contribution (ARC) of the employer, an amount actuarially determined in accordance with the parameters of the applicable GASB Statements. The ARC represents a level of funding that, if paid on an ongoing basis, is projected to cover normal cost each year and to amortize unfunded actuarial liabilities over a period not to exceed thirty years. The City Administrative Code and related ordinances define member contributions. Benefit Pension Plans Annual Pension Cost and Net Pension Asset (Obligation) The City s annual pension cost for the current year, net pension asset (obligation) at the end of the year, and related information for each plan are as follows (dollar amounts in thousands): Pensions LACERS DWP Retirement Contribution rates: City 21.7% of covered 14.6% of covered 20.4% of covered payroll payroll payroll Plan members 6% - Tier % to 13.33% of 6% of salaries upon 7% - Tier 2 salaries at entry becoming a 8% - Tiers 3 & 4 age with City member on or 9% - Tier 5 subsidy for after June 1, 1984; members prior prior to June 1, to February 1983; 1984, amount is 6% for entry date based on entry after January 1983 age percentage rate Annual required contribution $ 261,635 $ 288,119 $ 144,744 Interest on net pension asset (obligation) -- 6,538 (10,514) Adjustment to annual required contribution -- (8,289) 15,667 Annual pension cost 261, , ,897 Contributions made 261, , ,874 Change in net pension asset (obligation) -- 1,751 (7,023) Net pension asset (obligation) - beginning of year -- (81,723) 130,333 Net pension asset (obligation) - end of year $ -- $ (79,972) $ 123,310 For the fiscal year ended June 30, 2008, the City s contribution to LACERS of $302.8 million is broken down as follows: $288.1 million ARC; $14.5 million defrayal portion of member contributions; and $0.2 million for family death benefits insurance plan
169 NOTES TO THE BASIC FINANCIAL STATEMENTS Fiscal Year Ended June 30, 2008 NOTE 5 OTHER INFORMATION (Continued) The City s annual pension cost, the percentage of annual pension cost contributed to the plans, and the net pension asset (obligation) for fiscal year and the two preceding years for each of the plans are as follows (dollar amounts in thousands): Net Pension Annual Pension Percentage of Asset Year Ended Cost (APC) APC Contributed (Obligation) Pensions 6/30/06 $ 143, % $ -- 6/30/07 224, % -- 6/30/08 261, % -- LACERS 6/30/06 227, % (83,049) 6/30/07 276, % (81,723) 6/30/08 286, % (79,972) DWP Retirement 6/30/06 124,724 82% 148,564 6/30/07 147,288 88% 130,333 6/30/08 149,897 95% 123,310 Funded Status and Funding Progress The following is funded status information for each plan as of June 30, 2008 (dollar amounts in thousands): Pensions LACERS DWP Retirement Actuarial Accrued Liability (AAL) $ 14,279,116 $ 11,186,404 $ 7,619,103 Actuarial Value of Assets 14,153,296 9,438,318 7,247,853 Underfunded AAL $ 125,820 $ 1,748,086 $ 371,250 Funded Ratio 99.1% 84.4% 95.1% Covered Payroll $ 1,206,589 $ 1,977,645 $ 708,732 Underfunded AAL as a percentage of covered payroll 10.4% 88.4% 52.4% Actuarial valuations involve estimate of the value of reported amounts and assumptions about the probability of events in the future. Amounts determined regarding the funded status of the plans and the annual required contributions of the City are subject to continual revision as actual results are compared to past expectations and new estimates are made about the future. The required schedule of funding progress, presented as RSI following the notes to financial statements, presents multiyear trend information about whether the actuarial value of plan assets is increasing or decreasing over time relative to the AAL for benefits
170 NOTES TO THE BASIC FINANCIAL STATEMENTS Fiscal Year Ended June 30, 2008 NOTE 5 OTHER INFORMATION (Continued) Actuarial Methods and Assumptions The following is information as of the most recent actuarial valuation: Pensions LACERS DWP Retirement Plan Actuarial valuation date June 30, 2008 June 30, 2008 July 1, 2008 Actuarial cost method Entry age normal Projected unit credit Entry age normal Amortization method Level dollar - Tier 1 Level percent of payroll Level dollar Level percent of payroll - Tiers 2, 3, 4, & 5 Remaining amortization Multiple layers not Multiple layers not Multiple layers not period exceeding 30 years, exceeding 30 years, exceeding 15 years, closed closed closed Asset valuation method 5-year market related 5-year market related 5-year market related Actuarial assumptions: Investment rate of return 8% 8% 8% Projected salary 4.9% % 4.75% % 5.29% % increases Inflation rate 3.75% 3.75% 3.75% Cost-of-living 3.75% - Tiers 1 & 2 3% Based upon CPI adjustments 3% - Tiers 3, 4, & 5 increases with a 3% maximum
171 NOTES TO THE BASIC FINANCIAL STATEMENTS Fiscal Year Ended June 30, 2008 NOTE 5 OTHER INFORMATION (Continued) Other Postemployment Benefits (OPEB) The City Charter, the Administrative Code and related ordinance define the postemployment healthcare benefits. There are no member contributions for healthcare benefits. Annual OPEB Cost and Net OPEB Asset (Liability) The City s annual OPEB cost for the current year, net OPEB asset (liability) at the end of the year, and related information for each plan are as follows (dollar amounts in thousands): Pensions OPEB LACERS OPEB DWP OPEB City contribution rates 8.1% of covered 5.5% of covered 5.7% of covered payroll payroll payroll Annual required contribution $ 98,033 $ 108,848 $ 40,145 Interest on net OPEB asset (liability) 7, (35,720) Adjustment to annual required contribution (6,261) -- 26,652 Annual OPEB cost 99, ,848 31,077 Contributions made 78, , ,546 Change in net OPEB asset (liability) (21,358) ,469 Net OPEB asset - beginning of year ,745 Net OPEB asset (liability) - end of year $ (21,358) $ -- $ 556,214 The Pensions OPEB actuarial study for valuation date June 30, 2006 determined the annual required contribution for fiscal year ended June 30, To reflect the phasing-in of assumption changes, the Pensions Board adopted a contribution rate that was lower than the actuarially determined rate and resulted in a net OPEB liability. The annual OPEB cost for fiscal years beginning July 1, 2007, and continuing during the 30-year amortization period, shall include interest on the OPEB liability and adjustment to the annual required contribution
172 NOTES TO THE BASIC FINANCIAL STATEMENTS Fiscal Year Ended June 30, 2008 NOTE 5 OTHER INFORMATION (Continued) The City s annual OPEB cost, the percentage of annual OPEB cost contributed to the plans, and the net OPEB asset (liability) for fiscal year and the two preceding years for each of the plans are as follows (dollar amounts in thousands): Net OPEB Annual OPEB Percentage of Asset Year Ended Cost (AOC) AOC Contributed (Liability) Pensions OPEB 6/30/06 $ 31, % $ -- 6/30/07 55, % -- 6/30/08 99,615 79% (21,358) LACERS OPEB 6/30/06 76, % -- 6/30/07 115, % -- 6/30/08 108, % -- DWP OPEB 6/30/06 112,554 47% (168,704) 6/30/07 81, % 430,745 6/30/08 31, % 556,214 Funded Status and Funding Progress The following is funded status information for each plan as of June 30, 2008 (dollar amounts in thousands): Pensions OPEB LACERS OPEB DWP OPEB Actuarial Accrued Liability (AAL) $ 1,836,840 $ 1,928,043 $ 1,358,103 Actuarial Value of Assets 767,647 1,342, ,637 Underfunded AAL $ 1,069,193 $ 585,123 $ 638,466 Funded Ratio 41.8% 69.7% 53.0% Covered Payroll $ 1,206,589 $ 1,977,645 $ 708,732 Underfunded AAL as a percentage of covered payroll 88.6% 29.6% 90.1% Actuarial valuations involve estimate of the value of reported amounts and assumptions about the probability of events in the future. Amounts determined regarding the funded status of the plans and the annual required contributions of the City are subject to continual revision as actual results are compared to past expectations and new estimates are made about the future. The required schedule of funding progress, presented as RSI following the notes to financial statements, presents multiyear trend information about whether the actuarial value of plan assets is increasing or decreasing over time relative to the AAL for benefits
173 NOTES TO THE BASIC FINANCIAL STATEMENTS Fiscal Year Ended June 30, 2008 NOTE 5 OTHER INFORMATION (Continued) Although no formal funding policy has been established for the future benefits to be provided under the DWP OPEB Plan, DWP has made significant contributions into the Plan. In fiscal year 2008, the DWP transferred $100 million into the Plan and paid an additional $56.5 million in retiree medical premiums. The Power and Water Enterprise Funds portions of these amounts were $106.5 million and $50 million, respectively. Actuarial Methods and Assumptions Projections of benefits are based on the substantive plan and include the types of benefits in force at the valuation date. Actuarial calculations reflect a long-term perspective and employ methods and assumptions that are designed to reduce short-term volatility in actuarial accrued liabilities and the actuarial value of assets. Significant methods and assumptions are as follows: Pensions OPEB LACERS OPEB Actuarial valuation date June 30, 2008 June 30, 2008 June 30, 2008 Actuarial cost method Entry age normal Projected unit credit Entry age normal Amortization method Level percent of payroll Level percent of payroll Level percent of payroll Remaining amortization 28 years, closed Multiple layers not 27 years, closed period exceeding 30 years, closed Asset valuation method 5-year market related 5-year market related Market value at valuation date Actuarial assumptions: Investment rate of return 8% 8% 8% Projected salary 4.25% 4.25% 4.25% increases Inflation rate 3.75% 3.75% 3.75% DWP OPEB Healthcare cost trend rates Medical 9%, decreasing by 8.75%, decreasing by 9%, decreasing by 0.5% for each year 0.5% for each year 0.5% for each year for eight years until it for eight years until it for eight years until it reaches an ultimate reaches an ultimate reaches an ultimate rate of 5% rate of 5% rate of 5% Dental 5% 5% 5%
174 NOTES TO THE BASIC FINANCIAL STATEMENTS Fiscal Year Ended June 30, 2008 NOTE 5 OTHER INFORMATION (Continued) Deferred Retirement Option Plan Effective May 1, 2002 and through April 30, 2007, members of the Pensions have the option to enroll in a Deferred Retirement Option Plan (DROP). Members of Tiers 2 and 4 who have at least 25 years of service, and members of Tiers 3 and 5 who have at least 25 years of service and who are at least 50 years old are eligible for the DROP. The DROP program was extended to April 20, 2012 and enrollment in the program was extended. Members who enroll continue to work and receive their active salary for a period of time not to exceed five years. Enrolled members continue to make contributions to the Pensions until they have completed the number of years required for their specific tiers but cease to earn retirement service and pay credits. Monthly pension benefits that would have been paid to enrolled members are credited to their DROP accounts which will earn 5% annual interest. Once the DROP participation period ends, enrolled members must terminate active employment. They then receive proceeds from their DROP account and a monthly benefit based on their service and salary at the beginning date of the DROP, plus applicable cost of living adjustments. At June 30, 2008, there were 1,107 pensioners enrolled in the DROP program and the total estimated value of the DROP accounts at that date was $221 million. Community Redevelopment Agency Employees Retirement System and Other Postemployment Benefits Retirement System The CRA contributes to the California Public Employees Retirement System (CalPERS), an agent multiple-employer public employee defined benefit pension plan. CalPERS provides retirement and disability benefits, annual cost-of-living adjustments, and death benefits to plan members and beneficiaries. CalPERS acts as a common investment and administrative agent for participating public entities within the State of California. Benefit provisions and all other requirements are established by state statute and authorized by the City Council. Copies of the CalPERS annual financial report may be obtained from its Executive Office at 400 P Street, Sacramento, California The pension plan covers all full-time employees of the CRA. Under the provisions of CalPERS, pension benefits fully vest after five years of service. An employee may retire at age 50 and receive annual pension benefits equal to a predetermined percentage of the employee s salary earned during the highest 12 consecutive months of employment multiplied by the number of years of service. Under the CRA s current contract with CalPERS, the service requirement benefits vary from percent at age 50 to percent at age 63 and over, multiplied by the number of years of service
175 NOTES TO THE BASIC FINANCIAL STATEMENTS Fiscal Year Ended June 30, 2008 NOTE 5 OTHER INFORMATION (Continued) The contribution requirements of plan members and the CRA are established and may be amended by CalPERS. A summary of assumptions and methods used to determine the annual required contribution for the fiscal year ended June 30, 2008 is presented below. Actuarial valuation date June 30, 2007 Actuarial cost method Entry age actuarial cost method Amortization method Level percent of payroll Average remaining amortization period 21 years as of the valuation date Asset valuation method 15-year smoothed market Actuarial assumptions Investment rate of return 7.75% (net of administrative expenses) Projected salary increases 3.25% to 14.45% depending on age, service, and type of employment Inflation 3.00% Payroll growth 3.25% Individual salary growth A merit scale varying by duration of employment coupled with an assumed annual inflation growth of 3.00% and an annual growth of 0.25% Contribution rates for fiscal year ended June 30, 2008 CRA Plan members Annual pension cost $3,148,000 Contributions made % of covered payroll 7% of annual covered payroll (CRA makes this contribution for the employees on their behalf and for their account) $4,606,000 (including contributions for employees of $1,458,000) The three-year trend information is as follows (dollar amounts in thousands): Annual Pension Percentage of Net Pension Year Ended Cost (APC) APC Contributed Obligation 6/30/06 $ 2, % $ -- 6/30/07 3, % -- 6/30/08 3, %
176 NOTES TO THE BASIC FINANCIAL STATEMENTS Fiscal Year Ended June 30, 2008 NOTE 5 OTHER INFORMATION (Continued) As of June 30, 2007 (the most recent actuarial valuation date available), the CRA s retirement plan s funded status and funding progress are as follows (dollar amounts in thousands): Actuarial Accrued Liability (AAL) $ 149,785 Actuarial Value of Assets 135,101 Underfunded AAL $ 14,684 Funded Ratio 90.2% Covered Payroll $ 19,588 Underfunded AAL as a percentage of covered payroll 75.0% The schedule of funding progress, presented as RSI following the notes to financial statements, presents multi-year trend information on whether the actuarial value of plan assets is increasing or decreasing over time relative to the actuarial accrued liability for benefits. Other Postemployment Benefits The CRA currently funds the retiree medical and dental healthcare benefits on a pay-as-you-go basis. The CRA subsidizes healthcare benefits starting at 40% of maximum subsidy to retirees for the first ten years of service and increases at the rate of 4% each year of additional service. Eligible retirees pay premiums in excess of the subsidy. At 25 years of service and over 50 years of age, the retiree healthcare benefit is 100% subsidized. The plan is administered by the CRA and the CRA is currently negotiating with CalPERS to establish an OPEB trust fund. The CRA s annual OPEB cost and net OPEB liability at June 30, 2008 are as follows (dollar amounts in thousands): Contribution rate 15.2% of covered payroll Annual required contribution $ 3,321 Contributions made 717 Increase in OPEB liability 2,604 Net OPEB liability - beginning of year -- Net OPEB liability - end of year $ 2,
177 NOTES TO THE BASIC FINANCIAL STATEMENTS Fiscal Year Ended June 30, 2008 NOTE 5 OTHER INFORMATION (Continued) The CRA s annual OPEB cost, the percentage of annual OPEB cost contributed and the net OPEB liability for fiscal year are as follows (dollar amounts in thousands): Percentage of Net Annual Annual OPEB OPEB OPEB Cost Cost Contributed Liability $ 3,321 22% $ 2,604 The funded status of the plan as of June 30, 2008 is as follows: Actuarial Accrued Liability (AAL) $ 37,572 Actuarial Value of Assets -- Unfunded AAL $ 37,572 Funded Ratio 0.0% Covered payroll $ 21,835 Unfunded AAL as a percentage of 172.1% covered payroll Actuarial valuations involve estimate of the value of reported amounts and assumptions about the probability of events in the future. Amounts determined regarding the funded status of the plans and the annual required contributions of the City are subject to continual revision as actual results are compared to past expectations and new estimates are made about the future. Projections of benefits are based on the substantive plan and include the types of benefits in force at the valuation date. Actuarial calculations reflect long-term perspective and employ methods and assumptions that are designed to reduce short-term volatility in actuarial accrued liabilities and the actuarial value of assets. Significant methods and assumptions are as follows: Actuarial valuation date January 1, 2008 Actuarial cost method Entry age actuarial cost Amortization method Level percent of payroll Remaining amortization period 30 years, closed Asset valuation method 15-year smoothed market Actuarial assumptions: Investment rate of return 4.5% Projected salary increases 3.25% to 14.45% Inflation rate 5%
178 NOTES TO THE BASIC FINANCIAL STATEMENTS Fiscal Year Ended June 30, 2008 NOTE 5 OTHER INFORMATION (Continued) B. Commitments and Contingencies Pledges of Future Revenues The City has pledged certain future revenues for the payment of certain outstanding long-term obligations. Discussions about pledged revenues are included in Note 4l-Long-Term Liabilities beginning on page 111. Pending Lawsuits and Claims As mentioned in Note 4O on page 139, certain pending lawsuits and claims have a reasonable possibility of resulting in additional General Fund liability totaling approximately $142 million. However, no amount has been accrued in the accompanying financial statements because it is not probable that a loss has been incurred as of June 30, MacArthur Park May Day Incident Actions of the Police Department during the May 1, 2007 demonstrations at MacArthur Park are subjects of a number of lawsuits in federal and state courts. Plaintiffs claim for the federal cases range from $30 to $35 million plus $7.5 million in additional damages. No exact demands have been made on the state cases; however, plaintiffs counsel has indicated that they will seek approximately $20 million in damages. Rampart Division Litigation Investigations were conducted on the alleged illegal activities of some police officers at the Los Angeles Police Department s Rampart Division. As of December 30, 2008, all 214 lawsuits served on the City have been resolved. Rampart related employment lawsuits by some police officers against the City were also filed. A federal appeals court recently upheld a jury verdict for three police officers in one of the employment cases. An unfavorable result of this case and others could give rise to a liability of as much as $30 million. Federal Consent Decree The City has entered into a consent decree with the Federal government. It is a five-year agreement, which the court extended by three years to June 2009, that the City is required to implement in order to avoid litigation with the Federal government. Under the agreement, the City is required to build a database to track officer performance as well as undertake additional risk management and integrity assurance measures. Expenses associated with implementing the agreement which is expected to be absorbed through the regular budget process include the design and implementation of the officer tracking system, staff to implement and audit reforms, and an independent monitor to oversee implementation of the provisions of the agreement. Water Enterprise Fund Transfers to the General Fund The Howard Jarvis Taxpayers Association (HJTA) brought an action against the City alleging that the City overcharges water rates and that the overcharges violated Proposition 218. The overcharges exceeded the cost required to provide water service and resulted in surplus each year that the Water Enterprise Fund transferred to the General Fund. In 2000, the Court of Appeal ruled in favor of the City holding that metered water rates were not subject to Proposition 218. HJTA petitioned the State Supreme Court, but the Supreme Court denied review
179 NOTES TO THE BASIC FINANCIAL STATEMENTS Fiscal Year Ended June 30, 2008 NOTE 5 OTHER INFORMATION (Continued) In a July 2006 ruling on an essentially similar case, the State Supreme Court held that the lower court had erred in holding that metered water rates are not subject to Proposition 218. In a footnote, the Supreme Court ruled, Howard Jarvis Taxpayers Association v. City of Los Angeles is disapproved insofar as it is inconsistent with this conclusion. The Board of Water and Power Commissioners authorized transfers of $33.4 million and $29.9 million in fiscal years 2008 and 2007, respectively. However, due to the California Supreme Court decision, the City Attorney recommended that the City Council delay the transfer of such funds until a judicial resolution is obtained validating the legality of the transfer. Accordingly, the fund transfer has been conditioned by ordinance to be effective only upon a final judicial judgment upholding the proposed transfer rendered in a validation lawsuit or other legal action or proceeding by a court of competent jurisdiction. DWP filed a validation action in the Los Angeles County Superior Court in April It is anticipated that a trial court ruling will reach the Court of Appeal in 2009, with a decision from that court during that year or possibly in the early part of Airports Enterprise Fund Environmental Issues Through the normal course of operations, Airports and its facilities are subject to potential problems with environmental contamination and other environmental concerns. Accordingly, Airports has established a comprehensive hazardous materials management plan for all its facilities under its control. This plan calls for the evaluation of all property utilized by Airports and the environmental cleanup at any sites found to be contaminated. This evaluation has not been completed to date. Airports bears the responsibility for the cleanup of environmental contamination on property it owns. However, Airports believes that if the contamination originated based on contractual arrangements, the primary responsibility for any such cleanup would be borne by the tenants, even if they declare bankruptcy. Airports, as property owner, however, assumes the ultimate responsibility for cleanup of such contamination in the event that the tenant is unable to make restitution. As a result of the hazardous materials management plan noted above, Airports has already begun cleanup of several sites, is in the process of implementing additional safeguards to prevent additional hazardous substance contamination and is completing the environmental evaluation of Airports facilities. However, the extent of the cleanup and/or the ability of the original tenants to reimburse Airports for such cleanup cannot be determined at the present time. Therefore, under the circumstances, it is reasonably possible that losses could be incurred; however, until such matters are resolved, the range of loss, if any, cannot be reasonably estimated. Terminal Rents The Airports has lease arrangements at its passenger terminal facilities with American Airlines, Continental Airlines, Delta Air Lines, LAX TWO Corporation, and United Air Lines (collectively, the Long-term Airlines) that have various terms of up to 40 years. Under these leases, the Long-term Airlines pay various charges, including a maintenance and operations rent (M&O Rent) that reflects the expenses that the Airports incurs in maintaining and operating the terminals. The M&O Rent rates are set each calendar year based on the actual audited M&O expenses for the prior fiscal year ending June 30. Historically, less than the full amount of maintenance and operations expenses attributable to the airlines has been charged to the terminal tenants as M&O Rent. On December 18, 2006, the Board of Airport Commissioners (BOAC) approved a resolution setting the M&O Rent rate for 2006, effective January 1, 2006, based upon the full amount of maintenance and operations expenses during fiscal year ended June 30, 2005 attributable to the airlines for all LAX passenger terminals
180 NOTES TO THE BASIC FINANCIAL STATEMENTS Fiscal Year Ended June 30, 2008 NOTE 5 OTHER INFORMATION (Continued) The Long-term Airlines have objected to the Airports calculation of the M&O Rent as approved by the BOAC for On January 18, 2007, American Airlines, Continental Airlines, and United Air Lines filed a complaint with the United States District Court objecting to the 2006 M&O Rent. Subsequently, Northwest Airlines, as the primary shareholder of LAX TWO Corporation, and Delta Air Lines also filed objections. In February 2008, the Airports entered into interim settlement agreements with each of the Long-term Airlines resolving all disputed charges between January 1, 2006 and December 31, The agreements resulted in the issuance of credits for a portion of the amounts assessed to date. As part of these agreements, the Long-term Airlines and the Airports agreed to work together to reach an agreement on future charges implemented January 1, 2009 and after. To date, no new agreements have been reached; however, the parties have commenced negotiations. Separately, the BOAC approved a new lease form on December 18, 2006 with a subsequent institution of a tariff on January 22, Certain carriers utilizing terminals 1 and 3 as well as carriers operating from the Tom Bradley International Terminal objected to the tariff and filed a complaint with the U.S. Department of Transportation (USDOT). The USDOT issued its final decision on June 15, The decision resulted in a refund of a portion of the amounts assessed under the tariff to the complainants. A small number of tenants and sub-tenants were not party to the USDOT action and continued to be assessed at the tariff rate. Subsequent to the USDOT Supplemental Order on July 13, 2007, the carriers that are party to the USDOT complaint filed a petition to review at the United States Court of Appeals regarding the USDOT ruling. Pending the resolution of these objections, the Airports reported the disputed portion of the M&O Rent and interest earned totaling $95.2 million as part of other long-term liabilities. In July 2008, the Airports and the carriers that operate from the Tom Bradley International Terminal reached an agreement on M&O Rent and Base Rent charges settling all disputed charges between the period January 1, 2006 and December 31, The agreement resulted in the issuance of credits for a portion of the amounts assessed to date. The Partial Settlement Agreement signed on July 24, 2008 has not been fully implemented since all customer credits and revenue adjustments to be recognized are extremely complex and are still being calculated. In October 2008, the BOAC authorized a blanket order allowing the Executive Director to enter into letter of agreements with the carriers that are currently under the tariff, as well as new entrants regarding tariff charges. The letter of agreements may result in the issuance of credits for a portion of the amounts assessed to date. On December 11, 2008, the United States Court of Appeals began hearing oral arguments on the Petition to Review filed by carriers that are party to the USDOT complaint. Power and Water Enterprise Funds A number of claims and suits are also pending against DWP for alleged damages to persons and property and for other alleged liabilities arising out of DWP s operations. In the opinion of DWP management, any ultimate liability, which may arise from these actions, are not expected to materially impact the Power and Water Enterprise Funds financial statements
181 NOTES TO THE BASIC FINANCIAL STATEMENTS Fiscal Year Ended June 30, 2008 NOTE 5 OTHER INFORMATION (Continued) California Receivables and Refund Hearings During fiscal year 2001, the Power System made sales to two California agencies that were formed by Assembly Bill 1890 to facilitate the purchase and sale of energy and ancillary services in the State of California. Through June 30, 2007, these agencies, the CAISO, and the CPX, have made minimal payments since April 2001 on amounts outstanding to counterparties, including the Power System, for certain energy purchases in fiscal years 2000 and The CPX filed for protection under Chapter 11 of the Federal Bankruptcy Statute in January Two utilities with significant amounts due to these agencies have paid all amounts due to the CPX; however, the amounts remain in an escrow account pending the resolution of disbursement of the funds. As of June 30, 2008, a total of $166.5 million was due to the Power Enterprise Fund from the CAISO and the CPX. Claims have been filed questioning whether amounts charged for energy sold to the CAISO and the CPX during 2000 and 2001 represent unlawful profits that should be subject to refund. The Courts have opined that the Federal Energy Regulatory Commission (FERC) has no jurisdiction over the Department; however, the Courts have stated that the California parties seeking the refund may have a cause of action. As such, the litigation in this area is continuing. The Power Enterprise Fund has recorded a $50 million liability as of June 30, 2008 against the $166.5 million receivable, for potential refunds pertaining to its wholesale sales during 2000 and Management believes that this is the most probable amount that will be refunded by the Power System and is based on the most recent formula disclosed by FERC. While management has recorded its estimate of the most probable amounts that will be refunded, management does believe that it is entitled to all amounts due from sales to counterparties in California, including those named above. Furthermore, management believes that interest may be due to it on those amounts but any potential receivable is not estimable at this time. In addition, management does not believe that the Power System s exposure to any additional losses with respect to these receivable balances is currently estimable. If final settlement of these receivables results in an amount less than the recorded balance, net of the $50 million liability recorded, the Power Enterprise Fund will be required to record a loss in future periods. Capital Facilities Fee Claims In June 2007, the DWP received a tentative decision in favor of the State and a number of local government agencies that are electric customers of DWP that claimed that DWP has rates that include a capital facilities charge that violates the State s statute. However, in October 2008, DWP settled the case agreeing to pay the public entities $160 million through a combination of cash payments over a three-year period and bill credits over a ten-year period. Of the $160 million, $128.7 million was recorded as accounts payable and $31.3 million was recorded under long-term accrued liabilities in the Power Enterprise Fund s financial statements. Additionally, as permitted by generally accepted accounting principles, the DWP Board approved to defer all costs associated with the resolution of this litigation and establish a corresponding long-term deferred debit to be recovered through future revenues over a period of up to ten years, if necessary. Effective January 1, 2007, the California Legislature has amended Section of the Code, et seq., to clarify that, consistent with past practices, public agencies providing public utility service, such as DWP, may impose reasonable fee, including a rate, charge, or other surcharge for any product, commodity, or service provided to a public agency and any public agency receiving service from such public agency providing public utility services will pay the imposed fee
182 NOTES TO THE BASIC FINANCIAL STATEMENTS Fiscal Year Ended June 30, 2008 NOTE 5 OTHER INFORMATION (Continued) Harbor Enterprise Fund Alameda Corridor Transportation Authority Agreement In August 1989, the Harbor and the Port of Long Beach (the Ports) entered into a joint exercise of powers agreement and formed Alameda Corridor Transportation Authority (ACTA) for the purpose of establishing a comprehensive transportation corridor and related facilities consisting of street and railroad rights-of-way and an improved highway and railroad network along Alameda Street between the Santa Monica Freeway and the Ports in San Pedro Bay, linking the two ports to the central Los Angeles area. The Alameda Corridor began operating in April ACTA is governed by a seven-member board which is comprised of two members from each Port, one each from the Cities of Los Angeles and Long Beach and one from the Metropolitan Transportation Authority. In 2003, ACTA agreed to an expanded mission to develop and support projects that more effectively move cargo to points around Southern California, ease truck congestion, improve air quality, and make roads safer. If in the future ACTA becomes entitled to distribute income or make equity distributions, the Ports shall share any such income or equity distributions equally. In October 1998, the Ports, ACTA and the railroads companies (Railroads), which operate on the corridor, entered into a Corridor Use and Operating Agreement (Agreement). The Agreement obligates the Railroads to pay certain use fees and container charges (Use Fees), which ACTA will assess for the privilege of using the corridor to transport cargo into and out of the Ports. ACTA negotiated with the Railroads regarding certain types of cargo movements for which the Railroads are not paying Use Fees. In the Settlement and Release Agreement dated July 5, 2006, the Ports and ACTA release, acquit, and discharge the Railroads of all liability and costs arising from or relating to the transloading dispute; and the Railroads release, acquit, and discharge the Ports and ACTA of all liability and costs arising from or relating to any claim by the Railroads. These Use Fees are used to pay for: (a) the debt service for the bonds issued by ACTA ($1.2 billion issued in 1999 and $686 million issued in 2004), and (b) required reserves and financing costs. Use Fees end after 35 years or sooner if the ACTA Obligations are paid off earlier. If ACTA revenues are insufficient to pay ACTA Obligations, the Corridor Agreement obligates each Port to pay up to 20% of the shortfall (Shortfall) on an annual basis. If this contingency occurs, the Ports payments to ACTA are intended to provide cash for debt service payments and to assure that the Alameda Corridor is available to maintain continued cargo movements through the Ports. The Ports are required to include expected Shortfall payments in their budgets, but Shortfall payments are subordinate to other obligations of the Harbor, and neither of the Ports is required to take Shortfall payments into account when determining whether it may incur additional indebtedness or when calculating compliance with rate covenants under their respective bond indentures and resolutions. In April 2004, it was estimated by ACTA that the Ports would be required to make Shortfall payments totaling approximately $20.5 million (each port being liable for their one-half share of $10.25 million) through Pursuant to the ACTA Operating Agreement, Harbor is obligated to include any forecasted Shortfall payments in its budget each fiscal year. No shortfall payments were payable by Harbor in the prior years. ACTA notified the two ports in March 2008 that no Shortfall payment was required for the fiscal year ending June 30, 2008 due to transfers from other available sources and that the total amount of the Shortfall payment for fiscal year is estimated to be zero
183 NOTES TO THE BASIC FINANCIAL STATEMENTS Fiscal Year Ended June 30, 2008 NOTE 5 OTHER INFORMATION (Continued) Estimates of Shortfalls are prepared by ACTA and such Shortfalls could vary materially from the estimates. It is not possible to predict whether, when or how much the Harbor will be liable for Shortfall payments. In the opinion of Harbor management, Shortfall payments, if any, would not materially affect the financial position of the Harbor. Natural Resources Defense Council Settlement Judgment In March 2003, the Harbor settled a lawsuit entitled Natural Resources Defense Council, Inc. vs. City of Los Angeles, et al regarding the environmental review of a project. The settlement calls for a total of $50 million mitigation measures to be undertaken by the Harbor. The $50 million settlement liability was charged as an expense of the Harbor Enterprise Fund in fiscal year The terms of the settlement require that the Harbor fund various mitigation activities in the amount of $10 million each year over a five-year term ending fiscal year As of June 30, 2008, $50 million has been placed in the restricted mitigation funds. Pursuant to the settlement, the Harbor is also obligated to expend up to $5 million to retrofit customer vessels to receive shore-side power as an alternative to using on-board diesel fueled generators. Through the end of fiscal year 2008, the Harbor has spent $5 million for this program. In June 2004, the Harbor agreed to amend the original settlement agreement to include an additional $3.5 million for the creation of parks and open space in San Pedro. The settlement agreement also established an annual throughput cap at China Shipping Terminal. Actual throughput at the terminal exceeded the cap for calendar years 2007 and 2006; as a result the Harbor Enterprise Fund charged to non-operating expense and deposited in the restricted mitigation funds an additional $5.8 million and $3.9 million, respectively. As of June 30, 2008, the Harbor has disbursed a total of $22.3 million as provided in accordance with the provisions of the settlement. Settlement of Dispute on Nexus Study In January 2001, the City, Harbor, and the State Lands Commission, entered into a settlement and mutual release agreement to amicably resolve their disputes concerning the General Fund's entitlement to historic and future reimbursements for costs incurred and would incur in providing services to the Harbor. Such entitlement resulted from a series of studies, collectively referred to as the Nexus Study, conducted under the auspices of the City Attorney. The settlement agreement provides that the City's General Fund, as reimbursement for payments made by the Harbor to the City General Fund for retroactive billings for City General Fund services during the period July 1, 1977 through June 30, 1994, inclusive, pay the Harbor $53.4 million in principal plus 3% simple interest over 15 years. The settlement agreement also provides that the City General Fund reimburse Harbor for the payment differential, that amount representing the difference between the actual payments and the amount to which the City General Fund would have been entitled to reimbursement between fiscal year and fiscal year , inclusive, had the reimbursement been computed during those fiscal years using the settlement formula. This amount is estimated at $8.4 million. Payment for this period is to be reimbursed to the Harbor over 15 years including 3% simple interest. The agreement also provides that at any time after five years from January 19, 2001, the City, the Harbor and State Lands Commission may negotiate to amend their agreement to account for new or changed circumstances
184 NOTES TO THE BASIC FINANCIAL STATEMENTS Fiscal Year Ended June 30, 2008 NOTE 5 OTHER INFORMATION (Continued) The three parties have agreed to mutually release and discharge the other from any and all claims, demands, obligations and causes of action, of whatever nature pertaining in any way to the use, payment, transfer or expenditure for any of the services or facilities identified in the Nexus Study or the 1997 MOU and provided for during the period July 1, 1977 through June 30, Accordingly, the Harbor had recorded the amount due from the City General Fund as Advances From Other Funds of $32.3 million and the current portion as Due From Other Funds of $4 million as of June 30, Alleged Misuse of Federal Funds An individual has brought a lawsuit under the Federal Civil False Claims Act against the Harbor, the City, and the Harbor s former Executive Director, challenging the use by the Harbor of certain Federal and State funds for the construction of Pier 400 at the Harbor. The plaintiff alleges that the federal contribution amount to the construction of Pier 400 was $108 million and the State contribution was approximately $1 billion. The case was under seal from 2002 to 2005 while the Federal government determined whether to join as a plaintiff. In 2005, the Federal government decided not to join as a plaintiff. An amended complaint was served on the Harbor in August 2005 requesting treble damages. The Harbor believes that any claims alleging misuse of Federal and State funds are without merit. The defendants, including the City, filed motions to have the court dismiss the complaint or grant judgment in their favor. On August 11, 2006, the Court granted the City s and the Harbor s motion to disqualify the plaintiff, on the grounds that the plaintiff is not an attorney and therefore cannot represent the interests of the United States or the State in the action, and dismissed the lawsuit. Subsequently, the plaintiff brought motions to vacate the dismissal and to allow the substitution of an attorney. The trial court denied both of these motions. On October 13, 2006, the plaintiff in pro per filed a notice of appeal seeking review of the three court orders- order granting defendant s motion to disqualify relator and dismiss his claims, order denying relator s motion for substitution of counsel, and order denying relator s motion to vacate order of dismissal. The relator, Stanley Mosler, appealed the dismissal of the action to the Ninth Circuit. While the appeal was pending, the trial court judge issued a memorandum indicating that he may not have given the relator adequate notice that dismissal would result from his failure to have counsel. While the matter was pending appeal, the relator retained counsel. The Ninth circuit allowed the trial court to reconsider and vacate its prior order of dismissal. Recently, the Ninth Circuit has issued rulings dismissing the pending appeals and granting remand to the trial court. The parties anticipate further proceedings on the merits of the case in the trial court that should lead to a final adjudication. Westway Terminal Co. Inc. Westway Terminal Co. Inc. (Westway) operates a marine liquid bulk terminal at the Port of Los Angeles under a permit that expires in March On August 21, 2007, the City approved the Port s Settlement Agreement, Mutual Release and Compromise, and Permit Termination Agreement with Westway. Under the settlement, Westway s permit will be early terminated and Westway will vacate and surrender the premises on or before February 23, Within 30 days after the vacate and surrender date, the Harbor will pay Westway $17 million, less any applicable charges, as settlement payment
185 NOTES TO THE BASIC FINANCIAL STATEMENTS Fiscal Year Ended June 30, 2008 NOTE 5 OTHER INFORMATION (Continued) On August 21, 2007, the Harbor assumed responsibility for the cleanup and abatement order that the Regional Water Quality Control Board had issued to Westway. On and after the vacate and surrender date, the Harbor will assume responsibility for all claims, demands, and damages related to environmental conditions. Estimate of costs for any clean up and abatement of the property has not been determined. Westway vacated the premises effective September 15, In accordance with the settlement agreement, the Harbor wired $17 million to the account of Westway on October 2, This amount was accrued in the accompanying financial statements. Sewer Enterprise Fund Claims and lawsuits related to several construction projects seek compensation and/or payment of damages stemming from allegations of defective construction specifications, delayed early completion, concealed conditions, issues of interpretation of contract language, and other doctrines of construction and contract law which are asserted to support a claim for monies above the contract price. Additionally, claims of certain employees involving personnel matters are in litigation. The City Attorney estimates $48.2 million liability to be probable of occurring, of which $36.8 million is payable in the long-term. Community Redevelopment Agency In the normal course of its business, the CRA has been named as a defendant or co-defendant in several lawsuits and claims arising from its redevelopment activities. These claims against the CRA have been evaluated and CRA management believes that the ultimate resolution of such claims will not have a material impact on the financial condition of the CRA. In addition, the CRA, as a result of its real estate acquisition activities, is involved in eminent domain and other related litigation which may result in judgment or settlement amounts significantly higher that its initial court deposits or anticipated payments. Commitments As of June 30, 2008, the following Enterprise Funds have commitments for construction contracts and open purchase orders in the following amounts (in thousands): Airports $ 96,100 Harbor 290,152 Sewer 196,
186 NOTES TO THE BASIC FINANCIAL STATEMENTS Fiscal Year Ended June 30, 2008 NOTE 5 OTHER INFORMATION (Continued) Other Enterprise Fund Commitments Harbor Enterprise Fund In 1985, the Harbor received a parcel of land, with an estimated value of $14 million from the federal government, for the purpose of constructing a marina. The Harbor agreed to reimburse the federal government up to $14 million from excess revenues, if any, generated from marina operations after the Harbor has recovered all costs of construction. No such payments were made in fiscal year Power Enterprise Fund Purchase Power Commitments The DWP entered into a number of energy and transmission service contracts that involve substantial commitments as follows (dollars in thousands): DWP's Interest in Agency Share Agency Capacity Outstanding Agency Share Interest (Megawatts) Principal Intermountain Power Project IPA 100.0% 58.2% 1,022 $ 1,193,590 Palo Verde Nuclear Generating Station SCPPA 5.9% 67.0% ,219 Mead-Adelanto Project SCPPA 68.0% 36.0% ,972 Mead-Phoenix Project SCPPA 17.8% % 25.0% ,239 Southern Transmission System SCPPA 100.0% 60.0% 1, ,767 IPA: The Intermountain Power Agency is an agency of the State of Utah established to own, acquire, construct, operate, maintain, and repair the Intermountain Power Project (IPP). DWP Power System serves as the Project Manager and Operating Agent of IPP. SCPPA: The Southern California Public Power Authority, a California joint powers agency. Note: SCPPA's interest in the Mead-Phoenix Project includes three components. The above agreements require the Power Enterprise Fund to make certain minimum payments that are based mainly upon debt service requirements. In addition to average annual fixed charges of approximately $276 million during each of the next five years, the Power Enterprise Fund is required to pay for operating and maintenance costs related to actual deliveries of energy under these agreements (averaging approximately $321 million annually during each of the next five years). The Fund made total payments under these agreements of approximately $490 million in fiscal year These agreements are scheduled to expire from 2027 to The Power Enterprise Fund earned fees under the IPP project manager and operating agent agreements totaling $16 million in fiscal year
187 NOTES TO THE BASIC FINANCIAL STATEMENTS Fiscal Year Ended June 30, 2008 NOTE 5 OTHER INFORMATION (Continued) Long-term Notes Receivable Under the terms of its purchase power agreement with IPA, DWP is charged for its output entitlements based on its share of IPA s costs, including debt service. During fiscal year 2000, DWP restructured a portion of this obligation by transferring $1.11 billion to IPA in exchange for long-term notes receivable. The funds transferred were obtained from the debt reduction trust funds and through the issuance of new variable rate debentures. IPA used the proceeds from these transactions to defease and to tender bonds with par values of approximately $618 million and $611 million, respectively. On September 7, 2000, DWP paid $187 million to IPA in exchange for additional long-term notes receivable. IPA used the proceeds to defease bonds with a face value of $198 million. On July 20, 2005, DWP paid $97 million to IPA in exchange for additional long-term notes receivable. IPA used the proceeds to defease bonds with a face value of $92 million. The IPA notes are subordinate to all of IPA s publicly held debt obligations. The Power Fund s future payments to IPA will be partially offset by interest payments and principal maturities from the subordinated notes receivable. The net IPA notes receivable balance totaled $1.12 billion as of June 30, The IPA notes pay interest and principal monthly and mature on July 1, The interest rates range from 4.2% to 6.2%. Energy Entitlement DWP has a contract through 2017 with the U.S. Department of Energy for the purchase of available energy generated at the Hoover Power Plant. The Power Fund s share of capacity at Hoover is approximately 500 megawatts. The cost of power purchased under this contract was $15 million in fiscal year Palo Verde Nuclear Generating Station Matters As a joint project participant in Palo Verde Nuclear Generating Station (PVNGS), DWP has certain commitments with respect to nuclear spent fuel and waste disposal. Under the Nuclear Policy Act, the U.S. Department of Energy (DOE) is to develop facilities necessary for the storage and disposal of spent fuel and to have the first such facility in operation by 1998; however, the DOE has announced that such a repository cannot be completed before There is ongoing litigation with respect to the DOE s ability to accept spent nuclear fuel; however, no permanent resolution has been reached. Capacity in existing fuel storage pools at PVNGS was exhausted in A Dry Cask Storage Facility (also called the Independent Spent Fuel Storage Facility) was built and completed in 2003 at a total cost of $33.9 million (about $3.3 million for Power Enterprise Fund). The facility has the capacity to store all the spent fuel generated by the plant until the end of its life in The Power Enterprise Fund accrues for current nuclear fuel storage costs as a component of fuel expense as the fuel is burned. DWP s share of spent nuclear fuel costs related to its indirect interest in PVNGS is included in the Power Enterprise Fund s purchased power expense
188 NOTES TO THE BASIC FINANCIAL STATEMENTS Fiscal Year Ended June 30, 2008 NOTE 5 OTHER INFORMATION (Continued) The Price-Anderson Act (the Act) requires that all utilities with nuclear generating facilities share in the payment of claims resulting from a nuclear incident. Participants in the PVNGS currently insure potential claims and liability through commercial insurance with a $300 million limit; the remainder of the potential liability is covered by industrywide retrospective assessment program provided under the Act. This program limits assessments to a maximum of $100.6 million for each licensee for each nuclear incident occurring at any nuclear reactor in the United States; payments under the program are limited to $10 million per incident, per year. Based on DWP s 5.7% direct interest and its 3.95% indirect investment interest through SCPPA, DWP would be responsible for a maximum assessment of $9 million per incident, limited to payments of $1 million per incident annually. Environmental Matters Numerous environmental laws and regulations affect the Power System s facilities and operations. DWP monitors its compliance with laws and regulations, and reviews its remediation obligations on an ongoing basis. The following topics highlight some of the major environmental compliance issues affecting the Power System. Air Quality Nitrogen Oxide Emissions. DWP s generating station facilities are subject to the Regional Clean Air Incentives Market (RECLAIM) nitrogen oxide (NOx) emission reduction program adopted by the South Coast Air Quality Management District (SCAQMD). In accordance with this program, SCAQMD established annual NOx allocations for NOx RECLAIM facilities based on historical emissions and type of emissions sources operated. These allocations are in the form of RECLAIM trading emission credits (RTCs). Facilities that exceed their allocations may buy RTCs from other companies that have emissions below their allocations. DWP has a program of installing emission controls and purchasing RTCs, as necessary, to meet its emission requirements. As a result of the installation of NOx control equipment and the repowering of existing units, DWP has sufficient RTCs to meet its native load requirements for normal operations until For future years, DWP may need to acquire additional RTCs. Air Quality Greenhouse Gas Emissions. In September 2006, Governor Schwarzenegger signed the California Global Warming Solutions Act of 2006 (AB32). The bill requires the California Air Resources Board to develop regulations and market mechanisms that will ultimately reduce California s greenhouse gas emissions by 25 percent by Mandatory caps will begin in 2012 for significant sources and be gradually reduced to meet the 2020 goals. As specified in the bill, all emissions from electricity that is consumed in the State, whether it is generated in California or in other states, will be subject to the cap. As a result, the Power system s share of emissions from Intermountain Power Plant and other facilities outside California will be subject to this program. It is uncertain at this time what impact this statute will have on the Power system s operations. If a cap and trade program is established, the primary issue will be how allowances will be allocated to DWP and other power producers. The target date of the Air Resources Board to adopt regulations is January 1, The goal of the regulations would be to achieve the maximum technologically feasible and cost-effective reductions in greenhouse gas, including provisions for using market mechanisms and alternative compliance mechanisms. DWP will be actively participating in the rulemaking process
189 NOTES TO THE BASIC FINANCIAL STATEMENTS Fiscal Year Ended June 30, 2008 NOTE 5 OTHER INFORMATION (Continued) SB 1368 was signed into law on September 29, 2006 and requires the California Public Utilities Commission (CPUC) and the California Energy Commission (CEC) to establish a greenhouse gases emissions performance standard and implement regulations for all long-term financial commitments in baseload generation made by load serving entities (LSEs) and local publicly owned electric utilities (POUs), respectively. The greenhouse gas emissions performance standard is not to exceed the rate of greenhouse gases emitted per MW hour associated with combinedcycle, gas turbine baseload generation. The regulations have been adopted by the CPUC for investor-owned utilities and by the CEC for publicly owned utilities and establish an emissions performance standard of 1,100 pounds of carbon dioxide per MW hour of electricity. Power Plant Once-Through Cooling Water Systems. Once-through cooling is the process where water is drawn from a source, pumped through equipment to provide cooling, and then discharged. Some type of cooling process is necessary for nearly every type of traditional electrical generating station, and the once-through cooling process is utilized by many electrical generating stations located next to large bodies of water. Typically, the water used for cooling is not chemically changed in the process although its temperature is increased. Due to the Second Circuit Court s decision to remand most of Environmental Protection Agency s (EPA) new 316(b) Rule, EPA suspended its new 316(b) Rule and is in the process of drafting a new rule. In the absence of EPA s 316(b) Rule, the California State Water Resources Control Board has decided to move forward and is in the process of developing their state-wide oncethrough cooling policy. In addition, other regulatory changes have been made that could significantly impact operations at the Haynes, Scattergood, and Harbor Generating Stations. The Regional Water Quality Control Board reclassified the body of water that the once-through cooling water is discharged to for the Harbor Generating Station, and sent a letter of intent to reclassify the body of water for the Haynes Generating Station discharge. Even though the Haynes Generating Station will be repowering existing units, should there be a reclassification for the water body discharges at the Haynes Generating Station, there will be requirements that cannot be met with its existing cooling or future repowered configuration. DWP is in the process of reviewing the regulations and conducting studies. Once the studies are reviewed, DWP will determine an appropriate course of action. Water Enterprise Fund Surface Water Treatment Rule The State of California Surface Water Treatment Rule (SWTR) imposes increased filtration requirements at any open distribution reservoirs exposed to surface water runoff. DWP has four major reservoirs in its system subject to SWTR: Upper and Lower Hollywood, Lower Stone Canyon, and Encino. To comply with SWTR, DWP has designed projects to remove these reservoirs from regular service through construction of larger pipelines and alternate covered storage facilities. The Hollywood Water Quality Improvement Project was completed in July Upper and Lower Hollywood Reservoirs were removed from service and functionally replaced by two 30 million gallon tanks and additional pipelines. Construction of the Encino project was completed in December Construction of the Lower Stone Canyon Water Quality Improvement Project began in December 2003 and completed in November With the completion of these two reservoir projects, DWP will have achieved compliance with SWTR
190 NOTES TO THE BASIC FINANCIAL STATEMENTS Fiscal Year Ended June 30, 2008 NOTE 5 OTHER INFORMATION (Continued) Stage 2 Disinfectants and Disinfection Byproduct Rule In January 2006, the Environmental Protection Agency (EPA) published the Stage 2 Disinfectants and Disinfection Byproduct Rule (Stage 2 DBP Rule) in the federal register. The Stage 2 DBP Rule strengthens public health protection for customers by tightening compliance monitoring requirements for two groups of disinfection byproducts, trihalomethanes (TTHM) and haloacetic acids (HAA5). DBPs form when naturally occurring materials in water (e.g. decomposing plant material) combine with chemicals added to disinfect the water. DBPs are associated with cancer. In order to comply with the requirements of the Stage 2 DBP Rule, DWP must change its primary disinfectant from chlorine to chloramines, a less reactive disinfectant, by April In order to convert to chloramines, DWP is proposing the construction of several chloramination stations, ammoniation stations, and the installation of mixers in tanks and reservoirs. The cost of Stage 2 DBP compliance related engineering studies and construction activities on the remaining eight projects are expected to be approximately $127 million at completion in Long Term 2 Enhanced Surface Water Treatment Rule In January 2006, the EPA published the Long Term 2 Enhanced Surface Water Treatment Rule (LT2) in the federal register. The LT2 builds upon the Safe Drinking Water Act and other earlier water quality rules to strengthen protection against microbial contaminants, especially Cryptosporidium. Cryptosporidium is a significant concern in drinking water because it contaminates most watershed used for the collection of drinking water and can cause gastrointestinal illness. DWP has six reservoirs in its system subject to LT2: Ivanhoe, Silver Lake, Elysian, Upper Stone Canyon, Santa Ynez, and Los Angeles. In order to comply with the requirements of LT2, DWP is proposing to either, cover, bypass, or build alternate covered storage for the aforementioned reservoirs and to install additional pipelines and related facilities. All these projects are in different stages of planning, design and construction. The cost of the LT2 compliance-related engineering studies and construction activities is expected to reach $1.7 billion at completion in Owens Lake During 1997, the Great Basin Unified Air Pollution Control District (the District) adopted an initial State Implementation Plan, as amended, and an implementing order requiring DWP to initiate pollution control measures to control particulate matters emitting from the Owens Dry Lake bed. DWP disputed the remediation measures imposed by the original order; however, in July 1998, DWP and the District entered into an historic Memorandum of Agreement (MOA) to mitigate the dust problem. The MOA delineated the dust-producing areas on the lakebed that needed to be controlled, specified what measures must be used to control the dust, and specified a timetable for implementation of the control measures. The MOA called for phased implementation to permit the effectiveness of the control measures to be evaluated and modifications to be made as the control measures were being installed
191 NOTES TO THE BASIC FINANCIAL STATEMENTS Fiscal Year Ended June 30, 2008 NOTE 5 OTHER INFORMATION (Continued) The MOA was incorporated into a formal air quality State Implementation Plan (SIP) by the District. This SIP was approved by the United States Environmental Protection Agency on October 4, The District revised and adopted the SIP in November The revised SIP defines the additional boundaries and areas required to be controlled on the lakebed. DWP was allowed to examine the District s methodology to determine the additional areas to be controlled. As a result of those efforts, the District ordered in the revised SIP that 29.8 square miles required control including the areas DWP agreed to and completed. The revised SIP demonstrates that upon completion of DWP s work, emissions from Owens Lake bed will have been reduced so that the Owens Valley Planning Area will attain and maintain the Federal Clean Air Act ambient air quality standards for particulate matter. The Federal Clean Air Act requires that Owens Lake meet ambient air quality standards by the end of The MOA specified that DWP must choose from among three control measures the District has certified as Best Available Control Measures for Owens Lake. The three measures are Shallow Flooding, Managed Vegetation, and Gravel. The first phase of dust control implementation, completed December 2001, consists of 13.5 square miles of Shallow Flooding. Shallow Flooding involves flooding the area to be controlled until it is either inundated with a few inches of water or the soil becomes thoroughly saturated to the surface with water. The second phase of dust control implementation, completed in July 2002, consists of about four square miles of Managed Vegetation. Managed Vegetation involves growing native vegetative cover that will hold the shifting and emissive lakebed in place, locking up the dust. The third and fourth phases of dust control implementation, completed in March 2003 and September 2005, respectively, consist of a total of 5.6 square miles of additional Shallow Flooding. The fifth phase completed the remainder of the required 29.8 square miles of dust control in December 2006 with Shallow Flooding. The total capital-related costs of implementing the 29.8 square miles of dust control measures through 2008 is approximately $413 million. In November 2006, DWP and the District entered into an agreement to settle their disputes arising from supplemental dust control measures proposed to be ordered upon DWP by the District (Settlement Agreement). The Settlement Agreement largely defines DWP s activities moving forward in terms of new dust control measure development and air quality regulatory and research activities. The essence of the agreement calls for the City to construct 12.7 square miles of dust control measures by April 2010, 9.2 square miles must be shallow flooding and the remaining 3.5 square miles can be of the City s own choosing, including a new low to zero water using method called moat and row. Following a successful demonstration project, DWP has decided to move forward with moat and row on 3.5 square miles. In turn, the agreement allows for new opportunities for water savings and a marked improvement as to how DWP will be regulated in the future. There will also be no additional determinations of supplemental control during the 3+ years of dust control measure development. The District issued a new revised SIP in February 2008 that included an order to control the additional dust control areas agreed to in the Settlement Agreement. DWP awarded a $120 million contract in October 2008 for construction of shallow flooding on 9.2 square miles. Due to concerns expressed by the California State Lands Commission and the California Department of Fish and Game, construction of moat and row on 3.5 square miles has been delayed in order to conduct additional environmental analysis. DWP expects to begin construction of moat and row in 2009 at an estimated cost of approximately $20 million
192 NOTES TO THE BASIC FINANCIAL STATEMENTS Fiscal Year Ended June 30, 2008 NOTE 5 OTHER INFORMATION (Continued) Fire and Police Pension System The Pensions has commitments to contribute capital for real estate and alternative investments in the aggregate amount of approximately $1,052.8 million at June 30, All members of the Pensions, except Tier 4 members, who were active on or after July 1, 1982 have vested rights to their past contributions and accrued interest in the event of termination prior to retirement. At June 30, 2008, the total amount subject to this right is $1,237.8 million. Los Angeles City Employees Retirement System At June 30, 2008, the LACERS was committed to future purchases of real estate and alternative investments at an aggregate cost of approximately $891 million. Community Redevelopment Agency Hollywood and Highland Projects The CRA helped to facilitate public improvement financing for the Hollywood and Highland commercial development by the TrizecHahn Corporation (the Developer). Public financing consisted of taxable certificates of participation issued by MICLA for the live broadcast theater and tax-exempt parking revenue bonds issued by the City for a subterranean parking structure. The debt service requirements for the theater certificates of participation are paid from the annual lease rental payments from the City s General Fund. To the extent that the transient occupancy tax generated by the hotel project at the site is less than the annual debt service requirement, the Developer (or its successor) has guaranteed up to 74% of the shortfall. Under certain conditions, the Developer may be released from the guarantee after the eleventh year (year 2010). In a cooperation agreement executed in February 2004, the CRA agreed to guarantee the remaining 26%, net of certain exclusions, payable from tax increment revenues or other legally available funds from the Hollywood Redevelopment Project Area (Project Area). The CRA will be released from this guaranty when the developer is released from its guaranty as described above. Unless subordination is approved by the City Council, the pledge of tax increment is senior to all future pledges of tax increment from the Project Area. The parking revenue bonds are payable from and secured by a pledge of the parking revenues deposited into the City s Special Parking Revenue Fund. The February 2004 cooperation agreement does not require the CRA to provide a back-up reimbursement mechanism should parking revenues be insufficient to pay for the debt service on the parking bonds. The obligation to pay Hollywood Project tax increment revenues to the City, under certain conditions, is subject to prior and senior obligations to pay tax allocation bond debt service, housing set-asides as required by State law, and pass-through payments arising from agreements with the County of Los Angeles, the Los Angeles Unified School District, and the Los Angeles Community College District
193 NOTES TO THE BASIC FINANCIAL STATEMENTS Fiscal Year Ended June 30, 2008 NOTE 5 OTHER INFORMATION (Continued) Others At June 30, 2008, the CRA had approximately $151.8 million in outstanding commitments. These commitments include $14.6 million shift of tax increment to K-12 schools and community colleges during fiscal year 2009 to help alleviate the State s budget deficit. Other commitments include projected fiscal year 2009 expenditures for work program pursuant to executed agreements like disposition and development agreements, loan agreements, and memoranda of understanding. C. Third-Party Obligations The City participated in the issuance of the following indebtedness to provide financing to privatesector entities for the acquisition, construction and improvements of housing, commercial, educational, medical and other facilities deemed to be in the public interest (in thousands): Issue Outstanding June 30, 2008 Multifamily Housing Bonds - 98 Issues $ 592,858 Home Mortgage Revenue Bonds - 8 Issues 12,812 Bond proceeds were used to provide loans for the construction and financing of multi-family rental and single-family residences in the City. The indebtedness is secured solely by the property financed by the respective bond issues and by credit guarantees by reinvestment-grade financial institutions. Industrial Development Bonds - 31 Issues 297,393 The proceeds were used to provide manufacturers low cost financing to expand industrial capacity and stimulate job creation in the City. The City has no financial obligation as each bond is secured through a letter of credit. Limited Obligation Medium-Term Improvement Notes - 1 Issue 6,489 The proceeds were used to provide financing for fire safety improvements in privately owned buildings in the City. The notes are supported solely through annual assessments on the properties and the value of the underlying properties themselves. Community Facilities District No. 3 Special Tax Bonds 5,467 The proceeds were used to fund acquisition and construction of certain public improvements for the Cascade Business Park and Golf Course. The City's obligation is limited to collecting the special taxes annually levied and collected from the District for debt service payments. Community Facilities District No. 4 Special Tax Bonds 132,270 The proceeds were used to fund acquisition and construction of certain public improvements for the Playa Vista Development project. The City's obligation is limited to collecting the special taxes annually levied and collected from the District for debt service payments. Street Improvement 1911/1913 Act Bonds 1,530 The proceeds were used to finance certain public improvements for the Westwood Village Streetscape Assessment District. The City's obligation is limited to collecting the assessments annually levied for debt service payments. $ 1,048,
194 NOTES TO THE BASIC FINANCIAL STATEMENTS Fiscal Year Ended June 30, 2008 NOTE 5 OTHER INFORMATION (Continued) The City is not obligated in any manner for repayment of the indebtedness. Accordingly, the liabilities are not reported in the accompanying financial statements. Community Redevelopment Agency In order to encourage redevelopment activities by the private sector, the CRA has authorized the issuance of tax-exempt revenue bonds and certificates of participation. The private sector assets and revenues generated by the respective projects are the collateral for the indebtedness. As of June 30, 2008, the outstanding balance of such issues was $776.1 million. The CRA is not obligated for the repayment of such debt; therefore, the liabilities are not included in the accompanying financial statements. D. Other Matters Telephone Users Tax The City s telephone users tax ordinance has been the subject of litigation challenging application of the tax to certain telecommunications services as a result of outdated ordinance definitions or references to outdated federal laws. To provide reasonable certainty in the collection and receipt of this General Fund revenue, the electorate approved Proposition S, Reduction of Tax Rate and Modernization of Communications Users Tax, on the February 5, 2008 election ballot. This measure replaced the prior telephone users tax ordinance and reduced the rate of the City tax on users of communication services from 10% to 9%. The new ordinance applies to all users of telephone services, whether traditional land-line, wireless, or broadband telephone service to the extent permitted by federal law. Federal law currently prohibits the taxing of internet charges (such as charges from internet service providers for access to the internet) and accordingly, internet access is not taxed. The new ordinance provides for taxation of a broader tax base than the prior ordinance, and includes private communication services, voice mail, paging services, text messaging, and pay-phone usage. While the reduced tax rate is expected to reduce revenue in the first year, some of that loss is expected to be offset because the new ordinance distributes the tax burden to similarly situated communication services users. Business Tax Reform In November 2004, the Mayor and City Council adopted a package of changes to the City s business tax system that became effective in January One of the changes is the gradual reduction of the business tax rates. When business tax revenue receipts exceed the budgeted amount, the business tax rates applied on gross receipts can incur a reduction of up to 4% per year. Over time, the ordinance allows for a maximum of 15% reduction. Tax rate reductions of 3.1%, 4%, and 4% were effective January 1, 2006, January 1, 2007, and January 1, 2008, respectively, for a total of 11.1%. An additional 3.9% tax rate reduction will be effective January 1,
195 NOTES TO THE BASIC FINANCIAL STATEMENTS Fiscal Year Ended June 30, 2008 NOTE 5 OTHER INFORMATION (Continued) Loans Receivable from Los Angeles Community Development Bank The Los Angeles Community Development Bank (LACDB), a nonprofit corporation and not a commercial bank, was formed in June 1995 for the purpose of providing economic development loans, guarantees and other forms of credit, credit enhancement and capital to certain businesses or community development enterprises within the greater Los Angeles area. On March 17, 2004, because of the LACDB s poor financial condition, the Board of Directors of LACDB determined to dissolve and liquidate, and authorized the filing of an action for dissolution in the State Superior Court. On April 1, 2004, such action was filed and a Receiver was appointed to, among other things, take over and manage LACDB s affairs, including the dissolution, liquidation, and winding up of LACDB. On April 8, 2004, the Receiver caused LACDB to file for bankruptcy. To secure the loan balance LACDB owes the City, the City was granted a security interest in substantially all of LACDB s assets. At the time the Receiver filed for bankruptcy, LACDB owed the City $45 million in loans for which the City has provided full allowance for uncollectibility. The City recognized a long-term debt equivalent payable to HUD. The $45 million long-term debt represented the outstanding portion of the City s participation in the U.S. Department of Housing and Urban Development Section 108 Government Guaranteed Participation Certificates, Series HUD 1999-A (Section 108 Certificates). The Section 108 Certificates represent a fractional undivided interest in a portion of a trust sponsored by the Secretary of HUD and administered by a trustee. As required by law and to assure the repayment of the certificates, the City s participation was secured by a pledge of Community Development Block Grants that the City may become eligible to receive. During the bankruptcy case, LACDB and the City negotiated an agreement to facilitate asset liquidation. As part of the agreement, LACDB sought court authority to market and offer the loan portfolio of LACDB for public sale. The sale of the loan portfolio was completed on April 10, 2006 and the City received its share of $3.4 million. During fiscal year 2007, $10.6 million was remitted to the City from loans collected from LACDB borrowers. The City applied the $3.4 million and $10.6 million as reductions of the LACDB receivable. At June 30, 2007, the receivable and uncollectible reserve balances were reduced from $45 million to $31 million. On July 11, 2007, the City paid $5 million (plus applicable interest) of the $45 million Section 108 Certificates. The payment was from the proceeds of the sale of the loan portfolio and from collections from LACDB borrowers. On October 18, 2007, the Mayor and City Council authorized the defeasance of the remaining $40 million Section 108 Certificates utilizing funds from the following sources: (a) remaining LACDB loan repayments and loan portfolio sale proceeds, (b) LACDB related Economic Development Initiative grant funds, and (c) Community Development Block Grant funds. The defeasance occurred on November 7, 2007 and resulted in a cash flow savings of $10.6 million and an economic gain of $2.5 million. The LACDB Receiver filed a Notice of and Receiver s Final Report, Accounting and Request for Order Dissolving the Corporation that the State Superior Court approved on February 20, Consequently, the receivable and uncollectible reserve balances of $31 million were written off
196 NOTES TO THE BASIC FINANCIAL STATEMENTS Fiscal Year Ended June 30, 2008 NOTE 5 OTHER INFORMATION (Continued) Airports Enterprise Fund High-Security Environment The Airports, like the rest of North American air transportation system, has been adversely affected by the terrorist attacks that occurred in the United States on September 11, 2001 (the September 11 Events). Since the September 11 Events, due in part to the September 11 Events and in part to the slowdown in the national economy, significant declines have been experienced in aviation activity and enplaned passenger traffic, as well as in activity-based revenues consisting primarily of landing fees, passenger facility charges, concession revenues and parking revenue. During fiscal year 2008, Airports passenger volume was 6.4% or 4.7 million below its pre-september 11 Events level. As part of its program of proactively addressing heightened security concerns and requirements, Airports has engaged in a review of its rates and charges, and has implemented revenue enhancements and expenditure controls that affect a variety of operating expenses. The Airports capital improvement program was also reevaluated and several planned expenditures were suspended, except where the affected projects were near completion or essential from a security or safety standpoint. Reductions in operating levels at the Airports from those that existed prior to the September 11 Events may continue for a period of time and to a degree that is uncertain. The future level of aviation activity and enplaned passenger traffic at the Airports will depend upon several factors directly and indirectly related to the September 11 Events, including, among others, the financial condition of individual airlines and the viability of continued services. A number of airlines are recovering from the economic difficulties they experienced immediately following the September 11 Events. Airports is unable to predict (i) the duration of current reduced air traffic volume, (ii) the long-term impact of the above-mentioned events on costs and revenues of Airports, (iii) the future financial condition of the airlines using Airports facilities, or (iv) the likelihood of future incidents of terrorism or other air transport disruptions. Passenger Facility Charges The Aviation Safety and Capacity Expansion Act authorized domestic airports to impose a passenger facility charge (PFC) on enplaning passengers. The Federal Aviation Authority (FAA) issued the regulations for the use of PFC s for airport projects that must meet at least one of the following criteria: (a) preserve or enhance safety, security or capacity of the national air transportation system; (b) reduce noise or mitigate noise impacts resulting from an airport; or (c) furnish opportunities for enhanced competition between or among carriers. The FAA has approved the Airports applications to impose $3 per passenger PFC s at the Los Angeles International (LAX) and Ontario International Airports to fund certain approved projects. The FAA approved an increased rate of $4.50 effective August 1, 2003 at LAX. Through June 30, 2008, the cumulative PFC collections and the related interest earned as reported to the FAA were $1,221.6 million and $146 million, respectively
197 NOTES TO THE BASIC FINANCIAL STATEMENTS Fiscal Year Ended June 30, 2008 NOTE 5 OTHER INFORMATION (Continued) Power Enterprise Fund Regulatory Matters Affecting the Power System Federal Regulation of Transmission Access The Energy Policy Act of 1992 (the Energy Policy Act) made fundamental changes in the federal regulation of the electric utility industry, particularly in the area of transmission. As amended by the Energy Policy Act, Sections 211, 212, and 213 of the Federal Power Act (FPA) provide FERC authority, upon application by any electric utility, federal power marketing agency, or other person or entity generating electric energy for sale or resale, to require a transmitting utility to provide transmission services (including any enlargement of transmission capacity necessary to provide such services) to the applicant at rates, charges, terms, and conditions set by FERC based on standards and provisions in the FPA. Under the Energy Policy Act, electric utilities owned by municipalities and other public agencies, which own or operate electric power transmission facilities that are used for the sale of electric energy at wholesale are transmitting utilities subject to the requirements of Sections 211, 212, and 213. FERC has encouraged in the past the voluntary formation of regional transmission organizations (RTOs) independent from owners of generation and other market participants that will provide transmission access on a nondiscriminatory basis to buyers and sellers of power. Investor-owned utilities (IOUs) and publicly owned utilities have been encouraged to participate in the formation and operation of RTOs, but are not, at this time, being ordered by FERC to participate. FERC has adopted a go slow approach to the issue of RTO formation in the western United States; it is contemporaneously engaged in a wholesale overhaul of the California market design, referred to initially as the Market Design 2002 proceeding and lately as the Market Redesign and Technology Update (MRTU) proceeding. These FERC proceedings will have potential impacts on every electric utility doing business in California. MRTU involves a comprehensive overhaul of the electricity markets administered by California Independent System Operator (CAISO), including the areas of transmission congestion management, trading and scheduling energy in the day ahead, or spot market, improved market power mitigation, and pricing transparency measures and system improvements to increase operational efficiency and enhance reliability, among other things. Currently, MRTU is scheduled to be implemented on February 1, It is not certain at this time what impact, if any, FERC s final decision on MRTU will have on the Power System. In addition, CAISO has announced its intention to implement further market changes over the next five years. Federal Energy Legislation On August 8, 2005, the Energy Policy Act of 2005 (the EP Act) was enacted, the first comprehensive energy legislation in over a decade. One of the most significant provisions of the EP Act empowers FERC to certify an Electric Reliability Organization (ERO) to improve reliability of the nation s bulk-power system through mandatory and enforceable electric reliability standards (in contrast to the long-standing voluntary system). The definition of bulk-power system does not include facilities used in the local distribution of electric energy. The ERO will file any proposed reliability standard or modification with FERC
198 NOTES TO THE BASIC FINANCIAL STATEMENTS Fiscal Year Ended June 30, 2008 NOTE 5 OTHER INFORMATION (Continued) A reliability standard is a requirement that provides for reliable operation of the bulk-power system. Such a standard includes requirements for the operation of existing transmission facilities or the design of planned additions or modifications to the extent necessary to provide for reliable operation. It does not include, and the ERO may not impose, any requirement to enlarge existing facilities or to construct new transmission or generation. All users, owners, and operators of the bulk-power system are required to comply with the electric reliability standards. The ERO may impose a penalty on a user, owner, or operator for violating a reliability standard, and FERC may order compliance with such a standard and impose a penalty if it finds that a user, owner, or operator is about to engage in an act that would violate a reliability standard. The EP Act authorizes FERC to require nondiscriminatory access to transmission facilities owned by municipal, cooperative, and other transmission companies not currently regulated by FERC, unless exercising this authority would violate a private activity bond rule for purposes of Section 141 of the Internal Revenue Code of FERC is prohibited from requiring any such entities to join RTOs. The EP Act also allows FERC to issue permits for the construction of new transmission facilities when states have been unable or unwilling to act and allows load-serving entities to use the firm transmission rights, or equivalent tradable or financial transmission rights, in order to deliver output or purchased energy to the extent required to meet its service obligations. The EP Act does not relieve a load-serving entity from any obligation under state or local law to build transmission or distribution facilities adequate to meet its service obligations, or to abrogate preexisting firm transmission service contracts. The EP Act directs FERC to establish, by rule, incentive-based rates for transmission no later than August 2006 and requires FERC to establish market transparency rules for the electric wholesale market (entities that have a de minimis market presence are exempt from the rules). The EP Act instructs that the market transparency rules must provide for the timely dissemination of information about the availability and prices of wholesale electric energy and transmission service to FERC, state commission, buyers and sellers of wholesale electric energy, users of transmission services, and the public. Within 180 days of the EP Act s enactment, FERC and the Commodity Futures Trading Commission are required to enter into a memorandum of understanding regarding information sharing pursuant to these rules. In addition, the EP Act prohibits any person from willfully and knowingly reporting false information to any federal agency on the price of wholesale electricity or availability of transmission capacity, or using (directly or indirectly) any manipulative device in contravention of any FERC rule. The EP Act increases civil and criminal penalties, modifies the procedures for review of FERC orders under the FPA, and changes the refund date under the FPA to be effective as of the date an applicable complaint is filed. The EP Act also establishes an entity s right to a refund if (i) it makes a short-term sale of electric energy through an organized market in which the rates for the sale are set by a FERC-approved tariff (not by a contract) and (ii) the sale violates the terms of the tariff or applicable FERC rule in effect at the time of the sale. Based on the EP Act authority vested upon the FERC, the FERC approved the North American Electric Reliability Corporation (NERC) as the ERO, and last year made mandatory more than 80 NERC and Western Electricity Coordinating Council (WECC) reliability standards, all of which are subject to penalties ranging from $1,000 to $1,000,000, depending on the impact of the violation to reliability and other factors. DWP has implemented a NERC/WECC Reliability Standards Compliance Program to proactively prevent, monitor, and stop any potential violations to these standards
199 NOTES TO THE BASIC FINANCIAL STATEMENTS Fiscal Year Ended June 30, 2008 NOTE 5 OTHER INFORMATION (Continued) The overall impact of the EP Act on the Power Enterprise Fund cannot be predicted at this time. Sewer Enterprise Fund Land Application of Biosolids A number of counties and other jurisdictions currently ban or are considering to ban the bulk land application of biosolids. The City reuses biosolids, a by-product or residual of wastewater treatment, as soil amendment at a City-owned farm in Kern County. The Hyperion and Terminal Island Treatment Plants, using the highest level of treatment, are producing Exceptional Quality biosolids. A Kern County voter-approved initiative banned the land application of biosolids beginning early In August 2007, the Kern County initiative was overturned in the courts; however, the Kern County Board of supervisors has appealed this decision. National Pollutant Discharge Elimination System Permits In October 1998, the City filed an appeal of its National Pollutant Discharge Elimination System (NPDES) permits for the DC Tillman Water Reclamation Plant (DCTWRP) and the Los Angeles- Glendale Water Reclamation Plant (LAGWRP) to the State Water Resources Control Board. The permits set stringent effluent limits for a variety of constituents. Since then, the case has been heard by the Superior and Appellate Courts and the California Supreme Court agreed to review the Appellate Court decision. In April 2005, the State Supreme Court issued an opinion that affirmed the judgment of the Court of Appeal reinstating the permits to the extent that the specified numeric limitations on chemical pollutants are necessary to satisfy the Federal Clean Water Act requirements for treated wastewater. The State Supreme Court also remanded the matter to the trial court to decide whether any numeric limitations, as described in the permits, are more stringent than required under federal law and thus should have been subject to economic considerations by the California Regional Water Quality Control Board- Los Angeles Region (RWQCB) before inclusion in the permits. On June 28, 2006, a judge of the Superior Court issued a final opinion of the remand issue. The judge stated that the State set numeric limits that exceeded federal standards for eleven constituents. For these constituents, the State needed to do an economic analysis. The judge also directed the State to file new permits with the Court within 90 days demonstrating compliance with all of the previous decisions. The State Attorney General s Office received an extension to the deadline for filing new permits for LAGWRP and DCTWRP to December 28, New NPDES permits were adopted by the RWQCB on December 14, The permits contain more stringent limits for copper based on the California Toxics Rule and other constituents based on drinking water standards. The City filed an appeal to the State Water Resources Control Board (SWRCB) and requested that the permits be held in abeyance. In March 2007, the Superior Court ruled that the SWRCB must review the permits prior to making a final determination of whether the RWQCB followed all of the decisions in this case. The City s primary contention is that the RWQCB based certain limits on drinking water standards to protect groundwater that exceeded federal standards, without performing an economic analysis. The City is presently involved in settlement negotiations with the State Attorney General and the RWQCB prior to activating its appeal for review at the SWRCB and potentially returning to the Superior Court
200 NOTES TO THE BASIC FINANCIAL STATEMENTS Fiscal Year Ended June 30, 2008 NOTE 5 OTHER INFORMATION (Continued) The City and the City of Burbank are also participating in a Copper Site-Specific Objective Study (Study) that if successful, would aid compliance with the new copper limits. The Study is nearing completion and will be forwarded to a Stakeholders Committee for review. It is hoped that the Study will be considered by the RWQCB sometime late next year. The City is also conducting in-house studies to determine whether changes in sampling and testing protocols could help in complying with new permit limits. At this time, it is difficult to predict the financial impact to the City until completion of these studies and settlement negotiations. If these strategies are not successful, it is possible that the City may be required to install new treatment processes at a substantial cost. The new permits also require compliance with the Nitrogen Total Maximum Daily Load and contain a compliance schedule to allow the City to construct Nitrification-Denitrification (NDN) facilities by September 2007 at both DCTWRP and LAGWRP. These NDN facilities have been constructed and are in operation. An Ammonia Site-Specific Objective Study was approved by the RWQCB in May The adoption of this will allow the adjustment of ammonia limits that will allow operators flexibility in the disinfection process. The Study must be approved by the SWRCB and Office of Administrative Law before the permits can be reopened and the results of the study inserted into the permits. The RWQCB adopted the Terminal Island Water Reclamation Plant (TIWRP) NPDES permit on April 7, 2005, which became effective on May 27, TIWRP s permit included more stringent discharge limitations. As a result, plant modifications or new process operations may be necessary. A five-year compliance schedule was provided to allow time for compliance with new limits and to provide additional data for application of dilution credit. The City provided data to RWQCB in September 2007 that supports the granting of dilution credits for certain constituents. Based on the additional data submitted on October 2, 2008, the RWQCB adopted a permit amendment granting dilution credits for several metals, ammonia, and methylene blue active substances. Because the dilution credits were granted, the City will, most likely, not be required to install costly new treatment processes. Total Maximum Daily Loads for Impaired Waterbodies The RWQCB is required to develop Total Maximum Daily Loads (TMDLs) for impaired waterbodies. Various watersheds in the Los Angeles area have waterbody segments that are listed as impaired due to variety of pollutants. Although TMDLs have already been released, additional TMDLs will be under development and compliance with both existing and new TMDLs will continue into next decade. The City s Bureau of Sanitation is participating in the stakeholder process for TMDL development. At this time, it is difficult to predict the full impact of TMDLs on the NPDES effluent limits at the City s four treatment plants. However, it is expected that significant capital improvements may be required to comply with the TMDLs
201 NOTES TO THE BASIC FINANCIAL STATEMENTS Fiscal Year Ended June 30, 2008 NOTE 5 OTHER INFORMATION (Continued) Challenge to Final Environmental Impact Report On December 7, 2006, the City was served with a Notice of Commencement of Action arising under the California Environmental Quality Act by the City of Burbank. The City of Burbank challenged the adequacy of the Environmental Impact Report (EIR) prepared for the Glendale- Burbank Interceptor Sewer (GBIS) project. In October 2007, the court ruled that the City must clarify certain elements of the EIR as it relates to GBIS. On December 19, 2008, the City Council adopted recommendations to decertify and immediately recertify the Integrated Resources Plan s EIR without the GBIS portion. The City is correcting the deficiencies identified by the court related to mitigations in five areas. This process is expected to take approximately one year to complete and may identify mitigations that could add cost to the GBIS project. Statewide Waste Discharge Requirements In May 2006, the SWRCB issued new Statewide Waste Discharge Requirements (WDR) for all collection systems in the State of California with a system greater than one mile. One of the major requirements is the development of a Sewer System Management Plan (SSMP). The elements of the SSMP are similar to the City s existing programs and requirements of the Collection System Settlement Agreement (CSSA), but some enhancements may be necessary. Depending on the scope of any required system enhancements, which will be determined after the completion of the SSMP, the financial impact may be material. The Impact of the Right to Vote on Taxes Act- Proposition 218 On November 5, 1996, California voters approved Proposition 218 (the Proposition) that adds Articles XIIIC and XIIID to the California Constitution. The Proposition requires majority voter approval before the imposition, extension or increase of general taxes, and 2/3-voter approval before imposition, extension or increase of special taxes by a local government, which is defined in the Proposition to include charter cities such as the City. Such voter requirements apply to all general and special taxes that were newly created or increased after January 1, The Proposition also extends the initiative power to reducing or repealing local taxes, assessments, and property related fees and charges, regardless of the date such taxes, assessments, fees and charges were imposed. In addition, the Proposition limits the application of assessments, fees and charges and requires them to be submitted to property owners for approval or rejection, after notice and public hearing. The Proposition restricts the City s ability to impose or increase certain taxes and assessments, and land-based user fees and charges. It subjects existing sources of City revenue to reduction or repeal. Existing taxes at existing levels such as Utility Users Tax, Documentary Transfer Tax, Parking User Tax, Sales Tax, Vehicle License Fees, Municipal Court Fines, Transient Occupancy Tax, and Licenses, Permits, Fees and Fines are not be affected by the Proposition. Fees and charges of the Power System and its transfers to the General Fund are exempted from Proposition 218. The impact of the Proposition on future revenues will depend on the willingness of the electorate to support new taxes and cannot be determined at this time
202 NOTES TO THE BASIC FINANCIAL STATEMENTS Fiscal Year Ended June 30, 2008 NOTE 5 OTHER INFORMATION (Continued) In Bighorn-Desert View Water Agency v. Beringson (Bighorn), the California Supreme Court held that fees and charges for ongoing water service through existing connection were property related fees and charges imposed on a person as an incident of property ownership for purposes of Article XIIID of Proposition 218, whether the fees and charges are calculated based on consumption or are imposed as a fixed monthly fee. The City believes that the Bighorn decision, which applied to water fees and charges, would apply equally to sewer service charges. As a result, if the sewer service charges are a fee or charge under Article XIIID, any increase would require a public hearing, preceded by mailed notices, and would be subject to a majority written protest. The City currently provides written notices to all property owners and rate-payers receiving service in connection with proposed increase in sewer service charges and holds public hearing with respect to such increases. Article XIIIC of Proposition 218 provides that the initiative power shall not be prohibited or otherwise limited in matters of reducing or repealing any local tax, assessment, fee or charge and that the power of initiative to affect local taxes, assessments, fees and charges shall be applicable to all local governments. Article XIIIC does not define the terms local tax, assessment, fee or charge. No assurance can be given that the voters of the City will not, in the future, approve an initiative, which reduces or repeals local taxes, assessments, fees or charges, including a reduction of all or any portion of the sewer service charge. The use of the initiative power is arguably limited in the case of levies directly pledged to bonded indebtedness, such as sewer service charge. However, there can be no assurance that the voters of the City will not approve an initiative that attempts to reduce the sewer charge. Fire and Police Pension System Donations The Pensions has been a recipient of donations in the form of non-voting common stocks of certain non-public corporations (donors). Under the terms of the agreements, the Pensions acknowledged that: (a) the non-voting common stocks have not been registered under the Federal Securities Act of 1933 or qualified under the California Corporate Securities Law of 1968, (b) no public market exists for the non-voting common stocks, and (c) the non-voting common stock are subject to a right of first refusal prohibiting Pensions from selling or otherwise disposing of the stocks without first offering to sell them to the donors. Pensions records the donated stocks at zero cost and zero market value. Donated income is recorded when cash dividends and sales proceeds are received. Through June 30, 2008, the Pensions has received $28.7 million of such donated income, $0.07 million of which were received during fiscal year The Internal Revenue Service is investigating the tax treatment claimed by the donors. There has been no allegation of inappropriate activity by the Pensions
203 NOTES TO THE BASIC FINANCIAL STATEMENTS Fiscal Year Ended June 30, 2008 NOTE 5 OTHER INFORMATION (Continued) E. Subsequent Events Indebtedness Subsequent to June 30, 2008, the City issued the following indebtedness (in millions): Issue Date Amount Interest Rate July 8, Tax and Revenue Anticipation Notes $ % August 6, 2008 August 6, 2008 August 6, 2008 August 6, 2008 August 21, 2008 August 21, 2008 September 23, 2008 Bond Description General Obligation Bonds Series 2008-A % % Airports Senior Revenue Bonds Series 2008-A % Airports Senior Refunding Revenue Bonds Series 2008-B % Airports Subordinate Revenue Bonds Bonds Series 2008-C % MICLA Lease Revenue Bonds Series 2008-A % % MICLA Lease Revenue Bonds Series 2008-B % % Convention Center Lease Revenue Refunding Bonds Series 2008-A % % November 6, 2008 Power System Revenue Bonds % Financial Market Volatility Recent market conditions have resulted in an unusually high degree of volatility and increased risks associated with certain investments held by the City that could impact the value of investments after the date of these financial statements. The unfolding financial crisis may affect the market value of certain investments, but the impact of future events cannot be determined at this time. The values of assets held by the City s retirement and other postemployment benefit plans have also been impacted by recent market conditions. The plans actuarial valuations employ a smoothing policy which requires that the difference between the actual market return and the expected return on the market value be recognized in even increments over five years. As a result, the impact of recent market losses will be amortized and evidenced in actuarial valuations and funded status over the next five years and may eventually result in an increase in required City contributions
204 NOTES TO THE BASIC FINANCIAL STATEMENTS Fiscal Year Ended June 30, 2008 NOTE 5 OTHER INFORMATION (Continued) Harbor Enterprise Fund The Harbor obtains one or more reserve sureties in lieu of fully funding the outstanding bonds reserve fund requirement. Three bond insurers provide the reserve sureties. The downgrading of the rating of one of the insurers in June 2008 triggered certain specific requirements in compliance with the indenture. The Harbor opted to cash fund its reserve fund requirements in order to comply with its bond covenants. On September 18, 2008, the Board of Harbor Commissioners approved the one-time cash funding of the entire reserve requirement of $61.5 million which was transferred to the bond trustee in November Power Enterprise Fund On December 1, 2008, the fair value of the Power Enterprise Fund s derivative instruments held at June 30, 2008 was a negative $97.8 million, a decline of $311.2 million
205 This page intentionally left blank
206
207 REQUIRED SUPPLEMENTARY INFORMATION Fiscal Year Ended June 30, 2008 (Unaudited) Benefit Pension Plans Schedule of Funding Progress (amounts expressed in thousands) Underfunded Actuarial AAL as a Actuarial Actuarial Accrued Percentage Valuation Value of Liability Underfunded Funded Covered of Covered Date Assets (AAL) AAL Ratio Payroll Payroll Fire and Police Pension Plan 6/30/06 $ 12,121,403 $ 12,811,384 $ 689, % $ 1,092, % 6/30/07 13,215,668 13,324, , % 1,135, % 6/30/08 14,153,296 14,279, , % 1,206, % Los Angeles City Employees' Retirement Plan 6/30/06 $ 7,674,999 $ 9,870,662 $ 2,195, % $ 1,733, % 6/30/07 8,599,700 10,526,874 1,927, % 1,896, % 6/30/08 9,438,318 11,186,404 1,748, % 1,977, % Water and Power Employees' Retirement and Death Benefit Insurance Plan 7/1/06 $ 6,447,763 $ 7,046,571 $ 598, % $ 635, % 7/1/07 6,864,084 7,467, , % 670, % 7/1/08 7,247,853 7,619, , % 708, % Other Postemployment Benefits Healthcare Plans Schedule of Funding Progress (amounts expressed in thousands) Underfunded Actuarial AAL as a Actuarial Actuarial Accrued Percentage Valuation Value of Liability Underfunded Funded Covered of Covered Date Assets (AAL) AAL Ratio Payroll Payroll Fire and Police Health Subsidy Plan 6/30/06 $ 613,782 $ 1,631,187 $ 1,017, % $ 1,092, % 6/30/07 687,096 1,656, , % 1,135, % 6/30/08 767,648 1,836,840 1,069, % 1,206, % Los Angeles City Employees' Postemployment Healthcare Plan 6/30/06 $ 990,270 $ 1,730,799 $ 740, % $ 1,733, % 6/30/07 1,185,544 1,730, , % 1,896, % 6/30/08 1,342,920 1,928, , % 1,977, % Water and Power Employees' Retiree Health Benefits Plan 6/30/06 $ -- $ 1,053,853 $ 1,053, % $ 635, % 6/30/07 649,116 1,041, , % 670, % 6/30/08 719,637 1,358, , % 708, %
208 REQUIRED SUPPLEMENTARY INFORMATION Fiscal Year Ended June 30, 2008 (Unaudited) Community Redevelopment Agency Employee Retirement System Schedule of Funding Progress (amounts expressed in thousands) Underfunded Actuarial AAL as a Actuarial Actuarial Accrued Percentage Valuation Value of Liability Underfunded Funded Covered of Covered Date Assets (AAL) AAL Ratio Payroll Payroll 6/30/05 $ 114,728 $ 130,467 $ 15, % $ 16, % 6/30/06 123, ,943 14, % 17, % 6/30/07 135, ,785 14, % 19, % Community Redevelopment Agency Other Postemployment Benefits Schedule of Funding Progress (amounts expressed in thousands) Underfunded Actuarial AAL as a Actuarial Actuarial Accrued Percentage Valuation Value of Liability Underfunded Funded Covered of Covered Date Assets (AAL) AAL Ratio Payroll Payroll 1/1/08 $ -- $ 37,572 $ 37, % $ 21, % Condition Rating for City Bridges Rating No. of A = 90% - 100% B = 80% - 89% C = 70% - 79% D = 50% - 69% F = below 50% Bridge Type Bridges (very good) (good to fair) (fair to poor) (very poor) (failure) Vehicular Pedestrian Tunnel Bikeway Total Percentage 100% 47% 25% 24% 4% 0% Comparison of Needed-to-Actual Maintenance/Preservation Costs (amounts expressed in thousands) Fiscal Year Ended June Needed $ 30,006 $ 21,331 $ 35,080 Actual 16,352 18,411 35,789 Difference 13,654 2,920 (709)
209 REQUIRED SUPPLEMENTARY INFORMATION Fiscal Year Ended June 30, 2008 (Unaudited) The Computer File of Structures is a comprehensive bridge database system that enables the City to track the entire bridge inventory, inspection data, repair records, structural condition of various bridge elements, bridge sufficiency rating, cost data, traffic data, and geometric data. The Sufficiency Rating given each bridge is in accordance with national standards developed by the Federal Highway Administration. The Sufficiency Rating ranges from 0% to 100% and is composed of the following elements: Structural Safety and Adequacy (S 1 =55%), Serviceability and Functional Obsolescence (S 2 =30%), Essentiality for Public Use (S 3 =15%), and Special Reductions (S 4 =up to a maximum of 13%). The Special Reductions is provided for long detour distance, traffic safety features, and structure type. The Sufficiency Rating is computed by summing the four elements (SR = S 1 + S 2 + S 3 S 4 ). It is the City s policy that bridges shall be maintained so that at least 70% of the bridges are rated B or better, and no bridge shall be rated less than D. Condition assessments are determined every three years
210 This page intentionally left blank
211
212 COMBINING AND INDIVIDUAL FUND FINANCIAL STATEMENTS AND SCHEDULES The other governmental funds combining balance sheet; and other governmental funds combining statement of revenues, expenditures and changes in fund balances provide the detail for the combined amounts presented in the basic financial statements (pages 34 and 37, respectively). Subcombining statements are presented to provide the detail for the Nonmajor Special Revenue Funds, Nonmajor Debt Service Funds, and Nonmajor Capital Projects Funds. In addition, budgetary comparison schedules are presented for each of the Nonmajor Budgeted Funds. The combining statements for the fiduciary funds are also presented for the Pension and Other Employee Benefits Trust Funds, and Agency Funds to provide the detail for the combined amounts presented in the basic financial statements (pages on 54 and 55)
213 Combining Balance Sheet Other Governmental Funds June 30, 2008 (amounts expressed in thousands) Nonmajor Nonmajor Nonmajor Total Special Debt Capital Other Revenue Service Projects Governmental Funds Funds Funds Funds ASSETS Cash and Pooled Investments $ 1,143,172 $ 253,918 $ 688,940 $ 2,086,030 Other Investments Taxes Receivable (Net of Allowance for Uncollectibles of $4,750) 3,710 25, ,505 Accounts Receivable (Net of Allowance for Uncollectibles of $2,510) 10, ,605 Special Assessments Receivable (Net of Allowance for Uncollectibles of $2,299) 14, ,584 16,846 Investment Income Receivable 7,138 1,236 4,699 13,073 Intergovernmental Receivable (Net of Allowance for Uncollectibles of $107) 100, ,911 Loans Receivable (Net of Allowance for Uncollectibles of $507,613) 191, ,050 Due from Other Funds 17, ,841 Loans Receivable from Component Unit Prepaid Items and Other Assets Advances to Other Funds 94, ,812 Restricted Assets 6, ,175 TOTAL ASSETS $ 1,590,562 $ 281,747 $ 696,502 $ 2,568,811 LIABILITIES AND FUND BALANCES LIABILITIES Accounts, Contracts and Retainage Payable $ 58,216 $ -- $ 38,248 $ 96,464 Obligations Under Securities Lending Transactions 133,949 26,075 91, ,262 Accrued Salaries and Overtime Payable 3, ,778 Accrued Compensated Absences Payable Intergovernmental Payable Due to Other Funds 25, ,801 28,666 Deferred Revenue and Other Credits 78,875 20,026 2, ,023 Deposits and Advances 12, ,277 Matured Bonds and Interest Payable Advances from Other Funds 117, , ,186 Other Liabilities TOTAL LIABILITIES 432,037 46, , ,373 FUND BALANCES Reserved for: Encumbrances 188, , ,063 Assets Not Available for Appropriation 287, ,027 Debt Service , ,091 Special Purposes 6, ,175 Unreserved and Undesignated 676, ,333 1,153,082 TOTAL FUND BALANCES 1,158, , ,822 1,949,438 TOTAL LIABILITIES AND FUND BALANCES $ 1,590,562 $ 281,747 $ 696,502 $ 2,568,
214 Combining Statement of Revenues, Expenditures and Changes in Fund Balances Other Governmental Funds For the Fiscal Year Ended June 30, 2008 (amounts expressed in thousands) Nonmajor Nonmajor Nonmajor Total Special Debt Capital Other Revenue Service Projects Governmental Funds Funds Funds Funds REVENUES Property Taxes $ 20,279 $ 152,913 $ -- $ 173,192 Other Taxes 51, ,545 53,128 Licenses and Permits 3, ,646 Intergovernmental 598, , ,767 Charges for Services 192,081 4,993 2, ,678 Services to Enterprise Funds 1, ,304 Fines 13, ,691 Special Assessments 76, , ,069 Investment Earnings 62,093 11,903 47, ,302 Program Income 17, ,451 Other 43, ,930 45,360 TOTAL REVENUES 1,080, ,809 94,331 1,344,588 EXPENDITURES Current: General Government 28, ,533 Protection of Persons and Property 221, ,660 Public Works 164, ,909 Health and Sanitation 64, ,236 Transportation 112, ,891 Cultural and Recreational Services 118, ,027 Community Development 272, ,111 Capital Outlay 122, , ,863 Debt Service: Principal 13, , ,575 Interest 6, , ,513 Cost of Issuance Advance Refunding Loan Escrow 41, ,311 TOTAL EXPENDITURES 1,167, , ,264 1,739,757 DEFICIENCY OF REVENUES OVER EXPENDITURES (86,634) (128,602) (179,933) (395,169) OTHER FINANCING SOURCES (USES) Transfers In 254, ,873 7, ,234 Transfers Out (156,442) (7,119) (4,944) (168,505) Proceeds of Refunding Loan 24, ,110 Payment for Current Refunding of Loan (24,110) (24,110) TOTAL OTHER FINANCING SOURCES 97, ,754 2, ,729 NET CHANGE IN FUND BALANCES 11,040 (20,848) (177,632) (187,440) FUND BALANCES, JULY 1 1,147, , ,454 2,136,878 FUND BALANCES, JUNE 30 $ 1,158,525 $ 235,091 $ 555,822 $ 1,949,
215 This page intentionally left blank
216
217 Supplemental Schedule of Budget Appropriations, Expenditures and Other Financing Uses by Function Budget and Actual (Non-GAAP Budgetary Basis) General Fund For the Fiscal Year Ended June 30, 2008 (amounts expressed in thousands) Variance With Original Additional Final Budget Adopted Appropriations Final Encumbrances Total Positive Budget and Transfers Budget Expenditures June 30, 2008 Actual (Negative) GENERAL GOVERNMENT City Administrative Officer $ 13,604 $ 285 $ 13,889 $ 12,018 $ 1,152 $ 13,170 $ 719 City Attorney 97,354 15, , ,864 8, , City Clerk 11,464 4,688 16,152 14,022 1,233 15, Commission on the Status of Women Controller 19,220 1,251 20,471 15,982 2,639 18,621 1,850 Council 27,195 6,720 33,915 25,412 2,011 27,423 6,492 Employee Relations Board Ethics Commission 2,604 (4) 2,600 2, , Finance 25,602 1,337 26,939 24,634 2,087 26, General Services 260, , , ,189 35, ,463 39,840 Human Relations Commission 1, ,346 1, , Information Technology Agency 108,415 8, ,464 92,717 20, ,380 3,084 Mayor 8,843 8,722 17,565 12, ,036 4,529 Neighborhood Empowerment 4,197 (384) 3,813 3, , Personnel 63, ,981 50,542 12,750 63, Treasurer 5,149 (97) 5,052 4, , Non-Departmental Capital Finance Administration 38,330 (2,146) 36,184 36, , General City Purposes 84,495 (29,547) 54,948 40,036 7,053 47,089 7,859 Human Resources Benefits 470,397 (2,360) 468, ,887 4, , Liability Claims 37, ,070 36, , Unappropriated Balance 93,254 (72,493) 20, ,761 Water and Electricity 21,121 1,250 22,371 11,002 11,369 22, TOTAL GENERAL GOVERNMENT 1,394,835 42,368 1,437,203 1,237, ,345 1,348,621 88,582 PROTECTION OF PERSONS AND PROPERTY Animal Services 21, ,462 19,080 1,790 20, Building and Safety 80,969 4,402 85,371 76,944 5,187 82,131 3,240 Emergency Preparedness 1, ,361 2, , Fire 535,026 16, , ,241 37, ,971 4,289 Police 1,227,258 42,573 1,269,831 1,161,869 99,479 1,261,348 8,483 VLF-Funded Police Officers 5, ,978 5, , TOTAL PROTECTION OF PERSONS AND PROPERTY 1,872,398 63,865 1,936,263 1,774, ,326 1,918,714 17,549 PUBLIC WORKS Public Works Bureaus Board of Public Works 20,615 6,103 26,718 23,624 2,677 26, Contract Administration 31,661 5,649 37,310 29,668 2,029 31,697 5,613 Engineering 81,991 14,690 96,681 80,407 5,846 86,253 10,428 Street Lighting 20,364 7,297 27,661 20,224 2,910 23,134 4,527 Street Services 155,796 21, , ,566 14, ,472 3,109 Non-Departmental Water and Electricity 1, ,929 1, , TOTAL PUBLIC WORKS 312,356 55, , ,813 28, ,786 24,094 HEALTH AND SANITATION Environmental Affairs 3, ,239 2, , Public Works- Bureau of Sanitation 247,996 7, , ,055 22, ,660 6,247 Non-Departmental Water and Electricity TOTAL HEALTH AND SANITATION 251,992 7, , ,325 23, ,525 6,378 Continued
218 Supplemental Schedule of Budget Appropriations, Expenditures and Other Financing Uses by Function Budget and Actual (Non-GAAP Budgetary Basis) - (Continued) General Fund For the Fiscal Year Ended June 30, 2008 (amounts expressed in thousands) Variance With Original Additional Final Budget Adopted Appropriations Final Encumbrances Total Positive Budget and Transfers Budget Expenditures June 30, 2008 Actual (Negative) TRANSPORTATION $ 140,914 $ 13,039 $ 153,953 $ 131,348 $ 12,216 $ 143,564 $ 10,389 CULTURAL AND RECREATIONAL SERVICES Convention Center 23,357 2,320 25,677 22,900 2,063 24, Cultural Affairs 10, ,230 7,879 1,933 9, El Pueblo De Los Angeles Historical Monument Authority 2, ,104 1, , Zoo 19, ,215 17,103 1,520 18, Non-Departmental Water and Electricity 18,363 (216) 18,147 11,878 6,269 18, TOTAL CULTURAL AND RECREATIONAL SERVICES 73,064 2,309 75,373 61,566 11,954 73,520 1,853 COMMUNITY DEVELOPMENT Aging 3, ,377 3, , Commission for Children, Youth and Their Families 1,692 (137) 1,555 1, , Community Development 22,595 11,321 33,916 25,462 2,243 27,705 6,211 Disability 1, ,896 1, , Los Angeles Housing 45,134 1,485 46,619 42,200 3,494 45, Planning 31,289 (655) 30,634 24,203 5,354 29,557 1,077 TOTAL COMMUNITY DEVELOPMENT 106,080 12, ,997 98,505 11, ,353 8,644 PENSION AND RETIREMENT CONTRIBUTIONS Non-Departmental General City Purposes 15, ,101 14,056 1,020 15, General TOTAL PENSION AND RETIREMENT CONTRIBUTIONS 15, ,384 14,339 1,020 15, CAPITAL OUTLAY Non-Departmental Capital Improvement Projects 1,065 34,558 35,623 3,144 11,286 14,430 21,193 TRANSFERS TO OTHER FUNDS Non-Departmental Capital Finance Administration 110,166 3, , , , General 973,949 20, , , ,630 3 TOTAL TRANSFERS TO OTHER FUNDS 1,084,115 24,321 1,108,436 1,108, ,108,433 3 GRAND TOTAL $ 5,252,203 $ 256,812 $ 5,509,015 $ 4,974,137 $ 356,168 $ 5,330,305 $ 178,
219 Supplemental Schedule of Budget Appropriations, Expenditures and Other Financing Uses by Function and Object Budget and Actual (Non-GAAP Budgetary Basis) General Fund For the Fiscal Year Ended June 30, 2008 (amounts expressed in thousands) GENERAL GOVERNMENT Variance With Original Additional Final Budget Adopted Appropriations Final Encumbrances Total Positive Budget and Transfers Budget Expenditures June 30, 2008 Actual (Negative) CITY ADMINISTRATIVE OFFICER Salaries $ 12,481 $ 21 $ 12,502 $ 11,130 $ 724 $ 11,854 $ 648 Expenses 1, , , Equipment 40 (40) Subtotal 13, ,889 12,018 1,152 13, CITY ATTORNEY Salaries 90,578 7,901 98,479 91,754 6,086 97, Expenses 6,776 1,170 7,946 7, , Special -- 6,738 6,738 4,624 2,114 6, Subtotal 97,354 15, , ,864 8, , CITY CLERK Salaries 10, ,999 10, , Expenses 769 4,378 5,147 3, , Equipment 120 (114) Subtotal 11,464 4,688 16,152 14,022 1,233 15, COMMISSION ON THE STATUS OF WOMEN Salaries Expenses 58 (30) Subtotal CONTROLLER Salaries 15,364 (116) 15,248 14, , Expenses 3,856 1,352 5,208 1,920 1,647 3,567 1,641 Equipment Subtotal 19,220 1,251 20,471 15,982 2,639 18,621 1,850 COUNCIL Salaries 25,595 5,401 30,996 23,321 1,463 24,784 6,212 Expenses 1,425 1,445 2,870 2, , Equipment 175 (126) Subtotal 27,195 6,720 33,915 25,412 2,011 27,423 6,492 EMPLOYEE RELATIONS BOARD Salaries 282 (38) Expenses Subtotal ETHICS COMMISSION Salaries 2, ,264 2, , Expenses 377 (41) Subtotal 2,604 (4) 2,600 2, , FINANCE Salaries 23, ,072 22,283 1,575 23, Expenses 1, ,505 2, ,502 3 Equipment Subtotal 25,602 1,337 26,939 24,634 2,087 26, Continued
220 Supplemental Schedule of Budget Appropriations, Expenditures and Other Financing Uses by Function and Object Budget and Actual (Non-GAAP Budgetary Basis) - (Continued) General Fund For the Fiscal Year Ended June 30, 2008 (amounts expressed in thousands) Variance With Original Additional Final Budget Adopted Appropriations Final Encumbrances Total Positive Budget and Transfers Budget Expenditures June 30, 2008 Actual (Negative) GENERAL SERVICES Salaries $ 138,571 $ 50,265 $ 188,836 $ 154,482 $ 9,759 $ 164,241 $ 24,595 Expenses 116,893 49, , ,531 24, ,459 15,208 Equipment 431 (31) Special 4, ,400 4, , Subtotal 260, , , ,189 35, ,463 39,840 HUMAN RELATIONS COMMISSION Salaries 1, ,261 1, , Expenses 132 (47) Subtotal 1, ,346 1, , INFORMATION TECHNOLOGY AGENCY Salaries 60,331 7,628 67,959 63,176 4,294 67, Expenses 21, ,946 15,317 6,585 21, Equipment 1, , ,172 Special 24,963 (311) 24,652 14,035 9,238 23,273 1,379 Subtotal 108,415 8, ,464 92,717 20, ,380 3,084 MAYOR Salaries 7,899 6,425 14,324 11, ,993 2,331 Expenses 944 2,292 3, ,043 2,193 Equipment Subtotal 8,843 8,722 17,565 12, ,036 4,529 NEIGHBORHOOD EMPOWERMENT Salaries 3,474 (256) 3,218 2, , Expenses 717 (122) Special 6 (6) Subtotal 4,197 (384) 3,813 3, , PERSONNEL Salaries 37,615 1,209 38,824 35,850 2,299 38, Expenses 23,960 (1,419) 22,541 12,693 9,839 22,532 9 Special 2, ,616 1, ,611 5 Subtotal 63, ,981 50,542 12,750 63, TREASURER Salaries 2,924 (105) 2,819 2, , Expenses 2, ,226 1, , Equipment Subtotal 5,149 (97) 5,052 4, , Continued
221 Supplemental Schedule of Budget Appropriations, Expenditures and Other Financing Uses by Function and Object Budget and Actual (Non-GAAP Budgetary Basis) - (Continued) General Fund For the Fiscal Year Ended June 30, 2008 (amounts expressed in thousands) Variance With Original Additional Final Budget Adopted Appropriations Final Encumbrances Total Positive Budget and Transfers Budget Expenditures June 30, 2008 Actual (Negative) NON-DEPARTMENTAL Capital Finance Administration $ 38,330 $ (2,146) $ 36,184 $ 36,031 $ 153 $ 36,184 $ -- General City Purposes 84,495 (29,547) 54,948 40,036 7,053 47,089 7,859 Human Resources Benefits 470,397 (2,360) 468, ,887 4, , Liability Claims 37, ,070 36, , Unappropriated Balance 93,254 (72,493) 20, ,761 Water and Electricity 21,121 1,250 22,371 11,002 11,369 22, Subtotal 744,597 (105,226) 639, ,594 22, ,244 29,127 TOTAL GENERAL GOVERNMENT 1,394,835 42,368 1,437,203 1,237, ,345 1,348,621 88,582 PROTECTION OF PERSONS AND PROPERTY ANIMAL SERVICES Salaries 19,737 (575) 19,162 17,627 1,245 18, Expenses 1, ,300 1, , Subtotal 21, ,462 19,080 1,790 20, BUILDING AND SAFETY Salaries 78,521 4,449 82,970 74,967 4,979 79,946 3,024 Expenses 2,448 (47) 2,401 1, , Subtotal 80,969 4,402 85,371 76,944 5,187 82,131 3,240 EMERGENCY PREPAREDNESS Salaries 1, ,197 2, , Expenses Subtotal 1, ,361 2, , FIRE Salaries 511,106 15, , ,003 32, ,122 4,225 Expenses 23, ,647 19,024 5,561 24, Equipment 180 (4) Special Subtotal 535,026 16, , ,241 37, ,971 4,289 POLICE Salaries 1,185,962 18,874 1,204,836 1,124,234 73,482 1,197,716 7,120 Expenses 38,607 23,164 61,771 37,128 24,003 61, Equipment 2, , ,994 2, Subtotal 1,227,258 42,573 1,269,831 1,161,869 99,479 1,261,348 8,483 VLF-FUNDED POLICE OFFICERS Expenses 5, ,978 5, , TOTAL PROTECTION OF PERSONS AND PROPERTY 1,872,398 63,865 1,936,263 1,774, ,326 1,918,714 17,549 Continued
222 Supplemental Schedule of Budget Appropriations, Expenditures and Other Financing Uses by Function and Object Budget and Actual (Non-GAAP Budgetary Basis) - (Continued) General Fund For the Fiscal Year Ended June 30, 2008 (amounts expressed in thousands) PUBLIC WORKS Variance With Original Additional Final Budget Adopted Appropriations Final Encumbrances Total Positive Budget and Transfers Budget Expenditures June 30, 2008 Actual (Negative) BOARD OF PUBLIC WORKS Salaries $ 10,747 $ 1,517 $ 12,264 $ 11,218 $ 704 $ 11,922 $ 342 Expenses 9,813 4,586 14,399 12,367 1,957 14, Equipment Subtotal 20,615 6,103 26,718 23,624 2,677 26, BUREAU OF CONTRACT ADMINISTRATION Salaries 30,084 5,079 35,163 28,114 1,798 29,912 5,251 Expenses 1, ,108 1, , Equipment Subtotal 31,661 5,649 37,310 29,668 2,029 31,697 5,613 BUREAU OF ENGINEERING Salaries 78,593 14,607 93,200 78,710 4,983 83,693 9,507 Expenses 3, ,476 1, , Equipment Subtotal 81,991 14,690 96,681 80,407 5,846 86,253 10,428 BUREAU OF STREET LIGHTING Salaries 15,701 3,541 19,242 16,045 1,040 17,085 2,157 Expenses 1,254 2,515 3, ,345 2,138 1,631 Equipment Special 3,403 1,241 4,644 3, , Subtotal 20,364 7,297 27,661 20,224 2,910 23,134 4,527 BUREAU OF STREET SERVICES Salaries 87,441 10,328 97,769 89,709 5,835 95,544 2,225 Expenses 68,355 11,457 79,812 69,857 9,071 78, Subtotal 155,796 21, , ,566 14, ,472 3,109 NON-DEPARTMENTAL Water and Electricity 1, ,929 1, , TOTAL PUBLIC WORKS 312,356 55, , ,813 28, ,786 24,094 HEALTH AND SANITATION ENVIRONMENTAL AFFAIRS Salaries 3, ,073 2, , Expenses 203 (37) Subtotal 3, ,239 2, , PUBLIC WORKS - BUREAU OF SANITATION Salaries 183,469 6, , ,491 11, ,541 4,364 Expenses 64,436 1,475 65,911 52,493 11,555 64,048 1,863 Equipment Subtotal 247,996 7, , ,055 22, ,660 6,247 Continued
223 Supplemental Schedule of Budget Appropriations, Expenditures and Other Financing Uses by Function and Object Budget and Actual (Non-GAAP Budgetary Basis) - (Continued) General Fund For the Fiscal Year Ended June 30, 2008 (amounts expressed in thousands) Variance With Original Additional Final Budget Adopted Appropriations Final Encumbrances Total Positive Budget and Transfers Budget Expenditures June 30, 2008 Actual (Negative) NON-DEPARTMENTAL Water and Electricity $ 757 $ -- $ 757 $ 419 $ 338 $ 757 $ -- TOTAL HEALTH AND SANITATION 251,992 7, , ,325 23, ,525 6,378 TRANSPORTATION Salaries 109,670 13, , ,377 6, ,305 7,839 Expenses 31,211 (402) 30,809 22,971 5,288 28,259 2,550 Equipment 33 (33) TOTAL TRANSPORTATION 140,914 13, , ,348 12, ,564 10,389 CULTURAL AND RECREATIONAL SERVICES CONVENTION CENTER Salaries 14,727 1,544 16,271 15, , Expenses 7, ,959 6, , Special 1, , , Subtotal 23,357 2,320 25,677 22,900 2,063 24, CULTURAL AFFAIRS Salaries 5, ,371 4, , Expenses 637 (30) Equipment 37 (6) Special 4, ,221 2,496 1,420 3, Subtotal 10, ,230 7,879 1,933 9, EL PUEBLO DE LOS ANGELES HISTORICAL MONUMENT AUTHORITY Salaries 1, ,664 1, , Expenses 449 (9) Subtotal 2, ,104 1, , ZOO Salaries 15, ,315 14, , Expenses 3,737 (44) 3,693 2, , Special Subtotal 19, ,215 17,103 1,520 18, NON-DEPARTMENTAL Water and Electricity 18,363 (216) 18,147 11,878 6,269 18, TOTAL CULTURAL AND RECREATIONAL SERVICES 73,064 2,309 75,373 61,566 11,954 73,520 1,853 COMMUNITY DEVELOPMENT AGING Salaries 3, ,988 3, , Expenses Subtotal 3, ,377 3, , Continued
224 Supplemental Schedule of Budget Appropriations, Expenditures and Other Financing Uses by Function and Object Budget and Actual (Non-GAAP Budgetary Basis) - (Continued) General Fund For the Fiscal Year Ended June 30, 2008 (amounts expressed in thousands) Variance With Original Additional Final Budget Adopted Appropriations Final Encumbrances Total Positive Budget and Transfers Budget Expenditures June 30, 2008 Actual (Negative) COMMISSION FOR CHILDREN, YOUTH AND THEIR FAMILIES Salaries $ 1,362 $ (194) $ 1,168 $ 1,010 $ 84 $ 1,094 $ 74 Expenses Subtotal 1,692 (137) 1,555 1, , COMMUNITY DEVELOPMENT Salaries 20,583 6,755 27,338 21,518 1,359 22,877 4,461 Expenses 2,012 4,553 6,565 3, ,824 1,741 Equipment Subtotal 22,595 11,321 33,916 25,462 2,243 27,705 6,211 DISABILITY Salaries 1,490 (51) 1,439 1, , Expenses Special Subtotal 1, ,896 1, , LOS ANGELES HOUSING Salaries 38,629 (455) 38,174 35,313 2,260 37, Expenses 6,005 1,831 7,836 6,545 1,209 7, Equipment Special Subtotal 45,134 1,485 46,619 42,200 3,494 45, PLANNING Salaries 25,391 (904) 24,487 22,347 1,450 23, Expenses 4, ,197 1,285 3,648 4, Equipment 980 (30) Subtotal 31,289 (655) 30,634 24,203 5,354 29,557 1,077 TOTAL COMMUNITY DEVELOPMENT 106,080 12, ,997 98,505 11, ,353 8,644 PENSION AND RETIREMENT CONTRIBUTION Non-Departmental 15, ,384 14,339 1,020 15, CAPITAL OUTLAY Non-Departmental 1,065 34,558 35,623 3,144 11,286 14,430 21,193 TRANSFERS TO OTHER FUNDS Non-Departmental 1,084,115 24,321 1,108,436 1,108, ,108,433 3 GRAND TOTAL $ 5,252,203 $ 256,812 $ 5,509,015 $ 4,974,137 $ 356,168 $ 5,330,305 $ 178,
225
226 SPECIAL REVENUE FUNDS Special Revenue Funds are used to account for revenues derived from specific taxes, governmental grants, or other revenue sources that are designated to finance particular functions and activities of the City. Six funds are reported as major funds and are presented in the basic financial statements. Sixteen funds are separately identified in the Nonmajor Special Revenue Funds combining schedules and they account for 57.2% of the combined revenues of the Nonmajor Special Revenue Funds. Three groupings of numerous smaller funds are reported for other grants, other special revenue, and allocations from other governmental agencies funds. Automated Traffic Surveillance and Control (ATSAC) Fund - Accounts for funds used in constructing and maintaining an ATSAC system that links computer-controlled intersections in the City. Funding sources include allocations from Proposition C funds, county and federal grants, and developer fees. Citywide Recycling Fund Accounts for compliance fees collected from private solid waste haulers. Monies deposited in the Fund are used to pay for industrial, commercial, and multifamily recycling programs that include program administration, public education, technical assistance to private businesses, research, market development, development of material recovery/diversion facilities, and other programs designed to increase solid waste diversion rates. Local Public Safety Fund Accounts for the City s share of the one-half cent sales tax allocated by the State to replace at least 50% of the property tax revenue shifted to schools. Funds must be expended for public safety, primarily on fire and police services. Proposition C Anti-Gridlock Transit Improvement Fund Accounts for the City s 20% share of the additional one-half cent sales tax within the County of Los Angeles to improve transit service and operations, reduce traffic congestion, improve air quality and the condition of streets and freeways utilized by public transit, and reduce foreign fuel dependence. Special Parking Revenue Fund Accounts for all monies collected from parking meters in the City, except those monies from meters located in established vehicle parking districts. Monies in this fund may be used for the purchase, installation and maintenance of parking meters; the policing of parking meters and parking meter spaces; the collection of monies deposited in parking meters; the purchase, improvement, and operation of off-street parking facilities; the painting and marking of streets and curbs for the direction of traffic and parking of vehicles; and the installation of traffic signs, signals and other traffic control devices. Special Police Communications/911 System Tax Fund Accounts for the special tax imposed on each parcel, improvement to property, and use of property to finance improvements to the police communications system that includes the 911 system for the fire and police emergency calls. Stormwater Pollution Abatement Fund Accounts for the charge on all properties in the City in order to treat and abate stormwater. The charge is based on stormwater runoff and pollutant loading associated with property size and land use
227 SPECIAL REVENUE FUNDS (Continued) Street Lighting Maintenance Assessment Fund Accounts for revenues received for maintenance and operation of the majority of the streetlights in the City. Revenues are derived from benefit assessments to properties that comprise the Los Angeles City Lighting District. Expenditures include payments of electricity bills, replacement and modernization of older lighting systems, all repairs, engineering and administrative costs, purchase of supplies and equipment, and other items associated with the operation and maintenance of the street lighting system. Zoo Fund Accounts for the revenues derived from the operations as well as all appropriations to finance the operation, maintenance, management, control and improvement of the Los Angeles Zoo. Disaster Assistance Fund Accounts for grants received for emergency and disaster recovery costs and similar grant programs. Economic Development Section 108 Loan Guarantee Program Fund Accounts for loan guarantee funds from HUD for housing, commercial and industrial development projects. Home Investment Partnership Program Fund Accounts for the grants received from HUD to expand the supply of decent, safe, sanitary and affordable housing with the primary focus on rental housing, and to strengthen the abilities of state and local governments to provide housing to persons principally of low and very low income. Seismic Bond Reimbursement Fund Accounts for the funds received from the Federal government and other sources to reimburse the City for its seismic bond program. Special Gas Tax Street Improvement Fund Accounts for the revenues received from the State for the City s share of the gasoline tax and Traffic Congestion Relief Fund to be used for preservation, maintenance, and rehabilitation of local street and road system. The fund also accounts for federal grants from the Surface Transportation Program to finance the upgrade of the most heavily traveled highways. Transportation Fund Accounts for grant funds from the Metropolitan Transit Authority (MTA) to implement the Transportation Improvement Program Call for Projects (TIP). Workforce Investment Act Fund Accounts for the grants received from the United States Department of Labor for the purpose of providing employment and training opportunities for the disadvantaged residents and dislocated workers of the City. Nonmajor Other Grant Funds Account for various grants received from the Federal and State governments used for a specific purpose, activity or facility. This group represents 21% of the combined revenues of the Nonmajor Special Revenue Funds. Included in this group are eight annually budgeted funds: Community Services Block Grant, Forfeited Assets Trust of Police Department, Household Hazardous Waste, Housing Opportunities for Persons with AIDS, Mobile Source Air Pollution Reduction, Older Americans Act, Supplemental Law Enforcement Services, and Local Law Enforcement Block
228 SPECIAL REVENUE FUNDS (Continued) Nonmajor Other Special Revenue Funds Account for the activities of non-grant Special Revenue Funds that represent 19.9% of the combined revenues of the Nonmajor Special Revenue Funds. Included in this group are nineteen annually budgeted funds: Arts and Cultural Facilities and Services, Arts Development Fee, City Employees Ridesharing, City Ethics Commission, City of Los Angeles Affordable Housing, City Procurement and Materials Management, Department of Neighborhood Empowerment, Efficiency Projects and Police Hiring, El Pueblo de Los Angeles Historical Monument, Landfill Maintenance, Los Angeles Convention and Visitors Bureau, Major Projects Review, Municipal Housing Finance, Rent Stabilization, Street Damage Restoration Fee, Systematic Code Enforcement Fee, Tax Reform, Telecommunications Liquidated Damages and Lost Franchise Fees, and Traffic Safety. Allocations From Other Governmental Agencies Account for funds received by the City from various sources used for engineering design, fire protection, acquiring rights if any, construction and for various other programs. This group represents 1.9% of the combined revenues of the Nonmajor Special Revenue Funds. Included in this group are nineteen partially budgeted funds: Bicycle License, Bus Bench Advertising, Business Improvement, City Planning Systems Development, Coastal Transportation Corridor, Community Based Services Program AB2800, Cultural Affairs Trust, Curbside Recycling, Fire Hydrant Installation and Main Replacement, First and Broadway Project Child Care, General Services Trust, Integrated Solid Waste Management, Pershing Square Project, Street Banners Revenue, Urban Development Action Grant, Used Oil Collection Trust, Ventura/Cahuenga Boulevard Corridor Specific Plan, Warner Center Transportation Improvement, and West LA Transportation Improvement and Mitigation
229 Combining Balance Sheet Nonmajor Special Revenue Funds June 30, 2008 (amounts expressed in thousands) Automated Proposition C Traffic Local Anti-Gridlock Special Surveillance Citywide Public Transit Parking and Control Recycling Safety Improvement Revenue ASSETS Cash and Pooled Investments $ 24,416 $ 59,983 $ -- $ 14,106 $ 148,254 Taxes Receivable (Net of Allowance for Uncollectibles of $12) Accounts Receivable (Net of Allowance for Uncollectibles of $2,510) -- 5, Special Assessments Receivable (Net of Allowance for Uncollectibles of $2,299) Investment Income Receivable Intergovernmental Receivable (Net of Allowance for Uncollectibles of $107) ,118 15, Loans Receivable (Net of Allowance for Uncollectibles of $507,613) Due from Other Funds Loans Receivable from Component Unit Prepaid Items and Other Assets Advances to Other Funds , Restricted Assets TOTAL ASSETS $ 25,094 $ 66,450 $ 9,118 $ 122,356 $ 150,349 LIABILITIES AND FUND BALANCES LIABILITIES Accounts, Contracts and Retainage Payable $ 330 $ 1,141 $ -- $ 3,978 $ 1,628 Obligations Under Securities Lending Transactions 3,282 8, ,265 19,892 Accrued Salaries and Overtime Payable Accrued Compensated Absences Payable Intergovernmental Payable Due to Other Funds , Deferred Revenue and Other Credits ,914 2, Deposits and Advances Advances from Other Funds Other Liabilities TOTAL LIABILITIES 4,392 9,267 2,914 9,252 22,357 FUND BALANCES (DEFICIT) Reserved for: Encumbrances 1,465 3, ,374 10,572 Assets Not Available for Appropriation , Special Purposes Unreserved and Undesignated 19,237 53,191 6,204 18, ,460 TOTAL FUND BALANCES (DEFICIT) 20,702 57,183 6, , ,992 TOTAL LIABILITIES AND FUND BALANCES $ 25,094 $ 66,450 $ 9,118 $ 122,356 $ 150,349 Continued
230 Combining Balance Sheet - (Continued) Nonmajor Special Revenue Funds June 30, 2008 (amounts expressed in thousands) Special Police Street Communi- Stormwater Lighting Grant Fund cations/911 Pollution Maintenance Disaster System Tax Abatement Assessment Zoo Assistance ASSETS Cash and Pooled Investments $ 6,306 $ 5,235 $ 16,373 $ 12,138 $ 11,989 Taxes Receivable (Net of Allowance for Uncollectibles of $12) Accounts Receivable (Net of Allowance for Uncollectibles of $2,510) , Special Assessments Receivable (Net of Allowance for Uncollectibles of $2,299) 1,975 3,217 7, Investment Income Receivable Intergovernmental Receivable (Net of Allowance for Uncollectibles of $107) ,326 Loans Receivable (Net of Allowance for Uncollectibles of $507,613) Due from Other Funds 41 2,011 2,215 1, Loans Receivable from Component Unit Prepaid Items and Other Assets Advances to Other Funds ,122 Restricted Assets TOTAL ASSETS $ 8,479 $ 10,551 $ 28,550 $ 14,215 $ 22,538 LIABILITIES AND FUND BALANCES LIABILITIES Accounts, Contracts and Retainage Payable $ -- $ 249 $ 3,435 $ 26 $ -- Obligations Under Securities Lending Transactions ,632 1,612 Accrued Salaries and Overtime Payable Accrued Compensated Absences Payable Intergovernmental Payable Due to Other Funds ,619 Deferred Revenue and Other Credits 1,259 1,988 8, ,311 Deposits and Advances Advances from Other Funds , Other Liabilities TOTAL LIABILITIES 2,107 2,941 11,676 4,526 20,065 FUND BALANCES (DEFICIT) Reserved for: Encumbrances 31 2,047 9, Assets Not Available for Appropriation ,122 Special Purposes Unreserved and Undesignated 6,341 5,563 6,936 9,446 1,351 TOTAL FUND BALANCES (DEFICIT) 6,372 7,610 16,874 9,689 2,473 TOTAL LIABILITIES AND FUND BALANCES $ 8,479 $ 10,551 $ 28,550 $ 14,215 $ 22,538 Continued
231 Combining Balance Sheet - (Continued) Nonmajor Special Revenue Funds June 30, 2008 (amounts expressed in thousands) Grant Funds Economic Development Section 108 Home Loan Investment Special Gas Guarantee Partnership Seismic Bond Tax Street Trans- Program Program Reimbursement Improvement portation ASSETS Cash and Pooled Investments $ 9,927 $ 3,482 $ 48,290 $ 23,518 $ 238,484 Taxes Receivable (Net of Allowance for Uncollectibles of $12) Accounts Receivable (Net of Allowance for Uncollectibles of $2,510) Special Assessments Receivable (Net of Allowance for Uncollectibles of $2,299) Investment Income Receivable ,547 Intergovernmental Receivable (Net of Allowance for Uncollectibles of $107) ,536 22,739 19,025 Loans Receivable (Net of Allowance for Uncollectibles of $507,613) 43,084 68, Due from Other Funds Loans Receivable from Component Unit Prepaid Items and Other Assets Advances to Other Funds Restricted Assets TOTAL ASSETS $ 53,643 $ 72,382 $ 51,278 $ 46,664 $ 259,360 LIABILITIES AND FUND BALANCES LIABILITIES Accounts, Contracts and Retainage Payable $ -- $ 5,287 $ 1,801 $ 686 $ 5,352 Obligations Under Securities Lending Transactions ,492 3,161 32,060 Accrued Salaries and Overtime Payable Accrued Compensated Absences Payable Intergovernmental Payable Due to Other Funds 2, , ,323 Deferred Revenue and Other Credits ,741 13,084 Deposits and Advances 1, Advances from Other Funds ,382 Other Liabilities TOTAL LIABILITIES 3,976 6,344 11,234 27, ,201 FUND BALANCES (DEFICIT) Reserved for: Encumbrances ,083 2,213 5,352 20,258 Assets Not Available for Appropriation 43,084 68, Special Purposes Unreserved and Undesignated 6,401 (27,929) 37,831 13,944 92,901 TOTAL FUND BALANCES (DEFICIT) 49,667 66,038 40,044 19, ,159 TOTAL LIABILITIES AND FUND BALANCES $ 53,643 $ 72,382 $ 51,278 $ 46,664 $ 259,360 Continued
232 Combining Balance Sheet - (Continued) Nonmajor Special Revenue Funds June 30, 2008 (amounts expressed in thousands) Grant Funds Nonmajor Nonmajor Other Allocations Workforce Other Special from Other Investment Grant Revenue Governmental Act Funds Funds Agencies Total ASSETS Cash and Pooled Investments $ 1,682 $ 160,835 $ 246,200 $ 111,954 $ 1,143,172 Taxes Receivable (Net of Allowance for Uncollectibles of $12) , ,710 Accounts Receivable (Net of Allowance for Uncollectibles of $2,510) , ,605 Special Assessments Receivable (Net of Allowance for Uncollectibles of $2,299) , ,262 Investment Income Receivable , ,138 Intergovernmental Receivable (Net of Allowance for Uncollectibles of $107) 8,247 11,755 1, ,755 Loans Receivable (Net of Allowance for Uncollectibles of $507,613) -- 55,005 22,873 1, ,050 Due from Other Funds -- 1,304 6,341 2,054 17,718 Loans Receivable from Component Unit Prepaid Items and Other Assets Advances to Other Funds ,812 Restricted Assets , ,175 TOTAL ASSETS $ 9,936 $ 230,010 $ 293,174 $ 116,415 $ 1,590,562 LIABILITIES AND FUND BALANCES LIABILITIES Accounts, Contracts and Retainage Payable 7,733 13,495 10,979 2,096 58,216 Obligations Under Securities Lending Transactions ,260 25,321 14, ,949 Accrued Salaries and Overtime Payable , ,778 Accrued Compensated Absences Payable Intergovernmental Payable Due to Other Funds 65 6,558 3, ,865 Deferred Revenue and Other Credits 4,890 5,705 1, ,875 Deposits and Advances , ,256 Advances from Other Funds -- 13,423 7, ,936 Other Liabilities TOTAL LIABILITIES 12,914 53,926 63,563 17, ,037 FUND BALANCES (DEFICIT) Reserved for: Encumbrances 7,103 65,652 24,965 7, ,574 Assets Not Available for Appropriation -- 55,007 23,302 1, ,027 Special Purposes , ,175 Unreserved and Undesignated (10,081) 55, ,483 90, ,749 TOTAL FUND BALANCES (DEFICIT) (2,978) 176, ,611 99,401 1,158,525 TOTAL LIABILITIES AND FUND BALANCES $ 9,936 $ 230,010 $ 293,174 $ 116,415 $ 1,590,
233 Combining Statement of Revenues, Expenditures and Changes in Fund Balances (Deficit) Nonmajor Special Revenue Funds For the Fiscal Year Ended June 30, 2008 (amounts expressed in thousands) Automated Proposition C Traffic Local Anti-Gridlock Special Surveillance Citywide Public Transit Parking and Control Recycling Safety Improvement Revenue REVENUES Property Taxes $ -- $ -- $ -- $ -- $ -- Other Taxes -- 26, Licenses and Permits Intergovernmental ,321 60, Charges for Services ,292 Services to Enterprise Funds Fines Special Assessments 3, Investment Earnings 1,529 3, ,376 8,498 Program Income Other TOTAL REVENUES 4,892 30,197 36,321 62,131 45,347 EXPENDITURES Current: General Government Protection of Persons and Property , Public Works Health and Sanitation -- 13, Transportation 1, ,384 22,788 Cultural and Recreational Services Community Development Capital Outlay 2, ,175 1,906 Debt Service: Principal Interest Cost of Issuance Advance Refunding Loan Escrow TOTAL EXPENDITURES 3,441 13,662 36,595 55,559 24,694 EXCESS (DEFICIENCY) OF REVENUES OVER EXPENDITURES 1,451 16,535 (274) 6,572 20,653 OTHER FINANCING SOURCES (USES) Transfers In , Transfers Out (245) (25,738) (8,110) Proceeds of Refunding Loan Payment for Current Refunding of Loan Payment to Refunded Loan Escrow TOTAL OTHER FINANCING SOURCES (USES) (245) (19,738) (8,110) NET CHANGE IN FUND BALANCES 1,206 16,535 (274) (13,166) 12,543 FUND BALANCES (DEFICIT), JULY 1 19,496 40,648 6, , ,449 FUND BALANCES (DEFICIT), JUNE 30 $ 20,702 $ 57,183 $ 6,204 $ 113,104 $ 127,992 Continued
234 Combining Statement of Revenues, Expenditures and Changes in Fund Balances (Deficit) - (Continued) Nonmajor Special Revenue Funds For the Fiscal Year Ended June 30, 2008 (amounts expressed in thousands) Special Police Street Communi- Stormwater Lighting Grant Fund cations/911 Pollution Maintenance Disaster System Tax Abatement Assessment Zoo Assistance REVENUES Property Taxes $ 19,631 $ -- $ -- $ -- $ -- Other Taxes Licenses and Permits , Intergovernmental -- 1, ,041 39,416 Charges for Services -- 27,398 1,211 9, Services to Enterprise Funds Fines Special Assessments 718 1,231 41, Investment Earnings ,034 Program Income Other TOTAL REVENUES 21,086 30,325 45,098 13,017 40,450 EXPENDITURES Current: General Government Protection of Persons and Property ,967 Public Works , Health and Sanitation -- 29, Transportation Cultural and Recreational Services , Community Development Capital Outlay -- 3,077 3, Debt Service: Principal Interest Cost of Issuance Advance Refunding Escrow TOTAL EXPENDITURES ,370 48,551 21,301 39,967 EXCESS (DEFICIENCY) OF REVENUES OVER EXPENDITURES 20,157 (2,045) (3,453) (8,284) 483 OTHER FINANCING SOURCES (USES) Transfers In , Transfers Out (20,308) Proceeds of Refunding Loan Payment for Current Refunding of Loan Payment to Refunded Loan Escrow TOTAL OTHER FINANCING SOURCES (USES) (20,308) , NET CHANGE IN FUND BALANCES (151) (2,045) (3,453) FUND BALANCES (DEFICIT), JULY 1 6,523 9,655 20,327 8,773 1,990 FUND BALANCES (DEFICIT), JUNE 30 $ 6,372 $ 7,610 $ 16,874 $ 9,689 $ 2,473 Continued
235 Combining Statement of Revenues, Expenditures and Changes in Fund Balances (Deficit) - (Continued) Nonmajor Special Revenue Funds For the Fiscal Year Ended June 30, 2008 (amounts expressed in thousands) Grant Funds Economic Development Section 108 Home Loan Investment Special Gas Guarantee Partnership Seismic Bond Tax Street Program Program Reimbursement Improvement Transportation REVENUES Property Taxes $ -- $ -- $ -- $ -- $ -- Other Taxes Licenses and Permits Intergovernmental -- 70,413 10,949 73,083 58,242 Charges for Services ,142 Services to Enterprise Funds Fines Special Assessments Investment Earnings ,832 2,071 13,602 Program Income 7,094 1, Other TOTAL REVENUES 7,657 71,836 13,781 75,186 78,986 EXPENDITURES Current: General Government Protection of Persons and Property Public Works ,256 89, Health and Sanitation Transportation ,480 Cultural and Recreational Services Community Development -- 69, Capital Outlay ,959 7,292 51,012 Debt Service: Principal 12, Interest 5, Cost of Issuance Advance Refunding Escrow 6, TOTAL EXPENDITURES 23,856 69,194 11,215 97,151 72,492 EXCESS (DEFICIENCY) OF REVENUES OVER EXPENDITURES (16,199) 2,642 2,566 (21,965) 6,494 OTHER FINANCING SOURCES (USES) Transfers In 39, ,878 Transfers Out (2,308) (667) (20,000) Proceeds of Refunding Loan 13, Payment for Current Refunding of Loan (13,275) Payment to Refunded Loan Escrow (35,154) TOTAL OTHER FINANCING SOURCES (USES) 2,223 (667) ,878 NET CHANGE IN FUND BALANCES (13,976) 1,975 2,566 (21,965) 20,372 FUND BALANCES (DEFICIT), JULY 1 63,643 64,063 37,478 41,261 92,787 FUND BALANCES (DEFICIT), JUNE 30 $ 49,667 $ 66,038 $ 40,044 $ 19,296 $ 113,159 Continued
236 Combining Statement of Revenues, Expenditures and Changes in Fund Balances (Deficit) - (Continued) Nonmajor Special Revenue Funds For the Fiscal Year Ended June 30, 2008 (amounts expressed in thousands) Grant Funds Nonmajor Nonmajor Other Allocations Workforce Other Special from Other Investment Grant Revenue Governmental Act Funds Funds Agencies Total REVENUES Property Taxes $ -- $ -- $ 5 $ 643 $ 20,279 Other Taxes , ,583 Licenses and Permits , ,620 Intergovernmental 42, ,187 10,486 3, ,485 Charges for Services -- 2, ,485 5, ,081 Services to Enterprise Funds -- 1, ,304 Fines , ,691 Special Assessments ,104 1,341 76,431 Investment Earnings 45 6,256 12,078 6,845 62,093 Program Income -- 8, ,451 Other 46 19,595 21,293 1,433 43,430 TOTAL REVENUES 42, , ,769 20,266 1,080,448 EXPENDITURES Current: General Government -- 4,241 24, ,758 Protection of Persons and Property -- 66,917 76,188 1, ,660 Public Works -- 3,800 19, ,909 Health and Sanitation -- 7,621 9,789 3,871 64,236 Transportation -- 3,647 18,698 1, ,891 Cultural and Recreational Services -- 1,718 95, ,027 Community Development 41,025 63,328 87,938 10, ,111 Capital Outlay -- 22,631 11,945 1, ,599 Debt Service: Principal -- 1, ,602 Interest -- 1, ,850 Cost of Issuance Advance Refunding Escrow ,157 TOTAL EXPENDITURES 41, , ,109 19,033 1,131,928 EXCESS (DEFICIENCY) OF REVENUES OVER EXPENDITURES 1,388 49,906 (129,340) 1,233 (51,480) OTHER FINANCING SOURCES (USES) Transfers In -- 10, ,993 1, ,116 Transfers Out -- (40,513) (29,738) (8,815) (156,442) Proceeds of Refunding Loan -- 10, ,110 Payment for Current Refunding of Loan -- (10,835) (24,110) Payment to Refunded Loan Escrow (35,154) TOTAL OTHER FINANCING SOURCES (USES) -- (30,212) 124,255 (7,756) 62,520 NET CHANGE IN FUND BALANCES 1,388 19,694 (5,085) (6,523) 11,040 FUND BALANCES (DEFICIT), JULY 1 (4,366) 156, , ,924 1,147,485 FUND BALANCES (DEFICIT), JUNE 30 $ (2,978) $ 176,084 $ 229,611 $ 99,401 $ 1,158,
237 Budgetary Comparison Schedule (Non-GAAP Budgetary Basis) Annually Budgeted Nonmajor Special Revenue Funds For the Fiscal Year Ended June 30, 2008 (amounts expressed in thousands) REVENUES AND OTHER FINANCING SOURCES Citywide Recycling Actual Variance With Amounts Final Budget Budgeted Amounts (Budgetary Positive Original Final Basis) (Negative) Revenues Taxes $ 17,700 $ 17,700 $ 21,666 $ 3,966 Licenses, Permits and Fines Intergovernmental Charges for Services Special Assessments Interest ,426 1,456 Program Income Other Total Revenues 18,670 18,670 24,254 5,584 Other Financing Sources Transfers from Other Funds TOTAL REVENUES AND OTHER FINANCING SOURCES 18,670 18,670 24,254 5,584 EXPENDITURES AND OTHER FINANCING USES Expenditures Current General Government Protection of Persons and Property Public Works Health and Sanitation 42,247 42,310 11,597 30,713 Transportation Cultural and Recreational Services Community Development Capital Outlay Debt Service Principal Interest Total Expenditures 42,247 42,310 11,597 30,713 Other Financing Uses Transfers to Other Funds 3,510 4,221 3, TOTAL EXPENDITURES AND OTHER FINANCING USES 45,757 46,531 15,146 31,385 EXCESS (DEFICIENCY) OF REVENUES AND OTHER FINANCING SOURCES OVER EXPENDITURES AND OTHER FINANCING USES (27,087) (27,861) 9,108 36,969 FUND BALANCES (DEFICITS), JULY 1, RESTATED 27,087 27,087 38,677 11,590 Appropriation of Fund Balances and Carryforward Appropriations (774) Encumbrances Lapsed FUND BALANCES (DEFICITS), JUNE 30 $ -- $ -- $ 48,223 $ 48,223 Continued
238 Budgetary Comparison Schedule (Non-GAAP Budgetary Basis) Annually Budgeted Nonmajor Special Revenue Funds - (Continued) For the Fiscal Year Ended June 30, 2008 (amounts expressed in thousands) REVENUES AND OTHER FINANCING SOURCES Local Public Safety Actual Variance With Amounts Final Budget Budgeted Amounts (Budgetary Positive Original Final Basis) (Negative) Revenues Taxes $ -- $ -- $ -- $ -- Licenses, Permits and Fines Intergovernmental 39,300 36,800 36,595 (205) Charges for Services Special Assessments Interest Program Income Other Total Revenues 39,300 36,800 36,595 (205) Other Financing Sources Transfers from Other Funds TOTAL REVENUES AND OTHER FINANCING SOURCES 39,300 36,800 36,595 (205) EXPENDITURES AND OTHER FINANCING USES Expenditures Current General Government Protection of Persons and Property Public Works Health and Sanitation Transportation Cultural and Recreational Services Community Development Capital Outlay Debt Service Principal Interest Total Expenditures Other Financing Uses Transfers to Other Funds 39,400 50,050 36,595 13,455 TOTAL EXPENDITURES AND OTHER FINANCING USES 39,400 50,050 36,595 13,455 EXCESS (DEFICIENCY) OF REVENUES AND OTHER FINANCING SOURCES OVER EXPENDITURES AND OTHER FINANCING USES (100) (13,250) -- 13,250 FUND BALANCES (DEFICITS), JULY 1, RESTATED (100) Appropriation of Fund Balances and Carryforward Appropriations -- 13, (13,150) Encumbrances Lapsed FUND BALANCES (DEFICITS), JUNE 30 $ -- $ -- $ -- $ -- Continued
239 Budgetary Comparison Schedule (Non-GAAP Budgetary Basis) Annually Budgeted Nonmajor Special Revenue Funds - (Continued) For the Fiscal Year Ended June 30, 2008 (amounts expressed in thousands) REVENUES AND OTHER FINANCING SOURCES Proposition C Anti-Gridlock Transit Improvement Actual Variance With Amounts Final Budget Budgeted Amounts (Budgetary Positive Original Final Basis) (Negative) Revenues Taxes $ -- $ -- $ -- $ -- Licenses, Permits and Fines Intergovernmental 79,868 88,818 53,638 (35,180) Charges for Services -- 6, (5,986) Special Assessments Interest , Program Income Other (200) Total Revenues 80,668 95,618 55,062 (40,556) Other Financing Sources Transfers from Other Funds 2,000 2,000 6,000 4,000 TOTAL REVENUES AND OTHER FINANCING SOURCES 82,668 97,618 61,062 (36,556) EXPENDITURES AND OTHER FINANCING USES Expenditures Current General Government Protection of Persons and Property Public Works Health and Sanitation Transportation 58,149 85,936 25,397 60,539 Cultural and Recreational Services Community Development Capital Outlay 1,514 5,405 1,683 3,722 Debt Service Principal Interest Total Expenditures 59,663 91,341 27,080 64,261 Other Financing Uses Transfers to Other Funds 23,519 61,351 46,855 14,496 TOTAL EXPENDITURES AND OTHER FINANCING USES 83, ,692 73,935 78,757 EXCESS (DEFICIENCY) OF REVENUES AND OTHER FINANCING SOURCES OVER EXPENDITURES AND OTHER FINANCING USES (514) (55,074) (12,873) 42,201 FUND BALANCES (DEFICITS), JULY 1, RESTATED , ,921 Appropriation of Fund Balances and Carryforward Appropriations -- 54, (54,560) Encumbrances Lapsed ,244 1,244 FUND BALANCES (DEFICITS), JUNE 30 $ -- $ -- $ 95,806 $ 95,806 Continued
240 Budgetary Comparison Schedule (Non-GAAP Budgetary Basis) Annually Budgeted Nonmajor Special Revenue Funds - (Continued) For the Fiscal Year Ended June 30, 2008 (amounts expressed in thousands) REVENUES AND OTHER FINANCING SOURCES Special Parking Revenue Actual Variance With Amounts Final Budget Budgeted Amounts (Budgetary Positive Original Final Basis) (Negative) Revenues Taxes $ -- $ -- $ -- $ -- Licenses, Permits and Fines Intergovernmental Charges for Services 34,118 34,118 36,321 2,203 Special Assessments Interest 3,621 3,621 6,395 2,774 Program Income Other Total Revenues 37,739 37,739 43,274 5,535 Other Financing Sources Transfers from Other Funds TOTAL REVENUES AND OTHER FINANCING SOURCES 37,739 37,739 43,275 5,536 EXPENDITURES AND OTHER FINANCING USES Expenditures Current General Government Protection of Persons and Property Public Works Health and Sanitation Transportation 33,324 71,264 28,527 42,737 Cultural and Recreational Services Community Development Capital Outlay 21,080 23, ,868 Debt Service Principal 3,432 3,432 2, Interest 5,172 5,172 5, Total Expenditures 63, ,752 36,484 67,268 Other Financing Uses Transfers to Other Funds 404 2,745 2, TOTAL EXPENDITURES AND OTHER FINANCING USES 63, ,497 38,972 67,525 EXCESS (DEFICIENCY) OF REVENUES AND OTHER FINANCING SOURCES OVER EXPENDITURES AND OTHER FINANCING USES (25,673) (68,758) 4,303 73,061 FUND BALANCES (DEFICITS), JULY 1, RESTATED 25,673 25, ,476 83,803 Appropriation of Fund Balances and Carryforward Appropriations -- 43, (43,085) Encumbrances Lapsed FUND BALANCES (DEFICITS), JUNE 30 $ -- $ -- $ 114,688 $ 114,688 Continued
241 Budgetary Comparison Schedule (Non-GAAP Budgetary Basis) Annually Budgeted Nonmajor Special Revenue Funds - (Continued) For the Fiscal Year Ended June 30, 2008 (amounts expressed in thousands) REVENUES AND OTHER FINANCING SOURCES Special Police Communications/911 System Tax Actual Variance With Amounts Final Budget Budgeted Amounts (Budgetary Positive Original Final Basis) (Negative) Revenues Taxes $ 20,752 $ 20,753 $ 20,207 $ (546) Licenses, Permits and Fines Intergovernmental Charges for Services Special Assessments Interest Program Income Other Total Revenues 20,902 20,903 20,869 (34) Other Financing Sources Transfers from Other Funds TOTAL REVENUES AND OTHER FINANCING SOURCES 20,902 20,903 20,869 (34) EXPENDITURES AND OTHER FINANCING USES Expenditures Current General Government Protection of Persons and Property 2,455 3, ,567 Public Works Health and Sanitation Transportation Cultural and Recreational Services Community Development Capital Outlay Debt Service Principal Interest Total Expenditures 2,455 3, ,567 Other Financing Uses Transfers to Other Funds 21,746 21,838 20,710 1,128 TOTAL EXPENDITURES AND OTHER FINANCING USES 24,201 24,932 21,237 3,695 EXCESS (DEFICIENCY) OF REVENUES AND OTHER FINANCING SOURCES OVER EXPENDITURES AND OTHER FINANCING USES (3,299) (4,029) (368) 3,661 FUND BALANCES (DEFICITS), JULY 1, RESTATED 3,299 3,299 5,749 2,450 Appropriation of Fund Balances and Carryforward Appropriations (730) Encumbrances Lapsed FUND BALANCES (DEFICITS), JUNE 30 $ -- $ -- $ 5,386 $ 5,386 Continued
242 Budgetary Comparison Schedule (Non-GAAP Budgetary Basis) Annually Budgeted Nonmajor Special Revenue Funds - (Continued) For the Fiscal Year Ended June 30, 2008 (amounts expressed in thousands) REVENUES AND OTHER FINANCING SOURCES Stormwater Pollution Abatement Actual Variance With Amounts Final Budget Budgeted Amounts (Budgetary Positive Original Final Basis) (Negative) Revenues Taxes $ -- $ -- $ -- $ -- Licenses, Permits and Fines Intergovernmental 1,400 1,400 1,126 (274) Charges for Services 29,100 29,100 28,320 (780) Special Assessments Interest (25) Program Income Other (335) Total Revenues 31,313 31,313 29,899 (1,414) Other Financing Sources Transfers from Other Funds TOTAL REVENUES AND OTHER FINANCING SOURCES 31,313 31,313 29,899 (1,414) EXPENDITURES AND OTHER FINANCING USES Expenditures Current General Government Protection of Persons and Property Public Works Health and Sanitation 9,872 12,204 10,027 2,177 Transportation Cultural and Recreational Services Community Development Capital Outlay 445 3,183 1,768 1,415 Debt Service Principal Interest Total Expenditures 10,317 15,387 11,795 3,592 Other Financing Uses Transfers to Other Funds 23,021 29,914 22,385 7,529 TOTAL EXPENDITURES AND OTHER FINANCING USES 33,338 45,301 34,180 11,121 EXCESS (DEFICIENCY) OF REVENUES AND OTHER FINANCING SOURCES OVER EXPENDITURES AND OTHER FINANCING USES (2,025) (13,988) (4,281) 9,707 FUND BALANCES (DEFICITS), JULY 1, RESTATED 2,025 2,025 6,421 4,396 Appropriation of Fund Balances and Carryforward Appropriations -- 11, (11,963) Encumbrances Lapsed FUND BALANCES (DEFICITS), JUNE 30 $ -- $ -- $ 2,213 $ 2,213 Continued
243 Budgetary Comparison Schedule (Non-GAAP Budgetary Basis) Annually Budgeted Nonmajor Special Revenue Funds - (Continued) For the Fiscal Year Ended June 30, 2008 (amounts expressed in thousands) REVENUES AND OTHER FINANCING SOURCES Street Lighting Maintenance Assessment Actual Variance With Amounts Final Budget Budgeted Amounts (Budgetary Positive Original Final Basis) (Negative) Revenues Taxes $ -- $ -- $ -- $ -- Licenses, Permits and Fines , Intergovernmental (309) Charges for Services , Special Assessments 43,668 43,668 41,472 (2,196) Interest Program Income Other (259) Total Revenues 45,910 46,341 44,664 (1,677) Other Financing Sources Transfers from Other Funds TOTAL REVENUES AND OTHER FINANCING SOURCES 45,910 46,341 44,664 (1,677) EXPENDITURES AND OTHER FINANCING USES Expenditures Current General Government Protection of Persons and Property Public Works 20,976 28,518 20,846 7,672 Health and Sanitation Transportation Cultural and Recreational Services Community Development Capital Outlay 4,405 10,775 4,695 6,080 Debt Service Principal Interest Total Expenditures 25,381 39,293 25,541 13,752 Other Financing Uses Transfers to Other Funds 20,540 24,636 19,068 5,568 TOTAL EXPENDITURES AND OTHER FINANCING USES 45,921 63,929 44,609 19,320 EXCESS (DEFICIENCY) OF REVENUES AND OTHER FINANCING SOURCES OVER EXPENDITURES AND OTHER FINANCING USES (11) (17,588) 55 17,643 FUND BALANCES (DEFICITS), JULY 1, RESTATED ,622 4,611 Appropriation of Fund Balances and Carryforward Appropriations -- 17, (17,577) Encumbrances Lapsed FUND BALANCES (DEFICITS), JUNE 30 $ -- $ -- $ 5,426 $ 5,426 Continued
244 Budgetary Comparison Schedule (Non-GAAP Budgetary Basis) Annually Budgeted Nonmajor Special Revenue Funds - (Continued) For the Fiscal Year Ended June 30, 2008 (amounts expressed in thousands) REVENUES AND OTHER FINANCING SOURCES Zoo Actual Variance With Amounts Final Budget Budgeted Amounts (Budgetary Positive Original Final Basis) (Negative) Revenues Taxes $ -- $ -- $ -- $ -- Licenses, Permits and Fines Intergovernmental -- 3,040 3,041 1 Charges for Services 8,475 8,744 9, Special Assessments Interest Program Income Other Total Revenues 8,475 11,784 12,841 1,057 Other Financing Sources Transfers from Other Funds 9,900 9,900 9,200 (700) TOTAL REVENUES AND OTHER FINANCING SOURCES 18,375 21,684 22, EXPENDITURES AND OTHER FINANCING USES Expenditures Current General Government Protection of Persons and Property Public Works Health and Sanitation Transportation Cultural and Recreational Services -- 4,772 1,933 2,839 Community Development Capital Outlay Debt Service Principal Interest Total Expenditures -- 4,772 1,933 2,839 Other Financing Uses Transfers to Other Funds 19,357 25,873 18,736 7,137 TOTAL EXPENDITURES AND OTHER FINANCING USES 19,357 30,645 20,669 9,976 EXCESS (DEFICIENCY) OF REVENUES AND OTHER FINANCING SOURCES OVER EXPENDITURES AND OTHER FINANCING USES (982) (8,961) 1,372 10,333 FUND BALANCES (DEFICITS), JULY 1, RESTATED ,677 7,695 Appropriation of Fund Balances and Carryforward Appropriations -- 7, (7,979) Encumbrances Lapsed FUND BALANCES (DEFICITS), JUNE 30 $ -- $ -- $ 10,144 $ 10,144 Continued
245 Budgetary Comparison Schedule (Non-GAAP Budgetary Basis) Annually Budgeted Nonmajor Special Revenue Funds - (Continued) For the Fiscal Year Ended June 30, 2008 (amounts expressed in thousands) REVENUES AND OTHER FINANCING SOURCES Disaster Assistance Actual Variance With Amounts Final Budget Budgeted Amounts (Budgetary Positive Original Final Basis) (Negative) Revenues Taxes $ -- $ -- $ -- $ -- Licenses, Permits and Fines Intergovernmental ,793 14,939 (7,854) Charges for Services Special Assessments Interest Program Income Other Total Revenues ,793 15,769 (7,024) Other Financing Sources Transfers from Other Funds TOTAL REVENUES AND OTHER FINANCING SOURCES ,793 15,769 (7,024) EXPENDITURES AND OTHER FINANCING USES Expenditures Current General Government Protection of Persons and Property ,934 21,863 3,071 Public Works Health and Sanitation Transportation Cultural and Recreational Services Community Development Capital Outlay Debt Service Principal Interest Total Expenditures ,934 21,863 3,071 Other Financing Uses Transfers to Other Funds , ,833 TOTAL EXPENDITURES AND OTHER FINANCING USES ,497 22,593 40,904 EXCESS (DEFICIENCY) OF REVENUES AND OTHER FINANCING SOURCES OVER EXPENDITURES AND OTHER FINANCING USES -- (40,704) (6,824) 33,880 FUND BALANCES (DEFICITS), JULY 1, RESTATED ,244 18,244 Appropriation of Fund Balances and Carryforward Appropriations -- 40, (40,704) Encumbrances Lapsed FUND BALANCES (DEFICITS), JUNE 30 $ -- $ -- $ 11,420 $ 11,420 Continued
246 Budgetary Comparison Schedule (Non-GAAP Budgetary Basis) Annually Budgeted Nonmajor Special Revenue Funds - (Continued) For the Fiscal Year Ended June 30, 2008 (amounts expressed in thousands) REVENUES AND OTHER FINANCING SOURCES Home Investment Partnership Program Actual Variance With Amounts Final Budget Budgeted Amounts (Budgetary Positive Original Final Basis) (Negative) Revenues Taxes $ -- $ -- $ -- $ -- Licenses, Permits and Fines Intergovernmental 5,641 46,507 70,413 23,906 Charges for Services Special Assessments Interest Program Income ,282 6,282 Other Total Revenues 5,641 46,507 77,144 30,637 Other Financing Sources Transfers from Other Funds TOTAL REVENUES AND OTHER FINANCING SOURCES 5,641 46,507 77,144 30,637 EXPENDITURES AND OTHER FINANCING USES Expenditures Current General Government Protection of Persons and Property Public Works Health and Sanitation Transportation Cultural and Recreational Services Community Development 1, ,988 72, ,311 Capital Outlay Debt Service Principal Interest Total Expenditures 1, ,988 72, ,311 Other Financing Uses Transfers to Other Funds 3,642 4,167 3, TOTAL EXPENDITURES AND OTHER FINANCING USES 5, ,155 76, ,638 EXCESS (DEFICIENCY) OF REVENUES AND OTHER FINANCING SOURCES OVER EXPENDITURES AND OTHER FINANCING USES -- (158,648) ,275 FUND BALANCES (DEFICITS), JULY 1, RESTATED (32,969) (32,969) Appropriation of Fund Balances and Carryforward Appropriations , (158,648) Encumbrances Lapsed ,934 4,934 FUND BALANCES (DEFICITS), JUNE 30 $ -- $ -- $ (27,408) $ (27,408) Continued
247 Budgetary Comparison Schedule (Non-GAAP Budgetary Basis) Annually Budgeted Nonmajor Special Revenue Funds - (Continued) For the Fiscal Year Ended June 30, 2008 (amounts expressed in thousands) REVENUES AND OTHER FINANCING SOURCES Special Gas Tax Street Improvement Actual Variance With Amounts Final Budget Budgeted Amounts (Budgetary Positive Original Final Basis) (Negative) Revenues Taxes $ -- $ -- $ -- $ -- Licenses, Permits and Fines Intergovernmental 80,162 80,162 79,734 (428) Charges for Services Special Assessments Interest ,654 1,214 Program Income Other Total Revenues 80,632 80,632 81, Other Financing Sources Transfers from Other Funds -- 1, (1,700) TOTAL REVENUES AND OTHER FINANCING SOURCES 80,632 82,332 81,418 (914) EXPENDITURES AND OTHER FINANCING USES Expenditures Current General Government Protection of Persons and Property Public Works 1,130 1,155 1, Health and Sanitation Transportation Cultural and Recreational Services Community Development Capital Outlay 6,028 13,158 4,215 8,943 Debt Service Principal Interest Total Expenditures 7,158 14,313 5,345 8,968 Other Financing Uses Transfers to Other Funds 85,715 93,530 88,082 5,448 TOTAL EXPENDITURES AND OTHER FINANCING USES 92, ,843 93,427 14,416 EXCESS (DEFICIENCY) OF REVENUES AND OTHER FINANCING SOURCES OVER EXPENDITURES AND OTHER FINANCING USES (12,241) (25,511) (12,009) 13,502 FUND BALANCES (DEFICITS), JULY 1, RESTATED 12,241 12,241 22,920 10,679 Appropriation of Fund Balances and Carryforward Appropriations -- 13, (13,270) Encumbrances Lapsed FUND BALANCES (DEFICITS), JUNE 30 $ -- $ -- $ 11,363 $ 11,363 Continued
248 Budgetary Comparison Schedule (Non-GAAP Budgetary Basis) Annually Budgeted Nonmajor Special Revenue Funds - (Continued) For the Fiscal Year Ended June 30, 2008 (amounts expressed in thousands) REVENUES AND OTHER FINANCING SOURCES Workforce Investment Act Actual Variance With Amounts Final Budget Budgeted Amounts (Budgetary Positive Original Final Basis) (Negative) Revenues Taxes $ -- $ -- $ -- $ -- Licenses, Permits and Fines Intergovernmental 11,835 51,861 43,275 (8,586) Charges for Services Special Assessments Interest Program Income Other Total Revenues 11,835 51,861 43,355 (8,506) Other Financing Sources Transfers from Other Funds TOTAL REVENUES AND OTHER FINANCING SOURCES 11,835 51,861 43,355 (8,506) EXPENDITURES AND OTHER FINANCING USES Expenditures Current General Government Protection of Persons and Property Public Works Health and Sanitation Transportation Cultural and Recreational Services Community Development 3,421 61,649 32,900 28,749 Capital Outlay Debt Service Principal Interest Total Expenditures 3,421 61,649 32,900 28,749 Other Financing Uses Transfers to Other Funds 8,414 33,022 10,194 22,828 TOTAL EXPENDITURES AND OTHER FINANCING USES 11,835 94,671 43,094 51,577 EXCESS (DEFICIENCY) OF REVENUES AND OTHER FINANCING SOURCES OVER EXPENDITURES AND OTHER FINANCING USES -- (42,810) ,071 FUND BALANCES (DEFICITS), JULY 1, RESTATED (15,789) (15,789) Appropriation of Fund Balances and Carryforward Appropriations -- 42, (42,810) Encumbrances Lapsed ,140 2,140 FUND BALANCES (DEFICITS), JUNE 30 $ -- $ -- $ (13,388) $ (13,388) Continued
249 REVENUES AND OTHER FINANCING SOURCES CITY OF LOS ANGELES Budgetary Comparison Schedule (Non-GAAP Budgetary Basis) Annually Budgeted Nonmajor Special Revenue Funds - (Continued) For the Fiscal Year Ended June 30, 2008 (amounts expressed in thousands) Nonmajor Other Grant Fund - Community Services Block Grant Actual Variance With Amounts Final Budget Budgeted Amounts (Budgetary Positive Original Final Basis) (Negative) Revenues Taxes $ -- $ -- $ -- $ -- Licenses, Permits and Fines Intergovernmental 1,798 6,934 6,233 (701) Charges for Services Special Assessments Interest Program Income Other Total Revenues 1,798 6,934 6,268 (666) Other Financing Sources Transfers from Other Funds TOTAL REVENUES AND OTHER FINANCING SOURCES 1,798 6,934 6,268 (666) EXPENDITURES AND OTHER FINANCING USES Expenditures Current General Government Protection of Persons and Property Public Works Health and Sanitation Transportation Cultural and Recreational Services Community Development ,520 6,689 3,831 Capital Outlay Debt Service Principal Interest Total Expenditures ,520 6,689 3,831 Other Financing Uses Transfers to Other Funds 1,388 3,267 1,073 2,194 TOTAL EXPENDITURES AND OTHER FINANCING USES 1,798 13,787 7,762 6,025 EXCESS (DEFICIENCY) OF REVENUES AND OTHER FINANCING SOURCES OVER EXPENDITURES AND OTHER FINANCING USES -- (6,853) (1,494) 5,359 FUND BALANCES (DEFICITS), JULY 1, RESTATED ,016 1,016 Appropriation of Fund Balances and Carryforward Appropriations -- 6, (6,853) Encumbrances Lapsed FUND BALANCES (DEFICITS), JUNE 30 $ -- $ -- $ (228) $ (228) Continued
250 REVENUES AND OTHER FINANCING SOURCES CITY OF LOS ANGELES Budgetary Comparison Schedule (Non-GAAP Budgetary Basis) Annually Budgeted Nonmajor Special Revenue Funds - (Continued) For the Fiscal Year Ended June 30, 2008 (amounts expressed in thousands) Nonmajor Other Grant Fund - Forfeited Assets Trust of Police Department Actual Variance With Amounts Final Budget Budgeted Amounts (Budgetary Positive Original Final Basis) (Negative) Revenues Taxes $ -- $ -- $ -- $ -- Licenses, Permits and Fines Intergovernmental ,328 7,328 Charges for Services Special Assessments Interest Program Income Other Total Revenues ,167 8,167 Other Financing Sources Transfers from Other Funds TOTAL REVENUES AND OTHER FINANCING SOURCES ,167 8,167 EXPENDITURES AND OTHER FINANCING USES Expenditures Current General Government Protection of Persons and Property 6,891 10,536 3,968 6,568 Public Works Health and Sanitation Transportation Cultural and Recreational Services Community Development Capital Outlay Debt Service Principal Interest Total Expenditures 6,891 10,536 3,968 6,568 Other Financing Uses Transfers to Other Funds TOTAL EXPENDITURES AND OTHER FINANCING USES 7,090 10,739 4,168 6,571 EXCESS (DEFICIENCY) OF REVENUES AND OTHER FINANCING SOURCES OVER EXPENDITURES AND OTHER FINANCING USES (7,090) (10,739) 3,999 14,738 FUND BALANCES (DEFICITS), JULY 1, RESTATED 7,090 7,090 12,776 5,686 Appropriation of Fund Balances and Carryforward Appropriations -- 3, (3,649) Encumbrances Lapsed FUND BALANCES (DEFICITS), JUNE 30 $ -- $ -- $ 16,813 $ 16,813 Continued
251 REVENUES AND OTHER FINANCING SOURCES CITY OF LOS ANGELES Budgetary Comparison Schedule (Non-GAAP Budgetary Basis) Annually Budgeted Nonmajor Special Revenue Funds - (Continued) For the Fiscal Year Ended June 30, 2008 (amounts expressed in thousands) Nonmajor Other Grant Fund - Household Hazardous Waste Actual Variance With Amounts Final Budget Budgeted Amounts (Budgetary Positive Original Final Basis) (Negative) Revenues Taxes $ -- $ -- $ -- $ -- Licenses, Permits and Fines Intergovernmental 2,070 2,070 2, Charges for Services Special Assessments Interest Program Income Other Total Revenues 2,091 2,091 2, Other Financing Sources Transfers from Other Funds TOTAL REVENUES AND OTHER FINANCING SOURCES 2,091 2,091 2, EXPENDITURES AND OTHER FINANCING USES Expenditures Current General Government Protection of Persons and Property Public Works Health and Sanitation 861 1, Transportation Cultural and Recreational Services Community Development Capital Outlay Debt Service Principal Interest Total Expenditures 861 1, Other Financing Uses Transfers to Other Funds 1,943 1,943 1, TOTAL EXPENDITURES AND OTHER FINANCING USES 2,804 3,159 2, EXCESS (DEFICIENCY) OF REVENUES AND OTHER FINANCING SOURCES OVER EXPENDITURES AND OTHER FINANCING USES (713) (1,068) (146) 922 FUND BALANCES (DEFICITS), JULY 1, RESTATED , Appropriation of Fund Balances and Carryforward Appropriations (355) Encumbrances Lapsed FUND BALANCES (DEFICITS), JUNE 30 $ -- $ -- $ 1,296 $ 1,296 Continued
252 REVENUES AND OTHER FINANCING SOURCES CITY OF LOS ANGELES Budgetary Comparison Schedule (Non-GAAP Budgetary Basis) Annually Budgeted Nonmajor Special Revenue Funds - (Continued) For the Fiscal Year Ended June 30, 2008 (amounts expressed in thousands) Nonmajor Other Grant Fund - Housing Opportunities for Persons with AIDS Actual Variance With Amounts Final Budget Budgeted Amounts (Budgetary Positive Original Final Basis) (Negative) Revenues Taxes $ -- $ -- $ -- $ -- Licenses, Permits and Fines Intergovernmental ,531 9,055 (2,476) Charges for Services Special Assessments Interest Program Income Other Total Revenues ,531 9,423 (2,108) Other Financing Sources Transfers from Other Funds TOTAL REVENUES AND OTHER FINANCING SOURCES ,531 9,423 (2,108) EXPENDITURES AND OTHER FINANCING USES Expenditures Current General Government Protection of Persons and Property Public Works Health and Sanitation Transportation Cultural and Recreational Services Community Development 86 23,341 12,450 10,891 Capital Outlay Debt Service Principal Interest Total Expenditures 86 23,341 12,450 10,891 Other Financing Uses Transfers to Other Funds TOTAL EXPENDITURES AND OTHER FINANCING USES ,746 12,715 11,031 EXCESS (DEFICIENCY) OF REVENUES AND OTHER FINANCING SOURCES OVER EXPENDITURES AND OTHER FINANCING USES -- (12,215) (3,292) 8,923 FUND BALANCES (DEFICITS), JULY 1, RESTATED (4,945) (4,945) Appropriation of Fund Balances and Carryforward Appropriations -- 12, (12,215) Encumbrances Lapsed ,687 1,687 FUND BALANCES (DEFICITS), JUNE 30 $ -- $ -- $ (6,550) $ (6,550) Continued
253 REVENUES AND OTHER FINANCING SOURCES CITY OF LOS ANGELES Budgetary Comparison Schedule (Non-GAAP Budgetary Basis) Annually Budgeted Nonmajor Special Revenue Funds - (Continued) For the Fiscal Year Ended June 30, 2008 (amounts expressed in thousands) Nonmajor Other Grant Fund - Mobile Source Air Pollution Reduction Actual Variance With Amounts Final Budget Budgeted Amounts (Budgetary Positive Original Final Basis) (Negative) Revenues Taxes $ -- $ -- $ -- $ -- Licenses, Permits and Fines Intergovernmental 4,760 4,770 4, Charges for Services Special Assessments Interest Program Income Other Total Revenues 4,960 4,971 5, Other Financing Sources Transfers from Other Funds TOTAL REVENUES AND OTHER FINANCING SOURCES 4,960 4,971 5, EXPENDITURES AND OTHER FINANCING USES Expenditures Current General Government Protection of Persons and Property Public Works Health and Sanitation 3,364 4,301 2,660 1,641 Transportation Cultural and Recreational Services Community Development Capital Outlay Debt Service Principal Interest Total Expenditures 3,364 4,301 2,660 1,641 Other Financing Uses Transfers to Other Funds 2,054 2,054 1, TOTAL EXPENDITURES AND OTHER FINANCING USES 5,418 6,355 4,617 1,738 EXCESS (DEFICIENCY) OF REVENUES AND OTHER FINANCING SOURCES OVER EXPENDITURES AND OTHER FINANCING USES (458) (1,384) 503 1,887 FUND BALANCES (DEFICITS), JULY 1, RESTATED ,748 3,290 Appropriation of Fund Balances and Carryforward Appropriations (926) Encumbrances Lapsed FUND BALANCES (DEFICITS), JUNE 30 $ -- $ -- $ 4,323 $ 4,323 Continued
254 REVENUES AND OTHER FINANCING SOURCES CITY OF LOS ANGELES Budgetary Comparison Schedule (Non-GAAP Budgetary Basis) Annually Budgeted Nonmajor Special Revenue Funds - (Continued) For the Fiscal Year Ended June 30, 2008 (amounts expressed in thousands) Nonmajor Other Grant Fund - Older Americans Act Actual Variance With Amounts Final Budget Budgeted Amounts (Budgetary Positive Original Final Basis) (Negative) Revenues Taxes $ -- $ -- $ -- $ -- Licenses, Permits and Fines Intergovernmental 1,682 19,608 18,268 (1,340) Charges for Services Special Assessments Interest Program Income Other Total Revenues 1,682 19,608 18,270 (1,338) Other Financing Sources Transfers from Other Funds ,905 1,905 TOTAL REVENUES AND OTHER FINANCING SOURCES 1,682 19,608 20, EXPENDITURES AND OTHER FINANCING USES Expenditures Current General Government Protection of Persons and Property Public Works Health and Sanitation Transportation Cultural and Recreational Services Community Development -- 22,716 16,638 6,078 Capital Outlay Debt Service Principal Interest Total Expenditures -- 22,716 16,638 6,078 Other Financing Uses Transfers to Other Funds 1,682 4,744 2,293 2,451 TOTAL EXPENDITURES AND OTHER FINANCING USES 1,682 27,460 18,931 8,529 EXCESS (DEFICIENCY) OF REVENUES AND OTHER FINANCING SOURCES OVER EXPENDITURES AND OTHER FINANCING USES -- (7,852) 1,244 9,096 FUND BALANCES (DEFICITS), JULY 1, RESTATED (1,241) (1,241) Appropriation of Fund Balances and Carryforward Appropriations -- 7, (7,852) Encumbrances Lapsed FUND BALANCES (DEFICITS), JUNE 30 $ -- $ -- $ 590 $ 590 Continued
255 REVENUES AND OTHER FINANCING SOURCES CITY OF LOS ANGELES Budgetary Comparison Schedule (Non-GAAP Budgetary Basis) Annually Budgeted Nonmajor Special Revenue Funds - (Continued) For the Fiscal Year Ended June 30, 2008 (amounts expressed in thousands) Nonmajor Other Grant Fund - Supplemental Law Enforcement Services Actual Variance With Amounts Final Budget Budgeted Amounts (Budgetary Positive Original Final Basis) (Negative) Revenues Taxes $ -- $ -- $ -- $ -- Licenses, Permits and Fines Intergovernmental 7,739 10,239 7,726 (2,513) Charges for Services Special Assessments Interest Program Income Other Total Revenues 7,889 10,389 8,188 (2,201) Other Financing Sources Transfers from Other Funds TOTAL REVENUES AND OTHER FINANCING SOURCES 7,889 10,389 8,188 (2,201) EXPENDITURES AND OTHER FINANCING USES Expenditures Current General Government Protection of Persons and Property Public Works Health and Sanitation Transportation Cultural and Recreational Services Community Development Capital Outlay Debt Service Principal Interest Total Expenditures Other Financing Uses Transfers to Other Funds 7,966 15,534 10,483 5,051 TOTAL EXPENDITURES AND OTHER FINANCING USES 7,966 15,600 10,483 5,117 EXCESS (DEFICIENCY) OF REVENUES AND OTHER FINANCING SOURCES OVER EXPENDITURES AND OTHER FINANCING USES (77) (5,211) (2,295) 2,916 FUND BALANCES (DEFICITS), JULY 1, RESTATED ,269 2,192 Appropriation of Fund Balances and Carryforward Appropriations -- 5, (5,134) Encumbrances Lapsed FUND BALANCES (DEFICITS), JUNE 30 $ -- $ -- $ (26) $ (26) Continued
256 REVENUES AND OTHER FINANCING SOURCES CITY OF LOS ANGELES Budgetary Comparison Schedule (Non-GAAP Budgetary Basis) Annually Budgeted Nonmajor Special Revenue Funds - (Continued) For the Fiscal Year Ended June 30, 2008 (amounts expressed in thousands) Nonmajor Other Grant Fund - Local Law Enforcement Block Grant Actual Variance With Amounts Final Budget Budgeted Amounts (Budgetary Positive Original Final Basis) (Negative) Revenues Taxes $ -- $ -- $ -- $ -- Licenses, Permits and Fines Intergovernmental -- 3,912 5,393 1,481 Charges for Services Special Assessments Interest (16) Program Income Other Total Revenues 26 3,938 5,403 1,465 Other Financing Sources Transfers from Other Funds TOTAL REVENUES AND OTHER FINANCING SOURCES 26 3,938 5,403 1,465 EXPENDITURES AND OTHER FINANCING USES Expenditures Current General Government Protection of Persons and Property 813 8,860 5,191 3,669 Public Works Health and Sanitation Transportation Cultural and Recreational Services Community Development Capital Outlay Debt Service Principal Interest Total Expenditures 813 8,860 5,191 3,669 Other Financing Uses Transfers to Other Funds -- 15, ,376 TOTAL EXPENDITURES AND OTHER FINANCING USES ,522 5,477 19,045 EXCESS (DEFICIENCY) OF REVENUES AND OTHER FINANCING SOURCES OVER EXPENDITURES AND OTHER FINANCING USES (787) (20,584) (74) 20,510 FUND BALANCES (DEFICITS), JULY 1, RESTATED (788) (1,575) Appropriation of Fund Balances and Carryforward Appropriations -- 19, (19,797) Encumbrances Lapsed FUND BALANCES (DEFICITS), JUNE 30 $ -- $ -- $ (862) $ (862) Continued
257 REVENUES AND OTHER FINANCING SOURCES CITY OF LOS ANGELES Budgetary Comparison Schedule (Non-GAAP Budgetary Basis) Annually Budgeted Nonmajor Special Revenue Funds - (Continued) For the Fiscal Year Ended June 30, 2008 (amounts expressed in thousands) Nonmajor Other Special Revenue Fund - Arts and Cultural Facilities and Services Actual Variance With Amounts Final Budget Budgeted Amounts (Budgetary Positive Original Final Basis) (Negative) Revenues Taxes $ -- $ -- $ -- $ -- Licenses, Permits and Fines Intergovernmental Charges for Services Special Assessments Interest Program Income Other Total Revenues Other Financing Sources Transfers from Other Funds 11,077 11,077 11, TOTAL REVENUES AND OTHER FINANCING SOURCES 11,197 11,315 11, EXPENDITURES AND OTHER FINANCING USES Expenditures Current General Government Protection of Persons and Property Public Works Health and Sanitation Transportation Cultural and Recreational Services 1,360 3,769 1,760 2,009 Community Development Capital Outlay Debt Service Principal Interest Total Expenditures 1,360 3,769 1,760 2,009 Other Financing Uses Transfers to Other Funds 9,874 10,133 9, TOTAL EXPENDITURES AND OTHER FINANCING USES 11,234 13,902 11,255 2,647 EXCESS (DEFICIENCY) OF REVENUES AND OTHER FINANCING SOURCES OVER EXPENDITURES AND OTHER FINANCING USES (37) (2,587) 331 2,918 FUND BALANCES (DEFICITS), JULY 1, RESTATED ,334 2,297 Appropriation of Fund Balances and Carryforward Appropriations -- 2, (2,550) Encumbrances Lapsed FUND BALANCES (DEFICITS), JUNE 30 $ -- $ -- $ 2,680 $ 2,680 Continued
258 REVENUES AND OTHER FINANCING SOURCES CITY OF LOS ANGELES Budgetary Comparison Schedule (Non-GAAP Budgetary Basis) Annually Budgeted Nonmajor Special Revenue Funds - (Continued) For the Fiscal Year Ended June 30, 2008 (amounts expressed in thousands) Nonmajor Other Special Revenue Fund - Arts Development Fee Actual Variance With Amounts Final Budget Budgeted Amounts (Budgetary Positive Original Final Basis) (Negative) Revenues Taxes $ -- $ -- $ -- $ -- Licenses, Permits and Fines Intergovernmental Charges for Services 1,350 1,767 1,142 (625) Special Assessments Interest Program Income Other Total Revenues 1,399 1,816 1,301 (515) Other Financing Sources Transfers from Other Funds TOTAL REVENUES AND OTHER FINANCING SOURCES 1,399 1,816 1,301 (515) EXPENDITURES AND OTHER FINANCING USES Expenditures Current General Government Protection of Persons and Property Public Works Health and Sanitation Transportation Cultural and Recreational Services 1,400 3, ,801 Community Development Capital Outlay Debt Service Principal Interest Total Expenditures 1,400 3, ,801 Other Financing Uses Transfers to Other Funds (1) 31 TOTAL EXPENDITURES AND OTHER FINANCING USES 1,400 3, ,832 EXCESS (DEFICIENCY) OF REVENUES AND OTHER FINANCING SOURCES OVER EXPENDITURES AND OTHER FINANCING USES (1) (1,358) 959 2,317 FUND BALANCES (DEFICITS), JULY 1, RESTATED 1 1 2,771 2,770 Appropriation of Fund Balances and Carryforward Appropriations -- 1, (1,357) Encumbrances Lapsed FUND BALANCES (DEFICITS), JUNE 30 $ -- $ -- $ 3,753 $ 3,753 Continued
259 REVENUES AND OTHER FINANCING SOURCES CITY OF LOS ANGELES Budgetary Comparison Schedule (Non-GAAP Budgetary Basis) Annually Budgeted Nonmajor Special Revenue Funds - (Continued) For the Fiscal Year Ended June 30, 2008 (amounts expressed in thousands) Nonmajor Other Special Revenue Fund - City Employees Ridesharing Actual Variance With Amounts Final Budget Budgeted Amounts (Budgetary Positive Original Final Basis) (Negative) Revenues Taxes $ -- $ -- $ -- $ -- Licenses, Permits and Fines Intergovernmental Charges for Services 3,024 3,028 2,058 (970) Special Assessments Interest Program Income Other Total Revenues 3,028 3,035 3,038 3 Other Financing Sources Transfers from Other Funds TOTAL REVENUES AND OTHER FINANCING SOURCES 3,028 3,035 3,038 3 EXPENDITURES AND OTHER FINANCING USES Expenditures Current General Government Protection of Persons and Property Public Works Health and Sanitation Transportation Cultural and Recreational Services Community Development Capital Outlay Debt Service Principal Interest Total Expenditures Other Financing Uses Transfers to Other Funds 3,029 3,038 3,029 9 TOTAL EXPENDITURES AND OTHER FINANCING USES 3,029 3,320 3, EXCESS (DEFICIENCY) OF REVENUES AND OTHER FINANCING SOURCES OVER EXPENDITURES AND OTHER FINANCING USES (1) (285) FUND BALANCES (DEFICITS), JULY 1, RESTATED Appropriation of Fund Balances and Carryforward Appropriations (284) Encumbrances Lapsed FUND BALANCES (DEFICITS), JUNE 30 $ -- $ -- $ 293 $ 293 Continued
260 REVENUES AND OTHER FINANCING SOURCES CITY OF LOS ANGELES Budgetary Comparison Schedule (Non-GAAP Budgetary Basis) Annually Budgeted Nonmajor Special Revenue Funds - (Continued) For the Fiscal Year Ended June 30, 2008 (amounts expressed in thousands) Nonmajor Other Special Revenue Fund - City Ethics Commission Actual Variance With Amounts Final Budget Budgeted Amounts (Budgetary Positive Original Final Basis) (Negative) Revenues Taxes $ -- $ -- $ -- $ -- Licenses, Permits and Fines Intergovernmental Charges for Services Special Assessments Interest Program Income Other Total Revenues Other Financing Sources Transfers from Other Funds 2,237 2,237 2, TOTAL REVENUES AND OTHER FINANCING SOURCES 2,237 2,237 2, EXPENDITURES AND OTHER FINANCING USES Expenditures Current General Government Protection of Persons and Property Public Works Health and Sanitation Transportation Cultural and Recreational Services Community Development Capital Outlay Debt Service Principal Interest Total Expenditures Other Financing Uses Transfers to Other Funds 2,604 7,264 2,287 4,977 TOTAL EXPENDITURES AND OTHER FINANCING USES 2,755 8,258 2,287 5,971 EXCESS (DEFICIENCY) OF REVENUES AND OTHER FINANCING SOURCES OVER EXPENDITURES AND OTHER FINANCING USES (518) (6,021) (50) 5,971 FUND BALANCES (DEFICITS), JULY 1, RESTATED Appropriation of Fund Balances and Carryforward Appropriations -- 5, (5,503) Encumbrances Lapsed FUND BALANCES (DEFICITS), JUNE 30 $ -- $ -- $ 529 $ 529 Continued
261 REVENUES AND OTHER FINANCING SOURCES CITY OF LOS ANGELES Budgetary Comparison Schedule (Non-GAAP Budgetary Basis) Annually Budgeted Nonmajor Special Revenue Funds - (Continued) For the Fiscal Year Ended June 30, 2008 (amounts expressed in thousands) Nonmajor Other Special Revenue Fund - City of Los Angeles Affordable Housing Actual Variance With Amounts Final Budget Budgeted Amounts (Budgetary Positive Original Final Basis) (Negative) Revenues Taxes $ -- $ -- $ -- $ -- Licenses, Permits and Fines Intergovernmental -- 33, (33,903) Charges for Services Special Assessments Interest , Program Income Other Total Revenues ,543 1,674 (32,869) Other Financing Sources Transfers from Other Funds 44,875 48,040 25,692 (22,348) TOTAL REVENUES AND OTHER FINANCING SOURCES 45,430 82,583 27,366 (55,217) EXPENDITURES AND OTHER FINANCING USES Expenditures Current General Government Protection of Persons and Property Public Works Health and Sanitation Transportation Cultural and Recreational Services Community Development 44, ,954 45,142 82,812 Capital Outlay Debt Service Principal Interest Total Expenditures 44, ,954 45,142 82,812 Other Financing Uses Transfers to Other Funds 1,332 5,668 4,305 1,363 TOTAL EXPENDITURES AND OTHER FINANCING USES 45, ,622 49,447 84,175 EXCESS (DEFICIENCY) OF REVENUES AND OTHER FINANCING SOURCES OVER EXPENDITURES AND OTHER FINANCING USES -- (51,039) (22,081) 28,958 FUND BALANCES (DEFICITS), JULY 1, RESTATED ,291 21,291 Appropriation of Fund Balances and Carryforward Appropriations -- 51, (51,039) Encumbrances Lapsed FUND BALANCES (DEFICITS), JUNE 30 $ -- $ -- $ 93 $ 93 Continued
262 REVENUES AND OTHER FINANCING SOURCES CITY OF LOS ANGELES Budgetary Comparison Schedule (Non-GAAP Budgetary Basis) Annually Budgeted Nonmajor Special Revenue Funds - (Continued) For the Fiscal Year Ended June 30, 2008 (amounts expressed in thousands) Nonmajor Other Special Revenue Fund - City Procurement and Materials Management Actual Variance With Amounts Final Budget Budgeted Amounts (Budgetary Positive Original Final Basis) (Negative) Revenues Taxes $ -- $ -- $ -- $ -- Licenses, Permits and Fines Intergovernmental Charges for Services Special Assessments Interest Program Income Other Total Revenues Other Financing Sources Transfers from Other Funds TOTAL REVENUES AND OTHER FINANCING SOURCES EXPENDITURES AND OTHER FINANCING USES Expenditures Current General Government Protection of Persons and Property Public Works Health and Sanitation Transportation Cultural and Recreational Services Community Development Capital Outlay Debt Service Principal Interest Total Expenditures Other Financing Uses Transfers to Other Funds TOTAL EXPENDITURES AND OTHER FINANCING USES EXCESS (DEFICIENCY) OF REVENUES AND OTHER FINANCING SOURCES OVER EXPENDITURES AND OTHER FINANCING USES (6) (7) (6) 1 FUND BALANCES (DEFICITS), JULY 1, RESTATED 6 6 (22) (28) Appropriation of Fund Balances and Carryforward Appropriations (1) Encumbrances Lapsed FUND BALANCES (DEFICITS), JUNE 30 $ -- $ -- $ (28) $ (28) Continued
263 REVENUES AND OTHER FINANCING SOURCES CITY OF LOS ANGELES Budgetary Comparison Schedule (Non-GAAP Budgetary Basis) Annually Budgeted Nonmajor Special Revenue Funds - (Continued) For the Fiscal Year Ended June 30, 2008 (amounts expressed in thousands) Nonmajor Other Special Revenue Fund - Department of Neighborhood Empowerment Actual Variance With Amounts Final Budget Budgeted Amounts (Budgetary Positive Original Final Basis) (Negative) Revenues Taxes $ -- $ -- $ -- $ -- Licenses, Permits and Fines Intergovernmental Charges for Services Special Assessments Interest Program Income Other Total Revenues Other Financing Sources Transfers from Other Funds 7,862 7,909 7,686 (223) TOTAL REVENUES AND OTHER FINANCING SOURCES 7,862 7,927 7,708 (219) EXPENDITURES AND OTHER FINANCING USES Expenditures Current General Government 11,465 26,825 4,535 22,290 Protection of Persons and Property Public Works Health and Sanitation Transportation Cultural and Recreational Services Community Development Capital Outlay Debt Service Principal Interest Total Expenditures 11,465 26,825 4,535 22,290 Other Financing Uses Transfers to Other Funds 4,196 5,285 4, TOTAL EXPENDITURES AND OTHER FINANCING USES 15,661 32,110 9,084 23,026 EXCESS (DEFICIENCY) OF REVENUES AND OTHER FINANCING SOURCES OVER EXPENDITURES AND OTHER FINANCING USES (7,799) (24,183) (1,376) 22,807 FUND BALANCES (DEFICITS), JULY 1, RESTATED 7,799 7,799 7,587 (212) Appropriation of Fund Balances and Carryforward Appropriations -- 16, (16,384) Encumbrances Lapsed FUND BALANCES (DEFICITS), JUNE 30 $ -- $ -- $ 6,215 $ 6,215 Continued
264 REVENUES AND OTHER FINANCING SOURCES CITY OF LOS ANGELES Budgetary Comparison Schedule (Non-GAAP Budgetary Basis) Annually Budgeted Nonmajor Special Revenue Funds - (Continued) For the Fiscal Year Ended June 30, 2008 (amounts expressed in thousands) Nonmajor Other Special Revenue Fund - Efficiency Projects and Police Hiring Actual Variance With Amounts Final Budget Budgeted Amounts (Budgetary Positive Original Final Basis) (Negative) Revenues Taxes $ -- $ -- $ -- $ -- Licenses, Permits and Fines Intergovernmental Charges for Services Special Assessments Interest (102) Program Income Other Total Revenues (102) Other Financing Sources Transfers from Other Funds TOTAL REVENUES AND OTHER FINANCING SOURCES (102) EXPENDITURES AND OTHER FINANCING USES Expenditures Current General Government Protection of Persons and Property 58 13, ,804 Public Works Health and Sanitation Transportation Cultural and Recreational Services Community Development Capital Outlay Debt Service Principal Interest Total Expenditures 58 13, ,804 Other Financing Uses Transfers to Other Funds 3,111 7,441 5,572 1,869 TOTAL EXPENDITURES AND OTHER FINANCING USES 3,169 21,245 5,572 15,673 EXCESS (DEFICIENCY) OF REVENUES AND OTHER FINANCING SOURCES OVER EXPENDITURES AND OTHER FINANCING USES (2,925) (21,001) (5,430) 15,571 FUND BALANCES (DEFICITS), JULY 1, RESTATED 2,925 2,925 5,437 2,512 Appropriation of Fund Balances and Carryforward Appropriations -- 18, (18,076) Encumbrances Lapsed FUND BALANCES (DEFICITS), JUNE 30 $ -- $ -- $ 7 $ 7 Continued
265 REVENUES AND OTHER FINANCING SOURCES CITY OF LOS ANGELES Budgetary Comparison Schedule (Non-GAAP Budgetary Basis) Annually Budgeted Nonmajor Special Revenue Funds - (Continued) For the Fiscal Year Ended June 30, 2008 (amounts expressed in thousands) Nonmajor Other Special Revenue Fund - El Pueblo de Los Angeles Historical Monument Actual Variance With Amounts Final Budget Budgeted Amounts (Budgetary Positive Original Final Basis) (Negative) Revenues Taxes $ -- $ -- $ -- $ -- Licenses, Permits and Fines Intergovernmental Charges for Services 3,675 3,675 1,994 (1,681) Special Assessments Interest Program Income Other ,297 1,297 Total Revenues 3,675 3,675 3,291 (384) Other Financing Sources Transfers from Other Funds TOTAL REVENUES AND OTHER FINANCING SOURCES 3,992 3,992 4, EXPENDITURES AND OTHER FINANCING USES Expenditures Current General Government Protection of Persons and Property Public Works Health and Sanitation Transportation Cultural and Recreational Services Community Development Capital Outlay Debt Service Principal Interest Total Expenditures Other Financing Uses Transfers to Other Funds 4,223 4,366 4, TOTAL EXPENDITURES AND OTHER FINANCING USES 4,223 4,490 4, EXCESS (DEFICIENCY) OF REVENUES AND OTHER FINANCING SOURCES OVER EXPENDITURES AND OTHER FINANCING USES (231) (498) (35) 463 FUND BALANCES (DEFICITS), JULY 1, RESTATED (317) (548) Appropriation of Fund Balances and Carryforward Appropriations (267) Encumbrances Lapsed FUND BALANCES (DEFICITS), JUNE 30 $ -- $ -- $ (292) $ (292) Continued
266 REVENUES AND OTHER FINANCING SOURCES CITY OF LOS ANGELES Budgetary Comparison Schedule (Non-GAAP Budgetary Basis) Annually Budgeted Nonmajor Special Revenue Funds - (Continued) For the Fiscal Year Ended June 30, 2008 (amounts expressed in thousands) Nonmajor Other Special Revenue Fund - Landfill Maintenance Actual Variance With Amounts Final Budget Budgeted Amounts (Budgetary Positive Original Final Basis) (Negative) Revenues Taxes $ -- $ -- $ -- $ -- Licenses, Permits and Fines Intergovernmental Charges for Services 4,762 4,763 5, Special Assessments Interest (26) Program Income Other Total Revenues 4,835 4,836 5, Other Financing Sources Transfers from Other Funds TOTAL REVENUES AND OTHER FINANCING SOURCES 4,835 4,836 5, EXPENDITURES AND OTHER FINANCING USES Expenditures Current General Government Protection of Persons and Property Public Works Health and Sanitation Transportation Cultural and Recreational Services Community Development Capital Outlay Debt Service Principal Interest Total Expenditures Other Financing Uses Transfers to Other Funds 4,926 5,305 4,093 1,212 TOTAL EXPENDITURES AND OTHER FINANCING USES 4,926 5,475 4,093 1,382 EXCESS (DEFICIENCY) OF REVENUES AND OTHER FINANCING SOURCES OVER EXPENDITURES AND OTHER FINANCING USES (91) (639) 1,707 2,346 FUND BALANCES (DEFICITS), JULY 1, RESTATED Appropriation of Fund Balances and Carryforward Appropriations (548) Encumbrances Lapsed FUND BALANCES (DEFICITS), JUNE 30 $ -- $ -- $ 2,437 $ 2,437 Continued
267 REVENUES AND OTHER FINANCING SOURCES CITY OF LOS ANGELES Budgetary Comparison Schedule (Non-GAAP Budgetary Basis) Annually Budgeted Nonmajor Special Revenue Funds - (Continued) For the Fiscal Year Ended June 30, 2008 (amounts expressed in thousands) Nonmajor Other Special Revenue Fund - Los Angeles Convention and Visitors Bureau Actual Variance With Amounts Final Budget Budgeted Amounts (Budgetary Positive Original Final Basis) (Negative) Revenues Taxes $ 11,077 $ 11,077 $ 11,455 $ 378 Licenses, Permits and Fines Intergovernmental Charges for Services Special Assessments Interest Program Income Other Total Revenues 11,077 11,077 11, Other Financing Sources Transfers from Other Funds TOTAL REVENUES AND OTHER FINANCING SOURCES 11,077 11,077 11, EXPENDITURES AND OTHER FINANCING USES Expenditures Current General Government Protection of Persons and Property Public Works Health and Sanitation Transportation Cultural and Recreational Services 12,443 14,550 11,011 3,539 Community Development Capital Outlay Debt Service Principal Interest Total Expenditures 12,443 14,550 11,011 3,539 Other Financing Uses Transfers to Other Funds TOTAL EXPENDITURES AND OTHER FINANCING USES 12,532 14,640 11,101 3,539 EXCESS (DEFICIENCY) OF REVENUES AND OTHER FINANCING SOURCES OVER EXPENDITURES AND OTHER FINANCING USES (1,455) (3,563) 354 3,917 FUND BALANCES (DEFICITS), JULY 1, RESTATED 1,455 1,455 1, Appropriation of Fund Balances and Carryforward Appropriations -- 2, (2,108) Encumbrances Lapsed FUND BALANCES (DEFICITS), JUNE 30 $ -- $ -- $ 2,310 $ 2,310 Continued
268 REVENUES AND OTHER FINANCING SOURCES CITY OF LOS ANGELES Budgetary Comparison Schedule (Non-GAAP Budgetary Basis) Annually Budgeted Nonmajor Special Revenue Funds - (Continued) For the Fiscal Year Ended June 30, 2008 (amounts expressed in thousands) Nonmajor Other Special Revenue Fund - Major Projects Review Actual Variance With Amounts Final Budget Budgeted Amounts (Budgetary Positive Original Final Basis) (Negative) Revenues Taxes $ -- $ -- $ -- $ -- Licenses, Permits and Fines Intergovernmental Charges for Services 1,751 3,375 3,204 (171) Special Assessments Interest Program Income Other Total Revenues 1,851 3,550 3,407 (143) Other Financing Sources Transfers from Other Funds TOTAL REVENUES AND OTHER FINANCING SOURCES 1,851 3,550 3,415 (135) EXPENDITURES AND OTHER FINANCING USES Expenditures Current General Government Protection of Persons and Property Public Works Health and Sanitation Transportation Cultural and Recreational Services Community Development 2,845 4,783 3,206 1,577 Capital Outlay Debt Service Principal Interest Total Expenditures 2,845 4,783 3,206 1,577 Other Financing Uses Transfers to Other Funds TOTAL EXPENDITURES AND OTHER FINANCING USES 2,845 4,794 3,217 1,577 EXCESS (DEFICIENCY) OF REVENUES AND OTHER FINANCING SOURCES OVER EXPENDITURES AND OTHER FINANCING USES (994) (1,244) 198 1,442 FUND BALANCES (DEFICITS), JULY 1, RESTATED ,016 2,022 Appropriation of Fund Balances and Carryforward Appropriations (250) Encumbrances Lapsed FUND BALANCES (DEFICITS), JUNE 30 $ -- $ -- $ 3,214 $ 3,214 Continued
269 REVENUES AND OTHER FINANCING SOURCES CITY OF LOS ANGELES Budgetary Comparison Schedule (Non-GAAP Budgetary Basis) Annually Budgeted Nonmajor Special Revenue Funds - (Continued) For the Fiscal Year Ended June 30, 2008 (amounts expressed in thousands) Nonmajor Other Special Revenue Fund - Municipal Housing Finance Actual Variance With Amounts Final Budget Budgeted Amounts (Budgetary Positive Original Final Basis) (Negative) Revenues Taxes $ -- $ -- $ -- $ -- Licenses, Permits and Fines Intergovernmental Charges for Services 1,000 1,000 1, Special Assessments Interest (114) Program Income Other Total Revenues 1,284 1,284 1, Other Financing Sources Transfers from Other Funds TOTAL REVENUES AND OTHER FINANCING SOURCES 1,284 1,284 1, EXPENDITURES AND OTHER FINANCING USES Expenditures Current General Government Protection of Persons and Property Public Works Health and Sanitation Transportation Cultural and Recreational Services Community Development 743 1, ,181 Capital Outlay Debt Service Principal Interest Total Expenditures 743 1, ,181 Other Financing Uses Transfers to Other Funds 670 1, TOTAL EXPENDITURES AND OTHER FINANCING USES 1,413 2, ,933 EXCESS (DEFICIENCY) OF REVENUES AND OTHER FINANCING SOURCES OVER EXPENDITURES AND OTHER FINANCING USES (129) (1,490) 1,135 2,625 FUND BALANCES (DEFICITS), JULY 1, RESTATED ,120 1,991 Appropriation of Fund Balances and Carryforward Appropriations -- 1, (1,361) Encumbrances Lapsed FUND BALANCES (DEFICITS), JUNE 30 $ -- $ -- $ 3,307 $ 3,307 Continued
270 REVENUES AND OTHER FINANCING SOURCES CITY OF LOS ANGELES Budgetary Comparison Schedule (Non-GAAP Budgetary Basis) Annually Budgeted Nonmajor Special Revenue Funds - (Continued) For the Fiscal Year Ended June 30, 2008 (amounts expressed in thousands) Nonmajor Other Special Revenue Fund - Rent Stabilization Actual Variance With Amounts Final Budget Budgeted Amounts (Budgetary Positive Original Final Basis) (Negative) Revenues Taxes $ -- $ -- $ -- $ -- Licenses, Permits and Fines Intergovernmental Charges for Services 11,075 11,244 11, Special Assessments Interest Program Income Other Total Revenues 11,075 11,244 11, Other Financing Sources Transfers from Other Funds TOTAL REVENUES AND OTHER FINANCING SOURCES 11,075 11,244 11, EXPENDITURES AND OTHER FINANCING USES Expenditures Current General Government Protection of Persons and Property Public Works Health and Sanitation Transportation Cultural and Recreational Services Community Development 9,704 17,271 3,192 14,079 Capital Outlay Debt Service Principal Interest Total Expenditures 9,704 17,271 3,192 14,079 Other Financing Uses Transfers to Other Funds 8,073 15,510 8,359 7,151 TOTAL EXPENDITURES AND OTHER FINANCING USES 17,777 32,781 11,551 21,230 EXCESS (DEFICIENCY) OF REVENUES AND OTHER FINANCING SOURCES OVER EXPENDITURES AND OTHER FINANCING USES (6,702) (21,537) ,671 FUND BALANCES (DEFICITS), JULY 1, RESTATED 6,702 6,702 7,961 1,259 Appropriation of Fund Balances and Carryforward Appropriations -- 14, (14,835) Encumbrances Lapsed FUND BALANCES (DEFICITS), JUNE 30 $ -- $ -- $ 8,095 $ 8,095 Continued
271 REVENUES AND OTHER FINANCING SOURCES CITY OF LOS ANGELES Budgetary Comparison Schedule (Non-GAAP Budgetary Basis) Annually Budgeted Nonmajor Special Revenue Funds - (Continued) For the Fiscal Year Ended June 30, 2008 (amounts expressed in thousands) Nonmajor Other Special Revenue Fund - Street Damage Restoration Actual Variance With Amounts Final Budget Budgeted Amounts (Budgetary Positive Original Final Basis) (Negative) Revenues Taxes $ -- $ -- $ -- $ -- Licenses, Permits and Fines Intergovernmental Charges for Services 2,500 2,500 6,286 3,786 Special Assessments Interest Program Income Other Total Revenues 2,602 2,602 6,478 3,876 Other Financing Sources Transfers from Other Funds TOTAL REVENUES AND OTHER FINANCING SOURCES 2,602 2,602 6,478 3,876 EXPENDITURES AND OTHER FINANCING USES Expenditures Current General Government Protection of Persons and Property Public Works Health and Sanitation Transportation Cultural and Recreational Services Community Development Capital Outlay Debt Service Principal Interest Total Expenditures Other Financing Uses Transfers to Other Funds 4,269 6,569 6, TOTAL EXPENDITURES AND OTHER FINANCING USES 4,620 7,391 7, EXCESS (DEFICIENCY) OF REVENUES AND OTHER FINANCING SOURCES OVER EXPENDITURES AND OTHER FINANCING USES (2,018) (4,789) (913) 3,876 FUND BALANCES (DEFICITS), JULY 1, RESTATED 2,018 2,018 3,182 1,164 Appropriation of Fund Balances and Carryforward Appropriations -- 2, (2,771) Encumbrances Lapsed FUND BALANCES (DEFICITS), JUNE 30 $ -- $ -- $ 2,269 $ 2,269 Continued
272 REVENUES AND OTHER FINANCING SOURCES CITY OF LOS ANGELES Budgetary Comparison Schedule (Non-GAAP Budgetary Basis) Annually Budgeted Nonmajor Special Revenue Funds - (Continued) For the Fiscal Year Ended June 30, 2008 (amounts expressed in thousands) Nonmajor Other Special Revenue Fund - Systematic Code Enforcement Fee Actual Variance With Amounts Final Budget Budgeted Amounts (Budgetary Positive Original Final Basis) (Negative) Revenues Taxes $ -- $ -- $ -- $ -- Licenses, Permits and Fines Intergovernmental Charges for Services 30,474 31,227 33,821 2,594 Special Assessments Interest Program Income Other (17) Total Revenues 31,066 31,819 34,796 2,977 Other Financing Sources Transfers from Other Funds TOTAL REVENUES AND OTHER FINANCING SOURCES 31,066 31,819 34,796 2,977 EXPENDITURES AND OTHER FINANCING USES Expenditures Current General Government Protection of Persons and Property 16,178 26,737 9,418 17,319 Public Works Health and Sanitation Transportation Cultural and Recreational Services Community Development Capital Outlay Debt Service Principal Interest Total Expenditures 16,178 26,737 9,418 17,319 Other Financing Uses Transfers to Other Funds 22,185 26,901 22,146 4,755 TOTAL EXPENDITURES AND OTHER FINANCING USES 38,363 53,638 31,564 22,074 EXCESS (DEFICIENCY) OF REVENUES AND OTHER FINANCING SOURCES OVER EXPENDITURES AND OTHER FINANCING USES (7,297) (21,819) 3,232 25,051 FUND BALANCES (DEFICITS), JULY 1, RESTATED 7,297 7,297 12,478 5,181 Appropriation of Fund Balances and Carryforward Appropriations -- 14, (14,522) Encumbrances Lapsed FUND BALANCES (DEFICITS), JUNE 30 $ -- $ -- $ 15,710 $ 15,710 Continued
273 Budgetary Comparison Schedule (Non-GAAP Budgetary Basis) Annually Budgeted Nonmajor Special Revenue Funds - (Continued) For the Fiscal Year Ended June 30, 2008 (amounts expressed in thousands) REVENUES AND OTHER FINANCING SOURCES Nonmajor Other Special Revenue Fund - Tax Reform Actual Variance With Amounts Final Budget Budgeted Amounts (Budgetary Positive Original Final Basis) (Negative) Revenues Taxes $ -- $ -- $ -- $ -- Licenses, Permits and Fines Intergovernmental Charges for Services Special Assessments Interest Program Income Other Total Revenues Other Financing Sources Transfers from Other Funds 15,592 15,592 15, RE TOTAL REVENUES AND OTHER FINANCING SOURCES 15,942 15,942 16, TO EXPENDITURES AND OTHER FINANCING USES Expenditures Current General Government -- 7, ,512 Protection of Persons and Property Public Works Health and Sanitation Transportation Cultural and Recreational Services Community Development Capital Outlay Debt Service Principal Interest Total Expenditures -- 7, ,512 Other Financing Uses Transfers to Other Funds 17,020 17,339 17, TOTAL EXPENDITURES AND OTHER FINANCING USES 17,020 24,851 17,160 7,691 TO EXCESS (DEFICIENCY) OF REVENUES AND OTHER FINANCING SOURCES OVER EXPENDITURES AND OTHER FINANCING USES (1,078) (8,909) (1,129) 7,780 FUND BALANCES (DEFICITS), JULY 1, RESTATED 1,078 1,078 1, FU Appropriation of Fund Balances and Carryforward Appropriations -- 7, (7,831) Encumbrances Lapsed En FUND BALANCES (DEFICITS), JUNE 30 $ -- $ -- $ 154 $ 154 FU Continued... EX EX Ap
274 EVENUES AND OTHER FINANCING SOURCES CITY OF LOS ANGELES Budgetary Comparison Schedule (Non-GAAP Budgetary Basis) Annually Budgeted Nonmajor Special Revenue Funds - (Continued) For the Fiscal Year Ended June 30, 2008 (amounts expressed in thousands) Nonmajor Other Special Revenue Fund - Telecommunications Liquidated Damages and Lost Franchise Fees Actual Variance With Amounts Final Budget Budgeted Amounts (Budgetary Positive Original Final Basis) (Negative) Revenues Taxes $ 10,739 $ 10,739 $ 10,222 $ (517) Licenses, Permits and Fines Intergovernmental Charges for Services Special Assessments Interest Program Income Other Total Revenues 10,739 10,812 10,377 (435) Other Financing Sources Transfers from Other Funds OTAL REVENUES AND OTHER FINANCING SOURCES 10,739 10,812 10,377 (435) XPENDITURES AND OTHER FINANCING USES Expenditures Current General Government Protection of Persons and Property 4,016 4,646 4, Public Works Health and Sanitation Transportation Cultural and Recreational Services Community Development Capital Outlay Debt Service Principal Interest Total Expenditures 4,016 4,646 4, Other Financing Uses Transfers to Other Funds 8,748 12,771 7,309 5,462 OTAL EXPENDITURES AND OTHER FINANCING USES 12,764 17,417 11,373 6,044 XCESS (DEFICIENCY) OF REVENUES AND OTHER FINANCING SOURCES OVER EXPENDITURES AND OTHER FINANCING USES (2,025) (6,605) (996) 5,609 UND BALANCES (DEFICITS), JULY 1, RESTATED 2,025 2,025 1,317 (708) ppropriation of Fund Balances and Carryforward Appropriations -- 4, (4,580) ncumbrances Lapsed UND BALANCES (DEFICITS), JUNE 30 $ -- $ -- $ 911 $ 911 Continued
275 REVENUES AND OTHER FINANCING SOURCES CITY OF LOS ANGELES Budgetary Comparison Schedule (Non-GAAP Budgetary Basis) Annually Budgeted Nonmajor Special Revenue Funds - (Continued) For the Fiscal Year Ended June 30, 2008 (amounts expressed in thousands) Nonmajor Other Special Revenue Fund - Traffic Safety Actual Variance With Amounts Final Budget Budgeted Amounts (Budgetary Positive Original Final Basis) (Negative) Revenues Taxes $ -- $ -- $ -- $ -- Licenses, Permits and Fines 16,100 16,100 13,725 (2,375) Intergovernmental Charges for Services Special Assessments Interest Program Income Other Total Revenues 16,100 16,100 13,725 (2,375) Other Financing Sources Transfers from Other Funds TOTAL REVENUES AND OTHER FINANCING SOURCES 16,100 16,100 13,725 (2,375) EXPENDITURES AND OTHER FINANCING USES Expenditures Current General Government Protection of Persons and Property Public Works Health and Sanitation Transportation Cultural and Recreational Services Community Development Capital Outlay Debt Service Principal Interest Total Expenditures Other Financing Uses Transfers to Other Funds 16,100 13,907 13, TOTAL EXPENDITURES AND OTHER FINANCING USES 16,100 13,919 13, EXCESS (DEFICIENCY) OF REVENUES AND OTHER FINANCING SOURCES OVER EXPENDITURES AND OTHER FINANCING USES -- 2,181 (24) (2,205) FUND BALANCES (DEFICITS), JULY 1, RESTATED Appropriation of Fund Balances and Carryforward Appropriations -- (2,181) -- 2,181 Encumbrances Lapsed FUND BALANCES (DEFICITS), JUNE 30 $ -- $ -- $ -- $ -- Continued
276 Budgetary Comparison Schedule (Non-GAAP Budgetary Basis) Annually Budgeted Nonmajor Special Revenue Funds - (Continued) For the Fiscal Year Ended June 30, 2008 (amounts expressed in thousands) REVENUES AND OTHER FINANCING SOURCES Allocations from Other Governmental Agencies Actual Variance With Amounts Final Budget Budgeted Amounts (Budgetary Positive Original Final Basis) (Negative) Revenues Taxes $ 575 $ 580 $ 580 $ -- Licenses, Permits and Fines (62) Intergovernmental 2,129 2,104 1,181 (923) Charges for Services 6,970 6,970 5,149 (1,821) Special Assessments (491) Interest 1,635 1,423 1,365 (58) Program Income Other 1,068 1, (68) Total Revenues 13,018 12,727 9,304 (3,423) Other Financing Sources Transfers from Other Funds TOTAL REVENUES AND OTHER FINANCING SOURCES 13,018 12,727 9,304 (3,423) EXPENDITURES AND OTHER FINANCING USES Expenditures Current General Government Protection of Persons and Property Public Works Health and Sanitation Transportation Cultural and Recreational Services Community Development 1,764 1,552 1, Capital Outlay Debt Service Principal Interest Total Expenditures 1,826 1,614 1, Other Financing Uses Transfers to Other Funds 11,192 11,113 9,167 1,946 TOTAL EXPENDITURES AND OTHER FINANCING USES 13,018 12,727 10,719 2,008 EXCESS (DEFICIENCY) OF REVENUES AND OTHER FINANCING SOURCES OVER EXPENDITURES AND OTHER FINANCING USES (1,415) (1,415) FUND BALANCES (DEFICITS), JULY 1, RESTATED ,474 2,474 Appropriation of Fund Balances and Carryforward Appropriations Encumbrances Lapsed FUND BALANCES (DEFICITS), JUNE 30 $ -- $ -- $ 1,059 $ 1,059 Continued
277 Budgetary Comparison Schedule (Non-GAAP Budgetary Basis) Annually Budgeted Nonmajor Special Revenue Funds - (Continued) For the Fiscal Year Ended June 30, 2008 (amounts expressed in thousands) REVENUES AND OTHER FINANCING SOURCES Total Annually Budgeted Nonmajor Special Revenue Funds Actual Variance With Amounts Final Budget Budgeted Amounts (Budgetary Positive Original Final Basis) (Negative) Revenues Taxes $ 60,843 $ 60,849 $ 64,130 $ 3,281 Licenses, Permits and Fines 16,762 16,792 15,502 (1,290) Intergovernmental 239, , ,282 (61,703) Charges for Services 139, , ,067 (596) Special Assessments 44,247 44,247 41,560 (2,687) Interest 10,365 10,228 21,146 10,918 Program Income ,422 6,422 Other 2,639 2,629 5,493 2,864 Total Revenues 513, , ,602 (42,791) Other Financing Sources Transfers from Other Funds 93,860 98,772 80,381 (18,391) TOTAL REVENUES AND OTHER FINANCING SOURCES 607, , ,983 (61,182) EXPENDITURES AND OTHER FINANCING USES Expenditures Current General Government 11,678 35,676 4,535 31,141 Protection of Persons and Property 30,605 92,677 45,031 47,646 Public Works 22,457 30,495 22,798 7,697 Health and Sanitation 56,344 60,201 24,859 35,342 Transportation 91, ,212 53, ,288 Cultural and Recreational Services 15,203 26,359 15,075 11,284 Community Development 65, , , ,509 Capital Outlay 33,472 56,405 12,377 44,028 Debt Service Principal 3,432 3,432 2, Interest 5,172 5,172 5, Total Expenditures 334, , , ,598 Other Financing Uses Transfers to Other Funds 387, , , ,485 TOTAL EXPENDITURES AND OTHER FINANCING USES 722,188 1,527, , ,083 EXCESS (DEFICIENCY) OF REVENUES AND OTHER FINANCING SOURCES OVER EXPENDITURES AND OTHER FINANCING USES (114,364) (718,481) (47,580) 670,901 FUND BALANCES (DEFICITS), JULY 1, RESTATED 114, , , ,861 Appropriation of Fund Balances and Carryforward Appropriations , (604,117) Encumbrances Lapsed ,300 15,300 FUND BALANCES (DEFICITS), JUNE 30 $ -- $ -- $ 331,945 $ 331,
278 Reconciliation of Operations on Budgetary Basis to the GAAP Basis Nonmajor Special Revenue Funds For the Fiscal Year Ended June 30, 2008 (amounts expressed in thousands) Deficiency of Revenues and Other Financing Sources Over Expenditures and Other Financing Uses - Budgetary $ (47,580) Basis Difference Adjustments for net changes to accrued assets and liabilities. The GAAP basis operating statement recognizes revenues as soon as they are both measurable and available, and expenditures generally are recorded when liability is incurred; whereas, the budget basis operating statement reflects revenues when received and expenditures when paid. 13,471 Grant funded loans are recorded as expenditures when disbursed and as program income when repaid (budget), as opposed to adjustments to the loans receivable account balance (GAAP). 9,159 Encumbrances, which represent commitments to acquire goods and services, are recorded as the equivalent of expenditures in the budget year incurred (budget), as opposed to a reservation of fund balance (GAAP). Encumbrances reported as budgetary expenditures 80,103 Prior year encumbrances expended in current year (69,755) Perspective Difference Certain Nonmajor Special Revenue Funds are not included in the legally adopted budget; while for some, the budget provides for only the portion of fund receipts that are expended for City department operations. 25,642 Net Change in Fund Balances - Nonmajor Special Revenue Funds $ 11,040 DETAILS OF RESTATEMENT OF JULY 1 FUND BALANCES Fund Balances, July 1, as previously reported $ 365,013 Adjustment for fund not budgeted in prior year Local Law Enforcement Block Grant (788) Fund Balances, July 1, as restated $ 364,
279 Supplemental Schedule of Appropriations, Expenditures and Other Financing Uses Budget and Actual (Non-GAAP Budgetary Basis) All Budgeted Special Revenue Funds For the Fiscal Year Ended June 30, 2008 (amounts expressed in thousands) MAJOR FUNDS Additional Variance With Original Appropriations, Final Budget Adopted Carryforward Final Encumbrances Total Positive Budget and Transfers Budget Expenditures June 30, 2008 Actual (Negative) BUILDING AND SAFETY PERMIT Current - Special Purpose $ 110,677 $ 27,335 $ 138,012 $ 38,970 $ 4,404 $ 43,374 $ 94,638 Transfers to Other Funds 70,750 13,381 84,131 72, ,200 11,931 TOTAL 181,427 40, , ,170 4, , ,569 COMMUNITY DEVELOPMENT Current - Special Purpose 7, , ,452 98,076 18, ,203 58,249 Transfers to Other Funds 24,559 19,317 43,876 35, ,952 7,924 TOTAL 32, , , ,028 18, ,155 66,173 PROPOSITION A LOCAL TRANSIT ASSISTANCE Current - Special Purpose 146, , ,405 69,582 17,600 87, ,223 Transfers to Other Funds 10,330 4,433 14, ,278 TOTAL 156, , ,168 70,067 17,600 87, ,501 SOLID WASTE RESOURCES Current - Special Purpose 20,292 7,019 27,311 20,688 6,052 26, Debt Service Principal 23, ,612 23, , Interest 17,388 3,656 21,044 15, ,517 5,527 Transfers to Other Funds 146,848 1, , , , TOTAL 208,140 12, , ,014 6, ,066 6,723 NONMAJOR FUNDS CITYWIDE RECYCLING Current - Special Purpose 42, ,310 7,927 3,670 11,597 30,713 Transfers to Other Funds 3, ,221 3, , TOTAL 45, ,531 11,476 3,670 15,146 31,385 LOCAL PUBLIC SAFETY Transfers to Other Funds 39,400 10,650 50,050 36, ,595 13,455 PROPOSITION C ANTI-GRIDLOCK TRANSIT IMPROVEMENT Current - Special Purpose 58,149 27,787 85,936 24, ,397 60,539 Capital Outlay 1,514 3,891 5, ,683 1,683 3,722 Transfers to Other Funds 23,519 37,832 61,351 46, ,855 14,496 TOTAL 83,182 69, ,692 71,578 2,357 73,935 78,757 SPECIAL PARKING REVENUE Current - Special Purpose 33,324 37,940 71,264 19,045 9,482 28,527 42,737 Capital Outlay 21,080 2,804 23, ,868 Debt Service Principal 3, ,432 2, , Interest 5, ,172 5, , Transfers to Other Funds 404 2,341 2,745 2, , TOTAL 63,412 43, ,497 29,485 9,487 38,972 67,525 Continued
280 Supplemental Schedule of Appropriations, Expenditures and Other Financing Uses Budget and Actual (Non-GAAP Budgetary Basis) All Budgeted Special Revenue Funds - (Continued) For the Fiscal Year Ended June 30, 2008 (amounts expressed in thousands) Additional Variance With Original Appropriations, Final Budget Adopted Carryforward Final Encumbrances Total Positive Budget and Transfers Budget Expenditures June 30, 2008 Actual (Negative) SPECIAL POLICE COMMUNICATIONS/ 911 SYSTEM TAX Current - Special Purpose $ 2,455 $ 639 $ 3,094 $ 527 $ -- $ 527 $ 2,567 Transfers to Other Funds 21, ,838 20, ,710 1,128 TOTAL 24, ,932 21, ,237 3,695 STORMWATER POLLUTION ABATEMENT Current - Special Purpose 9,872 2,332 12,204 8,699 1,328 10,027 2,177 Capital Outlay 445 2,738 3,183 1, ,768 1,415 Transfers to Other Funds 23,021 6,893 29,914 22, ,385 7,529 TOTAL 33,338 11,963 45,301 32,245 1,935 34,180 11,121 STREET LIGHTING MAINTENANCE ASSESSMENT Current - Special Purpose 20,976 7,542 28,518 14,840 6,006 20,846 7,672 Capital Outlay 4,405 6,370 10,775 1,179 3,516 4,695 6,080 Transfers to Other Funds 20,540 4,096 24,636 19, ,068 5,568 TOTAL 45,921 18,008 63,929 35,087 9,522 44,609 19,320 ZOO Current - Special Purpose -- 4,772 4,772 1, ,933 2,839 Transfers to Other Funds 19,357 6,516 25,873 18, ,736 7,137 TOTAL 19,357 11,288 30,645 20, ,669 9,976 DISASTER ASSISTANCE Current - Special Purpose ,740 24,934 21, ,863 3,071 Transfers to Other Funds ,833 38, ,833 TOTAL ,573 63,497 22, ,593 40,904 HOME INVESTMENT PARTNERSHIP PROGRAM Current - Special Purpose 1, , ,988 50,474 22,203 72, ,311 Transfers to Other Funds 3, ,167 3, , TOTAL 5, , ,155 54,314 22,203 76, ,638 SPECIAL GAS TAX STREET IMPROVEMENT Current - Special Purpose 1, ,155 1, , Capital Outlay 6,028 7,130 13,158 1,630 2,585 4,215 8,943 Transfers to Other Funds 85,715 7,815 93,530 88, ,082 5,448 TOTAL 92,873 14, ,843 90,842 2,585 93,427 14,416 WORKFORCE INVESTMENT ACT Current - Special Purpose 3,421 58,228 61,649 25,743 7,157 32,900 28,749 Transfers to Other Funds 8,414 24,608 33,022 10, ,194 22,828 TOTAL 11,835 82,836 94,671 35,937 7,157 43,094 51,577 Continued
281 Supplemental Schedule of Appropriations, Expenditures and Other Financing Uses Budget and Actual (Non-GAAP Budgetary Basis) All Budgeted Special Revenue Funds - (Continued) For the Fiscal Year Ended June 30, 2008 (amounts expressed in thousands) Additional Variance With Original Appropriations, Final Budget Adopted Carryforward Final Encumbrances Total Positive Budget and Transfers Budget Expenditures June 30, 2008 Actual (Negative) COMMUNITY SERVICES BLOCK GRANT Current - Special Purpose $ 410 $ 10,110 $ 10,520 $ 5,755 $ 934 $ 6,689 $ 3,831 Transfers to Other Funds 1,388 1,879 3,267 1, ,073 2,194 TOTAL 1,798 11,989 13,787 6, ,762 6,025 FORFEITED ASSETS TRUST OF POLICE DEPARTMENT Current - Special Purpose 6,891 3,645 10, ,081 3,968 6,568 Transfers to Other Funds TOTAL 7,090 3,649 10,739 1,087 3,081 4,168 6,571 HOUSEHOLD HAZARDOUS WASTE Current - Special Purpose , Transfers to Other Funds 1, ,943 1, , TOTAL 2, ,159 2, , HOUSING OPPORTUNITIES FOR PERSONS WITH AIDS Current - Special Purpose 86 23,255 23,341 6,312 6,138 12,450 10,891 Transfers to Other Funds TOTAL ,255 23,746 6,577 6,138 12,715 11,031 MOBILE SOURCE AIR POLLUTION REDUCTION Current - Special Purpose 3, ,301 2, ,660 1,641 Transfers to Other Funds 2, ,054 1, , TOTAL 5, ,355 4, ,617 1,738 OLDER AMERICANS ACT Current - Special Purpose -- 22,716 22,716 14,291 2,347 16,638 6,078 Transfers to Other Funds 1,682 3,062 4,744 2, ,293 2,451 TOTAL 1,682 25,778 27,460 16,584 2,347 18,931 8,529 SUPPLEMENTAL LAW ENFORCEMENT SERVICES Current - Special Purpose Transfers to Other Funds 7,966 7,568 15,534 10, ,483 5,051 TOTAL 7,966 7,634 15,600 10, ,483 5,117 LOCAL LAW ENFORCEMENT BLOCK GRANT TRUST Current - Special Purpose 813 8,047 8,860 4, ,191 3,669 Transfers to Other Funds -- 15,662 15, ,376 TOTAL ,709 24,522 4, ,477 19,045 Continued
282 Supplemental Schedule of Appropriations, Expenditures and Other Financing Uses Budget and Actual (Non-GAAP Budgetary Basis) All Budgeted Special Revenue Funds - (Continued) For the Fiscal Year Ended June 30, 2008 (amounts expressed in thousands) Additional Variance With Original Appropriations, Final Budget Adopted Carryforward Final Encumbrances Total Positive Budget and Transfers Budget Expenditures June 30, 2008 Actual (Negative) ARTS AND CULTURAL FACILITIES AND SERVICES Current - Special Purpose $ 1,360 $ 2,409 $ 3,769 $ 1,631 $ 129 $ 1,760 $ 2,009 Transfers to Other Funds 9, ,133 9, , TOTAL 11,234 2,668 13,902 11, ,255 2,647 ARTS DEVELOPMENT FEE Current - Special Purpose 1,400 1,744 3, ,801 Transfers to Other Funds (1) -- (1) 31 TOTAL 1,400 1,774 3, ,832 CITY EMPLOYEES RIDESHARING Current - Special Purpose Transfers to Other Funds 3, ,038 3, ,029 9 TOTAL 3, ,320 3, , CITY ETHICS COMMISSION Current - Special Purpose Transfers to Other Funds 2,604 4,660 7,264 2, ,287 4,977 TOTAL 2,755 5,503 8,258 2, ,287 5,971 CITY OF LOS ANGELES AFFORDABLE HOUSING Current - Special Purpose 44,098 83, ,954 39,257 5,885 45,142 82,812 Transfers to Other Funds 1,332 4,336 5,668 4, ,305 1,363 TOTAL 45,430 88, ,622 43,562 5,885 49,447 84,175 CITY PROCUREMENT AND MATERIALS MANAGEMENT Current - Special Purpose Transfers to Other Funds TOTAL DEPARTMENT OF NEIGHBORHOOD EMPOWERMENT Current - Special Purpose 11,465 15,360 26,825 4, ,535 22,290 Transfers to Other Funds 4,196 1,089 5,285 4, , TOTAL 15,661 16,449 32,110 9, ,084 23,026 EFFICIENCY PROJECTS AND POLICE HIRING Current - Special Purpose 58 13,746 13, ,804 Transfers to Other Funds 3,111 4,330 7,441 5, ,572 1,869 TOTAL 3,169 18,076 21,245 5, ,572 15,673 Continued
283 Supplemental Schedule of Appropriations, Expenditures and Other Financing Uses Budget and Actual (Non-GAAP Budgetary Basis) All Budgeted Special Revenue Funds - (Continued) For the Fiscal Year Ended June 30, 2008 (amounts expressed in thousands) Additional Variance With Original Appropriations, Final Budget Adopted Carryforward Final Encumbrances Total Positive Budget and Transfers Budget Expenditures June 30, 2008 Actual (Negative) EL PUEBLO DE LOS ANGELES HISTORICAL MONUMENT Current - Special Purpose $ -- $ 124 $ 124 $ 28 $ -- $ 28 $ 96 Transfers to Other Funds 4, ,366 4, , TOTAL 4, ,490 4, , LANDFILL MAINTENANCE Current - Special Purpose Transfers to Other Funds 4, ,305 4, ,093 1,212 TOTAL 4, ,475 4, ,093 1,382 LOS ANGELES CONVENTION AND VISITORS BUREAU Current - Special Purpose 12,443 2,107 14,550 11, ,011 3,539 Transfers to Other Funds TOTAL 12,532 2,108 14,640 11, ,101 3,539 MAJOR PROJECTS REVIEW Current - Special Purpose 2,845 1,938 4,783 3, ,206 1,577 Transfers to Other Funds TOTAL 2,845 1,949 4,794 3, ,217 1,577 MUNICIPAL HOUSING FINANCE Current - Special Purpose ,415 (170) ,181 Transfers to Other Funds , TOTAL 1,413 1,361 2, ,933 RENT STABILIZATION Current - Special Purpose 9,704 7,567 17,271 3, ,192 14,079 Transfers to Other Funds 8,073 7,437 15,510 8, ,359 7,151 TOTAL 17,777 15,004 32,781 11, ,551 21,230 STREET DAMAGE RESTORATION Current - Special Purpose Transfers to Other Funds 4,269 2,300 6,569 6, , TOTAL 4,620 2,771 7,391 7, , SYSTEMATIC CODE ENFORCEMENT FEE Current - Special Purpose 16,178 10,559 26,737 9, ,418 17,319 Transfers to Other Funds 22,185 4,716 26,901 22, ,146 4,755 TOTAL 38,363 15,275 53,638 31, ,564 22,074 TAX REFORM Current - Special Purpose -- 7,512 7, ,512 Transfers to Other Funds 17, ,339 17, , TOTAL 17,020 7,831 24,851 17, ,160 7,691 Continued
284 Supplemental Schedule of Appropriations, Expenditures and Other Financing Uses Budget and Actual (Non-GAAP Budgetary Basis) All Budgeted Special Revenue Funds - (Continued) For the Fiscal Year Ended June 30, 2008 (amounts expressed in thousands) Additional Variance With Original Appropriations, Final Budget Adopted Carryforward Final Encumbrances Total Positive Budget and Transfers Budget Expenditures June 30, 2008 Actual (Negative) TELECOMMUNICATIONS LIQUIDATED DAMAGES AND LOST FRANCHISE FEES Current - Special Purpose $ 4,016 $ 630 $ 4,646 $ 3,231 $ 833 $ 4,064 $ 582 Transfers to Other Funds 8,748 4,023 12,771 7, ,309 5,462 TOTAL 12,764 4,653 17,417 10, ,373 6,044 TRAFFIC SAFETY Current - Special Purpose Transfers to Other Funds 16,100 (2,193) 13,907 13, , TOTAL 16,100 (2,181) 13,919 13, , ALLOCATIONS FROM OTHER GOVERNMENTAL AGENCIES Current - Special Purpose 1,826 (212) 1,614 1, , Transfers to Other Funds 11,192 (79) 11,113 9, ,167 1,946 TOTAL 13,018 (291) 12,727 10, ,719 2,008 TOTAL BUDGETED SPECIAL REVENUE FUNDS $ 1,300,667 $ 1,219,407 $ 2,520,074 $ 1,238,738 $ 126,287 $ 1,365,025 $ 1,155,049 ALL ANNUALLY BUDGETED SPECIAL REVENUE FUNDS Current - Special Purpose $ 577,822 $ 953,167 $ 1,530,989 $ 516,527 $ 117,874 $ 634,401 $ 896,588 Capital Outlay 33,472 22,933 56,405 3,981 8,396 12,377 44,028 Debt Service Principal 27, ,044 26, , Interest 22,560 3,656 26,216 20, ,519 5,697 Transfers to Other Funds 639, , , , , ,243 TOTAL $ 1,300,667 $ 1,219,407 $ 2,520,074 $ 1,238,738 $ 126,287 $ 1,365,025 $ 1,155,
285 This page intentionally left blank
286
287 Combining Balance Sheet Nonmajor Debt Service Funds June 30, 2008 (amounts expressed in thousands) General Obligation Bonds Refunding Refunding Series 1999-A Series 2001-A Series 2002-A Series 2003-A Series 2003-B ASSETS Cash and Pooled Investments $ 19,433 $ 16,782 $ 24,580 $ 22,409 $ 13,086 Other Investments Taxes Receivable (Net of Allowance for Uncollectibles of $4,738) 2,444 2,302 3,644 3, Investment Income Receivable TOTAL ASSETS $ 22,002 $ 19,191 $ 28,380 $ 25,914 $ 13,700 LIABILITIES AND FUND BALANCES LIABILITIES Obligations Under Securities Lending Transactions $ 2,612 $ 2,256 $ 3,304 $ 3,012 $ 1,759 Deferred Revenue and Other Credits 1,899 1,787 2,826 2, Matured Bonds and Interest Payable Other Liabilities TOTAL LIABILITIES 4,511 4,043 6,130 5,620 2,179 FUND BALANCES Reserved for Debt Service 17,491 15,148 22,250 20,294 11,521 TOTAL LIABILITIES AND FUND BALANCES $ 22,002 $ 19,191 $ 28,380 $ 25,914 $ 13,700 Continued
288 Combining Balance Sheet - (Continued) Nonmajor Debt Service Funds June 30, 2008 (amounts expressed in thousands) General Other Obligation Solid Nonmajor Bonds Convention Waste Debt Service B Series 2004-A Center Resources Funds Total ASSETS Cash and Pooled Investments $ 34,888 $ 5,794 $ 47,727 $ 69,219 $ 253,918 Other Investments Taxes Receivable (Net of Allowance for Uncollectibles of $4,738) 5, ,254 25,795 Investment Income Receivable ,236 TOTAL ASSETS $ 40,368 $ 6,629 $ 47,727 $ 77,836 $ 281,747 LIABILITIES AND FUND BALANCES LIABILITIES Obligations Under Securities Lending Transactions $ 4,690 $ 779 $ -- $ 7,663 $ 26,075 Deferred Revenue and Other Credits 4, ,403 20,026 Matured Bonds and Interest Payable Other Liabilities TOTAL LIABILITIES 8, ,621 46,656 FUND BALANCES Reserved for Debt Service 31,600 5,845 47,727 63, ,091 TOTAL LIABILITIES AND FUND BALANCES $ 40,368 $ 6,629 $ 47,727 $ 77,836 $ 281,
289 Combining Statement of Revenues, Expenditures and Changes in Fund Balances Nonmajor Debt Service Funds For the Fiscal Year Ended June 30, 2008 (amounts expressed in thousands) General Obligation Bonds Refunding Refunding Series 1999-A Series 2001-A Series 2002-A Series 2003-A Series 2003-B REVENUES Property Taxes $ 11,568 $ 13,390 $ 20,750 $ 19,148 $ 8,849 Charges for Services Investment Earnings 1, ,163 1, TOTAL REVENUES 12,820 14,170 21,913 20,209 9,505 EXPENDITURES Current: General Government Debt Service: Principal 24,935 10,065 13,110 11,665 10,800 Interest 2,793 4,529 9,554 9,189 1,539 TOTAL EXPENDITURES 27,728 14,594 22,664 20,854 12,339 DEFICIENCY OF REVENUES OVER EXPENDITURES (14,908) (424) (751) (645) (2,834) OTHER FINANCING SOURCES (USES) Transfers In Transfers Out TOTAL OTHER FINANCING SOURCES NET CHANGE IN FUND BALANCES (14,908) (424) (751) (645) (2,834) FUND BALANCES, JULY 1 32,399 15,572 23,001 20,939 14,355 FUND BALANCES, JUNE 30 $ 17,491 $ 15,148 $ 22,250 $ 20,294 $ 11,521 Continued
290 Combining Statement of Revenues, Expenditures and Changes in Fund Balances - (Continued) Nonmajor Debt Service Funds For the Fiscal Year Ended June 30, 2008 (amounts expressed in thousands) General Other Obligation Solid Nonmajor Bonds Convention Waste Debt Service Series 2004-A Center Resources Funds Total REVENUES Property Taxes $ 29,981 $ -- $ -- $ 49,227 $ 152,913 Charges for Services -- 4, ,993 Investment Earnings 1, ,922 3,042 11,903 TOTAL REVENUES 31,633 5,368 1,922 52, ,809 EXPENDITURES Current: General Government Debt Service: Principal 18,025 20,565 19,215 31, ,973 Interest 14,602 19,787 15,644 60, ,663 TOTAL EXPENDITURES 32,627 41,127 34,859 91, ,411 DEFICIENCY OF REVENUES OVER EXPENDITURES (994) (35,759) (32,937) (39,350) (128,602) OTHER FINANCING SOURCES (USES) Transfers In -- 33,837 31,003 50, ,873 Transfers Out -- (7,007) -- (112) (7,119) TOTAL OTHER FINANCING SOURCES -- 26,830 31,003 49, ,754 NET CHANGE IN FUND BALANCES (994) (8,929) (1,934) 10,571 (20,848) FUND BALANCES, JULY 1 32,594 14,774 49,661 52, ,939 FUND BALANCES, JUNE 30 $ 31,600 $ 5,845 $ 47,727 $ 63,215 $ 235,
291 Budgetary Comparison Schedule (Non-GAAP Budgetary Basis) Annually Budgeted Nonmajor Debt Service Funds For the Fiscal Year Ended June 30, 2008 (amounts expressed in thousands) REVENUES General Obligation Bonds Refunding Series1999-A Actual Variance With Amounts Final Budget Budgeted Amounts (Budgetary Positive Original Final Basis) (Negative) Revenues Taxes $ 27,728 $ 27,728 $ 11,408 $ (16,320) Charges for Services Interest TOTAL REVENUES 27,728 27,728 12,327 (15,401) EXPENDITURES AND OTHER FINANCING USES Expenditures Current General Government Debt Service Principal 24,935 24,935 24, Interest 2,793 2,793 2, Total Expenditures 27,728 27,728 27, Other Financing Uses Transfers to Other Funds TOTAL EXPENDITURES AND OTHER FINANCING USES 27,728 27,728 27, EXCESS (DEFICIENCY) OF REVENUES OVER EXPENDITURES AND OTHER FINANCING USES (15,401) (15,401) FUND BALANCES, JULY 1, RESTATED ,052 32,052 Appropriation of Fund Balance and Carryforward Appropriations FUND BALANCES, JUNE 30 $ -- $ -- $ 16,651 $ 16,651 Continued
292 Budgetary Comparison Schedule (Non-GAAP Budgetary Basis) Annually Budgeted Nonmajor Debt Service Funds - (Continued) For the Fiscal Year Ended June 30, 2008 (amounts expressed in thousands) REVENUES General Obligation Bonds Series 2001-A Actual Variance With Amounts Final Budget Budgeted Amounts (Budgetary Positive Original Final Basis) (Negative) Revenues Taxes $ 14,594 $ 14,594 $ 13,331 $ (1,263) Charges for Services Interest TOTAL REVENUES AND OTHER FINANCING SOURCES 14,594 14,594 13,864 (730) EXPENDITURES AND OTHER FINANCING USES Expenditures Current General Government Debt Service Principal 10,065 10,065 10, Interest 4,529 4,529 4, Total Expenditures 14,594 14,594 14, Other Financing Uses Transfers to Other Funds TOTAL EXPENDITURES AND OTHER FINANCING USES 14,594 14,594 14, EXCESS (DEFICIENCY) OF REVENUES OVER EXPENDITURES AND OTHER FINANCING USES (730) (730) FUND BALANCES, JULY 1, RESTATED ,145 15,145 Appropriation of Fund Balance and Carryforward Appropriations FUND BALANCES, JUNE 30 $ -- $ -- $ 14,415 $ 14,415 Continued
293 Budgetary Comparison Schedule (Non-GAAP Budgetary Basis) Annually Budgeted Nonmajor Debt Service Funds - (Continued) For the Fiscal Year Ended June 30, 2008 (amounts expressed in thousands) REVENUES General Obligation Bonds Series 2002-A Actual Variance With Amounts Final Budget Budgeted Amounts (Budgetary Positive Original Final Basis) (Negative) Revenues Taxes $ 22,664 $ 22,664 $ 20,641 $ (2,023) Charges for Services Interest TOTAL REVENUES AND OTHER FINANCING SOURCES 22,664 22,664 21,438 (1,226) EXPENDITURES AND OTHER FINANCING USES Expenditures Current General Government Debt Service Principal 13,110 13,110 13, Interest 9,554 9,554 9, Total Expenditures 22,664 22,664 22, Other Financing Uses Transfers to Other Funds TOTAL EXPENDITURES AND OTHER FINANCING USES 22,664 22,664 22, EXCESS (DEFICIENCY) OF REVENUES OVER EXPENDITURES AND OTHER FINANCING USES (1,226) (1,226) FUND BALANCES, JULY 1, RESTATED ,339 22,339 Appropriation of Fund Balance and Carryforward Appropriations FUND BALANCES, JUNE 30 $ -- $ -- $ 21,113 $ 21,113 Continued
294 Budgetary Comparison Schedule (Non-GAAP Budgetary Basis) Annually Budgeted Nonmajor Debt Service Funds - (Continued) For the Fiscal Year Ended June 30, 2008 (amounts expressed in thousands) REVENUES General Obligation Bonds Series 2003-A Actual Variance With Amounts Final Budget Budgeted Amounts (Budgetary Positive Original Final Basis) (Negative) Revenues Taxes $ 20,854 $ 20,854 $ 19,047 $ (1,807) Charges for Services Interest TOTAL REVENUES AND OTHER FINANCING SOURCES 20,854 20,854 19,775 (1,079) EXPENDITURES AND OTHER FINANCING USES Expenditures Current General Government Debt Service Principal 11,665 11,665 11, Interest 9,189 9,189 9, Total Expenditures 20,854 20,854 20, Other Financing Uses Transfers to Other Funds TOTAL EXPENDITURES AND OTHER FINANCING USES 20,854 20,854 20, EXCESS (DEFICIENCY) OF REVENUES OVER EXPENDITURES AND OTHER FINANCING USES (1,079) (1,079) FUND BALANCES, JULY 1, RESTATED ,327 20,327 Appropriation of Fund Balance and Carryforward Appropriations FUND BALANCES, JUNE 30 $ -- $ -- $ 19,248 $ 19,248 Continued
295 Budgetary Comparison Schedule (Non-GAAP Budgetary Basis) Annually Budgeted Nonmajor Debt Service Funds - (Continued) For the Fiscal Year Ended June 30, 2008 (amounts expressed in thousands) REVENUES General Obligation Bonds Refunding Series 2003-B Actual Variance With Amounts Final Budget Budgeted Amounts (Budgetary Positive Original Final Basis) (Negative) Revenues Taxes $ 12,339 $ 12,339 $ 9,048 $ (3,291) Charges for Services Interest TOTAL REVENUES AND OTHER FINANCING SOURCES 12,339 12,339 9,504 (2,835) EXPENDITURES AND OTHER FINANCING USES Expenditures Current General Government Debt Service Principal 10,800 10,800 10, Interest 1,539 1,539 1, Total Expenditures 12,339 12,339 12, Other Financing Uses Transfers to Other Funds TOTAL EXPENDITURES AND OTHER FINANCING USES 12,339 12,339 12, EXCESS (DEFICIENCY) OF REVENUES OVER EXPENDITURES AND OTHER FINANCING USES (2,835) (2,835) FUND BALANCES, JULY 1, RESTATED ,075 14,075 Appropriation of Fund Balance and Carryforward Appropriations FUND BALANCES, JUNE 30 $ -- $ -- $ 11,240 $ 11,240 Continued
296 Budgetary Comparison Schedule (Non-GAAP Budgetary Basis) Annually Budgeted Nonmajor Debt Service Funds - (Continued) For the Fiscal Year Ended June 30, 2008 (amounts expressed in thousands) REVENUES General Obligation Bonds Series 2004-A Actual Variance With Amounts Final Budget Budgeted Amounts (Budgetary Positive Original Final Basis) (Negative) Revenues Taxes $ 32,627 $ 32,627 $ 29,825 $ (2,802) Charges for Services Interest ,123 1,123 TOTAL REVENUES AND OTHER FINANCING SOURCES 32,627 32,627 30,948 (1,679) EXPENDITURES AND OTHER FINANCING USES Expenditures Current General Government Debt Service Principal 18,025 18,025 18, Interest 14,602 14,602 14, Total Expenditures 32,627 32,627 32, Other Financing Uses Transfers to Other Funds TOTAL EXPENDITURES AND OTHER FINANCING USES 32,627 32,627 32, EXCESS (DEFICIENCY) OF REVENUES OVER EXPENDITURES AND OTHER FINANCING USES (1,679) (1,679) FUND BALANCES, JULY 1, RESTATED ,646 31,646 Appropriation of Fund Balance and Carryforward Appropriations FUND BALANCES, JUNE 30 $ -- $ -- $ 29,967 $ 29,967 Continued
297 Budgetary Comparison Schedule (Non-GAAP Budgetary Basis) Annually Budgeted Nonmajor Debt Service Funds - (Continued) For the Fiscal Year Ended June 30, 2008 (amounts expressed in thousands) REVENUES Convention Center - Staples Arena Account Actual Variance With Amounts Final Budget Budgeted Amounts (Budgetary Positive Original Final Basis) (Negative) Revenues Taxes $ -- $ -- $ -- $ -- Charges for Services 4,000 4,000 4, Interest TOTAL REVENUES AND OTHER FINANCING SOURCES 4,080 4,080 5,185 1,105 EXPENDITURES AND OTHER FINANCING USES Expenditures Current General Government 2,597 11, ,139 Debt Service Principal 1,170 1,170 1, Interest 2,695 2,695 2, Total Expenditures 6,462 15,004 3,865 11,139 Other Financing Uses Transfers to Other Funds -- 1, ,842 TOTAL EXPENDITURES AND OTHER FINANCING USES 6,462 16,846 3,865 12,981 EXCESS (DEFICIENCY) OF REVENUES OVER EXPENDITURES AND OTHER FINANCING USES (2,382) (12,766) 1,320 14,086 FUND BALANCES, JULY 1, RESTATED 2,382 2,382 3,657 1,275 Appropriation of Fund Balance and Carryforward Appropriations -- 10, (10,384) FUND BALANCES, JUNE 30 $ -- $ -- $ 4,977 $ 4,977 Continued
298 Budgetary Comparison Schedule (Non-GAAP Budgetary Basis) Annually Budgeted Nonmajor Debt Service Funds - (Continued) For the Fiscal Year Ended June 30, 2008 (amounts expressed in thousands) REVENUES Other Nonmajor Debt Service Fund - General Obligation Bonds Series Refunding Series 1998-A Actual Variance With Amounts Final Budget Budgeted Amounts (Budgetary Positive Original Final Basis) (Negative) Revenues Taxes $ 6,542 $ 6,542 $ 19,125 $ 12,583 Charges for Services Interest TOTAL REVENUES AND OTHER FINANCING SOURCES 6,542 6,542 19,497 12,955 EXPENDITURES AND OTHER FINANCING USES Expenditures Current General Government Debt Service Principal 1,465 1,465 1, Interest 5,077 5,077 5, Total Expenditures 6,542 6,542 6, Other Financing Uses Transfers to Other Funds TOTAL EXPENDITURES AND OTHER FINANCING USES 6,542 6,542 6, EXCESS (DEFICIENCY) OF REVENUES OVER EXPENDITURES AND OTHER FINANCING USES ,955 12,955 FUND BALANCES, JULY 1, RESTATED ,236 5,236 Appropriation of Fund Balance and Carryforward Appropriations FUND BALANCES, JUNE 30 $ -- $ -- $ 18,191 $ 18,191 Continued
299 Budgetary Comparison Schedule (Non-GAAP Budgetary Basis) Annually Budgeted Nonmajor Debt Service Funds - (Continued) For the Fiscal Year Ended June 30, 2008 (amounts expressed in thousands) REVENUES Other Nonmajor Debt Service Fund - General Obligation Bonds Series 1999-B Actual Variance With Amounts Final Budget Budgeted Amounts (Budgetary Positive Original Final Basis) (Negative) Revenues Taxes $ 3,375 $ 3,375 $ 3,089 $ (286) Charges for Services Interest TOTAL REVENUES AND OTHER FINANCING SOURCES 3,375 3,375 3,220 (155) EXPENDITURES AND OTHER FINANCING USES Expenditures Current General Government Debt Service Principal 3,000 3,000 3, Interest Total Expenditures 3,375 3,375 3, Other Financing Uses Transfers to Other Funds TOTAL EXPENDITURES AND OTHER FINANCING USES 3,375 3,375 3, EXCESS (DEFICIENCY) OF REVENUES OVER EXPENDITURES AND OTHER FINANCING USES (155) (155) FUND BALANCES, JULY 1, RESTATED ,819 3,819 Appropriation of Fund Balance and Carryforward Appropriations FUND BALANCES, JUNE 30 $ -- $ -- $ 3,664 $ 3,664 Continued
300 Budgetary Comparison Schedule (Non-GAAP Budgetary Basis) Annually Budgeted Nonmajor Debt Service Funds - (Continued) For the Fiscal Year Ended June 30, 2008 (amounts expressed in thousands) REVENUES Other Nonmajor Debt Service Fund - General Obligation Bonds Series 2000-A Actual Variance With Amounts Final Budget Budgeted Amounts (Budgetary Positive Original Final Basis) (Negative) Revenues Taxes $ 5,387 $ 5,387 $ 4,931 $ (456) Charges for Services Interest TOTAL REVENUES AND OTHER FINANCING SOURCES 5,387 5,387 5,139 (248) EXPENDITURES AND OTHER FINANCING USES Expenditures Current General Government Debt Service Principal 4,650 4,650 4, Interest Total Expenditures 5,387 5,387 5, Other Financing Uses Transfers to Other Funds TOTAL EXPENDITURES AND OTHER FINANCING USES 5,387 5,387 5, EXCESS (DEFICIENCY) OF REVENUES OVER EXPENDITURES AND OTHER FINANCING USES (248) (248) FUND BALANCES, JULY 1, RESTATED ,037 6,037 Appropriation of Fund Balance and Carryforward Appropriations FUND BALANCES, JUNE 30 $ -- $ -- $ 5,789 $ 5,789 Continued
301 Budgetary Comparison Schedule (Non-GAAP Budgetary Basis) Annually Budgeted Nonmajor Debt Service Funds - (Continued) For the Fiscal Year Ended June 30, 2008 (amounts expressed in thousands) REVENUES Other Nonmajor Debt Service Fund - General Obligation Bonds Refunding Series 2002-B Actual Variance With Amounts Final Budget Budgeted Amounts (Budgetary Positive Original Final Basis) (Negative) Revenues Taxes $ 3,237 $ 3,237 $ 3,019 $ (218) Charges for Services Interest TOTAL REVENUES AND OTHER FINANCING SOURCES 3,237 3,237 3,113 (124) EXPENDITURES AND OTHER FINANCING USES Expenditures Current General Government Debt Service Principal Interest 2,852 2,852 2, Total Expenditures 3,237 3,237 3, Other Financing Uses Transfers to Other Funds TOTAL EXPENDITURES AND OTHER FINANCING USES 3,237 3,237 3, EXCESS (DEFICIENCY) OF REVENUES OVER EXPENDITURES AND OTHER FINANCING USES (124) (124) FUND BALANCES, JULY 1, RESTATED ,411 2,411 Appropriation of Fund Balance and Carryforward Appropriations FUND BALANCES, JUNE 30 $ -- $ -- $ 2,287 $ 2,287 Continued
302 Budgetary Comparison Schedule (Non-GAAP Budgetary Basis) Annually Budgeted Nonmajor Debt Service Funds - (Continued) For the Fiscal Year Ended June 30, 2008 (amounts expressed in thousands) REVENUES Other Nonmajor Debt Service Fund - General Obligation Bonds Series 2005-A Actual Variance With Amounts Final Budget Budgeted Amounts (Budgetary Positive Original Final Basis) (Negative) Revenues Taxes $ 11,491 $ 11,491 $ 11,235 $ (256) Charges for Services Interest TOTAL REVENUES AND OTHER FINANCING SOURCES 11,491 11,491 11, EXPENDITURES AND OTHER FINANCING USES Expenditures Current General Government Debt Service Principal 6,340 6,340 6, Interest 5,151 5,151 5, Total Expenditures 11,491 11,491 11, Other Financing Uses Transfers to Other Funds TOTAL EXPENDITURES AND OTHER FINANCING USES 11,491 11,491 11, EXCESS (DEFICIENCY) OF REVENUES OVER EXPENDITURES AND OTHER FINANCING USES FUND BALANCES, JULY 1, RESTATED ,510 10,510 Appropriation of Fund Balance and Carryforward Appropriations FUND BALANCES, JUNE 30 $ -- $ -- $ 10,634 $ 10,634 Continued
303 Budgetary Comparison Schedule (Non-GAAP Budgetary Basis) Annually Budgeted Nonmajor Debt Service Funds - (Continued) For the Fiscal Year Ended June 30, 2008 (amounts expressed in thousands) REVENUES Other Nonmajor Debt Service Fund - General Obligation Bonds Refunding Series 2005-B Actual Variance With Amounts Final Budget Budgeted Amounts (Budgetary Positive Original Final Basis) (Negative) Revenues Taxes $ 3,501 $ 3,501 $ 3,254 $ (247) Charges for Services Interest TOTAL REVENUES AND OTHER FINANCING SOURCES 3,501 3,501 3,351 (150) EXPENDITURES AND OTHER FINANCING USES Expenditures Current General Government Debt Service Principal Interest 3,411 3,411 3, Total Expenditures 3,501 3,501 3, Other Financing Uses Transfers to Other Funds TOTAL EXPENDITURES AND OTHER FINANCING USES 3,501 3,501 3, EXCESS (DEFICIENCY) OF REVENUES OVER EXPENDITURES AND OTHER FINANCING USES (150) (150) FUND BALANCES, JULY 1, RESTATED ,451 2,451 Appropriation of Fund Balance and Carryforward Appropriations FUND BALANCES, JUNE 30 $ -- $ -- $ 2,301 $ 2,301 Continued
304 Budgetary Comparison Schedule (Non-GAAP Budgetary Basis) Annually Budgeted Nonmajor Debt Service Funds - (Continued) For the Fiscal Year Ended June 30, 2008 (amounts expressed in thousands) REVENUES Other Nonmajor Debt Service Fund - General Obligation Bonds Series 2006-A Actual Variance With Amounts Final Budget Budgeted Amounts (Budgetary Positive Original Final Basis) (Negative) Revenues Taxes $ 7,285 $ 7,285 $ 4,407 $ (2,878) Charges for Services Interest TOTAL REVENUES AND OTHER FINANCING SOURCES 7,285 7,285 4,693 (2,592) EXPENDITURES AND OTHER FINANCING USES Expenditures Current General Government Debt Service Principal 4,333 4,333 4, Interest 2,952 2,952 2, Total Expenditures 7,285 7,285 7, Other Financing Uses Transfers to Other Funds TOTAL EXPENDITURES AND OTHER FINANCING USES 7,285 7,285 7, EXCESS (DEFICIENCY) OF REVENUES OVER EXPENDITURES AND OTHER FINANCING USES (2,592) (2,592) FUND BALANCES, JULY 1, RESTATED ,367 8,367 Appropriation of Fund Balance and Carryforward Appropriations FUND BALANCES, JUNE 30 $ -- $ -- $ 5,775 $ 5,775 Continued
305 Budgetary Comparison Schedule (Non-GAAP Budgetary Basis) Annually Budgeted Nonmajor Debt Service Funds - (Continued) For the Fiscal Year Ended June 30, 2008 (amounts expressed in thousands) REVENUES Total Annually Budgeted Nonmajor Debt Service Funds Actual Variance With Amounts Final Budget Budgeted Amounts (Budgetary Positive Original Final Basis) (Negative) Revenues Taxes $ 171,624 $ 171,624 $ 152,360 $ (19,264) Charges for Services 4,000 4,000 4, Interest ,316 6,236 TOTAL REVENUES 175, , ,669 (12,035) EXPENDITURES AND OTHER FINANCING USES Expenditures Current General Government 2,597 11, ,139 Debt Service Principal 110, , , Interest 65,456 65,456 65, Total Expenditures 178, , ,489 11,139 Other Financing Uses Transfers to Other Funds -- 1, ,842 TOTAL EXPENDITURES AND OTHER FINANCING USES 178, , ,489 12,981 EXCESS (DEFICIENCY) OF REVENUES OVER EXPENDITURES AND OTHER FINANCING USES (2,382) (12,766) (11,820) 946 FUND BALANCES, JULY 1, RESTATED 2,382 2, , ,690 Appropriation of Fund Balance and Carryforward Appropriations -- 10, (10,384) FUND BALANCES, JUNE 30 $ -- $ -- $ 166,252 $ 166,
306 Reconciliation of Operations on Budgetary Basis to the GAAP Basis Nonmajor Debt Service Funds For the Fiscal Year Ended June 30, 2008 (amounts expressed in thousands) Deficiency of Revenues Over Expenditures and Other Financing Uses - Budgetary $ (11,820) Basis Difference Adjustments for net changes to accrued assets and liabilities. The GAAP basis operating statement recognizes revenues as soon as they are both measurable and available, and expenditures generally are recorded when liability is incurred; whereas, the budget basis operating statement reflects revenues when received and expenditures when paid. 3,430 Perspective Difference Certain Nonmajor Debt Service Funds are not included in the legally adopted budget. (12,458) Net Change in Fund Balances - Nonmajor Debt Service Funds $ (20,848) DETAILS OF RESTATEMENT OF JULY 1 FUND BALANCES Fund Balances, July 1, as previously reported $ 169,705 Adjustment for fund not budgeted in prior year General Obligation Bonds Series 2006-A 8,367 Fund Balances, July 1, as restated $ 178,
307
308 CAPITAL PROJECTS FUNDS Capital Projects Funds are used to account for capital improvements which are financed from the City s and component units general obligation bond, certificates of participation issues, special assessments, certain Federal grants and other specific receipts. All of the City s Capital Projects Funds are considered nonmajor funds. Eight funds are separately identified. These funds represent 93.1% of the combined revenues of the Capital Project Funds. The other smaller funds are grouped as other nonmajor capital project funds. General Obligation Bonds Series 2001-A, Series 2002-A, Series 2003-A, Series A, Series 2005-A, and Series 2006-A These funds account for the proceeds from the sales of bonds authorized by the voters in November 1998, November 2000, March 2002, and November 2004 for the acquisition, improvement, and construction of certain police and fire safety facilities and equipment, animal shelter, zoo facilities, and stormwater infrastructure assets. Recreation and Parks Grant Fund Accounts for grants received for major capital improvements undertaken by the City s Department of Recreation and Parks. Parks Assessment Fund Accounts for assessments levied pursuant to Proposition K Los Angeles Kids program approved by City voters on November 5, The assessments from the City of Los Angeles Landscaping and Lighting District 96-1 will be used for the acquisition of land, construction of capital improvements and maintenance of facilities. The fund also accounts for the proceeds from the sale of special assessment bonds. Other Nonmajor Capital Projects Funds - Account for the activities of smaller Capital Project Funds and represent 6.9% of the combined revenues. Included in this group are three annually budgeted funds: Local Transportation, Park and Recreational Sites and Facilities, and Capital Projects Bond Reserve
309 Combining Balance Sheet Nonmajor Capital Projects Funds June 30, 2008 (amounts expressed in thousands) General Obligation Bonds Series 2001-A Series 2002-A Series 2003-A Series 2004-A Series 2005-A ASSETS Cash and Pooled Investments $ 34,322 $ 67,314 $ 75,486 $ 144,160 $ 73,340 Special Assessments Receivable Investment Income Receivable , Intergovernmental Receivable Due from Other Funds TOTAL ASSETS $ 34,550 $ 67,767 $ 76,005 $ 145,227 $ 73,858 LIABILITIES AND FUND BALANCES LIABILITIES Accounts, Contracts and Retainage Payable 1,884 $ 1,793 $ 7,351 $ 9,945 $ 8,093 Obligations Under Securities Lending Transactions 4,614 9,049 10,148 19,380 9,859 Due to Other Funds Deferred Revenue and Other Credits Deposits and Advances Advances from Other Funds TOTAL LIABILITIES 6,542 11,119 17,770 29,926 18,234 FUND BALANCES Reserved for Encumbrances 3,606 5,857 3,969 18,599 14,943 Unreserved and Undesignated 24,402 50,791 54,266 96,702 40,681 TOTAL FUND BALANCES 28,008 56,648 58, ,301 55,624 TOTAL LIABILITIES AND FUND BALANCES $ 34,550 $ 67,767 $ 76,005 $ 145,227 $ 73,858 Continued
310 Combining Balance Sheet - (Continued) Nonmajor Capital Projects Funds June 30, 2008 (amounts expressed in thousands) Other General Nonmajor Obligation Recreation Capital Bonds and Parks Projects Series 2006-A Parks Grant Assessment Funds Total ASSETS Cash and Pooled Investments $ 79,037 $ 45,186 $ 116,506 $ 53,589 $ 688,940 Special Assessments Receivable , ,584 Investment Income Receivable ,699 Intergovernmental Receivable Due from Other Funds TOTAL ASSETS $ 79,574 $ 45,750 $ 119,876 $ 53,895 $ 696,502 LIABILITIES AND FUND BALANCES LIABILITIES Accounts, Contracts and Retainage Payable $ 1,033 $ 3,293 $ 2,763 $ 2,093 $ 38,248 Obligations Under Securities Lending Transactions 10,625 6,074 15,246 6,243 91,238 Due to Other Funds , ,801 Deferred Revenue and Other Credits , ,122 Deposits and Advances Advances from Other Funds -- 6, ,250 TOTAL LIABILITIES 11,690 16,067 20,782 8, ,680 FUND BALANCES Reserved for Encumbrances 8,542 4,436 14,002 5,535 79,489 Unreserved and Undesignated 59,342 25,247 85,092 39, ,333 TOTAL FUND BALANCES 67,884 29,683 99,094 45, ,822 TOTAL LIABILITIES AND FUND BALANCES $ 79,574 $ 45,750 $ 119,876 $ 53,895 $ 696,
311 Combining Statement of Revenues, Expenditures and Changes in Fund Balances Nonmajor Capital Projects Funds For the Fiscal Year Ended June 30, 2008 (amounts expressed in thousands) General Obligation Bonds Series 2001-A Series 2002-A Series 2003-A Series 2004-A Series 2005-A REVENUES Other Taxes $ -- $ -- $ -- $ -- $ -- Licenses and Permits Intergovernmental Charges for Services Special Assessments Investment Earnings 2,106 4,461 5,420 13,120 5,275 Other TOTAL REVENUES 2,106 4,461 5,420 13,120 5,908 EXPENDITURES Capital Outlay 3,816 12,901 23, ,335 30,204 EXCESS (DEFICIENCY) OF REVENUES OVER EXPENDITURES (1,710) (8,440) (17,806) (129,215) (24,296) OTHER FINANCING SOURCES (USES) Transfers In Transfers Out (69) TOTAL OTHER FINANCING SOURCES (USES) (69) NET CHANGE IN FUND BALANCES (1,779) (8,440) (17,806) (129,215) (24,296) FUND BALANCES, JULY 1 29,787 65,088 76, ,516 79,920 FUND BALANCES, JUNE 30 $ 28,008 $ 56,648 $ 58,235 $ 115,301 $ 55,624 Continued
312 Combining Statement of Revenues, Expenditures and Changes in Fund Balances - (Continued) Nonmajor Capital Projects Funds For the Fiscal Year Ended June 30, 2008 (amounts expressed in thousands) Other General Nonmajor Obligation Recreation Capital Bonds and Parks Projects A Series 2006-A Parks Grant Assessment Funds Total REVENUES Other Taxes $ -- $ -- $ -- $ 1,545 $ 1,545 Licenses and Permits Intergovernmental -- 13, ,107 16,282 Charges for Services -- 2, ,604 Special Assessments , ,638 Investment Earnings 4,934 2,538 6,640 2,812 47,306 Other -- 1, ,930 TOTAL REVENUES 4,934 20,602 31,278 6,502 94,331 EXPENDITURES Capital Outlay 8,334 21,476 19,699 12, ,264 EXCESS (DEFICIENCY) OF REVENUES OVER EXPENDITURES (3,400) (874) 11,579 (5,771) (179,933) OTHER FINANCING SOURCES (USES) Transfers In ,000 7,245 Transfers Out (2,982) (1,893) (4,944) TOTAL OTHER FINANCING SOURCES (USES) (2,982) 5,107 2,301 NET CHANGE IN FUND BALANCES (3,400) (629) 8,597 (664) (177,632) FUND BALANCES, JULY 1, 71,284 30,312 90,497 46, ,454 FUND BALANCES, JUNE 30 $ 67,884 $ 29,683 $ 99,094 $ 45,345 $ 555,
313 Budgetary Comparison Schedule (Non-GAAP Budgetary Basis) Annually Budgeted Nonmajor Capital Projects Funds For the Fiscal Year Ended June 30, 2008 (amounts expressed in thousands) REVENUES AND OTHER FINANCING SOURCES Local Transportation Actual Variance With Amounts Final Budget Budgeted Amounts (Budgetary Positive Original Final Basis) (Negative) Revenues Taxes $ -- $ -- $ -- $ -- Intergovernmental 2,107 4,213 2,107 (2,106) Interest Total Revenues 2,239 4,345 2,354 (1,991) Other Financing Sources Transfers from Other Funds TOTAL REVENUES AND OTHER FINANCING SOURCES 2,239 4,345 2,354 (1,991) EXPENDITURES AND OTHER FINANCING USES Expenditures Capital Outlay 4,670 9, ,946 Other Financing Uses Transfers to Other Funds (11) 148 TOTAL EXPENDITURES AND OTHER FINANCING USES 4,688 9, ,094 EXCESS (DEFICIENCY) OF REVENUES AND OTHER FINANCING SOURCES OVER EXPENDITURES AND OTHER FINANCING USES (2,449) (5,605) 1,498 7,103 FUND BALANCES, JULY 1 2,449 2,449 3,942 1,493 Appropriation of Fund Balances and Carryforward Appropriations -- 3, (3,156) Encumbrances Lapsed FUND BALANCES, JUNE 30 $ -- $ -- $ 5,447 $ 5,447 Continued
314 Budgetary Comparison Schedule (Non-GAAP Budgetary Basis) Annually Budgeted Nonmajor Capital Projects Funds - (Continued) For the Fiscal Year Ended June 30, 2008 (amounts expressed in thousands) REVENUES AND OTHER FINANCING SOURCES Park and Recreational Sites and Facilities Actual Variance With Amounts Final Budget Budgeted Amounts (Budgetary Positive Original Final Basis) (Negative) Revenues Taxes $ 2,400 $ 1,350 $ 1,545 $ 195 Intergovernmental Interest Total Revenues 2,400 1,350 1, Other Financing Sources Transfers from Other Funds TOTAL REVENUES AND OTHER FINANCING SOURCES 2,400 1,350 1, EXPENDITURES AND OTHER FINANCING USES Expenditures Capital Outlay 2,400 6,884 1,211 5,673 Other Financing Uses Transfers to Other Funds TOTAL EXPENDITURES AND OTHER FINANCING USES 2,400 7,406 1,459 5,947 EXCESS (DEFICIENCY) OF REVENUES AND OTHER FINANCING SOURCES OVER EXPENDITURES AND OTHER FINANCING USES -- (6,056) 86 6,142 FUND BALANCES, JULY ,882 5,882 Appropriation of Fund Balances and Carryforward Appropriations -- 6, (6,056) Encumbrances Lapsed FUND BALANCES, JUNE 30 $ -- $ -- $ 5,990 $ 5,990 Continued
315 Budgetary Comparison Schedule (Non-GAAP Budgetary Basis) Annually Budgeted Nonmajor Capital Projects Funds - (Continued) For the Fiscal Year Ended June 30, 2008 (amounts expressed in thousands) REVENUES AND OTHER FINANCING SOURCES Capital Projects Bond Reserve Actual Variance With Amounts Final Budget Budgeted Amounts (Budgetary Positive Original Final Basis) (Negative) Revenues Taxes $ -- $ -- $ -- $ -- Intergovernmental Interest Total Revenues Other Financing Sources Transfers from Other Funds 7,000 6,607 7, TOTAL REVENUES AND OTHER FINANCING SOURCES 7,000 6,607 7, EXPENDITURES AND OTHER FINANCING USES Expenditures Capital Outlay 7,000 6,607 3,933 2,674 Other Financing Uses Transfers to Other Funds TOTAL EXPENDITURES AND OTHER FINANCING USES 7,000 6,607 3,933 2,674 EXCESS (DEFICIENCY) OF REVENUES AND OTHER FINANCING SOURCES OVER EXPENDITURES AND OTHER FINANCING USES ,241 3,241 FUND BALANCES, JULY Appropriation of Fund Balances and Carryforward Appropriations Encumbrances Lapsed FUND BALANCES, JUNE 30 $ -- $ -- $ 3,241 $ 3,241 Continued
316 Budgetary Comparison Schedule (Non-GAAP Budgetary Basis) Annually Budgeted Nonmajor Capital Projects Funds - (Continued) For the Fiscal Year Ended June 30, 2008 (amounts expressed in thousands) REVENUES AND OTHER FINANCING SOURCES Total Annually Budgeted Nonmajor Capital Projects Funds Actual Variance With Amounts Final Budget Budgeted Amounts (Budgetary Positive Original Final Basis) (Negative) Revenues Taxes $ 2,400 $ 1,350 $ 1,545 $ 195 Intergovernmental 2,107 4,213 2,107 (2,106) Interest Total Revenues 4,639 5,695 4,073 (1,622) Other Financing Sources Transfers from Other Funds 7,000 6,607 7, TOTAL REVENUES AND OTHER FINANCING SOURCES 11,639 12,302 11,073 (1,229) EXPENDITURES AND OTHER FINANCING USES Expenditures Capital Outlay 14,070 23,304 6,011 17,293 Other Financing Uses Transfers to Other Funds TOTAL EXPENDITURES AND OTHER FINANCING USES 14,088 23,963 6,248 17,715 EXCESS (DEFICIENCY) OF REVENUES AND OTHER FINANCING SOURCES OVER EXPENDITURES AND OTHER FINANCING USES (2,449) (11,661) 4,825 16,486 FUND BALANCES, JULY 1 2,449 2,449 9,824 7,375 Appropriation of Fund Balances and Carryforward Appropriations -- 9, (9,212) Encumbrances Lapsed FUND BALANCES, JUNE 30 $ -- $ -- $ 14,678 $ 14,
317 Reconciliation of Operations on Budgetary Basis to the GAAP Basis Nonmajor Capital Projects Funds For the Fiscal Year Ended June 30, 2008 (amounts expressed in thousands) Excess of Revenues and Other Financing Sources Over Expenditures and Other Financing Uses - Budgetary $ 4,825 Basis Difference Adjustments for net changes to accrued assets and liabilities. The GAAP basis operating statement recognizes revenues as soon as they are both measurable and available, and expenditures generally are recorded when liability is incurred; whereas, the budget basis operating statement reflects revenues when received and expenditures when paid. 93 Encumbrances, which represent commitments to acquire goods and services, are recorded as the equivalent of expenditures in the budget year incurred (budget), as opposed to a reservation of fund balance (GAAP). Encumbrances reported as budgetary expenditures 2,990 Prior year encumbrances expended in current year (2,197) Perspective Difference Certain Nonmajor Capital Projects Funds are not included in the legally adopted budget; while for some, the budget provides for only the portion of fund receipts that are expended for City department operations. (183,343) Net Change in Fund Balances - Nonmajor Capital Projects Funds $ (177,632)
318 Supplemental Schedule of Appropriations, Expenditures and Other Financing Uses Budget and Actual (Non-GAAP Budgetary Basis) All Budgeted Capital Projects Funds For the Fiscal Year Ended June 30, 2008 (amounts expressed in thousands) LOCAL TRANSPORTATION Additional Variance With Original Appropriations, Final Budget Adopted Carryforward Final Encumbrances Total Positive Budget and Transfers Budget Expenditures June 30, 2008 Actual (Negative) Capital Outlay $ 4,670 $ 5,143 $ 9,813 $ 774 $ 93 $ 867 $ 8,946 Transfers to Other Funds (11) -- (11) 148 TOTAL 4,688 5,262 9, ,094 PARK AND RECREATION SITES AND FACILITIES Capital Outlay 2,400 4,484 6, ,211 5,673 Transfers to Other Funds TOTAL 2,400 5,006 7, ,459 5,947 CAPITAL PROJECTS BOND RESERVE FUND Capital Outlay 7,000 (393) 6,607 1,515 2,418 3,933 2,674 TOTAL BUDGETED CAPITAL PROJECTS FUNDS $ 14,088 $ 9,875 $ 23,963 $ 3,259 $ 2,989 $ 6,248 $ 17,715 ALL ANNUALLY BUDGETED CAPITAL PROJECTS FUNDS Capital Outlay $ 14,070 $ 9,234 $ 23,304 $ 3,022 $ 2,989 $ 6,011 $ 17,293 Transfers to Other Funds TOTAL $ 14,088 $ 9,875 $ 23,963 $ 3,259 $ 2,989 $ 6,248 $ 17,
319 This page intentionally left blank
320
321 FIDUCIARY FUNDS Fiduciary Funds are used to report assets held by the City in a trustee or agency capacity for others and therefore cannot be used to support the City government s programs. These include Pension Trust Funds, Other Employee Benefits Trust Funds, and Agency Funds. Pension Trust Funds These funds are used to report resources that are held in trust for the members and beneficiaries of the City s defined benefit and pension plans namely: Fire and Police Pension Plan, Los Angeles City Employees Retirement Plan, and Water and Power Employees Retirement, Disability and Death Benefit Insurance Plan. Other Employee Benefits Trust Funds These funds are used to report resources that are held in trust for the members of the City s postemployment healthcare plans namely: Fire and Police Health Subsidy Plan, Los Angeles City Employees Postemployment Healthcare Plan, and Water and Power Employees Retiree Health Benefits Plan. Agency Funds These funds are used to account for assets held by the City as an agent for others, for example, federal and state income tax withheld from employees, and assessments for payments of certain conduit debt
322 Combining Statement of Fiduciary Net Assets Pension and Other Employee Benefits Trust Funds June 30, 2008 (amounts expressed in thousands) Other Employee Pension Benefits Trust Trust Funds Funds Total ASSETS Cash and Pooled Investments $ 2,618 $ 252 $ 2,870 Receivables: Contributions 29, ,315 Accrued Investment Income 102,138 9, ,448 Contingent Disability Benefit Advance 3, ,310 Other Receivables 11,362 1,179 12,541 Due from Brokers 972, ,313 1,109,661 Other Investments: Temporary 1,476, ,937 1,605,117 U. S. Government Agencies Securities 2,144, ,214 2,302,215 Domestic Corporate Bonds 3,284, ,374 3,556,588 International Bonds 201,704 24, ,620 Opportunistic Debt 90,381 12, ,207 Domestic Stocks 11,626,063 1,191,048 12,817,111 International Stocks 5,995, ,792 6,415,911 Mortgage-backed Securities 2,053, ,773 2,381,292 Real Estate 1,902, ,115 2,047,958 Venture Capital and Alternative Investments 1,889, ,874 2,051,994 Security Lending Collateral 4,738, ,596 5,134,045 Capital Assets Furniture, Fixtures and Equipment (Net of Accumulated Depreciation of $301) TOTAL ASSETS 36,523,687 3,388,902 39,912,589 LIABILITIES Accounts Payable and Accrued Expenses 38,503 3,811 42,314 Benefits in Process of Payment 38, ,701 Due to Brokers 1,731, ,325 1,958,261 Obligations Under Securities Lending Transactions 4,738, ,596 5,134,045 Mortgage Loan Payable - Current 38,715 2,095 40,810 Mortgage Loan Payable - Noncurrent 249,337 13, ,828 TOTAL LIABILITIES 6,835, ,548 7,476,959 NET ASSETS Held in Trust for Pension and Other Employee Benefits Benefit Pension Plans 29,626, ,626,545 Disability Plan 39, ,636 Death Benefit Plan 22, ,095 Postemployment Healthcare Plans -- 2,747,354 2,747,354 TOTAL NET ASSETS $ 29,688,276 $ 2,747,354 $ 32,435,
323 Combining Statement of Changes in Fiduciary Net Assets Pension and Other Employee Benefits Trust Funds For the Fiscal Year Ended June 30, 2008 (amounts expressed in thousands) Other Employee Pension Benefits Trust Trust Funds Funds Total ADDITIONS Contributions Employer $ 723,966 $ 343,862 $ 1,067,828 Plan Member 262, ,175 Other 2, ,840 Total Contributions 988, ,993 1,332,843 Investment Income Net Depreciation in Fair Value of Investments (2,401,239) (224,880) (2,626,119) Interest Income 439,118 39, ,610 Dividend Income 345,480 23, ,579 Securities Lending Income 54,874 3,622 58,496 Other Investment Income 18,312 1,444 19,756 Real Estate Operating Income, Net 65,833 3,768 69,601 Investment Loss (1,477,622) (153,455) (1,631,077) Investment Expense (95,612) (6,343) (101,955) Securities Lending Expense (29,662) (1,394) (31,056) Net Investment Loss (1,602,896) (161,192) (1,764,088) Return of Excess Reserve -- 11,000 11,000 TOTAL ADDITIONS (614,046) 193,801 (420,245) DEDUCTIONS Benefit Payments 1,612, ,335 1,811,139 Refunds of Member Contributions 24, ,150 Administrative Expenses 28,441 2,940 31,381 TOTAL DEDUCTIONS 1,665, ,275 1,866,670 CHANGE IN NET ASSETS Benefit Pension Plans (2,280,982) -- (2,280,982) Disability Plan 4, ,111 Death Benefit Plan (2,570) -- (2,570) Postemployment Healthcare Plans -- (7,474) (7,474) TOTAL CHANGE IN NET ASSETS (2,279,441) (7,474) (2,286,915) Net Assets Held in Trust for Pension and Other Employee Benefits, July 1 Benefit Pension Plans 31,907, ,907,527 Disability Plan 35, ,525 Death Benefit Plan 24, ,665 Postemployment Healthcare Plans -- 2,754,828 2,754,828 NET ASSETS HELD IN TRUST FOR PENSION AND OTHER EMPLOYEE BENEFITS, JUNE 30 $ 29,688,276 $ 2,747,354 $ 32,435,
324 Combining Statement of Fiduciary Net Assets Pension Trust Funds June 30, 2008 (amounts expressed in thousands) Water and Power Employees' Los Angeles Retirement, City Employees' Disability, and Fire and Police Retirement Death Benefit Pension Plan Plan Insurance Plan Total ASSETS Cash and Pooled Investments $ 652 $ 584 $ 1,382 $ 2,618 Receivables: Contributions 6, ,788 29,980 Accrued Investment Income 44,727 32,985 24, ,138 Contingent Disability Benefit Advance ,310 3,310 Other Receivables -- 8,308 3,054 11,362 Due from Brokers 260,993 46, , ,348 Other Investments: Temporary 592, , ,457 1,476,180 U. S. Government Agencies Securities 1,321, , ,547 2,144,001 Domestic Corporate Bonds 1,737, , ,296 3,284,214 International Bonds 31, ,622 6, ,704 Opportunistic Debt -- 90, ,381 Domestic Stocks 5,519,788 3,410,240 2,696,035 11,626,063 International Stocks 2,748,671 1,917,103 1,329,345 5,995,119 Mortgage-backed Securities ,033 1,320,486 2,053,519 Real Estate 1,223, , ,299 1,902,843 Venture Capital and Alternative Investments 1,007, , ,780 1,889,120 Security Lending Collateral 2,402,977 1,589, ,103 4,738,449 Capital Assets Furniture, Fixtures and Equipment (Net of Accumulated Depreciation of $264) TOTAL ASSETS 16,897,627 11,011,816 8,614,244 36,523,687 LIABILITIES Accounts Payable and Accrued Expenses 9,931 22,214 6,358 38,503 Benefits in Process of Payment 36, ,755 38,471 Due to Brokers 540, , ,366 1,731,936 Obligations Under Securities Lending Transactions 2,402,977 1,589, ,103 4,738,449 Mortgage Loan Payable - Current 38, ,715 Mortgage Loan Payable - Noncurrent 249, ,337 TOTAL LIABILITIES 3,278,181 1,928,648 1,628,582 6,835,411 NET ASSETS Held in Trust for Pension and Other Employee Benefits Benefit Pension Plans 13,619,446 9,083,168 6,923,931 29,626,545 Disability Plan ,636 39,636 Death Benefit Plan ,095 22,095 TOTAL NET ASSETS $ 13,619,446 $ 9,083,168 $ 6,985,662 $ 29,688,
325 Combining Statement of Changes in Fiduciary Net Assets Pension Trust Funds For the Fiscal Year Ended June 30, 2008 (amounts expressed in thousands) Water and Power Employees' Los Angeles Retirement, City Employees' Disability, and Fire and Police Retirement Death Benefit Pension Plan Plan Insurance Plan Total ADDITIONS Contributions Employer $ 256,269 $ 302,810 $ 164,887 $ 723,966 Plan Member 98, ,678 49, ,175 Other 2, ,709 Total Contributions 357, , , ,850 Investment Income Net Depreciation in Fair Value of Investments (1,080,861) (810,799) (509,579) (2,401,239) Interest Income 161, , , ,118 Dividend Income 186, ,871 52, ,480 Securities Lending Income 5,911 17,059 31,904 54,874 Other Investment Income 7,591 10, ,312 Real Estate Operating Income, Net 46,550 13,385 5,898 65,833 Investment Loss (672,679) (527,631) (277,312) (1,477,622) Investment Management Expense (56,031) (19,956) (19,625) (95,612) Securities Lending Expense (1,963) (2,799) (24,900) (29,662) Net Investment Loss (730,673) (550,386) (321,837) (1,602,896) TOTAL ADDITIONS (373,621) (132,898) (107,527) (614,046) DEDUCTIONS Benefit Payments 754, , ,943 1,612,804 Refunds of Member Contributions 2,768 15,149 6,233 24,150 Administrative Expenses 11,801 11,987 4,653 28,441 TOTAL DEDUCTIONS 768, , ,829 1,665,395 TRANSFER TO (FROM) PENSION PLANS 5,366 (5,366) CHANGE IN NET ASSETS Benefit Pension Plans (1,137,136) (649,949) (493,897) (2,280,982) Disability Plan ,111 4,111 Death Benefit Plan (2,570) (2,570) TOTAL CHANGE IN NET ASSETS (1,137,136) (649,949) (492,356) (2,279,441) Net Assets Held in Trust for Pension and Other Employee Benefits, July 1 Benefit Pension Plans 14,756,582 9,733,117 7,417,828 31,907,527 Disability Plan ,525 35,525 Death Benefit Plan ,665 24,665 NET ASSETS HELD IN TRUST FOR PENSION AND OTHER BENEFITS, JUNE 30 $ 13,619,446 $ 9,083,168 $ 6,985,662 $ 29,688,
326 Combining Statement of Fiduciary Net Assets Other Employee Benefits Trust Funds June 30, 2008 (amounts expressed in thousands) Los Angeles Water and Power City Employees' Employees' Fire and Police Postemployment Retiree Health Health Subsidy Healthcare Benefits Plan Plan Plan Total ASSETS Cash and Pooled Investments $ 35 $ 83 $ 134 $ 252 Receivables: Contributions Accrued Investment Income 2,420 4,681 2,209 9,310 Other Receivables -- 1, ,179 Due from Brokers 14,122 6, , ,313 Other Investments: Temporary 32,033 80,423 16, ,937 U. S. Government Agencies Securities 71,513 41,978 44, ,214 Domestic Corporate Bonds 93, ,886 59, ,374 International Bonds 1,696 23, ,916 Opportunistic Debt -- 12, ,826 Domestic Stocks 298, , ,417 1,191,048 International Stocks 148, , ,792 Mortgage-backed Securities , , ,773 Real Estate 66,201 78, ,115 Venture Capital and Alternative Investments 54, , ,874 Security Lending Collateral 130, ,554 40, ,596 Capital Assets Furniture, Fixtures and Equipment (Net of Accumulated Depreciation of $37) TOTAL ASSETS 914,313 1,562, ,861 3,388,902 LIABILITIES Accounts Payable and Accrued Expenses 537 3, ,811 Benefits in Process of Payment Due to Brokers 29,246 44, , ,325 Obligations Under Securities Lending Transactions 130, ,554 40, ,596 Mortgage Loan Payable - Current 2, ,095 Mortgage Loan Payable - Noncurrent 13, ,491 TOTAL LIABILITIES 175, , , ,548 NET ASSETS Held in Trust for Postemployment Healthcare Benefits $ 738,691 $ 1,289,026 $ 719,637 $ 2,747,
327 Combining Statement of Changes in Fiduciary Net Assets Other Employee Benefits Trust Funds For the Fiscal Year Ended June 30, 2008 (amounts expressed in thousands) Los Angeles Water and Power City Employees' Employees' Fire and Police Postemployment Retiree Health Health Subsidy Healthcare Benefits Plan Plan Plan Total ADDITIONS Contributions Employer $ 77,403 $ 108,848 $ 157,611 $ 343,862 Other Total Contributions 77, , , ,993 Investment Income Net Depreciation in Fair Value of Investments (52,447) (129,040) (43,393) (224,880) Interest Income 7,839 17,781 13,872 39,492 Dividend Income 9,053 14, ,099 Securities Lending Income 287 2,242 1,093 3,622 Other Investment Income 368 1, ,444 Real Estate Operating Income, Net 2,259 1, ,768 Investment Loss (32,641) (92,386) (28,428) (153,455) Investment Management Expense (2,719) (3,176) (448) (6,343) Securities Lending Expense (95) (445) (854) (1,394) Net Investment Loss (35,455) (96,007) (29,730) (161,192) Return of Excess Reserve -- 11, ,000 TOTAL ADDITIONS 42,079 23, , ,801 DEDUCTIONS Benefit Payments 70,879 70,096 57, ,335 Administrative Expenses 573 2, ,940 TOTAL DEDUCTIONS 71,452 72,463 57, ,275 TRANSFER TO (FROM) HEALTH PLANS 854 (854) CHANGE IN NET ASSETS (28,519) (49,476) 70,521 (7,474) Net Assets Held in Trust for Postemployment Healthcare Benefits, July 1 767,210 1,338, ,116 2,754,828 NET ASSETS HELD IN TRUST FOR POSTEMPLOYMENT HEALTHCARE BENEFITS, JUNE 30 $ 738,691 $ 1,289,026 $ 719,637 $ 2,747,
328 Combining Statement of Fiduciary Assets and Liabilities Agency Funds June 30, 2008 (amounts expressed in thousands) Internal Revenue Code Section 501 (c) Other Building Employee Public Agency and Safety Benefits Works Funds Total ASSETS Cash and Pooled Investments $ 14,926 $ 29,658 $ 71,326 $ 236,893 $ 352,803 Other Investments ,074 2,074 Special Assessments Receivable ,377 2,377 Investment Income Receivable Advances to Other Funds , ,414 TOTAL ASSETS $ 14,926 $ 29,944 $ 86,740 $ 241,415 $ 373,025 LIABILITIES Fiduciary Liabilities $ -- $ 25,957 $ -- $ 227,750 $ 253,707 Obligations Under Securities Lending Transactions -- 3, ,461 5,448 Deposits and Advances 14, ,740 12, ,870 TOTAL LIABILITIES $ 14,926 $ 29,944 $ 86,740 $ 241,415 $ 373,
329 Combining Statement of Changes in Fiduciary Assets and Liabilities Agency Funds For the Fiscal Year Ended June 30, 2008 (amounts expressed in thousands) BUILDING AND SAFETY ASSETS Balance Balance July 1, June 30, 2007 Additions Deductions 2008 Cash and Pooled Investments $ 22,224 $ 76,242 $ 83,540 $ 14,926 LIABILITIES Deposits and Advances $ 22,224 $ 76,242 $ 83,540 $ 14,926 INTERNAL REVENUE CODE SECTION 501(c) EMPLOYEE BENEFITS ASSETS Cash and Pooled Investments $ 23,005 $ 274,390 $ 267,737 $ 29,658 Investment Income Receivable TOTAL ASSETS $ 23,271 $ 274,676 $ 268,003 $ 29,944 LIABILITIES Fiduciary Liabilities $ 19,545 $ 270,690 $ 264,278 $ 25,957 Obligations Under Securities Lending Transactions 3,726 3,987 3,726 3,987 TOTAL LIABILITIES $ 23,271 $ 274,677 $ 268,004 $ 29,944 PUBLIC WORKS ASSETS Cash and Pooled Investments $ 60,829 $ 68,636 $ 58,139 $ 71,326 Intergovernmental Receivable Advances to Other Funds 20,648 12,747 17,981 15,414 TOTAL ASSETS $ 81,537 $ 81,783 $ 76,580 $ 86,740 LIABILITIES Advances from Other Funds $ 63 $ -- $ 63 $ -- Deposits and Advances 81,474 81,846 76,580 86,740 TOTAL LIABILITIES $ 81,537 $ 81,846 $ 76,643 $ 86,740 OTHER AGENCY FUNDS ASSETS Cash and Pooled Investments $ 250,159 $ 21,879,803 $ 21,893,069 $ 236,893 Other Investments 2, ,074 Special Assessments Receivable 973 2, ,377 Investment Income Receivable TOTAL ASSETS $ 253,270 $ 21,882,251 $ 21,894,106 $ 241,415 LIABILITIES Fiduciary Liabilities $ 235,146 $ 21,682,910 $ 21,690,306 $ 227,750 Obligations Under Securities Lending Transactions 1,253 1,461 1,253 1,461 Deposits and Advances 16, , ,546 12,204 TOTAL LIABILITIES $ 253,270 $ 21,882,250 $ 21,894,105 $ 241,415 Continued
330 Combining Statement of Changes in Fiduciary Assets and Liabilities Agency Funds - (Continued) For the Fiscal Year Ended June 30, 2008 (amounts expressed in thousands) TOTAL AGENCY FUNDS Balance Balance July 1, June 30, 2007 Additions Deductions 2008 ASSETS Cash and Pooled Investments $ 356,217 $ 22,299,071 $ 22,302,485 $ 352,803 Other Investments 2, ,074 Special Assessments Receivable 973 2, ,377 Investment Income Receivable Intergovernmental Receivable Advances to Other Funds 20,648 12,747 17,981 15,414 TOTAL ASSETS $ 380,302 $ 22,314,952 $ 22,322,229 $ 373,025 LIABILITIES Fiduciary Liabilities $ 254,691 $ 21,953,600 $ 21,954,584 $ 253,707 Obligations Under Securities Lending Transactions 4,979 5,448 4,979 5,448 Advances from Other Funds Deposits and Advances 120, , , ,870 TOTAL LIABILITIES $ 380,302 $ 22,315,015 $ 22,322,292 $ 373,
331
332
333 This page intentionally left blank
334 Net Assets by Category Accrual Basis of Accounting Last Seven Fiscal Years (amounts expressed in thousands) Fiscal Year Governmental Activities Invested in Capital Assets, Net of Related Debt $ 622,648 $ 730,518 $ 1,111,107 $ 1,562,198 Restricted for: Capital Projects 160, , ,433 94,725 Debt Service 112, , , ,334 Special Purposes 1,252,914 1,213,893 1,229,977 1,270,095 Unrestricted (Deficit) (781,035) (663,132) (1,061,469) (1,192,219) Subtotal Governmental Activities Net Assets 1,367,378 1,615,002 1,608,632 1,930,133 Business-type Activities Invested in Capital Assets, Net of Related Debt 7,655,053 7,996,013 8,317,620 8,405,535 Restricted for: Capital Projects 99, , , ,970 Debt Service 1,239,689 1,107, , ,973 Special Purposes 337, , , ,466 Unrestricted 2,099,497 1,764,334 2,153,319 1,936,039 Subtotal Business-type Activities Net Assets 11,431,049 11,694,119 12,375,164 12,624,983 Primary Government Invested in Capital Assets, Net of Related Debt 8,277,701 8,726,531 9,428,727 9,967,733 Restricted for: Capital Projects 259, , , ,695 Debt Service 1,352,074 1,262,909 1,129,412 1,113,307 Special Purposes 1,590,546 1,857,502 2,045,956 2,185,561 Unrestricted 1,318,462 1,101,202 1,091, ,820 Total Primary Government Net Assets $ 12,798,427 $ 13,309,121 $ 13,983,796 $ 14,555,116 Primary Government- Net Assets by Category Continued 2002 Invested in Capital Assets, Net of Related Debt 65% Unrestricted 10% Restricted 25% Restricted for Capital Projects 2% Restricted for Debt Service 11% Restricted for Special Purposes 12% 2003 Invested in Capital Assets, Net of Related Debt 66% Unrestricted 8% Restricted 26% Restricted for Capital Projects 3% Restricted for Debt Service 9% Restricted for Special Purposes 14% 2004 Invested in Capital Assets, Net of Related Debt 67% Unrestricted 8% Restricted 25% Restricted for Capital Projects 2% Restricted for Debt Service 8% Restricted for Special Purposes 15% 2005 Invested in Capital Assets, Net of Related Debt 68% Restricted 27% Unrestricted 5% Restricted for Capital Projects 4% Restricted for Debt Service 8% Restricted for Special Purposes 15%
335 Net Assets by Category Accrual Basis of Accounting (Continued) Last Seven Fiscal Years (amounts expressed in thousands) Fiscal Year Governmental Activities Invested in Capital Assets, Net of Related Debt $ 2,946,666 $ 3,189,365 $ 3,415,049 Restricted for: Capital Projects 104, , ,583 Debt Service 231, , ,072 Special Purposes 1,419,754 1,582,551 1,736,490 Unrestricted (Deficit) (1,019,029) (1,223,123) (1,455,537) Subtotal Governmental Activities Net Assets 3,683,527 3,909,472 4,037,657 Business-type Activities Invested in Capital Assets, Net of Related Debt 8,777,029 8,974,991 9,372,493 Restricted for: Capital Projects 163, , ,428 Debt Service 875, , ,318 Special Purposes 1,102,949 1,375,876 1,606,749 Unrestricted 2,103,362 2,311,450 2,527,916 Subtotal Business-type Activities Net Assets 13,023,052 13,678,686 14,380,904 Primary Government Invested in Capital Assets, Net of Related Debt 11,723,695 12,164,356 12,787,542 Restricted for: Capital Projects 268, , ,011 Debt Service 1,107,182 1,075, ,390 Special Purposes 2,522,703 2,958,427 3,343,239 Unrestricted 1,084,333 1,088,327 1,072,379 Total Primary Government Net Assets $ 16,706,579 $ 17,588,158 $ 18,418,561 Primary Government- Net Assets by Category 2006 Invested in Capital Assets, Net of Related Debt 70% Restricted 24% Unrestricted 6% Restricted for Capital Projects 2% Restricted for Debt Service 7% Restricted for Special Purposes 15% 2007 Invested in Capital Assets, Net of Related Debt 69% Restricted 25% Unrestricted 6% Restricted for Capital Projects 2% Restricted for Debt Service 6% Restricted for Special Purposes 17% 2008 Invested in Capital Assets, Net of Related Debt 69% Restricted 25% Unrestricted 6% Restricted for Capital Projects 2% Restricted for Debt Service 5% Restricted for Special Purposes 18%
336 Changes in Net Assets Accrual Basis of Accounting Last Seven Fiscal Years (amounts expressed in thousands) Fiscal Year Expenses Governmental Activities General Government $ 895,429 $ 1,055,535 $ 1,362,157 $ 1,220,826 Protection of Persons and Property 1,965,190 1,761,748 1,965,205 2,156,914 Public Works 314, , , ,627 Health and Sanitation 316, , , ,777 Transportation 237, , , ,952 Cultural and Recreational Services 339, , , ,344 Community Development 501, , , ,119 Interest on Long-term Debt 128, , , ,113 Subtotal Governmental Activities Expenses 4,698,471 4,524,882 5,025,649 5,129,672 Business-type Activities Airports 485, , , ,483 Harbor 208, , , ,567 Power 2,038,255 2,068,098 2,178,837 2,233,084 Water 502, , , ,152 Sewer 432, , , ,392 Other- Convention Center 36,519 35,823 36,031 34,371 Subtotal Business-type Activities Expenses 3,704,512 3,935,567 4,072,186 4,157,049 Total Primary Government Expenses 8,402,983 8,460,449 9,097,835 9,286,721 Program Revenues Governmental Activities Charges for Services General Government 176, , , ,101 Protection of Persons and Property 254, , , ,451 Public Works 136, , , ,037 Health and Sanitation 182, , , ,681 Transportation 63,737 66,639 71,028 65,729 Cultural and Recreational Services 85,076 90,695 93,965 98,808 Community Development 42,315 46,257 74,237 64,435 Operating Grants and Contributions 821, , , ,146 Capital Grants and Contributions 86,989 91,041 56,657 81,402 Subtotal Governmental Activities Program Revenues 1,850,185 1,886,395 1,802,513 1,942,790 Business-type Activities Charges for Services Airports 566, , , ,535 Harbor 306, , , ,637 Power 2,416,840 2,295,357 2,401,011 2,378,108 Water 562, , , ,134 Sewer 402, , , ,996 Other- Convention Center 22,832 22,224 19,885 20,409 Operating Grants and Contributions 17,685 25,512 18,931 11,971 Capital Grants and Contributions 193,780 87,656 92,640 53,276 Subtotal Business-type Activities Program Revenues 4,489,176 4,410,573 4,598,051 4,597,066 Total Primary Government Program Revenues 6,339,361 6,296,968 6,400,564 6,539,856 Continued
337 Changes in Net Assets Accrual Basis of Accounting - (Continued) Last Seven Fiscal Years (amounts expressed in thousands) Fiscal Year Expenses Governmental Activities General Government $ 921,672 $ 1,429,922 $ 1,570,377 Protection of Persons and Property 2,117,147 2,414,058 2,741,492 Public Works 374, , ,917 Health and Sanitation 357, , ,406 Transportation 286, , ,748 Cultural and Recreational Services 336, , ,051 Community Development 297, , ,859 Interest on Long-term Debt 173, , ,073 Subtotal Governmental Activities Expenses 4,864,929 5,801,873 6,416,923 Business-type Activities Airports 657, , ,391 Harbor 340, , ,148 Power 2,458,667 2,462,202 2,658,634 Water 543, , ,529 Sewer 497, , ,447 Other- Convention Center 34,939 35,741 38,753 Subtotal Business-type Activities Expenses 4,532,893 4,627,708 5,053,902 Total Primary Government Expenses 9,397,822 10,429,581 11,470,825 Program Revenues Governmental Activities Charges for Services General Government 250, , ,540 Protection of Persons and Property 260, , ,038 Public Works 138, , ,774 Health and Sanitation 250, , ,300 Transportation 76,785 79,961 90,588 Cultural and Recreational Services 133, , ,853 Community Development 71,884 86,800 91,347 Operating Grants and Contributions 644, , ,238 Capital Grants and Contributions 65,850 94, ,994 Subtotal Governmental Activities Program Revenues 1,891,571 2,238,754 2,549,672 Business-type Activities Charges for Services Airports 767, , ,195 Harbor 433, , ,161 Power 2,636,517 2,773,547 2,962,693 Water 614, , ,110 Sewer 492, , ,417 Other- Convention Center 24,261 26,449 26,162 Operating Grants and Contributions 17,281 11,776 10,490 Capital Grants and Contributions 130, , ,299 Subtotal Business-type Activities Program Revenues 5,116,850 5,488,009 5,971,527 Total Primary Government Program Revenues 7,008,421 7,726,763 8,521,199 Continued
338 Changes in Net Assets Accrual Basis of Accounting - (Continued) Last Seven Fiscal Years (amounts expressed in thousands) Fiscal Year Net (Expense)/Revenue Governmental Activities $ (2,848,286) $ (2,638,487) $ (3,223,136) $ (3,186,882) Business-type Activities 784, , , ,017 Total Primary Government Net Expense (2,063,622) (2,163,481) (2,697,271) (2,746,865) General Revenues and Other Changes in Net Assets Governmental Activities Taxes Property Taxes 742, , ,665 1,236,559 Utility Users Taxes 476, , , ,542 Business Taxes 338, , , ,316 Other Taxes 306, , , ,397 Unrestricted Grants and Contributions Sales Taxes 343, , , ,954 Motor Vehicle In-lieu Taxes 212, , ,853 90,944 Other Grants and Contributions 65,539 3, ,059 Unrestricted Investment Earnings 40,396 49, ,828 Other General Revenues 29,276 33,435 34,790 30,687 Transfers 213, , , ,198 Subtotal Governmental Activities 2,769,410 2,886,111 3,078,410 3,320,484 Business-type Activities Transfers (213,152) (211,936) (238,237) (190,198) Total Primary Government General Revenues and Other Changes in Net Assets 2,556,258 2,674,175 2,840,173 3,130,286 Changes in Net Assets Governmental Activities (78,876) 247,624 (144,726) 133,602 Business-type Activities 571, , , ,819 Total Primary Government Changes in Net Assets $ 492,636 $ 510,694 $ 142,902 $ 383,421 Continued Changes in Net Assets $1,000,000 $800,000 $600,000 $400,000 $200,000 $0 ($200,000) Governmental Activities Business-type Activities
339 Changes in Net Assets Accrual Basis of Accounting - (Continued) Last Seven Fiscal Years (amounts expressed in thousands) Fiscal Year Net (Expense)/Revenue Governmental Activities $ (2,973,358) $ (3,563,119) $ (3,867,251) Business-type Activities 583, , ,625 Total Primary Government Net Expense (2,389,401) (2,702,818) (2,949,626) General Revenues and Other Changes in Net Assets Governmental Activities Taxes Property Taxes 1,377,063 1,501,605 1,602,386 Utility Users Taxes 606, , ,716 Business Taxes 436, , ,272 Other Taxes 521, , ,455 Unrestricted Grants and Contributions Sales Taxes 329, , ,313 Motor Vehicle In-lieu Taxes 24,120 24, Other Grants and Contributions 14,297 33,525 32,064 Unrestricted Investment Earnings 21,555 72,559 80,538 Other General Revenues 38,795 34,367 64,285 Transfers 185, , ,407 Subtotal Governmental Activities 3,555,576 3,789,064 3,995,436 Business-type Activities Transfers (185,888) (204,667) (215,407) Total Primary Government General Revenues and Other Changes in Net Assets 3,369,688 3,584,397 3,780,029 Changes in Net Assets Governmental Activities 582, , ,185 Business-type Activities 398, , ,218 Total Primary Government Changes in Net Assets $ 980,287 $ 881,579 $ 830,403 Note: Certain actions by the State affected the Governmental Activities revenues from property, sales and motor vehicle in-lieu taxes. In March 2004, California voters approved the State's Economic Recovery Bond measure. Repayment of the bonds is from increasing the State's share of the sales tax by 0.25% and reducing the local government's share by the same rate. The sales tax reduction is offset by increased property tax allocation. The property tax for sales tax swap will remain in effect until the Economic Recovery Bonds are fully redeemed. In addition, the State effected changes in the vehicle license fee (VLF) distribution to local governments such that the State general fund component of the VLF is shifted to the State and is replaced by equivalent property tax. $1,000,000 $800,000 $600,000 $400,000 $200,000 $0 Changes in Net Assets ($200,000) Governmental Activities Business-type Activities
340 Fund Balances - Governmental Funds Modified Accrual Basis of Accounting Last Ten Fiscal Years (amounts expressed in thousands) Fiscal Year General Fund Reserved for Encumbrances $ 100,756 $ 93,339 $ 126,970 $ 122,132 $ 105,309 Assets Not Available for Appropriation 38,067 35,292 35,499 35,598 40,795 Special Purposes 7,571 27,795 3,931 28,451 25,941 Unreserved Designated for Special Purposes 48,144 49,832 70,799 71,000 71,000 Undesignated 11,941 13, , , ,826 Subtotal General Fund 206, , , , ,871 All Other Governmental Funds Reserved for Encumbrances 459, , , , ,003 Assets Not Available for Appropriation 523, , , , ,731 Debt Service 253, , , , ,246 Special Purposes 59,112 20,381 18,512 12,316 12,358 Unreserved Undesignated - Special Revenue Funds 524, , , , ,332 Undesignated - Capital Projects Funds 137, , , , ,414 Subtotal All Other Governmental Funds 1,958,610 1,987,172 1,931,854 2,211,401 2,428,084 All Governmental Funds Reserved for Encumbrances 560, , , , ,312 Assets Not Available for Appropriation 561, , , , ,526 Debt Service 253, , , , ,246 Special Purposes 66,683 48,176 22,443 40,767 38,299 Unreserved Designated for Special Purposes 48,144 49,832 70,799 71,000 71,000 Undesignated - General Fund 11,941 13, , , ,826 Undesignated - Special Revenue Funds 524, , , , ,332 Undesignated - Capital Projects Funds 137, , , , ,414 Total All Governmental Funds $ 2,165,089 $ 2,206,458 $ 2,369,800 $ 2,808,791 $ 3,109,955 Continued Fund Balances - Governmental Funds $4,000,000 $3,500,000 $3,000,000 $2,500,000 $2,000,000 $1,500,000 $1,000,000 $500,000 $ Unreserved Fund Balance Reserved Fund Balance
341 Fund Balances - Governmental Funds Modified Accrual Basis of Accounting - (Continued) Last Ten Fiscal Years (amounts expressed in thousands) Fiscal Year General Fund Reserved for Encumbrances $ 110,727 $ 119,019 $ 124,878 $ 188,095 $ 148,305 Assets Not Available for Appropriation 36,410 43,665 41,449 59,638 30,338 Special Purposes 16,283 68,001 47,860 24, Unreserved Designated for Special Purposes 71,000 88, , , ,827 Undesignated 395, , , , ,876 Subtotal General Fund 629, , , , ,947 All Other Governmental Funds Reserved for Encumbrances 367, , , , ,720 Assets Not Available for Appropriation 434, , , , ,137 Debt Service 316, , , , ,973 Special Purposes 16,143 10,737 15,943 26,202 6,175 Unreserved Undesignated - Special Revenue Funds 903, , ,988 1,174,152 1,233,120 Undesignated - Capital Projects Funds 599, , , , ,333 Subtotal All Other Governmental Funds 2,638,066 2,844,049 2,911,192 3,246,459 2,956,458 All Governmental Funds Reserved for Encumbrances 478, , , , ,025 Assets Not Available for Appropriation 470, , , , ,475 Debt Service 316, , , , ,973 Special Purposes 32,426 78,738 63,803 51,068 6,776 Unreserved Designated for Special Purposes 71,000 88, , , ,827 Undesignated - General Fund 395, , , , ,876 Undesignated - Special Revenue Funds 903, , ,988 1,174,152 1,233,120 Undesignated - Capital Projects Funds 599, , , , ,333 Total All Governmental Funds $ 3,267,671 $ 3,653,640 $ 3,696,582 $ 3,954,369 $ 3,554,405 Notes: Beginning fiscal year 2001, GASB Statement Nos. 33 and 36 were implemented and beginning fiscal year 2002, GASB Statement Nos. 34 and 37 were implemented. Prior year amounts were not restated to conform to the new reporting requirements. Fund Balances - Governmental Funds $4,000,000 $3,500,000 $3,000,000 $2,500,000 $2,000,000 $1,500,000 $1,000,000 $500,000 $ Unreserved Fund Balance Reserved Fund Balance
342 Changes in Fund Balances - Governmental Funds Modified Accrual Basis of Accounting Last Ten Fiscal Years (amounts expressed in thousands) Fiscal Year Revenues Taxes $ 2,058,142 $ 2,179,666 $ 2,379,053 $ 2,226,701 $ 2,373,673 Licenses and Permits 31,766 38,452 36,798 38,779 40,969 Intergovernmental 747, , , , ,583 Charges for Services 684, , , , ,400 Fines 106, , , , ,760 Special Assessments 83,202 86,568 94,253 93,156 92,568 Investment Earnings 101,450 97, , , ,059 Other 30,264 61,976 62,688 52,200 67,306 Total Revenues 3,843,245 4,066,251 4,411,634 4,422,550 4,626,318 Expenditures General Government 573, , , , ,212 Protection of Persons and Property 1,635,990 1,683,571 1,646,335 1,711,968 1,710,438 Public Works 256, , , , ,346 Health and Sanitation 266, , , , ,370 Transportation 188, , , , ,193 Cultural and Recreational Services 231, , , , ,949 Community Development 286, , , , ,147 Capital Outlay 394, , , , ,493 Debt Service: Principal 163, , , , ,716 Interest 118, , , , ,784 Cost of Issuance 1,941 1,598 1,766 5,353 14,387 Advance Refunding Loan Escrow 23, , ,076 Total Expenditures 4,140,677 4,358,686 4,623,685 4,829,674 5,120,111 Excess (Deficit) of Revenues over Expenditures (297,432) (292,435) (212,051) (407,124) (493,793) Other Financing Sources (Uses) Issuance of Long-term Debt 291, , , , ,615 Premium on Issuance of Long-term Debt ,679 23,867 Discount on Issuance of Long-term Debt (737) -- (5,742) Issuance of Refunding Bonds 349, ,440 54, ,950 Premium on Issuance of Refunding Bonds 3, ,823 13,031 Proceeds of Refunding Loan Payment for Current Refunding of Loan Loans from HUD 51,449 22,160 2,400 5,990 2,095 Transfers In 538, , , , ,012 Transfers Out (417,067) (429,073) (465,558) (504,665) (499,076) Transfers to Component Unit (12,135) Total Other Financing Sources (Uses) 804, , , ,294 1,353,494 Net Change in Fund Balances $ 507,338 $ 42,116 $ 149,813 $ 369,170 $ 859,701 Debt Service as a Percentage of Noncapital Expenditures 8.2% 7.3% 8.3% 7.2% 8.0% Continued
343 Changes in Fund Balances - Governmental Funds Modified Accrual Basis of Accounting - (Continued) Last Ten Fiscal Years (amounts expressed in thousands) Fiscal Year Revenues Taxes $ 2,625,489 $ 2,960,621 $ 3,259,718 $ 3,407,996 $ 3,480,296 Licenses and Permits 39,627 46,979 55,260 59,443 61,047 Intergovernmental 884, , , , ,376 Charges for Services 892, ,187 1,031,895 1,134,205 1,254,704 Fines 123, , , , ,600 Special Assessments 97,429 95,293 97, , ,782 Investment Earnings 13, ,198 71, , ,254 Other 91,689 73,136 81, , ,564 Total Revenues 4,768,169 5,154,312 5,379,550 5,961,032 6,296,623 Expenditures General Government 985,796 1,033,826 1,102,270 1,243,090 1,268,572 Protection of Persons and Property 1,851,489 1,944,897 2,089,451 2,366,956 2,573,006 Public Works 308, , , , ,026 Health and Sanitation 328, , , , ,152 Transportation 259, , , , ,301 Cultural and Recreational Services 294, , , , ,727 Community Development 430, , , , ,768 Capital Outlay 522, , , , ,999 Debt Service: Principal 186, , , , ,585 Interest 136, , , , ,675 Cost of Issuance 5,057 2,744 2,053 5,745 2,604 Advance Refunding Loan Escrow 3, , ,311 Total Expenditures 5,312,933 5,403,921 5,802,260 6,620,135 7,376,726 Excess (Deficit) of Revenues over Expenditures (544,764) (249,609) (422,710) (659,103) (1,080,103) Other Financing Sources (Uses) Issuance of Long-term Debt 468, , , , ,035 Premium on Issuance of Long-term Debt 25,522 15,944 9,740 15,138 3,596 Discount on Issuance of Long-term Debt Issuance of Refunding Bonds 77,345 49,395 73, Premium on Issuance of Refunding Bonds 4,736 1,497 4, Proceeds of Refunding Loan ,110 Payment for Current Refunding of Loan (24,110) Loans from HUD 23,895 14, Transfers In 745, , ,604 1,058,449 1,021,078 Transfers Out (547,296) (545,499) (642,716) (853,782) (805,671) Transfers to Component Unit Total Other Financing Sources (Uses) 797, , , , ,038 Net Change in Fund Balances $ 253,106 $ 438,965 $ 119,535 $ 256,190 $ (400,065) Debt Service as a Percentage of Noncapital Expenditures 7.0% 7.8% 8.1% 8.9% 9.9% Notes: Certain prior years' data were reclassified to conform to the fiscal year 2008 presentation. Beginning fiscal year 2001, GASB Statement Nos. 33 and 36 were implemented and beginning fiscal year 2002, GASB Statement Nos. 34 and 37 were implemented. Prior year amounts were not restated to conform to the new reporting requirements
344 Tax Revenues by Source - Governmental Funds Modified Accrual Basis of Accounting Last Ten Fiscal Years (amounts expressed in thousands) Fiscal Year (a) 2002 (a) 2003 Property Taxes $ 575,651 $ 615,555 $ 663,839 $ 741,040 $ 792,839 Sales Taxes 406, , , , ,112 Utility Users Taxes 487, , , , ,148 Business Taxes 300, , , , ,937 Other Taxes 288, , , , ,637 Total Revenues $ 2,058,142 $ 2,179,666 $ 2,379,053 $ 2,226,701 $ 2,373,673 Continued Tax Revenue By Source - Governmental Funds 1999 Business Taxes 15% Other Taxes 13% Property Taxes 28% 2000 Business Taxes 15% Other Taxes 14% Property Taxes 27% 2001 Business Taxes 14% Other Taxes 14% Property Taxes 28% Utility Users Taxes 24% Sales Taxes 20% Utility Users Taxes 24% Sales Taxes 20% Utility Users Taxes 23% Sales Taxes 21% 2002 Business Taxes 16% Other Taxes 14% Property Taxes 33% 2003 Business Taxes 15% Other Taxes 14% Property Taxes 34% Utility Users Taxes 21% Sales Taxes 16% Utility Users Taxes 22% Sales Taxes 15%
345 Tax Revenues by Source - Governmental Funds Modified Accrual Basis of Accounting - (Continued) Last Ten Fiscal Years (amounts expressed in thousands) Change Fiscal Year (b) Property Taxes $ 882,531 $ 1,229,381 $ 1,365,860 $ 1,490,223 $ 1,585, % Sales Taxes 381, , , , ,313-17% Utility Users Taxes 572, , , , ,199 27% Business Taxes 372, , , , ,124 55% Other Taxes 417, , , , ,431 65% Total Revenues $ 2,625,489 $ 2,960,621 $ 3,259,718 $ 3,407,996 $ 3,480,296 69% (a) Beginning fiscal year 2001, GASB Statement Nos. 33 and 36 were implemented and beginning fiscal year 2002, GASB Statement Nos. 34 and 37 were implemented. Prior year amounts were not restated to conform to the new reporting requirements. (b) Certain actions by the State affected the City's General Fund revenues from property taxes and sales taxes. In March 2004, California voters approved the State's Economic Recovery Bond measure. Repayment of the bonds is from increasing the State's share of the sales tax by 0.25% and reducing the local government's share by the same rate. The sales tax reduction is offset by increased property tax allocation. The property tax for sales tax swap will remain in effect until the Economic Recovery Bonds are fully redeemed. Tax Revenue By Source - Governmental Funds 2004 Business Taxes 14% Other Taxes 16% Property Taxes 33% 2005 Business Taxes 13% Other Taxes 15% Property Taxes 42% 2006 Business Taxes 13% Other Taxes 16% Property Taxes 42% Utility Users Taxes 22% Sales Taxes 15% Utility Users Taxes 20% Sales Taxes 10% Utility Users Taxes 19% Sales Taxes 10% 2007 Other Taxes 15% 2008 Other Taxes 14% Business Taxes 14% Property Taxes 43% Business Taxes 13% Property Taxes 45% Utility Users Taxes 18% Sales Taxes 10% Utility Users Taxes 18% Sales Taxes 10%
346 This page intentionally left blank
347
348 Assessed and Estimated Actual Value of Property Last Ten Fiscal Years Assessed and Estimated Actual Value (1) Total Direct Year Real Personal Average Rate (3) Assessed of Property (2) Property Total Annual (per $1,000 of Value Levy ($ 000's) ($ 000's) ($ 000's) Growth assessed value) Per Capita 1999 $ 173,237,992 $ 14,653,711 $ 187,891, % $ $ ,780,706 15,107, ,887, % ,860,259 15,986, ,846, % ,651,362 17,490, ,141, % ,593,072 16,806, ,399, % ,906,688 16,640, ,547, % ,163,573 16,304, ,468, % ,325,286 16,343, ,668, % ,032,179 15,950, ,982, % ,755,025 17,398, ,153, % Tax Source: Taxpayer's Guide - Auditor Controller, County of Los Angeles. (1) Net of Homeowners' Exemption. (2) Assessed at 100% of estimated actual value. (3) Total Direct Tax Rate for Tax Rate Area # 4 is used as it applies to most properties within the City of Los Angeles. Since each property is subject to taxation by a number of taxing entities, the County groups all properties subject to taxation by the same entities into Tax Rate Areas (TRAs). There are over 274 TRAs in the City. Total Assessed and Estimated Actual Value of Property $450,000,000 $400,000,000 $350,000,000 In Thousands $300,000,000 $250,000,000 $200,000,000 $150,000,000 $100,000,000 $50,000,000 $ Fiscal Year Real Property Personal Property
349 Direct and Overlapping Property Tax Rates Tax Rate Area No. 4 (a) Last Ten Fiscal Years City Direct Rates Overlapping Rates Total General L.A. Unified L.A. Unified Metropolitan Direct and Fiscal Obligation Total Los Angeles School Flood Control Water Overlapping Year Basic Rate Debt Service Direct County District District District Rates $ $ $ $ $ $ $ $ Source: Tax Rates, Los Angeles County Tax Collector. a) Tax Rate Area # 4 is used to illustrate the breakdown of a tax rate within the City and applies to most properties within the City of Los Angeles. Since each property is subject to taxation by a number of taxing entities, the County groups all properties subject to taxation by the same entities into Tax Rate Areas (TRAs). There are over 274 TRAs in the City. Total City Direct and Overlapping Property Tax Rates $ $1 Total Direct and Overlapping Rates In Thousands $ $1 $1 $ $1 $1 $ $1 $0 $0 $ $0 $ $ Fiscal Year 2001 Fiscal Years Total Direct Overlapping Rates
350 Ten Largest Property Taxpayers Secured Assessed Valuation Current and Nine Years Ago Percentage Percentage of Total City of Total City Secured Taxable Secured Taxable Assessed Assessed Assessed Assessed Taxpayer Valuation Rank Value Valuation Rank Value Douglas Emmett LLC $ 1,026,824, % $ 493,457, % Anheuser Busch Inc 947,763, ,394, Valero Energy Corp 936,573, Conocophillips Co 835,149, Trizec 791,000, Equilon Enterprises LLC 728,092, Maguire Partners 355 S Grand LLC 555,772, ,360, One Hundred Towers LLC 554,980, ,559, APM Terminals Pacific Ltd 505,917, Hay Dorothy Gdn 438,693, Shuwa Investments Corporation ,530, Beacon Oil Company ,880, Tosco Corporation ,469, Texaco Refining and Marketing Inc ,471, MCA Inc ,092, Arden Realty LP ,369, Total $ 7,320,766, % $ 4,674,585, % Total City Secured Assessed Valuation $ 363,705,598,011 $ 173,026,370,824 Source: KNN Public Finance Urbics.com California Municipal Statistics Inc
351 Property Tax Levies and Collections Last Ten Fiscal Years (dollar amounts expressed in thousands) Total Collected within the Collections Tax Levy (a) Fiscal Year of Levy in Total Collections to Date Fiscal for the Percent Subsequent Percent Year Fiscal Year Amount of Levy Years (b) Amount of Levy $ 490,167 $ 464, % $ 23,721 $ 488, % , , % 21, , % , , % 31, , % , , % 27, , % , , % 28, , % , , % 27, , % , , % 30, , % , , % 45, , % , , % 80, , % , , % 64, , % (a) One percent basic levy only, which is a General Fund revenue; excludes City levy for debt service. (b) Includes collections on adjustments for undetermined prior fiscal year(s). Property Tax Levies and Collections Within Fiscal Year of Levy Fiscal Year Levy Collections in Year of Levy $0 $100,000 $200,000 $300,000 $400,000 $500,000 $600,000 $700,000 $800,000 $900,000 $1,000,000 In Thousands
352 Energy Sold by Type of Customer Power Enterprise Fund Last Ten Fiscal Years Sales of Energy (in thousands of megawatt hours) Commercial Direct Rate per Kilowatt Hour Commercial Fiscal and and Year Residential Industrial All Other Total Residential Industrial ,474 14,987 5,263 26,724 $ 0.10 $ ,372 15,399 5,464 27, ,716 15,781 4,302 26, ,485 15, , ,554 15,350 1,831 23, ,266 15, , ,063 15,705 2,675 25, ,252 16,085 2,726 26, ,641 16,291 2,556 26, ,664 16,482 2,206 26, CITY OF LOS ANGELES Average Number of Customers for Energy Sales Power Enterprise Fund Last Ten Fiscal Years Average Number of Customers (in thousands) Commercial Fiscal and Year Residential Industrial All Other Total , , , , , , , , , , , , , , , , , , , ,
353 This page intentionally left blank
354
355 This page intentionally left blank
356 Ratios of Outstanding Debt By Type Last Ten Fiscal Years (dollar amounts expressed in thousands, except per capita) Governmental Activities Fiscal Year General Judgment Certificates Special F Ended Obligation Obligation of Assessment Revenue Notes HUD June 30 Bonds Bonds Participation Bonds Bonds Payable Loan 1999 $ 525,915 $ 121,600 $ 849,900 $ -- $ 694,900 $ 1,000 $ 135, , , ,100 14, , , , , ,200 23, , , ,535 74, ,905 21, , , ,120 41, ,330 38, , , ,140,850 34, ,625 35, ,886 36, , ,418,980 28, ,730 34, ,543 52, , ,445,250 21, ,705 32, , , , ,411,898 15,340 1,090,485 31, , , , ,303,035 9,195 1,309,510 29, , ,000 76,055 Continued
357 Ratios of Outstanding Debt By Type - (Continued) Last Ten Fiscal Years (dollar amounts expressed in thousands, except per capita) Business-Type Activities Fiscal Year Total Percent of Ended Revenue Commercial Notes Loans Capital Primary Assessed Per June 30 Bonds Paper Payable Payable Leases Government Value Capita 1999 $ 7,561,900 $ 215,200 $ -- $ 6,500 $ 141,203 $ 10,253, % $ 2, ,138, ,200 4,000 6, ,433 10,858, % 2, ,815, ,200 4,200 5, ,641 10,491, % 2, ,364, ,000 4,462 18, ,554 10,598, % 2, ,049, ,302 9,887 13,252 55,446 11,504, % 2, ,075, ,095 9, ,215 54,648 11,823, % 3, ,342, ,561 4, ,684 53,793 12,375, % 3, ,591, ,561 4, ,659 52,881 13,590, % 3, ,642, ,745 3, ,122 51,855 14,263, % 3, ,931, ,328 3, ,441 50,715 14,916, % 3,
358 Ratios of Net General Bonded Debt to Assessed Value and Per Capita Last Ten Fiscal Years Net Net General General Fiscal Bonded Debt Bonded Year Ratio to Debt Ended Net General Assessed Per June 30 Bonded Debt Assessed Value (1) Value Population Capita 1999 $ 525,915,000 $ 187,891,702, % 3,627,878 $ ,220, ,887,819, % 3,679, ,580, ,846,570, % 3,745, ,535, ,141,811, % 3,804, ,120, ,399,750, % 3,856, ,140,850, ,547,493, % 3,901, ,418,980, ,468,294, % 3,932, ,445,250, ,668,294, % 3,966, ,411,898, ,982,792, % 3,996, ,303,035, ,153,231, % 4,045, (1) Net of homeowners exemptions. Net General Bonded Debt and Population $1,600,000,000 4,100,000 Net General Bonded Debt $1,400,000,000 $1,200,000,000 $1,000,000,000 $800,000,000 $600,000,000 $400,000,000 $200,000,000 4,000,000 3,900,000 3,800,000 3,700,000 3,600,000 3,500,000 Population $ Fiscal Years 3,400,000 Net General Bonded Debt Population
359 Direct and Overlapping Governmental Activities Debt June 30, 2008 Estimated Share Debt Estimated of Overlapping Outstanding Percentage Debt June 30, 2008 Applicable (1) June 30, 2008 Debt repaid with property taxes Los Angeles Flood Control District $ 99,210, % $ 40,672,132 Metropolitan Water District of Southern California 327,215, ,541,165 Los Angeles Community College District 1,370,820, ,784,078 Beverly Hills Unified School District 131,777, ,013 Inglewood Unified School District 121,095, ,566,969 Las Virgenes Joint Unified School District 120,301, ,199,403 Los Angeles Unified School District 7,325,045, ,426,042,227 Los Angeles Unified School District State School Loan 590, ,852 Other School Districts 308,856,754 various 218,581 City of Los Angeles Community Facilities District Nos. 3 and 4 138,370, ,370,000 City of Los Angeles Assessment District No. 1 6,489, ,489,479 Mountains Recreation and Conservation Authority Assessment Districts 25,155, ,151,437 Los Angeles County Metropolitan Transit District Benefit Assessment Districts 43,535, ,535,000 Los Angeles County Regional Park and Open Space Assessment District 269,995, ,559,590 Other overlapping debt Los Angeles County General Fund Obligations 1,019,552, ,941,785 Los Angeles County Pension Obligations 352,255, ,634,850 Los Angeles County Superintendent of Schools Certificates of Participation 17,861, ,181,577 Los Angeles County Sanitation District Nos. 1, 3, 4, 5, 8 and 16 Authorities 159,214, ,693,674 Pasadena Area Community College District Certificates of Participation 3,410, Inglewood Unified School District Certificates of Participation 1,855, ,004 Las Virgenes Joint Unified School District Certificates of Participation 12,965, ,261 Los Angeles Unified School District Certificates of Participation 498,121, ,987,233 Less: Los Angeles Unified School District QZAB Bonds (supported by periodic payments to investment accounts) (29,918,995) Subtotal- overlapping debt 8,819,574,349 City of Los Angeles direct debt General Obligation Bonds 1,303,035,000 Special Assessment Bonds 29,390,000 Special Tax Obligation Bonds 115,810,000 Lease Obligation Bonds 1,707,130,000 Judgment Obligation Bonds 9,195,000 Subtotal- City of Los Angeles direct debt 3,164,560,000 Total direct and overlapping debt (2) $ 11,984,134,349 (1) (2) Percentage of overlapping agency's assessed valuation located within boundaries of the City. Excludes tax and revenue anticipation notes, commercial paper notes, revenue bonds, mortgage revenue and tax allocation bonds, and non-bonded capital lease obligations. Source: Kelling, Northcross & Nobriga for overlapping debt
360 Ratios of General Bonded Debt Outstanding and Legal Debt Margin Last Ten Fiscal Years (dollar amounts expressed in thousands, except per capita) Fiscal Year Assessed Valuation Net of Homeowners' Exemptions $ 187,891,703 $ 200,887,819 $ 214,846,570 $ 230,141,811 $ 244,399,750 Add: Homeowners' Exemptions 2,724,218 2,690,526 2,667,789 2,645,302 2,625,257 Gross Assessed Valuation $ 190,615,921 $ 203,578,345 $ 217,514,359 $ 232,787,113 $ 247,025,007 Legal Debt Limit (a) (15% of assessed value) $ 28,592,388 $ 30,536,752 $ 32,627,154 $ 34,918,067 $ 37,053,751 Less: General Obligation Bonds Outstanding 525, , , , ,120 Legal Debt Margin $ 28,066,473 $ 29,985,532 $ 32,024,574 $ 34,152,532 $ 36,075,631 Legal Debt Margin as a Percentage of the Debt Limit 98.16% 98.19% 98.15% 97.81% 97.36% General Obligation Bonds Outstanding as a Percentage of Assessed Value 0.28% 0.27% 0.28% 0.33% 0.40% Population 3,627,878 3,679,600 3,745,083 3,804,577 3,856,688 General Obligation Bonds Outstanding Per Capita $145 $150 $161 $201 $254 Continued
361 Ratios of General Bonded Debt Outstanding and Legal Debt Margin - (Continued) Last Ten Fiscal Years (dollar amounts expressed in thousands, except per capita) Fiscal Year Assessed Valuation Net of Homeowners' Exemptions $ 263,547,493 $ 284,468,294 $ 312,668,295 $ 346,982,793 $ 381,153,232 Add: Homeowners' Exemptions 2,598,874 2,641,639 2,642,161 2,637,783 2,664,276 Gross Assessed Valuation $ 266,146,367 $ 287,109,933 $ 315,310,456 $ 349,620,576 $ 383,817,508 Legal Debt Limit (a) (15% of assessed value) $ 39,921,955 $ 43,066,490 $ 47,296,568 $ 52,443,086 $ 57,572,626 Less: General Obligation Bonds Outstanding 1,140,850 1,418,980 1,445,250 1,411,898 1,303,035 Legal Debt Margin $ 38,781,105 $ 41,647,510 $ 45,851,318 $ 51,031,188 $ 56,269,591 Legal Debt Margin as a Percentage of the Debt Limit 97.14% 96.71% 96.94% 97.31% 97.74% General Obligation Bonds Outstanding as a Percentage of Assessed Value 0.43% 0.49% 0.46% 0.40% 0.34% Population 3,901,614 3,932,740 3,966,959 3,996,070 4,045,873 General Obligation Bonds Outstanding Per Capita $292 $361 $364 $353 $322 (a) Debt limit provided in Section of the State of California Government Code
362 Pledged Revenue Coverage Last Ten Fiscal Years (dollar amounts expressed in thousands) Net Net Less: Net Available Net Operating Fiscal Operating Operating Available Debt Revenue Operating Cash Flow Year Revenues (1) Expenses (2) Revenue Service (3) Coverage Cash Flow Coverage (4) Airports Enterprise Fund Revenue Bonds and Notes 1999 $ 430,210 $ 270,727 $ 159,483 $ 48, $ 234, , , ,730 53, , , ,789 99,265 56, , , , ,345 46, , , , , , , , , ,114 46, , , , ,395 45, , , , ,961 44, , , , ,808 35, , , , ,422 39, , Harbor Enterprise Fund Revenue Bonds and Notes 1999 $ 212,621 $ 86,913 $ 125,708 $ 53, $ 136, ,089 83, ,095 53, , ,498 90, ,482 53, , ,677 99, ,400 54, , , , ,861 55, , , , ,080 59, , , , ,738 60, , , , ,027 62, , , , ,386 71, , , , ,593 61, , Power Enterprise Fund Revenue Bonds and Notes 1999 $ 2,281,861 $ 1,520,573 $ 761,288 $ 202, $ 684, ,508,213 1,636, , , , ,257,949 2,358, , , , ,457,375 1,568, , , , ,318,167 1,655, , , , ,437,461 1,771, , , , ,401,458 1,835, , , , ,665,535 2,016, , , , ,799,140 1,996, , , , ,989,725 2,176, , , , Continued
363 Pledged Revenue Coverage - (Continued) Last Ten Fiscal Years (dollar amounts expressed in thousands) Net Net Less: Net Available Net Operating Fiscal Operating Operating Available Debt Revenue Operating Cash Flow Year Revenues (1) Expenses (2) Revenue Service (3) Coverage Cash Flow Coverage (4) Water Enterprise Fund Revenue Bonds and Notes 1999 $ 471,697 $ 233,418 $ 238,279 $ 62, $ 187, , , ,969 65, , , , ,277 64, , , , ,425 48, , , , ,407 46, , , , ,955 64, , , , ,487 71, , , , ,452 95, , , , , , , , , , , , Sewer Enterprise Fund Revenue Bonds and Notes 1999 $ 409,162 $ 208,777 $ 200,385 $ 140, $ 191, , , , , , , , , , , , , , , , , , , , , , , , , , , , , , , , , , , , , , , , , , , , , , (1) For Airports, operating revenues include pledged pooled investment interest income. For Power and Water, operating revenues include capital contributions, net nonoperating revenues and allowance for funds used during construction. For Sewer, operating revenues include interest income from pooled investments other than interest income from construction funds. (2) For Airports, Harbor and Sewer, operating expenses do not include interest, depreciation and amortization expenses. For Power and Water, operating expenses do not include depreciation and amortization expenses. (3) Debt service includes principal and interest payments on bonds and commercial paper notes, and State loan for Sewer. (4) Net operating cash flow coverage is presented to show the Funds' ability to generate sufficient cash flow to cover debt service costs
364 This page intentionally left blank
365
366 Demographic and Economic Statistics Last Ten Fiscal Years Personal Personal Fiscal Estimated Income Income Median Public School Unemployment Year Population (1) (in thousands) (2) Per Capita (2) Age (3) Enrollment (4) Rate (5) ,627,878 $ 263,987,283 $ 27,973 n/a 868, % ,679, ,049,532 29, , % ,745, ,508,314 30, , % ,804, ,002,945 30, , % ,856, ,827,072 31, , % ,901, ,362,646 33, , % ,932, ,231,121 34, , % ,966, ,123,392 39, , % ,996, ,163,491 41, , % ,045,873 n/a n/a n/a 801, % (1) State Department of Finance estimates as of January 1 of each year. (2) U.S. Department of Commerce, Bureau of Economic Analysis ( Contains compiled data for Los Angeles-Long-Beach-Glendale CA Metropolitan Division Areas. Separate information for the City of Los Angeles not available. Additionally, beginning Fiscal Year statistical reporting, the Bureau of Economic Analysis revised the Metropolitan Statistical Area (MSA) to Los Angeles-Long Beach-Santa Ana based on the definition issued by the Office of Management and Budget in November (3) Information through Fiscal Year is taken from the California Department of Finance Survey for Los Angeles County; separate figures for the City are not compiled. Data for Fiscal Years through provided by the U. S. Census Bureau American Community Survey ( (4) Enrollment data determined at the beginning of each school year (October). Data include the City and all or significant portions of a number of smaller cities and unincorporated territories. Beginning of Fiscal Year enrollment data do not include fiscally independent charter schools. (5) California Employment Development Department data for the City of Los Angeles n/a Not Available 4,100,000 4,000,000 3,900,000 3,800,000 3,700,000 3,600,000 3,500,000 3,400,000 $45,000 $40,000 $35,000 $30,000 $25,000 $20,000 $15,000 $10,000 $5,000 $ Estimated Population Personal Income Per Capita , , , , , , , , , , % 7.0% 6.0% 5.0% 4.0% 3.0% 2.0% 1.0% 0.0% Public School Enrollment Unemployment Rate
367 Principal Employers Current Year and Nine Years Ago Percentage Percentage of Total of Total City City Employer Employees Rank Employment (1) Employees Rank Employment (2) City of Los Angeles 52, % 43, % County of Los Angeles 46, % 23, % University of Southern California 12, % 10, % Cedars-Sinai Medical Center 10, % 5, % Kaiser Foundation Hospitals 8, % 19, % UCLA Medical Center 7, % United States Postal Service 7, % 7, % The Walt Disney Company 6, % Fox Entertainment Group Inc. 5, % Northrop Grumman Corp 5, % Veterans Health Administration , % University of California , % Boeing North America Inc , % Southern California Permanente Medical Group , % 162, % 133, % (1) Based on a total city employment of 412,613 (2) Based on a total city employment of 411,042 Sources: City of Los Angeles Detail of Department Programs and various City Departments County of Los Angeles, Chief Executive Office D&B Regional Business Directory 2008 Los Angeles County Area University of Southern California, Office of Budget and Planning Note: From the Sources, employers located outside the City of Los Angeles were excluded
368
369 This page intentionally left blank
370 Number of City Government Employees by Function/Program Full-Time Equivalent Last Ten Fiscal Years Fiscal Year GOVERNMENTAL ACTIVITIES General Government City Administrative Officer City Attorney City Clerk (1) City Ethics Commission Commission on the Status of Women Controller Council Employee Relations Board General Services 1,523 1,539 1,673 1,857 1,861 Human Relations Commission Information Technology Agency Mayor Neighborhood Empowerment (2) Office of Finance (1) Personnel Treasurer (3) Protection of Persons and Property Animal Services Building & Safety Emergency Preparedness/Management (4) Fire-Civilian Fire-Sworn 2,922 3,008 3,300 3,389 3,460 Police- Civilian 3,590 3,605 3,596 3,562 3,609 Police- Sworn 9,870 10,045 10,054 10,196 10,190 Public Works Public Works- Accounting (5) Public Works- Board of Commissioners (5) Public Works- Contract Administration Public Works- Engineering Public Works- Management-Employee Services (5) Public Works- Street Lighting Public Works- Street Services 1,219 1,225 1,241 1,304 1,318 Health and Sanitation Environmental Affairs Public Works- Sanitation 2,544 2,496 2,421 2,582 2,652 Transportation 1,485 1,479 1,472 1,477 1,527 Continued
371 Number of City Government Employees by Function/Program Full-Time Equivalent - (Continued) Last Ten Fiscal Years Fiscal Year GOVERNMENTAL ACTIVITIES General Government City Administrative Officer City Attorney City Clerk (1) City Ethics Commission Commission on the Status of Women Controller Council Employee Relations Board General Services 1,871 1,923 2,120 2,276 2,323 Human Relations Commission Information Technology Agency Mayor Neighborhood Empowerment (2) Office of Finance (1) Personnel Treasurer (3) Protection of Persons and Property Animal Services Building & Safety ,016 1,056 Emergency Preparedness/Management (4) Fire-Civilian Fire-Sworn 3,530 3,423 3,571 3,661 3,706 Police- Civilian 3,595 3,592 3,678 3,634 3,778 Police- Sworn 10,212 10,213 10,245 10,310 10,466 Public Works Public Works- Accounting (5) Public Works- Board of Commissioners (5) Public Works- Contract Administration Public Works- Engineering ,010 1,018 Public Works- Management-Employee Services (5) Public Works- Street Lighting Public Works- Street Services 1,318 1,285 1,285 1,500 1,466 Health and Sanitation Environmental Affairs Public Works- Sanitation 2,695 2,762 2,821 2,899 2,940 Transportation 1,524 1,521 1,521 1,620 1,627 Continued
372 Number of City Government Employees by Function/Program Full-Time Equivalent - (Continued) Last Ten Fiscal Years Fiscal Year GOVERNMENTAL ACTIVITIES (Continued) Cultural and Recreational Services Cultural Affairs El Pueblo de los Angeles Historical Monument Library 1,055 1,093 1,102 1,154 1,184 Recreation and Parks 1,807 1,845 1,888 1,980 2,037 Zoo Community Development Aging Commission for Children, Youth and Their Families Community Development Department Disability Los Angeles Housing Planning TOTAL GOVERNMENTAL ACTIVITIES 33,213 33,739 34,324 35,382 35,771 BUSINESS-TYPE ACTIVITIES Airports 2,236 2,426 2,705 2,665 2,824 Harbor Los Angeles Convention Center Water and Power 7,071 7,157 7,506 7,731 8,108 TOTAL BUSINESS-TYPE ACTIVITIES 10,085 10,326 10,951 11,161 11,734 PENSION SYSTEMS City Employees Retirement System Fire and Police Pension System TOTAL PENSION FUNDS GRAND TOTAL 43,407 44,193 45,414 46,707 47,686 Continued
373 Number of City Government Employees by Function/Program Full-Time Equivalent - (Continued) Last Ten Fiscal Years Fiscal Year GOVERNMENTAL ACTIVITIES (Continued) Cultural and Recreational Services Cultural Affairs El Pueblo de los Angeles Historical Library 1,194 1,138 1,141 1,189 1,186 Recreation and Parks 2,053 1,905 1,973 2,127 2,200 Zoo Community Development Aging Commission for Children, Youth and Their Families Community Development Department Disability Los Angeles Housing Planning TOTAL GOVERNMENTAL ACTIVITIES 35,919 35,499 36,091 37,972 38,708 BUSINESS-TYPE ACTIVITIES Airports 3,116 3,343 3,481 3,542 3,732 Harbor Los Angeles Convention Center Water and Power 8,101 8,029 8,119 8,241 8,592 TOTAL BUSINESS-TYPE ACTIVITIES 12,048 12,194 12,469 12,685 13,342 PENSION SYSTEMS City Employees Retirement System Fire and Police Pension System TOTAL PENSION FUNDS GRAND TOTAL 48,160 47,889 48,758 50,880 52,287 Notes: (1) The Office of Finance was created in fiscal year 2001 under the current Charter consolidating the Treasurer's Office and certain functions of the City Clerk, City Administrative Officer and Personnel Department. (2) The Department of Neighborhood Empowerment was created by Ordinance in fiscal year (3) The Treasurer's Office was span-off from the Office of Finance in fiscal year (4) Emergency Preparedness was created as a separate department in fiscal year In November 2007, name changed (5) to Emergency Management Department. In fiscal year 2002, Public Works- Accounting and Management Employee Services were consolidated. In fiscal year 2005, their resources and functions were transferred to the Board of Public Works Commissioners. Sources: City of Los Angeles Detail of Department Programs with Financial Summaries and from the following departments: Fire, Airports, Harbor, Water and Power, Fire and Police Pension, and Los Angeles City Employees Retirement System
374 Operating Indicators by Function/Program Last Ten Fiscal Years General Government City Attorney Criminal Prosecution Program Combined criminal jury and court trials 1,166 1, Consumer cases concluded (2) Consumer protection-cases reviewed Consumer protection-consumer complaints Environmental cases concluded Housing/rent control cases concluded City Ethics Commission Whistle-blower complaints and investigations processed Information Technology Agency Call Center Operations (3) Number of calls received ,079 Number of wireless calls Office of Finance Total tax accounts audited -- 1,135 1,395 2,746 3,549 Revenue enhancement unit investigations (4) -- 28,549 21,004 21,668 14,901 Refund claims processed 8,837 12,856 8,296 4,480 14,100 General Services Building Services Program Recycling Operations Tonnage Collected 1,585 2,000 1,898 1,865 1,503 Special Events Filmings coordinated Building Maintenance and Repair Square feet of buildings 14,000,000 14,757,172 14,809,372 15,146,677 15,146,677 Neighborhood Empowerment Neighborhood councils certified (5) Protection of Persons and Property Animal Services Fire Animal Shelter Operations Program Animals impounded (6) 72,299 73,543 70,024 67,528 62,704 Animals adopted 11,998 12,726 15,490 17,880 18,708 Animals euthanized 51,637 53,445 42,800 37,640 34,002 Animal Licensing and Permitting Operations Dog licenses issued 158, , , , ,603 Building and Safety Function/Program Fiscal Year Building Permits Issued 104, , , , ,120 Fire Suppression Program Actual Fires Structure fires 2,957 2,922 2,972 2,800 2,436 Non structure fires 9,602 10,074 10,060 10,000 8,866 Emergency responses Fires (includes automatic alarms) 108, , , , ,346 Hazardous conditions 4,521 4,797 4,655 5,000 4,766 Rescues and others 22,299 22,465 31,898 34,100 25,057 Helicopter flight hours for brush and structure fires Continued
375 Operating Indicators by Function/Program - (Continued) Last Ten Fiscal Years General Government City Attorney (1) Criminal Prosecution Program Combined criminal jury and court trials Consumer cases concluded (2) Consumer protection-cases reviewed Consumer protection-consumer complaints Environmental cases concluded Housing/rent control cases concluded City Ethics Commission Whistle-blower complaints and investigations processed Information Technology Agency Call Center Operations (3) Number of calls received 403, , , ,218 1,656,388 Number of wireless calls 39,424 60, , , ,979 Office of Finance Total tax accounts audited 4,322 4,187 5,545 5,880 6,320 Revenue enhancement unit investigations (4) 19,840 24,463 27,738 52,441 25,000 Refund claims processed 13,804 13,555 14,240 19,374 24,225 General Services Building Services Program Recycling Operations Tonnage Collected 1,650 1,637 1,600 1,700 1,700 Special Events Filmings coordinated Building Maintenance and Repair Square feet of buildings 15,626,000 16,228,700 16,370,578 16,867,229 17,775,611 Neighborhood Empowerment Neighborhood councils certified (5) Protection of Persons and Property Animal Services Fire Animal Shelter Operations Program Animals impounded (6) 59,065 57,923 57,063 55,570 53,915 Animals adopted 18,741 18,879 19,592 25,427 30,512 Animals euthanized 29,554 25,029 19,524 18,108 16,840 Animal Licensing and Permitting Operations Dog licenses issued 131, , , , ,699 Building and Safety Function/Program Fiscal Year Building Permits Issued 144, , , , ,700 Fire Suppression Program Actual Fires Structure fires 2,431 3,222 3,406 3,327 3,800 Non structure fires 8,362 6,303 9,358 10,060 7,400 Emergency responses Fires (includes automatic alarms) 118, , , , ,687 Hazardous conditions 4,932 5,464 5,730 5,567 5,730 Rescues and others 25,934 28,808 30,211 35,773 30,211 Helicopter flight hours for brush and structure fires Continued
376 Protection of Persons and Property - (Continued) Fire - (Continued) Police Emergency Ambulance Services Operating Indicators by Function/Program - (Continued) Last Ten Fiscal Years Fiscal Year Emergency medical responses by Paramedic ambulances 164, , , , ,846 EMT ambulances 79,327 73,682 73,174 78,300 87,806 Paramedic fire resources 30,728 34,762 34,400 36,800 53,700 EMT fire resources 124, , , , ,457 Patrol Program Part I crimes reported 177, , , , ,368 Selected Part II crimes reported 72,335 66,408 82,843 88, ,028 Total arrests 212, , , , ,285 Traffic Control Program Traffic collisions investigated 42,837 46,485 48,873 49,534 48,357 Fatal and injury traffic accidents 21,354 22,415 24,203 24,811 23,647 Traffic citations issued 532, , , , ,814 Technical Support Program Complaint board calls received (911) 3,630,359 1,874,065 1,775,787 1,803,579 1,852,500 Public Works Board of Commissioners Graffiti eradicated/square footage (per 1,000 sq. ft.) (7) 17,797 21,877 25,083 30,926 29,375 Street Services Weed Abatement, Brush and Debris Clearance Land cleared/cleaned-private (million sq ft) Land cleared/cleaned-public (million sq ft) Debris removed (cubic yards) 145, , , , ,000 Street Cleaning Program Completion frequency-posted routes 100% 99% 98% 100% 97% Goal-posted routes 97% 97% 97% 97% 97% Completion frequency-nonposted routes (weeks) Goal-nonposted routes (weeks) Street Tree and Parkway Maintenance Program Trees planted - City forces 291 1,607 4,776 4,615 4,200 Trees trimmed - City forces (broadhead) 47,695 41,000 40,718 48,844 40,000 Street Resurfacing and Reconstruction Program Streets resurfaced (miles) Bus pads constructed Curb ramps constructed -- 7,205 7,210 7, Sidewalks repaired (miles) Health and Sanitation Sanitation Function/Program Maintenance and Operation of Flood Control Facilities Catch Basin Cleaning 44,480 49,917 51,470 57,597 76,668 Maintenance and Operation of Wastewater Facilities HTP Wastewater Treatment (MGD) HTP Wastewater Reclaimed (MGD) TITP Wastewater Treatment (MGD) TITP Wastewater Reclaimed (MGD) LAG Wastewater Treatment (MGD) LAG Water Reclaimed (MGD) DCT Wastewater Treatment (MGD) DCT Water Reclaimed (MGD) WCSD Sewer Cleaning-1,000 Feet 11,261 10,202 11,885 18,678 13,248 Continued
377 Protection of Persons and Property - (Continued) Fire - (Continued) Police Emergency Ambulance Services Operating Indicators by Function/Program - (Continued) Last Ten Fiscal Years Fiscal Year (1) Emergency medical responses by Paramedic ambulances 180, , , , ,000 EMT ambulances 93,856 91, , , ,000 Paramedic fire resources 57,671 55,916 77,088 77,467 78,000 EMT fire resources 232, , , , ,000 Patrol Program Part I crimes reported 177, , , , ,000 Selected Part II crimes reported 72,513 67,977 67, ,246 95,000 Total arrests 168, , , , ,000 Traffic Control Program Traffic collisions investigated 47,798 51,643 54,225 52,190 55,000 Fatal and injury traffic accidents 23,270 24,776 26,014 23,755 25,000 Traffic citations issued 421, , , , ,000 Technical Support Program Complaint board calls received (911) 1,817,331 1,752,555 1,726,179 2,104,658 2,303,000 Public Works Board of Commissioners Graffiti eradicated/square footage (per 1,000 sq. ft.) (7) 22,907 21,441 22,000 30,503 30,500 Street Services Weed Abatement, Brush and Debris Clearance Land cleared/cleaned-private (million sq ft) Land cleared/cleaned-public (million sq ft) Debris removed (cubic yards) 276, , , , ,000 Street Cleaning Program Completion frequency-posted routes 100% 97% 98% 97% 97% Goal-posted routes 97% 97% 98% 97% 97% Completion frequency-nonposted routes (weeks) Goal-nonposted routes (weeks) Street Tree and Parkway Maintenance Program Trees planted - City forces 4,068 4,200 3,889 5,578 4,200 Trees trimmed - City forces (broadhead) 41,000 40,000 44,514 48,555 45,000 Street Resurfacing and Reconstruction Program Streets resurfaced (miles) Bus pads constructed Curb ramps constructed 1,017 1, Sidewalks repaired (miles) Health and Sanitation Sanitation Function/Program Maintenance and Operation of Flood Control Facilities Catch Basin Cleaning 83,184 87, , , ,300 Maintenance and Operation of Wastewater Facilities HTP Wastewater Treatment (MGD) HTP Wastewater Reclaimed (MGD) TITP Wastewater Treatment (MGD) TITP Wastewater Reclaimed (MGD) LAG Wastewater Treatment (MGD) LAG Water Reclaimed (MGD) DCT Wastewater Treatment (MGD) DCT Water Reclaimed (MGD) WCSD Sewer Cleaning-1,000 Feet 14,953 19,150 25,328 26,030 26,300 Continued
378 Health and Sanitation (Continued) Operating Indicators by Function/Program - (Continued) Last Ten Fiscal Years Fiscal Year Sanitation (Continued) Household Refuse Collection Program Tons Collected: Refuse and Yard Trimmings Refuse 840, , , , ,266 Yard Trimmings 439, , , , ,669 Recyclables 190, , , , ,532 Bulky Items 13,600 16,808 26,206 25,594 33,267 Recycling Contamination -- 53,371 61,744 64,323 72,945 Transportation Transportation Rate and Service Regulation Bandit drivers arrested Bandit vehicles impounded Transportation System Engineering Program Speed humps/tables constructed Transportation System Operations Red curb miles reinstalled/installed Thermoplastic longline striping installed/ reinstalled (previously lane miles) New signs installed 32,250 32,544 57,227 11,872 9,320 Signs Replaced (8) ,708 26,674 Signs Maintained/Replaced Parking Management and Intersection Control Citations written 3,006,488 3,075,617 3,071,298 2,949,881 3,248,081 Citations written per officer per eight-hour shift Peak hour tows and other tows 27,483 10,099 11,995 10,038 10,549 Crossing guard assignments Number of hours of intersection control 28,184 14,833 16,770 60,023 32,242 Abandoned vehicles abated 92,951 94,074 96, , ,491 Abandoned vehicles impounded -- 10,253 10,055 14,276 11,719 Transit Operations Fixed transit routes in service Fixed transit route passenger trips 17,623,982 20,449,633 24,146,629 23,200,000 24,997,011 Total transit vehicle passenger trips 19,094,369 21,780,119 25,429,889 24,438,948 25,154,903 Cultural and Recreational Services Cultural Affairs Community Arts Art exhibitions presented Special events/festivals Performing Arts Music/theatre programs presented El Pueblo Art exhibitions presented Special events/festivals held Children's art workshops held Cultural and historical tours given ,061 1,100 Historic sites maintained Library Function/Program Public Library Services Program Items circulated 12,561,965 12,815,363 13,189,229 13,090,726 14,868,262 Books received: Volumes 346, , , , ,255 Books cataloged 56,205 56,525 61,361 59,875 61,625 Registered Borrowers 1,249,474 1,272,174 1,343,596 1,418,519 1,571,346 Number of people visiting library facilities 11,745,119 12,009,547 12,151,013 12,312,418 12,046,053 Continued
379 Health and Sanitation (Continued) Operating Indicators by Function/Program - (Continued) Last Ten Fiscal Years Fiscal Year (1) Sanitation (Continued) Household Refuse Collection Program Tons Collected: Refuse and Yard Trimmings Refuse 914,139 1,009, , ,196 1,034,429 Yard Trimmings 491, , , , ,467 Recyclables 186, , , , ,369 Bulky Items 29,740 31,150 33,038 33,047 33,146 Recycling Contamination 76,754 85,044 81,868 85,614 87,014 Transportation Transportation Rate and Service Regulation Bandit drivers arrested Bandit vehicles impounded Transportation System Engineering Program Speed humps/tables constructed Transportation System Operations Red curb miles reinstalled/installed Thermoplastic longline striping installed/ reinstalled (previously lane miles) New signs installed 11,000 12,000 22,678 23,000 23,000 Signs Replaced (8) 20,000 21,000 30, Signs Maintained/Replaced ,818 96,000 96,000 Parking Management and Intersection Control Citations written 3,152,691 3,101,079 3,205,565 3,102,611 3,220,000 Citations written per officer per eight-hour shift Peak hour tows and other tows 10,000 10,000 18,359 8,813 18,000 Crossing guard assignments Number of hours of intersection control 28,960 84,262 56,837 79,415 61,000 Abandoned vehicles abated 133, , , , ,000 Abandoned vehicles impounded 12,036 9,516 5,577 8,813 7,000 Transit Operations Fixed transit routes in service Fixed transit route passenger trips 29,175,688 30,711,799 30,630,303 32,195, Total transit vehicle passenger trips 29,368,124 30,851,486 30,765,034 30,027,152 30,606,307 Cultural and Recreational Services Cultural Affairs Community Arts Art exhibitions presented Special events/festivals Performing Arts Music/theatre programs presented El Pueblo Art exhibitions presented Special events/festivals held Children's art workshops held Cultural and historical tours given 1,200 1,400 1,400 1,450 1,450 Historic sites maintained Library Function/Program Public Library Services Program Items circulated 15,333,869 15,744,303 15,639,485 15,800,000 15,900,000 Books received: Volumes 275, , , , ,389 Books cataloged 56,294 50,915 50,000 50, Registered Borrowers 1,496,250 1,424,922 1,429,345 1,440,000 1,445,000 Number of people visiting library facilities 13,533,822 14,011,932 14,032,869 16,003,909 16,100,000 Continued
380 Cultural and Recreational Services - (Continued) Convention Center Zoo Operating Indicators by Function/Program - (Continued) Last Ten Fiscal Years Fiscal Year Scheduled exhibit hall events Educational Exhibits Attendance 1,365,819 1,368,998 1,537,253 1,517,366 1,516,067 Recreation and Parks Educational Exhibits Observatory Attendance 1,852,208 1,833,139 1,833,000 1,000, ,000 Recreational Opportunities Aquatics Pool Attendance 1,051,353 1,820,000 1,820,000 2,002,000 2,650,000 Camps Camper days 51,377 52,000 52,000 52,000 48,000 Municipal Sports Team sports participants 68,330 66,550 66,550 67,320 71,400 Number of teams 5,124 4,880 4,880 4,950 5,200 Senior Citizens Services Sr. Citizens Clubs Community Development Aging Senior Social Services Program Prop A - One-way transportation trips 129, , , , ,567 Congregate meals served 1,098,186 1,049,866 1,047,044 1,047, ,430 Homebound meals served 784, , , , ,431 Housing Housing Preservation and Production Programs Residential units preserved under the Housing Rehabilitation Program Units financed by GAP under the Homeownership Program - Low Income Units financed by MRB under the Homeownership Program Compliance Monitoring Affordable units monitored 10,863 14,562 14,376 15,000 9,000 Code Enforcement Program Periodic inspections (units) 230,850 72,504 82, , ,985 Urgent repair referrals Rent Program Rent adjustments processed Rental units registered 561, , , , ,000 Tenant complaints processed 2,149 3,692 5,378 5,633 6,155 Disability Constituents served Counseling sessions Crisis intervention Business Type Activities Airports Function/Program Aircraft movements (thousands) 1,490 1,546 1,456 1,329 1,292 Passengers (millions) Air cargo (thousand tons) 2,542 2,767 2,601 2,365 2,590 Continued
381 Cultural and Recreational Services - (Continued) Convention Center Zoo Operating Indicators by Function/Program - (Continued) Last Ten Fiscal Years Fiscal Year (1) Scheduled exhibit hall events Educational Exhibits Attendance 1,389,639 1,396,538 1,523,469 1,564,674 1,600,000 Recreation and Parks Educational Exhibits Observatory Attendance , ,000 Recreational Opportunities Aquatics Pool Attendance 2,300,000 1,389,678 1,298,123 1,292,655 1,500,000 Camps Camper days 48,000 52,652 48,454 50,000 52,000 Municipal Sports Team sports participants 72,000 73,307 76,498 74,000 76,000 Number of teams 5,200 4,864 5,099 5,200 5,000 Senior Citizens Services Sr. Citizens Clubs Community Development Aging Senior Social Services Program Prop A - One-way transportation trips 133, , , , ,339 Congregate meals served 891, , , , ,383 Homebound meals served 845, , , , ,684 Housing Housing Preservation and Production Programs Residential units preserved under the Housing Rehabilitation Program Units financed by GAP under the Homeownership Program - Low Income Units financed by MRB under the Homeownership Program Compliance Monitoring Affordable units monitored 15,000 15,000 17,000 17,476 18,000 Code Enforcement Program Periodic inspections (units) 150, , , , ,000 Urgent repair referrals Rent Program Rent adjustments processed Rental units registered 565, , , , ,000 Tenant complaints processed 8,000 8,000 8,000 7,404 8,100 Disability Constituents served ,001 1,000 Counseling sessions Crisis intervention Business Type Activities Airports Function/Program Aircraft movements (thousands) 1,280 1,270 1,220 1,225 1,249 Passengers (millions) Air cargo (thousand tons) 2,661 2,718 2,677 2,631 2,519 Continued
382 Business Type Activities - (Continued) Harbor Operating Indicators by Function/Program - (Continued) Last Ten Fiscal Years Fiscal Year Miles of waterfront Inbound tonnage (million tons) Outbound tonnage (million tons) Containerized cargo volume (in million of TEUs) Vessel arrivals 2,683 3,060 2,899 2,778 2,845 Cruise passengers 998,086 1,110,053 1,073,357 1,099,552 1,057,293 Power Kilowatt hours sold (billions) Customers-average number (thousands) 1,386 1,433 1,452 1,414 1,421 Energy production (billion kwh) Net system capability (megawatts) Water Function/Program Gallons sold (billions) Customers-average number (thousands) Net water supply (billions of gallons) Continued
383 Business Type Activities - (Continued) Harbor Operating Indicators by Function/Program - (Continued) Last Ten Fiscal Years Fiscal Year (1) Miles of waterfront Inbound tonnage (million tons) Outbound tonnage (million tons) Containerized cargo volume (in million of TEUs) Vessel arrivals 2,812 2,646 2,771 2,920 2,467 Cruise passengers 803,308 1,097,204 1,205,947 1,194,984 1,191,449 Power Kilowatt hours sold (billions) Customers-average number (thousands) 1,428 1,437 1,445 1,448 1,446 Energy production (billion kwh) Net system capability (megawatts) Water Function/Program Gallons sold (billions) Customers-average number (thousands) Net water supply (billions of gallons) (1) FY 2008 figures were based on estimates. (2) Beginning in FY 2005, this category was broken into two: "Consumer Protection-cases reviewed" and "Consumer Protection-consumer complaints". (3) The Call Center Operations, which provides assistance on routine and non-emergency City services, began operations in November (4) The revenue enhancement unit investigations data include the number of tax discovery cases resulting from the implementation of the new LATAX program. (5) The Citywide system of neighborhood councils was adopted on May 25, No data available for FY (6) This category was formerly "Animals Rescued". (7) The City offers free graffiti removal services through its Operation Clean Sweep Program. (8) In FY 2006, the Dept of Transportation changed "Signs Replaced" to "Signs Maintained/Replaced" for better description of reporting. -- Data not available. Sources: Except for the business-type activities data and Library Dept's Volumes of Books Received, of which were provided by the departments, all indicators are from the Detail of Department Programs which is a supplemental budget document
384 Capital Assets Information Last Ten Fiscal Years General Government Fiscal Year Function/Program Fiber optic cabling (fiber miles) (1) ,291 9,835 Public office buildings Protection of Persons and Property Animal shelters Fire stations Fire trucks Patrol units 1,250 1,274 1,274 1,274 1,276 Police stations Police training centers Public Works Bridges Street lights 237, , , , ,885 Streets (miles) 7,300 7,300 7,300 7,300 7,300 Health and Sanitation Refuse collection trucks Refuse yards Transportation Automated traffic signal and control systems Bike paths Commuter buses Traffic signals 1,549 1,808 2,102 2,501 2,902 Cultural and Recreational Services Acres of beach land Acres park land (incl. beaches) 15,261 15,277 15,418 15,451 15,535 Archery ranges Baseball/softball diamonds Children's play areas Dog parks Golf courses Hiking trails (miles) Historical sites Horticulture centers Indoor gyms Lakes Libraries Licensed child-care centers Museums Park sites Pools Recreational centers Regional parks Residential camps Senior citizen centers Skate parks Tennis courts Therapeutic centers Wedding sites Continued
385 Capital Assets Information - (Continued) Last Ten Fiscal Years General Government Fiscal Year Function/Program Fiber optic cabling (fiber miles) (1) 9,843 9,855 9,870 9,870 9,876 Public office buildings Protection of Persons and Property Animal shelters Fire stations Fire trucks Patrol units 1,276 1,276 1,276 1,374 1,374 Police stations Police training centers Public Works Bridges Street lights 242, , , , ,000 Streets (miles) 7,221 6,493 6,489 7,300 7,300 Health and Sanitation Refuse collection trucks Refuse yards Transportation Automated traffic signal and control systems Bike paths Commuter buses Traffic signals 3,403 4,251 4,555 4,506 4,515 Cultural and Recreational Services Acres of beach land Acres park land (incl. beaches) 15,553 15,704 15,822 15,944 15,710 Archery ranges Baseball/softball diamonds Children's play areas Dog parks Golf courses Hiking trails (miles) Historical sites Horticulture centers Indoor gyms Lakes Libraries Licensed child-care centers Museums Park sites Pools Recreational centers Regional parks Residential camps Senior citizen centers Skate parks Tennis courts Therapeutic centers Wedding sites Continued
386 Capital Assets Information - (Continued) Last Ten Fiscal Years Airports Harbor Power (2) Water Fiscal Year Function/Program Number of airports Number of major container terminals Number of cargo terminals Number of generating units (3) Transmission lines (miles) 3,620 3,620 3,620 3,620 3,631 Overhead distribution lines (miles) -- 6,100 6,100 6,161 6,223 Underground distribution lines (miles) -- 5,600 5,600 5,662 5,718 Aqueduct (miles) Number of storage reservoirs and tanks Distribution pipe (miles) 7,109 7,112 7,096 7,097 7,098 Service connections 697, , , , ,112 Wastewater Sanitary sewers (miles) 6,500 6,500 6,500 6,500 6,500 Stormwater drains (miles) 1,231 1,232 1,261 1,200 1,261 Continued
387 Capital Assets Information - (Continued) Last Ten Fiscal Years Airports Harbor Power (2) Water Fiscal Year Function/Program Number of airports Number of major container terminals Number of cargo terminals Number of generating units (3) Transmission lines (miles) 3,631 3,631 3,643 3,643 3,643 Overhead distribution lines (miles) 6,949 7,268 7,268 6,954 6,947 Underground distribution lines (miles) 6,257 6,115 6,115 6,061 6,095 Aqueduct (miles) Number of storage reservoirs and tanks Distribution pipe (miles) 7,108 7,119 7,137 7,229 7,227 Service connections 706, , , , ,430 Wastewater Sanitary sewers (miles) 6,500 6,500 6,500 6,500 6,550 Stormwater drains (miles) 1,500 1,200 1,000 1,000 1,200 (1) Fiber optic cabling data were not available prior to fiscal year (2) No data available for Power Overhead and Underground distribution lines for fiscal year (3) Data changed to Department-owned generating units beginning fiscal year Source: Various City departments
388 This page intentionally left blank

389
Prepared by Department of Finance
 COMPREHENSIVE ANNUAL FINANCIAL REPORT Year Ended September 30, 2016 Prepared by Department of Finance THIS PAGE INTENTIONALLY LEFT BLANK COMPREHENSIVE ANNUAL FINANCIAL REPORT TABLE OF CONTENTS Year Ended
Comprehensive Annual Financial Report. Fiscal Year Ended June 30, 2017
 Comprehensive Annual Financial Report Fiscal Year Ended June 30, 2017 CITY OF COVINGTON, GEORGIA COMPREHENSIVE ANNUAL FINANCIAL REPORT FOR THE FISCAL YEAR ENDED JUNE 30, 2017 Prepared by: Randy Smith,
CITY OF COMPTON STATE OF CALIFORNIA. Comprehensive Annual Financial Report. Fiscal Year Ended June 30, 2009
 STATE OF CALIFORNIA Comprehensive Annual Financial Report Fiscal Year Ended Comprehensive Annual Financial Report Table of Contents Page(s) Independent Auditor s Report... 1 Management s Discussion and
CITY OF NEDERLAND, TEXAS. Comprehensive Annual Financial Report
 Comprehensive Annual Financial Report For the Year Ended September 30, 2014 Prepared by the Finance Department INTRODUCTORY SECTION Comprehensive Annual Financial Report September 30, 2014 Table of Contents
NASSAU COUNTY, FLORIDA
 NASSAU COUNTY, FLORIDA COMPREHENSIVE ANNUAL FINANCIAL REPORT FOR THE FISCAL YEAR ENDED SEPTEMBER 30, 2017 PREPARED BY: John A. Crawford CLERK OF THE CIRCUIT COURT/COMPTROLLER Table of Contents INTRODUCTORY
CITY OF ROLLING HILLS, CALIFORNIA FINANCIAL STATEMENTS FOR THE FISCAL YEAR ENDED JUNE 30, 2017
 , CALIFORNIA FINANCIAL STATEMENTS FOR THE FISCAL YEAR ENDED JUNE 30, 2017 PREPARED BY: THE CITY OF ROLLING HILLS, CALIFORNIA FINANCIAL SERVICES DEPARTMENT THIS PAGE INTENTIONALLY LEFT BLANK FINANCIAL STATEMENTS
CITY OF AUBURN CALIFORNIA Comprehensive Annual Financial Report
 CALIFORNIA 2012 Comprehensive Annual Financial Report Fiscal Year Ended June 30, 2012 THIS PAGE INTENTIONALLY LEFT BLANK City of Auburn, California Comprehensive Annual Financial Report For the Year Ended
ST. CLAIR COUNTY, MICHIGAN
 TABLE OF CONTENTS DECEMBER 31, 2005 Page Number SECTION ONE: INTRODUCTORY SECTION Letter of Transmittal I-1 List of Elected and Appointed Officials I-9 GFOA Certificate of Achievement I-10 Organizational
City of Clinton, Iowa. Financial and Compliance Report Year Ended June 30, 2014
 Financial and Compliance Report Year Ended June 30, 2014 Table of Contents Introductory Section Table of contents City officials Organizational chart i ii iii iv Financial Section Independent auditor
City of North Chicago, Illinois
 Annual Financial Report Year Ended April 30, 2015 Annual Financial Report Table of Contents For the Year Ended April 30, 2015 Page INDEPENDENT AUDITORS' REPORT 1-3 MANAGEMENT'S DISCUSSION AND ANALYSIS
CITY OF HEALDSBURG HEALDSBURG, CALIFORNIA COMPREHENSIVE ANNUAL FINANCIAL REPORT WITH REPORT ON AUDIT BY INDEPENDENT CERTIFIED PUBLIC ACCOUNTANTS
 HEALDSBURG, CALIFORNIA COMPREHENSIVE ANNUAL FINANCIAL REPORT WITH REPORT ON AUDIT BY INDEPENDENT CERTIFIED PUBLIC ACCOUNTANTS FISCAL YEAR ENDED JUNE 30, 2008 Prepared by the Finance Department COMPREHENSIVE
 City Auditor Assistant City Manager Capital Projects Parks, Recreation & Cultural Affairs General Services City of Gainesville Organizational Chart Citizens City Commission City Attorney Clerk of the Commission
CITY OF CHEYENNE FINANCIAL & COMPLIANCE REPORT
 CITY OF CHEYENNE FINANCIAL & COMPLIANCE REPORT Cheyenne, Wyoming Year Ended Prepared by City Treasurer s Office This page is intentionally left blank 2 City of Cheyenne Financial and Compliance Report
City of North Chicago, Illinois
 Annual Financial Report Year Ended Annual Financial Report Table of Contents For the Year Ended Page INDEPENDENT AUDITORS' REPORT 1-3 MANAGEMENT'S DISCUSSION AND ANALYSIS (UNAUDITED) 4-12 BASIC FINANCIAL
City of Tarpon Springs, Florida
 City of Tarpon Springs, Florida Comprehensive Annual Financial Report Fiscal Year Ended September 30, 2018 CITY OF TARPON SPRINGS, FLORIDA COMPREHENSIVE ANNUAL FINANCIAL REPORT For the Fiscal Year Ended
MANAGEMENT S DISCUSSION AND ANALYSIS
 MANAGEMENT S DISCUSSION AND ANALYSIS As Finance Director of the City of St. Petersburg (City), I offer readers of the City s financial statements this narrative overview and analysis of the financial activities
SALEM CITY CORPORATION FINANCIAL STATEMENTS
 FINANCIAL STATEMENTS FOR THE YEAR ENDED JUNE 30, 2014 TABLE OF CONTENTS Introductory Section: Page Letter of transmittal 3 Financial Section: Independent Auditors Report 7 Management Discussion and Analysis
Clay County, Florida. County Audit Report September 30, 2014
 Clay County, Florida County Audit Report September 30, 2014 Clay County, Florida County Audit Report September 30, 2014 Table of Contents Section Financial Report 1 County-Wide 3 Clerk of the Circuit Court
SALEM CITY CORPORATION FINANCIAL STATEMENTS
 FINANCIAL STATEMENTS FOR THE YEAR ENDED JUNE 30, 2016 ii Table of Contents Introductory Section Page Letter of transmittal... 3 Financial Section Independent Auditors Report... 7 Management Discussion
SALEM CITY CORPORATION FINANCIAL STATEMENTS
 FINANCIAL STATEMENTS FOR THE YEAR ENDED JUNE 30, 2017 Allred Jackson, PC 50 East 2500 North, Suite 200 North Logan, UT 84341 (P) 435.752.6441 (F) 435.752.6451 www.allredjackson.com ii Table of Contents
City of North Lauderdale, Florida
 Comprehensive Annual Financial Report Fiscal Year Ended September 30, 2012 PREPARED BY THE FINANCE DEPARTMENT STEVEN CHAPMAN II, FINANCE DIRECTOR SENDIE RYMER, CONTROLLER Comprehensive Annual Financial
City of Merced, California
 For the Fiscal Year Ended June 30, 2015 Basic Financial Statements, California Merced, California Annual Financial Report For the year ended June 30, 2015 This page intentionally left blank Annual Financial
VILLAGE OF PIGEON PIGEON, MICHIGAN HURON COUNTY FINANCIAL REPORT FEBRUARY 29, 2016
 VILLAGE OF PIGEON PIGEON, MICHIGAN HURON COUNTY FINANCIAL REPORT FEBRUARY 29, 2016 REPORT OF INDEPENDENT AUDITORS MANAGEMENT S DISCUSSION AND ANALYSIS TABLE OF CONTENTS PAGE NUMBER i - iii iv x BASIC FINANCIAL
Village of Chicago Ridge, Illinois
 Comprehensive Annual Financial Report Year Ended Comprehensive Annual Financial Report Year Ended Contents Introductory Section List of Elected and Appointed Officials... i Organization Chart... ii Financial
ANNUAL FINANCIAL REPORT CITY OF GROVES, TEXAS
 ANNUAL FINANCIAL REPORT For the fiscal year ended September 30, 2010 3411 Richmond Avenue Suite 500 Houston, TX 77046 (P) 713.621.1515 (F) 713.621.1570 www.null-lairson.com ANNUAL FINANCIAL REPORT TABLE
City of Tombstone, Arizona Financial Statements. Year Ended June 30, 2016
 City of Tombstone, Arizona Financial Statements Year Ended June 30, 2016 CONTENTS Page INDEPENDENT AUDITOR S REPORT 1 MANAGEMENT S DISCUSSION AND ANALYSIS (MD&A) (Required Supplementary Information) 5
CITY OF CHARLESTON, ILLINOIS. FINANCIAL STATEMENTS For the Year Ended April 30, 2015
 FINANCIAL STATEMENTS For the Year Ended April 30, 2015 TABLE OF CONTENTS Page No. INDEPENDENT AUDITOR'S REPORT... 1 INDEPENDENT AUDITOR'S REPORT ON INTERNAL CONTROL OVER FINANCIAL REPORTING AND ON COMPLIANCE
CITY OF RACINE. Racine, Wisconsin FINANCIAL STATEMENTS. December 31, 2003
 Racine, Wisconsin FINANCIAL STATEMENTS December 31, 2003 TABLE OF CONTENTS December 31, 2003 Independent Auditors' Report 1 2 Management s Discussion and Analysis 3 16 Basic Financial Statements Government-wide
INTRODUCTORY SECTION
 INTRODUCTORY SECTION FINANCIAL SECTION CITY OF MINNETRISTA Management s Discussion and Analysis Year Ended December 31, 2012 As management of the City of Minnetrista, Minnesota, (the City), we
COMPREHENSIVE ANNUAL FINANCIAL REPORT City of McGregor, Texas. Year ended September 30, 2015
 COMPREHENSIVE ANNUAL FINANCIAL REPORT City of McGregor, Texas Year ended September 30, 2015 This page is intentionally left blank. CITY OF MCGREGOR, TEXAS COMPREHENSIVE ANNUAL FINANCIAL REPORT FOR THE
City of Murphy, Texas
 Comprehensive Annual Financial Report Fiscal Year Ended September 30, 2018 Prepared by: Finance Department This Page Left Intentionally Blank Comprehensive Annual Financial Report For the Fiscal Year Ended
County of Lackawanna, Pennsylvania
 Financial Statements and Supplementary Information Table of Contents Independent Auditors Report 1 Management s Discussion and Analysis (Unaudited) 4 Financial Statements Statement of Net Position 14 Statement
VILLAGE OF HARWOOD HEIGHTS, ILLINOIS COMPREHENSIVE ANNUAL FINANCIAL REPORT. For the Year Ended April 30, 2006
 COMPREHENSIVE ANNUAL FINANCIAL REPORT For the Year Ended April 30, 2006 Prepared by: Finance Department TABLE OF CONTENTS Page(s) INTRODUCTORY SECTION Principal Officials... Organizational Chart... Letter
City of North Chicago, Illinois
 Annual Financial Report Year Ended Annual Financial Report Table of Contents For the Year Ended Page INDEPENDENT AUDITORS' REPORT 1-3 MANAGEMENT'S DISCUSSION AND ANALYSIS (UNAUDITED) 4-13 BASIC FINANCIAL
COUNTY OF CALDWELL NORTH CAROLINA
 COUNTY OF CALDWELL NORTH CAROLINA COMPREHENSIVE ANNUAL FINANCIAL REPORT FOR THE YEAR ENDED JUNE 30, 2013 Comprehensive Annual Financial Report For the Year Ended June 30, 2013 Prepared by Finance Department
City of Moorhead, Minnesota. Comprehensive Annual Financial Report. For The Year Ended December 31,
 City of Moorhead, Minnesota Comprehensive Annual Financial Report For The Year Ended December 31, 2009 www.cityofmoorhead.com This page intentionally left blank COMPREHENSIVE ANNUAL FINANCIAL REPORT OF
 MANAGEMENT S DISCUSSION AND ANALYSIS As management of the City of Gainesville (the City ), we offer readers of the City s financial statements this narrative overview and analysis of the financial activities
City of Ocoee, Florida COMPREHENSIVE ANNUAL FINANCIAL REPORT. For The Year Ended September 30, 2016
 City of Ocoee, Florida COMPREHENSIVE ANNUAL FINANCIAL REPORT For The Year Ended September 30, 2016 Prepared by: City of Ocoee Finance Department This page intentionally left blank. INTRODUCTORY SECTION
TOWN OF EAST BRIDGEWATER, MASSACHUSETTS BASIC FINANCIAL STATEMENTS AND MANAGEMENT S DISCUSSION AND ANALYSIS WITH INDEPENDENT AUDITOR S REPORT FOR THE
 BASIC FINANCIAL STATEMENTS AND MANAGEMENT S DISCUSSION AND ANALYSIS WITH INDEPENDENT AUDITOR S REPORT FOR THE YEAR ENDING JUNE 30, 2017 BASIC FINANCIAL STATEMENTS AND MANGEMENT S DISCUSSION AND ANALYSIS
Management s Discussion and Analysis
 Management s Discussion and Analysis Management s Discussion and Analysis (Unaudited) Financial 17 Management of the City and County of Denver (City) offers readers of the basic financial statements this
CITY OF SOUTH GATE, CALIFORNIA COMPREHENSIVE ANNUAL FINANCIAL REPORT JUNE 30, 2012
 , CALIFORNIA COMPREHENSIVE ANNUAL FINANCIAL REPORT JUNE 30, 2012 , CALIFORNIA COMPREHENSIVE ANNUAL FINANCIAL REPORT JUNE 30, 2012 PREPARED BY: DEPARTMENT OF FINANCE COMPREHENSIVE ANNUAL FINANCIAL REPORT
CITY OF CARSON CITY, MICHIGAN
 , MICHIGAN FINANCIAL STATEMENTS Vredeveld Haefner LLC CPAs and Consultants TABLE OF CONTENTS FINANCIAL SECTION PAGE Independent Auditors Report 1-2 Management s Discussion and Analysis 3-8 Basic Financial
VILLAGE OF KEY BISCAYNE, FLORIDA
 COMPREHENSIVE ANNUAL FINANCIAL REPORT FOR THE FISCAL YEAR ENDED SEPTEMBER 30, 2012 Prepared by: THE FINANCE DEPARTMENT COMPREHENSIVE ANNUAL FINANCIAL REPORT FOR THE FISCAL YEAR ENDED SEPTEMBER 30, 2012
CITY OF UNIVERSITY CITY, MISSOURI COMPREHENSIVE ANNUAL FINANCIAL REPORT FOR THE FISCAL YEAR ENDED JUNE 30, 2017
 COMPREHENSIVE ANNUAL FINANCIAL REPORT FOR THE FISCAL YEAR ENDED JUNE 30, 2017 Report prepared and submitted by the Department Of Finance Tina Charumilind Director of Finance Contents Section I - Introductory
CITY OF SANTA PAULA FINANCIAL STATEMENTS
 CITY OF SANTA PAULA FINANCIAL STATEMENTS Year Ended Financial Statements Year Ended TABLE OF CONTENTS Page Independent Auditor s Report Management s Discussion and Analysis i - iii iv - xii Basic Financial
VILLAGE OF RICHMOND, ILLINOIS ANNUAL FINANCIAL REPORT
 VILLAGE OF RICHMOND, ILLINOIS ANNUAL FINANCIAL REPORT FOR THE FISCAL YEAR ENDED APRIL 30, 2015 VILLAGE OF RICHMOND TABLE OF CONTENTS APRIL 30, 2015 PAGE INDEPENDENT AUDITOR S REPORT 1 REQUIRED SUPPLEMENTARY
Borough of East Stroudsburg East Stroudsburg, Pennsylvania Monroe County. Financial Statements Year Ended December 31, 2015
 Borough of East Stroudsburg East Stroudsburg, Pennsylvania Monroe County Financial Statements Year Ended CONTENTS INDEPENDENT AUDITOR'S REPORT 1 MANAGEMENT S DISCUSSION AND ANALYSIS 3 BASIC FINANCIAL STATEMENTS
CITY OF COLLEGE PARK, GEORGIA
 CITY OF COLLEGE PARK, GEORGIA COMPREHENSIVE ANNUAL FINANCIAL REPORT FOR THE FISCAL YEAR ENDED JUNE 30, 2010 Prepared by: Finance Department, City of College Park, Georgia CITY OF COLLEGE PARK, GEORGIA
CITY OF DEERFIELD BEACH, FLORIDA
 COMPREHENSIVE ANNUAL FINANCIAL REPORT FOR THE FISCAL YEAR ENDED SEPTEMBER 30, 2014 Prepared by the Department of Financial Services Director of Finance, Hugh B. Dunkley Assistant Director of Finance, Sophia
CITY OF BOYNE CITY CHARLEVIOX COUNTY, MICHIGAN ANNUAL FINANCIAL REPORT YEAR ENDED APRIL 30, 2014
 CITY OF BOYNE CITY CHARLEVIOX COUNTY, MICHIGAN ANNUAL FINANCIAL REPORT YEAR ENDED APRIL 30, 2014 TABLE OF CONTENTS INDEPENDENT AUDITOR'S REPORT 1 MANAGEMENT S DISCUSSION AND ANALYSIS 4 BASIC FINANCIAL
CAFR COMPREHENSIVE ANNUAL FINANCIAL REPORT
 C I T Y OF LY N WO OD FISCAL YEAR 2014-2015 CAFR COMPREHENSIVE ANNUAL FINANCIAL REPORT Y E A R E N DING J U N E 3 0, 2 0 1 5 Comprehensive Annual Financial Report City of Lynwood, California with Report
Village of Hazel Crest, Illinois COMPREHENSIVE ANNUAL FINANCIAL REPORT
 COMPREHENSIVE ANNUAL FINANCIAL REPORT FOR THE FISCAL YEAR ENDED APRIL 30, 2016 Comprehensive Annual Financial Report Year Ended April 30, 2016 Prepared by Village of Hazel Crest Finance Department Table
HENRY COUNTY, GEORGIA
 HENRY COUNTY, GEORGIA FINANCIAL REPORT FOR THE FISCAL YEAR ENDED JUNE 30, 2003 INTRODUCTORY SECTION HENRY COUNTY, GEORGIA FINANCIAL REPORT FOR THE FISCAL YEAR ENDED JUNE 30, 2003 TABLE OF CONTENTS Page
TUNICA COUNTY, MISSISSIPPI AUDITED FINANCIAL STATEMENTS AND SPECIAL REPORTS FOR THE YEAR ENDED SEPTEMBER 30, 2008
 AUDITED FINANCIAL STATEMENTS AND SPECIAL REPORTS FOR THE YEAR ENDED SEPTEMBER 30, 2008 ANNUAL FINANCIAL REPORT Year Ended September 30, 2008 TABLE OF CONTENTS Independent Auditor s Report....1 Management
CITY OF ST. PAUL PARK FINANCIAL STATEMENTS FOR THE FISCAL YEAR ENDED DECEMBER 31, 2012
 FINANCIAL STATEMENTS FOR THE FISCAL YEAR ENDED DECEMBER 31, 2012 FINANCIAL STATEMENTS For the Fiscal Year Ended December 31, 2012 TABLE OF CONTENTS INTRODUCTORY SECTION Elected and Appointed Officials
State of New Mexico City of Hobbs. Annual Financial Report For the Year Ended June 30, 2016
 State of New Mexico Annual Financial Report For the Year Ended June 30, 2016 (This page intentionally left blank.) 2 INTRODUCTORY SECTION 3 STATE OF NEW MEXICO Annual Financial Report June 30, 2016 Table
TOOELE CITY CORPORATION. Financial Statements and Independent Auditor's Report. June 30, 2014
 Financial Statements and Independent Auditor's Report June 30, 2014 Table of Contents Page Independent Auditor's Report 1 Management's Discussion and Analysis 3 Basic Financial Statements: Government-Wide
INTRODUCTORY SECTION. Principal Officials... Organizational Chart... Certificate of Achievement for Excellence in Financial Reporting...
 TABLE OF CONTENTS Page(s) INTRODUCTORY SECTION Principal Officials... Organizational Chart... Certificate of Achievement for Excellence in Financial Reporting... Letter of Transmittal... i ii iii iv-ix
CITY OF CENTERVILLE, GEORGIA ANNUAL FINANCIAL REPORT FOR THE FISCAL YEAR ENDED JUNE 30, 2013
 ANNUAL FINANCIAL REPORT FOR THE FISCAL YEAR ENDED JUNE 30, 2013 NICHOLS, CAULEY & ASSOCIATES, LLC Certified Public Accountants Certified Financial Planners Certified Internal Auditors Certified Government
COMPREHENSIVE ANNUAL FINANCIAL REPORT City of McGregor, Texas. Year ended September 30, 2014
 COMPREHENSIVE ANNUAL FINANCIAL REPORT City of McGregor, Texas Year ended September 30, 2014 This page is intentionally left blank. CITY OF MCGREGOR, TEXAS COMPREHENSIVE ANNUAL FINANCIAL REPORT FOR THE
Township of Cranberry
 Township of Cranberry Financial Statements and Required Supplementary and Supplementary Information Year Ended December 31, 2013 with Independent Auditor s Report TABLE OF CONTENTS Independent Auditor's
BASIC FINANCIAL STATEMENTS, MANAGEMENT DISCUSSION AND ANALYSIS, AND REQUIRED SUPPLEMENTAL INFORMATION
 BASIC FINANCIAL STATEMENTS, MANAGEMENT DISCUSSION AND ANALYSIS, AND REQUIRED SUPPLEMENTAL INFORMATION C O N T E N T S PAGE Independent Auditor's Report........................................... Management
ROBINSON, FARMER, COX ASSOCIATES
 ROBINSON, FARMER, COX ASSOCIATES A PROFESSIONAL LIMITED LIABILITY COMPANY CERTIFIED PUBLIC ACCOUNTANTS Independent Auditors Report To the Honorable Members of the City Council City of Manassas, Virginia
This page was left blank intentionally.
 This page was left blank intentionally. TABLE OF CONTENTS Reference Page Introductory Section Transmittal Letter i Organization 1 Financial Section Independent Auditor s Report 2 Management s Discussion
CITY OF RICHARDSON, TEXAS COMPREHENSIVE ANNUAL FINANCIAL REPORT FOR THE FISCAL YEAR ENDED SEPTEMBER 30, Prepared By: DEPARTMENT OF FINANCE
 COMPREHENSIVE ANNUAL FINANCIAL REPORT FOR THE FISCAL YEAR ENDED SEPTEMBER 30, 2014 Prepared By: DEPARTMENT OF FINANCE Kent Pfeil, CGFO Director of Finance Keith Dagen, CPA Assistant Director of Finance
TOWN OF SOUTH PALM BEACH, FLORIDA
 COMPREHENSIVE ANNUAL FINANCIAL REPORT FISCAL YEAR ENDED SEPTEMBER 30, 2009 PREPARED BY FINANCE DEPARTMENT TABLE OF CONTENTS Introductory Section Letter of Transmittal... i-iv Organizational Chart...v Certificate
SURRY COUNTY, NORTH CAROLINA Comprehensive Annual Financial Report For the Year Ended June 30, 2008 TABLE OF CONTENTS
 2007 GFOA Certificate of Achievement for Excellence in Financial Reporting Letter of Transmittal Organizational Chart List of Principal Officials Introductory Section i ii-x xi xii Financial Section Independent
CITY OF EAST GRAND RAPIDS, MICHIGAN FINANCIAL STATEMENTS FOR THE YEAR ENDED JUNE
 , MICHIGAN FINANCIAL STATEMENTS Vredeveld Haefner LLC TABLE OF CONTENTS FINANCIAL SECTION PAGE Independent Auditors Report 1-2 Management s Discussion and Analysis 3-8 Basic Financial Statements Government-wide
GOGEBIC COUNTY ANNUAL FINANCIAL REPORT YEAR ENDED DECEMBER 31, 2013
 GOGEBIC COUNTY ANNUAL FINANCIAL REPORT YEAR ENDED DECEMBER 31, 2013 TABLE OF CONTENTS INDEPENDENT AUDITOR'S REPORT 1 MANAGEMENT S DISCUSSION AND ANALYSIS 4 BASIC FINANCIAL STATEMENTS Government-wide Financial
CITY OF SOUTH GATE, CALIFORNIA COMPREHENSIVE ANNUAL FINANCIAL REPORT JUNE 30, 2014
 , CALIFORNIA COMPREHENSIVE ANNUAL FINANCIAL REPORT JUNE 30, 2014 , CALIFORNIA COMPREHENSIVE ANNUAL FINANCIAL REPORT JUNE 30, 2014 PREPARED BY: DEPARTMENT OF FINANCE THIS PAGE INTENTIONALLY LEFT BLANK COMPREHENSIVE
VILLAGE OF ISLAND LAKE, ILLINOIS ANNUAL FINANCIAL REPORT WITH SUPPLEMENTARY INFORMATION
 ANNUAL FINANCIAL REPORT WITH SUPPLEMENTARY INFORMATION YEAR ENDED APRIL 30, 2014 CONTENTS Pages Independent Auditor s Report 1-2 Management s Discussion and Analysis 3-7 Basic Financial Statements: Government-wide
City of Lompoc, California. Financial Statements. Year Ended June 30, 2015
 Financial Statements Year Ended June 30, 2015 Financial Statements Year Ended June 30, 2015 Table of Contents Page Independent Auditors Report 4 6 Management s Discussion and Analysis 7 26 Basic Financial
City of Panama City Beach, Florida
 City of Panama City Beach, Florida FINANCIAL STATEMENTS September 30, 2017 City of Panama City Beach, Florida Table of Contents September 30, 2017 Independent Auditors Report 1 Management s Discussion
CITY OF RIPON CALIFORNIA
 CALIFORNIA FINANCIAL STATEMENTS AND INDEPENDENT AUDITOR S REPORT FOR THE YEAR ENDED CALIFORNIA TABLE OF CONTENTS Page Independent Auditor s Report... 1 Management s Discussion and Analysis... 3 Basic Financial
This page intentionally left blank.
 This page intentionally left blank. , CALIFORNIA COMPREHENSIVE ANNUAL FINANCIAL REPORT FOR THE FISCAL YEAR ENDED JUNE 30, 2017 Prepared By Finance Department This page intentionally left blank. COMPREHENSIVE
City of Coeur d Alene, Idaho. Audited Financial Statements
 City of Coeur d Alene, Idaho Audited Financial Statements City of Coeur d Alene, Idaho TABLE OF CONTENTS FINANCIAL SECTION: Independent Auditor s Report...1 3 Management s Discussion and Analysis... 4
City of Alhambra California. Comprehensive Annual Financial Report
 City of Alhambra California Comprehensive Annual Financial Report For the year ended June 30, 2013 On the Cover: Almansor Park Playground The City opened the newly renovated playground in Almansor Park
COMPREHENSIVE ANNUAL FINANCIAL REPORT CITY OF ORMOND BEACH, FLORIDA FISCAL YEAR ENDED SEPTEMBER 30, 2018
 City of Ormond Beach Florida Photo by Sam West Comprehensive Annual Financial Report Fiscal Year Ended September 30, 2018 COMPREHENSIVE ANNUAL FINANCIAL REPORT FISCAL YEAR ENDED Prepared by: Finance Department
City of Starkville, Mississippi. Audit Report. September 30, 2017
 Audit Report September 30, 2017 Contents Page Financial Section: Independent Auditors Report 2 Management Discussion and Analysis 5 Basic Financial Statements: Government-wide Financial Statements: Statement
VILLAGE OF ISLAND LAKE, ILLINOIS ANNUAL FINANCIAL REPORT WITH SUPPLEMENTARY INFORMATION
 ANNUAL FINANCIAL REPORT WITH SUPPLEMENTARY INFORMATION YEAR ENDED APRIL 30, 2015 CONTENTS Pages Independent Auditor s Report 1-2 Management s Discussion and Analysis 3-7 Basic Financial Statements: Government-wide
CITY OF FREEPORT FREEPORT, TEXAS
 FREEPORT, TEXAS ANNUAL FINANCIAL REPORT FOR THE YEAR ENDED SEPTEMBER 30, 2013 KENNEMER, MASTERS & LUNSFORD, LLC CERTIFIED PUBLIC ACCOUNTANTS 8 WEST WAY COURT LAKE JACKSON, TEXAS 77566 THIS PAGE LEFT BLANK
COMPREHENSIVE ANNUAL FINANCIAL REPORT
 COMPREHENSIVE ANNUAL FINANCIAL REPORT City of Nampa, Idaho for Fiscal Year Ended September 30, 2014 COMPREHENSIVE ANNUAL FINANCIAL REPORT CITY OF NAMPA, IDAHO Fiscal Year Ended September 30, 2014 Submitted
CITY OF FITCHBURG, MASSACHUSETTS. Annual Financial Statements. For the Year Ended June 30, 2016
 CITY OF FITCHBURG, MASSACHUSETTS Annual Financial Statements For the Year Ended June 30, 2016 TABLE OF CONTENTS PAGE INDEPENDENT AUDITORS REPORT 1 MANAGEMENT S DISCUSSION AND ANALYSIS 4 BASIC FINANCIAL
CITY OF JASPER Jasper, Alabama. Financial Statements and Supplemental Information. September 30, 2016
 CITY OF JASPER Jasper, Alabama Financial Statements and Supplemental Information Table of Contents Page(s) INDEPENDENT AUDITORS' REPORT 1 3 MANAGEMENT'S DISCUSSION AND ANALYSIS 4 11 BASIC FINANCIAL STATEMENTS
City of Hazelwood, Missouri. For The Year Ended June 30, much more than you imagine
 City of Hazelwood, Missouri For The Year Ended June 30, 2017 much more than you imagine City of Hazelwood, Missouri For The Year Ended June 30, 2017 much more than you imagine Prepared by the Finance Department
TOWN OF BLACKSTONE, MASSACHUSETTS. Report on Examination of Basic Financial Statements and Additional Information Year Ended June 30, 2016
 TOWN OF BLACKSTONE, MASSACHUSETTS Report on Examination of Basic Financial Statements and Additional Information Year Ended June 30, 2016 Report on Internal Control Over Financial Reporting and On Compliance
CITY OF SOUTH BELOIT, ILLINOIS ANNUAL FINANCIAL REPORT. For the Year Ended December 31, 2015
 ANNUAL FINANCIAL REPORT For the Year Ended December 31, 2015 TABLE OF CONTENTS Page(s) INDEPENDENT AUDITOR S REPORT... 1-3 GENERAL PURPOSE EXTERNAL FINANCIAL STATEMENTS Management s Discussion and Analysis...
City of Grand Ledge. FINANCIAL STATEMENTS (With Required Supplementary Information) June 30, 2018
 June 30, 2018") FINANCIAL STATEMENTS (With Required Supplementary Information) TABLE OF CONTENTS Page INDEPENDENT AUDITOR S REPORT MANAGEMENT S DISCUSSION AND ANALYSIS i-iii iv-x BASIC FINANCIAL STATEMENTS Government-wide
FINANCIAL STATEMENTS (With Required Supplementary Information) TABLE OF CONTENTS Page INDEPENDENT AUDITOR S REPORT MANAGEMENT S DISCUSSION AND ANALYSIS i-iii iv-x BASIC FINANCIAL STATEMENTS Government-wide
VILLAGE OF TEQUESTA, FLORIDA 2017 COMPREHENSIVE ANNUAL FINANCIAL REPORT
 2017 COMPREHENSIVE ANNUAL FINANCIAL REPORT FISCAL YEAR ENDED SEPTEMBER 30, 2017 VILLAGE OF TEQUESTA COUNCIL MEMBERS 2017 From left to right: Council Member Thomas Paterno, Council Member Vince Arena, Mayor
CITY OF GOLETA Comprehensive Annual Financial Report for Fiscal Year Ending June 30, 2014
 Comprehensive Annual Financial Report for Fiscal Year Ending June 30, 2014 , CALIFORNIA COMPREHENSIVE ANNUAL FINANCIAL REPORT WITH REPORT ON AUDIT BY INDEPENDENT CERTIFIED PUBLIC ACCOUNTANTS YEAR ENDED
CITY OF INKSTER, MICHIGAN. Year Ended June 30, Financial Statements and Single Audit Compliance Act
 CITY OF INKSTER, MICHIGAN Year Ended June 30, 2016 Financial Statements and Single Audit Compliance Act This page intentionally left blank. Table of Contents Independent Auditors Report 1 Management s
City of Elko, Nevada FINANCIAL STATEMENTS FISCAL YEAR ENDED JUNE 30, 2018
 City of Elko, Nevada FINANCIAL STATEMENTS FISCAL YEAR ENDED JUNE 30, 2018 Table of Contents Page FINANCIAL SECTION Independent Auditors Report... 1 Management s Discussion and Analysis... 4 Basic Financial
(This page intentionally left blank.)
") (This page intentionally left blank.) ANNUAL FINANCIAL REPORT of the For the Year Ended (This page intentionally left blank.) TABLE OF CONTENTS FINANCIAL SECTION Independent Auditor s Report 1 Management
(This page intentionally left blank.) ANNUAL FINANCIAL REPORT of the For the Year Ended (This page intentionally left blank.) TABLE OF CONTENTS FINANCIAL SECTION Independent Auditor s Report 1 Management
PROVISO TOWNSHIP HIGH SCHOOL DISTRICT NO. 209 [Forest Park, Illinois] Audited Financial Statements And Supplementary Financial Information
![PROVISO TOWNSHIP HIGH SCHOOL DISTRICT NO. 209 [Forest Park, Illinois] Audited Financial Statements And Supplementary Financial Information](/thumbs/90/101384916.jpg "PROVISO TOWNSHIP HIGH SCHOOL DISTRICT NO. 209 [Forest Park, Illinois] Audited Financial Statements And Supplementary Financial Information") PROVISO TOWNSHIP HIGH SCHOOL DISTRICT NO. 209 [Forest Park, Illinois] Audited Financial Statements And Supplementary Financial Information June 30, 2017 THIS PAGE INTENTIONALLY LEFT BLANK PROVISO TOWNSHIP
PROVISO TOWNSHIP HIGH SCHOOL DISTRICT NO. 209 [Forest Park, Illinois] Audited Financial Statements And Supplementary Financial Information June 30, 2017 THIS PAGE INTENTIONALLY LEFT BLANK PROVISO TOWNSHIP
TOOELE CITY CORPORATION. Financial Statements and Independent Auditor's Report. June 30, 2012
 Financial Statements and Independent Auditor's Report June 30, 2012 Table of Contents Page Independent Auditor's Report 1 Management's Discussion and Analysis 3 Basic Financial Statements: Government-Wide
WOODS CROSS CITY CORPORATION FINANCIAL STATEMENTS. For The Year Ended June 30, Together With Independent Auditor s Report
 CORPORATION FINANCIAL STATEMENTS For The Year Ended June 30, 2017 Together With Independent Auditor s Report Financial Section: WOODS CROSS CITY TABLE OF CONTENTS Independent Auditor s Report... 1 Management
CITY OF FREEPORT, ILLINOIS ANNUAL FINANCIAL REPORT
 ANNUAL FINANCIAL REPORT FOR THE FISCAL YEAR ENDED APRIL 30, 2017 TABLE OF CONTENTS FINANCIAL SECTION PAGE INDEPENDENT AUDITORS' REPORT... 1-3 MANAGEMENT S DISCUSSION AND ANALYSIS... MD&A 1-11 BASIC FINANCIAL
City of Le Sueur Le Sueur County, Minnesota. Financial Statements. December 31, 2015
 Le Sueur County, Minnesota Financial Statements December 31, 2015 Table of Contents Page Elected Officials and Administration 1 Independent Auditor's Report 3 Management's Discussion and Analysis 7 Basic
FLORIDA REPORT COUNCIL MAYOR CITY BMC R 30, 2014 RICK DWYER TERS NC.
 CITY OF DEBARY, FLORIDA ANNUAL FINANCIAL REPORT FOR THE FISCAL YEAR ENDED SEPTEMBER R 30, 2014 CITY COUNCIL CHRIS CARSON, INTERIM MAYOR DAN HUNT, VICE MAYOR RICK DWYER LITA HANDY-PETH TERS SID VIHLEN,
CITY OF METHUEN, MASSACHUSETTS. Annual Financial Statements. For the Year Ended June 30, 2017
 CITY OF METHUEN, MASSACHUSETTS Annual Financial Statements For the Year Ended June 30, 2017 CITY OF METHUEN, MASSACHUSETTS TABLE OF CONTENTS INDEPENDENT AUDITORS REPORT 1 MANAGEMENT S DISCUSSION AND ANALYSIS