Quarterly Financial Reporting Information
|
|
|
- Erick McGee
- 5 years ago
- Views:
Transcription


1 1 1 For the Nine Months Ended September 30, 2017 Sisters of Charity of Leavenworth Health System, Inc. Disclosure Information as of September 30, 2017 November 15,
2 2 2 Table of Contents SCL Health History, Background and Organization 3 Where We Serve Our Communities 4 Restricted Affiliates Organization Chart 5 Changes 6 Management s Discussion and Analysis of Financial Performance Summary 7 Financial Analysis 7 Liquidity and Capital Resources 10 Subsequent Events 14 Notice to Readers on Forward Looking Statements 15 Financial Analysis and Utilization Statistics Summary 15 SCL Health Consolidated Financial Statements Consolidated Balance Sheets 18 Consolidated Statements of Operations 20 Consolidated Statements of Changes in Net Assets 21 Consolidated Statements of Cash Flows 22 Restricted Affiliates Statistics and Financial Ratios 23 2
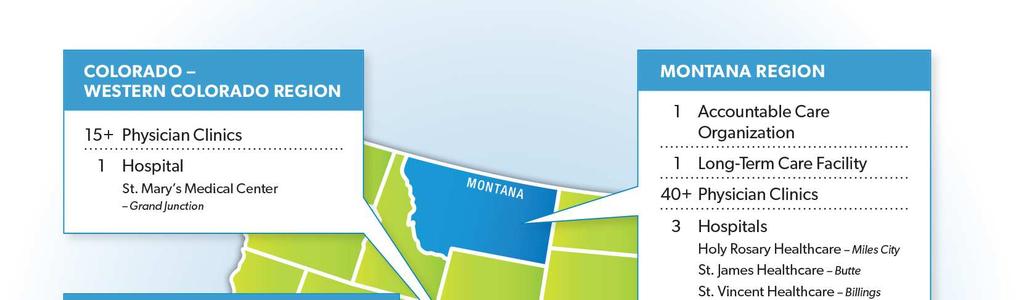
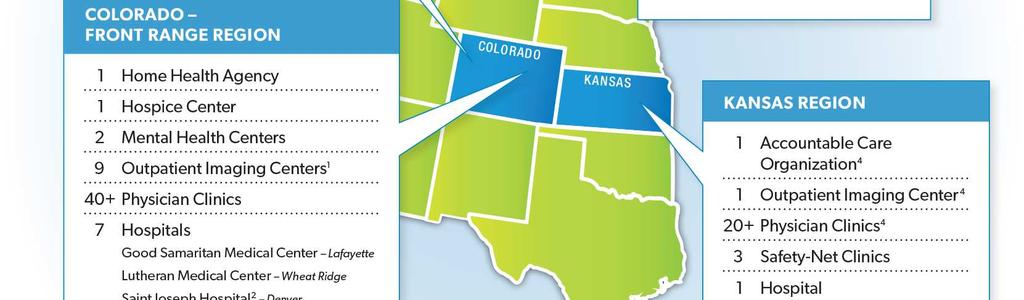
3 3 3 SISTERS OF CHARITY OF LEAVENWORTH HEALTH SYSTEM, INC. AND AFFILIATES History, Background and Organization OVERVIEW The Sisters of Charity of Leavenworth (the Sisters or the Congregation ), founded in 1858, have provided more than 159 years of service committed to enhancing the spiritual, health, educational and social well-being of all persons. In 1857, a small congregation of Sisters from Nashville, Tennessee, ventured to the edge of an expanding frontier, settling in the territory of Kansas. Over the years, these women established schools, orphanages and hospitals throughout the western territories as the populations and needs of these communities grew. The Congregation sponsors a variety of ministries in healthcare, education, social welfare, spiritual development and foreign missions. The historical roots of its health-care ministry can be traced to 1864 when the Sisters opened the first private hospital in the state of Kansas. Within the next century the Sisters established, developed and staffed hospitals in Montana, Colorado, Nebraska, New Mexico, California, Kansas and Wyoming. In 1972, following a review of their first century of providing health-care services, the Sisters recognized the need to unify and develop a more cohesive system for the hospitals, strengthening them individually and collectively. As a result of that review, the Sisters sought the incorporation of Sisters of Charity of Leavenworth Health System, Inc. ( SCL Health ), a nonprofit corporation organized under the laws of the State of Kansas. In 2011, the Congregation formed a new canonical entity, Leaven Ministries, which was approved and recognized by the Catholic Church to be the new Sponsor of SCL Health. Leadership of the Sisters of Charity of Leavenworth religious community remains involved in Leaven Ministries. The members of Leaven Ministries include four Sisters and one lay leader. SCL Health is governed by a 17-member Board of Directors. Headquartered in Broomfield, Colorado, SCL Health is a faith-based nonprofit health-care system that operates nine acute care hospitals, three community hospitals and an emergency center in a joint venture with Emerus Holdings, Inc., three safety net clinics, one children s mental health center and more than 190 ambulatory service centers in three states Colorado, Kansas and Montana with more than 15,000 associates and over 500 employed providers. SCL Health is the sole member of an Obligated Group under a Master Trust Indenture ( MTI ). Seven hospitals comprise the Restricted Affiliates under the MTI. (See Restricted Affiliates Organization Chart.) SCL Health and its hospitals have been recognized for clinical quality and patient experience by multiple third-party organizations that rank hospital and health systems nationwide. SCL Health has entered into several strategic partnerships and affiliation agreements from 2012 to the present, including but not limited to: a Joint Operating Agreement with National Jewish Health, a joint venture with Emerus Holdings, Inc., a joint venture with Touchstone Imaging and an affiliation agreement with Platte Valley Medical Center. These reflect the organization s efforts to expand its continuum of care and grow in the communities it serves. 3
4 4 4 4
5 5 5 5
6 6 6 SCL Health Changes Restricted Affiliates, Affiliates and Joint Ventures As previously disclosed, the Board of Directors of SCL Health authorized and directed senior management of SCL Health to explore the divestiture of the hospital and related assets of St. Francis Health Center, Inc. ( St. Francis ) located in Topeka, Kansas. The decision to divest operations in Kansas is a significant strategic shift for the organization. As a result, the operations of St. Francis Hospital, and the related physician practices, are reported as discontinued operations and have been segregated as such in the financial information for all periods presented and reported as assets held for sale on the accompanying balance sheets. No other changes to the restricted affiliates, affiliates or joint ventures have occurred since the June 30, 2017 disclosure. Corporate Governance In July, Pamela S. Federbush, Consultant, Healthcare Finance and Credit Counseling, joined the SCL Health board of directors. No other changes to corporate governance have occurred since the June 30, 2017 disclosure. Executive Management On August 24, 2017 SCL Health announced the appointment of Jay Doyle as President of St. James Healthcare in Butte, Montana. Doyle had been serving as interim president since January On August 25, 2017 SCL Health announced the appointment of Jennifer Alderfer, MHA, MBA, FACHE, as President of Good Samaritan Medical Center in Lafayette, Colorado. Alderfer began her new role with Good Samaritan on September 25, No other changes to executive management have occurred since the June 30, 2017 disclosure. 6
7 7 7 Management s Discussion and Analysis of Financial Performance For the Nine Months Ended September 30, 2017 Summary For the nine months ended September 30, 2017, SCL Health generated operating income from continuing operations of $108.2 million, an operating margin of 5.5% on total operating revenue of $2.0 billion. Operating cash flow (1) from continuing operations of $266.4 million represented an operating cash flow margin of 13.6%. Non-operating income consisted primarily of net investment income of $151.2 million. Financial Analysis Balance Sheet At September 30, 2017, the consolidated balance sheet of SCL Health continued to reflect a strong and stable health system. Total cash and investments of $2.0 billion (a total of 319 days cash and investments on hand) represented an increase of $151.0 million compared to December 31, 2016, after scheduled debt principal payments of $27.1 million and $123.8 million in capital expenditures made in the first three quarters of Total assets have increased by $132.5 million in Total long-term debt, including current maturities, decreased by $27.4 million due to scheduled debt principal payments and amortization of original issuance premium. Total net assets increased by $195.6 million primarily as a result of net income. The increase in net assets and reduction in outstanding debt resulted in a decrease in the net long-term debt-to-capitalization ratio from 34.5% at December 31, 2016 to 32.4% at September 30, Volume and Operating Income Volume indicators from continuing operations were generally favorable compared to the first nine months of the prior year. Admissions, emergency visits and emergency department visits were 1.0%, 0.8% and 0.8% greater than the prior year, respectively. The average inpatient length of stay from continuing operations increased slightly to 4.7 days from 4.6 days and the case mix index from continuing operations experienced an increase from 1.67 to SCL Health s payer mix has largely stabilized after Medicaid expansion in Colorado and Montana. In the first nine months of 2017, Medicaid represented 17% of gross patient revenue, consistent with the prior year. Medicare increased from 44% to 45%. Commercial and contracted payers decreased from 36% to 35%. Self-pay remained the same at 3% of gross patient revenue. The combination of increased volumes, payer mix shifts and changes in contracted rates resulted in a $126.6 million increase in net patient revenue from continuing operations for the first nine months of 2017 compared to the same period in Non-patient revenue from continuing operations decreased by $15.8 million in the first nine months of 2017 compared to The (1) Defined as operating income + depreciation and amortization + interest. 7

 from continuing operations increased 1.")
8 8 8 chart below shows the percentage of operating revenue generated by Care Site for the first nine months of 2017: % of YTD Operating Revenue by Care Site Lutheran Medical Center, 14.5% St. Vincent Healthcare, 14.8% St Mary's Medical Center, 15.9% Good Samaritan Medical Center, 12.2% Physician Clinics, 7.7% Platte Valley Medical Center, 4.6% St. James Healthcare, 4.3% Saint Joseph Hospital, 21.0% Other, 3.3% Holy Rosary Healthcare, 1.7% Information presented is for continuing operations only. Operating expenses from continuing operations increased by $95.2 million or 5.4% in the first nine months of 2017 compared to the same period in The number of full-time-equivalent employees (FTEs) from continuing operations increased 1.5% to 13,037 from 12,840 in Salaries and benefits costs from continuing operations increased by $35.8 million (3.8%) and other operating expenses from continuing operations increased by $64.1 million, partially due to the increase in volumes. Slightly offsetting these increases, depreciation expense and interest expense were $1.4 million and $3.3 million lower than the prior year, respectively. 8
9 9 9 Sources of Patient Revenue The primary sources of consolidated gross patient service charges include Medicare, stateadministered Medicaid programs, contracted rate payors (including health maintenance organizations and preferred provider organizations), commercial insurers and self-paying patients. The following information provides consolidated gross patient service revenue for continuing operations for the nine months ended September 30, 2017 and 2016 and the year ended December 31, Nine Months Ended September 30 Year Ended December Medicare 45% 44% 45% Medicaid 17% 17% 16% Managed care, commercial and other 35% 36% 36% Self-pay 3% 3% 3% Total 100% 100% 100% Commitments and Contingencies The SCL Health Board of Directors and Sponsors engage in on-going evaluations of the Care Sites and communities it serves for ministry realignment opportunities to better serve the health ministry. Ministry realignment includes, but is not limited to, acquisitions, divestitures, partnerships, management services, and other strategic relationships. 9
10 10 10 Liquidity and Capital Resources SCL Health s total cash and investments increased by $151.0 million during the nine months ended September 30, Unrestricted cash and investments (which exclude Self-Insured Risks Funds, Trustee Held Funds and Permanently Restricted Net Assets) increased by $151.7 million. SCL Health had 319 Days Total Cash on Hand (307 Unrestricted Days) at September 30, Cash, investments and assets limited as to use, stated at fair value and including pooled and separate accounts, as of September 30, 2017 and December 31, 2016 were as follows: Asset Category September 30, 2017 December 31, 2016 (In Millions) Cash and cash equivalents $ 31.1 $ 56.1 Global equity Domestic fixed income Real return Global Infrastructure Domestic equity Core hedge funds Master Limited Partnership Opportunistic Real estate Absolute return Tactical asset allocation Investments held in the Comprehensive Investment Program ( CIP ) 1, ,623.4 Cash and investments held outside of the CIP $ 1,985.0 $ 1,877.2 SCL Health s investments are exposed to various kinds and levels of risk (interest rate risk, credit risk, market risk and liquidity risk). SCL Health s investments are diversified across a broad range of asset classes, durations and funds to avoid concentrations of risk in any particular company, region or industry. 10
11 11 11 SCL Health Liquidity Information As of September 30, 2017 (unaudited) Assets Daily Liquidity (In millions) Money Market Funds $ 25.3 Checking and deposit accounts at P-1 rated bank 91.6 Overnight Repurchase Agreements (collateralized by Treasuries/Agencies; P-1 rated counterparty) - US Treasuries & Agencies (<3-year maturity) 71.5 US Treasuries & Agencies (>3-year maturity) 43.0 Other 17.2 Subtotal Daily Liquidity General Operating Line of Credit Drawn Portion of Line - Net Available Line Subtotal Daily Liquidity Including Line of Credit Weekly Liquidity P-1 Rated Commercial Paper 34.5 Publicly Traded Fixed Income Securities (at least Aa3) Publicly Traded Fixed Income Securities (below Aa3) Exchange Traded Equity (ownership of shares of stock) Equity Funds Subtotal Weekly Liquidity 1,235.8 TOTAL DAILY AND WEEKLY LIQUIDITY $ 1,684.4 Liquidity greater than 7 days Funds, vehicles, investments that allow withdrawals with one week notice or more TOTAL LIQUIDITY $ 2,
12 12 12 Outstanding Long-Term Debt Annual Interest Rates September 30, 2017 December 31, 2016 (In Millions) Tax-exempt bond issues: 2016, due through December 2045 Variable rate, 0.98% and 0.71% $ $ , due through January % to 5.50% , due through January 2039 Variable rate, 1.31% and 0.88% , due through January % to 5.25% Total under the SCL Health MTI 1, ,296.5 PVMC mortgage (HUD-Insured) 2.98% Other notes and capital leases , ,379.8 Original issue premium, net Unamortized debt issuance costs (10.5) (11.1) Current maturities of long-term debt (177.3) (176.1) $ 1,175.2 $ 1,203.8 Recent Debt Activity On June 15, 2016, SCL Health executed a new five-year private placement agreement for $57.5 million of outstanding 2011A Colorado Health Facility Authority tax-exempt variable rate revenue bonds with Bank of America. On June 1, 2016, SCL Health established a defeasance escrow with respect to Series 2010A Kansas Development Finance Authority tax-exempt bonds allocable to St. Francis projects and other Kansas projects (approximately $143.2 million in total aggregate principal amount) at a cost to SCL Health of approximately $163.7 million, funded from the SCL Health s cash fund balances (including cash made available by liquidating investment holdings). On May 12, 2016, SCL Health issued the Series 2016A, 2016B, 2016C and 2016D Colorado Health Facilities Authority tax-exempt variable rate revenue bonds in a par amount of $222.0 million. Proceeds of the Series 2016 bonds will be used to finance qualified capital expenditures at Saint Joseph Hospital in Denver, Colorado and St. Mary s Hospital & Medical Center in Grand Junction, Colorado. On May 11, 2016, SCL Health used cash to defease the $220.0 million outstanding par amount of the Colorado Series 2003A, Kansas Series 2012A, Montana Series 2014A and Colorado Series 2014B variable rate tax-exempt bonds. 12
13 13 13 Interest Rate Swaps SCL Health is a party to certain interest rate swap agreements utilized to hedge the interest rate expense on a portion of the variable rate bonds, which are summarized in the following table: Initial Notional Amount Current Notional Amount Expiry Rate Paid By Dealer Rate Paid By SCL Health Counterparty Fair Value 09/30/2017 $60,000,000 $25,240, % of LIBOR 3.18% MLCS(1) $(1,572,616) $60,000,000 $25,240, SIFMA 3.79% MLCS(1) $(1,916,446) $60,000,000 $60,000, SIFMA 4.22% Wells Fargo(2) $(13,798,244) (1) Merrill Lynch Capital Services, Inc. (2) Wells Fargo Bank, N.A. (3) The fair value of the swap agreements was calculated by Ponder & Co. at the request of SCL Health using Bloomberg midmarket closing swap curves as reported by Bloomberg as of September 30, 2017 and excluding accrued interest. Effective June 1, 2016 SCL Health executed a swap novation on the current notional $60.0 million swap, which expires December 1, 2031, from Deutsche Bank AG, New York to Wells Fargo Bank N.A. The swap agreements do not require SCL Health to post collateral to secure the counterparty s credit exposure. There can be no assurance that SCL Health will not be required to post collateral on any swaps entered into in the future. In addition, market conditions have resulted in swap valuations that would currently obligate SCL Health to make termination payments on existing interest rate hedge agreements, if such swap agreements are terminated. The provisions of the above-referenced interest rate hedge agreements permit SCL Health to terminate them at any time upon payment of any required termination payments. Liquidity Facilities The Series 2016B and 2016D Variable Rate Demand Bonds are backed by a Standby Bond Purchase Agreement with Wells Fargo. In the event that bonds bearing interest at a weekly rate are not successfully remarketed, or if funds are not available for remarketing, Wells Fargo will pay the purchase price for debt that is tendered. The Issues supported by the Standby Bond Purchase Agreement are listed below along with the expiration date: Series Bank Expiration Date Amount 2016B Colorado Wells Fargo May 31, 2019 $ 55,490, D Colorado Wells Fargo May 31, 2019 $ 55,490,000 13

 signed an Asset Purchase agreement to transfer operations of St.")
14 14 14 Estimated Annual Debt Service at September 30, 2017 (In Millions) (1) Excludes other notes and capital leases (2) Assumes Interest Rate on variable rate bonds of 2.25% per annum Ratings In J u l y 2017, Standard and Poor s and Fitch Ratings both affirmed their ratings of AA- with stable outlooks. In September 2017, Moody s Investor Services affirmed its rating of Aa3 with a stable outlook. Subsequent Events On October 1, 2017, SCL Health, Ardent Health Services and The University of Kansas Health System ( UKHS ) signed an Asset Purchase agreement to transfer operations of St. Francis in Topeka, Kansas to Ardent and UKHS. Subsequent to regulatory approval the transfer was finalized effective November 1, On October 12, 2017, SCL Health announced that EVP and Chief Financial Officer Lydia Jumonville was appointed President and Chief Executive Officer. Jumonville had been filling the interim President/CEO role since May. SCL Health will immediately begin the process to fill the role of Chief Financial Officer for the health system. On November 1, 2017, Rita Truly was commissioned as a member of Leaven Ministries, the sponsor of SCL Health. 14
15 15 15 Forward-Looking Statements This Quarterly Report contains disclosures which constitute forward-looking statements. Forward-looking statements include all statements that do not relate solely to historical or current facts, and can be identified by the use of words like may, believe, will, expect, project, estimate, anticipate, plan, initiative or continue. These forward-looking statements are based on the current plans and expectations of SCL Health and are subject to a number of known and unknown uncertainties and risks, many of which are beyond SCL Health s control that could significantly affect current plans and expectations and SCL Health s future financial position and results of operations. These factors include, but are not limited to, (i) the highly competitive nature of the health care business, (ii) the efforts of insurers, health care providers and others to contain health care costs, (iii) possible changes in the Medicare and Medicaid programs (including changes to Medicare outlier payments) that may impact reimbursements to health care providers and insurers, (iv) the ability to achieve expected levels of patient volumes and control the costs of providing services, (v) changes in Federal, state or local regulations affecting the health care industry, (vi) the ability to attract and retain qualified management and personnel, including affiliated physicians, nurses and medical support personnel, (vii) liabilities and other claims asserted against SCL Health (vii) changes in accounting practices, (ix) changes in general economic conditions including growing numbers of uninsured and unemployed patients, (x) changes in revenue mix and the ability to enter into and renew managed care provider arrangements on acceptable terms and (xii) the collectability of uninsured accounts and deductible and co-pay amounts. As a consequence, current plans, anticipated actions and future financial position and results of operations may differ from those expressed in any forward-looking statements made by or on behalf of SCL Health. You are cautioned not to unduly rely on such forward-looking statements when evaluating the information presented in this report, including in Management s Discussion and Analysis of Financial Performance. Financial Analysis and Utilization Statistics Summary The Consolidated Statements of Operations and Changes in Net Assets in the attached Financial Statements for SCL Health (Consolidated) are a summary of activity for the nine months ended September 30, 2017 and September 30, The Consolidated Balance Sheet and Utilization Statistics with respect to the years ended December 31, 2016 and 2015 should be read in conjunction with the Audited Financial Statements, including the notes thereto, and the reports of Ernst & Young LLP, independent auditors. The information discussed below and illustrated in the various financial tables is generally derived from the consolidated financial statements which are in conformity with U.S. generally accepted accounting principles, except for the omission of Notes to Consolidated Financial Statements. The two major indicators, Operating Indicator and Performance Indicator, respectively known as Income from Operations and Excess of Revenues over Expenses, are defined terms and are generally fully detailed in the Notes to Consolidated Financial Statements from the December 31, 2016 Audited Financial Statements within the section entitled, Summary of Significant Accounting Policies. Operating and Performance Indicator information is also presented in an alternative form prescribed by the Master Trust Indenture (MTI). These ratios are unique to the MTI and differ from ratios commonly used by rating agencies such as Standard & Poor s, Fitch Ratings and Moody s Investors Service. 15
16 16 16 SCL Health Financial Analysis of Consolidated Continuing Operations (Unaudited) (Dollars in Millions) Nine Months Ended September 30 Twelve Months Ended December Industry Standard Ratios (1): Operating Margin 5.5% 5.0% 4.8% 4.4% Total Margin 12.3% 8.3% 7.7% 10.0% MTI Ratios (2): Adjusted Operating Income Margin 6.0% 5.3% 5.1% 4.3% Operating Income Margin 12.3% 8.3% 7.7% 10.0% Operating Cash Flow Margin 13.6% 13.8% 13.5% 13.7% Return on Net Assets (Annualized) 12.4% 8.2% 7.7% 9.9% Debt Service Coverage (Annualized) 4.5x 3.3x 3.4x 3.4x Total Cash and Investments $2,028.2 $1,820.9 $1,877.2 $1,963.5 Unrestricted Cash and Investments (3) $1,951.2 $1,737.6 $1,799.5 $1,883.2 Days Total Cash on Hand Days Unrestricted Cash on Hand (3) Cushion Ratio 22.6x 17.0x 17.5x 18.4x Unrestricted Cash to Net Long-Term Debt (4) 147.5% 128.4% 133.1% 123.9% Percentage of Net Long-Term Debt to Total Capitalization (4) 32.4% 34.5% 34.5% 38.4% (1) Industry Standard Ratios: Operating margin = (operating revenue operating expense) / operating revenue Total margin = consolidated excess of revenue over expense / (total operating revenue + non-operating gains/losses) (2) MTI Ratios: Adjusted operating revenue = net patient service revenue + other operating revenue + net assets released from restrictions Adjusted operating income = adjusted operating revenue total operating expenses Adjusted operating income margin = adjusted operating income / adjusted operating revenue Operating income margin = consolidated excess of revenue over expense / (total operating revenue + nonoperating gains/losses) (3) Excludes trustee held funds, self-insured risk funds and permanently restricted net assets (4) Ratios for the twelve months ended December 31, 2015 have been restated to reflect debt issuance costs as a direct deduction from bonds payable 16
17 17 17 SCL Health Utilization Statistics Consolidated Continuing Operations (Unaudited) Nine Months Ended September 30 Twelve Months Ended December Licensed Beds 1,971 1,971 1,971 1,991 Staffed Beds 1,674 1,674 1,674 1,674 Admissions Acute 57,919 57,422 76,602 71,399 Admissions Total 61,608 60,976 81,267 76,076 Adjusted Admissions (1) 116, , , ,670 Expense per CMIAA (2) $7,587 $7,655 $7,651 $7,729 Newborn Deliveries 10,003 10,855 14,220 13,858 Patient Days Acute 248, , , ,793 Patient Days Total 287, , , ,744 Adjusted Patient Days (3) 544, , , ,285 Occupancy on Staffed Beds 62.8% 61.4% 61.4% 61.9% Average Daily Census 1,052 1,028 1,027 1,002 Average Length Of Stay Emergency Department Visits 224, , , ,986 Outpatient Visits (4) 594, , , ,990 Inpatient Surgeries 17,493 18,251 24,474 23,715 Outpatient Surgeries 21,605 22,236 29,636 28,016 Full Time Equivalent Employees 13,037 12,840 12,874 12,611 (1) Adjusted Admissions = Total Admissions + (Outpatient Revenue/(Inpatient Revenue/Total Admissions)) (2) Expense per CMIAA = Acute Hospital costs (excluding Medicare Provider Fees, depreciation, interest and one-time costs associated with replacement of the Saint Joseph facility) / Case Mix Index Adjusted Admissions (3) Adjusted Patient Days = Total Patient Days + (Outpatient Revenue/(Inpatient Revenue/Total Patient Days)) (4) Outpatient Visits = the sum of all series visits (i.e. rehab, radiation oncology, therapy, lab, etc.) and all nonseries visits (i.e. short stays, day surgeries, specialty services, etc.) excluding inpatient and outpatient emergency department visits, home health visits, outpatient clinic visits and outpatient surgeries. Outpatient visits include 92,346 and 82,788 patient visits from the Touchstone Joint Venture for the first nine months of 2017 and 2016, respectively. (5) Utilization statistics include PVMC beginning October 1,
18 18 18 SCL Health Consolidated Balance Sheets Assets Current assets: Unaudited September 30 Audited December (In Millions) Cash and cash equivalents $ $ Current portion of investments Accounts receivable: Patient (less allowance for uncollectible accounts of $123.2 million at September 30, 2017 and $106.6 million at December 31, 2016) Pledges and other Inventory Prepaid and other assets Assets held for sale Total current assets Investments: Investments, net of current portion 1, ,451.2 Assets limited as to use: Restricted funds self-insured risks Trustee-held funds Land, buildings, and equipment, net 2, ,025.6 Other assets: Investments in joint ventures Pledges receivable, net Other assets Total assets $ 4,567.1 $ 4,
19 19 19 SCL Health Consolidated Balance Sheets (continued) Unaudited September 30 Audited December (In Millions) Liabilities and net assets Current liabilities: Accounts payable $ 84.1 $ 88.4 Accrued salaries, wages, and benefits Accrued interest payable Other accrued expenses Current maturities of long-term obligations Liabilities held for sale Total current liabilities Other noncurrent liabilities: Reserve for self-insured risks Accrued pension liability Accrued swap liability Other liabilities Capital structure: Bonds payable 1, ,298.2 Other notes and capital lease obligations , ,379.9 Less current maturities , ,203.8 Total liabilities 1, ,806.8 Net assets: Noncontrolling interest Unrestricted 2, ,562.6 Temporarily restricted Permanently restricted Total net assets 2, ,627.8 Total liabilities and net assets $ 4,567.1 $ 4,
20 20 20 SCL Health Consolidated Statements of Operations Unaudited Nine Months Ended September (In Millions) Operating Revenue: Net patient service revenue before provision for bad debts $ 1,935.8 $ 1,816.7 Provision for bad debts (41.4) (48.9) Net patient service revenue 1, ,767.8 Other operating revenue Net assets released from restrictions Net gain (loss) from joint ventures (9.1) (3.0) Net gain (loss) from disposal of assets (0.8) (2.5) Total operating revenue 1, ,846.5 Operating Expenses: Salaries and wages Associate benefits Other operating expenses Depreciation and amortization Interest Total operating expenses 1, ,753.9 Income from continuing operations Non-operating Gains (Losses) Income tax expense (2.3) (3.0) Investment income (loss) Loss on early extinguishment of debt (17.2) Mission Fund expenditures 0.1 Net gain from Acquisitions/Disposals 1.7 Total non-operating gains, net Consolidated excess of revenue over expenses Less amounts attributable to noncontrolling interest Excess of revenue over expenses attributable to SCL Health $ $
21 21 21 SCL Health Consolidated Statements of Changes in Net Assets Nine Months Ended September (Unaudited) Noncontrolling Controlling 2016 (Unaudited) Total Total (In Millions) Unrestricted net assets Excess of revenue over expenses $ $ $ 2.1 $ Loss related to discontinued operations (58.3) (58.3) (31.9) Change in unrealized value of interest rate swaps and amortization of accumulated losses on interest rate swaps (2.9) Contribution from Montrose Careflight Joint Venture 0.4 Distributions to noncontrolling interest (1.3) (1.3) (1.9) Equity transfers to related entities (0.2) (0.2) Transfer of equipment to West Park Joint Venture (2.2) (2.2) Pension-related charges other than net periodic pension costs (0.5) (0.5) 0.2 Net assets released for capital acquisitions Temporarily restricted net assets Contributions Net investment activity Net assets released from restrictions (18.2) (18.2) (18.6) Permanently restricted net assets Contributions Net investment activity Permanently restricted net assets reclassification (5.2) (5.2) (3.4) (3.4) 0.7 Increase in net assets Beginning net assets 2, , ,509.1 Ending net assets $ 2,823.4 $ 2,821.3 $ 2.1 $ 2,
22 22 22 SCL Health Consolidated Statements of Cash Flows Unaudited Nine Months Ended September (In Millions) Operating activities Increase in net assets $ $ Adjustments to reconcile increase in net assets to net cash provided by operating activities: Depreciation and amortization Loss on assets held for sale 48.6 Provision for bad debts Increase in accounts receivable, net of allowances (73.6) (78.2) Change in amortization of accumulated losses and unrealized value of interest rate swaps (1.4) 2.9 Restricted contributions (19.6) (23.3) Pension-related charges other than net periodic pension costs (0.5) 0.2 Net assets released for capital acquisitions (0.1) (0.3) Loss from joint ventures Loss from disposal of assets (Increase) decrease in investments (207.8) Decrease in other assets Decrease in liabilities (33.9) (67.9) Net cash provided by operating activities Investing activities Acquisition of land, buildings, and equipment (123.8) (133.4) Increase in investments in joint ventures (16.7) (2.9) Net cash used in investing activities (140.5) (136.3) Financing activities Restricted contributions Net Assets released for capital acquisition Proceeds from issuance of long-term debt, net of original issuance discount and financing costs Payments on bonds, notes and capital leases payable (27.1) (36.8) Defeasance of bonds payable, including call and interest premiums (363.4) Net cash used in financing activities (7.4) (157.0) Net increase (decrease) in cash and cash equivalents (56.8) 42.3 Beginning cash and cash equivalents Ending cash and cash equivalents $ $
23 23 23 Restricted Affiliates Statistics and Financial Ratios The financial and statistical tables which follow are presented for the continuing operations of the Obligated Group under the Master Indenture (Restricted Affiliates). A complete list of the Restricted Affiliates can be found in the 2016 Consolidated Financial Statements. Historical Capitalization Ratio (Unaudited) The following table presents the capitalization of continuing operations of SCL Health and Restricted Affiliates (Restricted) as of September 30, 2017 and December 31, 2016 and Effective January 1, 2015, a majority of the Physician Practices converted from hospital-owned to free standing clinics. As a result, they are no longer classified as restricted affiliates. The 2015 information has also been restated to reflect debt issuance costs as a direct deduction from bonds payable Restricted September 30 December (In Millions) Long-term debt: Master Indenture debt (net of original issue premium and issuance costs, net ) $ 1,272.3 $ 1,296.6 $ 1,475.7 Other long-term indebtedness Total long-term debt 1, , ,479.9 Less current maturities (173.1) (172.0) (102.9) Plus variable portion not scheduled Net long-term debt 1, , ,441.3 Unrestricted net assets 2, , ,352.3 Total capitalization $ 3,983.7 $ 3,735.2 $ 3,793.6 Percent of net long-term debt to total capitalization 31.4% 34.2% 38.0% 23
24 Historical Debt Service Coverage Requirements (Unaudited) The table below presents the debt service coverage for the continuing operations of SCL Health and Restricted Affiliates (Restricted) for the nine months ended September 30, 2017 and the years ended December 31, 2016 and Effective January 1, 2015, a majority of the Physician Practices converted from hospital-owned to free standing clinics. As a result, they are no longer classified as restricted affiliates. Nine Months Ended September 30 Restricted Year Ended December (In Millions) Consolidated income available for debt service: Excess of revenue over expenses attributable to SCL Health $ $ $ Business acquisitions (gains) losses, net (5.9) Loss on early extinguishment of debt Change in unrealized (gains) losses, net (109.0) (64.4) 71.9 Depreciation and amortization Interest Total income available for debt service $ $ $ Consolidated annual debt service requirements (1) $ 81.3 $ 99.6 $ Actual debt service coverage ratio all long-term debt (2) 5.7x 4.2x 4.0x (1) Annual debt service = principal paid + interest paid + 20% of interest and principal for guaranteed debt. (2) Debt service coverage = total income available for debt service / annual debt service. Nine months debt service calculation is annualized. 24
25 25 25 Financial Performance (Unaudited) The following table highlights the financial results for continuing operations of SCL Health and Restricted Affiliates (Restricted) for the nine months ended September 30, 2017 and the years ended December 31, 2016 and Effective January 1, 2015, a majority of the Physician Practices converted from hospital-owned to free standing clinics. As a result, they are no longer classified as restricted affiliates. Nine Months Ended September 30 Restricted Year Ended December 31 MTI Ratios: Adjusted operating income margin (1) 10.1% 9.1% 8.1% Operating income margin (2) 17.4% 11.9% 6.4% Return on net assets (3) 15.4% 10.8% 5.5% Debt service coverage (4) 5.7x 4.2x 4.0x Days cash on hand (excluding self-insured risk funds, trustee-held funds and permanently restricted net assets) (5) Cushion ratio (6) 22.3x 16.7x 16.4x (1) Adjusted operating revenue = net patient service revenue + other operating revenue + net assets released from restrictions. Adjusted operating income = adjusted operating revenue total operating expenses. Adjusted operating income margin = adjusted operating income / adjusted operating revenue. (2) Operating income margin = excess of revenue over expenses / (total operating revenue + (total nonoperating gains (losses)). (3) Return on net assets = excess of revenue over expenses / unrestricted net assets. Nine months return on net assets calculation is annualized. (4) Debt service coverage = (excess of revenue over expenses change in unrealized gains (losses), net + depreciation and amortization + interest and amortization) / annual debt service. (5) Days cash on hand = (cash and cash equivalents + investments permanently restricted net assets) / ((total operating expenses depreciation and amortization) / cumulative days). (6) Cushion ratio = (cash and cash equivalents + investments + trustee-held funds) / annual debt service. 25
Sisters of Charity of Leavenworth Health System, Inc. Years Ended December 31, 2017 and 2016 With Reports of Independent Auditors
 C ONSOLIDATED F INANCIAL S TATEMENTS AND S UPPLEMENTARY I NFORMATION Years Ended December 31, 2017 and 2016 With Reports of Independent Auditors Ernst & Young LLP Consolidated Financial Statements and
Quarterly Report For the Period Ending 9/30/14
 This Document is Dated as of November 24, 2014. SPECIAL NOTE CONCERNING FORWARD-LOOKING STATEMENTS: Certain of the discussions included in the Management Discussion and Analysis section of the following
MultiCare Health System Year End 2012 Results December 31, 2012
 MultiCare Health System Year End 2012 Results December 31, 2012 MultiCare Health System (MHS), a Washington nonprofit corporation, is an integrated healthcare delivery system providing inpatient, outpatient,
Third Quarter Fiscal Year Financial Report (Unaudited Statements)
") Bond Long Term Rating Standard and Poor s AA-/Stable FITCH Investors Service AA/Stable Third Quarter Fiscal Year Financial Report (Unaudited Statements) Cone Health is an integrated health care delivery
Bond Long Term Rating Standard and Poor s AA-/Stable FITCH Investors Service AA/Stable Third Quarter Fiscal Year Financial Report (Unaudited Statements) Cone Health is an integrated health care delivery
Third Quarter Fiscal Year 2017 Financial Report (Unaudited Statements)
") Bond Long Term Rating Standard and Poor s AA/Negative FITCH Investors Service AA/Stable Third Quarter Fiscal Year 2017 Financial Report (Unaudited Statements) Cone Health is an integrated health care delivery
Bond Long Term Rating Standard and Poor s AA/Negative FITCH Investors Service AA/Stable Third Quarter Fiscal Year 2017 Financial Report (Unaudited Statements) Cone Health is an integrated health care delivery
Banner Health Management s Discussion and Analysis of Results of Operations and Financial Position
 Banner Health Management s Discussion and Analysis of Results of Operations and Financial Position The preparation of financial statements in conformity with accounting principles generally accepted in
First Quarter Fiscal Year Financial Report (Unaudited Statements)
") Bond Long Term Rating Standard and Poor s AA/Negative FITCH Investors Service AA/Stable First Quarter Fiscal Year Financial Report (Unaudited Statements) Cone Health is an integrated health care delivery
Bond Long Term Rating Standard and Poor s AA/Negative FITCH Investors Service AA/Stable First Quarter Fiscal Year Financial Report (Unaudited Statements) Cone Health is an integrated health care delivery
Fairview Health Services Years Ended December 31, 2016, 2015, and 2014 With Report of Independent Auditors
 C ONSOLIDATED F INANCIAL S TATEMENTS Fairview Health Services Years Ended December 31, 2016, 2015, and 2014 With Report of Independent Auditors Ernst & Young LLP Consolidated Financial Statements Years
cfp Premier Health May 14,2015
 cfp Premier Health Prem ier Health Center 110 N. Main St. Dayton, Oh io 45402 prem ierhealt h.co m May 14,2015 Enclosed are the unaudited Consolidated Financial Statements for MedAmerica Health Systems
Advocate Health Care Network and Subsidiaries FINANCIAL REPORT
 Advocate Health Care Network and Subsidiaries FINANCIAL REPORT For the First Quarter Ended March 31, 2018 Cautionary Statement Regarding Forward Looking Statements in this Quarterly Financial Report This
Advocate Health Care Network and Subsidiaries FINANCIAL REPORT
 Advocate Health Care Network and Subsidiaries FINANCIAL REPORT For the Third Quarter Ended September 30, 2017 Cautionary Statement Regarding Forward Looking Statements in this Quarterly Financial Report
September 30, 2018 Fiscal Year Financial Report (Unaudited Statements)
") Bond Long Term Rating Standard and Poor s AA-/Stable FITCH Investors Service AA/Stable September 30, 2018 Fiscal Year Financial Report (Unaudited Statements) Cone Health is an integrated health care delivery
Bond Long Term Rating Standard and Poor s AA-/Stable FITCH Investors Service AA/Stable September 30, 2018 Fiscal Year Financial Report (Unaudited Statements) Cone Health is an integrated health care delivery
McLEOD HEALTH FINANCIAL INFORMATION FOR CONSOLIDATED & OBLIGATED GROUP FOURTH QUARTER REPORT TWELVE MONTHS ENDED SEPTEMBER 30, 2012 AND 2011
 McLEOD HEALTH FINANCIAL INFORMATION FOR CONSOLIDATED & OBLIGATED GROUP FOURTH QUARTER REPORT TWELVE MONTHS ENDED SEPTEMBER 30, 2012 AND 2011 Note: These unaudited financial statements have been prepared
September 30, 2017 Fiscal Year Financial Report (Audited Statements)
") Bond Long Term Rating Standard and Poor s AA/Negative FITCH Investors Service AA/Stable September 30, 2017 Fiscal Year Financial Report (Audited Statements) Cone Health is an integrated health care delivery
Bond Long Term Rating Standard and Poor s AA/Negative FITCH Investors Service AA/Stable September 30, 2017 Fiscal Year Financial Report (Audited Statements) Cone Health is an integrated health care delivery
Advocate Health Care Network and Subsidiaries FINANCIAL REPORT
 Advocate Health Care Network and Subsidiaries FINANCIAL REPORT For the Second Quarter Ended June 30, 2017 Cautionary Statement Regarding Forward Looking Statements in this Quarterly Financial Report This
For The Period. The Cleveland
 Interim Unaudited Consolidated Financial Statements and Other Information For The Period Ended June 30, 2013 The Cleveland Clinic Foundation d.b. a. Cleveland Clinic Health System INTERIM UNAUDITED CONSOLIDATED
Banner Health Management s Discussion and Analysis of Results of Operations and Financial Position
 Banner Health Management s Discussion and Analysis of Results of Operations and Financial Position The preparation of financial statements in conformity with accounting principles generally accepted in
Advocate Health Care Network and Subsidiaries FINANCIAL REPORT
 Advocate Health Care Network and Subsidiaries FINANCIAL REPORT For the Fourth Quarter and Year Ended December 31, 2017 Cautionary Statement Regarding Forward Looking Statements in this Quarterly Financial
CentraCare Health. Consolidated Financial and Compliance Report With Independent Auditor s Reports Thereon June 30, 2017 and 2016
 Consolidated Financial and Compliance Report With Independent Auditor s Reports Thereon June 30, 2017 and 2016 Contents Independent auditor s report 1-2 Financial statements Consolidated balance sheets
Banner Health Management s Discussion and Analysis of Results of Operations and Financial Position
 Banner Health Management s Discussion and Analysis of Results of Operations and Financial Position The preparation of financial statements in conformity with accounting principles generally accepted in
Ascension Health Alliance Years Ended June 30, 2012 and 2011 With Reports of Independent Auditors
 C ONSOLIDATED F INANCIAL S TATEMENTS AND S UPPLEMENTARY I NFORMATION Ascension Health Alliance Years Ended June 30, 2012 and 2011 With Reports of Independent Auditors Consolidated Financial Statements
C ONSOLIDATED F INANCIAL S TATEMENTS AND O THER F INANCIAL I NFORMATION
 C ONSOLIDATED F INANCIAL S TATEMENTS AND O THER F INANCIAL I NFORMATION CAMC Health System, Inc. and Subsidiaries Years Ended December 31, 2008 and 2007 With Report of Independent Auditors Ernst & Young
Advocate Health Care Network and Subsidiaries Years Ended December 31, 2017 and 2016 With Reports of Independent Auditors
 C ONSOLIDATED FINANCIAL STATEMENTS AND SUPPLEMENTARY INFORMATION Advocate Health Care Network and Subsidiaries Years Ended December 31, 2017 and 2016 With Reports of Independent Auditors Consolidated Financial
North Shore-Long Island Jewish Health System, Inc. (North Shore-LIJ)
") North Shore-Long Island Jewish Health System, Inc. (North Shore-LIJ) ANNUAL FINANCIAL INFORMATION AND OPERATING DATA FOR THE YEAR ENDED DECEMBER 31, 2013 Contents Management s Discussion and Analysis of
North Shore-Long Island Jewish Health System, Inc. (North Shore-LIJ) ANNUAL FINANCIAL INFORMATION AND OPERATING DATA FOR THE YEAR ENDED DECEMBER 31, 2013 Contents Management s Discussion and Analysis of
DEBT SERVICE COVERAGE (1) (dollars in thousands)
 (dollars in thousands)") HISTORICAL COVERAGE OF PRO FORMA DEBT SERVICE The following table presents, for the fiscal years ended September 30, 2012, 2013 and 2014, the System s income available to pay debt service on the indebtedness
HISTORICAL COVERAGE OF PRO FORMA DEBT SERVICE The following table presents, for the fiscal years ended September 30, 2012, 2013 and 2014, the System s income available to pay debt service on the indebtedness
Quarterly Report As of March 31, 2018 and for the three and nine months ended March 31, 2018 and 2017
 Quarterly Report As of March 31, 2018 and for the three and nine months ended March 31, 2018 and 2017 Information Concerning Catholic Health Initiatives Table of Contents PART I: OVERVIEW... 1 PART II:
^asasssss-- MANAGEMENT'S DISCUSSION AND ANALYSIS AND BASIC FINANCIAL STATEMENTS. Release Date. H'
 MANAGEMENT'S DISCUSSION AND ANALYSIS AND BASIC FINANCIAL STATEMENTS Hospital Service District No. 1 of the Parish of Tangipahoa, State of Louisiana Years Ended June 30, 2006 and 2005 ^asasssss-- Release
Interim Unaudited Consolidated Financial Statements and Other Information
 Interim Unaudited Consolidated Financial Statements and Other Information For The Period Ended March 31, 2017 The Cleveland Clinic Foundation d.b.a. Cleveland Clinic Health System INTERIM UNAUDITED CONSOLIDATED
OhioHealth Corporation
 OhioHealth Corporation Financial Results for the Quarter Ended March 31, 2015 Unaudited Management's Discussion and Analysis of Financial Condition and Recent Financial Performance For the quarter ended
Fairview Health Services Years Ended December 31, 2017, 2016, and 2015 With Report of Independent Auditors
 C ONSOLIDATED F INANCIAL S TATEMENTS Fairview Health Services Years Ended December 31, 2017, 2016, and 2015 With Report of Independent Auditors Ernst & Young LLP Consolidated Financial Statements Years
Advocate Health Care Network and Subsidiaries FINANCIAL REPORT
 Advocate Health Care Network and Subsidiaries FINANCIAL REPORT For the First Quarter Ended March 31, 2017 Cautionary Statement Regarding Forward Looking Statements in this Quarterly Financial Report This
CAMC Health System, Inc. and Subsidiaries
 CAMC Health System, Inc. and Subsidiaries Consolidated Financial Statements and Other Financial Information as of and for the Years Ended December 31, 2014 and 2013, and Independent Auditors Report CAMC
SARASOTA COUNTY PUBLIC HOSPITAL DISTRICT
 FINANCIAL STATEMENTS (UNAUDITED) AS OF, AND FOR THE THREE MONTHS ENDED DECEMBER 31, 2008 MANAGEMENT S DISCUSSION AND ANALYSIS FOR THE THREE MONTHS ENDED DECEMBER 31, 2008 For the three months ended December
CONSOLIDATED FINANCIAL STATEMENTS AND OTHER INFORMATION INDIANA UNIVERSITY HEALTH, INC. AND SUBSIDIARIES AS OF AND FOR THE THREE MONTHS AND YEARS
 CONSOLIDATED FINANCIAL STATEMENTS AND OTHER INFORMATION INDIANA UNIVERSITY HEALTH, INC. AND SUBSIDIARIES AS OF AND FOR THE THREE MONTHS AND YEARS ENDED DECEMBER 31, 2012 AND 2011 TABLE OF CONTENTS Management
I N T E R I M U N A U D I T E D C O N S O L I D A T E D F I N A N C I A L S T A T E M E N T S A N D S U P P L E M E N T A R Y I N F O R M A T I O N
 I N T E R I M U N A U D I T E D C O N S O L I D A T E D F I N A N C I A L S T A T E M E N T S A N D S U P P L E M E N T A R Y I N F O R M A T I O N Baptist Health Care Corporation and Subsidiaries For
QUARTERLY REPORT ORLANDO HEALTH, INC. Quarter Ended December 31, 2018
 QUARTERLY REPORT ORLANDO HEALTH, INC. Quarter Ended Filed by: Address: 1414 Kuhl Avenue Orlando, FL 32806 Contact: John Miller, Vice President, Finance Contents Interim Consolidated Financial Statements
Interim Unaudited Consolidated Financial Statements and Other Information
 Interim Unaudited Consolidated Financial Statements and Other Information For The Period Ended March 31, 2018 The Cleveland Clinic Foundation d.b.a. Cleveland Clinic Health System INTERIM UNAUDITED CONSOLIDATED
Jennie Stuart Medical Center, Inc.
 Independent Auditor s Report and Consolidated Financial Statements Contents Independent Auditor s Report... 1 Consolidated Financial Statements Balance Sheets... 3 Statements of Operations... 4 Statements
Quarterly Report As of December 31, 2017 and for the three and six months ended December 31, 2017 and 2016
 Quarterly Report As of December 31, 2017 and for the three and six months ended December 31, 2017 and 2016 Information Concerning Catholic Health Initiatives Table of Contents PART I: OVERVIEW... 1 PART
Trinity Health FY18 Annual Operating Income Jumps More Than 50% Over Prior Year
 Trinity Health FY18 Annual Operating Income Jumps More Than 50% Over Prior Year Summary Highlights for the Year-Ended June 30, 2018 Trinity Health reported operating income before other items of $401.3
CAMC Health System, Inc. and Subsidiaries
 CAMC Health System, Inc. and Subsidiaries Consolidated Financial Statements and Other Financial Information as of and for the Years Ended December 31, 2016 and 2015, and Independent Auditors Report CAMC
Verity Health System of California, Inc. Unaudited Financial Report and Utilization Statistics For the Twelve Months Ended June 30, 2018
 Verity Health System of California, Inc. Unaudited Financial Report and Utilization Statistics For the Twelve Months Ended June 30, 2018 Verity Health System of California, Inc. Page Ref Management's Discussion
2012 Financial Report
 2012 Financial Report Introduction Catholic Health Initiatives (CHI s) operating performance during the fiscal year ended June 30, 2012, was positive. Acquisitions and partnerships created during the year
Advocate Health Care Network and Subsidiaries Years Ended December 31, 2016 and 2015 With Reports of Independent Auditors
 C ONSOLIDATED F INANCIAL S TATEMENTS AND S UPPLEMENTARY I NFORMATION Advocate Health Care Network and Subsidiaries Years Ended December 31, 2016 and 2015 With Reports of Independent Auditors Consolidated
Beaumont Health and Consolidated Subsidiaries
 Beaumont Health and Consolidated Subsidiaries Consolidated Financial Statements as of and for the Years Ended December 31, 2017 and 2016, and Independent Auditors Report BEAUMONT HEALTH AND CONSOLIDATED
Children s Healthcare of Atlanta Inc. and Affiliates. Interim Financial Statements March 31, 2014
 Children s Healthcare of Atlanta Inc. and Affiliates Interim Financial Statements March 31, 2014 CHILDREN S HEALTHCARE OF ATLANTA, INC. AND AFFILIATES Unaudited Consolidated Financial Statements for the
Mercy Health Quarterly Financial Report. As of and for the three months ended December 31, 2018 and 2017
 Mercylit Quarterly Financial Report As of and for the three months ended December 31, 2018 and 2017 Contents: - Consolidated Financial Statements (Unaudited) - Management Discussion & Analysis Consolidated
FINANCIAL REPORT (UNAUDITED) FOR THE SIX MONTHS ENDED
 FOR THE SIX MONTHS ENDED") FINANCIAL REPORT (UNAUDITED) FOR THE SIX MONTHS ENDED JUNE 30, 2018 ATRIUM HEALTH FINANCIAL REPORT FOR THE SIX MONTHS ENDED JUNE 30, 2018 INDEX Page Financial Highlights 1-3 Comparative Balance Sheet 4
FINANCIAL REPORT (UNAUDITED) FOR THE SIX MONTHS ENDED JUNE 30, 2018 ATRIUM HEALTH FINANCIAL REPORT FOR THE SIX MONTHS ENDED JUNE 30, 2018 INDEX Page Financial Highlights 1-3 Comparative Balance Sheet 4
The Guthrie Clinic Financial Highlights for the Three and Six Months Ended December 31, 2017
 Financial Highlights for the Three and Six Months Ended December 31, 2017 I. Introduction In accordance with the provisions of the Master Indenture relating to the 2011 and 2007 Guthrie Health Bonds, enclosed
Annual Report For the Period Ended June 30, 2014
 This Document is Dated as of October 13, 2014. SPECIAL NOTE CONCERNING FORWARD-LOOKING STATEMENTS: Certain of the discussions included in the Management Discussion and Analysis section of the following
MERITER HOSPITAL, INC. Consolidated Financial Statements. December 31, 2013 and (With Independent Auditors Report Thereon)
") Consolidated Financial Statements (With Independent Auditors Report Thereon) Table of Contents Page Independent Auditors Report 1 Consolidated Balance Sheets 3 Consolidated Statements of Unrestricted Revenues,
Consolidated Financial Statements (With Independent Auditors Report Thereon) Table of Contents Page Independent Auditors Report 1 Consolidated Balance Sheets 3 Consolidated Statements of Unrestricted Revenues,
Atrium Health System and Subsidiaries. Consolidated Balance Sheet (Unaudited)
") Consolidated Balance Sheet At June 30, At December 31, Assets Current assets: Cash and short-term investments $ 12,364 $ 11,242 Accounts receivable, net of allowances 33,702 30,213 Inventories 2,231 1,991
Consolidated Balance Sheet At June 30, At December 31, Assets Current assets: Cash and short-term investments $ 12,364 $ 11,242 Accounts receivable, net of allowances 33,702 30,213 Inventories 2,231 1,991
Quarterly Report As of December 31, 2018, and for the three and six months ended December 31, 2018 and 2017
 Quarterly Report As of December 31, 2018, and for the three and six months ended December 31, 2018 and 2017 Information Concerning Table of Contents PART I: OVERVIEW... 1 PART II: Q2 & FYTD 2019 HIGHLIGHTS
Quarterly Disclosure Report. For Six Months Ended December 31, (Unaudited)
") Quarterly Disclosure Report For Six Months Ended December 31, 2008 (Unaudited) Contacts: Mark Amiri Frederick Savelsbergh Vice President and Treasurer Senior Vice President of Hospital Finance and 214-820-2538
Quarterly Disclosure Report For Six Months Ended December 31, 2008 (Unaudited) Contacts: Mark Amiri Frederick Savelsbergh Vice President and Treasurer Senior Vice President of Hospital Finance and 214-820-2538
DUKE UNIVERSITY HEALTH SYSTEM, INC. AND AFFILIATES
 Consolidated Financial Statements March 31, 2018 and 2017 (Unaudited) Prepared by: Duke University Health System Finance Print Date: April 24, 2018 Consolidated Balance Sheets (Unaudited) March 31, 2018
Advocate Health Care Network and Subsidiaries Years Ended December 31, 2015 and 2014 With Reports of Independent Auditors
 C ONSOLIDATED F INANCIAL S TATEMENTS AND S UPPLEMENTARY I NFORMATION Years Ended December 31, 2015 and 2014 With Reports of Independent Auditors Ernst & Young LLP Consolidated Financial Statements and
WHEATON FRANCISCAN SERVICES, INC. Consolidated Financial Statements and Supplementary Information. June 30, 2010 and 2009
 Consolidated Financial Statements and Supplementary Information (With Independent Auditors Report Thereon) Table of Contents Independent Auditors Report 1 Consolidated Balance Sheets 2 Consolidated Statements
St. Anthony s Medical Center and Affiliates
 Auditor s Report and Consolidated Financial Statements Contents Independent Auditor s Report... 1 Consolidated Financial Statements Balance Sheets... 3 Statements of Operations and Changes in Net Assets...
Interim Unaudited Consolidated Financial Statements and Other Information
 Interim Unaudited Consolidated Financial Statements and Other Information For The Period Ended June 30, 2016 The Cleveland Clinic Foundation d.b.a. Cleveland Clinic Health System INTERIM UNAUDITED CONSOLIDATED
Interim Unaudited Consolidated Financial Statements and Other Information
 Interim Unaudited Consolidated Financial Statements and Other Information For The Period Ended September 30, 2017 The Cleveland Clinic Foundation d.b.a. Cleveland Clinic Health System INTERIM UNAUDITED
Financial Statements and Report of Independent Certified Public Accountants. AU Medical Center, Inc. (a component unit of AU Health System, Inc.
 Financial Statements and Report of Independent Certified Public Accountants AU Medical Center, Inc. June 30, 2017 and 2016 AU Medical Center, Inc. Table of contents Management s discussion and analysis
NORTH MISSISSIPPI MEDICAL CENTER, INC., CLAY COUNTY MEDICAL CORPORATION, AND WEBSTER HEALTH SERVICES, INC. (The Obligated Group)
") Combined Financial Statements (With Independent Auditors Report Thereon) KPMG LLP Suite 1100 One Jackson Place 188 East Capitol Street Jackson, MS 39201-2127 Independent Auditors Report The Board of Directors
Combined Financial Statements (With Independent Auditors Report Thereon) KPMG LLP Suite 1100 One Jackson Place 188 East Capitol Street Jackson, MS 39201-2127 Independent Auditors Report The Board of Directors
Northwest Community Healthcare and Subsidiaries Quarter Ended June 30, 2016 UNAUDITED CONSOLIDATED FINANCIAL STATEMENTS
 CONSOLIDATED FINANCIAL STATEMENTS AND OTHER FINANCIAL INFORMATION Northwest Community Healthcare and Subsidiaries Quarter Ended June 30, 2016 UNAUDITED Northwest Community Healthcare and Subsidiaries Consolidated
Pocono Health System. Independent Auditor s Report and Consolidated Financial Statements
 Independent Auditor s Report and Consolidated Financial Statements Contents Independent Auditor s Report... 1 Consolidated Financial Statements Balance Sheets... 3 Statements of Operations and Changes
Northwell Health, Inc.
 Northwell Health, Inc. MANAGEMENT S DISCUSSION AND ANALYSIS OF FINANCIAL PERFORMANCE FOR THE NINE MONTHS ENDED SEPTEMBER 30, 2016 and 2015 Management s Discussion and Analysis of Recent Financial Performance
NONOPERATING ITEMS: MidMichigan Health s investment income of $3.3 million increased compared to $2.6 million a year ago.
 4000 Wellness Drive Midland, Michigan 48670 Phone (989) 839-3181 Francine.Padgett@midmichigan.org Subject: Continuing Disclosure Filing for MidMichigan Health Period Ended: Nine-month Period Ended March
GREAT RIVER MEDICAL CENTER, GRMC FOUNDATION AND GREAT RIVER FOUNDATION, INC. COMBINED FINANCIAL STATEMENTS YEARS ENDED JUNE 30, 2011 AND 2010
 GREAT RIVER MEDICAL CENTER, GRMC FOUNDATION AND COMBINED FINANCIAL STATEMENTS YEARS ENDED TABLE OF CONTENTS YEARS ENDED INDEPENDENT AUDITORS' REPORT 1 COMBINED FINANCIAL STATEMENTS COMBINED BALANCE SHEETS
QUARTERLY REPORT CONCERNING CATHOLIC HEALTH INITIATIVES
 QUARTERLY REPORT CONCERNING CATHOLIC HEALTH INITIATIVES AND THE CHI REPORTING GROUP This Quarterly Report should be reviewed in conjunction with the information contained in the Annual Report dated October
Interim Unaudited Consolidated Financial Statements and Other Information
 Interim Unaudited Consolidated Financial Statements and Other Information For The Period Ended September 30, 2018 The Cleveland Clinic Foundation d.b.a. Cleveland Clinic Health System INTERIM UNAUDITED
MUNROE REGIONAL HEALTH SYSTEM, INC. d/b/a MUNROE REGIONAL MEDICAL CENTER FOR THE ACCOUNT OF MARION COUNTY HOSPITAL DISTRICT
 Consolidated Financial Statements (With Independent Auditors Report Thereon) Table of Contents Pages Independent Auditors Report 1 Consolidated Financial Statements: Consolidated Balance Sheets 2 Consolidated
Baptist Health Care Corporation and Subsidiaries Years Ended September 30, 2014 and 2013 With Report of Independent Certified Public Accountants
 C ONSOLIDATED F INANCIAL S TATEMENTS AND S UPPLEMENTARY I NFORMATION Years Ended September 30, 2014 and 2013 With Report of Independent Certified Public Accountants Ernst & Young LLP Consolidated Financial
Robinson Memorial Portage County Hospital and Affiliates. Financial Report December 31, 2012
 Robinson Memorial Portage County Hospital Financial Report December 31, 2012 Contents Report Letter 1-3 Management s Discussion and Analysis 4-15 Financial Statements Statement of Financial Position 16
Annual Report For the Fiscal Year Ending 6/30/15
 This Document is Dated as of October 1, 2015. SPECIAL NOTE CONCERNING FORWARD-LOOKING STATEMENTS: Certain of the discussions included in the Management Discussion and Analysis section of the following
Ascension Health Alliance Years Ended June 30, 2013 and 2012 With Reports of Independent Auditors
 C ONSOLIDATED F INANCIAL S TATEMENTS AND S UPPLEMENTARY I NFORMATION Ascension Health Alliance Years Ended June 30, 2013 and 2012 With Reports of Independent Auditors Consolidated Financial Statements
Northwest Community Healthcare and Subsidiaries Quarter Ended December 31, 2014 UNAUDITED
 CONSOLIDATED FINANCIAL STATEMENTS AND OTHER FINANCIAL INFORMATION Northwest Community Healthcare and Subsidiaries Quarter Ended December 31, 2014 UNAUDITED Northwest Community Healthcare and Subsidiaries
Hunterdon Medical Center
 . c o m Financial Statements [Type text] Table of Contents Page Independent Auditors Report 1 Financial Statements Balance Sheet 3 Statement of Operations 4 Statement of Changes in Net Assets 5 Statement
Lakewood Hospital Association Years Ended December 31, 2013 and 2012 With Report of Independent Auditors
 A UDITED F INANCIAL S TATEMENTS Lakewood Hospital Association Years Ended December 31, 2013 and 2012 With Report of Independent Auditors Ernst & Young LLP Audited Financial Statements Years Ended December
C ONSOLIDATED F INANCIAL S TATEMENTS
 C ONSOLIDATED F INANCIAL S TATEMENTS AND S UPPLEMENTARY I NFORMATION Baptist Health Care Corporation and Subsidiaries Years Ended September 30, 2013 and 2012 With Reports of Independent Certified Public
Iowa Health System and Subsidiaries d/b/a UnityPoint Health
 Independent Auditor s Report and Consolidated Financial Statements Contents Independent Auditor s Report... 1 Consolidated Financial Statements Balance Sheets... 3 Statements of Operations... 5 Statements
Baptist Memorial Health Care Corporation and Affiliates
 Baptist Memorial Health Care Corporation and Affiliates Combined Financial Statements as of and for the Years Ended September 30, 2013 and 2012, and Independent Auditors Report INDEPENDENT AUDITORS REPORT
Quarterly Report As of December 31, 2018 and for the three and six months ended December 31, 2018
 Quarterly Report As of December 31, 2018 and for the three and six months ended December 31, 2018 Table of Contents Part I: Overview... 1 Part II: Leadership Changes... 1 Part III: Strategic Acquisitions...
Bronson Methodist Hospital. Financial Report December 31, 2014
 Financial Report December 31, 2014 Contents Report Letter 1 Financial Statements Balance Sheet 2 Statement of Operations and Changes in Net Assets 3 Statement of Cash Flows 4 5-23 Independent Auditor's
CENTEGRA HEALTH SYSTEM AND AFFILIATES CONSOLIDATING STATEMENT OF REVENUE AND EXPENSES FOR THE TWELVE MONTHS ENDED JUNE 30, 2017 Unaudited
 CONSOLIDATING STATEMENT OF REVENUE AND EXPENSES FOR THE TWELVE MONTHS ENDED JUNE 30, 2017 HOSPITAL THE CENTEGRA HEALTH BRIDGE CLINICAL CHWN GROUP FOUNDATION NIMED COMBINED LAB CMS CPC COMBINED CIS ELIMINATIONS
Aurora Health Care, Inc. and Affiliates. Unaudited Consolidated Financial Statements and Other Information For the Period Ended March 31, 2016
 Aurora Health Care, Inc. and Affiliates Unaudited Consolidated Financial Statements and Other Information For the Period Ended March 31, 2016 Document Dated as of May 27, 2016 AURORA HEALTH CARE, INC.
LAHEY HEALTH SYSTEM F i n a n c i a l S t a t e m e n t D i s c u s s i o n a n d A n a l y s i s. For the Six Months Ended March 31, 2017
 LAHEY HEALTH SYSTEM F i n a n c i a l S t a t e m e n t D i s c u s s i o n a n d A n a l y s i s For the Six Months Ended March 31, 2017 Introduction The attached combined financial statements of Lahey
Annual Report For the Period Ending 6/30/12
 This Document is Dated as of November 1, 2012. SPECIAL NOTE CONCERNING FORWARD-LOOKING STATEMENTS: Certain of the discussions included in the Management Discussion and Analysis section of the following
MANAGEMENT'S DISCUSSION AND ANALYSIS AND BASIC FINANCIAL STATEMENTS
 MANAGEMENT'S DISCUSSION AND ANALYSIS AND BASIC FINANCIAL STATEMENTS West Jefferson Medical Center Years ended December 31,2004 and 2003 Under provisions of state law. this report is a public document,
Butler Health System and Subsidiaries. Consolidated Financial Statements June 30, 2012
 Butler Health System and Subsidiaries Consolidated Financial Statements June 30, 2012 C O N T E N T S INDEPENDENT AUDITORS REPORT 1 CONSOLIDATED FINANCIAL STATEMENTS Consolidated balance sheets 2-3 Consolidated
I N T E R I M U N A U D I T E D C O N S O L I D A T E D F I N A N C I A L S T A T E M E N T S A N D S U P P L E M E N T A R Y I N F O R M A T I O N
 I N T E R I M U N A U D I T E D C O N S O L I D A T E D F I N A N C I A L S T A T E M E N T S A N D S U P P L E M E N T A R Y I N F O R M A T I O N Baptist Health Care Corporation and Subsidiaries For
Northwell Health, Inc.
 Northwell Health, Inc. MANAGEMENT S DISCUSSION AND ANALYSIS OF FINANCIAL PERFORMANCE FOR THE THREE MONTHS ENDED MARCH 31, 2016 and 2015 Management s Discussion and Analysis of Recent Financial Performance
PUBLIC HOSPITAL DISTRICT NO. 1 OF KING COUNTY VALLEY MEDICAL CENTER Management s Discussion and Analysis September 30, 2012 and 2011 (unaudited)
") PUBLIC HOSPITAL DISTRICT NO. 1 OF KING COUNTY VALLEY MEDICAL CENTER Management s Discussion and Analysis 30, 2012 and 2011 Public Hospital District No. 1 of King County, Washington (the District), doing
PUBLIC HOSPITAL DISTRICT NO. 1 OF KING COUNTY VALLEY MEDICAL CENTER Management s Discussion and Analysis 30, 2012 and 2011 Public Hospital District No. 1 of King County, Washington (the District), doing
Children s Hospital of Wisconsin, Inc. and Children s Hospital and Health System Foundation, Inc.
 Children s Hospital of Wisconsin, Inc. and Children s Hospital and Health System Foundation, Inc. Combined Financial Statements as of and for the Years Ended December 31, 2011 and 2010, Combining Information
SANTA CLARA COUNTY FINANCING AUTHORITY (A Component Unit of the County of Santa Clara, California)
") SANTA CLARA COUNTY FINANCING AUTHORITY (A Component Unit of the County of Santa Clara, California) Independent Auditor s Reports, Management s Discussion and Analysis and Basic Financial Statements Table
SANTA CLARA COUNTY FINANCING AUTHORITY (A Component Unit of the County of Santa Clara, California) Independent Auditor s Reports, Management s Discussion and Analysis and Basic Financial Statements Table
S PECIAL-PURPOSE F INANCIAL S TATEMENTS
 S PECIAL-PURPOSE F INANCIAL S TATEMENTS Years Ended December 31, 2009 and 2008 With Report of Independent Auditors Special-Purpose Financial Statements Years Ended December 31, 2009 and 2008 Contents Report
MCG Health, Inc. d/b/a Georgia Regents Medical Center (a component unit of MCG Health System, Inc.)
") Financial Statements and Report of Independent Certified Public Accountants MCG Health, Inc. d/b/a Georgia Regents Medical Center June 30, 2015 and 2014 MCG Health, Inc. Table of contents Management s
Financial Statements and Report of Independent Certified Public Accountants MCG Health, Inc. d/b/a Georgia Regents Medical Center June 30, 2015 and 2014 MCG Health, Inc. Table of contents Management s
MEDICAL UNIVERSITY HOSPITAL AUTHORITY (A Component Unit of The Medical University of South Carolina)
") Basic Financial Statements and Required Supplementary Information (With Independent Auditors Report Thereon) Table of Contents Management s Discussion and Analysis Required Supplementary Information (Unaudited)
Basic Financial Statements and Required Supplementary Information (With Independent Auditors Report Thereon) Table of Contents Management s Discussion and Analysis Required Supplementary Information (Unaudited)
Banner Health and Subsidiaries Years Ended December 31, 2015 and 2014 With Report of Independent Auditors
 C ONSOLIDATED F INANCIAL S TATEMENTS Banner Health and Subsidiaries Years Ended December 31, 2015 and 2014 With Report of Independent Auditors Ernst & Young LLP Consolidated Financial Statements Years
DUKE UNIVERSITY HEALTH SYSTEM, INC. AND AFFILIATES
 Consolidated Financial Statements December 31, 2017 and 2016 (Unaudited) Prepared by: Duke University Health System Finance Print Date: January 17, 2018 Consolidated Balance Sheets (Unaudited) December
CAMC Health System, Inc. and Subsidiaries
 CAMC Health System, Inc. and Subsidiaries Consolidated Financial Statements and Other Financial Information as of and for the Years Ended December 31, 2012 and 2011, and Independent Auditors Report CAMC
Trinity Health Operating Income continues to climb in Q1 FY19
 Trinity Health Operating Income continues to climb in Q1 FY19 Summary Highlights for the First Quarter of FY19 (Quarter Ended September 30, 2018) In the first quarter of fiscal year 2019, Trinity Health