Towards sustainable partnerships
|
|
|
- Cory Snow
- 6 years ago
- Views:
Transcription

1 KUMBA IRON ORE ANNUAL FINANCIAL STATEMENTS 2011 Towards sustainable partnerships

2 Towards sustainable partnerships CONTENTS ii ii Approach and overview Kumba at a glance 1 Integrated reporting 2 Financial review 10 Audited annual financial statements 10 Directors responsibility for financial reporting FRONT COVER: A GOOD EXAMPLE OF SUSTAINABLE PARTNERSHIPS Sarel Le Roux, a master electrician, and Clayton Mora, an electrical engineer, are shown on the cover photograph, conducting their final inspections together on the newly commissioned reclaimer at Kolomela mine. Kolomela mine was brought into commercial production in December 2011, within budget and ahead of schedule. Working partnerships like this one between Sarel and Clayton have been a critical feature of the success story so far at Kolomela mine, and indeed throughout the Kumba group. In this environment of partnership, the company has been able to achieve strong financial success for the year and a solid platform for growth in the year ahead. It is with this in mind that we introduce our suite of reports for 2011 with the theme: Towards sustainable partnerships. 11 Certificate of the company secretary 12 Independent auditor s report 13 Directors report 17 Report of the Audit Committee 19 Remuneration report 27 Principal accounting policies 38 Group balance sheet 39 Group income statement 39 Group statement of comprehensive income 40 Group statement of changes in equity 41 Group cash flow statement 42 Group Notes to the financial statements 69 Company balance sheet 70 Company income statement 70 Company statement of changes in equity 71 Company cash flow statement Integrated Report 2011 Annual Financial Statements 2011 Sustainable Development Report Company Notes to the financial statements 76 Annexures 76 Annexure 1: Investments in subsidiaries 77 Annexure 2: Investments in associates, joint ventures and other investments 78 Annexure 3: Share-based payments Abridged Integrated Report 2011 Kumba Online Report reports/kumba_ar2011/index.php 82 Annexure 4: Balance sheet: US dollar convenience translation Look out for important references KPI Key performance indicator IR See the corresponding page/s in our Integrated Report SD See the corresponding page/s in our Sustainable Development Report www See the website 83 Annexure 5: Income statement: US dollar convenience translation 84 Corporate information 84 Shareholder analysis 85 Breakdown of non-public holdings 86 Administration Annual Financial Statements 2011 i
3 KUMBA AT A GLANCE BROAD AND MEANINGFUL OWNERSHIP AT ALL LEVELS OUR OPERATIONS 4a 4d 4c 4e 4b 3b Thabazimbi mine Sishen mine Kolomela mine 2c Limpopo 3a 1 2 North West 1 Gauteng Mpumalanga 1 2 Corporate office Centurion (South Africa) Mines a. Sishen mine b. Kolomela mine c. Thabazimbi mine 3 4 Port operations a. Saldanha Bay (South Africa) b. Qingdao (China) Exports a. Western Europe b. China c. Japan d. South Korea e. The Middle East 3a 2a 2b Northern Cape Western Cape SOUTH AFRICA Free State KwaZulu- Natal Eastern Cape KUMBA IRON ORE LIMITED GROUP STRUCTURE Industrial Development Corp 12.9% Anglo American plc 65.2% Minority interests 21.9% KUMBA IRON ORE LIMITED 73.9% Public Investment Corp 4.3% BEE OWNERSHIP 26.1% Exxaro Resources Limited: 19.98% SIOC Community Development Trust: 3% SIOC Employee Share Participation Scheme (Envision): 3.1% SISHEN IRON ORE COMPANY OPERATIONS Sishen mine Thabazimbi mine Kolomela mine Saldanha Bay port operations ii Kumba Iron Ore Limited
4 EXPORT DESTINATIONS AND EXPORT VOLUMES 13% 68% 18% 1% Kumba Iron Ore Limited (Kumba or the group), a member of the Anglo American plc Group, is a leading value-adding supplier of high-quality iron ore to the global steel industry. With its headquarters in Centurion, South Africa, the group holds a 73.9% interest in and manages Sishen Iron Ore Company (Pty) Limited (SIOC) which, in turn, has three mining operations: s 3ISHEN MINE LOCATED NEAR THE TOWN OF +ATHU IN.ORTHERN Cape Province; s 4HABAZIMBI MINE SITUATED IN THE TOWN OF 4HABAZIMBI IN,IMPOPO Province; and s +OLOMELA MINE A NEW DEVELOPMENT IN THE VICINITY OF 0OSTMASBURG in Northern Cape Province, which was brought into commercial production in December 2011 and is anticipated to produce between 4 million tonnes (Mt) and 5Mt while ramping up in 2012, before reaching design capacity of 9 million tonnes per annum (Mtpa) in Both the Sishen and Kolomela mines are long-life operations with current life of mine (LOM) estimates, of 21 years and 27 years RESPECTIVELY 4HABAZIMBI MINE IS REACHING THE END OF ITS LIFE PLANNED for 2016), after some 80 years of continuous operation. The 0HOENIX PROJECT WHICH IS ADJACENT TO 4HABAZIMBI MINE IS CURRENTLY at a feasibility stage. Subject to board approval, this project will REPLACE PRODUCTION FROM 4HABAZIMBI MINE!T THE END OF THE group reported total attributable Ore Reserves of 1,197.7Mt and attributable Mineral Resources of 1,340.4Mt (These are reported in accordance with the South African Code for Reporting of Exploration Results, Mineral Resources and Mineral Reserves (SAMREC)). Kumba produced 41.3Mt of iron ore for domestic and export markets in The export ore is railed via a dedicated iron ore rail link operated by Transnet Freight Rail, the national transport utility for rail operations, to the port of Saldanha Bay. In 2011 the company exported 37.1Mt of iron ore from the port of Saldanha Bay to customers in countries and regions around the world, including China (68%), Western Europe (13%), Japan and South Korea (18%) and the Middle East (1%). The group continues to invest significantly in the development and expansion of its business. In 2011 Kumba spent R5.8 billion on capital 53% on growth projects and 47% on stay in business capital. IR iii Page 65 Kumba Iron Ore Limited Kumba s South African project pipeline is extensive, with the potential to grow production to 70Mtpa by 2019; Kolomela mine is expected to produce an additional 9Mtpa by 2013 while a further 15Mtpa could come from other Northern Cape Province operations and 5Mtpa from Limpopo Province. As much of this growth potential resides in lower-grade ore, the group is intensely focused on turning this material to account. In the year under review, Kumba announced its intention of seeking growth in other parts of Africa, in a second footprint, most notably west and central Africa, with the aim of growing production by a further 10 to 20Mtpa by At the end of December 2011, Kumba employed 11,898 people, comprising 6,303 full-time employees and 5,595 full-time contractors. A further 4,131 fixed-term project contractors were employed on capital expenditure projects during the year. Kumba, which is listed on the JSE Limited (JSE) in South Africa, had a market capitalisation of R161 billion at 31 December 2011, the eighth largest company listed on the JSE by market capitalisation. The company s largest shareholder is Anglo American plc, with a 65.2% interest. Also holding a significant stake is South Africa s Industrial Development Corporation, a national development finance institution set up to promote economic development and growth in the country, which holds 12.9%. The balance (free float) is held largely by institutional investors in South Africa (45%), the United Kingdom (19%), North America (26%) and Europe (5%). Achieved in a landmark transaction in 2006, SIOC is fully empowered, with a black economic empowerment (BEE) ownership of 26.1%. Through this empowerment structure, Kumba has achieved a significant and broad-based BEE shareholding as set out below. The slight increase in the BEE ownership from 2010 is as a result of the unwind of the first phase as well as the implementation of the second five-year phase of the Envision scheme. s %XXARO 2ESOURCES,IMITED %XXARO A LEADING "%% COMPANY LISTED on the JSE, has a 19.98% stake. s 3)/# #OMMUNITY $EVELOPMENT 4RUST #$4 HAS A 3% unencumbered interest. s 4HE %NVISION EMPLOYEE SHARE PARTICIPATION SCHEME HAS
5 INTEGRATED REPORTING THE INTEGRATED REPORTING JOURNEY Approach and overview APPROACH Kumba recognises that the group has a responsibility to engage with and report to a broad range of stakeholders, including shareholders, employees, customers, communities, suppliers and the public at large. In Kumba s Integrated Report 2011, the group presents a holistic picture of the business, covering its operating context and markets, the opportunities and challenges it faces, its strategy, its operational, financial and non-financial performance for the year, and its objectives and outlook for the year ahead. Issues and concerns raised by stakeholders actively inform opportunities and challenges within the business. In developing the Integrated Report 2011, Kumba has applied the recommendations of the King Code of Governance Principles for South Africa 2009 (King III), the Integrated Report Discussion Paper published by the Integrated Reporting Committee of South Africa, as well as the discussion paper, Towards Integrated Reporting: Communicating Value in the 21st Century, published by the International Integrated Reporting Committee. This report, the Annual Financial Statements 2011, forms part of a suite of reports produced by the group. It comprises: annual general meeting, which has been posted to all shareholders; the economic, social and environmental impacts of the group s business in greater detail; report which focuses on the issues that are important to employees; and (with downloadable pdfs) on an interactive web platform at index.php. ABOUT THIS REPORT: SCOPE AND BOUNDARY This report presents the group s annual financial statement for the year ended 31 December It forms part of a suite of reports that gives an overall account of the group s operational, financial, economic, social and environmental performance, as well as governance, during the period under review. Historical information is supplied for context where appropriate. Also supplied is an outlook where these support an understanding of the strategy of the business. The annual financial statements have been prepared in compliance with International Financial Reporting Standards and the International Financial Reporting Interpretation Committee s interpretations of those standards; the South African Companies Act No 71 of 2008 as amended (The Companies Act); the Listings Requirements of the JSE Limited; and the AC500 standards as issued by the Accounting Practices Board. The annual financial statements have been audited by Deloitte & Touche. An unmodified audit opinion was issued and is included on page 12 of the Annual Financial Statements. Printed copies of these reports are available on request. Stakeholders are encouraged to provide feedback on Kumba s reports and its reporting. Your feedback and suggestions will be taken into consideration as the group continues its journey. A feedback form is available at reports/kumba_ar2011/sustainability/feedback_form.php. Annual Financial Statements
6 FINANCIAL REVIEW FOR THE YEAR ENDED 31 DECEMBER 2011 SIGNIFICANT DISTRIBUTIONS TO SHAREHOLDERS Kumba s headline earnings for the year ended 31 December 2011 were a record R17.0 billion, 19% more than the R14.3 billion achieved in This financial performance was achieved mainly as a result of a weighted average increase of 26% in export iron ore prices realised and a 3% increase in export sales volumes. Attributable and headline earnings for the year were R53.11 and R53.13 per share respectively, on which a final cash dividend of R22.50 per share was declared, bringing the total dividend for 2011 to R44.20 per share. We continue to deliver increasing value to our listed shareholders and also to Sishen Iron Ore Company s Black Economic Empowerment shareholders by returning substantial cash dividends. The group announced the maturity of the first phase of Envision, its broad based employee share scheme with 6,209 permanent employee members, on 29 November Envision was valued at R2.7 billion at the conclusion of its first phase, resulting in employee members who have worked for Kumba over the five-year period since its inception in 2006, each receiving R576,045 (pre-tax). Envision is a broad based empowerment success story and sets a benchmark for empowerment goals and ideals in South Africa. Vincent Uren, Chief financial officer The group has again posted outstanding financial results OPERATIONAL PERFORMANCE The key indicators of our operating results during the past year were: REVENUE (R billion) CAGR:43% REVENUE up 26% to R48.6bn HEADLINE EARNINGS up 19% to R17.0bn FINAL CASH DIVIDEND R22.50 per share ENVISION Returns R2.7bn to employees 2 Kumba Iron Ore Limited
7 OPERATING PROFIT (R billion) CAGR:52% SISHEN MINE UNIT CASH COST (R/tonne) CAGR:19% ATTRIBUTABLE EARNINGS AND DIVIDEND PER SHARE (Rand) * * The 2010 unit cash cost was restated to take into account non-cash share-based payment expenses CAGR EPS:51%; CAGR DPS:56% Financial review Earnings per share (EPS) Dividend per share (DPS) OPERATIONAL PERFORMANCE % change 2009 Revenue 48,553 38,704 25% 23,408 Operating expenses (16,587) (13,573) 22% (10,528) Operating expenses (excl. mineral royalty) (14,825) (12,163) 22% (10,528) Mineral royalty (1,762) (1,410) 25% Operating profit 31,966 25,131 27% 12,880 Operating margin (%) Headline earnings 17,048 14,328 19% 6,972 Cash from operations 32,631 25,555 28% 12,745 Capital expenditure 5,849 4,723 24% 3,996 REVENUE The group s total mining revenue (excluding shipping operations R2.7 billion in 2011; R2.9 billion in 2010) of R45.8 billion for the year was 28% higher than the R35.8 billion of REVENUE 2011 (R million) 2,711 45, (R million) 2,879 35,825 The increase in mining revenue was driven by a weighted average increase of 26% in export iron ore prices compared to 2010, which added R9.6 billion. Spot iron ore prices traded at record highs during the first half of 2011 as the demand for iron ore exceeded supply. In 2011, global steel production was up by 6% to 1.5 billion tonnes, of which 683Mt was produced in China, an increase of 7%. To support this growth in steel production, China s seaborne iron ore imports rose by 8% to 654Mt with the balance of China s iron ore needs met by domestic iron ore production. However, the global economic uncertainty in the second half of the year, coupled with a steel stocking by end users and the construction sector, caused steel prices to fall. In turn, steel mills cut production, slowed purchasing of raw materials, focused on fine ore (rather than lump ore) and turned to sourcing lower grade ore to limit absolute costs. This halted Sale of iron ore Services rendered shipping Annual Financial Statements
8 44,903 35,159 FINANCIAL REVIEW FOR THE YEAR ENDED 31 DECEMBER 2011 ANALYSIS OF THE INCREASE IN REVENUE (R million) 50,000 46,000 9, ,553 42,000 38,000 38,704 34,000 30, Price Volume Currency Shipping 2011 REVENUE SEGMENT ANALYSIS 2011 (R million) 2010 (R million) ,711 2,879 REVENUE GEOGRAPHICAL ANALYSIS 2011(R million) 2010 (R million) ,450 3,388 29,904 4, ,874 23,112 9,274 7,465 1 Sishen mine R nil revenue in 2010 Thabazimbi mine Shipping operations Kolomela mine 1 South Africa China Rest of Asia Europe Middle East Americas increases in the spot price of iron ore. By the end of the third quarter, steel production had started to slow noticeably as steel prices continued to weaken and market sentiment remained uncertain. Spot iron ore prices fell to a low of US$116.75/tonne CFR at the end of October 2011, losing around 35% from the peak achieved in early September Similarly lump iron ore premiums came under severe pressure during the fourth quarter of Steel markets in China remain subdued but have stabilised with steel producers resuming the sourcing of iron ore during November 2011 as stocks had been run down and spot iron ore pricing found a support level provided by high cost Chinese domestic iron ore production. Spot prices have recovered and climbed to around US$140.00/tonne CFR to China. In addition we increased our export sales volume by 3% or 1.0Mt on which these higher prices were realised this increased revenue by R764 million. The average Rand/US$ exchange rate of R7.25 to the dollar was marginally stronger than the R7.30 achieved during 2010 which resulted in a decline in revenue of R335 million. Due to lower freight rates, the revenue from shipping operations of R2.7 billion was R168 million down on the R2.9 billion earned during This revenue was earned on 21.7Mt shipped on behalf of our customers. The margin achieved has been sustained delivering a profit of R337 million for the year. Revenue generated from Sishen mine increased significantly by mine s revenue was up 36%, revenue of R32 million was generated on the sale of first ore by Kolomela mine and revenue from our shipping operations decreased by 6%, as compared to % of revenue was earned from sales to customers in China, 19% from customers based in the rest of Asia and 11% from European customers. A geographical analysis of revenue earned based on the country of origin is provided above. OPERATING EXPENDITURE Operating expenses increased by 22% year on year from R13.6 billion to R16.6 billion. Mining operating expenses increased by R2.8 billion or 30% from 2010 (calculated on operating expenses excluding shipping expenses and the mineral royalty). As with the rest of the industry, Kumba experienced mining inflation well in excess of CPI. A number of cost items increased well in excess of inflation, such as the price of diesel which increased by 24%. In addition, operating costs remained under pressure due to large planned increases in waste mining activities across all our sites. Operating expenses was favourably affected by higher finance gains realised from the revaluation of US$ denominated monetary assets and derivative instruments, to the value of R587 million. Selling and distribution costs rose by 22% year on year to R3.7 billion. This was primarily driven by rail and port tariff contractual increases, a 7% increase in volumes railed by Transnet to 39.1Mt and a 3% increase in volumes loaded at the port, to 37.6Mt. Sishen mine unit cash cost Sishen mine produced 38.9Mt, 6% lower year on year as operations were disrupted during the first half of The mine managed to mitigate some of the production shortfall by producing 9% more in the second half of This production shortfall had a significant impact on Sishen mine s unit cash cost which has a substantial fixed cost element. As a result unit cash costs increased by 35% to 4 Kumba Iron Ore Limited
9 OPERATING EXPENDITURE % change 2009 Production costs 9,497 7, ,960 Movement in inventories (149) (459) (68) (600) Finished products 247 (171) (440) Work-in-progress (396) (288) 38 (160) Finance gains (587) (286) 105 (329) Other (2) (30) Cost of goods sold 8,761 6, ,001 Selling and distribution costs 3,698 3, ,838 Sublease rent received (8) (8) (8) Mining operating expenses 12,451 9, ,831 Mineral royalty 1,762 1, Cost of services rendered shipping 2,374 2,560 (7) 2,697 Operating expenses 16,587 13, ,528 Financial review R150/tonne from the R111/tonne achieved in However, at US$21/tonne the mine remains well positioned in the lower part of the cash cost curve. We saw a R39/tonne increase in unit cash cost which was driven by a few key factors: Inflationary pressures, principally on labour and contract mining, pushed up costs by almost R7/tonne; A number of cost items increasing well in excess of inflation, such as the price of diesel which increased from R7.50 per litre to R9.30 per litre. This accounted for R7/tonne of the nearly R13/tonne increases in excess of inflation and increased maintenance cost on the larger mining fleet contributed a further R3/tonne; The increased mining activity added almost R11/tonne or 10%; and The production shortfalls added R9/tonne. Further increases in unit cash costs are anticipated as the mine increases the waste stripping according to plan. The increased waste stripping is expected to add 10% per annum to unit cash costs (before mining inflation) for the next 2 to 3 years. The group s Asset Optimisation and Supply Chain programmes are now embedded in the business. Sishen mine s Asset Optimisation initiatives are focused on improving the efficiency of mining operations on a sustainable basis. Through these initiatives and procurement savings we seek to contain some of the cost increases. The Sishen Mine unit cash cost structure per major cost component both on a Rand per tonne as well as a percentage basis is illustrated below. Compared to 2010, with the significant increase in the cost and utilisation of diesel, the relative contribution of this cost item to the mine s cost structure saw an increase from 13% to 17%. SISHEN MINE UNIT CASH COST STRUCTURE 2011 (R/tonne) 2010 (R/tonne) 2011 (%) 2010 (%) Labour Outside service Maintenance Fuel Drilling & blasting Energy Other SISHEN MINE UNIT CASH COST (R/tonne) * (US$15.23) (US$20.75) 2010 Inflation Cost escalation Mining volume Production volume 2011 * The 2010 unit cash cost was restated to take into account non-cash share-based payment expenses Annual Financial Statements
10 32,661 25, FINANCIAL REVIEW FOR THE YEAR ENDED 31 DECEMBER 2011 Operating profit (EBIT) Operating profit increased by 27% from R25.1 billion to a record R32.0 billion. The group s operating profit margin increased marginally to 66%. Excluding the margin earned from providing a shipping service to customers, the group s mining operating margin remained stable at 69%. The operating profit achieved was impacted by the increase in operating expenses on the back of the growth in mining volumes across the group and above inflationary cost increases. Operating profit improved principally as a result of: which added R8.9 billion to operating profit and a 3% growth in export sales volumes which contributed R954 million; and shipped by Kumba on behalf of customers increased by 3.0Mt from 18.7Mt in 2010 to 21.7Mt for This increase in operating profit was offset by: selling and distribution expenses, shipping expenses and the mineral royalty) driven by the substantial increase in waste mined on costs; mainly as a result of a 7% growth in total volumes railed at an increased tariff; free-on-rail ( FOR ) iron ore revenue, which added R352 million to operating expenditure; and marginally stronger than the R7.30 achieved during 2010 and resulted in a decline in revenue of some R335 million. The group s operating profit per business segment is analysed below. Other segments, which include the Corporate Office, Project and Technical Services of the group, contributed to a net operating loss of R1.1 billion and R684 million for 2011 and 2010 respectively. Net finance income incurred on a centralised basis was R92 million for 2011 (R29 million net finance costs for 2010). CAPITAL EXPENDITURE Capital expenditure 5,849 4,723 Comprising: Expansion 3,104 3,099 Stay in business 2,745 1,624 Transfers from assets under construction to property, plant and equipment 8,951 1,519 Capital expenditure of R5.8 billion was incurred, of which R2.7 billion was to maintain operations, mainly for Sishen mine s fleet expansion programme. R3.1 billion was invested to expand operations, mainly on Kolomela mine, and R317 million on the Sishen Westerly Expansion Project (SWEP) in 2011 (2010: R62 million). The development of Kolomela mine was largely completed during 2011, and the mine commenced with commercial production in December On 1 December 2011 the capitalisation of mining operating expenses ceased as substantially all the activities for bringing the mine in the location and condition necessary for it to be capable of operating in the manner intended by management had been completed. R7.7 billion was subsequently transferred to property, plant, infrastructure and equipment from assets under construction. Stay in business capital expenditure of some R3 billion is anticipated for 2012 and 2013 mainly due to the Sishen mining fleet replacement and associated infrastructure. Cash flows The group continued to generate substantial cash from its operations, with R34.3 billion (before the mineral royalty of R1.7 billion) generated during the year, 27% more than the R27.0 billion of These cash flows were used to pay aggregate dividends of R17.9 billion, taxation of R7.0 billion, the Envision payout of R2.7 billion and mineral royalties of R1.7 billion during Cash generated during the year was utilised as follows: EBIT SEGMENT ANALYSIS 2011(R million) 2010 (R million) UTILISATION OF CASH GENERATED 2011(%) 2010 (%) Sishen mine Thabazimbi mine 1 Shipping operations Kolomela mine 2 1 Contributed an operating loss of R44 million for Contributed an operating loss of R80 million for 2011; R nil EBIT in 2010 Employee cost Additions to PPE Taxation 1 Dividends paid 1 Taxation includes mineral royalties Envision Other Cash retained 6 Kumba Iron Ore Limited
11 Net debt Kumba s net cash position at 31 December was as follows: Long-term interest-bearing borrowings 3,185 Short-term portion of long-term interest-bearing borrowings 3,191 Total 3,191 3,185 Cash and cash equivalents (4,742) (4,855) Net cash (1,551) (1,670) Total equity 20,592 18,376 Interest cover (times) At 31 December 2011 R3.2 billion of the total R8.6 billion long-term debt facilities has been drawn down to finance Kumba s expansion. The R3.2 billion debt facility matures in 2012 and is due for repayment on 31 July We are well advanced with the process to put in place alternative funding options for the group. Kumba was not in breach of any of its covenants during the year. The group had undrawn long-term borrowing and uncommitted short-term facilities at 31 December 2011 of R9 billion (2010: R9.3 billion). Kumba s debt profile has a longer term bias, which reflects both our capital investment programme as well as the excellent results generated by our operations over the past 5 years. This has reduced the group s dependency on short-term borrowing facilities. SHAREHOLDER RETURNS Share price Kumba s share price has shown a marked increase during the year, growing 39% from the closing price of R425 at 31 December 2010 to R500 at 31 December The share price has grown at a compound annual growth rate of 35% from the listing share price of R111 at the end of Kumba continued to outperform the mining index of the JSE during the year by some 25%. Dividends Kumba continues to return cash to its shareholders after considering the need to preserve cash to fund the future growth of the group. Kumba s dividend policy of returning surplus cash to shareholders remains unchanged as does the desire to fund capital expenditure with debt instruments. Financial review KUMBA CLOSING SHARE PRICE (Rand) Dec 2006 Dec 2007 Dec 2008 Dec 2009 Dec 2010 Dec 2011 Total dividend 2011 Final dividend 31 December 2011 Interim dividend 30 June 2011 Total dividend 2010 Total dividend 2009 Earnings per share (Rand per share) Dividend per share (Rand per share) Total dividend declared (Rm) 14,250 7,247 7,003 11, Dividend cover (times) EMPOWERMENT Dividend declared by SIOC 19,266 13,982 6,295 9,040 3,266 Kumba 14,250 10,348 4,658 6,690 2,417 Exxaro 3,851 2,796 1,259 1, SIOC Community development trust Envision (Employee share ownership scheme) Dividend cash flows to BEE shareholders 1 4,170 1,876 1,811 1, Exxaro 3,516 1,810 1,744 1, SIOC Community development trust Envision (Employee share ownership scheme) Dividend cash flows in 2011 consists of the final cash dividend for 2010 and the interim dividend for 2011 Annual Financial Statements
12 FINANCIAL REVIEW FOR THE YEAR ENDED 31 DECEMBER 2011 Attributable and headline earnings for the year were R53.11 and R53.13 per share respectively (2010: R44.66 and R44.67 per share). The board reviewed the cash flow generation, growth plans and the capital structure of Kumba and declared a final dividend of R22.50 per share (interim dividend R21.70 per share), bringing the total dividend for the year to R44.20 (2010: R34.50). With the declaration of the final dividend the cover has reduced to 1.2 times for 2011 from 1.3 times in The total dividend declared to shareholders since listing is R per share. The board will continue to consider the dividend payable at each declaration date after taking into account the financial position and prospects of the group. Empowerment Kumba continues to make a meaningful contribution towards South Africa s broad based empowerment, through both capital appreciation and the payment of substantial cash dividends to the Black Economic Empowerment (BEE) shareholders of Sishen Iron Ore Company (Pty) Limited (SIOC): its broad based employee share scheme with 6,209 permanent employee members, on 29 November Envision was valued at R2.7 billion at the conclusion of its first phase, resulting in employee members who have worked for Kumba over the five-year period since its inception in 2006, each receiving R576,045 (pre tax). Members of the scheme have already received up to R55,000 in dividends through the course of the five year term. The second five year phase of the scheme commenced on 10 November 2011, through this second phase employees will receive their first dividend in March 2012 payable from the final SIOC 2011 dividend declared. received R1.3 billion in dividends since its inception five years ago, of which R527 million was received in cash during 2011 and R578 million will be paid in February 2012 from the final 2011 dividend declared by SIOC. These funds contribute towards sustainable community projects. since its listing five years ago. KEY FACTORS AFFECTING FUTURE OPERATING RESULTS Export iron ore sales prices and volumes The short-term outlook for the global seaborne iron ore market is impacted by ongoing macro-economic uncertainty. Monetary tightening measures to control inflation in emerging economies such as China started to have the intended effect. In addition, a lack of co-ordinated policy response to tackle the European sovereign debt crisis also impacted demand. Despite the short-term macroeconomic uncertainty, medium to long-term prospects for demand remains robust as China continues to industrialise and urbanise. Nevertheless, as China shifts from an investment intensive to consumption driven economy, the rate of growth for steel materials is expected to moderate to a more sustainable level. While demand is a key driver for pricing, supply constraints also play a crucial role. In the short-term iron ore supply is anticipated to Australia, and government s moves in India to control export. Ongoing challenges producers face in delivering new supply will lead to increasing capital intensity and underpinned long-term pricing outlook. Kumba s ability to supply iron ore to the market will be enhanced by the ramping up of Kolomela mine during 2012 to produce between 4Mt and 5Mt in Export sales volumes in 2012 are anticipated to grow by ~3Mt from the volumes achieved in 2011 as volumes from Kolomela mine ramp up, offset by the fact that excess finished product stockpiles at Sishen mine have been depleted to operating levels. Exchange rate Relative to 2010, the US Dollar has weakened marginally against the South African Rand, remaining at pre-2008 levels, as can be seen from the graph on the next page. A significant proportion of our turnover and capital expenditure is affected by Rand/US Dollar exchange rate, and as such Kumba s operating profit remains highly sensitive to the Rand/US Dollar exchange rate. Operating expenses Annual production volumes from Sishen mine are expected to increase back to design capacity which should aid in containing unit cost increases. Waste mining at Sishen mine is anticipated to increase in line with the planned ramp up that commenced in 2009, which will put upward pressure on unit cash costs of production. Operating efficiencies and revenue enhancement Kumba continues to focus on operational excellence, productivity improvements and efficiencies. Achieving this optimisation is currently a critical factor at Sishen mine, where management is facing a challenging period of increasing waste stripping set to continue for the next two to three years. The western-dipping ore body requires increased waste stripping and tight pit conditions constrain face lengths which, in turn, limits flexibility. Sishen mine s PLATTS IODEX 62% Fe CFR (US Dollar) Dec 2008 Dec 2009 Dec 2010 Dec 2011 Platts IODEX 62% Fe CFR 8 Kumba Iron Ore Limited
13 productivity improvement project, Bokamoso continues to deliver efficiency and productivity improvements required to partially offset cost pressures associated with increased mining activity. SIGNIFICANT ACCOUNTING MATTERS Change in accounting estimates Management has revised the remaining estimated useful lives of certain items of property, plant and equipment at Sishen mine, as well as the estimated rehabilitation and decommissioning provisions at both Sishen and Kolomela mines. The change in estimate at Kolomela mine was mainly as a result of a decrease in the useful life resulting from the exclusion of inferred mineral resources from the LOM plan for accounting purposes. The LOM plan on which accounting estimates are based only includes proved and probable ore resources as disclosed in Kumba s annual Ore Reserves and Mineral Resources statement. The effect of these changes is detailed below: 31 December Rand million 2011 Increase in environmental rehabilitation provision 67 Increase in decommissioning provision 20 Increase in accumulated depreciation 55 The change in estimate in the environmental rehabilitation provision and accumulated depreciation was applied prospectively from 1 January 2011 and resulted in a decrease in attributable profit before taxation and headline earnings per share for the year ended 31 December 2011 of R122 million and 21 cents, respectively. The change in estimate in the decommissioning provision has been capitalised to the related property, plant and equipment. IR Page 70 Unwinding of phase one of Envision Envision, SIOC s broad-based equity participation scheme for employees below managerial level, was set up to provide a framework for the incentivisation and retention of certain employees, as well as effective participation in the equity transition of the group as contemplated in the Mining Charter. Envision was structured as a ten year scheme, divided into two capital appreciation periods. The first capital appreciation period vested on 17 November The second capital appreciation period commenced on 10 November 2011 with the issue of 3.09% in the share capital of SIOC to the Envision trust. This resulted in a net increase in the non-controlling interest in SIOC of R4 million. The unwind of phase one resulted in a net cash outflow for the group through the implementation of the specific share repurchase by Kumba undertaken to monetise the value for employee participants. The actual monetary impact was R2.7 billion, based on a Kumba 5 day average share price of R per share on 17 November Accounting policies The following amendments to published standards and interpretations which became effective for the year commencing on 1 January 2011 were adopted by the group: IAS 24 - RELATED PARTY DISCLOSURES (AMENDMENT) This amendment simplifies the definition of a related party, clarifying its intended meaning and eliminating inconsistencies from the definition and provides a partial exemption from the disclosure requirements for government-related entities. This amendment did not have a significant impact on the reported results for the year ended 31 December ANNUAL IMPROVEMENTS PROJECT 2010 The group adopted the amendments to various issued accounting standards issued by the International Accounting Standards Board (IASB) as part of its Annual Improvements Project 2010 that are effective for reporting periods that commenced on 1 January These amendments have not had an effect on the reported results or the group accounting policies. CONCLUSION The year under review has been very successful for the group. This has enabled us to consistently deliver on and exceed our financial targets and consequently return significant cash to our shareholders. Our strong balance sheet, together with our sustained financial performance, provides a solid foundation for sustainable growth. Vincent Uren Chief financial officer Financial review EXCHANGE RATE (Rand/US Dollar) Dec 2006 Dec 2007 Dec 2008 Dec 2009 Dec 2010 Dec 2011 Yearly average Monthly average Annual Financial Statements
14 DIRECTORS RESPONSIBILITY FOR FINANCIAL REPORTING FOR THE YEAR ENDED 31 DECEMBER 2011 DIRECTORS RESPONSIBILITY FOR FINANCIAL REPORTING The directors are responsible for: financial statements and related financial information of the Kumba Iron Ore Limited Group (the group) as well as Kumba Iron Ore Limited (Kumba or the company), in accordance with International Financial Reporting Standards and the requirements of The Companies Act and the Listings Requirements of the JSE Limited, which include amounts based on judgments and estimates made by management. The annual financial statements, set out on pages 13 to 81, are based on appropriate accounting policies which have been been consistently applied and which are supported by reasonable and prudent judgments and estimates, comprise the balance sheets at 31 December 2011; the income statements, the statements of comprehensive income, the statements of changes in equity and cash flow statements for the year then ended; the notes to the financial statements, which include a summary of principal accounting policies and other explanatory notes; and the directors report. The directors, primarily through the Audit Committee, meet periodically with the external and internal auditors as well as the executive management to evaluate matters concerning the responsibilities below: of risk management; internal control relevant to the preparation and fair presentation of these financial statements, that provides reasonable but not absolute assurance against material misstatement or loss, whether owing to fraud or error; circumstances; assets; and financial statements. The group s internal auditors independently evaluate the internal controls and co-ordinate their audit coverage with the external auditors. The external and internal auditors have unrestricted access to all records, property and personnel as well as to the Audit Committee. The directors acknowledge that they are ultimately responsible for the process of risk management and the system of internal financial control established by the group and place a strong emphasis on maintaining a strong control environment. The directors are not aware of any material breakdown in the functioning of these controls and systems during the year under review. The directors are of the opinion, based on the information and explanations given by management, the internal auditors, the external auditors and the group s risk, compliance and other reporting processes that the risk management processes and system of internal control provide reasonable assurance in all key material aspects that the financial records may be relied upon for the preparation of the annual financial statements. Having considered the group s major risks, outstanding legal, insurance and taxation issues, an assessment of the solvency and liquidity taking into account the current financial position and existing borrowing facilities as well as the group s financial budgets with their underlying business plans, the directors consider it appropriate that the annual financial statements be prepared on the going-concern basis. APPROVAL OF GROUP ANNUAL FINANCIAL STATEMENTS AND ANNUAL FINANCIAL STATEMENTS The group annual financial statements on pages 13 to 68, and 78 to 81; and the annual financial statements of Kumba Iron Ore Limited on pages 69 to 77, as identified in the first paragraph, were approved by the Kumba board of directors on 7 February 2012 and are subject to approval by the shareholders at the annual general meeting on 4 May The group and company annual financial statements are signed on the directors behalf by: The independent auditors are responsible for reporting on whether the group annual financial statements and the company annual financial statements are fairly presented in accordance with the applicable financial reporting framework. Their report to the members of the group and Kumba is set out on page 12 of this report. AJ Morgan Interim chairman 7 February 2012 CI Griffith Chief executive 10 Kumba Iron Ore Limited
15 CERTIFICATE OF THE COMPANY SECRETARY FOR THE YEAR ENDED 31 DECEMBER 2011 CERTIFICATE OF THE COMPANY SECRETARY I, VF Malie, in my capacity as company secretary, confirm that, for the year ended 31 December 2011, Kumba Iron Ore Limited has lodged with the Registrar of Companies all such returns and notices as are required of a public company in terms of the Companies Act 71 of 2008, as amended, and that all such returns and notices are true, correct and up to date. VF Malie Company secretary 7 February 2012 Approvals Annual financial statements
16 INDEPENDENT AUDITOR S REPORT INDEPENDENT AUDITOR S REPORT TO THE SHAREHOLDERS OF KUMBA IRON ORE LIMITED We have audited the group annual financial statements and annual financial statements of Kumba Iron Ore Limited, which comprise the consolidated and separate balance sheets as at 31 December 2011, and the consolidated and separate income statements, the consolidated and separate statements of comprehensive income, the consolidated and separate statements of changes in equity, the consolidated and separate cash flow statements for the year then ended, and a summary of significant accounting policies and other explanatory notes, and the directors report, as set out on pages 13 to 81. OPINION In our opinion, these financial statements present fairly, in all material respects, the consolidated and separate financial position of Kumba Iron Ore Limited as at 31 December 2011, and its consolidated and separate financial performance and consolidated and separate cash flows for the year then ended in accordance with International Financial Reporting Standards, and the requirements of the Companies Act of South Africa. DIRECTORS RESPONSIBILITY FOR THE FINANCIAL STATEMENTS The company s directors are responsible for the preparation and fair presentation of these financial statements in accordance with International Financial Reporting Standards and the requirements of the Companies Act of South Africa, and for such internal control as the directors determine is necessary to enable the preparation of financial statements that are free from material misstatement, whether due to fraud or error. AUDITOR S RESPONSIBILITY Our responsibility is to express an opinion on these financial statements based on our audit. We conducted our audit in accordance with International Standards on Auditing. Those standards require that we comply with ethical requirements and plan and perform the audit to obtain reasonable assurance about whether the financial statements are free from material misstatement. An audit involves performing procedures to obtain audit evidence about the amounts and disclosures in the financial statements. The procedures selected depend on the auditor s judgement, including the assessment of the risks of material misstatement of the financial statements, whether due to fraud or error. In making those risk assessments, the auditor considers internal controls relevant to the entity s preparation and fair presentation of the financial statements, in order to design audit procedures that are appropriate in the circumstances, but not for the purpose of expressing an opinion on the effectiveness of the entity s internal controls. An audit also includes evaluating the appropriateness of accounting policies used and the reasonableness of accounting estimates made by management, as well as evaluating the overall presentation of the financial statements. Deloitte & Touche Registered auditor Per G Krog Partner 7 February 2012 National executive: GG Gelink chief executive; AE Swiegers chief operating officer; GM Pinnock audit; DL Kennedy risk advisory and legal services; NB Kader tax; L Geeringh consulting; L Bam finance; TJ Brown chairman of the board; MJ Comber deputy chairman of the board A full list of partners and directors is available on request BBBEE rating: Level 2 contributor in terms of the Chartered Accountancy Profession Sector Code Member of Deloitte Touche Tohmatsu Limited We believe that the audit evidence we have obtained is sufficient and appropriate to provide a basis for our audit opinion. 12 Kumba Iron Ore Limited
17 DIRECTORS REPORT FOR THE YEAR ENDED 31 DECEMBER 2011 DIRECTORS REPORT COMPANY REGISTRATION NUMBER 2005/015852/06 The directors have pleasure in presenting the annual financial statements of Kumba and the group for the year ended 31 December NATURE OF BUSINESS Kumba was incorporated in South Africa on 16 May 2005 and commenced trading in November 2006 following the unbundling of Kumba from Exxaro Resources Limited (previously Kumba Resources Limited). Subsequent to unbundling, Kumba listed on the JSE Limited (JSE) on 20 November 2006 as the only pure play iron ore company on the JSE. Kumba is a mining group of companies focusing on the exploration, extraction, beneficiation, marketing, shipping and sale of iron ore. Kumba produces iron ore in South Africa at Sishen and Kolomela mines in Province. The Kolomela mine commenced commercial production on 1 December 2011, almost five months ahead of schedule. The nature of the businesses of the group s subsidiaries, associates and joint ventures is set out in annexures 1 and 2. CORPORATE GOVERNANCE The group subscribes to the Code of Good Corporate Practices and Conduct as contained in the King III report on corporate governance. The board has satisfied itself that Kumba has complied in all material aspects with the code as well as the JSE Listings Requirements throughout the year under review. The corporate governance report is set out on pages 82 to 93 of the Integrated Report IR Page 82 FINANCIAL RESULTS The financial statements on pages 13 to 81 set out fully the financial position, results of operations and cash flows of the group for the financial year ended 31 December The financial statements have been prepared under the supervision of Martin Poggiolini, CA(SA), acting chief financial officer. Operating results for the year Summary of the group s key financial results for the year ended 31 December: % Increase/ (decrease) Revenue 48,553 38, Operating profit 31,966 25, Cash generated from operations (excluding mineral royalties paid) 34,331 26, The group s total mining revenue (excluding shipping operations R2.7 billion in 2011; R2.9 billion in 2010) of R45.8 billion for the year was 28% higher than the R35.8 billion of 2010 due to a weighted average increase of 26% in export prices. Operating profit increased by 27% from R25.1 billion to R32.0 billion. The group s operating profit margin increased marginally to 66%. Excluding the margin earned from providing shipping services to customers, the group s mining operating margin remained stable at 69%. The operating profit achieved was impacted by an increase in operating expenses on the back of the growth in mining volumes across the group and above-inflation cost increases. The group continued to generate substantial cash from its operations, with R34.3 billion (before the mineral royalty of R1.7 billion) generated during the year, 27% more than the R27.0 billion of These cash flows were used to pay aggregate dividends of R17.9 billion, taxation of R7.0 billion, Envision phase one of R2.7 billion and mineral royalties of R1.7 billion during Attributable and headline earnings for the year were R53.11 and R53.13 per share respectively. Refer to note 20, Per share information, of the group annual financial statements for an analysis of movements in the group s basic and headline earnings per share. FINANCIAL POSITION Summary of the group s financial position as at 31 December: (decrease) % Increase/ Property, plant and equipment 20,878 15, Net working capital (excluding cash and cash equivalents) 2,845 2,924 (3) Net cash 1,551 1,670 (7) Net asset value per share (R) Property, plant and equipment Capital expenditure of R5.8 billion was incurred. R2.7 billion was invested to maintain operations, mainly on Sishen mine s fleet expansion programme to mitigate mining and production risks. A further R3.1 billion was incurred to expand operations, mainly on the development of Kolomela mine. Excellent progress was made at Kolomela mine, which was brought into production ahead of schedule. The plant was successfully commissioned during 2011, delivering production of 1.2Mt during the fourth quarter, bringing total production for 2011 to 1.5Mt. Kolomela mine is on track to produce between 4Mt and 5Mt in 2012 during ramp up, before producing at full design capacity of 9Mtpa in Audited annual financial statements Annual Financial Statements
18 DIRECTORS REPORT FOR THE YEAR ENDED 31 DECEMBER 2011 Working capital Net working capital decreased by R79 million from 31 December 2010 to R2.8 billion. This decrease is due to an increase in payables as a result of the employees tax on the Envision payout, offset by the growth in the accounts receivable balance on the back of the higher export iron ore prices and an increase in sales volumes in December 2011 relative to December Net cash At 31 December 2011 the group was in a net cash position of R1.6 billion (R1.7 billion net cash at the end of 2010), with R3.2 billion of the total R8.6 billion long-term debt facilities drawn down to finance Kumba s expansion. The R3.2 billion debt facility is due for repayment in Kumba was not in breach of any of its covenants during the year. The group had undrawn long-term borrowing and uncommitted shortterm facilities at 31 December 2011 of R9.1 billion (2010: R9.3 billion). ACCOUNTING POLICIES The group adopted the following amendments to existing standards with effect from 1 January IAS 24, Related party disclosures (amendment) This amendment simplifies the definition of a related party, clarifying its intended meaning and eliminating inconsistencies from the definition and provides a partial exemption from the disclosure requirements for government-related entities. This amendment did not have a significant impact on the reported results for the year ended 31 December Annual Improvements Project 2010 The group adopted the amendments to various issued accounting standards issued by the International Accounting Standards Board (IASB) as part of its Annual Improvements Project 2010 that are effective for reporting periods that commenced on 1 January These amendments have not had an effect on the reported results or the group accounting policies. SHARE CAPITAL Authorised capital The company s authorised share capital of 500,000,000 shares remained unchanged during the year. Share movements Balance at beginning of year Total shares issued for cash consideration Net movement in treasury shares under employee share incentive schemes (139) (129) Purchase and treasury shares* (278) (191) Shares issued to employees Share capital and share premium During 2011, as part of the unwind and monetisation of Envision phase one, the company issued 5,377,770 Kumba shares for R2.68 billion and subsequently repurchased 5,230,867 of these Kumba shares for R2.67 billion. * The group acquired 550,781 (2010: 515,241) of its own shares through purchases on the JSE during the year. The total amount paid to acquire the shares was R278 million (2010: R191 million). The shares are held as treasury shares and the purchase consideration has been deducted from equity. Unissued shares The directors are authorised to issue unissued shares until the next annual general meeting. Shareholders will be asked to extend the authority of the directors to control the unissued shares of the company at the forthcoming annual general meeting, up to a maximum of 5% of the issued capital. DIVIDENDS An interim dividend of R21.70 per share was paid on 22 August A final dividend of R22.50 per share was declared on 7 February 2012 from profits accrued during the financial year ended 31 December The total dividend for the year amounted to R44.20 per share. The estimated total cash flow of the final dividend of R22.50 per share, payable on 19 March 2012, is R7.2 billion for Kumba Iron Ore Limited. The board of directors is satisfied that, after payment of the final dividend, the group is sufficiently liquid and solvent to support the current operations and to facilitate future development of the business. SUBSIDIARIES, JOINT VENTURES AND ASSOCIATES Full particulars of the group s investment in subsidiaries, associates and joint ventures are set out in annexures 1 and 2. EQUITY COMPENSATION PLANS Refer to the detailed remuneration report on pages 19 to 26, note 22, Equity-settled share-based payment reserve, and Annexure 3 of the group annual financial statements for a detailed discussion and analysis of movements in the group s various equity compensation plans available to executive directors and senior employees. 14 Kumba Iron Ore Limited
19 SEGMENT RESULTS Refer to note 36, Segment reporting, for a detailed segmental analysis of the group s operating results for the year ended and financial position as at 31 December HOLDING COMPANY AND RELATED PARTIES Anglo American plc is the group s ultimate holding company. The interest in the group is held through a 65.22% holding by Anglo South Africa Capital (Pty) Limited (2010: 65.25%). The analysis of ordinary shareholders is given on pages 84 and 85. MANAGEMENT BY THIRD PARTIES None of the businesses of the company or its subsidiaries had, during the financial year, been managed by a third party or a company in which a director had an interest. CONTINGENT ASSETS AND LIABILITIES Falémé Project Kumba initiated arbitration proceedings against La Société des Mines De Fer Du Sénégal Oriental (Miferso) and the Republic of Senegal under the rules of the Arbitration of the International Chamber of Commerce in 2007, in relation to the Falémé Project. Following the arbitration award rendered in July 2010, a mutually agreed settlement was concluded between the parties. The parties agreed that the precise terms of the settlement agreement will remain confidential. The first settlement was paid by the Republic of Senegal in April The remaining settlement amount will be recovered in equal instalments from the Republic of Senegal over the remaining four-year period, on which contingent legal costs will be payable. A portion of the amount recovered was committed to social and community development projects to benefit the population of Senegal. Environmental obligations During the year Sishen Iron Ore Company (Pty) Limited (SIOC) issued financial guarantees to the Department of Mineral Resources (DMR) to the value of R286 million in respect of the environmental rehabilitation and decommissioning obligations of the group. There have been no other significant changes in the contingent assets and liabilities disclosed at 31 December LEGAL PROCEEDINGS Sishen Supply Agreement arbitration ArcelorMittal SIOC notified ArcelorMittal on 5 February 2010 that it was no longer entitled to receive 6.25Mtpa of iron ore contract mined by SIOC at cost plus 3% from Sishen mine, as a result of the fact that ArcelorMittal had failed to convert its old order mining rights. This contract mining agreement, concluded in 2001, was premised on ArcelorMittal owning an undivided 21.4% interest in the mineral rights of Sishen mine. As a result of ArcelorMittal s failure to convert its old order mining right, the contract mining agreement automatically lapsed and became inoperative in its entirety as of 1 May As a result, a dispute arose between SIOC and ArcelorMittal, which SIOC has referred to arbitration. During 2011, three arbitrators were appointed and May 2012 was set as the date for the arbitration to begin. On 9 December 2011, SIOC and AMSA agreed to postpone the arbitration until the final resolution of the mining right dispute. SIOC and ArcelorMittal reached an interim pricing arrangement in respect of the supply of iron ore to ArcelorMittal from the Sishen mine. This interim arrangement endured until 31 July SIOC and ArcelorMittal agreed to an addendum to the interim supply agreement which extended the terms and conditions of the current interim pricing agreement. The new interim pricing agreement, which is on the same terms and conditions as the first interim pricing agreement, commenced on 1 August 2011 and will endure to 31 July % undivided share of the Sishen mine mineral rights After ArcelorMittal failed to convert its old order rights, SIOC applied for the residual 21.4% mining right previously held by ArcelorMittal and its application was accepted by the DMR on 4 May A competing application for a prospecting right over the same area was also accepted by the DMR. SIOC objected to this acceptance. Notwithstanding this objection, a prospecting right over the 21.4% interest was granted by the DMR to Imperial Crown Trading 289 (Pty) Limited (ICT). SIOC initiated a review application in the North Gauteng High Court on 21 May 2010 in relation to the decision of the DMR to grant a prospecting right to ICT. The High Court Review, in which SIOC challenged the award of the 21.4% prospecting right over Sishen mine by the DMR to ICT, was presided over by Judge Raymond Zondo in the North Gauteng High Court in Pretoria, South Africa, from August On 21 December 2011, judgment was delivered in the High Court regarding the status of the mining rights at the Sishen mine. The High Court held that, upon the conversion of SIOC s old order mining right relating to the Sishen mine properties in 2008, SIOC became the in respect of the Sishen mine properties. The High Court held further that as a consequence, any decision taken by the DMR after such conversion in 2008 to accept or grant any further rights to iron ore at the Sishen mine properties was void. Finally, the High Court reviewed and set aside the decision of the Minister of Mineral Resources or her delegate to grant a prospecting right to ICT relating to the iron ore as a 21.4% share in respect of the Sishen mine properties. On 3 February 2012, both the DMR and ICT submitted applications for leave to appeal against the High Court judgment. SIOC has noted an application for leave to present a conditional cross appeal, in order to protect its rights. SIOC is awaiting a date for the hearing of the application for leave to appeal. The High Court order does not affect the interim supply agreement between AMSA and SIOC, which will endure until 31 July SIOC will continue to take the necessary steps to protect its shareholders interests in this regard. Audited annual financial statements Annual Financial Statements
20 DIRECTORS REPORT FOR THE YEAR ENDED 31 DECEMBER 2011 Lithos Corporation (Pty) Limited Lithos Corporation (Pty) Limited is claiming USD421 million from Kumba for damages in relation to the Falémé Project in Senegal. Kumba continues to defend the merits of the claim and is of the view, and has been so advised, that the basis of the claim and the quantification thereof is fundamentally flawed. The trial date has been postponed indefinitely. There have been no further developments in this matter. COMPANY SECRETARY The company secretary of Kumba is Mr VF Malie. His business and postal addresses appear on the inside back cover of these financial statements. DIRECTORS The names of the directors in office during the year and at the date of this report are set out on page 86 of the Integrated Report The remuneration and fees of directors as well as the directors beneficial interest in Kumba are set out in the detailed remuneration report on pages 19 to 26. The board of directors of Kumba announced the following changes in Kumba s directorate during the year: non-executive director of Kumba on 14 June financial officer from the end of December He will continue to be employed by Kumba in 2012 and will work exclusively on the legal issues until 30 June Mr Martin Poggiolini, the company s head of finance, was appointed to act in the position of chief financial officer with effect from 31 December director on 31 March PRESCRIBED OFFICERS The names of the prescribed officers during the year and at the date of this report are set out on page 24. The remuneration and fees of the prescribed officers are also set out in the detailed remuneration report on page 24. AUDITORS Deloitte & Touche continued in office as auditors of Kumba and its subsidiaries. At the annual general meeting on 4 May 2012, shareholders will be requested to reappoint Deloitte & Touche as auditors of Kumba for the 2012 financial year. SPECIAL RESOLUTION On 6 May 2011, the shareholders of Kumba resolved that the company and any of its subsidiaries may from time to time be authorised to acquire of the company s own shares subject to the articles of association of the company, the provisions of the South African Companies Act No 71 of 2008 and the Listings Requirements of the JSE. GOING CONCERN STATEMENT The directors have reviewed the group s financial budgets with their underlying business plans. In light of the current financial position and existing borrowing facilities, they consider it appropriate that the group and company annual financial statements be prepared on the going-concern basis. IR Page Kumba Iron Ore Limited
21 REPORT OF THE AUDIT COMMITTEE FOR THE YEAR ENDED 31 DECEMBER 2011 REPORT OF THE AUDIT COMMITTEE INTRODUCTION The committee is pleased to present its report for the financial year ended 31 December 2011 as recommended by the King Report s principles of good corporate governance and in line with the South African Companies Act No 71 of The Audit Committee is constituted as a statutory committee of the group as well as a board committee approved by the board. The committee has terms of reference in place, which include both its statutary duties and those assigned to it by the board, and its mandate includes: regarding all factors and risks that may impact on the reporting; the shareholders; audit function; of the finance function; co-ordinated approach to all assurance activities; strategy of the company; and COMPOSITION The Audit Committee, appointed by the board and approved by the shareholders in respect of the financial year ended 31 December 2011, comprised the following independent non-executive directors, who have the requisite financial skills and experience to fulfill the committee s duties: FREQUENCY AND ATTENDANCE OF AUDIT COMMITTEE MEETINGS In addition to the committee members, the chief executive, chief financial officer, the risk manager and head of internal audit and external audit attend meetings of the committee by invitation. The committee meets separately with management, internal audit and external audit at every meeting. During the year under review, the committee met five times. Attendance of meetings held during the year under review is presented in the following table: Member ZBM Bassa (chairman) 07-Feb Mar May Jul Nov- 11 DD Mokgatle AJ Morgan * LM Nyhonyha n/a n/a n/a indicates attendance * indicates absence with apology OVERSIGHT FOR RISK MANAGEMENT Although the board has a risk committee to assist with the discharge of its duties with regard to the integrated risk management process, the Audit Committee has an interest in risk management as a result of its responsibility for internal controls. The chairman of the committee also chairs the Risk Committee and the committee is kept informed on the performance of risk management. INTERNAL AUDIT The group s internal audit function is fulfilled by Anglo Business Assurance Services (ABAS) and provides the board with assurance on the key areas of the group s internal financial controls. The internal audit charter was reviewed and approved by the committee. Internal audit provides assurance that the company operates in a responsibly governed manner by performing the following functions: internal control framework; controls; and the audit committee. Audited annual financial statements Annual Financial Statements
22 REPORT OF THE AUDIT COMMITTEE FOR THE YEAR ENDED 31 DECEMBER 2011 ABAS participated in a Quality Assessment Review of Risk Management and Business Assurance conducted by Deloitte LLP. The independent review was aimed at assessing whether ABAS was aligned with industry and broader good practice using the FTSE 500 as a peer group. The overall finding was satisfactory. The Committee is of the opinion, having considered the positive assurance statement provided by ABAS, that the group s system of internal financial controls is effective and provides reasonable assurance that the financial records may be relied upon for the preparation of the annual financial statements. DUTIES CARRIED OUT IN 2011 During the financial year ended 31 December 2011 the committee carried out its duties as required by section 94(2) of the South African Companies Act No 71 of 2008, the King Report, the committee s terms of reference and in accordance with its annual plan. Statutory duties: auditors and approved their terms of engagement after consideration of the timing and scope of the audit; auditors for the year ended 31 December 2011; auditor is in compliance with the South African Companies Act No 71 of 2008, The Auditing Professional Act, 2005 and the Listings Requirements of the JSE Limited; and by the external auditors in terms of an established policy to ensure that the independence of the external auditors is not compromised. The committee performed the following duties: compliance with statutory requirements; price sensitive information; internal audit process as well as the positive assurance opinion of the internal auditor on internal financial controls; management responses; resulting from the audit, as well as any reporting decisions made; requirements; engagement partner were independent; engagement partner to shareholders; with all relevant legislation; ensured that they were fair and equitable; and monitoring of legal governance compliance within the company and ensured that the combined assurance model addressed the significant risks within the company including: financial risks; internal financial controls; fraud risks; strategic risks; operational risks; and IT governance risks. appropriateness of the finance function; and nd were satisfied with the expertise of the chief financial officer. FINANCE FUNCTION AND CHIEF FINANCIAL OFFICER The committee conducted an assessment of the appropriateness, skills, expertise and resourcing of the finance function and was satisfied with the overall adequacy and appropriateness of the function. The committee further reviewed the expertise and experience of the chief financial officer and was satisfied with the appropriateness of the expertise and experience of the chief financial officer, as well as the acting chief financial officer. ANNUAL FINANCIAL STATEMENTS The Audit Committee has evaluated the consolidated annual financial statements for the year ended 31 December 2011 and concluded that it complies, in all material aspects, with the requirements of the South African Companies Act No 71 of 2008 and International Financial Reporting Standards. The committee has therefore recommended the approval of the annual financial statements to the board. CONCLUSION The committee is satisfied that it has considered and discharged its responsibilities in accordance with its mandate and terms of reference during the year under review. ZBM Bassa Chairman, Audit Committee 7 February Kumba Iron Ore Limited
23 REMUNERATION REPORT FOR THE YEAR ENDED 31 DECEMBER 2011 REMUNERATION REPORT KUMBA S REMUNERATION PHILOSOPHY Kumba s remuneration practices are based on the following tenets: element in support of Kumba s strategy; and in relation to job responsibility, the employment market and personal performance. Kumba s overall remuneration philosophy has remained unchanged since the listing of the company in However, some components of the remuneration elements were reviewed and amended during The Human Resources, Remuneration and Nomination Committee of the board of directors (Remco) has the task of applying principles of accountability and transparency to remuneration matters, so that the remuneration of directors and executive management is linked to performance and supports the group s strategy, with the ultimate aim of creating value for shareholders. This report deals with the group s Remuneration Policy, as well as the remuneration of directors and executive management for the 2011 financial year. It includes: for directors and executive management and its support of group strategy; during 2011; directors and executive management; Committee, including executive directors; detailed descriptions of the various long-terms incentive awards and other information relating to 2011 payments. HIGHLIGHTS During the year the Remco focused specifically on: assessing pay for performance according to the targets set in terms of achieving Kumba s goals; the principles and recommended practices of the King Code of Governance Principles for South Africa 2009 (King III); the SIOC Employee Share Participation Scheme which was implemented five years ago, and matured on 17 November 2011; mature in 2016; and THE REMCO The Remco has functioned as a sub-committee of the board since Kumba s listing in When considering remuneration matters, it focuses on the company s remuneration philosophy, on the determination of levels of remuneration and on annual and long-term incentive plans. The underlying philosophy is to offer remuneration that will attract, retain, motivate and reward directors, executive management and those employees who manifest the competencies required for the company to achieve its strategy, and to offer remuneration that is based on individual and company performance in accordance with competitive market practices. The role of the Remco in relation to the remuneration of directors and executive management is to: executive directors; pay and incentive schemes for directors and executive management; directors and executive management, including short-term incentive payments and long-term incentive share awards; and term incentive schemes are made. The role of the Remco in relation to the remuneration of employees generally is to: adjustments; are based; long-term incentive schemes to staff are made; employees; and to employees. During the year the members of the Remco comprised the following members: Mr AJ Morgan (chairman) and Mr PB Matlare. Both Mr Morgan and Mr Matlare are independent non-executive directors. Details of the directorate are available on page 86 of the Integrated Report 2011 as well as on the company s website at: IR Page 86 Audited annual financial statements Annual Financial Statements
24 REMUNERATION REPORT FOR THE YEAR ENDED 31 DECEMBER 2011 The Remco meets at least three times a year and is empowered to obtain such external or other independent professional advice as it considers necessary to carry out its duties. When deliberating on the remuneration of directors and executive management, the Remco considers both external market surveys on remuneration matters and the interests of shareholders. In applying agreed remuneration principles, the Remco is committed to the principles of accountability, transparency and good governance, and seeks to ensure that the reward arrangements are linked to individual and group performance and that they are in support of the strategy. Three meetings of the Remco were held during Attendance at meetings was as follows: Member 03-Feb May Nov-11 No. of meetings: AJ Morgan 3 PB Matlare 3 Indicates attendance. In 2011 the remuneration elements supported the strategy, contributing to the creation of short- and long-term value and high performance for shareholders by focusing on specific earnings before interest and tax (EBIT) and return on capital employed (ROCE) targets. Base pay is kept lean and targeted at the 50th percentile of the market while short-term incentives are capped at a maximum of 60% of basic employment cost (BEC). The long-term incentives are derived directly from the short-term incentives which fully support the pay for performance principle. The remuneration elements are structured to: aligned with shareholder needs; to incentivise them to achieve exceptional performance with the assurance that they will be appropriately rewarded and given opportunities to advance their careers; and strong performance culture with no encouragement of excessive risk-taking, to assess the appropriateness of deferral mechanisms to bring about long-term sustainability and to ensure that performance is rewarded. It should be noted that the Remco approved changes to the 2012 short- and long-term performance incentive schemes, which include: participate in the schemes based on the new aligned Anglo American Performance Management Standard; and the mine s Rapid Ramp-up Bonus Scheme, which is designed to incentivise the ramp up in production ahead of the original project plan for the year ending 31 December Overview of the group s remuneration structure for executive directors and executive management: Element Fixed/ variable Objective Delivery Salary Fixed Reflects scope and nature of role, performance and experience Non-monetary benefits (medical health care, vehicle allowance etc.) Fixed Provision of non-monetary items Pension Fixed Provision of retirement benefits Short-term incentives Long-term incentives Variable Variable Rewards and motivates achievement of agreed group and individual performance objectives Alignment with shareholder interests and creation of longterm value Cash Benefits in kind Contribution to pension and provident funds Cash of up to maximum of 60% of basic employment cost* for achievement of maximum targets Shares * Basic employment cost: cost to company less employer retirement fund contributions. DIRECTORS FEES AND REMUNERATION The directors are appointed by the Kumba board based on their competence, ability and appropriate experience to contribute to achieving the company s objectives as a leading value-adding iron ore supplier to the global steel industry. The policy is to ensure that executive directors receive remuneration that is appropriate to their scope of responsibility and contribution to operating and financial performance, taking into account industry norms and external market and country benchmarks. In applying the remuneration principles, the Remco aims to encourage long-term performance and the continual alignment of such performance with the strategic direction and specific value drivers of the business. Executive directors The remuneration of executive directors of Kumba consists of two components: a fixed and a variable component of an annual executive performance incentive and long-term incentives in terms of Kumba s Bonus Share Plan and a Long-term Incentive Plan. 20 Kumba Iron Ore Limited
25 Both fixed and variable components are designed to ensure that a substantial portion of the remuneration package is linked to the achievement of the company s strategic objectives, thereby aligning incentives awarded to improving shareholder value. A portion of the approved cash salary and the annual performance incentive elements of the chief executive, Mr CI Griffith, and chief financial officer, Mr VP Uren, were determined and paid in terms of separate employment agreements concluded between Kumba International Trading SA (KITSA) and the respective executive director for services rendered outside South Africa. The remuneration paid by KITSA is calculated according to the time spent by the director on services performed offshore. Fixed remuneration Following established practice, the fixed salaries of executive directors are reviewed every year in January. Adjustments to the fixed packages are determined with reference to the scope and nature of an individual s role and their performance and experience. The fixed packages are also compared with the median pay ensure market competitiveness and performance excellence. The review also takes into account any change in the scope of the role performed by the individual, changes required to meet the principles of the remuneration policy and market competitiveness. Reward benchmarking is conducted bi-annually when reward elements are compared with those of peer mining companies. In addition to a basic cash salary, executive directors receive benefits that include a contribution towards membership of one of the group s approved medical health care schemes, vehicle benefits, vehicle insurance and security services. There are no other material benefits paid. Retirement and risk benefits, including life cover and death-in-service benefits are provided to executive directors subject to the rules of the Kumba Selector Pension and Provident Funds. During the year, contributions calculated as a percentage of the pensionable income are paid to contributory retirement schemes established and/or approved by the group and subject to the rules of the pension and provident funds. The employer s retirement contribution is 9.5% of cost to company. The rate of contribution for each executive director is calculated on the basis of the assumption that executive directors will retire at the age of 60 years. The basic salaries payable to the executive directors for the 2010 and 2011 financial year and proposed 2012 basic salaries are set out in the table below: 2012 Basic salary Basic salary Basic salary CI Griffith 4,616 4,269 3,953 VP Uren 3,504 3,197 1 Included in the 2012 salary above is EUR51,212 to CI Griffith by KITSA in respect of services to be rendered in Included in the 2011 salary above is EUR49,007 to CI Griffith and USD46,688 to VP Uren by KITSA in respect of services rendered as directors in Annual performance incentives In addition to fixed remuneration, each executive director participates in an executive performance incentive scheme, the Bonus Share Plan (the BSP). This incentive scheme is designed to reward and motivate the achievement of agreed group financial, strategic and performance objectives linked to the key performance areas of their respective portfolios. Cash awards under the BSP are determined annually, based on performance in the previous financial year. Performance of the group is assessed on various financial, business and strategic performance criteria and metrics, targeting EBIT and ROCE. For executive directors cash awards, 50% will reflect the extent to which the company achieved its financial targets in The balance of the cash awards is determined by the extent to which certain personal strategic and other performance objectives were achieved by each executive director in Maximum earnings potential is set at 60% of annual BEC. The group s EBIT target is set at budgeted levels, with an entry threshold at 95% and maximum payout at 110%. The group s ROCE target is set at budgeted levels, with an entry threshold at 30% and maximum payout at 100%. The performance targets for executive directors within Kumba s business operations will vary depending on business-specific strategic value drivers and key objectives as approved by the board. Focused value drivers derived from group business objectives include targets agreed for growth, safety and employment equity to ensure continued focus on these important business objectives. In 2011 the CEO s performance targets were as follows: Kumba financial targets 50%; Safety targets 10%; Production and sales 20%; Anglo American plc earnings per share (EPS) 10%; strategic initiatives and projects 10%. In 2011 the CFO s performance targets were as follows: Kumba financial targets 50%; safety targets 10%; strategy execution, asset optimisation and strategic projects 40%. In February 2011, the Remco considered an overall assessment of the financial performance of the group for the 2010 financial year and considered the personal performances of the participants in this executive performance incentive scheme, against the agreed group financial targets and the levels of achievement against their strategic and other key performance objectives within their respective areas of accountability. Following this, the Remco reported the outcome to the board which then approved the annual incentives for Long-term incentive plans Executive directors and executive management participate in one or more of the long-term incentive schemes described below as proposed by the Remco and approved by the board: since 2008); Kumba Management Share Incentive Scheme (no grants awarded since unbundling). Audited annual financial statements Annual Financial Statements
26 REMUNERATION REPORT FOR THE YEAR ENDED 31 DECEMBER 2011 Bonus share plan The BSP was approved by shareholders at the annual general meeting (AGM) on 20 March 2009 and was implemented in It is offered to directors and senior managers who have the opportunity and the responsibility to contribute towards the group s overall strategic objectives. The rationale for implementing the BSP was to: linked to wealth creation for the group s shareholders; between annual performance objectives and share-based incentives; and thus increase the alignment of employees interests with shareholders; and to enable the company to attract, motivate and retain key management talent. The BSP has two components: bonus award these shares are known as bonus shares. The split between the cash and bonus share elements is determined with reference to the employees grade. The number of bonus shares awarded is determined with reference to the value of the annual cash bonus awarded to each participant. The bonus shares are held by an escrow agent and released to the participant three years after the award date (conditional upon the participant still being in the employment of the Anglo American Group). During the three-year period, the participant is entitled to all rights attaching to the bonus shares, including dividend entitlements and voting rights. There are no performance conditions linked to the bonus shares although the individuals performance determines the actual bonus amount on which these shares are based. The long-term incentive plan Executive directors (and, before 2009, senior management) may, each year, receive on a discretionary basis, a conditional award of Kumba shares. Conditional shares are awarded at 100% of annual BEC at the face value of the underlying Kumba share. Any vesting of each of the annual The Long-term Incentive Plan (LTIP) awards made since the inception of the plan in 2007 is subject to the achievement of stretching performance targets relating to total shareholder return (TSR) (50% of the award) and to a financial measure (ROCE) (50% of the award), over a fixed three-year period. No retesting of the performance conditions is allowed. The part of the share award that is subject to the TSR performance condition is determined to the extent that the company s TSR performance reaches certain hurdles relative to the TSR of an agreed peer group over the same three-year performance period. During 2010, the Remuneration Committee assessed the appropriateness of the peer group and changed the peer group to be more representative of the mining sector of companies. The entire award will vest should TSR/ROCE performance be in the upper quartile as measured against peer group, while 30% will vest should TSR/ROCE performance be at the median of peer group performances. There will be linear vesting for a TSR/ ROCE performance between the median and the upper quartile of the peer group performances. No vesting will occur if TSR/ROCE performance is below the median. Upon vesting the participant will be entitled to shares in Kumba to the value of the vested portion of the conditional award. Such portion of the conditional awards which does not vest at the end of the three-year period will lapse. Executive directors remuneration Executive directors remuneration for the year was as follows: Rand 000 Basic salary Short-term incentive 1 Retirement funding and medical aid Other benefits 2 Total 2011 Total 2010 CI Griffith 3 4,269 2, ,720 6,495 VP Uren 3 3,504 1, ,229 5,255 Total 7,773 3, ,525 13,949 11,750 1 Short-term incentives awarded, based on the group results for the 2011 financial year and including offshore bonuses accrued to Mr CI Griffith of ZAR121,122 (EUR12,214) (six months) and Mr VP Uren of ZAR159,444 (USD21,641) by KITSA. 2 Includes the encashment of leave accrued by Mr CI Griffith of R139,758, and fringe benefit for use of a company car by Mr CI Griffith of R684,188 (2010 and 2011) and Mr VP Uren of R651,381(2010 and 2011) and reimbursed expense of R6,821 paid to Mr VP Uren. 3 Included in basic salary above is salary paid to Mr CI Griffith and Mr VP Uren by KITSA in respect of services rendered to that company in Kumba Iron Ore Limited
27 Executive directors short-term incentives The table below sets out the short-term incentives paid during The short-term incentives awarded are based on performance in the 2010 financial year and calculated as a percentage of basic employment cost approved for the pay cycle. Rand Total fixed remuneration 2010 BEC used for calculating incentive 2011 Annual incentive paid CI Griffith 4,195 3,953 2,044 VP Uren 3,527 3,197 1,618 Executive directors service contracts Annual incentive as a percentage of 2010 total fixed remuneration 49% (52% of BEC) 46% (51% of BEC) Executive directors are not employed on fixed-term contracts and have standard employment service agreements with notice periods of up to 12 months. No restraint of trade provisions apply and no restraint payments have been made during the year. There are no changes to control provisions or any provisions relating to payment on termination of employment. Mr VP Uren stepped down from his role as chief financial officer on 31 December He continues to be employed by Kumba in 2012 and will work exclusively on the legal issues until 30 June June The recruitment process was conducted by an extended nominations group and the appointment was made by the Kumba board. Employment date* Date first appointed to the board CI Griffith 1 July July 2009 VP Uren 7 April April 2006 * In terms of the board charter, the termination of an employment contract of an executive director will result ipso facto in the termination of his membership of the board, unless the board determines otherwise. Non-executive directors fees The Remco recommends fees payable to the non-executive directors for approval by the shareholders. Additional remuneration was paid retrospectively on a once-off basis in respect of additional board meetings held in 2010 in which various legal issues were discussed. The annual fees payable to non-executive directors for the period commencing 1 January 2011 were approved by the shareholders at the AGM in May Fees are approved for an annual period commencing on 1 January each year. The proposed fees for nonexecutive directors for 2012, as noted in the following table, will be submitted to the shareholders for approval at the next AGM in May The proposed fees were determined following a benchmarking exercise using market data, including a survey of the top 40 companies listed on the JSE, which indicated a need for an adjustment to bring the fees in line with the market. The board also considered the increased scope of responsibilities for its committees, taking into account specifically, the fact that both the Remco and Safety, Sustainable Development, Social and Ethics Committees have additional roles as nominations, and social and ethics committees, thereby increasing the workload on the members of the respective committees. The board is of the view that the fee increase proposal is in line with the market and is appropriate. Board meeting fees are set annually and are informed by a market benchmark study conducted by an independent external service provider. These fees are not dependent upon attendance of meetings. No other supplementary fees are payable. Non-executive directors do not participate in any of the company s incentive schemes. Non-executive directors fees approved for 2011 were as follows: Rand Chairman 1,100,000 1,116,000 Director 177, ,000 Audit Committee chairman 197, ,000 Audit Committee member 117, ,800 Risk Committee chairman 158, ,000 Risk Committee member 78,475 83,500 Safety, Sustainable Development, Social and Ethics Committee* chairman 158, ,000 Safety, Sustainable Development, Social and Ethics Committee* member 78, ,800 Human Resources, Remuneration and Nomination Committee chairman 158, ,000 Human Resources, Remuneration and Nomination Committee member 78, ,800 * Previously the Safety and Sustainable Development Committee Non-executive directors are subject to retirement by rotation and re-election by shareholders in accordance with the terms of the articles of association of the company. Executive Committee members remuneration The fixed remuneration of members of the Executive Committee, other than executive directors, was reviewed by the Remco at its meeting held in November The fixed salaries were compared with the median pay levels of other South African mining companies, based on the scope and nature of each individual s role and his or her performance and experience. The Remco at its meeting held in November 2011 approved the appointment of each Executive Committee member as a prescribed officer. The remuneration of each prescribing officer (excluding executive directors) is disclosed in the following table. As is the case with the executive directors, the members of the group Executive Committee participate in the BSP. Audited annual financial statements Annual Financial Statements
28 REMUNERATION REPORT FOR THE YEAR ENDED 31 DECEMBER emoluments The table below provides an analysis of the emoluments paid to executive and non-executive directors, as well as prescribed officers. The table also provides an analysis of the emoluments paid to executive and non-executive directors, as well as the top-earning managers of the company in The 2010 total emoluments have not been restated to include the fair value of long-term incentives awarded during that year. Names (ZAR 000) Base Benefits (retirement and medical aid) Benefits (retirement and medical aid) Incentives based on 2010 performance paid in 2011 Directors fees Additional Directors fees 8 Committee fees Fair value of long-term incentive awards 7 Total emoluments Executive directors 25,394 11,750 CI Griffith 4, ,044 7,073 13,929 6,495 VP Uren 3, ,618 5,897 11,465 5,255 Non-executive directors 3,918 3,416 ZBM Bassa 1, GS Gouws GG Gomwe 2, DD Mokgatle 1,2, DM Weston AJ Morgan 1,2,3,4 1, , PB Matlare 1,3, LM Nyhonyha 1,2 (appointed 14 June 2011) PL Zim 1,100 Prescribed officers (including top three earners) 44,246 27,680 M Schottler 11 2, ,006 1,988 5,405 RJ Botha 11 2, ,852 5,144 C Van Loggerenberg 10 2, ,343 5,490 FM Louw 10 2, ,337 5,457 AC Loots 10 1, ,774 4,889 SV Tyobeka 10 1, ,502 4,202 A Van Den Brink 10 1, ,505 4,181 9,10 1, , , ,360 3,689 VF Malie 10 1, ,167 3,326 Y Mfolo 10 (appointed 1 August 2011) Total 26,686 3,189 10,967 2, ,082 28,798 73,558 42,846 Base salary includes cash and travel allowance Benefits include Kumba Retirement Fund and medical contributions 1 Audit Committee member 2 Risk Committee member 3 Human Resources, Remuneration and Nomination Committee member 4 Safety, Sustainable Development, Social and Ethics Committee member 5 Directors fees ceded to Anglo Operations Limited (AOL), a wholly owned subsidiary of Anglo American plc. 6 Directors fees ceded to Anglo American Services (UK) Limited, a wholly owned subsidiary of Anglo American plc. 7 This relates to the fair value of grants made during the year in terms of the BSP and the LTIP share schemes. The LTIP is subject to stringent performance conditions. The LTIP awards to the extent of achievement of the performance conditions will vest in Bonus shares are included at 100% of face value and the LTIP awards (only for CEO and CFO) at 83.6% of face value, at a volume-weighted average share price of R as at 31 December Additional Directors board meeting fees paid in 2011 in respect of once-off additional board meetings held in Mr LLA Mgadzah was appointed 1 January Executive Committee member 11 Mr M Schottler is employed in the position Legal Counsel Litigation and Mr RJ Botha is the Head of Legal. 24 Kumba Iron Ore Limited
29 Long-term incentive schemes: interests of executive directors and the Executive Committee The interests of the executive directors and of the Executive Committee in shares of the company granted in terms of the various long-term incentive schemes are shown in the tables below. No variations have been made to the terms and conditions of the schemes during the year, including to the performance conditions to which the granting and vesting of the options, rights and conditional awards are subject. BONUS SHARE PLAN Balance at beginning of year Conditional awards granted Shares vested Balance at end of year Weighted average exercise price Rand Share-based payment expense 2011 Rand Rand 000 Number of shares Vesting date Executive directors CI Griffith 15,007 6,025 21,032 2,028 1,084 7,328 7, May ,679 7,679 1 March ,025 2 March 2014 VP Uren 15,731 4,778 20,509 1,843 1,080 9,528 9, May ,203 6,203 1 March ,778 2 March 2014 Total 30,738 10,803 41,541 3,871 2,164 Executive Committee members 73,105* 38,114 (11,610) 1 99,609 11,931 6,248 1 A total of 11,610 share awards vested during the year 1 January 2011 to 31 December 2011 on which a gain of R1,013,032 was realised. LONG-TERM INCENTIVE PLAN Balance at beginning of year Conditional awards granted Shares vested Balance at end of year Weighted average exercise price Rand Share-based payment expense 2011 Rand Rand 000 Number of shares Vesting date Executive directors CI Griffith 37,508 9,634 (7,548) 39,594 2,556 2,185 7,548 18,586 1 April ,586 11,374 2 March ,374 9,634 1 March 2014 VP Uren 31,286 8,326 (5,240) 34,372 2,164 1,788 5,240 16,858 1 April ,858 9,188 2 March ,188 8,326 1 March 2014 Audited annual financial statements Total 68,794 17,960 (12,788) 73,966 4,720 3,973 Executive Committee members 2,546* (2,546) 1 1,592 1 A total of 15,334 conditional share awards vested during the year 1 January 2011 to 31 December 2011 on which a gain of R12,383,139 was realised. Annual Financial Statements
30 REMUNERATION REPORT FOR THE YEAR ENDED 31 DECEMBER 2011 SHARE APPRECIATION RIGHTS SCHEME Balance at beginning of year Rights exercised Balance at end of year Weighted average exercise price Rand Share-based payment expense 2011 Rand Rand 000 Number of rights Executive directors CI Griffith 7,540 7, VP Uren 11,154 (11,154) , ,624 Total 18,694 (11,154) 7, Executive Committee members 14,676* (12,496) 1 2, A total of 23,650 share appreciation rights with a weighted average exercise price of R were exercised during the year 1 January 2011 to 31 December 2011 on which a gain of R4,763,053 was realised (equal to 12,496 Kumba shares on date of vesting). * The differences in the balances at the beginning and at the end of the year to what was previously disclosed for Bonus Share Plan, Long-term Incentive Plan and Share Appreciation Rights Scheme are due to changes in the composition of the Executive Committee. Anglo American plc: Group long-term incentive schemes CI Griffith retained awards granted while he was a participant in certain Anglo American plc Group long-term incentive schemes. CI Griffith no longer receives awards under these schemes. As at 31 December 2011 the following awards in terms of the Anglo Platinum long-term incentives schemes were held by CI Griffith: Balance at beginning and end of year Number Weighted average exercise price Rand Anglo Platinum Executive Share Appreciation Scheme Anglo Platinum Executive Share Option Scheme 2, DIRECTORS BENEFICIAL INTEREST IN KUMBA The aggregate beneficial interest in Kumba at 31 December 2011 of the directors of the company and their immediate families (none of which has a holding greater than 1%) in the issued shares of the company are detailed below. There have been no material changes in these shareholdings since 31 December 2011 and the date of approval of the annual financial statements. Number of shares Long-term incentive scheme shares 1 Total beneficial interest Number of shares 1 Long-term incentive scheme shares 1 Total beneficial interest Executive directors CI Griffith ,166 68, ,055 60,385 VP Uren 1,000 54,881 55,881 11,200 58,819 70,019 Total 1, , ,377 11, , ,404 1 Granted under the Bonus Share Plan, Long-term Incentive Plan and Share Appreciation Rights Scheme as disclosed in the tables above. 26 Kumba Iron Ore Limited
31 PRINCIPAL ACCOUNTING POLICIES FOR THE YEAR ENDED 31 DECEMBER 2011 PRINCIPAL ACCOUNTING POLICIES 1. GENERAL INFORMATION Kumba is the holding company of the Kumba Group. Kumba is a mining group of companies focusing on the exploration, extraction, beneficiation, marketing, sale and shipping of iron ore. Kumba produces iron ore at Sishen and Kolomela mines in the Northern Kumba is a public company which is listed on the JSE Limited and is incorporated and domiciled in the Republic of South Africa. 2. BASIS OF PREPARATION 2.1 Accounting framework The consolidated financial statements are prepared in accordance with International Financial Reporting Standards (IFRS) and International Financial Reporting Interpretation Committee (IFRIC) interpretations of those Standards, the South African Companies Act No 71 of 2008, as amended, the Listings Requirements of the JSE Limited, and the AC 500 standards as issued by the Accounting Practices Board (APB). The financial statements have been prepared in accordance with the historical cost convention except for certain financial instruments, biological assets and share-based payments which are measured at fair value. The consolidated financial statements are prepared on the basis that the group will continue to be a going concern. These accounting policies are consistently applied throughout the group. The following principal accounting policies and methods of computation were applied by the company and the group in the preparation of the consolidated and stand-alone financial statements for the financial year ended 31 December Except as disclosed below, these accounting policies are consistent in all material respects with those applied for the year ended 31 December Statement of compliance ADOPTION OF AMENDMENTS TO EXISTING ACCOUNTING STANDARDS The following amendments and revisions to issued accounting standards which are relevant to the group were adopted and are effective from 1 January 2011: IAS 24, Related party disclosures (amendment) This amendment simplifies the definition of a related party, clarifying its intended meaning and eliminating inconsistencies from the definition and provides a partial exemption from the disclosure requirements for government-related entities. This amendment did not have a significant impact on the reported results for the year ended 31 December Annual Improvements Project 2010 The group adopted the amendments to various issued accounting standards issued by the International Accounting Standards Board (IASB) as part of its Annual Improvements Project 2010 that are effective for reporting periods that commenced on 1 January These amendments did not have an effect on the reported results or the group accounting policies. Other A number of other amendments to accounting interpretations issued by the IASB were applicable for annual periods beginning on or after 1 January 2011 and have consequently been adopted. They have not had a material impact on the accounting policies, methods of computation or presentation applied by the group NEW ACCOUNTING STANDARDS AND INTERPRETATIONS NOT YET ADOPTED At balance sheet date, the following new standards, revisions and amendments to issued accounting standards and interpretations, which are relevant to the group but not yet effective, have not been adopted by the group: IFRS 9, Financial Instruments: Classification and Measurement IFRS 9 is the first step in the process to replace IAS 39, Financial Instruments: Recognition and Measurement. IFRS 9 introduces new requirements for classifying and measuring financial assets, financial liabilities, derecognition and hedge accounting. The standard is not applicable until 1 January 2013 but is available for early adoption. IFRS 9 requires all recognised financial assets that are within the scope of IAS 39 to be subsequently measured at amortised cost or fair value. With regards to financial liabilities, the accounting for changes in the fair value of a financial liability that is designated as at fair value through profit or loss and are attributable to changes in the credit risk of that liability are recognised in comprehensive income, unless it creates or enlarges an accounting mismatch in profit or loss. It is anticipated that IFRS 9 will be adopted in the group s consolidated financial statements for the annual period beginning 1 January It is not anticipated that the application of the new standard will have a significant impact on amounts reported in respect of the group s financial assets and financial liabilities as the majority of financial assets and financial liabilities are carried at amortised cost as disclosed in note 29. However, it is not practicable to provide a reasonable estimate of that effect until a detailed review has been completed. IFRS 10, Consolidated financial statements This standard builds on existing principles by identifying the concept of control as the determining factor in whether an entity should be included within the consolidated financial statements. The standard provides additional guidance to assist in determining control where this is difficult to assess. The standard is effective for annual periods beginning on or after 1 January Audited annual financial statements Annual Financial Statements
32 PRINCIPAL ACCOUNTING POLICIES FOR THE YEAR ENDED 31 DECEMBER 2011 The group is currently in the process of evaluating the detailed requirements of this new standard in order to assess whether this new standard potentially impacts on the entities that the group consolidates as its subsidiaries. IFRS 11, Joint arrangements This standard provides for a more realistic reflection of joint arrangements by focusing on the rights and obligations of the arrangement, rather than its legal form. There are two types of joint arrangements: joint operations and joint ventures. Proportional consolidation of joint ventures will no longer be allowed. The standard is effective for annual periods beginning on or after 1 January The group is currently in the process of evaluating the detailed requirements of this new standard in order to assess the possible impact on the group s financial statements. IFRS 12, Disclosures of interests in other entities This standard includes the disclosure requirements for all forms of interests in other entities, including joint arrangements, associates, special purpose vehicles and other off-balance sheet vehicles. The standard is effective for annual periods beginning on or after 1 January The group is currently in the process of evaluating the detailed requirements of this new standard in order to assess the possible impact on the group s financial statements. IFRS 13, Fair value measurement This standard aims to improve consistency and reduce complexity by providing a precise definition of fair value and a single source of fair value measurement and disclosure requirements for use across IFRSs. The requirements do not extend the use of fair value accounting but provide guidance on how it should be applied where its use is already required or permitted by other standards within IFRS. The standard is effective for annual periods beginning on or after 1 January The group is currently in the process of evaluating the detailed requirements of this new standard in order to assess the possible impact on the group s financial statements. IFRIC 20, Stripping costs in the production phase of a surface mine In surface mining operations, entities may find it necessary to remove mine waste materials (overburden) to gain access to mineral ore deposits. This waste removal activity is known as stripping. The interpretation clarifies there can be benefits accruing to an entity from stripping activity: usable ore that can be used to produce inventory and improved access to further quantities of material that will be mined in future periods. The interpretation considers when and how to account separately for these benefits arising from the stripping activity, as well as how to measure these benefits both initially and subsequently. The standard is effective for annual periods beginning on or after 1 January The group is currently in the process of evaluating the detailed requirements of this new interpretation in order to assess the possible impact on the group s financial statements. It is anticipated that the application of the interpretation will not have a significant impact on the group s operations as the interpretation is in line with the group s current accounting policy on waste stripping cost. Amendment to IFRS 7, Financial Instruments: Disclosures The amendments to IFRS 7 increase the disclosure requirements for transactions involving transfers of financial assets. These amendments are intended to provide greater transparency around risk exposures when a financial asset is transferred but the transferor retains some level of continuing exposure in the asset. The amendments also require disclosures where transfers of financial assets are not evenly distributed throughout the period. The amendment is effective for periods beginning on or after 1 July It is not anticipated that this amendment will have a significant effect on the group s disclosures. Amendment to IAS 12, Income Taxes on Deferred Tax The amendment introduces an exception to the existing principle for the measurement of deferred tax assets or liabilities arising on investment property measured at fair value. As a result of the amendments, SIC 21, Income Taxes Recovery of Revalued Non-depreciable Assets, would no longer apply to investment properties carried at fair value. The amendments also incorporate into IAS 12 the remaining guidance previously contained in SIC 21, which is accordingly withdrawn. The amendment is effective for periods beginning on or after 1 January It is not expected that this amendment will have any impact on the group s financial statements as the group does not have any investment properties at present. Other A number of other amendments to accounting standards and interpretations issued by the IASB are effective for annual periods beginning on or after 1 January They are not expected to have an impact on the accounting policies, methods of computation or presentation applied by the group. 2.3 Foreign currencies Items included in the financial results of each group entity are measured using the functional currency of that entity. The functional currency of an entity is the currency of the primary economic environment in which the entity operates. The consolidated financial results are presented in rand, which is Kumba s functional and the group s presentation currency. FOREIGN CURRENCY TRANSACTIONS Transactions are translated into the functional currency of an entity at the rate of exchange ruling at the transaction date. Monetary assets and liabilities that are denominated in foreign currencies are translated into the functional currency of an entity at the rate of exchange ruling at the balance sheet date. Foreign exchange gains and losses arising on translation are recognised in the income statement, except where they relate to cash flow hedging activities in which case they are recognised in the statement of changes in equity. FOREIGN OPERATIONS The financial results of all entities that have a functional currency different from the presentation currency of their parent entity are translated into the presentation currency. All assets and liabilities, including fair value adjustments arising on acquisitions, are translated at the rate of exchange ruling at the balance sheet date. Income and expenditure transactions of foreign operations are translated at the average rate of exchange. Resulting foreign exchange gains and losses arising on translation are recognised in the foreign currency translation reserve (FCTR) as a separate component of equity. Goodwill and fair value adjustments arising on the acquisition of a foreign entity are treated as assets and/or liabilities of the foreign entity and translated at the closing rate. 28 Kumba Iron Ore Limited
33 On disposal of part or all of the investment, the proportionate share of the related cumulative gains and losses previously recognised in the foreign currency translation reserve in the statement of changes in equity are recognised in the income statement on disposal of that investment. 2.4 Segment reporting Operating segments are reported in a manner consistent with the internal reporting provided to the chief operating decision-maker. The chief operating decision-maker, who is responsible for allocating resources and assessing performance of the operating segments, has been identified as the Kumba Executive Committee. Management has determined the operating segments of the group based on the reports reviewed by the Executive Committee that are used to make strategic decisions. The Executive Committee considers the business principally according to the nature of the products and service provided, with the segment representing a strategic business unit. The reportable operating segments derive their revenue primarily from mining, extraction, production and selling of iron ore and shipping operations charged to external clients. 2.5 Post-balance sheet events Recognised amounts in the financial statements are adjusted to reflect events arising after the balance sheet date that provide evidence of conditions that existed at the balance sheet date. Events after the balance sheet that are indicative of conditions that arose after the balance sheet date are dealt with by way of a note. SUBSIDIARIES Subsidiaries are those entities (including special purpose entities) over which the group has the power to exercise control. Control is achieved where the group has the ability, directly or indirectly, to govern the financial and operating policies of an entity so as to obtain benefits from its activities. The financial results of subsidiaries acquired or disposed of during the year are included in the consolidated income statement from the effective date of acquisition or up to the effective date of disposal, as appropriate. NON-CONTROLLING INTERESTS The effects of transactions with non-controlling interests are recorded in equity as transactions with equity owners of the group. For purchases from non-controlling interests, the difference between any consideration paid and the relevant share acquired of the carrying value of net assets of the subsidiary is recorded in equity. Gains or losses on disposals to non-controlling interests are also recorded in equity. When the group ceases to have control or significant influence, any retained interest in the entity is remeasured to its fair value, with the change in carrying amount recognised in profit or loss. The fair value is the initial carrying amount for the purposes of subsequently accounting for the retained interest as an associate, joint venture or financial asset. In addition, any amounts previously recognised in comprehensive income in respect of that entity are accounted for as if the group had directly disposed of the related assets or liabilities. This may mean that amounts previously recognised in comprehensive income are reclassified to profit or loss. 2.6 Comparative figures Comparative figures are restated in the event of a change in accounting policy. 3. COMPANY FINANCIAL STATEMENTS Subsidiaries, associates and joint ventures Investments in subsidiaries, associates and joint ventures in the separate financial statements presented by Kumba are recognised at cost less accumulated impairment. 4. CONSOLIDATED FINANCIAL STATEMENTS 4.1 Basis of consolidation The consolidated financial statements present the financial position and changes therein, operating results and cash flow information of the group. The group comprises Kumba, its subsidiaries and interests in joint ventures and associates. Where necessary, adjustments are made to the results of subsidiaries, joint ventures and associates to ensure the consistency of their accounting policies with those used by the group. Intercompany transactions, balances and unrealised profits and losses between group companies are eliminated on consolidation. In respect of joint ventures and associates, unrealised profits and losses are eliminated to the extent of the group s interest in these entities. Unrealised profits and losses arising from transactions with associates are eliminated against the investment in the associate. ASSOCIATES Associates are investments over which the group is in a position to exercise significant influence, but not control or joint control, through participation in the financial and operating policy decisions of the investee. Typically the group owns between 20% and 50% of the voting equity. Investments in associates are accounted for using the equity method of accounting from the date on which significant influence commences until the date that significant influence ceases, and are initially recognised at cost. Under this method the group s share of post-acquisition profits or losses of associates is recognised in the income statement as equity accounted earnings and its share of movements in post-acquisition equity reserves is recognised in the statement of changes in equity. All cumulative post-acquisition movements in the equity of associates are adjusted against the carrying value of the investment. When the group s share of losses in associates equals or exceeds its interest in those associates, the group does not recognise further losses, unless the group has incurred a legal or constructive obligation or made payments on behalf of those associates. If the ownership interest in an associate is reduced but significant influence is retained, only a proportionate share of the amounts previously recognised in comprehensive income are reclassified to profit or loss where appropriate. Goodwill identified on acquisition relating to associates is included in the carrying value of those associates. The total carrying value of associates, including goodwill, is evaluated annually for impairment or when conditions indicate that a decline in fair value below the carrying amount is other than temporary. If impaired, the carrying value of the group s share of the underlying net assets of associates is written down to its estimated recoverable Audited annual financial statements Annual Financial Statements
34 PRINCIPAL ACCOUNTING POLICIES FOR THE YEAR ENDED 31 DECEMBER 2011 amount in accordance with the accounting policy on impairment and recognised in the income statement as part of equity accounted earnings of those associates. Results of associates are equity accounted from their most recent audited annual financial statements or unaudited interim financial statements. JOINT VENTURES A joint venture is an economic entity in which the group holds a long-term interest and shares joint control over strategic, financial and operating decisions with one or more other venturers established under a contractual arrangement. It may involve a corporation, partnership or other entity in which the group has an interest. The group s share of the assets, liabilities, income, expenditure and cash flows of joint ventures are accounted for using the proportionate consolidation method. The proportionate share of the financial results of joint ventures is consolidated into the consolidated financial statements from date on which joint control commences until such time as joint control ceases. Proportionate consolidation combines the group s share of the financial results of the joint venture on a line-by-line basis with similar items in the consolidated financial statements. BALANCE SHEET 4.2 Property, plant and equipment Land and assets that are in the process of being constructed, which include capitalised development and mineral exploration and evaluation costs, are measured at cost less accumulated impairment and are not depreciated. All other classes of property, plant and equipment are stated at cost less accumulated depreciation and accumulated impairment. The cost of an item of property, plant and equipment shall be recognised as an asset if it is probable that future economic benefits associated with the item will flow to the entity and the cost of the item can be measured reliably. The cost of items of property, plant and equipment include all costs incurred to bring the assets to the location and condition necessary for their intended use by the group. The cost of self-constructed assets includes expenditure on materials, direct labour and an allocated proportion of project overheads. The cost of property, plant and equipment may also include: rehabilitation costs to the extent that they relate to the asset; that asset; The cost of items of property, plant and equipment is capitalised into its various components where the useful life of the components differ from the main item of property, plant and equipment to which the component can be logically assigned. Expenditure incurred to replace or modify a significant component of property, plant and equipment is capitalised and any remaining carrying value of the component replaced is written off as an expense in the income statement. Subsequent expenditure on property, plant and equipment is capitalised only when the expenditure enhances the value or output of the asset beyond original expectations and it can be measured reliably. Costs incurred on repairing and maintaining assets are recognised in the income statement in the period in which they are incurred. Gains and losses on the disposal of property, plant and equipment, which are represented by the proceeds on disposal of such assets less their carrying values at that date, are recognised in the income statement. DEPRECIATION Depreciation is charged on a systematic basis over the estimated useful lives of the assets after taking into account the estimated residual value of the assets. Depreciation commences on self-constructed assets when they are ready for their intended use by the group. The useful life of an asset is the period of time over which the asset is expected to be used (straight-line method of depreciation). The estimated useful lives of assets and their residual values are reassessed annually, with any changes in such accounting estimates being adjusted in the year of reassessment and applied prospectively. The estimated useful lives of items of property, plant and equipment are: Mineral properties years Residential buildings 5 23 years Buildings and infrastructure 5 23 years Mobile equipment, built-in process computers and reconditionable spares 2 23 years Fixed plant and equipment 4 23 years Loose tools and computer equipment 5 years Mineral exploration, site preparation and development 5 23 years RESEARCH, DEVELOPMENT, MINERAL EXPLORATION AND EVALUATION COSTS Research, development, mineral exploration and evaluation costs are expensed in the year in which they are incurred until they result in projects that the group: Once these criteria are met, all directly attributable development costs and ongoing mineral exploration and evaluation costs are capitalised within property, plant and equipment. Capitalisation of pre-production expenditure ceases when the mining property is capable of commercial production. During the development of a mine, before production commences, stripping expenses are capitalised as part of the investment in construction of the mine. Capitalised pre-production expenditure prior to commercial production is assessed for impairment in accordance with the group accounting policy stated below. WASTE STRIPPING EXPENSES The removal of overburden or waste is required to obtain access to the ore body. To the extent that the actual stripping ratio is higher than the average LOM stripping ratio in the early years of a mine s production phase, the mining costs associated with this process are deferred and charged to operating costs using the expected average stripping ratio over the average life of the area being mined. The effect of this will therefore be that the cost of stripping in profit or loss will be reflective of the average stripping rates for the ore body as a whole. This reflects the fact that waste removal is necessary to gain access to the ore body and therefore realise future economic benefit. 30 Kumba Iron Ore Limited
35 The average LOM stripping ratio is calculated as the number of tonnes of waste material expected to be removed during the LOM, per tonne of ore mined. The average LOM cost per tonne is calculated as the total expected mining costs to be incurred to mine the ore body divided by the number of tonnes expected to be mined. Where the pit profile is such that the actual stripping ratio is below the average LOM stripping ratio in the early years no deferral takes place as this would result in recognition of a liability for which there is no obligation. Instead this position is monitored and when the cumulative calculation reflects a debit balance deferral commences. 4.3 Business combinations and goodwill BUSINESS COMBINATIONS The purchase method of accounting is used when a business is acquired. On acquisition date, fair values are attributed to the identifiable assets, liabilities and contingent liabilities. The non-controlling interest at acquisition date is determined as the non-controlling shareholders proportionate share of the fair value of the net assets of subsidiaries acquired. The cost of acquisition is measured as the fair value of the group s contribution to the business combination in the form of assets transferred, shares issued or liabilities assumed at the acquisition date plus all costs directly attributable to the acquisition. Fair values of the identifiable assets and liabilities are determined by reference to market values of those or similar items at the acquisition date, irrespective of the extent of any non-controlling interests, where these values are available. Alternatively, these values are determined by discounting expected future cash flows to present values. GOODWILL Goodwill is measured at cost less accumulated impairment, if any. Goodwill represents the excess of the cost of an acquisition over the fair value of the group s share of the identifiable net assets of the acquired entity at the date of acquisition. Goodwill is assessed for impairment on an annual basis. Once any impairment has occurred on a specific goodwill item, the impairment losses will not be reversed in future periods. Negative goodwill arises when the cost of acquisition is less that the fair value of the net identifiable assets and contingent liabilities of the entity acquired. Negative goodwill is recognised directly in the income statement. The gain or loss on disposal of an entity includes the balance of goodwill relating to the entity sold. Goodwill is allocated to cash-generating units for the purpose of impairment testing. The allocation is made to those cash-generating units or groups of cash-generating units that are expected to benefit from the business combination from which the goodwill arose identified according to operating segment. 4.4 Impairment of non-financial assets The group s non-financial assets, other than inventories and deferred tax, are reviewed to determine whether there is any indication that those assets are impaired whenever events or changes in circumstances indicate that the carrying value may not be recoverable. If any such indication exists, the recoverable amount of the asset is estimated in order to determine the extent of the impairment. Recoverable amounts are estimated for individual assets. Where an individual asset cannot generate cash inflows independently, the assets are grouped at the lowest level for which there are separately identifiable cash flows (cash-generating units). The recoverable amount is determined for the cash-generating unit to which the asset belongs. The impairment loss recognised in the income statement is the excess of the carrying value over the recoverable amount. Recoverable amount is the higher of fair value less costs to sell and value in use. In assessing value in use, the estimated future cash flows are discounted to their present value using a pre-tax discount rate. The discount rate reflects the current market assessments of the time value of money and the risks specific to the asset for which estimates of future cash flows have not been adjusted. If the recoverable amount of an asset or cash-generating unit is estimated to be less than its carrying amount, the carrying amount of the asset or cash-generating unit is reduced to its recoverable amount and an impairment loss is recognised in the income statement. A previously recognised impairment will be reversed insofar as estimates change as a result of an event occurring after the impairment was recognised. An impairment is reversed only to the extent that the asset or cash-generating unit s carrying amount does not exceed the carrying amount that would have been determined had no impairment been recognised. A reversal of an impairment is recognised in the income statement. Exploration and evaluation assets are tested for impairment when development of the property commences or whenever facts and circumstances indicate impairment. An impairment is recognised for the amount by which the exploration assets carrying amount exceeds their recoverable amount. For the purpose of assessing impairment, the relevant exploration and evaluation assets are included in the existing cash-generating units of producing properties that are located in the same region. 4.5 Biological assets Biological assets are measured on initial recognition and at each balance sheet date at their fair value less estimated costs to sell, with these fair value adjustments recognised as income and expenditure in the income statement in the period in which they occur. Biological assets comprise livestock and game. The fair value of livestock is determined based on market prices taking into account commercially. The fair value of game is the market price for the game, determined using auction selling prices achieved for live game. Both livestock and game held for sale are classified as consumable biological assets. 4.6 Financial instruments Purchases and sales of financial instruments are recognised on the trade-date, being the date on which the group becomes party to the contractual provisions of the relevant instrument. The financial instruments are initially measured at fair value plus transaction costs that are directly attributable to the acquisition or issue of the financial asset or financial liability, with the exception of at fair value through profit or loss assets which are initially recognised at fair value, and transaction costs are expensed in the income statement. The fair values are based on quoted bid prices or amounts derived using discounted cash flow models. Subsequent to initial recognition, the instruments are measured as set out on the next page. Audited annual financial statements Annual Financial Statements
36 PRINCIPAL ACCOUNTING POLICIES FOR THE YEAR ENDED 31 DECEMBER 2011 Financial assets (other than derivative financial instruments) The group classifies all of its financial assets into the at fair value through profit or loss (FVTPL) and loans and receivables categories. This classification is dependent on the purpose for which the financial asset is acquired. Management determines the classification of its financial assets at the time of the initial recognition and re-evaluates such designation annually. FVTPL financial assets are financial assets that are designated by the group as at FVTPL on initial recognition. A financial asset is designated in this category if it is managed and its performance is evaluated on a fair value basis, in accordance with documented risk management policies. Assets in this category are included in non-current assets unless the investment matures or management intends to dispose of it within 12 months of the end of the reporting period. Financial assets at FVTPL are subsequently carried at fair value. Gains or losses arising from changes in the fair value of this category are presented in the income statement within finance gains/(losses) in the period in which they arise. Loans and receivables are non-derivative financial assets with fixed or determinable payments that are not quoted in an active market. They are included in current assets, except for maturities greater than 12 months after the end of the reporting period. These are classified as non-current assets. Loans and receivables are subsequently carried at amortised cost using the effective interest method. TRADE RECEIVABLES Trade receivables are amounts due from customers for iron ore sold or shipping services rendered in the ordinary course of business. CASH AND CASH EQUIVALENTS Cash and cash equivalents comprise cash on hand, deposits held on call, and investments in money market instruments that are readily convertible to a known amount of cash, all of which are available for use by the group unless otherwise stated. IMPAIRMENT Loans and receivables are assessed at each balance sheet date to determine whether objective evidence exists that a financial asset is impaired. A financial asset or a group of financial assets is impaired and impairment losses are incurred only if there is objective evidence of impairment as a result of one or more events that occurred after the initial recognition of the asset and that loss has an impact on the estimated future cash flows of the financial asset or group of financial assets that can be reliably estimated. To the extent that the carrying value of an individual or group of assets exceeds the present value of estimated future cash flows (excluding future credit losses that have not been incurred) discounted at the financial asset s original effective interest rate of those assets, an impairment loss is recognised by way of an allowance account in the income statement. An impairment is reversed when evidence exists that an impairment has decreased. The reversal does not result in the carrying amount of the financial asset exceeding what the amortised cost would have been had the impairment not been recognised at the date the impairment is reversed. The amount of the reversal is recognised in the income statement. DERECOGNITION: FINANCIAL ASSETS Financial assets are derecognised when the rights to receive cash flows from the assets have expired, the right to receive cash flows has been retained but an obligation to on-pay them in full without material delay has been assumed or the right to receive cash flows has been transferred together with substantially all the risks and rewards of ownership. Financial liabilities (other than derivative financial instruments) A financial liability is a contractual obligation to deliver cash or another financial asset to another entity or to exchange financial assets or financial liabilities with another entity under conditions that are potentially unfavourable to the entity. They are included in current liabilities, except for maturities greater than 12 months after the balance sheet date. These are classified as non-current liabilities. Financial liabilities comprise short-term and long-term interestbearing borrowings and trade and other payables (excluding income received in advance). Financial liabilities are subsequently carried at amortised cost using the effective interest method. Interest calculated using the effective interest rate method is recognised in profit or loss. BORROWINGS Borrowings comprise short-term and long-term interest-bearing borrowings. Premiums or discounts arising from the difference between the fair value of borrowings raised and the amount repayable at maturity date are recognised in the income statement as borrowing costs based on the effective interest rate method. TRADE PAYABLES Trade payables are obligations to pay for goods or services that have been acquired in the ordinary course of business from suppliers. DERECOGNITION: FINANCIAL LIABILITIES Financial liabilities are derecognised when the associated obligation has been discharged, cancelled or has expired. EQUITY INSTRUMENTS An equity instrument is any contract that evidences a residual interest in the assets of the group after deducting all of its liabilities, and includes ordinary share capital. Equity instruments issued by the group are recorded at the proceeds received, net of direct issue costs. DERIVATIVE FINANCIAL INSTRUMENTS Derivative instruments are categorised as at FVTPL financial instruments held for trading and are classified as current assets or liabilities. All derivative instruments are initially recognised at fair value on the date a derivative contract is entered into and are subsequently remeasured at fair value at balance sheet date. Resulting gains or losses on derivative instruments, excluding designated and effective hedging instruments, are recognised in the income statement. 32 Kumba Iron Ore Limited
37 The group s criteria for a derivative instrument to be designated as a hedging instrument require that: effective in achieving offsetting changes in fair value or cash flows attributable to the hedged risk; throughout the duration of the hedge; of the hedge; and of the hedge is highly probable. A derivative instrument is classified as a cash flow hedge when it is designated and qualifies as hedge of a particular risk associated with a recognised asset or liability or highly probable forecasted transaction. The effective portion of any fair value gain or loss arising on such a derivative instrument is classified in comprehensive income as a cash flow hedge accounting reserve until the underlying transaction occurs. The ineffective part of any gain or loss is recognised immediately in the income statement within finance gains/(losses). If the forecasted transaction results in the recognition of a nonfinancial asset or non-financial liability, the associated gain or loss is transferred from the cash flow hedge accounting reserve and included in the initial measurement of the cost of the underlying asset or liability on the transaction date. For hedges that do not result in the recognition of a non-financial asset or liability, amounts deferred in equity are recognised in the income statement in the same period in which the hedged item affects profits or loss. Hedge accounting is discontinued when the hedging instrument expires or is sold, terminated, exercised, revoked, or no longer qualifies for hedge accounting. At that time, any cumulative gain or loss on the hedging instrument recognised in equity is retained in equity until the forecast transaction occurs. If a hedge transaction is no longer expected to occur, the net cumulative gain or loss previously recognised in equity is included in the income statement within finance gains/(losses) for the period. OFFSET Where a legally enforceable right of offset exists for recognised financial assets and financial liabilities, and there is an intention to settle the liability and realise the asset simultaneously, or to settle on a net basis, all related financial effects are offset and the net amount is reported in the balance sheet. 4.7 Inventories Inventories, which comprise finished products, work-in-progress, plant spares and stores, raw material and merchandise, are measured at the lower of cost, determined on a weighted average basis, and net realisable value. The cost of finished goods and work-in-progress comprises raw materials, direct labour, other direct costs and fixed production overheads, but excludes finance costs. Fixed production overheads are allocated on the basis of normal capacity. Plant spares and consumable stores are capitalised to the balance sheet and expensed to the income statement as they are utilised. Net realisable value is the estimated selling price in the ordinary course of business, less the cost of completion and selling expenses. Write-downs to net realisable value and inventory losses are expensed in the income statement in the period in which the writedowns or losses occur. 4.8 Share capital Ordinary shares are classified as equity instruments. Incremental costs directly attributable to the issue of new shares are shown in equity as a deduction there from, net of tax. Incremental costs directly attributable to the issue of new shares for the acquisition of a business are included in the cost of acquisition as part of the purchase consideration. 4.9 Treasury shares When the group acquires its own share capital, the amount of the consideration paid, including directly attributable costs, net of any related tax benefit, is recognised as a change in equity. Shares repurchased by the issuing entity are cancelled. Shares repurchased by group entities are classified as treasury shares and are held at cost. These shares are treated as a deduction from the issued and weighted average number of shares, and the cost price of the shares is presented as a deduction from total equity. The par value of the shares is presented as a deduction from ordinary share capital and the remainder of the cost is presented as a deduction from ordinary share premium. Dividends received on treasury shares are eliminated on consolidation Dividends payable Dividends payable and the related taxation thereon are recognised by the group when the dividend is declared. These dividends are recorded and disclosed as dividends in the statement of changes in equity. Secondary Taxation on Companies (STC) in respect of such dividends is recognised as a liability when the dividends are recognised as a liability and are included in the taxation charge in profit or loss. Dividends proposed or declared subsequent to the balance sheet date are not recognised, but are disclosed in the notes to the consolidated financial statements Provisions Provisions are recognised when the group has a present legal or constructive obligation as a result of past events, for which it is probable that an outflow of economic benefits will be required to settle the obligation, and a reliable estimate can be made of the amount of the obligation. Provisions are not recognised for future operating losses. ENVIRONMENTAL REHABILITATION Environmental rehabilitation provisions The provision for environmental rehabilitation is recognised as and when an obligation to incur rehabilitation and mine closure costs arises from environmental disturbance caused by the development or ongoing production of a mining property. Estimated long-term environmental rehabilitation provisions are measured based on the group s environmental policy taking into account current technological, environmental and regulatory requirements. Any subsequent changes to the carrying amount of the provision resulting from changes to the assumptions applied in estimating the obligation are recognised in the income statement. Audited annual financial statements Annual Financial Statements
38 PRINCIPAL ACCOUNTING POLICIES FOR THE YEAR ENDED 31 DECEMBER 2011 Contributions to rehabilitation trust Annual contributions are made to a dedicated environmental rehabilitation trust to fund the estimated cost of rehabilitation during and at the end of the life of the group s mines. The group exercises full control over this trust and therefore the trust is consolidated. The trust s assets are recognised separately on the balance sheet as non-current assets at fair value. Interest earned on funds invested in the environmental rehabilitation trust is accrued on a time-proportion basis and recognised as interest income. Ongoing rehabilitation expenditure Ongoing rehabilitation expenditure is recognised in the income statement as incurred. DECOMMISSIONING PROVISION The estimated present value of costs relating to the future decommissioning of plant or other site preparation work, taking into account current environmental and regulatory requirements, is capitalised as part of property, plant and equipment, to the extent that it relates to the construction of an asset, and the related provisions are raised in the balance sheet, as soon as the obligation to incur such costs arises. These estimates are reviewed at least annually and changes in the measurement of the provision that result from the subsequent changes in the estimated timing or amount of cash flows, or a change in discount rate, are added to, or deducted from, the cost of the related asset in the current period. If a decrease in the liability exceeds the carrying amount of the asset, the excess is recognised immediately in the income statement. If the asset value is increased and there is an indication that the revised carrying value is not recoverable, an impairment test is performed in accordance with the accounting policy on Impairment of non-financial assets above. EMPLOYEE BENEFITS CASH-SETTLED SHARE-BASED PAYMENTS Refer to the Employee benefits equity compensation benefits accounting policy note below Deferred tax Deferred tax is recognised using the liability method, on all temporary differences between the carrying values of assets and liabilities for accounting purposes and the tax bases of these assets and liabilities used for tax purposes and on any tax losses. No deferred tax is provided on temporary differences relating to: asset or liability to the extent that neither accounting nor taxable profit is affected on acquisition; and reverse in the foreseeable future. Deferred tax liabilities are generally recognised for all taxable temporary differences and deferred tax assets are recognised to the extent that it is probable that taxable profits will be available against which deductible temporary differences can be utilised. Deferred tax liabilities are recognised for taxable temporary differences arising from investments in subsidiaries, associates and joint ventures, except where the group is able to control the reversal of the temporary difference and it is probable that the temporary difference will not reverse in the foreseeable future. When dividends received during the current year can be offset against future dividend payments to reduce the secondary tax (STC) liability, a deferred tax asset is recognised to the extent of the future reduction in STC. The carrying amount of deferred tax assets is reviewed at each balance sheet date and is adjusted to the extent that it is no longer probable that sufficient taxable profit will be available to allow all of the assets to be recovered. Deferred tax is calculated at the tax rates that are expected to apply in the period when the liability is settled or the asset is realised. Deferred tax is recognised in the income statement, except when it relates to items recognised directly to equity, in which case the deferred tax is also taken directly to equity. Deferred tax assets and liabilities are offset when they relate to income taxes levied by the same taxation authority and the group intends, and is able to, settle its current tax assets and liabilities on a net basis Employee benefits LONG-TERM BENEFITS The vesting portion of long-term benefits is recognised and provided at balance sheet date, based on the current total cost to the group. POST-EMPLOYMENT BENEFITS The group operates defined contribution plans for the benefit of its employees, the assets of which are held in separate funds. A defined contribution plan is a pension plan under which the group pays fixed contributions into a separate entity. The group has no legal or constructive obligations to pay further contributions if the fund does not hold sufficient assets to pay all employees the benefits relating to employee service in the current and prior periods. The plan is funded by payments from employees and the group. The group s contribution to the funds is recognised as employee benefit expense in the income statement in the year to which it relates. The group does not provide guarantees in respect of the returns in the defined contribution funds and has no further payment obligations once the contributions have been paid. The group is also a participating employer in two closed defined benefit plans for its pensioner members who retired before The group does not, however, provide defined employee benefits to its current employees. A defined benefit plan is a pension plan that is not a defined contribution plan. Typically defined benefit plans define an amount of pension benefit that an employee will receive on retirement, usually dependent on one or more factors such as age, years of service and compensation. Statutory actuarial valuations on the defined benefit plans are performed every three years, using the projected unit credit method. Valuations are performed on a date which coincides with the balance sheet date. Consideration is given to any event that could impact the funds up to balance sheet date. TERMINATION BENEFITS Termination benefits are payable whenever an employee s employment is terminated before the normal retirement date or whenever an employee accepts voluntary redundancy in exchange for these benefits. 34 Kumba Iron Ore Limited
39 The group recognises termination benefits when it has demonstrated its commitment to either terminate the employment of current employees according to a detailed formal plan without possibility of withdrawal or to provide termination benefits as a result of an offer made to encourage voluntary redundancy. If the benefits are due more than 12 months after balance sheet date, they are discounted to present value Cost of sales When inventories are sold, the carrying amount is recognised as part of cost of sales. Any write-down of inventories to net realisable value and all losses of inventories or reversals of previous write downs or losses are recognised in cost of sales in the period the write down, loss or reversal occurs. EQUITY COMPENSATION BENEFITS The various equity compensation schemes operated by the group allow certain senior employees, including executive directors, the option to acquire shares in Kumba over a prescribed period in return for services rendered. These options are settled by means of the issue of shares. Such equity-settled share-based payments are measured at fair value at the date of the grant. The fair value determined at the grant date of the equity-settled share-based payments is charged as employee costs on a straight-line basis over the period that the employees become unconditionally entitled to the options, based on management s estimate of the shares that will vest and adjusted for the effect of non market-based vesting conditions. These share options are not subsequently revalued. The fair value of the share options is measured using option pricing models. The expected life used in the models has been adjusted, based on management s best estimate, for the effects of non-transferability, exercise restrictions and behavioural considerations such as volatility, dividend yield and the vesting period. The fair value takes into account the terms and conditions on which these incentives are granted and the extent to which the employees have rendered services to balance sheet date. INCOME STATEMENT 4.14 Revenue Revenue is derived principally from the sale of iron ore and shipping services rendered. Revenue is measured at the fair value of the consideration received or receivable for the sale of goods and service in the ordinary course of the group s activities. Revenue excludes value-added tax (VAT), discounts, volume rebates and sales between group companies, and represents the gross value of goods invoiced. The group recognises revenue when the amount of revenue can be reliably measured, it is probable that future economic benefits will flow to the entity and when specific criteria have been met for each of the group s activities as described below. SALES OF GOODS IRON ORE Revenue from the sale of iron ore is recognised when significant risks and rewards of ownership of the goods are transferred to the buyer. Export revenues are recorded when the risks and rewards of ownership are transferred as indicated by the relevant sales terms stipulated in the sales contract Income from investments INTEREST INCOME Interest is recognised on the time proportion basis, taking into account the principal amount outstanding and the effective interest rate over the period to maturity, when it is determined that such income will accrue to the group. DIVIDEND INCOME Dividends received are recognised when the right to receive payment is established Borrowing costs Interest on borrowings directly relating to the financing of qualifying capital projects under construction is added to the capitalised cost of those projects during the construction phase, until such time as the assets are substantially ready for their intended use or sale which, in the case of mining properties, is when they are capable of commercial production. Where funds have been borrowed specifically to finance a project, the amount capitalised represents the actual borrowing costs incurred. Where the funds used to finance a project form part of general borrowings, the amount capitalised is calculated using a weighted average of rates applicable to relevant general borrowings of the group during the period. All other borrowing costs are recognised in profit or loss in the period in which they are incurred Employee benefits: short-term benefits The cost of all short-term employee benefits, such as salaries, bonuses, housing allowances, medical and other contributions is recognised in the income statement during the period in which the employee renders the related service Operating leases The group leases property and equipment. Under the leasing agreements all the risks and benefits of ownership are effectively retained by the lessor and are classified as operating leases. Payments made under operating leases are expensed in the income statement on a straight-line basis over the period of the lease. Audited annual financial statements SHIPPING SERVICES Revenue arising from shipping services rendered is recognised based on the percentage of completion method based on the services performed to date as a percentage of the total services to be performed, and is only recognised when the stage of completion can be measured reliably. Annual Financial Statements
40 PRINCIPAL ACCOUNTING POLICIES FOR THE YEAR ENDED 31 DECEMBER Taxation The income tax charge for the period is determined based on profit before tax for the year and comprises current, deferred tax and STC. Tax is recognised in the income statement, except to the extent that it relates to items recognised in comprehensive income or directly in equity. In this case the tax is also recognised in comprehensive income or directly in equity, respectively. CURRENT TAX The current tax charge is the calculated tax payable on the taxable income for the year using tax rates that have been enacted or substantively enacted by the balance sheet date and any adjustments to tax payable in respect of prior years. Taxable profit differs from net profit as reported in the income statement because it excludes items of income or expense that are taxable or deductible in other years and it further excludes items that are not taxable or deductible. STC STC is recognised as part of the current tax charge in the income statement when the related dividend is declared. When dividends received during the current year can be offset against future dividend payments to reduce the STC liability, a deferred tax asset is recognised to the extent of the future reduction in STC. Also refer to the Deferred tax accounting policy note above Earnings per share The group presents basic and diluted earnings per share (EPS) data for its ordinary shares. Basic EPS is calculated by dividing the profit or loss attributable to ordinary shareholders of Kumba by the weighted average number of ordinary shares outstanding during the year. Diluted EPS is determined by adjusting the profit or loss attributable to ordinary shareholders and the weighted average number of ordinary shares outstanding for the effects of all dilutive potential ordinary shares, which comprises share options granted to employees Convenience translation from Rand to US dollars The presentation currency of the group is Rand. Supplementary US dollar information is provided for convenience only. The conversion to US dollar is performed as follows: on balance sheet date. for the years presented. is translated at the closing rate on each balance sheet date. The resulting translation differences are included in shareholders equity. 5. SIGNIFICANT ACCOUNTING JUDGEMENTS AND ESTIMATES The preparation of the financial statements requires the group s management to make estimates and assumptions that affect the reported amounts of assets and liabilities, disclosure of contingent assets and liabilities at the date of the financial statements, and the reported amounts of revenues and expenses during the reporting period. The determination of estimates requires the exercise of judgement based on various assumptions and other factors such as historical experience, current and expected economic conditions, and in some cases actuarial techniques. Actual results could differ from those estimates. Estimates and judgements are continually evaluated and are based on historical experience and other factors, including expectations of future events that are believed to be reasonable under the circumstances. The following key assumptions concerning the future, and other key sources of estimation uncertainty at the balance sheet date, have a risk of causing an adjustment to the carrying amounts of assets and liabilities within the next financial year: 5.1 Property, plant and equipment The depreciable amount of property, plant and equipment is allocated on a systematic basis over its useful life. In determining the depreciable amount management makes certain assumptions with regard to the residual value of assets based on the expected estimated amount that the group would currently obtain from disposal of the asset, after deducting the estimated cost of disposal. If an asset is expected to be abandoned the residual value is In determining the useful life of items of property, plant and equipment that is depreciated, management considers the expected usage of assets, expected physical wear and tear, legal or similar limits of assets such as mineral rights as well as obsolescence. This estimate is further impacted by management s best estimation of proved and probable iron ore reserves and the expected future life of each of the mines within the group. The forecast production could be different from the actual iron ore mined. This would generally result from significant changes in the factors or assumptions used in estimating iron ore reserves. These factors could include: logistics costs, discount rates and foreign exchange rates. Also refer to the unaudited Ore Reserves and Mineral Resources statement included in the Integrated Report 2011 for a more detailed discussion on iron ore reserve estimation. IR Page 70 Any change in management s estimate of the useful lives and residual values of assets would impact the depreciation charge. Any change in management s estimate of the total expected future life of each of the mines would impact the depreciation charge as well as the estimated rehabilitation and decommissioning provisions. 36 Kumba Iron Ore Limited
41 5.2 Waste stripping costs The rate at which costs associated with the removal of overburden or waste material is capitalised as development costs or charged as an operating costs is calculated using management s best estimates of the: The average LOM stripping ratio and the average LOM mining cost are recalculated annually in light of additional knowledge and changes in estimates. Any change in management s estimates would impact the stripping costs capitalised charged to operating costs. 5.3 Impairment of non-financial assets The group reviews and tests the carrying value of assets when events or changes in circumstances indicate that the carrying amount may not be recoverable by comparing expected future cash flows to these carrying values. Such events or circumstances include movements in exchange rates, iron ore prices and the economic environment in which its businesses operate. Assets are grouped at the lowest level for which identifiable cash flows are largely independent of cash flows of other assets and liabilities. If there are indications that impairment may have occurred, estimates are prepared of expected future cash flows of each group of assets. Expected future cash flows used to determine the value in use of non-financial assets are inherently uncertain and could materially change over time. They are significantly affected by a number of factors including iron ore reserves and production estimates, together with economic factors such as future iron ore prices, discount rates, foreign currency exchange rates, estimates of production and logistics costs, future capital expenditure and discount rates used. 5.4 Provision for environmental rehabilitation and decommissioning The provisions for environmental rehabilitation and decommissioning are calculated using management s best estimate of the costs to be incurred based on the group s environmental policy taking into account current technological, environmental and regulatory requirements discounted to a present value. Estimates are based upon costs that are regularly reviewed, by internal and external experts, and adjusted as appropriate for new circumstances. Actual costs incurred in future periods could differ from the estimates. Additionally, future changes to environmental laws and regulations, LOM estimates and discount rates used could affect the carrying amount of this provision. As a result, the liabilities that we report can vary if our assessment of the expected expenditures changes. 5.6 Equity-settled share-based payment reserve Management makes certain judgements in respect of selecting appropriate fair value option pricing models to be used in estimating the fair value of the various share-based payment arrangements in respect of employees and special purpose entities. Judgements and assumptions are also made in calculating the variable elements used as inputs in these models. The inputs that are used in the models include, but are not limited to, the expected vesting period and related conditions, share price, dividend yield, share option life, risk free interest rate and annualised share price volatility (refer note 22). 5.7 Estimation of deemed gross sales value of revenue for calculating mineral royalty In terms of The Mineral and Petroleum Resources Royalty Act, No. 28 of 2008 and the Mineral and Petroleum Resources Royalty Administration Act, No. 29 of 2008, the specified condition for iron ore used to calculate the mining royalty payable will be deemed to have been extracted at a 61.5% Fe specified condition. Management is required to make certain judgements and estimates in determining the gross sales value of the ore extracted at the group s mines. 5.8 Discount rates The discount rates used are the appropriate pre-tax rates that reflect the current market assessment of the time value of money and the risks specific to the assets and liabilities being measured for which the future cash flow estimates have not been adjusted. 5.9 Segment reporting In applying IFRS 8, Operating segments, management makes judgements with regard to the identification of reportable operating segments of the group Going concern Management considers key financial metrics and loan covenant compliance in its approved medium-term budgets, together with its existing-term facilities, to conclude that the going-concern assumption used in the compiling of its annual financial statements, is appropriate. Audited annual financial statements 5.5 Deferred tax assets The group recognises the net future tax benefit related to deferred income tax assets to the extent that it is probable that the deductible temporary differences will reverse in the foreseeable future, or the probability of utilising assessed losses. Assessing the recoverability of deferred income tax assets requires the group to make significant estimates related to expectations of future taxable income on a subsidiary by subsidiary level. Estimates of future taxable income are based on forecast cash flows from operations. To the extent that future cash flows differ significantly from estimates, the ability of the group to realise the net deferred tax assets recorded at the balance sheet date could be impacted. Annual Financial Statements
42 GROUP BALANCE SHEET AS AT 31 DECEMBER BALANCE SHEET Rand million Notes Assets Property, plant and equipment 1 20,878 15,866 Biological assets Investments in associates and joint ventures Investments held by environmental trust Long-term prepayments and other receivables Deferred tax assets Non-current assets 22,238 16,798 Inventories 6 3,864 3,102 Trade and other receivables 7 3,537 3,096 Current tax assets Cash and cash equivalents 8 4,742 4,855 Current assets 12,175 11,077 Total assets 34,413 27,875 Equity and liabilities Shareholders equity 15,833 14,338 Non-controlling interest 23 4,759 4,038 Total equity 20,592 18,376 Liabilities Interest-bearing borrowings 9 3,185 Provisions Deferred tax liabilities 11 4,942 2,272 Non-current liabilities 5,843 6,129 Short-term portion of interest-bearing borrowings 9 3,191 Short-term portion of provisions Trade and other payables 12 4,556 3,274 Current tax liabilities Current liabilities 7,978 3,370 Total liabilities 13,821 9,499 Total equity and liabilities 34,413 27, Kumba Iron Ore Limited
43 GROUP INCOME STATEMENT/ STATEMENT OF COMPREHENSIVE INCOME FOR THE YEAR ENDED 31 DECEMBER INCOME STATEMENT Rand million Notes Revenue 14 48,553 38,704 Operating expenses 15 (16,587) (13,573) Operating profit 16 31,966 25,131 Finance income Finance costs 18 (149) (178) Profit before taxation 32,058 25,102 Taxation 19 (9,760) (6,813) Profit for the year 22,298 18,289 Attributable to: Owners of Kumba 17,042 14,323 Non-controlling interest 5,256 3,966 22,298 18,289 Earnings per share for profit attributable to the owners of Kumba (Rand per share) 20 Basic Diluted STATEMENT OF COMPREHENSIVE INCOME Audited annual financial statements Rand million Notes Profit for the year 22,298 18,289 Other comprehensive income/(losses) for the year, net of tax (217) Exchange differences on translation of foreign operations 363 (215) Net effect of cash flow hedges 41 (2) Total comprehensive income for the year 22,702 18,072 Attributable to: Owners of Kumba 17,340 14,143 Non-controlling interest 5,362 3,929 22,702 18,072 Annual Financial Statements
44 GROUP STATEMENT OF CHANGES IN EQUITY FOR THE YEAR ENDED 31 DECEMBER STATEMENT OF CHANGES IN EQUITY Equitysettled Rand million Share capital and share premium (note 21) Treasury shares (note 21) share-based payments reserve (note 22) Foreign currency translation reserve Cash flow hedge accounting reserve Retained earnings Shareholders equity Noncontrolling interest Total equity Balance at 31 December (62) (8) 6,322 7,306 1,650 8,956 Shares issued during the year 80 (6) Net movement in treasury shares under employee share incentive schemes (129) (129) (129) Equity-settled share-based payments expense (8) 195 Vesting of shares under employee share incentive schemes (13) (50) (63) (63) Total comprehensive income for the year (165) (15) 14,323 14,143 3,929 18,072 Change in effective ownership of SIOC (16) (11) (1) (273) (301) 301 Share-based payment vesting upon deconsolidation of the SIOC Community Development SPV (153) 14 (139) (139) Dividends paid (6,756) (6,756) (1,834) (8,590) Balance at 31 December (197) (24) 13,580 14,338 4,038 18,376 Shares issued during the year Net movement in treasury shares under employee share incentive schemes (139) (139) (139) Equity-settled share-based payments expense Vesting of shares under employee share incentive schemes (445) (1,712) (2,157) (646) (2,803) Total comprehensive income for the year ,042 17,340 5,362 22,702 Change in effective ownership of SIOC 4 4 (4) Dividends paid (13,834) (13,834) (4,078) (17,912) Balance at 31 December (336) (6) 15,080 15,833 4,759 20,592 Rand Dividend per share (note 20) Interim Final* Total * The final dividend was declared subsequent to the year-end and is presented for information purposes only. Equity-settled share-based payments reserve The equity-settled share-based payment reserve comprises the fair value of goods received or services rendered that has been settled through the issue of shares or share options. Foreign currency translation reserve The foreign currency translation reserve comprises all foreign exchange differences arising from the translation of the financial results of foreign operations to the presentation currency of Kumba. Cash flow hedge accounting reserve The cash flow hedge accounting reserve comprises the effective portion of the cumulative net change in the fair value of derivative financial instruments designated as cash flow hedges where the forecasted transaction has not yet occurred. 40 Kumba Iron Ore Limited
45 GROUP CASH FLOW STATEMENT FOR THE YEAR ENDED 31 DECEMBER CASH FLOW STATEMENT Rand million Notes Cash flows from operating activities Cash receipts from customers 48,788 37,325 Cash paid to suppliers and employees (16,157) (11,770) Cash generated from operations 24 32,631 25,555 Net finance costs paid 25 (96) (283) Taxation paid 26 (7,035) (7,031) 25,500 18,241 Cash flows from investing activities Additions to property, plant and equipment 28 (5,849) (4,723) Investment in associates and joint ventures 3 (4) (9) Proceeds from disposal of non-current assets 2 1 Net cash outflow on disposal of subsidiaries (2) (5,851) (4,733) Cash flows from financing activities Shares issued Purchase of treasury shares 21 (278) (191) Vesting of Envision share scheme 22 (1,694) Dividends paid to owners of Kumba 27 (13,742) (6,714) Dividends paid to non-controlling shareholders 27 (4,170) (1,876) Change in effective ownership of SIOC (147) Interest-bearing borrowings raised 9 4,771 Interest-bearing borrowings repaid 9 (5,500) (19,868) (9,583) Net (decrease)/increase in cash and cash equivalents (219) 3,925 Cash and cash equivalents at beginning of year 4, Exchange differences on translation of cash and cash equivalents Cash and cash equivalents at end of year 8 4,742 4,855 Audited annual financial statements Annual Financial Statements
46 GROUP NOTES TO THE ANNUAL FINANCIAL STATEMENTS FOR THE YEAR ENDED 31 DECEMBER NOTES TO THE ANNUAL FINANCIAL STATEMENTS 1. PROPERTY, PLANT AND EQUIPMENT Buildings and infrastructure Machinery, plant and equipment Mineral exploration, site preparation and development Assets under construction Rand million Land Mineral properties Residential buildings Total 2011 Cost Balance at beginning of year , ,980 19,299 Additions (refer to note 28) ,804 5,983 Changes in decommissioning provision (refer to note 10) Disposals and scrapping (58) (58) Transfers between asset classes ,482 6,053 (8,952) Exchange differences on translation 1 1 Balance at 31 December ,884 17, ,839 25,263 Accumulated depreciation Balance at beginning of year , ,433 Depreciation Disposals and scrapping (46) (46) Transfers between asset classes Balance at 31 December , ,385 Carrying amount at 31 December ,729 13, ,839 20, Cost Balance at beginning of year , ,741 14,338 Additions (refer to note 28) ,751 5,019 Changes in decommissioning provision (refer to note 10) Disposals and scrapping (33) (1) (48) (22) (104) Transfers between asset classes ,401 (1,519) Exchange differences on translation (4) (4) Balance at 31 December , ,980 19,299 Accumulated depreciation Balance at beginning of year , ,733 Depreciation Disposals and scrapping (1) (42) (22) (65) Transfers between asset classes 9 (9) Balance at 31 December , ,433 Impairment of assets Balance at beginning of year Disposals and scrapping (33) (33) Exchange differences on translation (4) (4) Balance at 31 December 2010 Carrying amount at 31 December , ,980 15, Kumba Iron Ore Limited
47 1. PROPERTY, PLANT AND EQUIPMENT continued Additional disclosures Included in the above items of property, plant and equipment are fully depreciated assets still in use with an original cost price of R337 million (2010: R143 million). During the year the group scrapped fully depreciated assets with an original cost price of R9.1 million (2010: R49 million). The group generated proceeds from the disposal of items of property, plant and equipment of R1.8 million (2010: R0.7 million). The estimated replacement value of assets for insurance purposes and assets under construction at cost amounts to R29.9 billion (2010: R26.1 billion). A register of land and buildings is available for inspection at the registered office of the company. None of the assets are encumbered as security for any of the group s liabilities. Capital commitments Capital commitments include all items of capital expenditure for which specific board approval has been obtained up to balance sheet date. Capital expenditure still under investigation for which specific board approvals have not yet been obtained are excluded. Capital expenditure contracted for plant and equipment 1,988 1,727 Capital expenditure authorised for plant and equipment but not contracted 2,168 4,965 Capital expenditure will be financed principally from borrowing facilities and cash generated from operations Capital expenditure contracted for plant and equipment Capital expenditure authorised for plant and equipment but not contracted BIOLOGICAL ASSETS Rand million Livestock Game Total Balance at beginning of year Gains attributable to physical changes and price changes 1 1 Disposals (1) (1) Balance at 31 December Balance at beginning of year Acquisitions 2 2 Gains attributable to physical changes and price changes 1 1 Disposals (4) (4) Balance at 31 December Biological assets comprise mature livestock and game and are measured at fair value. Livestock consists of cattle, sheep and goats and game consists of giraffe, ostrich and a variety of antelope. Audited annual financial statements 3. INVESTMENTS IN ASSOCIATES AND JOINT VENTURES Rand Associates Unlisted Joint ventures Unlisted 33,251 28,952 Total 33,301 29,002 Refer to annexure 2 for details of associated companies and joint ventures and directors valuations. Rand 000 Investments Loans Total Associates Balance at beginning of year Balance at 31 December Balance at beginning of year Balance at 31 December No income was earned or expense was incurred by the associate during the year as the entity is dormant. Annual Financial Statements
48 GROUP NOTES TO THE ANNUAL FINANCIAL STATEMENTS FOR THE YEAR ENDED 31 DECEMBER 3. INVESTMENTS IN ASSOCIATES AND JOINT VENTURES continued Rand Balance sheet information of associates Non-current assets 2,893 2,893 Total assets 2,893 2,893 Shareholders' equity 2,847 2,847 Non-current liabilities Total equity and liabilities 2,893 2,893 The financial information presented represents the group s effective interest. Rand 000 Investments Loans Total Joint ventures Balance at beginning of year 28,952 28,952 Increase in loans to joint ventures 4,299 4,299 Balance at 31 December ,251 33,251 Balance at beginning of year 19,840 19,840 Increase in loans to joint ventures 9,112 9,112 Balance at 31 December ,952 28,952 Rand Income statement information of joint ventures Revenue 173,772 Operating expenses (24,167) (26,923) Operating (loss)/profit (24,167) 146,849 Net financing income Profit before taxation (24,163) 147,127 Taxation 6,771 3,819 (Loss)/profit for the year (17,392) 150,946 Balance sheet information of joint ventures Non-current assets 23,527 16,762 Current assets 82 3,129 Total assets 23,609 19,891 Shareholders' deficit (44,634) (25,862) Non-current liabilities 33,251 28,951 Current liabilities 34,992 16,802 Total equity and liabilities 23,609 19,891 Cash flow information of joint ventures Cash flows utilised in operating activities (7,488) (22,475) Cash flows from investing activities 4,299 7,402 Cash flows from financing activities (105) Foreign currency translations 257 (9,718) Net decrease in cash and cash equivalents (3,037) (24,791) The financial information presented represents the group s effective interest. 4. INVESTMENTS HELD BY ENVIRONMENTAL TRUST Balance at beginning of year Contributions Growth in environmental trusts Balance at end of year Cash investments Equity investments Kumba Iron Ore Limited
49 4. INVESTMENTS HELD BY ENVIRONMENTAL TRUST continued These investments may only be utilised for the purposes of settling decommissioning and rehabilitation obligations relating to the group s mining operations. The investment returns are reinvested by the trust. Refer to note 10 for the environmental rehabilitation and decommissioning provisions. Maturity profile of the investments held by environmental trust 5 years 222 More than 5 years Currency analysis of investments held by environmental trust Rand Fair value of investments held by environmental trust The fair value of investments held by the environmental trust is determined using quoted market values at 31 December Rand million Carrying value Fair value Investments held by environmental trust Investments held by environmental trust Credit risk Investments held by the environmental trust are managed by a financial institution with long-term investment grade credit rating and with the capacity for payment of financial commitments considered strong. The trustees of the environmental trust continuously review the investment strategy of the trust with its investment advisors to ensure that the strategy remains appropriate in light of changing market conditions. Equity securities price risk The equity instruments values are determined with reference to quoted market values (level 1). 5. LONG-TERM PREPAYMENTS AND OTHER RECEIVABLES Long-term receivables 1 1 Prepayments Maturity profile of long-term prepayments and other receivables 1 to 2 years to 5 years More than 5 years INVENTORIES Finished products 1,472 1,310 Work-in-progress 1,864 1,375 Plant spares and stores ,864 3,102 Audited annual financial statements No inventories are carried at net realisable value or were encumbered during the year. 7. TRADE AND OTHER RECEIVABLES Trade receivables 2,249 2,058 Other receivables 1, Derivative financial instruments (refer to note 29) ,537 3,096 Annual Financial Statements
50 GROUP NOTES TO THE ANNUAL FINANCIAL STATEMENTS FOR THE YEAR ENDED 31 DECEMBER 7. TRADE AND OTHER RECEIVABLES continued Credit risk Trade receivables are exposed to the credit risk of end-user customers within the steel manufacturing industry. Significant concentrations of credit risk exist in respect of trade receivables, where R1,862 million (2010: R1,609 million) or 83% (2010: 78%) of the total outstanding trade receivables balance of R2,249 million (2010: R2,058 million) consists of individual end-user customers with an outstanding balance in excess of 5% of the total trade receivables balance as at 31 December The group has an established credit policy under which customers are analysed for creditworthiness before the group s payment and delivery terms and conditions are offered. Customer balances are monitored on an ongoing basis to ensure that they remain within the negotiated terms and conditions offered. Trade receivables credit risk exposure by geographical area Asia 1,316 1,436 South Africa Europe ,249 2,058 Credit quality of trade receivables Not past due 2,249 2,054 Past due 0 to 30 days 4 2,249 2,058 Currency analysis of trade receivables US dollar 1,763 1,768 Rand Other 7 2,249 2,058 Other receivables consists of the following Prepayments Value-added tax receivable Interest receivable Provision for doubtful other receivables (5) Opening balance (5) Income statement reversal/(charge) for the year 5 (5) Other , CASH AND CASH EQUIVALENTS Bank balance and cash 4,742 4,855 Currency analysis of cash and cash equivalents Rand 4,041 3,346 US dollar 692 1,501 Euro 6 8 Other 3 4,742 4,855 Credit risk Cash and cash equivalents are held in various financial institutions with long-term investment grade credit rating and with the capacity for payment of financial commitments considered strong. Kumba has a R3,885 million short-term deposit facility as at 31 December 2011 that was placed with Anglo American SA Finance Limited (2010: R1,391 million), a subsidiary of the group s ultimate holding company (refer to note 35). 46 Kumba Iron Ore Limited
51 9. INTEREST-BEARING BORROWINGS Non-current interest-bearing borrowings Long-term interest-bearing borrowings 3,191 3,185 Current portion included in current interest-bearing borrowings (3,191) 3,185 Current interest-bearing borrowings Current portion of interest-bearing borrowings 3,191 3,191 Total interest-bearing borrowings 3,191 3,185 Reconciliation Balance at beginning of year 3,185 3,914 Interest-bearing borrowings raised 4,771 Interest-bearing borrowings repaid (5,527) Deferred transaction cost recognised 6 27 Balance at end of year 3,191 3,185 Maturity profile of interest-bearing borrowings Within 1 year 3,191 2 to 3 years 3,185 Balance at end of year 3,191 3,185 Rand million Unsecured loans Maturity date Interest rate at 31 Dec 2011 (%) Facility Outstanding balance 2011 Outstanding balance 2010 Revolving facility C at a floating interest rate of 3-month Jibar basis points, reset quarterly but payable semi-annually (2010: 7.98%) Maturity date 28 November * 5,400 Term facility at a floating interest rate of 3-month Jibar basis points, reset quarterly but payable semi-annually (2010: 8.43%) Maturity date 31 July ,195 3,195 3,195 Call loan facility ,690 Fair value at end of year 12,285 3,195 3,195 Deferred transaction costs (4) (10) Carrying value at end of year 12,285 3,191 3,185 * There were no funds drawn down against the facility during the year ended 31 December The Jibar rate at 31 December 2011 was 5.584% (2010: 5.549%). Audited annual financial statements Financial covenants The group is in compliance with its debt covenants (total debt/earnings before interest, tax, depreciation and amortisation (EBITDA); EBITDA/Net interest expense). This was also the case in Currency analysis of interest-bearing borrowings All interest-bearing borrowings of the group are denominated in Rand. Annual Financial Statements
52 GROUP NOTES TO THE ANNUAL FINANCIAL STATEMENTS FOR THE YEAR ENDED 31 DECEMBER 10. PROVISIONS Employee benefits Rand million cash-settled share-based payments Contract for affreightment Environmental rehabilitation Decommis- -sioning Total Non-current provisions Current portion of provisions Total provisions Balance at beginning of the year Notional interest Charged to income statement Capitalised to property, plant and equipment Utilised during the year (17) (17) Cash-settled share-based payments Balance at 31 December Expected timing of future cash flows Within 1 year years More than 5 years Estimated undiscounted obligation 12 1, , Non-current provisions Current portion of provisions Total provisions Balance at beginning of the year Notional interest (Reversed)/charged to income statement (2) Capitalised to property, plant and equipment Utilised during the year (10) (10) Cash-settled share-based payments Balance at 31 December Expected timing of future cash flows Within 1 year More than 5 years Estimated undiscounted obligation 11 1, ,427 Cash-settled share-based payments (refer to note 22) At 31 December 2011 the current provision represents amounts payable to deceased beneficiaries on the Envision share scheme. The non-current provision represents amounts payable to beneficiaries of certain conditional share awards under the Bonus share scheme which vests in Environmental rehabilitation Provision is made for environmental rehabilitation costs where either a legal or constructive obligation is recognised as a result of past events. Estimates are based upon costs that are reviewed regularly and adjusted as appropriate for new circumstances. Decommissioning The decommissioning provision relates to decommissioning of property, plant and equipment where either a legal or constructive obligation is recognised as a result of past events. Estimates are based upon costs that are regularly reviewed and adjusted. Funding of environmental rehabilitation and decommissioning (refer to note 4) Contributions towards the cost of mine closure are also made to the Kumba Iron Ore Rehabilitation Trust and the balance of the trust amounted to R568 million at 31 December 2011 (2010: R372 million). Significant accounting estimates The estimation of the environmental rehabilitation and decommissioning provisions are a key area where management s judgement is required. A change of 1% in the discount rate used in estimating the environmental rehabilitation and decommissioning provisions would result in an increase of R147.4 million (2010: R43.4 million) or a decrease of R122.3 million (2010: R35.6 million) in the carrying value of the provision. A change of one year in the expected timing of the commencement of environmental rehabilitation and decommissioning would result in an increase of R34.7 million (2010: R26.9 million) or a decrease of R33.4 million (2010: R25.8 million) in the carrying value of the provision. 48 Kumba Iron Ore Limited
53 10. PROVISIONS continued Change in accounting estimate mines. The effect of these changes are detailed below: Rand million Environmental rehabilitation Decommissioning Total Amount of the closure cost Expected timing of future cash flows The change in estimate in the environmental rehabilitation provision resulted in a decrease in attributable profit for 2011 of R72 million (effect on earnings per share R0.22 per share) after taking into account taxation of R37 million and minority interest of R22 million. The change in estimate in the decommissioning provision has been capitalised to the related property, plant and equipment (refer to note 1). 11. DEFERRED TAX Deferred tax assets Reconciliation Balance at beginning of year Foreign exchange translation differences 130 (37) Current year charge per the income statement Balance at end of year Expected timing Deferred tax assets to be recovered after 12 months Deferred tax assets to be recovered within 12 months Balance at end of year Deferred tax assets attributable to the following temporary differences Estimated tax losses Other Total deferred tax assets There was no unused tax losses for which a deferred tax asset was recognised at 31 December 2011 (2010: R681 million). Deferred tax liabilities Reconciliation Balance at beginning of year 2,272 2,282 Prior year adjustment 9 Current year charge/(credit) per the income statement 2,670 (19) Balance at end of year 4,942 2,272 Expected timing Deferred tax liabilities to be recovered after 12 months 4,495 2,064 Deferred tax liabilities to be recovered within 12 months ,942 2,272 Audited annual financial statements Deferred tax liabilities attributable to the following temporary differences Property, plant and equipment 5,061 2,460 Environmental rehabilitation provision (199) (149) Decommissioning provision (20) (16) Environmental rehabilitation trust asset Leave pay accrual (46) (40) Other (13) (87) Total deferred tax liabilities 4,942 2,272 Annual Financial Statements
54 GROUP NOTES TO THE ANNUAL FINANCIAL STATEMENTS FOR THE YEAR ENDED 31 DECEMBER 12. TRADE AND OTHER PAYABLES Trade payables 1,672 1,595 Other payables 2,704 1,510 Leave pay accrual Derivative financial instruments (refer to note 29) ,556 3,274 Currency analysis of trade and other payables Rand 4,197 3,094 US dollar Euro ,556 3,274 Other payables consist mainly of accruals for goods and services received, as well as a R968 million accrual for PAYE on the Envision distribution paid in January OTHER COMPREHENSIVE INCOME/(LOSSES) Rand million Before tax Tax Net of tax 2011 Foreign currency translation differences Net gains arising during the year Net effect of cash flow hedges Net gains arising during the year Other comprehensive income for the year Foreign currency translation differences Net losses arising during the year (215) (215) Net effect of cash flow hedges Net losses arising during the year (2) (2) Other comprehensive losses for the year (217) (217) 14. REVENUE Sale of iron ore 45,842 35,825 Services rendered shipping 2,711 2,879 48,553 38,704 Sale of iron ore Domestic South Africa 3,388 2,874 Export 42,454 32,951 China 27,193 20,233 Rest of Asia 9,274 7,465 Europe 5,450 4,896 Middle East Americas/other Services rendered shipping (China) 2,711 2,879 48,553 38, Kumba Iron Ore Limited
55 15. OPERATING EXPENSES Operating expenditure by function Production costs 9,477 7,317 Movement in work-in-progress inventories (396) (288) Cost of goods produced 9,081 7,029 Movement in finished product inventories 247 (171) Finance gains (refer to note 17) (587) (286) Other 20 (2) Cost of goods sold 8,761 6,570 Mineral royalty 1,762 1,410 Selling and distribution costs 3,698 3,041 Distribution costs 3,393 2,760 Selling costs Cost of services rendered shipping 2,374 2,560 Sublease rentals received (8) (8) Operating expenses 16,587 13,573 Cost of goods sold comprises: Staff costs 2,777 2,284 Salaries and wages 2,159 1,883 Equity-settled share-based payments Cash-settled share-based payments Pension and medical costs Raw materials and consumables 2,233 1,509 Depreciation of property, plant and equipment Mineral properties Residential buildings 7 4 Buildings and infrastructure Machinery, plant and equipment Site preparation and development 2 4 Repairs and maintenance Legal Professional fees Outside services 1,887 1,288 Technical services and project studies General expenses Finance gains (refer to note 17) (587) (286) Energy costs Own work capitalised (971) (581) Movement in inventories (149) (459) Cost of goods sold 8,761 6,570 Audited annual financial statements Annual Financial Statements
56 GROUP NOTES TO THE ANNUAL FINANCIAL STATEMENTS FOR THE YEAR ENDED 31 DECEMBER 16. OPERATING PROFIT Operating profit includes the following amounts, some of which are also included in the analysis of operating expenses disclosed in note 15: Staff costs Employee expenses 2,408 2,078 Share-based payments expenses Directors emoluments (refer to remuneration report on page 24) Executive directors Emoluments received as directors of the company (excluding fair value of incentive awards) 10 8 Bonuses and cash incentives 4 4 Non-executive directors emoluments received as directors of the company 4 3 Prescribed officers remuneration (excluding executive directors refer to remuneration report on page 24) Depreciation of property, plant and equipment (refer to note 1) Operating lease rental expenses Property Equipment Borrowings facility fee 6 12 Auditors' remuneration Audit fees 8 6 Other services 1 1 Provision for doubtful other receivables 5 Impairment of trade receivables 1 Research and development cost 1 3 Reconditioned spares usage 4 2 Net loss on disposal of investment 2 Net loss on disposal or scrapping of property, plant and equipment 10 5 Operating sublease rentals received Property (8) (6) Other (2) 17. FINANCE GAINS/(LOSSES) Finance (losses)/gains recognised in operating profit Net (losses)/gains on derivative financial instruments Realised (473) 626 Unrealised (14) 10 Net foreign currency gains/(losses) Realised 1,000 (279) Unrealised 74 (71) FINANCE INCOME/(COSTS) Interest expense (337) (432) Notional interest on non-current provisions (refer to note 10) (59) (42) Capitalisation of borrowing costs (refer to note 28) Finance costs (149) (178) Interest received Net finance income/(costs) 92 (29) 52 Kumba Iron Ore Limited
57 19. TAXATION Taxation expense Current taxation 5,344 6,318 Deferred taxation 2,614 (390) STC 1, ,760 6,813 Charge to the income statement South African normal taxation Current year 5,389 6,292 Prior year (120) Foreign taxation Current year Prior year 1 (18) STC 1, Income taxation 7,146 7,203 Deferred taxation Current year 2,614 (399) Prior years 9 9,760 6,813 % Reconciliation of taxation rates Taxation as a percentage of profit before taxation Taxation effect of: Disallowable expenditure (0.1) (0.1) Exempt income Deferred tax asset raised in the current year on unrecognised taxation losses brought forward Rate difference on tax rate STC (5.6) (3.5) Prior year underprovision 0.4 Equity-settled share-based payments (0.2) (0.3) Foreign exchange translation differences 0.2 Standard taxation rate PER SHARE INFORMATION Attributable earnings per share is calculated by dividing profit attributable to shareholders of Kumba by the weighted average number of ordinary shares in issue during the year, excluding ordinary shares purchased by the group and held as treasury shares. Audited annual financial statements For the diluted earnings per share, the weighted average number of ordinary shares in issue is adjusted to assume conversion of all potential dilutive ordinary shares as a result of share options granted to employees under the employee share incentive schemes. A calculation is performed to determine the number of shares that could have been acquired at fair value, determined as the average annual market share price of the company s shares based on the monetary value of the subscription rights attached to the outstanding share options. Profit attributable to equity holders of Kumba 17,042 14,323 Number of shares Weighted average number of ordinary shares in issue 320,895, ,727,067 Potential dilutive effect of outstanding share options 836, ,068 Diluted weighted average number of ordinary shares in issue 321,731, ,691,135 Annual Financial Statements
58 GROUP NOTES TO THE ANNUAL FINANCIAL STATEMENTS FOR THE YEAR ENDED 31 DECEMBER 20. PER SHARE INFORMATION continued Rand million 2011 Gross adjustment 2011 Net attributable 2010 Gross adjustment 2010 Net attributable Profit attributable to equity holders of Kumba 17,042 17,042 14,323 14,323 Net loss on disposal or scrapping of property, plant and equipment Net loss on disposal of investment ,052 17,048 14,330 14,328 Taxation effect of adjustments (3) (1) Minority interest in adjustments (1) (1) Headline earnings 17,048 17,048 14,328 14,328 Attributable earnings per share Basic Diluted Headline earnings per share Basic Diluted Dividend per share Interim Final SHARE CAPITAL AND SHARE PREMIUM (including treasury shares) Number of shares Authorised Ordinary shares of R0.01 each 500,000, ,000,000 Issued Ordinary shares of R0.01 each 322,058, ,911,721 Reconciliation of issued shares Number of shares at beginning of year 321,911, ,415,081 Number of ordinary shares issued 5,377,770 1,496,640 Number of ordinary shares repurchased and cancelled (5,230,867) Number of shares at end of year 322,058, ,911,721 Shares held in reserve reconciliation Authorised shares at the beginning of year not issued 178,088, ,584,919 Shares issued (140,000) (1,342,852) Shares held by the Kumba Iron Ore Management Share Trust (6,903) (153,788) Unissued shares 177,941, ,088,279 The unissued shares are under the control of the directors of Kumba until the next AGM. Reconciliation of share capital and premium Balance at beginning of year Total shares issued for cash consideration Shares issued share premium Net movement in shares held by Kumba Iron Ore Management Share Trust (6) Net movement in treasury shares under employee share incentive schemes (139) (129) Purchase of treasury shares employee share incentive schemes (278) (191) Shares issued to employees under employee share incentive schemes Share capital and premium at end of year Consists of: Share capital 3 3 Share premium Kumba Iron Ore Limited
59 22. EQUITY-SETTLED SHARE-BASED PAYMENTS RESERVE Unrecognised share-based payment expense at 31 December Recognised share-based payment expense Balance at beginning of year Equity-settled share-based payments expense Employee share incentive schemes 2, Envision Phase Envision Phase 2 2, Bonus Share Plan (BSP) Long-term Incentive Plan (LTIP) Share Appreciation Rights Scheme (SARS) Deferred Bonus Plan (2011 and 2010: < R1 million) Management Share Option Scheme 2 Vesting of shares under employee share incentive schemes (445) (166) Change in effective ownership of SIOC (refer to note 23) (16) Non-controlling interest (87) 8 Balance at end of year Employee share incentive schemes Employees of the group participate in the following share incentive schemes. Refer to annexure 3: share-based payments for details of each share scheme. Bonus Share Plan The BSP for executive directors and senior employees was implemented during The adoption and implementation of the scheme was approved by shareholders at the AGM on 20 March The BSP is offered to senior managers and key executives who have the opportunity and the responsibility to contribute towards the Kumba s overall strategic objectives. The BSP has two components: a payment of an annual cash bonus; and a forfeitable award of shares linked to the participant s annual cash bonus award known as Bonus Shares. The number of Bonus Shares awarded is determined with reference to the amount of the annual cash bonus an employee receives which is directly linked to the employee s personal performance and potential. The shares are held by an escrow agent and released to the employee three years after the award date (subject to continuous employment). During the three-year period, the employee is entitled to all rights attaching to the Bonus Shares including dividend entitlements and voting rights. Long-term Incentive Plan Senior employees receive annual grants of conditional awards of Kumba shares. The conditional award will vest after the performance period of three years, and to the extent that specific performance conditions have been satisfied. No retesting of the performance conditions is allowed. The performance conditions for the LTIP awards made to date are subject to the achievement of stretching performance targets relating to total shareholder return (TSR) and to an operating measure, currently return on capital employed (ROCE), over a fixed three-year period. Audited annual financial statements The performance conditions will determine if, and to what extent, the conditional award will vest. Upon vesting the employee will be entitled to shares in Kumba to settle the value of the vested portion of the conditional award. The conditional awards which do not vest at the end of the three-year period will lapse. Upon retrenchment, ill-health, disability, retirement or death a proportion of unvested conditional awards shall vest on the date of cessation of employment. The proportion of awards that vest under the LTIP would reflect the number of months service and in the opinion of the Remuneration Committee the extent to which the performance conditions have been met. On resignation or termination of employment all unexercised (vested and unvested) conditional awards will lapse on the date of cessation of employment. The main intention of the LTIP is to settle the benefits by delivering shares in Kumba to employees. The aggregate number of shares which may be allocated under the LTIP when added to the total number of unvested conditional awards, unexercised SARS and share options allocated to employees under any other managerial share scheme, may not exceed 10% of the number of issued ordinary shares of Kumba. Share Appreciation Rights Scheme During 2007 and 2008 senior employees received annual grants of share appreciation rights, which are rights to receive Kumba shares equal to the value of the difference between the market value of a Kumba share on the day immediately preceding the date of exercise (exercise price) of the right and market value of the Kumba share on the day immediately preceding the date of grant of the right (grant price). No new grants have been made as the SARS was replaced with the BSP. Annual Financial Statements
60 GROUP NOTES TO THE ANNUAL FINANCIAL STATEMENTS FOR THE YEAR ENDED 31 DECEMBER 22. EQUITY-SETTLED SHARE-BASED PAYMENTS RESERVE continued The vesting of the rights is subject to specific performance conditions. The duration and specific nature of the conditions as determined by the Remuneration Committee of Kumba are stated in the letter of grant for each annual grant. The measurement of the performance conditions will be tested after three years. Retesting of the performance condition is permitted on the first and second anniversary of the end of the performance period. After vesting, the rights will become exercisable. Kumba will settle the value of the difference between the exercise price and the grant price, by delivering shares to the employee. Rights not exercised within seven years will lapse. Upon retrenchment, ill-health, disability, retirement or death a proportion of unvested rights shall vest on the date of cessation of employment. The proportion of awards that vest under the SARS would reflect the number of months service and in the opinion of the Remuneration Committee the extent to which the performance conditions have been met. On resignation or termination of employment all unexercised (vested and unvested) rights will lapse on the date of cessation of employment. Envision The implementation objective of Envision was to provide an incentive and retention initiative to employees who do not participate in the other share schemes of the group that are permanently employed by SIOC in South Africa. The acquisition of the interest in SIOC by Envision was funded by SIOC company in terms of a contribution agreement. The scheme s first phase matured on 17 November A second phase was implemented on 10 November 2011, on the same terms and conditions as the first phase. Employee beneficiaries of Envision are entitled to receive 50% of any dividend received by Envision in respect of its underlying shareholding in SIOC and a distribution at the end of the first term (five years) of the SIOC shares remaining in Envision after the repurchase of certain SIOC shares in terms of the subscription agreement. Each employee will be entitled to receive Kumba shares which were swapped for the SIOC shares using the specific price earnings ratio of Kumba and the most recent earnings of SIOC at the end of the first term. Envision was structured as a ten-year scheme, divided into two capital appreciation periods. The first capital appreciation period vested on 17 November The second capital appreciation period commenced on 10 November 2011 with the issue of 3.09% in the share capital of SIOC to the Envision trust. This resulted in a net increase in the non-controlling interest in SIOC of R4 million. The unwind of phase one resulted in a net cash outflow for the group through the implementation of the specific share repurchase by Kumba undertaken to monetise the value for employee participants. The actual monetary impact was R2.7 billion, based on a Kumba five-day average share price of R per share on 17 November Included in the R2.7 billion is employees tax of R968 million paid to SARS during January Management Share Option Scheme Prior to the unbundling of Kumba Resources, senior employees and directors of Sishen Iron Ore Company participated in the Kumba Resources Management Share Option Scheme. At the time of unbundling in order to place, as far as possible, all participants in the Kumba Resources Management Share Option Scheme in the position they would have been in if they remained shareholders of the then Kumba Resources Limited, the schemes continued in Kumba and in Exxaro Resources Limited (Exxaro). The Management Share Option Scheme was adopted by the group post unbundling subject to certain amendments that were made to the Kumba Resources Management Share Option Scheme. As a result the senior employees and directors that participated in the Kumba Resources Management Share Option Scheme subsequently became participants of the new Kumba Iron Ore Management Share Option Scheme. Under the Kumba Resources Management Share Option Scheme, share options in Kumba Resources were granted to eligible employees at the market price of the underlying Kumba Resources shares at the date of the grant. The options granted under the scheme vest over a period of five years commencing on the first anniversary of the offer date except for some share options granted in 2005 that vest in multiples of 33.3% per year over a three-year period commencing on the first anniversary of the offer date. The vesting periods of these share options are as follows: Share options not exercised lapse by the seventh anniversary of the offer date. Participants of the Kumba Iron Ore Management Share Option Scheme and the Exxaro Resources Management Share Option Scheme exchanged each of their Kumba Resources share options for a share option in Kumba and Exxaro. The strike price of each Kumba Resources option was apportioned between Kumba and Exxaro share options with reference to the volume weighted average price (VWAP) at which Kumba (67.19%) and Exxaro Resources (32.81%) traded for the first 22 days post the implementation of the unbundling transaction. 56 Kumba Iron Ore Limited
61 23. NON-CONTROLLING INTEREST Balance at beginning of year 4,038 1,650 Profit for the year 5,256 3,966 Exxaro 4,461 3,671 SIOC Community Development SPV Envision Dividends paid (4,078) (1,834) Exxaro (3,516) (1,811) SIOC Community Development SPV (528) (4) Envision (126) (61) Recoupment of Envision dividend Interest in movement in equity reserves (457) 256 Change in effective ownership of SIOC (refer to note 22 Envision) (4) 301 Equity-settled share-based payments reserve 87 (8) Vesting of shares under share incentive schemes (excluding Envision) (146) Vesting of shares under Envision (500) Foreign currency translation reserve 83 (49) Cash flow hedge accounting reserve Balance at end of year 4,759 4,038 The recoupment of the Envision dividend of R92 million (2010: R42 million) arises from SIOC s participation as income beneficiary in Envision. 24. CASH GENERATED FROM OPERATIONS Operating profit 31,966 25,131 Adjusted for Foreign exchange differences on translation of foreign operations (733) 155 Depreciation of property, plant and equipment Movement in provisions Unrealised foreign currency revaluations and fair value adjustments (62) 61 Reconditionable spares used 4 2 Loss on disposal or scrapping of property, plant and equipment 10 5 Movement in non-current financial assets and prepayments (235) (118) Equity-settled share-based payment expenses Cash-settled share-based payment provision Cash flows from operations 32,431 26,315 Working capital movements Increase in inventories (429) (607) Decrease/(increase) in trade and other receivables 235 (1,379) Increase in trade and other payables 394 1,226 32,631 25,555 Audited annual financial statements Annual Financial Statements
62 GROUP NOTES TO THE ANNUAL FINANCIAL STATEMENTS FOR THE YEAR ENDED 31 DECEMBER 25. NET FINANCE COSTS PAID Net financing costs as per income statement 92 (29) Adjusted for: Notional interest on non-current provisions (refer to note 10) Capitalisation of borrowing costs (refer to note 18) (247) (296) (96) (283) 26. TAXATION PAID Net taxation (liability)/receivable at beginning of year (61) 109 Income taxation per the income statement (refer to note 19) (7,146) (7,203) Translation of taxation for foreign operations (16) 2 (7,223) (7,092) Net current taxation liability per balance sheet Taxation paid per the cash flow statement (7,035) (7,031) Comprising normal taxation: South Africa (7,033) (7,029) Foreign (2) (2) (7,035) (7,031) 27. DIVIDENDS PAID Dividends per the statement of changes in equity (13,834) (6,756) Recoupment of Envision dividend (refer to note 23) (13,742) (6,714) Dividends paid to non-controlling shareholders Dividends per the statement of changes in equity (4,078) (1,834) Recoupment of Envision dividend (refer to note 23) (92) (42) (4,170) (1,876) 28. ADDITIONS TO PROPERTY, PLANT AND EQUIPMENT Replacement of property, plant and equipment (2,745) (1,560) Reconditionable spares (64) Investments to maintain operations (2,745) (1,624) Investment to expand operations (3,104) (3,099) Additions per the cash flow statement (5,849) (4,723) Borrowing costs capitalised (refer to note 18) (247) (296) Movement in capital creditor 112 Additions per note 1 (5,984) (5,019) 58 Kumba Iron Ore Limited
63 29. FINANCIAL INSTRUMENTS The group is exposed to credit risk, liquidity risk and market risk (currency risk and interest rate risk) from the use of financial instruments. Overall responsibility for establishment and oversight of the risk management framework rests with the board of directors. The Risk Committee, a committee of the board, is responsible for the development and monitoring of the group s risk management process. The group maintains an integrated, enterprise-wide, risk management programme (IRM). The group applies a logical, systematic and repetitive methodology to identify, analyse, assess, treat and monitor all risks, whether they are insurable or not. The risk management process is continuous, with well-defined steps, which support better decision-making by contributing a greater insight into risks and their impacts. Risks from all sources are identified and once they pass the materiality threshold, a formal process begins in which causal factors and consequences are identified and the correlation with other risks and the current risk-mitigating strategy is reviewed. One of the challenges is to ensure that mitigating strategies are geared to deliver reliable and timely risk information to support better decision-making. The risk assessment and reporting criteria are designed to provide the Executive Committee and the board, via the Risk Committee, with a consistent, enterprise-wide perspective of the key risks. The reports which are submitted monthly to the Executive Committee and quarterly to the Risk Committee include an assessment of the likelihood and impact of risks materialising, as well as risk mitigation initiatives and their effectiveness. In conducting its review of the effectiveness of risk management, the board considers the key findings from the ongoing monitoring and reporting processes, management assertions and independent assurance reports. The board also takes into account material changes and trends in the risk profile and consider whether the control system, including reporting, adequately supports the board in achieving its risk management objectives. SIOC in conjunction with Anglo American SA Finance Limited (a subsidiary of the ultimate holding company) provide a treasury function to the group, co-ordinates access to domestic and international financial markets, and manages the financial risks relating to the group s operations. MEASUREMENT BASIS OF FINANCIAL INSTRUMENTS Fair value Rand million Notes Amortised cost through profit or loss Total 2011 Financial assets Investments held by the environmental trust Trade receivables 7 2,249 2,249 Other receivables (excluding VAT and prepayments) Derivative financial instruments Cash and cash equivalents 8 4,742 4,742 Financial liabilities Interest-bearing borrowings 9 (3,191) (3,191) Trade payables 12 (1,672) (1,672) Other payables 12 (2,870) (2,870) Derivative financial instruments 12 (14) (14) (209) Financial assets Investments held by the environmental trust Trade receivables 7 2,058 2,058 Other receivables (excluding VAT and prepayments) Derivative financial instruments Cash and cash equivalents 8 4,855 4,855 Financial liabilities Interest-bearing borrowings 9 (3,185) (3,185) Trade payables 12 (1,595) (1,595) Other payables 12 (1,510) (1,510) Derivative financial instruments 12 (30) (30) 1, ,308 Audited annual financial statements Annual Financial Statements
64 GROUP NOTES TO THE ANNUAL FINANCIAL STATEMENTS FOR THE YEAR ENDED 31 DECEMBER 29. FINANCIAL INSTRUMENTS continued Credit risk Credit risk is the risk of financial loss to the group if a counterparty to a financial instrument fails to meet its contractual obligations. The group limits its counterparty exposure arising from money market and derivative instruments by dealing only with well-established financial institutions of high credit standing. The group s exposure and the credit ratings of its counterparties are continuously monitored and the aggregate value of transactions concluded are spread amongst approved counterparties. Credit exposure is controlled by counterparty limits that are reviewed and approved by the board annually. The group has established policies and guidelines that are followed for specific exposure limits when transacting in derivative financial instruments. The carrying amount of the financial assets as set out above, represents the group s maximum exposure to credit risk. An analysis of the credit risk of these financial assets is provided under the individual notes specified above. The group does not hold any collateral in respect of its financial assets subject to credit risk. Liquidity risk Liquidity risk is the risk that the group will be unable to meet its financial obligations as they become due. The group manages liquidity risk by ensuring sufficient cash is available to meet expected operational expenses as well as sufficient cash resources and credit facilities to meet its liabilities when due. The group s credit facilities are detailed under note 9. MATURITY PROFILE OF THE GROUP S FINANCIAL INSTRUMENTS: Rand million Notes Within 1 year 1 to 2 years 3 or more years Total 2011 Financial assets Investments held by the environmental trust Trade receivables 7 2,249 2,249 Other receivables (excluding VAT and prepayments) Cash and cash equivalents 8 4,742 4,742 Derivative financial instruments Financial liabilities Interest-bearing borrowings 9 (3,191) (3,191) Trade payables 12 (1,672) (1,672) Other payables 12 (2,870) (2,870) Derivative financial instruments 12 (14) (14) (419) Financial assets Investments held by the environmental trust Trade receivables 7 2,058 2,058 Other receivables (excluding VAT and prepayments) Cash and cash equivalents 8 4,855 4,855 Derivative financial instruments Financial liabilities Interest-bearing borrowings 9 (3195) (3,195) Trade payables 12 (1,595) (1,595) Other payables 12 (1,510) (1,510) Derivative financial instruments 12 (30) (30) 4,120 (3,195) 373 1,298 Market risk Market risk includes currency risk, interest rate risk and other price risk. Currency risk Currency risk is the risk that the fair value or future cash flows of a financial instrument will fluctuate in rands due to changes in foreign exchange rates. The group undertakes transactions denominated in currencies other than the respective functional currencies of the entities within the group. Through these transactions the group is exposed to currency risk. Kumba s iron ore export prices are determined in US dollars and the company negotiates iron ore prices in that currency with customers. Currency movements of the US dollar against the rand therefore could have a significant effect on the financial position and results of Kumba. The group undertakes transactions denominated in foreign currencies, hence exposures to exchange rate fluctuations arise which may expose it to economic or accounting losses. Treasury continues to sell US dollar export proceeds on a short term rolling forward basis with the view of reducing any short term cash borrowings and matching the cash requirements of the company on a day to day basis. US dollar export proceeds acts as a natural hedge for operating activities while major capital expenditure is hedged. 60 Kumba Iron Ore Limited
65 29. FINANCIAL INSTRUMENTS continued The average US dollar/rand exchange rate for 2011 of USD1: R7.25 (2010: USD1: R7.30) has been used to translate income and cash flow statements, whilst the balance sheet has been translated at the closing rate at the last day of the reporting year using an exchange rate of USD1: R8.18 (2010: USD1: R6.63). The group s financial instrument exposure to currency risk is analysed under the individual note for each financial instrument at balance sheet date. NET CURRENCY EXPOSURE OF THE GROUP S FINANCIAL INSTRUMENTS, EXCLUDING DERIVATIVES Rand million Financial assets Financial liabilities Net exposure 2011 Rand 5,343 (7,374) (2,031) US dollar 2,455 (340) 2,115 Euro 6 (19) (13) Other 3 3 7,807 (7,733) Rand 4,265 (6,110) (1,845) US dollar 3,270 (143) 3,127 Euro 8 (37) (29) Other 7 7 7,550 (6,290) 1,260 The group uses derivative financial instruments to reduce the uncertainty over future cash flows arising from movements in currencies in which it transacts. Currency risk is managed within board-approved policies and guidelines, which restrict the use of derivative financial instruments to the hedging of specific underlying currencies. Exchange rate exposures are managed within approved policy parameters utilising forward exchange contracts (FECs). The group maintains a fully covered exchange rate position in respect of imported capital equipment resulting in these exposures being fully converted to rand. Trade-related import exposures are managed through the use of natural hedges arising from export revenue as well as through short-term FECs. OUTSTANDING EXPOSURE AT 31 DECEMBER IN RESPECT OF DERIVATIVE FINANCIAL INSTRUMENTS Rand million Foreign amount (million) Market related value Contract value Recognised fair value in equity Derivative instruments cash flow hedges FECs related to commitments for the import of capital equipment 2011 US dollar Euro (1) US dollar 2 2 Euro Audited annual financial statements Rand million Foreign amount (million) Market related value Contract value Recognised fair value in profit or loss Derivative instruments held for trading 2011 FECs related to the repatriation of foreign cash receipts US dollar 180 1,466 1, ,466 1, FECs related to the repatriation of foreign cash receipts US dollar FECs related to future commitments for the import of capital equipment US dollar (15) (99) (107) (8) Euro (3) (6) (3) Annual Financial Statements
66 GROUP NOTES TO THE ANNUAL FINANCIAL STATEMENTS FOR THE YEAR ENDED 31 DECEMBER 29. FINANCIAL INSTRUMENTS continued Sensitivity analysis A movement in exchange rates of 5%, with all other variables held constant, against the US dollar would have increased/(decreased) profit or loss and equity by the amounts shown below. The impact on equity includes the after-tax impact of the movements in profit or loss. The analysis has been performed on the basis of the change occurring at the start of the reporting period and is performed on the same basis for This analysis considers the impact of changes in foreign exchange rates on profit or loss and equity, excluding foreign exchange translation differences resulting from the translation of group entities that have a functional currency different from the presentation currency, into the group s presentation currency (and recognised in the foreign currency translation reserve). Impact on profit or loss Impact on equity Rand million Increase Decrease Increase Decrease 2011 US dollar 91 (91) 66 (66) 2010 US dollar 58 (58) 42 (42) Interest rate risk Interest rate risk arises from the group s floating rate borrowings and the floating rate cash balances which exist. The company is not exposed to fair value interest rate risk as the company does not have any fixed interest bearing financial instruments carried at fair value. As part of the process of managing the company s interest rate risk, interest rate characteristics of new borrowings and the refinancing of existing borrowings are positioned according to expected movements in interest rates. For further details on long-term borrowings refer to note 9 Interest-bearing borrowings. Sensitivity analysis Changes in market interest rates affect the interest income or expense of floating rate financial instruments. A change in the market interest rate of 50 basis points, with all other variables held constant, would have increased/(decreased) profit or loss and equity by the amounts shown below. The impact on equity includes the after-tax impact of the movements in profit or loss. The analysis has been performed on the basis of the change occurring at the start of the reporting period and is performed on the same basis for Impact on profit or loss Impact on equity Rand million Increase Decrease Increase Decrease 2011 Floating interest rate instruments (8) 8 (6) Floating interest rate instruments (8) 8 (6) 6 Price risk The group is not exposed to commodity price risk, as the value of its financial assets or liabilities are not subject to commodity price movements. The group is exposed to equity securities price risk from equity investments held by the environmental trust. Refer to note 4 Investments held by environmental trust. Fair value The fair values of cash and cash equivalents, trade and other receivables and trade and other payables approximate the respective carrying amounts of these financial assets and financial liabilities because of the short period to maturity of these instruments. The fair value of interestbearing borrowings is disclosed in note 9. Level 1 1 Level 2 2 Level 3 3 Fair value measurements recognised in the consolidated balance sheet 2011 Investments held by the environmental trust (refer to note 4) 283 Derivative financial assets 90 Derivative financial liabilities (14) Investments held by the environmental trust (refer to note 4) 71 Derivative financial assets 78 Derivative financial liabilities (30) Level 1 fair value measurements are derived from unadjusted quoted prices in active markets for identical assets or liabilities. 2 Level 2 fair value measurements are derived from inputs other than quoted prices included within level 1 that are observable either directly or indirectly (i.e. derived from prices). 3 Level 3 fair value measurements are derived from valuation techniques that include inputs that are not based on observable market data. There were no transfers between level 1 and level 2 during the year. This was also the case in Kumba Iron Ore Limited
67 29. FINANCIAL INSTRUMENTS continued Fair value gains and losses recognised in operating profit are disclosed in note 17, Finance gains/(losses). All gain and losses included in other comprehensive income relate to cash flow hedges in respect of future commitments for the import of capital equipment held at the end of the reporting period. Capital management The group strives to maintain strong credit ratings. In managing its capital, the group focuses on a sound net debt position, return on shareholders equity (or return on capital employed) and the level of dividends to shareholders. Neither the company nor any of its subsidiaries are subject to externally imposed capital requirements. The group s net cash position at balance sheet dates was as follows: Long-term interest-bearing borrowings 3,185 Short-term interest-bearing borrowings 3,191 Total 3,191 3,185 Cash and cash equivalents (4,742) (4,855) Net cash (1,551) (1,670) Total equity 20,592 18,376 It is the intention of management to fund Kumba s capital projects through debt financing and available cash resources. The undrawn short- and long-term borrowing facilities available to the group are R9.1 billion (2010: R9.3 billion). Kumba was not in breach of any of its covenants during the current year. 30. EMPLOYEE BENEFITS Retirement fund Independent funds provide pension and other benefits for all permanent employees and their dependants. At the end of 2011 and 2010 the following funds were in existence: Kumba Iron Ore Selector Pension Fund and Kumba Iron Ore Selector Provident Fund, both operating as defined contribution funds; and Iscor Employees Umbrella Provident Fund, operating as a defined contribution fund. Members pay contributions of 7% and an employers contribution of 9.5% is expensed as incurred. All funds are governed by the South African Pension Funds Act of Defined contribution funds Membership of each fund and employer contributions to each fund were as follows: Working members 2011 Rand million Number Employer contributions 2011 Working members 2010 Number Employer contributions 2010 Kumba Iron Ore Selector Pension and Provident Funds 2, , Iscor Employees Umbrella Provident Fund 3, , Total 5, , Audited annual financial statements Due to the nature of these funds, the accrued liabilities definition equates to the total assets under control of these funds. Medical fund The group contributes to defined benefit medical aid schemes for the benefit of permanent employees and their dependants. The contributions charged against income amounted to R93 million (2010: R76 million). The group has no obligation to fund medical aid contributions for current or retired employees. Annual Financial Statements
68 GROUP NOTES TO THE ANNUAL FINANCIAL STATEMENTS FOR THE YEAR ENDED 31 DECEMBER 31. GUARANTEES AND LEGAL PROCEEDINGS Guarantees Environmental trust closure liability Environmental obligations During 2011 SIOC issued financial guarantees to the DMR to the value of R286 million (2010: R567 million) in respect of the environmental rehabilitation and decommissioning obligations of the group. Legal proceedings ArcelorMittal SA Limited (ArcelorMittal) SIOC notified ArcelorMittal on 5 February 2010, that it was no longer entitled to receive 6.25Mtpa of iron ore contract mined by SIOC at cost plus 3% from Sishen mine, as a result of the fact that ArcelorMittal had failed to convert its old order mining rights. This contract mining agreement, concluded in 2001, was premised on ArcelorMittal owning an undivided 21.4% interest in the mineral rights of Sishen mine. As a result of ArcelorMittal s failure to convert its old order mining right, the contract mining agreement automatically lapsed and became inoperative in its entirety as of 1 May As a result, a dispute arose between SIOC and ArcelorMittal, which SIOC has referred to arbitration. During 2011, three arbitrators were appointed and May 2012 was set as the date for the arbitration to begin. On 9 December 2011, SIOC and ArcelorMittal agreed to postpone the arbitration until the final resolution of the mining right dispute. SIOC and ArcelorMittal reached an interim pricing arrangement in respect of the supply of iron ore to ArcelorMittal from Sishen mine. This interim arrangement endured until 31 July SIOC and ArcelorMittal agreed to an addendum to the interim supply agreement which extended the terms and conditions of the current interim pricing agreement. The new interim pricing agreement, which is on the same terms and conditions as the first interim pricing agreement, commenced on 1 August 2011 and will endure to 31 July % undivided share of Sishen mine mineral rights After ArcelorMittal failed to convert its old order rights, SIOC applied for the residual 21.4% mining right previously held by ArcelorMittal and its application was accepted by the DMR on 4 May A competing application for a prospecting right over the same area was also accepted by the DMR. SIOC objected to this acceptance. Notwithstanding this objection, a prospecting right over the 21.4% interest was granted by the DMR to Imperial Crown Trading 289 (Pty) Limited ( ICT ). SIOC initiated a review application in the North Gauteng High Court on 21 May 2010 in relation to the decision of the DMR to grant a prospecting right to ICT. The High Court Review, in which SIOC challenged the award of the 21.4% prospecting right over Sishen mine by the DMR to ICT, was presided over by Judge Raymond Zondo in the North Gauteng High Court in Pretoria, South Africa, from July On 21 December 2011, judgment was delivered in the High Court regarding the status of the mining rights at the Sishen mine. The High Court held that, upon the conversion of SIOC s old order mining right relating to the Sishen mine properties in 2008, SIOC became the exclusive holder any decision taken by the DMR after such conversion in 2008 to accept or grant any further rights to iron ore at the Sishen mine properties was void. Finally, the High Court reviewed and set aside the decision of the Minister of Mineral Resources or her delegate to grant a prospecting right to ICT relating to the iron ore as a 21.4% share in respect of the Sishen mine properties. On 3 February 2012, both the DMR and ICT submitted applications for leave to appeal against the High Court judgment. SIOC has noted an application for leave to present a conditional cross appeal, in order to present its rights. SIOC is awaiting a date for the hearing of the application for leave to appeal. The High Court order does not affect the interim supply agreement between AMSA and SIOC, which will endure until 31 July 2012 as indicated above. SIOC will continue to take the necessary steps to protect its shareholders interests in this regard. Lithos Corporation (Pty) Limited (Lithos) Lithos Corporation (Pty) Limited is claiming USD421 million from Kumba for damages in relation to the Falémé Project in Senegal. Kumba continues to defend the merits of the claim and is of the view, and has been so advised, that the basis of the claim and the quantification thereof is fundamentally flawed. The trial date has been postponed indefinitely. There have been no further developments in this matter. 64 Kumba Iron Ore Limited
69 32. COMMITMENTS Operating lease commitments The future minimum lease payments under non-cancellable operating leases are as follows: Property Within 1 year 8 14 Between 1 and 2 years to 5 years Plant and equipment Within 1 year 11 2 Between 1 and 2 years 2 2 to 5 years Other 2 to 5 years 1 Total operating lease commitments Commitments shipping services The future commitments under contracts for affreightment are as follows: Within 1 year 943 Between 1 and 2 years to 5 years 2,817 More than 5 years 4,784 The future commitments for spot vessels are as follows: Within 1 year , CONTINGENT ASSETS AND LIABILITIES Falémé Project Kumba initiated arbitration proceedings against La Société des Mines De Fer Du Sénégal Oriental (Miferso) and the Republic of Senegal under the rules of the Arbitration of the International Chamber of Commerce in 2007, in relation to the Falémé Project. Following the arbitration award rendered in July 2010, a mutually agreed settlement was concluded between the parties. The parties agreed that the precise terms of the settlement agreement will remain confidential. The first settlement was paid by the Republic of Senegal in April The remaining settlement amount will be recovered in equal instalments from the Republic of Senegal over the remaining four-year period, on which contingent legal costs will be payable. A portion of the amount recovered was committed to social and community development projects to benefit the population of Senegal. Audited annual financial statements Other There have been no other significant changes in the contingent assets and liabilities disclosed at 31 December POST-BALANCE SHEET EVENTS The directors are not aware of any other matter or circumstance arising since the end of the year and up to the date of this report, not otherwise dealt with in this report. Annual Financial Statements
70 GROUP NOTES TO THE ANNUAL FINANCIAL STATEMENTS FOR THE YEAR ENDED 31 DECEMBER 35. RELATED PARTY TRANSACTIONS During the year the company and its subsidiaries, in the ordinary course of business, entered into various sale and purchase of goods and services with the ultimate holding company, Anglo American plc, its subsidiaries, associates and joint ventures. Certain deposits are also placed with the holding company (refer to note 8). The effect of these transactions is included in the results of the group. These transactions occurred under terms that are no less favourable than those arranged with third parties. Holding company Anglo American plc is the group s ultimate holding company. The interest in the group is held through a 65.22% holding by Anglo South Africa Capital (Pty) Limited (2010: 65.25%). Subsidiaries Details of investments in and loans to/from subsidiaries are disclosed in annexure 1. Associates and joint ventures Details of investments in associates and joint ventures are disclosed in note 3 of the group financial statements and in annexure 2. Entities with significant influence over SIOC Exxaro is SIOC s 20% Black Economic Empowerment shareholder. Details of dividends paid to Exxaro as well as its proportionate share of earnings for the year are detailed in note 23 of the group financial statements. Special purpose entities The group has an interest in the following special purpose entities which are consolidated: Entity SIOC Employee Share Participation Scheme (Envision) Kumba Iron Ore Rehabilitation Trust Kumba BSP Trust Kumba Iron Ore Management Share Trust Nature of business Investment vehicle Trust fund for mine closure Share incentive scheme administration Share incentive scheme administration Directors and prescribed officers Details relating to directors and the group s Executive Committee remuneration and shareholdings (including share options) are disclosed in the remuneration report on pages 19 to 26. Shareholders The principal shareholders of the company are detailed under Shareholder analyses on page 84. Material related party transactions Purchase of goods and services and finance charges Subsidiary of the ultimate holding company 22 Fellow subsidiaries Aircraft services Research Technical services 21 7 Corporate Operations (including shared services) Scaw metals Other 1 Associates and joint ventures 174 Enitities with significant influence over SIOC Finance income Holding company Amounts owing to related parties (after eliminating intercompany balances) Holding company Derivative financial instruments Fellow subsidiaries Trade payables Goods were purchased from Exxaro and consisted mainly of ferrosilicon. 2 Interest was earned at an average rate of 5.37% (2010: 5.30%) on cash deposits held with Anglo American SA Finance Ltd. 66 Kumba Iron Ore Limited
71 35. RELATED PARTY TRANSACTIONS continued Amounts owing by related parties (after eliminating intercompany balances) Subsidiaries of ultimate holding company 3,980 1,472 Interest receivable 5 3 Cash and cash equivalents 3,885 1,391 Derivative financial instruments Fellow subsidiaries Trade receivables 5 3 Associates and joint ventures Loans ,018 1, SEGMENT REPORTING The Kumba Executive Committee considers the business principally according to the nature of the products and service provided, with the identified segments each representing a strategic business unit. The total reported segment revenue comprises revenue from external customers as the group does not have any inter-segment revenue and is measured in a manner consistent with that disclosed in the income statement. The performance of the operating segments are assessed based on a measure of earnings before interest and tax (EBIT), which is consistent with Operating profit in the financial statements. Finance income and finance costs are not allocated to segments, as treasury activity is managed on a central group basis. Total segment assets comprise finished goods inventory only, which is allocated based on the operations of the segment and the physical location of the asset. Other segments comprise corporate, administration and other expenditure not allocated to the reported segments. Rand million Sishen mine Thabazimbi mine Kolomela mine* Shipping operations Total 2011 Revenue (from external customers) 44, ,711 48,553 EBIT 32, (80) ,030 Total segment assets Revenue (from external customers) 35, ,879 38,704 EBIT 25,540 (44) ,815 Total segment assets * Kolomela mine represents a strategic business unit for Kumba, although it does not yet qualify as a reportable segment in terms of IFRS 8, Operating Segments. Audited annual financial statements Annual Financial Statements
72 GROUP NOTES TO THE ANNUAL FINANCIAL STATEMENTS FOR THE YEAR ENDED 31 DECEMBER 36. SEGMENT REPORTING continued REVENUE FROM EXTERNAL CUSTOMERS ANALYSED BY GOODS AND SERVICES Sale of products* 45,842 35,825 Shipping services 2,711 2,879 Revenue per the income statement 48,553 38,704 Reconciliation of EBIT to total profit before taxation Total EBIT for reportable segments 33,030 25,815 Other segments (1,064) (684) Operating profit 31,966 25,131 Net finance costs/(income) 92 (29) Profit before taxation per the income statement 32,058 25,102 Reconciliation of reportable segments' assets to total assets Segment assets for reportable segments Other segments and WIP inventory 3,071 2,114 Inventory per balance sheet 3,864 3,102 Other current assets 8,311 7,975 Non-current assets 22,238 16,798 Total assets per the balance sheet 34,413 27,875 * Derived from extraction, production and selling of iron ore. GEOGRAPHICAL ANALYSIS Kumba is domiciled in South Africa. The result of its revenue from external customers and its non-current assets disclosed on a geographical basis, are set out below. Revenue from external customers South Africa 3,388 2,874 Export 45,165 35,830 China 29,904 23,112 Rest of Asia 9,274 7,465 Europe 5,450 4,896 Middle East Americas/other Total revenue 48,553 38,704 Non-current assets* South Africa 21,450 16,243 China 2 2 Total non-current assets 21,452 16,245 * Excluding pre-payments, investments in associates and joint ventures and deferred tax assets. 68 Kumba Iron Ore Limited
73 COMPANY BALANCE SHEET AS AT 31 DECEMBER BALANCE SHEET Rand million Notes Assets Investments in subsidiaries Deferred tax assets Non-current assets Other receivables 8 Current tax assets Cash and cash equivalents Current assets Total assets 384 1,390 Equity and liabilities Share capital and premium Reserves (74) 993 Total equity 292 1,343 Liabilities Provisions 5 Non-current liabilities Loans from subsidiary companies 1 18 Other payables Current liabilities Total liabilities Total equity and liabilities 384 1,390 Audited annual financial statements Annual Financial Statements
74 COMPANY INCOME STATEMENT / STATEMENT OF CHANGES IN EQUITY FOR THE YEAR ENDED 31 DECEMBER INCOME STATEMENT Rand million Notes Net operating expenses 6 (44) (33) Operating loss (44) (33) Finance income Finance costs (1) Income from investments 7 13,016 6,705 Profit before taxation 13,042 6,794 Taxation 8 (95) (35) Profit for the year 12,947 6,759 Total comprehensive income for the year 12,947 6,759 The company did not have any non-owner changes in equity during the year other than the profit for the year, therefore no separate statement of other comprehensive income is presented for the years ended 31 December 2011 and STATEMENT OF CHANGES IN EQUITY Share premium (note 4) Equity-settled share-based payment Rand million Share capital (note 4) Retained earnings Total Balance at beginning of year Shares issued during the period Equity-settled share-based payments Vesting of shares under employee share incentive schemes (3) (9) (12) Total comprehensive income for the year 6,759 6,759 Dividends paid (6,720) (6,720) Balance at 31 December ,343 Shares issued during the period Equity-settled share-based payments (244) (244) Vesting of shares under employee share incentive schemes (7) (14) (21) Total comprehensive income for the year 12,947 12,947 Dividends paid (13,749) (13,749) Balance at 31 December (268) Kumba Iron Ore Limited
75 COMPANY CASH FLOW STATEMENT FOR THE YEAR ENDED 31 DECEMBER CASH FLOW STATEMENT Rand million Notes Cash flows from operating activities Cash utilised by operations Net finance income Income from investments 13,016 6,705 Taxation paid 10 (114) (16) Dividends paid (13,749) (6,720) (773) 97 Cash flows from investing activities Redemption of long-term asset 458 Net increase/(decrease) in loans to subsidiaries 364 (164) Cash flows from financing activities Share capital issued Increase in loans from subsidiaries 18 Vesting of shares under employee share incentive schemes (21) (12) Net (decrease)/increase in cash and cash equivalents (396) 459 Cash and cash equivalents at beginning of year Cash and cash equivalents at end of year Audited annual financial statements Annual Financial Statements
76 COMPANY NOTES TO THE ANNUAL FINANCIAL STATEMENTS FOR THE YEAR ENDED 31 DECEMBER NOTES TO THE ANNUAL FINANCIAL STATEMENTS 1. INVESTMENTS IN SUBSIDIARIES Reflected as non-current assets Shares at cost 3 3 Share-based payment expenditure* Long-term loans to subsidiaries Short-term loans from subsidiaries (18) Net investments in subsidiaries * Arising from the accounting for share-based payment transactions in terms of IFRS 2. Investments in subsidiaries are accounted for at cost. For further details of interests in significant subsidiaries, refer to annexure DEFERRED TAX ASSET Balance at beginning of year 1 1 Balance at end of year 1 1 Deferred tax asset attributable to the following temporary differences Leave pay accrual 1 1 Total deferred tax assets CASH AND CASH EQUIVALENTS Cash Currency analysis of cash and cash equivalents Rand Credit risk Cash and cash equivalents are held in various financial institutions with long-term investment grade credit rating and with the capacity for payment of financial commitments considered strong. Fair value of cash and cash equivalents The carrying amount of cash and cash equivalents approximate their fair value because of the short period maturity of these instruments. 72 Kumba Iron Ore Limited
77 4. SHARE CAPITAL AND SHARE PREMIUM Number of shares Authorised 500,000,000 ordinary shares of R0.01 each 500,000, ,000,000 Issued Ordinary shares of R0.01 each 322,058, ,911,721 Reconciliation of issued shares Number of shares at beginning of year 321,911, ,415,081 Number of ordinary shares issued 5,377,770 1,496,640 Number of ordinary shares repurchased and cancelled (5,230,867) Number of shares at end of year 322,058, ,911,721 For further detail refer to the group annual financial statements. Reconciliation of share capital and premium Share capital 3 3 Share premium PROVISIONS Balance at beginning of year 1 Amounts utilised against provision 2 (2) Cash-settled share-based payments (2) 1 Balance at end of year 6. OPERATING (EXPENSES)/INCOME Cost by type Salaries and wages (18) (26) Equity-settled share-based payments (13) (14) Cash-settled share-based payments (2) (1) Pension and medical costs (9) (2) General charges (8) 4 Cost recoveries 6 6 (44) (33) The above costs are stated after including: Directors emoluments Executive directors Emoluments received as directors of the company 10 8 Bonuses and cash incentives 4 4 Non-executive directors emoluments as directors of the company 4 3 Audited annual financial statements 7. INCOME FROM INVESTMENTS Dividends received from subsidiaries 13,016 6,705 Annual Financial Statements
78 COMPANY NOTES TO THE ANNUAL FINANCIAL STATEMENTS FOR THE YEAR ENDED 31 DECEMBER 8. TAXATION Charge to income SA normal tax Current year STC 74 Total % Reconciliation of taxation rates Taxation as a percentage of profit before taxation Taxation effect of: Capital profits (0.6) Disallowable expenditure (0.1) (0.1) Exempt income Standard tax rate CASH UTILISED BY OPERATIONS Operating loss (44) (33) Adjusted for: Movement in provisions (1) Share-based payment expense Cash flows from operations (31) (19) Working capital movements: Decrease in other receivables 8 12 Increase in other payables NORMAL TAXATION PAID Amounts unpaid at beginning of year (4) (23) Amounts charged to the income statement Amount paid during the period (114) (16) Current tax asset at end of year (23) (4) 74 Kumba Iron Ore Limited
79 11. RELATED PARTY TRANSACTIONS During the year Kumba in the ordinary course of business, entered into various sale and purchase of goods and services transactions with its subsidiaries SIOC and Main Street 576 (Pty) Ltd as well as its holding company, Anglo American plc. The effects of these transaction is included in the results of Kumba. These transactions occurred under terms that are no less favourable than those arranged with third parties. Holding company Anglo American plc is Kumba s ultimate holding company. The interest in Kumba is held through a 65.22% holding by Anglo South Africa Capital (Pty) Limited (2010: 65.25%). Subsidiaries Details of investments in and loans to/from subsidiaries are disclosed in annexure 1. Shareholders The principal shareholders of the company are detailed under Shareholder analyses on page 84. Material related party transactions Purchase of goods and services and finance charges Holding company Anglo American plc 1 (2011 and 2010 <R1 million) Sale of goods and services and finance income Subsidiaries: SIOC Amounts owing to related parties Subsidiaries: SIOC 18 Amounts owing by related parties 18 Subsidiaries: SIOC 386 Main Street 576 (Pty) Ltd Dividends paid by Kumba Holding company Anglo American plc 1 8,969 4,324 8,969 4,324 Dividends paid to Kumba Subsidiaries: SIOC 13,009 6,699 1 Goods and services consists of directors fees paid directly to Anglo Operations Limited for Mr DM Weston and Mr GG Gomwe. 2 Goods and services consists of a management fee charged by Kumba to SIOC. Finance income was also earned on dividends payable to Kumba by SIOC. 13,009 6, POST-BALANCE SHEET EVENTS A final dividend of R22.50 per share was declared on 7 February 2012 from profits accrued during the financial year ended 31 December The total dividend for the year amounted to R44.20 per share. The estimated total cash flow of the final dividend of R22.50 per share, payable on 19 March 2012, is R7.2 billion. The directors are not aware of any other matter or circumstance arising since the end of the year and up to the date of this report, not otherwise dealt with in this report. Annexures Annual Financial Statements
80 ANNEXURE 1: INVESTMENTS IN SUBSIDIARIES FOR THE YEAR ENDED 31 DECEMBER ANNEXURE 1: INVESTMENTS IN SUBSIDIARIES Rand million Direct investments Country of incorporation 1 Nature of % business 2 holding Nominal issued capital Investments at cost 2011 Rand 2010 Rand 2011 Rand Loans (from)/to subsidiaries Sishen Iron Ore Company (Pty) Limited RSA A ,008,810 3,008,810 (17,940,816) 385,646,729 Main Street 576 (Pty) Limited RSA E ,613,188 39,050,027 Indirect investments Groler Investments Limited SWL E ,958 Kumba Hong Kong Limited HK B Kumba Hong Kong Shipping Limited HK C Kumba International BV NE B ,806,511 Kumba International Trading SA LUX B ,335,369 Kumba Iron Ore Holdings SARL NE E ,654 Mineco Limited MAU F Oreco Leasing Limited MAU F Sibelo Resources Development (Pty) Limited RSA D Sishen South Mining (Pty) Limited RSA F Vulcan Leasing Limited MAU F Total investments in subsidiaries 3,008,910 3,008,910 42,672, ,696,756 Aggregate attributable after tax profits/(losses) of subsidiaries: Profits 19,347 17, Rand Losses 3 (745) 1 RSA South Africa, NE Netherlands, SWL Switzerland, HK Hong Kong, LUX Luxembourg, MAU Mauritius 2 A Mining, B Iron ore marketing and sales, C Shipping charter, D Exploration, E Investment holding, F Dormant 3 Includes the impairment of investments in subsidiaries. 76 Kumba Iron Ore Limited
81 ANNEXURE 2: INVESTMENTS IN ASSOCIATES, JOINT VENTURES AND OTHER INVESTMENTS FOR THE YEAR ENDED 31 DECEMBER ANNEXURE 2: INVESTMENTS IN ASSOCIATES Group Loan balance Company Loan balance Rand 000 Nature of business 1 Number of shares held % holding Investment at cost 2011 Rand Rand Rand Rand 000 Associates Unlisted Manganore Iron Mining Limited 2 A 25, Incorporated joint ventures Unlisted Polokwane Iron Ore Company (Pty) Limited 2 A 4, ,740 33,251 28,952 Safore (Pty) Limited 3 B Sishen Shipping (Pty) Limited 3 B Trans Orient Ore Supplies Limited 3 C ,740 33,251 28,952 Group Loan balance Company Loan balance Rand 000 Investment at cost 2011 Rand Rand Rand Rand 000 Directors valuation of investments at 31 December Unlisted investments in associates 50 Unlisted investments in joint ventures 3,740 33,251 28,952 The financial year-end for Manganore Iron Ore Mining Limited and Sibelo Resources Development (Pty) Limited is 30 June. Where the financial year-ends are not co-terminous with that of the group, financial information has been obtained from published information or management accounts as appropriate. All above entities are incorporated in South Africa other than Trans Orient Ore Supplies Limited which is incorporated in Hong Kong. 1 A Mining, B Shipping charter, C Iron ore merchant, D Community development 2 On 5 July 2011 the company changed its name from Pietersburg Iron Company (Pty) Limited to Polokwane Iron Ore Company (Pty) Limited. 3 Dormant Annexures Annual Financial Statements
82 ANNEXURE 3: SHARE - BASED PAYMENTS FOR THE YEAR ENDED 31 DECEMBER ANNEXURE 3: SHARE-BASED PAYMENTS BONUS SHARE PLAN Grant Movement in the number of awards granted Balance at beginning of year 225, ,777 Bonus shares awarded 223,868 16,241 Awards exercised* (4,878) (17,611) (11,549) Awards forfeited (2,302) (3,787) (1,325) Balance at 31 December , , ,903 Balance at beginning of year 299,138 Bonus shares awarded 231,573 26,564 Awards exercised* (512) (4,360) Awards forfeited (5,187) (10,565) Balance at 31 December , ,777 * This relates to the pro-rata portion of the Bonus Shares granted to employees who are considered good leavers in terms of the share rules. Number of awards Expiry date Vesting period of awards granted Less than 1 year 297, to 2 years 220, to 5 years 216, The share awards granted under the BSP are considered equity-settled. The share-based payment expense is measured using the fair value of the share awards issued under the BSP which was determined using the grant date share price of Kumba s shares. Grant Fair value assumptions Share price on date of grant (Rand) Expected share option life (years) Expected dividend yield (%) Risk-free interest rate (%) The risk-free interest rate for the period within the contractual term of the awards is based on South African government bonds. The historical volatility of the Kumba share price is used in determining the expected volatility. LONG-TERM INCENTIVE PLAN Awards Number of conditional awards Movement in the number of conditional awards granted Balance at beginning of year 23,365 36, , Conditional awards issued 17,960 2,314 Conditional awards vested (208,775) Conditional awards forfeited (4,384) (388) Balance at 31 December ,960 23,365 36,490 Balance at beginning of year 36, ,175 74,913 Conditional awards issued 24,219 Conditional awards vested 2 (74,525) Conditional awards forfeited (854) (6,330) Balance at 31 December ,365 36, , The balance of 2007 awards remaining at 31 December 2010 represents a pro-rata allocation of LTIP awards made to employees that joined Kumba after the original award and these awards will vest on the third anniversary. 2 This relates to employees who are considered good leavers in terms of the share rules. 78 Kumba Iron Ore Limited
83 LONG-TERM INCENTIVE PLAN continued Number of conditional awards Expiry date Vesting period of conditional awards granted Less than 1 year 36, to 2 years 23, to 5 years 17, The conditional awards granted under the LTIP are considered equity-settled. The share-based payment expense is measured using the fair value of the conditional award issued under the LTIP which was determined using the Monte Carlo option pricing model. Grant Fair value assumptions Share price on date of grant (Rand) Annualised expected volatility (%) Expected share option life (years) Expected dividend yield (%) Risk-free interest rate (%) The risk-free interest rate for the period within the contractual term of the conditional awards is based on South African government bonds. The historical volatility of the Kumba and, where applicable, the Kumba Resources share price is used in determining the expected volatility. SHARE APPRECIATION RIGHTS SCHEME Number of rights 2008 award Number of rights 2007 award Exercise price range Rand Movement in the number of rights granted Balance at beginning of year 210, , Rights exercised (111,230) (43,377) Rights forfeited (1,130) Balance at 31 December ,164 61, Balance at beginning of year 215, , Rights exercised* (145,514) Rights forfeited (5,370) (2,000) Balance at 31 December , , * This relates to employees who are considered good leavers in terms of the share rules. Exercise price range Rand Number of rights Expiry date Vesting period of rights granted 2 to 5 years , to 5 years , The rights granted under the SARS are considered equity-settled. The share-based payment expense is measured using the fair value of the rights issued under the SARS which was determined using the Black-Scholes option pricing model. Annexures Annual Financial Statements
84 ANNEXURE 3: SHARE - BASED PAYMENTS FOR THE YEAR ENDED 31 DECEMBER 2008 award 2007 award Fair value assumptions Share price on date of grant (Rand) Weighted average exercise price (Rand) Annualised expected volatility (%) Expected share option life (years) Expected dividend yield (%) Risk-free interest rate (%) The risk-free interest rate for the period within the contractual term of the rights is based on South African government bonds. The historical volatility of the Kumba share price is used in determining the expected volatility. DEFERRED BONUS PLAN Number of rights Exercise price range Rand Movement in the number of pledged shares Balance at beginning of year 1, Exercised (1,578) Balance at 31 December 2011 Balance at beginning of year 1, Balance at 31 December , Exercise price range Rand Number of pledged shares Expiry date Vesting period of pledged shares 1 to 2 years , The shares awarded under the DBP are considered equity-settled. The share-based payment expense is measured using the fair value of the shares issued under the DBP which was determined using the Black-Scholes option pricing model. MANAGEMENT SHARE OPTION SCHEME Number of share options Option price range (Rand) Movement in the number of share options granted Balance at beginning of year 321, Share options exercised (149,218) Share options forfeited 75 Balance at 31 December , Balance at beginning of year 798, Share options exercised (462,752) Share options forfeited (14,720) 75 Balance at 31 December , Number of share options Vesting period of share options granted Already vested 171, ,168 Within 1 year 143, , ,148 Range of exercise prices (rand) Weighted average option price Rand Number of share options Expiry date , , ,930 The share options granted under the Management Share Option Scheme are considered equity-settled. The share-based payment expense is measured using the fair value of the share options issued under the Management Share Option Scheme which was determined using the Black- Scholes option pricing model. 80 Kumba Iron Ore Limited
85 MANAGEMENT SHARE OPTION SCHEME continued Before After unbundling unbundling Kumba Exxaro Fair value assumptions Share price (Rand) Weighted average exercise price (Rand) Annualised expected volatility (%) Expected share option life (years) Expected dividend yield (%) Risk-free interest rate The risk-free interest rate for the period within the contractual term of the share options is based on South African government bonds. The historical volatility of the Kumba Resources share price is used in determining the expected volatility. ENVISION Number of share options Phase 2 Phase 1 Weighted average option price Rand Number of share options Weighted average option price Rand Movement in the number of share options granted Balance at beginning of year ,622, Share options issued 22,618, , Share options vested (15,614,606) Share options lapsed (106,092) Balance at 31 December ,618, Balance at beginning of year 15,353, Share options issued 655, Share options lapsed (387,033) Balance at 31 December ,622, Number of share options Expiry date Vesting period of share options granted Within 5 years 22,618, Envision is considered equity-settled. The share-based payment expense is measured using the fair value of the awards issued under the scheme which was determined using the Monte Carlo option pricing model. Phase 2 Phase 1 Share price on date of grant (Rand) Weighted average exercise price (Rand) Annualised expected volatility (%) Expected share option life (years) Expected dividend yield (%) Risk-free interest rate (%) The risk-free interest rate for the period within the contractual term of the share options is based on South African government bonds. The historical volatility of the Kumba and Kumba Resources share price is used in determining the expected volatility. Annexures Annual Financial Statements
86 ANNEXURE 4: BALANCE SHEET US DOLLAR CONVENIENCE TRANSLATION AS AT 31 DECEMBER ANNEXURE 4: BALANCE SHEET US DOLLAR CONVENIENCE TRANSLATION (Unaudited supplementary information) US dollar million Assets Property, plant and equipment 2,552 2,395 Biological assets 1 1 Investments in associates and joint ventures 4 4 Investments held by environmental trust Long-term prepayments and other receivables 12 8 Deferred tax assets Non-current assets 2,718 2,535 Inventories Trade and other receivables Current tax assets 4 4 Cash and cash equivalents Current assets 1,489 1,672 Total assets 4,207 4,207 Equity and liabilities Shareholders equity 1,936 2,164 Non-controlling interest Total equity 2,518 2,774 Liabilities Interest-bearing borrowings 481 Provisions Deferred tax liabilities Non-current liabilities Short-term portion of interest-bearing borrowings 390 Short-term portion of provisions 1 2 Trade and other payables Current tax liabilities Total liabilities 1,689 1,433 Total equity and liabilities 4,207 4,207 Exchange rate Translated at closing rand/us dollar exchange rate Kumba Iron Ore Limited
87 ANNEXURE 5: INCOME STATEMENT US DOLLAR CONVENIENCE TRANSLATION FOR THE YEAR ENDED 31 DECEMBER ANNEXURE 5: INCOME STATEMENT US DOLLAR CONVENIENCE TRANSLATION (Unaudited supplementary information) US dollar million Revenue 6,697 5,299 Operating expenses (2,288) (1,858) Operating profit 4,409 3,441 Finance income Finance costs (21) (24) Profit before taxation 4,421 3,437 Taxation (1,346) (933) Profit for the year 3,075 2,504 Attributable to: Owners of Kumba 2,351 1,961 Non-controlling interest ,075 2,504 (Cents per share) Basic Diluted Exchange rate Translated at average rand/us dollar exchange rate Annexures Annual Financial Statements
88 SHAREHOLDER ANALYSIS SHAREHOLDER ANALYSIS REGISTER DATE: 30 DECEMBER 2011 ISSUED SHARE CAPITAL: No of shareholdings % No of shares % Shareholder spread shares 20, ,641, shares 2, ,797, shares ,813, shares ,564, shares and over ,241, Totals 23, ,058, Distribution of shareholders Banks/Brokers ,338, Close corporations , Endowment funds , Individuals 18, ,776, Insurance companies ,001, Investment companies ,988, Medical schemes , Mutual funds ,813, Nominees and trusts 2, ,195, Other corporations , Private companies ,267, Public companies ,659, Retirement funds ,401, Share trust , Totals 23, ,058, Public / non-public shareholders Non-public shareholders ,694, Directors and associates of the company holdings , Strategic holdings ,547, Related holdings ,103, Public shareholders 23, ,364, Totals 23, ,058, Beneficial shareholders holding 3% or more Anglo American plc 210,052, Industrial Development Corporation of South Africa Ltd 41,498, Government Employees Pension Fund 13,409, Totals 264,960, Kumba Iron Ore Limited
89 BREAKDOWN OF NON-PUBLIC HOLDINGS BREAKDOWN OF NON-PUBLIC HOLDINGS No of shares % Directors of the company Uren, VP 21, Uren, VP 20, V.N Centurien Trust 1, Griffith, CI 21, Griffith, CI 21, Griffith, CL Totals 42, Strategic Holdings Anglo American South Africa Capital (Pty) Ltd 210,049, Industrial Development Corporation of South Africa Ltd 41,498, Totals 251,547, Related Holdings Mercantile Shareholder Nominees - Exxaro 1,630, Kumba Bonus Share Plan Trust 244, Sishen Iron Ore Company (Pty) Ltd 139, Exxaro Resources Limited (No8) 88, SIOC Employee Share Participation Scheme Totals 2,103, BREAKDOWN OF BENEFICIAL SHAREHOLDERS HOLDING 3% OR MORE No of shares % Beneficial Shareholders Anglo American plc 210,052, Anglo American South Africa Capital (Pty) Ltd 210,052, Industrial Development Corporation of South Africa Ltd 41,498, Industrial Development Corporation of South Africa Ltd 41,498, Government Employees Pension Fund 14,530, Government Employees Pension Fund - PIC 13,383, Government Employees Pension Fund - Investec Asset Management 530, Government Employees Pension Fund - Prudential Portfolio Managers 448, Government Employees Pension Fund - Taquanta Asset Mangers 65, Government Employees Pension Fund - Sentio Capital Management 41, Government Employees Pension Fund - AEON Investment Management 32, Government Employees Pension Fund - Mergence Africa Investments 28, Totals 266,081, Corporate information Annual Financial Statements
90 ADMINISTRATION COMPANY REGISTRATION NUMBER: 2005/015852/06 JSE share code: KIO ISIN code: ZAE SECRETARY AND REGISTERED OFFICE Vusani Malie Centurion Gate Building 2B 124 Akkerboom Road Centurion, Pretoria, 0157 Republic of South Africa Tel: +27 (0) Fax: +27 (0) AUDITORS Deloitte & Touche Chartered Accountants (SA) Registered Auditors Deloitte Place, The Woodlands Office Park 20 Woodlands Drive, Woodmead, 2146 South Africa Private Bag X46, Gallo Manor, 2052 ASSURANCE PROVIDERS PricewaterhouseCoopers SA Registered Auditors 2 Eglin Road, Sunninghill, 2157 South Africa Private Bag X36, Sunninghill, 2157 Tel: +27 (0) Fax: +27 (0) SPONSOR Rand Merchant Bank (A division of FirstRand Bank Limited) Registration number: 1929/001225/06 1 Merchant Place Corner Rivonia Road and Fredman Drive Sandton, 2146 South Africa CORPORATE LAW ADVISORS 82 Maude Street Sandton, 2196 South Africa PO Box , Sandton, 2146 UNITED STATES ADR DEPOSITORY BNY Mellon Depositary Receipts Division 101 Barclay Street, 22nd Floor New York, New York Tel: Fax: /1/2 TRANSFER SECRETARIES Computershare Investor Services (Pty) Limited 70 Marshall Street Johannesburg, 2001 South Africa PO Box 61051, Marshalltown, 2107 INVESTOR RELATIONS Esha Mansingh esha.mansingh@angloamerican.com Tel: +27 (0) Mobile: +27 (0) FORWARD-LOOKING STATEMENTS Certain statements made in this report constitute forward-looking statements. Forward-looking statements are typically identified by the use of forwardlooking terminology such as believes, expects, may, will, could, should, intends, estimates, plans, assumes or anticipates or the negative thereof or other variations thereon or comparable terminology, or by discussions of, e.g. future plans, present or future events, or strategy that involves risks and uncertainties. Such forward-looking statements are subject to a number of risks and uncertainties, many of which are beyond the company s control and all of which are based on the company s current beliefs and expectations about future events. Such statements are based on current expectations and, by their nature, are subject to a number of risks and uncertainties that could cause actual results and performance to differ materially from any expected future results or performance, expressed or implied, by the forward-looking statement. No assurance can be given that such future results will be achieved; actual events or results may differ materially as a result of risks and uncertainties facing the company and its subsidiaries. The forward-looking statements contained in this report speak only as of the date of this report and the company undertakes no duty to, and will not necessarily, update any of them in light of new information or future events, except to the extent required by applicable law or regulation. PO Box , Sandton, Kumba Iron Ore Limited
91 NOTES Annual Financial Statements Corporate information
92 NOTES 88 Kumba Iron Ore Limited
93 4771/11
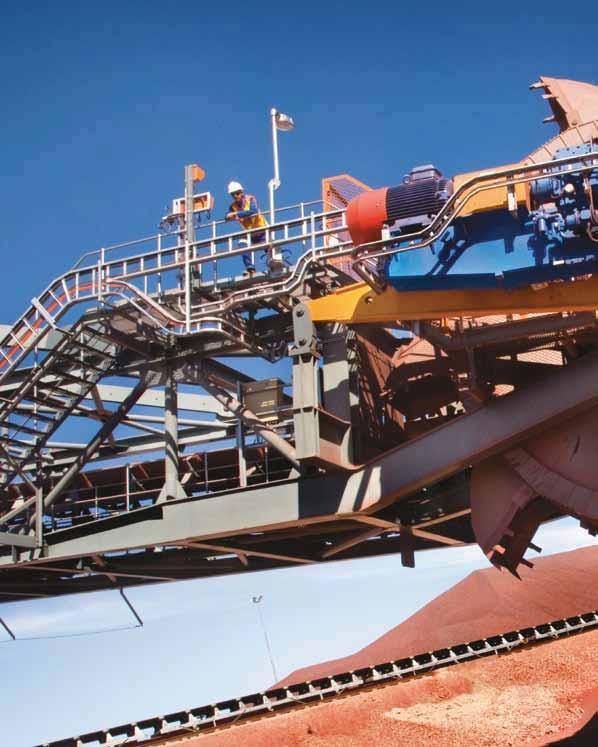
94
31 Dec Dec Dec Dec Dec Dec Dec Dec Dec Dec Dec Dec 2017
 Shareholder returns Kumba s share price continued to recover significantly during the year from R159 at to end the year at R379, gaining the accolade of best performing share on the JSE. The share price
Annual F inancial Financial Results 2008
 Annual Financial Results 2008 16 February 2009 Disclaimer Our presentation contains some forward looking statements with respect to the financial Our presentation contains some forward looking statements
2018 Interim Financial Results 24 July 2018
 2018 Interim Financial Results 24 July 2018 DISCLAIMER Certain statements made in this presentation constitute forward-looking statements. Forward-looking statements are typically identified by the use
2016 ANNUAL RESULTS 14 FEBRUARY 2017
 2016 ANNUAL RESULTS 14 FEBRUARY 2017 DISCLAIMER Certain statements made in this presentation constitute forward-looking statements. Forward-looking statements are typically identified by the use of forward-looking
KUMBA IRON ORE Centurion Gate 2B 124 Akkerboom Street Centurion
 KUMBA IRON ORE Centurion Gate 2B 124 Akkerboom Street Centurion 0157 www.angloamericankumba.com KUMBA IRON ORE LIMITED INTERIM FINANCIAL RESULTS FOR THE SIX MONTHS ENDED 30 JUNE 2011 KUMBA IRON ORE KUMBA
Annual financial statements 2016 KUMBA IRON ORE LIMITED DELIVERING CHANGE BUILDING RESILIENCE FOCUSED PERFORMANCE
 KUMBA IRON ORE LIMITED Annual financial statements 2016 DELIVERING CHANGE BUILDING RESILIENCE FOCUSED PERFORMANCE INTRODUCTION AUDITED ANNUAL FINANCIAL STATEMENTS OUR APPROACH TO REPORTING DELIVERING CHANGE.
BUILDING ON FIRM FOUNDATIONS DELIVERING A SUSTAINABLE FUTURE ENHANCING OUTCOMES
 KUMBA IRON ORE LIMITED 2017 ANNUAL FINANCIAL RESULTS FOR THE YEAR ENDED 31 DECEMBER 2017 BUILDING ON FIRM FOUNDATIONS DELIVERING A SUSTAINABLE FUTURE ENHANCING OUTCOMES MEDIA Sinah Phochana sinah.phochana@angloamerican.com
Kumba Iron Ore Limited ( Kumba or The Group ) announces its results for the year ended 31 December 2015
 announces its results for the year ended 31 December 2015") 9 February 2016 Kumba Iron Ore Limited ( Kumba or The Group ) announces its results for the year ended 31 December 2015 POSITIONING KUMBA FOR THE FUTURE Norman Mbazima, chief executive of Kumba notes,
9 February 2016 Kumba Iron Ore Limited ( Kumba or The Group ) announces its results for the year ended 31 December 2015 POSITIONING KUMBA FOR THE FUTURE Norman Mbazima, chief executive of Kumba notes,
SUMMARISED ANNUAL RESULTS FOR THE YEAR ENDED 31 DECEMBER 2015 DRIVING CHANGE, DEFINING OUR FUTURE KUMBA IRON ORE LIMITED
 SUMMARISED ANNUAL RESULTS FOR THE YEAR ENDED 31 DECEMBER 2015 DRIVING CHANGE, DEFINING OUR FUTURE KUMBA IRON ORE LIMITED DRIVING CHANGE, DEFINING OUR FUTURE KEY FEATURES No loss of life in 2015 42% drop
KUMBA IRON ORE LIMITED AUDITED PRELIMINARY SUMMARISED ANNUAL RESULTS FOR THE YEAR ENDED 31 DECEMBER 2014 AND FINAL CASH DIVIDEND DECLARATION
 Kumba Iron Ore Limited A member of the Anglo American plc group (Incorporated in the Republic of South Africa) (Registration number 2005/015852/06) JSE Share code: KIO ISIN: ZAE000085346 KUMBA IRON ORE
Production of 41.5Mt, Sishen and Kolomela exceeding targets. Substantial 34% reduction in controllable costs
 14 February 2017 Kumba Iron Ore Limited Annual results for the year ended 31 December 2016 Kumba Iron Ore Limited ( Kumba or the Group ) announces its results for the year ended 31 December 2016. Themba
BUILDING ON FIRM FOUNDATIONS DELIVERING A SUSTAINABLE FUTURE ENHANCING OUTCOMES
 KUMBA IRON ORE LIMITED ANNUAL FINANCIAL STATEMENTS 2017 BUILDING ON FIRM FOUNDATIONS DELIVERING A SUSTAINABLE FUTURE ENHANCING OUTCOMES Kumba Iron Ore Centurion Gate Building 2B 124 Akkerboom Road Centurion
BUILDING ON FIRM FOUNDATIONS DELIVERING A SUSTAINABLE FUTURE ENHANCING OUTCOMES
 KUMBA IRON ORE LIMITED REVIEWED INTERIM RESULTS FOR THE SIX MONTHS ENDED 3O JUNE BUILDING ON FIRM FOUNDATIONS DELIVERING A SUSTAINABLE FUTURE ENHANCING OUTCOMES KEY FEATURES Safety performance improved:
BUILDING ON FIRM FOUNDATIONS DELIVERING A SUSTAINABLE FUTURE ENHANCING OUTCOMES
 KUMBA IRON ORE LIMITED AUDITED ANNUAL RESULTS FOR THE YEAR ENDED 31 DECEMBER BUILDING ON FIRM FOUNDATIONS DELIVERING A SUSTAINABLE FUTURE ENHANCING OUTCOMES KEY FEATURES Material improvement IN ALL KEY
UNLOCKING OUR FULL POTENTIAL DISCIPLINED GROWTH FOR A SUSTAINABLE FUTURE
 KUMBA IRON ORE LIMITED AUDITED ANNUAL RESULTS FOR THE YEAR ENDED 31 DECEMBER 2018 UNLOCKING OUR FULL POTENTIAL DISCIPLINED GROWTH FOR A SUSTAINABLE FUTURE DELIVERING ON OUR STRATEGY AND CREATING VALUE
efficiency resulted in efficiency improving to 65% of benchmark.
 KUMBA IRON ORE LIMITED Incorporated in the Republic of South Africa REGISTRATION NUMBER: 2005/015852/06 JSE code: KIO ISIN: ZAE000085346 INCOME TAX NUMBER: 9586/481/15/3 ("Kumba" or "the Company" or "the
Financial statements. Contents. Responsibility statements 94 Independent auditors report to the members of Anglo American plc 95
 Contents Responsibility statements 94 Independent auditors report to the members of Anglo American plc 95 Principal statements Consolidated income statement 96 Consolidated statement of comprehensive income
Annual Financial Statements. for the year ended 31 March 2013
 Annual Financial Statements Annual financial statements Approval of annual financial statements 1 Lodgement of returns with the Companies and Intellectual Property Commission 1 Independent auditor s report
Results for the half-year ended 31 December 2017
 Results for the half-year These results are also available on: www.assore.com Assore Limited Registration number: 1950/037394/06 Share code: ASR ISIN: ZAE000146932 (Assore or group or company) Highlights
ANGLO AMERICAN SA FINANCE LIMITED (Incorporated in the Republic of South Africa)
") ANGLO AMERICAN SA FINANCE LIMITED (Incorporated in the Republic of South Africa) Company Registration number 2003/015144/06 Audited Annual Financial Statements For the year ended A member of the Anglo
ANGLO AMERICAN SA FINANCE LIMITED (Incorporated in the Republic of South Africa) Company Registration number 2003/015144/06 Audited Annual Financial Statements For the year ended A member of the Anglo
For personal use only
 IKWEZI MINING LIMITED (Incorporated in Bermuda with registered company number 45349) ARBN 151 258 221 REPORT FOR THE HALF-YEAR ENDED 31 DECEMBER 2013 CONTENTS DIRECTORS REPORT 1 INDEPENDENT AUDITORS REVIEW
THIRD QUARTER THIRD QUARTER REPORT REPORT
 10NOV20171551038 17 THIRD QUARTER REPORT REPORT TO HOLDERS OF COMMON SHARES To the Holders of Common Shares of Labrador Iron Ore Royalty Corporation The Directors of Labrador Iron Ore Royalty Corporation
MANAGEMENT S DISCUSSION AND ANALYSIS OF FINANCIAL CONDITION AND RESULTS OF OPERATIONS
 The following contains selected additional information regarding the business and operations of African Minerals Limited and certain of its subsidiaries, including Tonkolili Iron Ore (SL) Limited, African
INTERIM RESULTS PRESENTATION. for the six-month period ended 30 June 2017
 INTERIM RESULTS PRESENTATION for the six-month period ended 30 June 2017 Disclaimer 2 The operational and financial information on which any outlook or forecast statements are based has not been reviewed
Financial results for the year ended December 2013
 Financial results for the year ended December 2013 Agenda OVERVIEW Results overview and recent developments Results analysis Steel market overview Operating results Finance Other key issues and outlook
NOTES TO THE FINANCIAL STATEMENTS
 FINANCIAL STATEMENTS NOTES TO THE FINANCIAL STATEMENTS 1. ACCOUNTING POLICIES Basis of preparation The financial statements have been prepared in accordance with International Financial Reporting Standards
HIGHLIGHTS. 20% higher. Interim dividend. Iron ore and manganese ore. safety performance. Headline earnings. of R10 per share. prices remain firm
 RESULTS FOR THE HALF-YEAR ENDED 31 DECEMBER HIGHLIGHTS Headline earnings 20% higher Interim dividend of R10 per share Iron ore and manganese ore prices remain firm Continuous commitment to overall safety
INTERIM RESULTS FOR THE SIX MONTHS ENDED 30 SEPTEMBER October 2014 Presented by Mr Brian Molefe, Group Chief Executive Investor and Media
 INTERIM RESULTS FOR THE SIX MONTHS ENDED 30 SEPTEMBER 29 October Presented by Mr Brian Molefe, Group Chief Executive Investor and Media 1 Agenda Macro economic context Executive summary Actual performance
CHAPTER 2: THE YEAR IN BRIEF
 THE YEAR IN BRIEF Chapter CHAPTER : THE YEAR IN BRIEF ROBUST PERFORMANCE Exxaro delivered a very strong performance for FY with higher net operating profit, including discontinued operations, mainly driven
Material improvement in all key safety benchmarks and no fatal incidents. performance gains
 Our performance Strategic focus areas: performance and prospects STRATEGIC FOCUS AREAS: PERFORMANCE AND PROSPECTS Kumba s full year results reflect the stronger operational performance, which has been
1 August 2013 RESULTS FOR THE SIX MONTHS ENDED 30 JUNE Key features
 1 August 2013 RESULTS FOR THE SIX MONTHS ENDED 30 JUNE 2013 Key features H1 headline loss of R123 million Strong recovery in the second quarter with headline earnings increasing to R147 million compared
Consolidated financial statements December 31, 2017 and 2016
 Consolidated financial statements December 31, 2017 and 2016 April 26, 2018 Independent Auditor's Report To the Shareholders of Robex Resources Inc. We have audited the accompanying consolidated financial
Cliffs Natural Resources Inc. Reports First-Quarter 2011 Results
 Cliffs Natural Resources Inc. Reports First-Quarter 2011 Results - Revenue Increases 63% over Last Year to a First-Quarter Record of $1.2 Billion; Net Income Reaches $423 Million, or $3.11 Per Diluted
REVIEWED CONDENSED GROUP INTERIM FINANCIAL STATEMENTS AND UNREVIEWED PRODUCTION AND SALES VOLUMES INFORMATION
 REVIEWED CONDENSED GROUP INTERIM FINANCIAL STATEMENTS AND UNREVIEWED PRODUCTION AND SALES VOLUMES INFORMATION for the six-month period ended 30 June 2017 REVIEWED CONDENSED GROUP ANNUAL FINANCIAL STATEMENTS
Risk profile of IDC s book
 Integrated Report 213 Risk profile Risk profile of IDC s book Credit risk Impairments Impairments (IDC Company) 5 2 IDC s level of impairments has been increasing gradually in recent years, with the ratio
REPORT TO HOLDERS OF COMMON SHARES
 17 FIRST QUARTER REPORT REPORT TO HOLDERS OF COMMON SHARES To the Holders of Common Shares of Labrador Iron Ore Royalty Corporation The Directors of Labrador Iron Ore Royalty Corporation ( LIORC or the
Table of contents. Glossary of terms. Directors responsibility. Certificate from the Company Secretary. Independent Auditor s report
 MERCANTILE BANK LIMITED 1 Mercantile Bank Limited Registration Number: 1965/006706/06 An Authorised Financial Services and Credit Provider NCRCP19 Member of CGD Group 2 3 3 4 5 6 7 15 16 17 18 19 44 Table
Limited assurance report on non-financial performance indicators
 APPENDICES Limited assurance report on non-financial performance indicators Limited assurance report of the independent auditor, Deloitte & Touche to the directors of PPC Ltd on their non-financial performance
A B N
 A B N 9 8 0 0 8 9 0 5 3 8 8 HALF-YEAR FINANCIAL REPORT 31 DECEMBER 2007 DIRECTORS REPORT The directors present their report together with the consolidated financial report for the half-year ended 31 December
THE HOLLARD INSURANCE COMPANY LIMITED
 (Registration number 1952/003004/06) Audited consolidated annual financial statements for the year ended 30 June THE HOLLARD INSURANCE LIMITED These financial statements were audited in compliance with
CONSOLIDATED FINANCIAL STATEMENTS. DECEMBER 31, 2011 and (Expressed in US Dollars)
") CONSOLIDATED FINANCIAL STATEMENTS DECEMBER 31, 2011 and 2010 (Expressed in US Dollars) Independent Auditors Report To the Shareholders of Capstone Mining Corp. We have audited the accompanying consolidated
CONSOLIDATED FINANCIAL STATEMENTS DECEMBER 31, 2011 and 2010 (Expressed in US Dollars) Independent Auditors Report To the Shareholders of Capstone Mining Corp. We have audited the accompanying consolidated
MOUNTAIN PROVINCE DIAMONDS INC. As at December 31, 2017 and 2016 And for the years ended December 31, 2017 and 2016
 Consolidated Financial Statements (Expressed in thousands of Canadian Dollars) MOUNTAIN PROVINCE DIAMONDS INC. As at December 31, 2017 and 2016 And for the years ended December 31, 2017 and 2016 CONTENTS
newest iron ore LABRADOR IRON MINES Canada s producer Q3 Conference Call (for the quarter ended December 31, 2012)
") LABRADOR IRON MINES Canada s newest iron ore producer Q3 Conference Call (for the quarter ended December 31, 2012) John Kearney, Chairman & CEO Rod Cooper, President & COO Richard Pinkerton, CFO February
LABRADOR IRON MINES Canada s newest iron ore producer Q3 Conference Call (for the quarter ended December 31, 2012) John Kearney, Chairman & CEO Rod Cooper, President & COO Richard Pinkerton, CFO February
Audited Annual Financial Statements Together. creating value for all
 Audited Annual Financial Statements Together creating value for all Contents 1 Directors responsibility and approval of the group and company annual financial statements 2 Directors report 5 Audit and
For personal use only
 NRW Holdings Limited (ASX: NWH) ABN 95 118 300 217 For the Half-Year Ended 31 December 2014 220142013 1 APPENDIX 4D RESULTS FOR ANNOUNCEMENT TO THE MARKET For the Half-Year Ended 31 December 2014 NRW Holdings
Sasol Limited Analyst book for the half-year ended 31 December 2011
 Sasol Limited Analyst book for the half-year ended 31 December 2011 SASOL LIMITED GROUP ANALYST BOOK Key highlights for the half-year ended 31 December 2011 Sasol is pleased to provide this Analyst Book
DETOUR GOLD CORPORATION
 DETOUR GOLD CORPORATION YEARS ENDED DECEMBER 31, 2017 AND 2016 Consolidated Financial Statements Management s Responsibility for Financial Reporting The accompanying audited consolidated financial statements,
Annual General Meeting
 16 6MAR20170848348 16MAR201107545716 Annual General Meeting The Annual General Meeting of the holders of common shares of Labrador Iron Ore Royalty Corporation will be held: Date Thursday, May 11, 2017
FINANCIAL STATEMENTS
 FINANCIAL STATEMENTS GROUP SALIENT FEATURES 30 June N$ 000 s 30 June N$ 000 s % Change Revenue 2 434 177 2 316 932 5.1 Profit attributable to ordinary shareholders 258 982 205 529 26.0 Earnings per share
TONGAAT HULETT AUDITED RESULTS FOR THE YEAR ENDED 31 MARCH 2011
 1 TONGAAT HULETT AUDITED RESULTS FOR THE YEAR ENDED 31 MARCH 2011 Revenue of R9,681 billion (2010: R8,789 billion) Profit from operations of R1,338 billion (2010: R1,500 billion) Headline earnings of R806
MOUNT GIBSON IRON LIMITED QUARTERLY REPORT FOR THE PERIOD ENDED 31 DECEMBER January 2016
 MOUNT GIBSON IRON LIMITED QUARTERLY REPORT FOR THE PERIOD ENDED 31 DECEMBER 2015 20 January 2016 Key Points* December quarter iron ore sales of 1.5 million wet metric tonnes (Mwmt), and quarterly ore sales
statements annual financial statements 70 Group salient features 71 Five-year summary of results Annexure a: interest-bearing borrowings
 annual financial statements Annual financial statements 70 Group salient features 71 Five-year summary of results 72 Summary of statistics 73 Definitions 74 Ordinary share ownership 75 Financial review
Labrador Iron Ore Royalty Corporation - Results for the First Quarter Ended March 31, 2017
 Labrador Iron Ore Royalty Corporation - Results for the First Quarter Ended March 31, 2017 TORONTO, May 2, 2017 /CNW/ - Labrador Iron Ore Royalty Corporation ("LIORC", TSX: LIF) announced today its operation
Financial statements. Group financial statements. Company financial statements. 68 Independent auditor s report 74 Consolidated income statement
 Strategic report Governance Financial statements Financial statements Group financial statements 68 Independent auditor s report 74 Consolidated income statement 75 Consolidated statement of comprehensive
Management Consulting Group PLC Half-year report 2016
 provides professional services across a wide range of industries and sectors. Strategic report 01 Highlights 02 Chairman s statement 03 Operating and financial review Financials 08 Directors responsibility
REVIEWED PRELIMINARY RESULTS AND DIVIDEND ANNOUNCEMENT
 Palabora Mining Company Limited and its Subsidiaries (a member of the Rio Tinto Group) (Incorporated in the Republic of South Africa, Reg. No. 1956/002134/06) JSE Code: PAM ISIN: ZAE000005245 ( Group or
working together to achieve great results
 19% Increase in headline earnings per share 18% Increase in dividend/distribution to ordinary shareholders Strong balance sheet and cash flows GRINDROD LIMITED results and final dividend announcement for
Annual financial statements
 Annual financial statements 11 Statement of responsibility by the board of directors Page 100 Certificate by the company secretary Page 100 Audit committee report Page 101 Directors report Page 102 Independent
Strategic objectives. Business model. Key performance indicators
 Strategic objectives Strategy The strategy of the Assore group is to anticipate and react to changes in the markets in which it operates, to align and manage existing and available minerals and production
March. Report. Highlights. expected. Full Cash. Wodgina
 March 2017 ly Report 18 April 2017 Strong cashflow takes Atlas cash on hand too A$108m and Term Loan debt to A$ $112m Highlights Net operating cashflow of $22m after inventory build, interest, contractor
LABRADOR IRON MINES REPORTS THIRD QUARTER RESULTS. Requirement for Refinancing and Restructuring Voluntary Delisting from the TSX
 LABRADOR IRON MINES REPORTS THIRD QUARTER RESULTS Requirement for Refinancing and Restructuring Voluntary Delisting from the TSX Toronto, Ontario, February 13, 2015. Labrador Iron Mines Holdings Limited
9 Months Results September 2017
 9 Months Results September 2017 9 November 2017 Priorities and Targets Progress on key strategic initiatives 2 Initiatives Announced in May 2017 Status 1 2 Perform strategic review of business under direction
LEADERS IN MOBILITY ANNUAL FINANCIAL STATEMENTS
 LEADERS IN MOBILITY ANNUAL FINANCIAL STATEMENTS FOR THE YEAR ENDED 30 JUNE AUDITED ANNUAL FINANCIAL STATEMENTS FOR THE YEAR ENDED 30 JUNE CONTENTS 1 DIRECTORS RESPONSIBILITY FOR SEPARATE AND CONSOLIDATED
SUMMARISED CONSOLIDATED FINANCIAL STATEMENTS
 SUMMARISED CONSOLIDATED FINANCIAL STATEMENTS Chief Financial Officer s 64 Directors Responsibility Statement and Basis of Preparation 66 Certificate by Company Secretary 66 Independent Auditor s Report
INTERIM FINANCIAL RESULTS
 INTERIM FINANCIAL RESULTS PRESENTATION for the six-month period ended 30 June 2018 Belfast project: dam liner installation June 2018 Disclaimer The operational and financial information on which any outlook
Cliffs Natural Resources Inc. Reports Fourth-Quarter and Full-Year 2014 Results
 NEWS RELEASE Cliffs Natural Resources Inc. Reports Fourth-Quarter and Full-Year 2014 Results Reports Fourth-Quarter Adjusted EBITDA 1 of $297 million Reports U.S. Iron Ore Realized Pricing of $99 Per Ton
GROUP HIGHLIGHTS. Innovative Solutions. Endless Possibilities. Preliminary Audited Results for the year ended 28 February 2015
 GROUP HIGHLIGHTS Innovative Solutions. Endless Possibilities. Preliminary Audited Results for the year ended 28 February 2015 Santova Limited Preliminary audited results for the year ended 28 February
SUMMARISED CONSOLIDATED FINANCIAL STATEMENTS FOR THE YEAR ENDED 31 DECEMBER 2017
 SUMMARISED CONSOLIDATED FINANCIAL STATEMENTS FOR THE YEAR ENDED 31 DECEMBER 2017 FINAL RESULTS 2017 Summarised Consolidated Financial Statements For the year ended 31 December 2017 Merafe Resources Limited
2017 Audited Annual Financial Statements for the year ended 31 December 2017 Grindrod Limited
 2017 Audited Annual Financial Statements for the year ended 31 December 2017 Grindrod Limited FINANCIAL + FREIGHT + SHIPPING 1 Group 01 Approval of the annual financial statements 2 02 Compliance statement
PT HARUM ENERGY Tbk 1H 2018 Summary and Highlights
 31 July 2018 PT HARUM ENERGY Tbk 1H 2018 Summary and Highlights Important Note: The results provided below reflect the unaudited consolidated results of PT Harum Energy Tbk. ( the Company ) for the 6-month
POWERING BETTER LIVES
 Coal Ferrous Wind energy Titanium dioxide and pigment POWERING BETTER LIVES REVIEWED CONDENSED CONSOLIDATED ANNUAL FINANCIAL STATEMENTS AND UNREVIEWED PRODUCTION AND SALES VOLUMES INFORMATION for the year
REVIEWED PROVISIONAL CONDENSED CONSOLIDATED FINANCIAL RESULTS REVIEWED PROVISIONAL CONDENSED CONSOLIDATED FINANCIAL RESULTS
 REVIEWED PROVISIONAL CONDENSED CONSOLIDATED FINANCIAL RESULTS FOR THE YEAR ENDED 31 AUGUST 2018 REVIEWED PROVISIONAL CONDENSED CONSOLIDATED FINANCIAL RESULTS HIGHLIGHTS Property portfolio increase to R8.6
analyst book for the six months ended 31 December 2012 better together... we deliver
 analyst book for the six months ended 31 December 2012 better together... we deliver SASOL LIMITED GROUP ANALYST BOOK Key highlights for the half-year ended 31 December 2012 Sasol is pleased to provide
SASOL INZALO PUBLIC (RF) LIMITED GROUP
 LIMITED GROUP") SASOL INZALO PUBLIC (RF) LIMITED GROUP Annual Financial Statements 30 June 2017 1 FINANCIAL 2 4 Sasol Inzalo Public (RF) Limited Group Contents OVERVIEW CONSOLIDATED AND SEPARATE FINANCIAL STATEMENTS 4
SASOL INZALO PUBLIC (RF) LIMITED GROUP Annual Financial Statements 30 June 2017 1 FINANCIAL 2 4 Sasol Inzalo Public (RF) Limited Group Contents OVERVIEW CONSOLIDATED AND SEPARATE FINANCIAL STATEMENTS 4
282 Harmony Annual Report Company financial statements
 282 Harmony Annual Report Company financial statements Company income statements Harmony Annual Report 283 Figures in million Note 2008 Revenue 3 538 2 423 Cost of sales 1 (2 756) (2 403) Production costs
South African Reserve Bank STATEMENT OF THE MONETARY POLICY COMMITTEE. Issued by Lesetja Kganyago, Governor of the South African Reserve Bank
 South African Reserve Bank PRESS STATEMENT EMBARGO DELIVERY 18 January 2018 STATEMENT OF THE MONETARY POLICY COMMITTEE Issued by Lesetja Kganyago, Governor of the South African Reserve Bank In recent weeks,
80 YEARS IN LABRADOR WEST 14NOV
 18 THIRD QUARTER REPORT 80 YEARS IN LABRADOR WEST 14NOV201811173944 REPORT TO HOLDERS OF COMMON SHARES To the Holders of Common Shares of Labrador Iron Ore Royalty Corporation The Directors of Labrador
STATEMENT OF RESPONSIBILITY BY THE BOARD
 AUDITED CONSOLIDATED FINANCIAL STATEMENTS FOR THE YEAR ENDED 30 JUNE 2 STATEMENT OF RESPONSIBILITY BY THE BOARD for the year ended 30 June The directors are responsible for the preparation, integrity and
UNWIND OF EXXARO S EXISTING BEE TRANSACTION, TERMS OF REPLACEMENT BEE TRANSACTION AND CAUTIONARY ANNOUNCEMENT
 Exxaro Resources Limited (Incorporated in the Republic of South Africa) Registration number: 2000/011076/06 JSE share code: EXX ISIN: ZAE000084992 ADR code: EXXAY ( Exxaro or the Company or the Group )
Financial Statements and Dividend Announcement for the year ended 31 December 2017
 Page 1 of 21 COMFORTDELGRO CORPORATION LIMITED Company Registration Number : 200300002K Financial Statements and Dividend Announcement for the year ended 31 December 2017 The Board of Directors announces
ArcelorMittal South Africa Achieving profit in a challenging market. Nonkululeko Nyembezi-Heita, CEO 31 May 2013
 ArcelorMittal South Africa Achieving profit in a challenging market Nonkululeko Nyembezi-Heita, CEO 31 May 2013 Disclaimer Forward-Looking Statements This presentation may contain forward-looking information
analyst book sasol limited forward-looking statements for the year ended 30 June 2010
 sasol limited forward-looking statements analyst book In this document we make certain statements that are not historical facts and relate to analyses and other information which are based on forecasts
Global Iron Ore and Steel Forecast Unlocking value across our portfolio. Edgar Basto, Asset President Western Australia Iron Ore 21 March 2018
 Global Iron Ore and Steel Forecast Unlocking value across our portfolio Edgar Basto, Asset President Western Australia Iron Ore Disclaimer Forward-looking statements This presentation contains forward-looking
June 2018 Quarterly Report
 12 July 2018 June 2018 ly Report Summary 2.1 million wmt shipped in the June C1 cash costs of A$42/wmt FOB; Full cash cost of A$62/wmt CFR Average realised price of A$59/wmt CFR, inclusive of hedging gains
For personal use only
 COUNTY COAL LIMITED ABN 40 149 136 783 AND CONTROLLED ENTITIES Appendix 4D and Half-Year Financial Report 31 December 2014 This half-year report is for the six months ended 31 December 2014. The previous
AUDITED summarised CONSOLIDATED annual FINANCIAL RESULTS
 AUDITED summarised CONSOLIDATED annual FINANCIAL RESULTS FOR THE YEAR ENDED 31 DECEMBER 2017 CORPORATE INFORMATION Sea Harvest Group Limited (Formerly Sea Harvest Holdings Proprietary Limited) (Incorporated
Financial Statements and Dividend Announcement for the year ended 31 December 2016
 Page 1 of 22 COMFORTDELGRO CORPORATION LIMITED Company Registration Number : 200300002K Financial Statements and Dividend Announcement for the year ended 31 December 2016 The Board of Directors announces
African Iron Ore Metal Bulletin, Johannesburg, 6-8 November Alan Davies, Chief executive Diamonds and Minerals, Rio Tinto
 African Iron Ore Metal Bulletin, Johannesburg, 6-8 November Alan Davies, Chief executive Diamonds and Minerals, Rio Tinto 6-8 November 2012 Metal Bulletin African Iron Ore Conference 2012, Rio Tinto, All
Credit Suisse Annual Asian Investment Conference
 Adelaide Brighton Limited Credit Suisse Annual Asian Investment Conference Hong Kong, 27 30 March 2017 Martin Brydon Chief Executive Officer and Managing Director Adelaide Brighton Limited Overview of
REVIEWED GROUP INTERIM RESULTS AND INTERIM DIVIDEND DECLARATION
 REVIEWED GROUP INTERIM RESULTS AND INTERIM DIVIDEND DECLARATION Six-month period ended 30 June 2009 Presentation Sipho Nkosi : Chief Executive Officer Wim de Klerk : Finance Director 20 August 2009 Disclaimer
Unlocking Our Full Potential
 Unlocking Our Full Potential Merrill Lynch Conference Cynthia Carroll May 2007 This presentation is being made only to and is directed only at (a) persons who have professional experience in matters relating
CHARTING A NEW COURSE. Annual Financial Statements 2016
 CHARTING A NEW COURSE Annual Financial Statements 2016 Contents Annual financial statements Directors responsibility statement 2 Secretarial certification 2 Independent auditors report 3 Directors report
Cliffs Natural Resources Inc. Reports 2013 Second-Quarter Results
 July 25, 2013 Cliffs Natural Resources Inc. Reports 2013 Second-Quarter Results - Company Reports 2013 Second-Quarter Revenues of $1.5 Billion and Net Income Attributable to Cliffs' Common Shareholders
Straits Asia Resources Limited
 Straits Asia Resources Limited Strategic Outlook September 2009 Table of Contents 1 Sebuku 2 Jembayan 3 The Market for Straits Asia Coal 4 Straits Asia s Financials and Funding the High Growth Targets
Financial results For the year ended 31 December 2017
 Financial results For the year ended 31 December 2017 Disclaimer Forward looking statements This presentation includes forward-looking information and statements about ArcelorMittal South Africa ( AMSA
For personal use only
 NRW Holdings Limited (ASX: NWH) ABN 95 118 300 217 Interim Financial Report For the Half-Year Ended 31 December 2015 In t er im Fin an cial Rep o r t 1 APPENDIX 4D RESULTS FOR ANNOUNCEMENT TO THE MARKET
AUDITED ANNUAL FINANCIAL STATEMENTS
 smarter, sustainable solutions AUDITED ANNUAL FINANCIAL STATEMENTS for the year ended 31 December 2013 Audited Annual Financial Statements Directors responsibility statement and basis of preparation, approval
analyst book sasol limited forward-looking statements for the year ended 30 June 2008
 sasol limited forward-looking statements We may in this document make statements that are not historical facts and relate to analyses and other information based on forecasts of future results and estimates
Exxaro year end results dec 2016
 EXXARO RESOURCES LIMITED (Incorporated in the Republic of South Africa) Registration number: 2000/011076/06 JSE share code: EXX ISIN: ZAE000084992 ADR code: EXXAY ( Exxaro or the company or the group )
UNCONTROLLED COPY WHEN PRINTED 24/07/2007
 ANNUAL FINANCIAL STATEMENTS 2004 INDEX Statement of responsibility 49 Certificate by Company Secretary 49 Information presented 50 Report of the independent auditors 51 Directors report 52 Balance sheets