U.S. Supply Forecast and Potential Jobs and Economic Impacts ( )
|
|
|
- Beverley Shepherd
- 6 years ago
- Views:
Transcription
 Released September 7,")
1 U.S. Supply Forecast and Potential Jobs and Economic Impacts (12-3) Released September 7, 11
2 Study Background API has requested Wood Mackenzie undertake a study which examines the energy supply, job and government revenue implications at the state and federal levels of enacting policies in the U.S. that encourage the development of North American hydrocarbon resources. Given the high level of unemployment and budgetary stress facing the nation, the findings of this study should be of interest to policy makers as they move forward to craft solutions to these problems. This study examines the impacts of opening access to key U.S. regions which are currently closed to development, as well as assessing a return to historical levels of development on existing U.S. producing areas (including onshore U.S., the Gulf of Mexico and Alaska). The economic impacts of the Keystone XL pipeline and other potential Canada to U.S. oil pipelines are also considered. Additionally this report looks at the potential threats to production, jobs and government revenues associated with a continuation on the current path of an increased regulatory burden and slower permitting relative to historical levels. Wood Mackenzie 2
3 Key National Results Wood Mackenzie s analysis found that U.S. policies i which h encourage the development of new and existing i resources could, by 3, increase domestic oil and natural gas production by over 1 million boed, support an additional 1.4 million jobs, and raise over $8 billion of cumulative additional government revenue. Whereas increasing regulatory burdens on the oil and gas upstream sector will result in higher development costs, which can potentially hinder the growth of production, tax revenues, and job creation. Continuing the current path of policies which slow down the issuance of leases and drilling permits, increase the cost of hydraulic fracturing through duplicative water or air quality regulations, or delay the construction of oil sands export pipelines such as Keystone XL, will have a detrimental effect on production, jobs, and government revenues. Total U.S. Oil and Natural Gas Production (Projected) Development Policy Case Incremental Impacts: (Change from the Current Path Case) mmboed Development Policy Case Current Path Case bcfed Total Potential Jobs Impact: Approximately 1. million jobs by 18 and over 1.4 million by 3 Total cumulative potential ti government revenue: Additional $36 billion by 15 and nearly $83 billion by 3 Total Potential Production impact: By 15, an additional 1.27 million boed could be produced, rising to 1.4 million boed by 3. Over the period 12 to 3, it is estimated an additional cumulative 35.4 billion boe of reserves could be produced through development policies Wood Mackenzie 3
4 U.S. Employment Impacts of Oil and Natural Gas Development (Projected) Wood Mackenzie estimates 1.4 million new jobs could be added through policies which encourage the development of U.S. and Canadian resources by 3 Jobs added could exceed 1. million by 18 5,, 4,, U.S. Employment Impacts of Oil and Natural Gas Development (Projected) Development Policy Case Current Path Case Policies that increase access to currently 3,, undeveloped regions have the largest potential to create jobs in the U.S.. An estimated 69, new jobs by 3 2,,, Jobs 1,, Total U.S. employment supported by the upstream oil and natural gas sector Wood Mackenzie 4
5 Key State Results (Projected) Wood Mackenzie 5
6 Key State Results (continued) Wood Mackenzie 6
7 Contents 1 2 Scenarios: Scenario descriptions, assumptions and methodology Results: Scenario impacts; production, jobs and revenues 3 Appendix Wood Mackenzie 7
8 Case Development The objective of the study was to evaluate the impact on production, jobs and government revenues of implementing U.S. oil and natural gas regulatory policies which support the development of North America s oil and natural gas resources To achieve this, Wood Mackenzie has developed two scenarios reflecting different regulatory policy with respect to North American hydrocarbon resources The base case will be referred to throughout this report as the Current Path Case The case assumes that current policy and regulatory environment continue into the future In essence, the policies in this case hinder the development of North America s oil and gas resources. Resource development increases in this case but at a relatively modest pace The alternative to the Current Path Case is referred to throughout this report as the Development Policy Case This case evaluates the impact of policies that encourage development of the U.S. upstream oil and natural gas sector Wood Mackenzie 8
9 Current Path Case - Assumptions The Current Path Case assumes the following policy and regulatory initiatives: Continued slow walk of Federal permitting for offshore Gulf of Mexico The case assumes an increase from current offshore exploration and development activity levels, but not back to pre-moratorium rates Tighter Federal hydraulic fracturing and water disposal regulations which are beyond the current state regulations Slow down of onshore drilling due to increased cost of well completions. Results in a negative impact on development economics No opening of new areas for exploration and development No new exploration and development in frontier areas of Alaska, Eastern Gulf of Mexico, Atlantic and Pacific offshore, and Federal Rockies Restrictions on new pipeline development from Canada Curtailment of oil sands pipeline infrastructure into the U.S.. No development of the Keystone XL pipeline or other future Canada to U.S. pipelines Wood Mackenzie 9
10 Current Path Case Assumptions (continued) In developing the Current Path Case Wood Mackenzie has made the following assumptions: Onshore U.S. Slowdown of the development of onshore plays to a rate below current company plans. This is due to increased cost resulting from slower permitting and a heavier regulatory burden. Key assumptions are that leasing and permitting continues at a slower pace relative to historical trends as borne out by a time series of BLM leasing and permitting data, and a heavier regulatory burden adds to drilling and completion costs The impact of increasing costs is to increase the breakeven economics of all U.S. wells by 3 cents per mcfe relative to the Development Policy Case. This has two effects: A number of marginal plays become sub-economic (primarily gas plays), i.e. their economics fall below a 15% hurdle rate. It is therefore assumed that no further drilling will occur in these plays A U.S.-wide slowdown in drilling activity. This results in a 4% decline in drilling across all remaining oil and natural gas plays which have not become sub-economic as a result of increased cost No lifting of moratorium on shale gas development in New York Gulf of Mexico In the future the leasing of deep water acreage will continue, but at 5% of the pre-moratorium rates Exploration activity picks-up from current level, but only recovers to 5% of the pre-moratorium drilling rates, approximately wells per year Alaska No drilling activity offshore Alaska, ANWR or the NPRA No future development activity in the currently closed areas Wood Mackenzie 1
11 Current Path Case Production Projection If the current U.S. policy and regulatory environment continues (the Current Path Case), Wood Mackenzie predicts U.S. production will 35 grow from 18.5 mmboed in 1 to 22.2 mmboed 3 in 3, a % increase 25 We expect to see significant production growth from the Rockies, Northeast and Gulf Coast regions Pi Primarily il driven di by unconventional plays, 5 development activity will more than offset declines from the conventional regions mmboed Total U.S. Production - Current Path Case Oil Gas bcfed Wood Mackenzie 11
12 Development Policy Case Assumptions The Development Policy Case assumes the following policy and regulatory initiatives: Opening of Federal areas that t are currently off limits it to exploration and development Commencement of leasing, drilling and development activity in currently closed regions. Regions to be opened include: Eastern Gulf of Mexico, portions of the Rocky Mountains, Atlantic OCS, Pacific OCS, Alaska National Wildlife Refuge (ANWR) 12 Area, National Petroleum Reserve, Alaska (NPRA) and Alaska offshore Lifting of drilling moratorium in New York State Commencement of drilling and development of Marcellus shale in New York State Increased rate of permitting in the offshore Gulf of Mexico Allows for a return to pre-moratorium exploration and development activity Approval of the Keystone XL and other future Canada to U.S. oil pipelines Facilitates t additional Canadian oil sands development, thereby increasing i the demand d for U.S. supplied equipment and infrastructure Regulation of shale resources remains predominately at the State level Environmental regulation of shale gas and tight oil plays are not duplicative or unduly burdensome. Permitting levels l are at sufficient i rates to develop resources in a timely manner Wood Mackenzie 12
13 Development Policy Case Assumptions (continued) In developing the Development Policy Case Wood Mackenzie has made the following assumptions: Onshore U.S. Development of onshore plays as per company plans. Includes tight oil, shale gas and tight gas plays Leasing and permitting rates do not significantly hinder current company plans No restrictions of shale development in New York state Gulf of Mexico Leasing of deep water acreage returns to pre-moratorium rates Exploration activity recovers to pre-moratorium drilling rates, approximately 4 wildcat wells per year Alaska Resources offshore Alaska and NPRA are developed Access is allowed in current and previously restricted areas Atlantic Coast Production begins 19 Pacific Coast Production begins 19 Eastern Gulf of Mexico Production begins 16 ANWR Production begins 17 Portions of the Rocky Mountains Production begins 12 Wood Mackenzie 13

14 New Resource Areas Development Policy Case 135 W 1 W 1 5 W 9 W 75 W 6 W Enbridge Northern Ga Under the Development Policy Case, it is assumed that a number of new Federal areas become open for exploration drilling and field development. These are: 45 N Pacific O CS Wash ington / Oregon TMX Northern Leg TMX Expansion Gate way Edmonton Hardisty Rockies Region CANADA New York State 45 N Pacific, Atlantic, Eastern GoM, portions of the Rockies, ANWR, NPRA and the Chukchi Sea Also Wood Mackenzie has assumed that New York lifts its drilling moratorium 3 N Northern California Central California Southern California Alaska Planning Areas MEXICO Keystone UNITED STATES OF AMERICA Cushing Western Gulf Central Gulf Eastern Gulf South Atl antic Mid- Atlantic North Atlantic Straits of Florida Atlantic OCS 3 N Under this case, the permit and regulatory policies encourage the development of currently permitted onshore areas Permit and regulatory policies allow for relatively faster development of the Gulf of Mexico Canadian oil sands pipelines into the U.S. are fully developed (e.g., Keystone XL) Chukchi Beaufort NPRA CANADA 15 N Al aska ANWR km , 15 N 1 W 15 W 9 W 75 W Source: Wood Mackenzie Wood Mackenzie 14
15 Development Policy Case Production Projection If the U.S. enacts policies that encourage domestic oil and natural gas development (the Development Policy Case), Wood Mackenzie expects production to grow from 18.5 mmboed in 1 to 32.6 mmboed by 3, a 76% increase from 1 levelsl The opening of restricted Federal areas would add over 6.7 mmboed The remaining production growth comes from New York, and accelerated drilling across the onshore U.S. and the Gulf of Mexico mmboed Development Policy Case Production Projection Oil Gas bcfed Wood Mackenzie 15
16 Scenario Modeling For the two scenarios described, Wood Mackenzie has developed an activity outlook based upon the expected impact of the respective policies on oil and natural gas development activity levels Policy impacts on production and tax revenue are estimated by contrasting the results of Wood Mackenzie s proprietary economic model (GEM) for the two stated scenarios The GEM (Global Economic Model) is an Excel based tool which Wood Mackenzie has developed to forecast capex, opex, production and taxation at the asset level across the whole of North America. Wood Mackenzie defines an asset as a stand-alone field or distinct play which has a distinct development scenario. GEM is capable of generating full economic analysis for each asset modeled in North America. Outputs include Internal Rates of Return, Net Present Values and $/boe estimates Data inputs and tax assumptions are based upon publicly available state and federal information, public and private disclosures by oil and gas operating companies, and information referenced in the appendix of this report and other public sources (industry journals, independent agencies, etc.) Where no such information is available, Wood Mackenzie has made assumptions based on its indepth technical knowledge of the U.S. industry, supplemented by its many years of experience studying the activity in the North American oil and gas sector Wood Mackenzie 16
17 Methodology Production and Revenues The basic methodology that was developed to assess the impacts of two cases and associated production, and revenues was as follows: Build individual asset models as described in the previous slide to represent each scenario Generate cash flow and production information from the asset models Assign assets to regions and states, then consolidate the assets to generate cash flow and production information at the state level Tag each asset to a particular policy to generate the impact of each individual policy either at the national or state level, i.e. consolidation of all new Access areas Consolidation of assets to generate regional impacts Tax assumptions Royalties from new OCS areas were split with the states t (see appendix) Potential state income taxes which could be generated from new OCS areas were not included Wood Mackenzie 17
18 Methodology Employment Estimation Base (1) Level Wood Mackenzie has derived the base count for the Current Path Case jobs numbers from the 8 Implan database Wood Mackenzie took these direct employment numbers for the upstream sector, then added a multiplier of 2.5 for indirect and induced (income related) jobs per direct job. This multiplier is likely conservative given that t total t employment multipliers li for the oil and natural gas sector estimated t by BEA are in the rage of 5 to 7 total jobs per 1 direct jobs The combined direct, indirect and induced job counts gives the total economic impact for the upstream sector across the U.S. Since these numbers were calculated for 8, Wood Mackenzie used a production ratio to derive the 1 base job count per state The production ratio is defined as a ratio of 1 production in boed divided by 8 production Future base job counts for the Current Path Case are derived by using future production ratios generated from dividing future production by 1 production levels Wood Mackenzie 18
19 Methodology Employment Estimation New Activity For each new project being developed in the future Wood Mackenzie has developed associated employment levels The number of jobs generated is dependent on a number of factors, including: Type of project - onshore drilling, offshore field development Location of project onshore, offshore, shallow or deep water, Alaska Potential employment associated with OCS production was allocated to each state based upon the percentage of the state s coastline in the region s total Jobs were also attributed to exploration activity Relevant to new access areas and the Gulf of Mexico For each activity a direct job count was estimated Multiplying the number of each discrete activity per annum by the number of direct jobs per activity gave an overall job count Indirect and induced jobs which were calculated using an indirect jobs multiplier A multiplier of 2.5 indirect and induced jobs per every 1. direct jobs was used (Note: this is conservative relative to other estimates, e.g. BEA estimated multipliers are typically in the 5 to 7 range) Wood Mackenzie 19
20 Methodology Employment Estimation New Activity (continued) For estimating the jobs impact for the opening of the Marcellus play in New York State, Wood Mackenzie utilized supporting material from the Timothy J. Considine study entitled The Economic Impacts of the Marcellus Shale: Implications for New York, Pennsylvania, and West Virginia For estimating the U.S. jobs impact from Canadian Oil Sands pipeline development, Wood Mackenzie has utilized outputs t from the Canadian Energy Research Institute t study entitled Economic Impacts of New Oil Sands Projects in Alberta (1-35) These two studies provided job impact data for development scenarios in the Marcellus Play and Keystone XL and other related Canada to U.S. oil pipelines Wood Mackenzie
21 Access Areas Resource Assumptions Development Policy Case The following table details the assumptions Wood Mackenzie used for developing the resource base for each of the new Access areas in the Development Policy Case These assumptions form the basis of the economic models which generate the production and revenue forecasts Each discovery for each of the new Access areas has its own cash flow and production profile Consolidation of each model generates the forecasts for each region * Source: - Wood Mackenzie report January 11 Energy Policy at a Crossroads: An Assessment of the Impacts of Increased Access versus Higher Taxes on U.S. Oil and Natural Gas Production, Government Revenue, and Employment - ICF International, 8, Strengthening Our Economy: The Untapped U.S. Oil and Gas Resources Wood Mackenzie 21
22 Gulf of Mexico and Onshore Areas Resource Assumptions Development Policy Case In the Development Policy Case, Wood Mackenzie made specific assumptions surrounding development activity in the onshore regions and the Gulf of Mexico These assumptions have a direct impact on production, jobs, and government revenues Onshore regions assumptions Addition of production from any play which becomes economic after removing the well cost of 3 cents/mcf (environmental policy costs) Increase in activity across all onshore plays of 4% as marginal wells in all regions become economic Gulf of Mexico Increasing leasing and permit rates back to pre-macondo levels raises production relative to the Current Path Case Production Development Policy Case less Current Path Case Wood Mackenzie 22

23 Jobs Assumptions Development Policy Case For each discovery and field development in the Development Policy Case, Wood Mackenzie has assigned a direct job count The following table details the assumptions Wood Mackenzie used for developing the job impacts for onshore and offshore new access and existing production areas The indirect multiplier stated in the table is taken from a recent PriceWaterhouse Coopers study and used to assess the impact of the upstream oil and gas sector activity on employment in other sectors Wood Mackenzie 23
24 Contents 1 2 Scenarios: Scenario descriptions, assumptions and methodology Results: Scenario impacts; production, jobs and revenues 3 Appendix Wood Mackenzie 24
25 Current Path Case Employment Forecast Wood Mackenzie estimates that 1 U.S. employment supported by the upstream sector was 2,523, 5,, U.S. Jobs Forecast Current Path Case This consists of 631, direct jobs and 1,892, 4,, indirect and induced jobs Current Path Case By 3 Wood Mackenzie projects the total U.S. employment in the Current Path Case will be 3,27, The assumption used to generate this jobs forecast, is that jobs will grow in direct proportion to the production growth over the period analyzed Jobs 3,, 2,, 1,, Wood Mackenzie 25
26 Added U.S. Production from Development Policy Case Wood Mackenzie projects that by 3, an estimated 1.4 mmboed of incremental domestic production could be added through policies which encourage the development of U.S. resources This is a 47% increase over the estimated 3 production levels in the Current Path Case Total U.S. Production Development Policy Case Potential U.S. Production Impact mmboed Oil Gas bcfed mmboed Oil Gas bcfed Total U.S. Production : Development Policy Case less Current Path Case Wood Mackenzie 26
27 Oil Sands Production Impacts Current Path Case vs. Development Policy Case Potential Canadian Production Impact Total Alberta oil production, both conventional and oil sands, is limited by the 3.5 mmbod of oil pipeline capacity out of the 7. Additional Development Policy Case region. Oil sands production is expected to increase from Keystone mmbod in 1 to 2.4 mmbod in 14. Further production growth will not happen without the Keystone XL 5. Current Path Case or other pipelines that can export oil out of Alberta Most of the incremental oil production is expected to be exported to the U.S. although the oil could also be exported to other countries with additional pipelines being built to the Canadian West coast The Keystone XL pipeline has a potential to import 7, bod into the U.S. and can be expanded to 9, bod Building sufficient oil pipeline capacity into the U.S. should allow Canadian oil sands production to increase from 2.1 mmbod in 1 to 5.8 mmbod by 3, an increase of 3.7 mmbod or 28%. This is 2. mmbod greater than the level in the Current Path Case, which assumes no additional oil pipeline capacity into the U.S. mmbo od Wood Mackenzie 27
28 Added U.S. Jobs from Development Policy Case Wood Mackenzie estimates that by 3, 1.4 million new jobs could be added through policies which encourage the development of U.S. oil and natural gas resources and facilitate Canadian oil sands production through the development of the Keystone XL and other related U.S. pipelines Jobs added have the potential to exceed 1. million by 18 Jobs 1,6, 1,4, 1,, 1,, 8, 6, Potential U.S. Job Impact 4,, Total U.S. Employment: Development Policy Case less Current Path Case Wood Mackenzie 28
29 Added U.S. Jobs Canadian Oil Sands Pipelines Canadian oil sands production stimulates demand for U.S. produced services and equipment (e.g., large trucks and related infrastructure) and hence an increase in U.S. jobs U.S. employment associated with Canadian oil sands production that is expected to fill the initial phase of the Keystone XL pipeline should reach nearly 85, new jobs by Jobs 6, 5, 4, 3, Potential Total Job Impact Additional Development Policy Case Keystone Current Path Case By 3, U.S. employment associated with Canadian oil, sands production that could fill new Canada to U.S. pipeline capacity could reach 27, 1, If 3.5 mmbod of additional oil pipeline export capacity is built out of Alberta (either to the U.S. or Canadian West Coast), the U.S. employment associated with Canadian oil sands production has the potential to reach 5, by 3 (inclusive of jobs in the Current Path Case) Wood Mackenzie 29
30 Added U.S. Government Revenue from Development Policy Case Wood Mackenzie estimates over $99 billion per year of new U.S. government revenue could be added by 3 under the current taxation regime through policies which encourage the 1 9 Potential Annual Government Revenue Impact development of U.S. oil and natural gas 8 resources 7 Furthermore, Wood Mackenzie estimates total 6 additional cumulative government revenues of 5 $83 billion could be generated by 3 under 4 policies assumed in the Development Policy 3 Case. illion per year $B Total Government Revenue: Development Policy Case less Current Path Case Wood Mackenzie 3
31 Oil and Natural Gas Production Impacts by Policy Opening access to areas which are currently closed to development has the largest incremental impact on production between 12 and Potential U.S. Production Impact Onshore Regulatory GoM Permitting Increased Access 6 Wood Mackenzie estimates these new access areas could add up to 6.7 mmboed by 3 Regulations which permit timely development of GoM and the U.S. onshore would add a further 3.7 mmboed by 3 mmboed bcfed Total incremental production could increase by 1.4 mmboed by Total Production: Development Policy Case less Current Path Case Wood Mackenzie 31
32 Employment Impacts by Policy Opening access to new areas for oil and natural gas development could add 69, jobs by 3, approximately half of the total potential jobs added 1,6, 1,4, Wood Mackenzie estimates that a more favourable policy to develop pipelines from the Canadian oil 1,,, sands to the U.S. would add over 27, U.S. jobs by 3 1,, 8, These jobs are primarily a result of U.S. services and the production of capital and intermediate 6, goods exported to Canada for the development of 4, the oil sands Jobs Potential Total Job Impact Oil Sands Pipelines, e.g. Keystone XL Onshore Regulatory GoM Permitting Increased Access The impact on jobs from the GoM and onshore regions is more immediate as companies are already active in these regions with portfolios of opportunities to develop, Total Employment: Development Policy Case less Current Path Case Wood Mackenzie 32
33 Added Revenue by Policy Increasing access to areas currently off-limits to oil and natural gas development has the greatest potential to increase government revenues Cumulative government revenue (inclusive of leases, state and local taxes) due to increased access, has the potential to reach a cumulative $127 billion by and $83 billion by 3 New lease sales drive the majority of revenues derived from the access policies in the short term From onwards, the impact of new production from these access areas drives the majority of revenue growth More timely development of existing oil and natural gas regions, both on and offshore, will also create additional government revenue $Billion Potential U.S. Government Revenue Impact 1 9 Onshore Regulatory 8 GoM Permitting Increased Access Total Revenue: Development Policy Case less Current Path Case 3 Wood Mackenzie 33

34 Added Revenue by Type Of the cumulative $83 billion of government revenues which could be generated through the Development Policy Case by 3, $618 billion will be paid as Federal royalties and taxes. The states will generate a further $63 billion in royalties and taxes, with the remainder being new lease sales Revenue from both lease sales in new areas and 6 from incremental lease sales in existing areas 5 could reach $29 billion by 15 and $122 billion by 3 4 Policies that encourage U.S. oil and gas development have the greatest potential to increase Federal income tax and royalty revenue n $Billio Potential U.S. Government Revenue Impact Lease Sales Federal Royalty State Royalty State Taxes Federal Taxes Total Revenue: Development Policy Case less Current Path Case Wood Mackenzie 34
35 Development Policy Case Projected Regional Impacts* - Alaska Alaska new development production could reach over 1.6 mmboed by 3, with up to $22 billion of government revenue, and over 1, jobs being created Creating access to new federal areas and more efficient i regulatory policies have the biggest impact on the future development of Alaska s oil and gas industry ANWR provides the main growth opportunity in Alaska, supplemented by development of the Chukchi hi and NPRA Wood Mackenzie has assumed that the State of Alaska and the Federal Government will share royalties form these areas mmboed Alaska Production NPRA & Chukchi 1.8 ANWR All production from Federal lands bcfed Alaska Job Creation 25 Annual Government Revenue - Alaska Jobs 14, 1, 1, 8, 6, NPRA & Chukchi ANWR $Billio on / year 15 1 Lease Sales Federal Royalty State Royalty Federal Taxes 4,, * Relative to the Current Path Case OCS and Federal BLM Royalties split with state Wood Mackenzie 35
36 Development Policy Case Projected Regional Impacts* Gulf of Mexico Gulf of Mexico production could reach 3.1 mmboed by 3, with up to $33 billion of government revenue, and 29, jobs being created as a result The opening of currently off-limits areas off the coast of Florida to exploration and development has the largest potential impact on the Gulf of Mexico s oil and gas industry Up to 1, new Florida jobs could be created by 16 More timely and efficient permitting for the offshore can increase production, government revenue, and jobs from Gulf of Mexico oil and natural gas development mmboed Louisiana 3.5 Texas Florida GoM Production All production from Federal lands bcfed Jobs 35, 3, 25,, 15, Lousiana Texas Florida GoM Jobs Creation $Billio on / year Annual Government Revenue - GoM Lease Sales Federal Royalty State Royalty Federal Tax 1, 1 5, * Relative to the Current Path Case GoM royalties 1% Federal allocation Wood Mackenzie 36
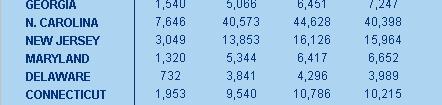
37 Development Policy Case Projected Regional Impacts* Atlantic OCS Atlantic OCS production could reach nearly 1.6 mmboed by 3, with up to $14 billion of government revenue per year, and 14, jobs being created as a result Cumulative government revenue for the region has the potential to reach $95 billion by 3 (inclusive of lease bonuses) Wood Mackenzie assumes that states will be impacted on a proportionate basis of their coastline length mmboed Florida Georgia South Carolina North Carolina Virginia Maryland Delaware New Jersey New York Connecticut Rhode Island Massachusetts New Hampshire Maine Atlantic OCS Production bcfed All production from Federal lands Jobs 18, 16, 14, 1, 1, 8, 6, 4, Florida Georgia South Carolina North Carolina Virginia Maryland Delaw are New Jersey New York Connecticut Rhode Island Massachusetts New Hampshire Maine Atlantic OCS Job Creation $Billion / year Annual Government Revenue - Atlantic OCS Lease Sales Federal Royalty State Royalty Federal Tax, * Relative to the Current Path Case OCS royalties split with states Wood Mackenzie 37
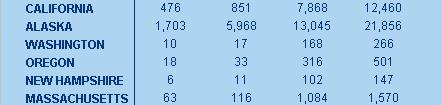
38 Development Policy Case Projected Regional Impacts* Pacific OCS Pacific OCS production could reach 1.1 mmboed by 3, with up to $13 billion of government revenue, and over 1, jobs being created as a result Oregon Washington California Pacific OCS Production 6. Creating access to new federal areas and more efficient regulatory policies have the biggest impact on the future development of the Pacific OCS oil and gas industry mmboed bcfed Wood Mackenzie projects that California would account for over 94% of production and job creation if the Pacific OCS were open for oil and gas development All production from Federal lands Pacific OCS Job Creation 14 Annual Government Revenue - Pacific OCS Jobs 14, 1, 1, 8, 6, Oregon Washington California $Billio on / year Lease Sales Federal Royalty State Royalty Federal Taxes 4, 4, * Relative to the Current Path Case OCS royalties split with states Wood Mackenzie 38
39 Development Policy Case Projected Regional Impacts* Onshore U.S. Onshore new development production could reach 3. mmboed by 3, with over $12 billion of government revenue, and over 7, jobs being created 2. Creating greater access to portions of the Rocky Mountains, 1.5 removing the moratorium on shale development in New York State, and supporting efficient onshore regulatory policies will 1. all have a positive impact on the future development of U.S. 5.5 domestic onshore oil and natural gas resources. The. development of Canadian oil sands associated with Canada to U.S. pipelines will also create jobs in the U.S. mmboed Other States California North Dakota Wyoming Oklahoma Pennsylvania Colorado Utah Louisiana New York Texas Onshore Lower 48 Production Production from Federal, State and Private lands bcfed Jo obs 8, 7, 6, 5, 4, 3, Onshore Lower 48 Job Creation Other States California North Dakota Wyoming Oklahoma Pennsylvania Colorado Utah Louisiana New York Texas $Billio on / year Annual Government Revenue - Onshore Lower 48 Lease Sales Federal Royalty State Royalty Federal Tax State Tax, 4 1, * Relative to the Current Path Case Royalties allocated 1% to Federal, Sate or Private depending on ownership rights Wood Mackenzie 39
40 Contents 1 2 Scenarios: Scenario descriptions, assumptions and methodology Results: Scenario impacts; production, jobs and revenues 3 Appendix Wood Mackenzie 4


")
41 Development Policy Case - Production Impact Forecasts by State ( boed) Wood Mackenzie 41


42 Development Policy Case - Annual Job Creation Forecasts by State Wood Mackenzie 42


43 Development Policy Case Annual Gov t Revenue Impact by State (US$M) Wood Mackenzie 43
44 Projected Results by State and Policy
45 Projected Results by State and Policy (continued)
46 Projected Results by State and Policy (continued)
47 Projected Results by State and Policy (continued)
48 Projected Results by State and Policy (continued)
49 Projected Results by State and Policy (continued)
50 Projected Results by State and Policy (continued)
51 Projected Results by State and Policy (continued)
52 Projected Results by State and Policy (continued)
53 GEM Tool Description The Global Economic Model (GEM) is Wood Mackenzie s proprietary economic modeling software GEM combines Wood Mackenzie s unique and proprietary p data, both historic and forecast, with company interests, price decks and fiscal models to produce cash flow and valuation reports. It contains more than 19 fiscal regimes covering the globe GEM generates cash flow and production forecasts based on user input development plans. These include drilling forecasts and assumed type well profiles and well costs for onshore U.S. plays. For offshore developments, Alaska and the Canadian oil sands, production facilities and export pipelines are also included GEM includes a sensitivity tool to show the economics impact of changes in costs, taxes, production and prices. Outputs include cash flow summaries, IRR, NPV and $/boe calculations Wood Mackenzie has developed cost, tax and production data in the following productive regions: Alaska 57 fields Gulf of Mexico 212 fields Canadian oil sands 25 projects Onshore U.S. 245 plays Wood Mackenzie 53
54 Tax Assumptions Models included the following assumptions: Federal royalty rates modelled at 12.5% Federal income tax modelled at 35% Wood Mackenzie s commodity price forecast was used. For all new Access region models, oil was priced at WTI, gas was priced at Henry Hub (HH). Oil price forecast was $8/bbl in 12 inflating at 2.5%. Gas price forecast was $6./mcf in 12 inflating at 2.5% In the Atlantic and Pacific OCS regions royalties were split with 37.5/62.5 between the states and the federal government respectively. In Alaska federal areas the royalty split with the state was 5/5. Production and revenue from new access regions were split by state according to the following: Atlantic OCS Maine 13%, New Hampshire 1%, Massachusetts 11%, Rhode Island 2%, Connecticut 6%, New York 7%, New Jersey 8%, Delaware 2%, Maryland 3%, Virginia 1%, North Carolina 26%, South Carolina 3%, Georgia 2%, Florida 5% Pacific OCS California 94%, Oregon 4%, Washington 2% East Gulf of Mexico Florida 1% Rockies Colorado 27.%, North Dakota 19.4%, South Dakota.1%, Wyoming 31.7%, Utah 12.4%, New Mexico 6.8%, Montana 2.6% For the existing producing areas; Gulf of Mexico, Alaska and onshore U.S., Wood Mackenzie has modeled each producing field or play by its applicable state and federal royalty Other state taxes, such as Ad Valorem, Severance Taxes, and fee royalties have been applied which applicable Wood Mackenzie 54
55 References ICF International, 8, Strengthening Our Economy: The Untapped U.S. Oil and Gas Resources, MIG, Inc. 8 Implan database, U.S. Department of Interior, 8, Inventory of Onshore Federal Oil and Natural Gas Resources and Restrictions to Their Development, Considine, Timothy J., July 1, The Economic Impacts of the Marcellus Shale: Implications for New York, Pennsylvania, and West Virginia, Economic Impacts Marcellus Shale.pdf Considine, Timothy J., July 11, The Pennsylvania Marcellus Natural Gas Industry: Status, Economic Impacts and Future Potential BLM Oil and Gas Statistics (1984-1) January 11 Version Price Waterhouse Coopers September 9 Study The Economic Impacts of the Oil and Natural Gas Industry on the U.S. Economy: Employment, Labor, Income and Value Added Canadian Energy Research Institute, Economic Impacts of New Oil Sands Projects in Alberta (1-35), Study 124.pdf Wood Mackenzie 55
56 Wood Mackenzie Disclaimer Except for existing proprietary computer programs and materials, all reports, drawings, drafts, data, models and other documents developed hereunder, and the right to copyright such reports, drawings, drafts, data and other documents, shall be the sole property of API. API may use such materials in any manner in which API, in its sole discretion, deems fit and proper, including submission to governmental agencies, use in litigation, or use in other proceedings before governmental bodies. Wood Mackenzie will not use the aforementioned items or other material developed there from, or release the content or findings of the work performed hereunder to parties outside API without prior review and written approval from API, unless they are in the public domain or are otherwise publicly released by API. Wood Mackenzie agrees to preserve the confidentiality of information received on behalf of API, furnished by API or prepared for API hereunder. This report has been prepared by Wood Mackenzie for API. The report is intended for use by API and API may use such material in any manner in which API, in its sole discretion, deems fit and proper, including submission to governmental agencies, use in litigation, or use in other proceedings before governmental bodies. The information upon which this report is based comes from our own experience, knowledge and databases. The opinions expressed in this report are those of Wood Mackenzie. They have been arrived at following careful consideration and enquiry consistent t with standard d industry practices but we do not guarantee their fairness, completeness or accuracy. All results and observations are based on information available at the time of this report. To the extent that additional information becomes available or the factors upon which our analysis is based change, our conclusions could be subsequently affected. Wood Mackenzie does not accept any liability for your reliance upon them. Wood Mackenzie 56

57 Global Contact Details Europe +44 () Americas Asia Pacific energy@woodmac.com Website www woodmac com Global Offices Australia Brazil Canada China India Japan Malaysia Russia Singapore South Korea Website South Korea United Arab Emirates United Kingdom United States Wood Mackenzie is the most comprehensive source of knowledge about the world s energy and metals industries. We analyse and advise on every stage along the value chain - from discovery to delivery, and beyond - to provide clients with the commercial insight that makes them stronger. For more information visit: Wood Mackenzie 57
The Impact of Gulf of Mexico-Deepwater Permit Delays on US Oil and Natural Gas Production, Investment, and Government Revenue
 The Impact of Gulf of Mexico-Deepwater Permit Delays on US Oil and Natural Gas December 2010 Disclaimer This report has been prepared by Wood Mackenzie for API. The report is intended for use by API and
The Economic Impacts of Allowing Access to the Atlantic OCS for Oil and Natural Gas Exploration and Development
 The Economic Impacts of Allowing Access to the Atlantic OCS for Oil and Natural Gas Exploration and Development Prepared For: The American Petroleum Institute (API) Prepared By: Executive Summary Executive
DFA INVESTMENT DIMENSIONS GROUP INC. DIMENSIONAL INVESTMENT GROUP INC. Institutional Class Shares January 2018
 DFA INVESTMENT DIMENSIONS GROUP INC. DIMENSIONAL INVESTMENT GROUP INC. Institutional Class Shares January 2018 Supplementary Tax Information 2017 The following supplementary information may be useful in
BRINKER CAPITAL DESTINATIONS TRUST
 Important 2018 Tax Information Regarding Your Mutual s BRINKER CAPITAL DESTINATIONS TRUST The following tax information is furnished for informational purposes only. Please consult your tax advisor for
State Income Tax Tables
 ALABAMA 1 st $1,000... 2% Next 5,000... 4% Over 6,000... 5% ALASKA... 0% ARIZONA 1 1 st $10,000... 2.87% Next 15,000... 3.2% Next 25,000... 3.74% Next 100,000... 4.72% Over 150,000... 5.04% ARKANSAS 1
Taxes and Economic Competitiveness. Dale Craymer President, Texas Taxpayers and Research Association (512)
") Taxes and Economic Competitiveness Dale Craymer President, Texas Taxpayers and Research Association (512) 472-8838 dcraymer@ttara.org www.ttara.org Presented to the Committee on Economic Competitiveness
Taxes and Economic Competitiveness Dale Craymer President, Texas Taxpayers and Research Association (512) 472-8838 dcraymer@ttara.org www.ttara.org Presented to the Committee on Economic Competitiveness
Checkpoint Payroll Sources All Payroll Sources
 Checkpoint Payroll Sources All Payroll Sources Alabama Alaska Announcements Arizona Arkansas California Colorado Connecticut Source Foreign Account Tax Compliance Act ( FATCA ) Under Chapter 4 of the Code
Mackenzie Gas Project US State Canadian Provincial PADD-level Economic Impacts Assessment
 Mackenzie Gas Project US State Canadian Provincial PADD-level Economic Impacts Assessment October 2012 Submitted to: Government of the Northwest Territories Industry Tourism and Investment Submitted by:
The Costs and Benefits of Half a Loaf: The Economic Effects of Recent Regulation of Debit Card Interchange Fees. Robert J. Shapiro
 The Costs and Benefits of Half a Loaf: The Economic Effects of Recent Regulation of Debit Card Interchange Fees Robert J. Shapiro October 1, 2013 The Costs and Benefits of Half a Loaf: The Economic Effects
Kentucky , ,349 55,446 95,337 91,006 2,427 1, ,349, ,306,236 5,176,360 2,867,000 1,462
 TABLE B MEMBERSHIP AND BENEFIT OPERATIONS OF STATE-ADMINISTERED EMPLOYEE RETIREMENT SYSTEMS, LAST MONTH OF FISCAL YEAR: MARCH 2003 Beneficiaries receiving periodic benefit payments Periodic benefit payments
State Individual Income Taxes: Personal Exemptions/Credits, 2011
 Individual Income Taxes: Personal Exemptions/s, 2011 Elderly Handicapped Blind Deaf Disabled FEDERAL Exemption $3,700 $7,400 $3,700 $7,400 $0 $3,700 $0 $0 $0 $0 Alabama Exemption $1,500 $3,000 $1,500 $3,000
Macroeconomic Impact Analysis of Proposed Greenhouse Gas and Fuel Economy Standards for Medium- and Heavy-Duty Vehicles
 Macroeconomic Impact Analysis of Proposed Greenhouse Gas and Fuel Economy Standards for Medium- and Heavy-Duty Vehicles Prepared for the: Union of Concerned Scientists 2397 Shattuck Ave., Suite 203 Berkeley,
Income from U.S. Government Obligations
 Baird s ----------------------------------------------------------------------------------------------------------------------------- --------------- Enclosed is the 2017 Tax Form for your account with
THE HOME ENERGY AFFORDABILITY GAP 2017
 TOTAL US $38,597,642,593 $47,648,609,571 123.4 The Index (2 nd Series) indicates the extent to which the has increased between the base year and the current year. In the total United States this Index
Total state and local business taxes
 Total state and local business taxes State-by-state estimates for fiscal year 2014 October 2015 Executive summary This report presents detailed state-by-state estimates of the state and local taxes paid
THE ECONOMIC IMPACTS OF THE OIL AND NATURAL GAS INDUSTRY ON THE U.S. ECONOMY: EMPLOYMENT, LABOR INCOME AND VALUE ADDED
 THE ECONOMIC IMPACTS OF THE OIL AND NATURAL GAS INDUSTRY ON THE U.S. ECONOMY: EMPLOYMENT, LABOR INCOME AND VALUE ADDED Prepared for American Petroleum Institute September 8, 2009 National Economics & Statistics
Important 2007 Tax Information
 Important 2007 Information For First American s Shareholders In order to assist you with your 2007 income tax preparation, we have compiled this important tax information pertaining to First American s.
NOTICE TO MEMBERS CANADIAN DERIVATIVES CORPORATION CANADIENNE DE. Trading by U.S. Residents
 NOTICE TO MEMBERS CANADIAN DERIVATIVES CORPORATION CANADIENNE DE CLEARING CORPORATION COMPENSATION DE PRODUITS DÉRIVÉS NOTICE TO MEMBERS No. 2002-013 January 28, 2002 Trading by U.S. Residents This is
Economic Impacts of Wait Times for Commercial Driver s Licenses Skills Tests
 Economic Impacts of Wait Times for Commercial Driver s Licenses Skills Tests Nam D. Pham, Ph.D. Mary Donovan January 2019 Economic Impact of Wait Times for Commercial Driver s Licenses Skills Tests Nam
Undocumented Immigrants are:
 Immigrants are: Current vs. Full Legal Status for All Immigrants Appendix 1: Detailed State and Local Tax Contributions of Total Immigrant Population Current vs. Full Legal Status for All Immigrants
State Corporate Income Tax Collections Decline Sharply
 Corporate Income Tax Collections Decline Sharply Nicholas W. Jenny and Donald J. Boyd The Rockefeller Institute Fiscal News: Vol. 1, No. 3 July 26, 2001 According to a report from the Congressional Budget
ECONOMIC IMPACT OF LOCAL PARKS FULL REPORT
 ECONOMIC IMPACT OF LOCAL PARKS AN EXAMINATION OF THE ECONOMIC IMPACTS OF OPERATIONS AND CAPITAL SPENDING BY LOCAL PARK AND RECREATION AGENCIES ON THE UNITED STATES ECONOMY FULL REPORT Center for Regional
THE HOME ENERGY AFFORDABILITY GAP 2012
 TOTAL US $38,597,642,593 $38,573,122,158 99.9 The Index (2 nd Series) indicates the extent to which the has increased between the base year and the current year. In the total United States this Index was
The Effect of the Federal Cigarette Tax Increase on State Revenue
 FISCAL April 2009 No. 166 FACT The Effect of the Federal Cigarette Tax Increase on State Revenue By Patrick Fleenor Today the federal cigarette tax will rise from 39 cents to $1.01 per pack. The proceeds
BIG LAKE ENERGY INC. COMPEER VIKING ASSET
 BIG LAKE ENERGY INC. COMPEER VIKING ASSET READER ADVISORY Certain statements in this presentation constitute forward looking statements or forward looking information within the meaning of applicable securities
Termination Final Pay Requirements
 State Involuntary Termination Voluntary Resignation Vacation Payout Requirement Alabama No specific regulations currently exist. No specific regulations currently exist. if the employer s policy provides
Providing Subprime Consumers with Access to Credit: Helpful or Harmful? James R. Barth Auburn University
 Providing Subprime Consumers with Access to Credit: Helpful or Harmful? James R. Barth Auburn University FICO Scores: Identifying Subprime Consumers Category FICO Score Range Super-prime 740 and Higher
THE ECONOMIC IMPACTS OF THE OIL AND NATURAL GAS INDUSTRY ON THE U.S. ECONOMY IN 2009: EMPLOYMENT, LABOR INCOME, AND VALUE ADDED
 www.pwc.com/us/nes THE ECONOMIC IMPACTS OF THE OIL AND NATURAL GAS INDUSTRY ON THE U.S. ECONOMY IN 2009: EMPLOYMENT, LABOR INCOME, AND VALUE ADDED May 2011 Prepared for American Petroleum Institute The
Annual Costs Cost of Care. Home Health Care
 2017 Cost of Care Home Health Care USA National $18,304 $47,934 $114,400 3% $18,304 $49,192 $125,748 3% Alaska $33,176 $59,488 $73,216 1% $36,608 $63,492 $73,216 2% Alabama $29,744 $38,553 $52,624 1% $29,744
Q Homeowner Confidence Survey Results. May 20, 2010
 Q1 2010 Homeowner Confidence Survey Results May 20, 2010 The Zillow Homeowner Confidence Survey is fielded quarterly to determine the confidence level of American homeowners when it comes to the value
Q309 NATIONAL DELINQUENCY SURVEY FROM THE MORTGAGE BANKERS ASSOCIATION. Data as of September 30, 2009
 NATIONAL DELINQUENCY SURVEY FROM THE MORTGAGE BANKERS ASSOCIATION Q309 Data as of September 30, 2009 2009 Mortgage Bankers Association (MBA). All rights reserved, except as explicitly granted. Data are
Total state and local business taxes
 Total state and local business taxes State-by-state estimates for fiscal year 2016 August 2017 Executive summary This study presents detailed state-by-state estimates of the state and local taxes paid
U.S. Marina Industry Economic Impact Study
 U.S. Marina Industry Economic Impact Study Completed by The Association of Marina Industries Released: May 2018 Introduction The Association of Marina Industries (AMI) is proud to release the first ever
Property Taxation of Business Personal Property
 Taxation of Business Personal Evaluate the property tax as it applies to business personal property and the current $500 exemption. Quantify the economic effect of taxing business personal property and
Q209 NATIONAL DELINQUENCY SURVEY FROM THE MORTGAGE BANKERS ASSOCIATION. Data as of June 30, 2009
 NATIONAL DELINQUENCY SURVEY FROM THE MORTGAGE BANKERS ASSOCIATION Q209 Data as of June 30, 2009 2009 Mortgage Bankers Association (MBA). All rights reserved, except as explicitly granted. Data are from
The table below reflects state minimum wages in effect for 2014, as well as future increases. State Wage Tied to Federal Minimum Wage *
 State Minimum Wages The table below reflects state minimum wages in effect for 2014, as well as future increases. Summary: As of Jan. 1, 2014, 21 states and D.C. have minimum wages above the federal minimum
S T A T E TURNING THE TABLES ON PLAINTIFFS IN TRUCKING LITIGATION APRIL 26 27, 2018 CHICAGO, IL. DRI Will Submit Credit For You To Your State Agency
 A d j u s t e r C r e d i t C E I n f o r m a t i o n TURNING THE TABLES ON PLAINTIFFS IN TRUCKING LITIGATION APRIL 26 27, 2018 CHICAGO, IL Delaware Georgia Louisiana Mississippi New Hampshire North Carolina
A summary of regional and national economic indicators for the Tenth District states SUMMARY OF CURRENT TENTH DISTRICT ECONOMIC CONDITIONS
 Tenth THE District ECONOMIC DATABOOK A summary of regional and national economic indicators for the states FEBRUARY 26, 218 FEDERAL RESERVE BANK of KANSAS CITY SUMMARY OF CURRENT TENTH DISTRICT ECONOMIC
German Business Matters
 German Business Matters A U.S. and State-by-State Analysis Second Edition Representative of GERMAN Industry + Trade CONGRESSIONAL RECOGNITION OF THE ECONOMIC IMPORTANCE OF GERMAN COMPANIES IN THE UNITED
Commonfund Higher Education Price Index Update
 Commonfund Higher Education Price Index 2017 Update Table of Contents EXECUTIVE SUMMARY 1 INTRODUCTION: THE HIGHER EDUCATION PRICE INDEX 1 About HEPI 1 The HEPI Tables 2 HIGHER EDUCATION PRICE INDEX ANALYSIS
Sales Tax Return Filing Thresholds by State
 Thanks to R&M Consulting for assistance in putting this together Sales Tax Return Filing Thresholds by State State Alabama Alaska Arizona Arkansas California Colorado Connecticut Delaware Filing Thresholds
Do you charge an expedite fee for online filings?
 Topic: Expedite Fees and Online Filings Question by: Allison A. DeSantis : Ohio Date: March 14, 2012 Manitoba Corporations Canada Alabama Alaska Arizona Yes. The expedite fee is $35. We currently offer
DATA AS OF SEPTEMBER 30, 2010
 NATIONAL DELINQUENCY SURVEY Q3 2010 DATA AS OF SEPTEMBER 30, 2010 2010 Mortgage Bankers Association (MBA). All rights reserved, except as explicitly granted. Data are from a proprietary paid subscription
CHAPTER 6. The Economic Contribution of Hospitals
 CHAPTER 6 The Economic Contribution of Hospitals Chart 6.1: National Health Expenditures as a Percentage of Gross Domestic Product and Breakdown of National Health Expenditures, 2014 U.S. GDP 2014 $3.03
JANUARY 30 DATA RELEASE WILL CAPTURE ONLY A PORTION OF THE JOBS CREATED OR SAVED BY THE RECOVERY ACT By Michael Leachman
 820 First Street NE, Suite 510 Washington, DC 20002 Tel: 202-408-1080 Fax: 202-408-1056 center@cbpp.org www.cbpp.org January 29, 2010 JANUARY 30 DATA RELEASE WILL CAPTURE ONLY A PORTION OF THE JOBS CREATED
CAPITOL research. States Face Medicaid Match Loss After Recovery Act Expires. health
 CAPITOL research MAR health States Face Medicaid Match Loss After Expires Summary Medicaid, the largest health insurance program in the nation, is jointly financed by state and federal governments. The
Media Alert. First American CoreLogic Releases Q3 Negative Equity Data
 Contact Information Below Media Alert First American CoreLogic Releases Q3 Negative Equity Data First American CoreLogic, the first company to develop a national, state and city-level negative equity report,
Total state and local business taxes
 Total state and local business taxes State-by-state estimates for fiscal year 2017 November 2018 Executive summary This study presents detailed state-by-state estimates of the state and local taxes paid
TA X FACTS NORTHERN FUNDS 2O17
 TA X FACTS 2O17 Northern Funds Tax Facts provides specific information about your Northern Funds investment income and capital gain distributions for 2017. If you have any questions about how to apply
State Budget Update. Fall 2017 FEB 2018
 State Budget Update Fall 2017 FEB 2018 State Budget Update Fall: 2017 The National Conference of State Legislatures is the bipartisan organization dedicated to serving the lawmakers and staffs of the nation
Union Members in New York and New Jersey 2018
 For Release: Friday, March 29, 2019 19-528-NEW NEW YORK NEW JERSEY INFORMATION OFFICE: New York City, N.Y. Technical information: (646) 264-3600 BLSinfoNY@bls.gov www.bls.gov/regions/new-york-new-jersey
Metrics and Measurements for State Pension Plans. November 17, 2016 Greg Mennis
 Metrics and Measurements for State Pension Plans November 17, 2016 Greg Mennis Fiscal Sustainability Metrics Net Amortization Measures whether contributions are sufficient to reduce pension debt if plan
Understanding Oregon s Throwback Rule for Apportioning Corporate Income
 Understanding Oregon s Throwback Rule for Apportioning Corporate Income Senate Interim Committee on Finance and Revenue January 12, 2018 2 Apportioning Corporate Income Apportionment is a method of dividing
MEDICAID BUY-IN PROGRAMS
 MEDICAID BUY-IN PROGRAMS Under federal law, states have the option of creating Medicaid buy-in programs that enable employed individuals with disabilities who make more than what is allowed under Section
Growing Slowly, Getting Older:*
 Growing Slowly, Getting Older:* Demographic Trends in the Third District States BY TIMOTHY SCHILLER N ational trends such as slower population growth, an aging population, and immigrants as a larger component
Residual Income Requirements
 Residual Income Requirements ytzhxrnmwlzh Ch. 4, 9-e: Item 44, Balance Available for Family Support (04/10/09) Enter the appropriate residual income amount from the following tables in the guideline box.
Pay Frequency and Final Pay Provisions
 Pay Frequency and Final Pay Provisions State Pay Frequency Minimum Final Pay Resign Final Pay Terminated Alabama Bi-weekly or semi-monthly No Provision No Provision Alaska Semi-monthly or monthly Next
Chapter D State and Local Governments
 Chapter D State and Local Governments State and Local Governments contains detailed information on the taxes, revenues, and expenditures of states and localities. The public finances of these two levels
Fingerprint, Biographical Affidavit and Third-Party Verification Reports Requirements
 Updates to the State Specific Information Fingerprint, Biographical Affidavit and Third-Party Verification Reports Requirements State Requirements For Licensure Requirements After Licensure (Non-Domestic)
Total State and Local Business Taxes
 Q UANTITATIVE E CONOMICS & STATISTICS J ANUARY 2004 Total State and Local Business Taxes A 50-State Study of the Taxes Paid by Business in FY2003 By Robert Cline, William Fox, Tom Neubig and Andrew Phillips
AIG Benefit Solutions Producer Licensing and Appointment Requirements by State
 3600 Route 66, Mail Stop 4J, Neptune, NJ 07754 AIG Benefit Solutions Producer Licensing and Appointment Requirements by State As an industry leader in the group insurance benefits market, AIG is firmly
IMPORTANT TAX INFORMATION
 IMPORTANT TAX INFORMATION The following information about your enclosed 1099-DIV from s should be used when preparing your 2017 tax return. Form 1099-DIV reports dividends, exempt-interest dividends, capital
Federal Registry. NMLS Federal Registry Quarterly Report Quarter I
 Federal Registry NMLS Federal Registry Quarterly Report 2012 Quarter I Updated June 6, 2012 Conference of State Bank Supervisors 1129 20 th Street, NW, 9 th Floor Washington, D.C. 20036-4307 NMLS Federal
America s New Energy Future: The Unconventional Oil and Gas Revolution and the US Economy
 America s New Energy Future: The Unconventional Oil and Gas Revolution and the US Economy Volume 3: A Manufacturing Renaissance Appendix D. Economic Contribution Assessment Detailed Tables Prepared by:
Mapping the geography of retirement savings
 of savings A comparative analysis of retirement savings data by state based on information gathered from over 60,000 individuals who have used the VoyaCompareMe online tool. Mapping the geography of retirement
STATE MINIMUM WAGES 2017 MINIMUM WAGE BY STATE
 STATE MINIMUM WAGES 2017 MINIMUM WAGE BY STATE The table below, created by the National Conference of State Legislatures (NCSL), reflects current state minimum wages in effect as of January 1, 2017, as
MainStay Funds Income Tax Information Notice
 MainStay Funds Income Tax Information Notice The information contained in this brochure is being furnished to shareholders of the MainStay Funds for informational purposes only. Please consult your own
Introduction to the U.S. K-12 Instructional Materials Industry
 Introduction to the U.S. K-12 Instructional Materials Industry Objective For the benefit of creditors of McGraw-Hill School Education, we have prepared a primer on the U.S. K-12 Instructional Materials
Year-End Tax Tables Applicable to Form 1099-DIV Page 2 Qualified Dividend Income
 Year-End Tax Tables This document contains general information to assist you in completing your 2016 tax returns. You should consult your tax advisor to determine the appropriate use of these tables. This
Recourse for Employees Misclassified as Independent Contractors Department for Professional Employees, AFL-CIO
 Recourse for Employees Misclassified as Independent Contractors Department for Professional Employees, AFL-CIO State Relevant Agency Contact Information Online Resources Online Filing Alabama Department
Evaluation of Data Submitted to American Public Power Association s 2016 Safety Awards of Excellence
 Evaluation of Data Submitted to American Public Power Association s 6 Safety Awards of Excellence 6 American Public Power Association s Safety Awards of Excellence Report Page Copyright 6 by the American
STATE AND LOCAL TAXES A Comparison Across States
 STATE AND LOCAL TAXES A Comparison Across States INDEPENDENT FISCAL OFFICE FEBRUARY 2018 Methodology This report uses data from the U.S. Census Bureau, the Internal Revenue Service (IRS), the U.S. Bureau
Mutual Fund Tax Information
 Mutual Fund Tax Information We have provided this information as a service to our shareholders. Thornburg Investment Management cannot and does not give tax or accounting advice. If you have further questions
February 2018 QUARTERLY CONSUMER CREDIT TRENDS. Public Records
 February 2018 QUARTERLY CONSUMER CREDIT TRENDS Public Records p Jasper Clarkberg p Michelle Kambara This is part of a series of quarterly reports on consumer credit trends produced by the Consumer Financial
A d j u s t e r C r e d i t C E I n f o r m a t i o n S T A T E. DRI Will Submit Credit For You To Your State Agency. (hours ethics included)
") A d j u s t e r C r e d i t C E I n f o r m a t i o n INSURANCE COVERAGE AND CLAIMS INSTITUTE APRIL 3 5, 2019 CHICAGO, IL Delaware Georgia Louisiana Mississippi New Hampshire North Carolina (hours ethics
A d j u s t e r C r e d i t C E I n f o r m a t i o n INSURANCE COVERAGE AND CLAIMS INSTITUTE APRIL 3 5, 2019 CHICAGO, IL Delaware Georgia Louisiana Mississippi New Hampshire North Carolina (hours ethics
Forecasting State and Local Government Spending: Model Re-estimation. January Equation
 Forecasting State and Local Government Spending: Model Re-estimation January 2015 Equation The REMI government spending estimation assumes that the state and local government demand is driven by the regional
ST98: 2017 ALBERTA S ENERGY RESERVES & SUPPLY/DEMAND OUTLOOK. Executive Summary.
 ST98: 2017 ALBERTA S ENERGY RESERVES & SUPPLY/DEMAND OUTLOOK Executive Summary ST98 www.aer.ca Executive SummARY The Alberta Energy Regulator (AER) ensures the safe, however, will depend on the level
STATE BUDGET DEFICITS PROJECTED FOR FISCAL YEAR By Nicholas Johnson and Bob Zahradnik
 820 First Street, NE, Suite 510, Washington, DC 20002 Tel: 202-408-1080 Fax: 202-408-1056 center@cbpp.org www.cbpp.org Revised February 6, 2004 STATE BUDGET DEFICITS PROJECTED FOR FISCAL YEAR 2005 By Nicholas
Fingerprint and Biographical Affidavit Requirements
 Updates to the State-Specific Information Fingerprint and Biographical Affidavit Requirements State Requirements For Licensure Requirements After Licensure (Non-Domestic) Alabama NAIC biographical affidavit
NEW FEDERAL LAW COULD WORSEN STATE BUDGET PROBLEMS States Can Protect Revenues by Decoupling By Nicholas Johnson
 820 First Street NE, Suite 510 Washington, DC 20002 Tel: 202-408-1080 Fax: 202-408-1056 center@cbpp.org www.cbpp.org Revised February 28, 2008 NEW FEDERAL LAW COULD WORSEN STATE BUDGET PROBLEMS States
The 2017 CHP Salary Survey
 The 2017 CHP Salary Survey Gary Lauten, CHP, AAHP Niche Analyst Introduction The 2017 certified health physicist (CHP) survey data was collected by having CHPs submit their responses to survey questions
American Economics Group Clear and Effective Economic Analysis. American Economics Group
 Presentation for: Federation Clear of and Tax Effective Administrators Economic Analysis 9/22/03 Charles W. de Seve, Ph.D. www.americaneconomics.com The Economy is Recovering : The National Economic Setting
PAY STATEMENT REQUIREMENTS
 PAY MENT 2017 PAY MENT Alabama Alaska Arizona Arkansas California Colorado Connecticut Delaware District of Columbia Florida Georgia No generally applicable wage payment law for private employers. Rate
FISCAL FACT Top Marginal Effective Tax Rates By State under Rival Tax Plans from Congressional Democrats and Republicans
 September 22, 2010 No. 246 FISCAL FACT Top Marginal Effective Tax Rates By State under Rival Tax Plans from Congressional Democrats and Republicans By Gerald Prante Introduction One of biggest news stories
Federal Rates and Limits
 Federal s and Limits FICA Social Security (OASDI) Base $118,500 Medicare (HI) Base No Limit Social Security (OASDI) Percentage 6.20% Medicare (HI) Percentage Maximum Employee Social Security (OASDI) Withholding
LATEST DEVELOPMENTS: THE ROLE OF NATURAL GAS AND OIL IN AMERICA S ENERGY FUTURE. Rayola Dougher API Senior Economic Advisor
 LATEST DEVELOPMENTS: THE ROLE OF NATURAL GAS AND OIL IN AMERICA S ENERGY FUTURE Rayola Dougher API Senior Economic Advisor Oil & Natural Gas Industry: The Backbone of the American Economy Supports more
kaiser medicaid and the uninsured commission on The Cost and Coverage Implications of the ACA Medicaid Expansion: National and State-by-State Analysis
 kaiser commission on medicaid and the uninsured The Cost and Coverage Implications of the ACA Expansion: National and State-by-State Analysis Executive Summary John Holahan, Matthew Buettgens, Caitlin
ATHENE Performance Elite Series of Fixed Index Annuities
 Rates Effective August 8, 05 ATHE Performance Elite Series of Fixed Index Annuities State Availability Alabama Alaska Arizona Arkansas Product Montana Nebraska Nevada New Hampshire California PE New Jersey
How Would States Be Affected By Health Reform?
 How Would States Be Affected By Health Reform? Timely Analysis of Immediate Health Policy Issues January 2010 John Holahan and Linda Blumberg Summary The prospects of health reform were dealt a serious
SBA should aid and assist small businesses to increase their ability to compete in international markets.
 Authority of Office of International Trade 1 SBA should aid and assist small businesses to increase their ability to compete in international markets. SMALL BUSINESS ACT [The Act of July 18, 1958] Small
2018 TOP POOL EXECUTIVE COMPENSATION & BENEFITS ANALYSIS REDACTED: Data provided to participating pools
 2018 TOP POOL EXECUTIVE COMPENSATION & BENEFITS ANALYSIS TABLE OF CONTENTS Introduction............................. 3 Anticipated retirement of top executives............. 4 Salary findings...........................
The Impact of Third-Party Debt Collection on the U.S. National and State Economies in 2013
 The Impact of Third-Party Debt Collection on the U.S. National and State Economies in 2013 Prepared for ACA International July 2014 The Impact of Third-Party Debt Collection on the National and State Economies
Economic Growth Through Employee Ownership. How states can save jobs and address the wealth inequality gap through ESOPs
 Economic Growth Through Employee Ownership How states can save jobs and address the wealth inequality gap through ESOPs CONTENTS 1 GROWTH THROUGH ESOPs 2 WHAT IS AN ESOP? 3 STATE POLICIES TO PROMOTE ESOPs
Nation s Uninsured Rate for Children Drops to Another Historic Low in 2016
 Nation s Rate for Children Drops to Another Historic Low in 2016 by Joan Alker and Olivia Pham The number of uninsured children nationwide dropped to another historic low in 2016 with approximately 250,000
CRS Report for Congress
 Order Code RS20853 Updated February 22, 2005 CRS Report for Congress Received through the CRS Web State Estate and Gift Tax Revenue Steven Maguire Economic Analyst Government and Finance Division Summary
BY THE NUMBERS 2016: Another Lackluster Year for State Tax Revenue
 BY THE NUMBERS 2016: Another Lackluster Year for State Tax Revenue Jim Malatras May 2017 Lucy Dadayan and Donald J. Boyd 2016: Another Lackluster Year for State Tax Revenue Lucy Dadayan and Donald J. Boyd
Update: Obamacare s Impact on Small Business Wages and Employment Sam Batkins, Ben Gitis
 Update: Obamacare s Impact on Small Business Wages and Employment Sam Batkins, Ben Gitis Executive Summary Research from the American Action Forum (AAF) finds regulations from the Affordable Care Act (ACA)
STATE REVENUE AND SPENDING IN GOOD TIMES AND BAD 5
 STATE REVENUE AND SPENDING IN GOOD TIMES AND BAD 5 Part 2 Revenue States claim that the most immediate cause of strife in state budgets is current and anticipated drops in revenue. No doubt, a drop in
Employer-Funded Individual Health Insurance
 Employer-Funded Individual Health Insurance ANNUAL REPORT 2016 1 EXECUTIVE SUMMARY This 2016 Annual Report is intended to provide a detailed, nationwide profile of how employers and employees are using
Motor Vehicle Sales/Use, Tax Reciprocity and Rate Chart-2005
 The following is a Motor Vehicle Sales/Use Tax Reciprocity and Rate Chart which you may find helpful in determining the Sales/Use Tax liability of your customers who either purchase vehicles outside of