ANNUAL REPORT. Innovative. Innovative. Sustainable. Profitable.
|
|
|
- Benedict Barton
- 6 years ago
- Views:
Transcription


1 2016 ANNUAL REPORT Innovative. Innovative. Sustainable. Profitable.

2 A solid foundation
3 MEG Energy Corp. is a Canadian energy company focused on sustainable in situ development and production in the southern Athabasca oil sands region of Alberta. Our vision for the future entails the implementation of a series of highly economic expansions at our Christina Lake leases. Our goal is to take our production to the regulatory approved limit of 210,000 barrels per day, while driving down our per barrel cash costs with each incremental expansion. Following that, we plan to develop our projects at Surmont, which has a total design capacity of approximately 120,000 barrels per day, and May River, which is designed to produce approximately 160,000 barrels per day ANNUAL REPORT IBC MEG at a glance Capital investment plan Operational & financial highlights To our shareholders I A message from the President and CEO The journey to 210,000 barrels per day Innovative I Our proven technology Sustainable I Protecting the environment Profitable I From investment to cash flow Management s discussion and analysis Report of management Independent auditor s report Financial statements Notes to consolidated financial statements Directors and officers Information for shareholders

4 -46%W%%TI%%%% MEG at a glance Focused cost management Sustainable cost savings achieved through continued technological advancement and reductions in overall cost base NON-ENERGY OPERATING COSTS* $/bbl -44% G & A EXPENSE** $/bbl OPERATING BREAKEVEN 2016 $ 33 (US$/bbl) WTI * Per barrel non-energy operating costs are calculated based on sales volume. ** Per barrel G&A expense are calculated based on production volume as per the MD&A. Monthly production and steam-oil ratio Production (barrels per day) Production SOR Designed capacity ** * * Design SOR * * * * * * Steam-oil ratio (SOR) * Planned plant turnaround ** The designed capacities shown in this table do not reflect the anticipated production increases expected to result from the implementation of the RISER initiative. 4 MEG at a glance


5 GROWTH PROPERTIES MAY RIVER REGIONAL PROJECT SURMONT CHRISTINA LAKE Significant reserves ACCESS PIPELINE Close to 500,000 barrels per day of production approved or under regulatory review Barrels in millions Proved 1,468 Probable 1,517 2,985 STURGEON TERMINAL STONEFELL TERMINAL AND RAIL LOADING Evaluated by GLJ Exploration lands EDMONTON CHRISTINA LAKE PV-10% PROVED + PROBABLE $ 18.1 billion SURMONT PV-10% PROVED + PROBABLE $ 2.6 billion Based on GLJ Reserve Report dated effective as of December 31, 2016 MEG ENERGY 2016 ANNUAL REPORT 5


6 Capital investment plan MEG grew production in 2016 to a record annual level of 81,245 barrels per day while keeping capital investment at $137 million, a reduction of 58% from its original 2016 budget of $328 million. The lower level of 2016 capital spending was driven primarily through efficiency gains associated with the implementation of emsagp at Phase 2, as well as a deferral of certain growth projects capital budget MEG s comprehensive refinancing has put the company in a position to move ahead with its growth plans. The company s $590 million capital budget for 2017 is focused on funding approximately 20,000 barrels per day of highly economic emsagp production growth. This growth is expected to drive further reductions in MEG s breakeven cash costs and significantly de-risk its business from volatile commodity prices. The estimated capital cost of the anticipated 20,000 barrels per day emsagp growth at Christina Lake Phase 2B is approximately $400 million. MEG is planning to invest $320 million, or approximately 80% of the total estimated cost, in $590 C$ millions 2B emsagp growth $320 Sustaining & maintenance $200 emvapex marketing & other $70 MEG has allocated approximately $70 million in 2017 to our emvapex pilot, marketing, corporate and other initiatives. emvapex (a MEG patented process) is a continuation of the company s emsagp technology development. If proven successful, it will enhance MEG s growth potential and further reduce GHG emissions. The low level of capital required to sustain MEG s highly-economic projects has enabled the company to maintain production while limiting our anticipated sustaining and maintenance capital for 2017 to approximately $200 million.* *Assumes the midpoint of MEG s 2017 production guidance range of 80,000 to 82,000 barrels per day. 6 Capital investment plan
 27.79 30.63 62.67 49.28 46.93 Steam-oil ratio (SOR) 2.3 2.5 2.5 2.6 2.4 Net operating costs ($ per barrel) 1 7.99 9.39 12.06 10.01 9.98 Non-energy operating costs ($ per barrel) 5.62 6.54 8.")
7 Operational & financial highlights ($ millions, except as indicated) Bitumen production (barrels per day) 81,245 80,025 71,186 35,317 28,773 Bitumen realization ($ per barrel) Steam-oil ratio (SOR) Net operating costs ($ per barrel) Non-energy operating costs ($ per barrel) Cash operating netback ($ per barrel) Adjusted funds flow 3 (62.0) Per share, diluted 3 (0.27) Operating earnings (loss) 3 (455.1) (374.4) Per share, diluted 3 (2.01) (1.67) Revenue 4 1, , , , ,050.5 Net earnings (loss) 5 (428.7) (1,169.7) (105.5) (166.4) 52.6 Per share, diluted (1.90) (5.21) (0.47) (0.75) 0.26 Total cash capital investment , , ,567.9 Cash and cash equivalents , ,474.8 Long-term debt 7 5, , , , , Net operating costs include energy and non-energy operating costs, reduced by power revenue. 2 Cash operating netback is calculated by deducting the related diluent expense, transportation, operating expenses, royalties and realized commodity risk management gains (losses) from proprietary blend revenues and power revenues, on a per barrel of bitumen sales volume basis. 3 Adjusted funds flow, Operating earnings (loss) and the related per share amounts do not have standardized meanings prescribed by IFRS and therefore may not be comparable to similar measures used by other companies. For the years ended December 31, 2016 and December 31, 2015, the non- GAAP measure of adjusted funds flow is reconciled to net cash provided by (used in) operating activities and the non-gaap measure of operating loss is reconciled to net loss in accordance with IFRS under the heading NON-GAAP MEASURES and discussed further in the ADVISORY section. 4 The total of Petroleum revenue, net of royalties and Other revenue as presented on the Consolidated Statement of Earnings (Loss) and Comprehensive Income (Loss). 5 Includes a net unrealized foreign exchange gain of $148.2 million on the Corporation s U.S. dollar denominated debt and U.S. dollar denominated cash and cash equivalents for the year ended December 31, The net loss for the year ended December 31, 2015 includes a net unrealized foreign exchange loss of $785.3 million. 6 Defined as total capital investment excluding dispositions, capitalized interest, capitalized cash-settled stock-based compensation and non-cash items. 7 On December 8, 2016, Fitch Ratings ( Fitch ) assigned the Corporation a first-time Long-Term Issuer Default Rating of B, and assigned a rating of BB to the Corporation s covenant-lite revolving credit facility and term loan and a rating of B to the Corporation s Senior Unsecured Notes. On January 12, 2017, Fitch assigned a BB rating to the Corporation s new second lien secured notes (see the Capital Resources section of this MD&A). Fitch s rating outlook is negative. On January 12, 2017, Standard & Poor s Ratings Services ( S&P ) assigned a BB+ rating to the Corporation s new second lien secured notes. On January 12, 2017, Moody s Investors Service ( Moody s ) upgraded the Corporation s Corporate Family Rating to B3 from Caa2, the Probability of Default Rating to B3-PD from Caa2-PD and the Corporation s Senior Unsecured Notes rating to Caa2 from Caa3. Moody s Speculative Grade Liquidity Rating was raised to SGL-1 from SGL-2. Moody s also assigned a rating of Ba3 to the Corporation s covenant-lite revolving credit facility and refinanced term loan and a rating of Caa1 to the new second lien secured notes. Moody s rating outlook was changed to stable from negative. MEG ENERGY 2016 ANNUAL REPORT 7
8 To our shareholders 2016 and early 2017 have been extremely important for MEG Energy. Our comprehensive refinancing plan, successfully completed in late January, extended the maturity profile of our debt to nearly five years under favourable terms. This refinancing included a $518 million equity issuance, which opened the door for us to refocus on growth toward 210,000 barrels per day. In 2016, MEG Energy utilized its proven, proprietary emsagp technology to achieve record annual production of 81,245 barrels per day while at the same time reducing annual per barrel net operating costs and per barrel non-energy operating costs to record lows. We are now using the same technology to springboard forward our growth plans on Phase 2B. In 2017, we will direct approximately $320 million toward this initiative out of our capital budget of $590 million. Over the past six years we have proven and commercially applied emsagp on Phase 1 and 2, which account for approximately 25% of our total field-wide production. Where implemented, the emsagp process has reduced the steam-oil ratio by about 50% to an industry-leading range of 1.0 to As we apply emsagp to the remainder of our wells at Phase 2B, we believe the value of this technology is going to become very apparent. We estimate at this time that our second project, known as the Phase 2B brownfield expansion, could proceed some time in mid to late This plant expansion will add a further 13,000 barrels per day and can be done concurrently with the implementation of emsagp. We expect the implementation of emsagp and the brownfield expansion to bring production to approximately 113,000 barrels per day, and reduce our cash costs by $6 to $7 per barrel. These savings contribute directly to MEG s bottom line and will increase the ability of the company to respond to swings in the marketplace, while further reducing the breakeven price we need to advance our growth plans. As MEG increases production, we will also be in a more advantageous position to improve the company s overall debt metrics. Based on a WTI price in the mid to low $US fifties, we believe we can reach a net debt to EBITDA (earnings before interest, taxes, depreciation and amortization) ratio in the 3x to 4x range once the first two projects are completed. We anticipate there will be further improvements to our debt metrics as subsequent projects are developed. Following completion of these two projects, we plan to continue our journey to 210,000 barrels per day with a series of additional high return, short-cycle brownfield development projects, each in the range of 10,000 to 20,000 barrels per day. This block-byblock strategy breaks down a large project, which formerly could have taken three-plus years to fund and construct, into a series of smaller-scale projects which can each be implemented on a 12 to 18 month basis. MEG can also get from our initial investment to cash flow in as little as nine to 12 months. This approach enables us to reach the same finish line as we would have with a large-scale project, but we are able to implement it more efficiently with less capital and with a quicker path to cash flow. Because each added project requires significantly less capital than might have been the case before, we have considerable flexibility around our timing. We are comfortable we can speed up or slow down development of each component depending on market conditions. With the strong returns associated with these projects, even at lower oil prices, we believe it makes 8 To our shareholders


9 sense for MEG to go ahead with them. It is the company s intention to fund these projects from cash flow. We continue to apply our hedging strategy, which is focused on protecting MEG s capital program against downward oil price movements. Our objective is to set a floor price that is set at or above the company s costs, while leaving room to take advantage of improving oil prices. In addition, we continue to work to diversify markets and reduce the price differential for MEG s heavy oil production. An important component of the company s marketing strategy is our access to the Gulf of Mexico through the Flanagan-Seaway pipeline system. Combined with our use of rail, Flanagan-Seaway gives MEG a competitive advantage to gaining access to that important market as we continue to pursue additional transportation opportunities. MEG has recently submitted an application to the Alberta Energy Regulator for the May River Project, which has a total planned capacity of approximately 160,000 barrels per day. MEG now has close to 500,000 barrels per day of production approved or under regulatory review. Following completion of the Phase 2B emsagp and brownfield expansions, we plan to continue our journey to 210,000 barrels per day with a series of additional high return, short-cycle brownfield development projects, each in the range of 10,000 to 20,000 barrels per day. MEG has put in place a very solid foundation to move forward with its plans. Our focus through 2017 is on the successful execution of those plans. Bill McCaffrey President and CEO MAY 2017 MEG ENERGY 2016 ANNUAL REPORT 9
10 The journey to 210,000 barrels per day * ,000-82,000 barrels per day MEG continues efforts to incrementally grow production to 210,000 barrels per day at Christina Lake by advancing a series of high-return, short-cycle 10,000 to 20,000 barrels per day projects. These projects will have capital cash intensities in the range of $20,000 to $30,000 per flowing barrel and are each expected to take 12 to 18 months to implement. Potential annual production growth of approximately 10% *Growth can be internally funded at a WTI price in the mid to low $US fifties and onward 10 The journey to 210,000 barrels per day*
 is reduced.")
11 Expand emsagp to Phase 2B wells, which represent 75% of MEG production. Production increases begin from emsagp, enabling MEG to exit 2017 at 86,000 to 89,000 barrels per day while the steam-oil ratio (SOR) is reduced. Subject to market conditions, Phase 2B Brownfield expansion commences in mid to late year. Capital expenditures for emsagp expansion completed. Production ramp-up continues. Phase 2B emsagp expansion fully ramped up, taking production to approximately 100,000 barrels per day and further reducing the company s SOR. Phase 2B Brownfield expansion begins to ramp up toward year end. Phase 2B Brownfield expansion complete, bringing total MEG production to approximately 113,000 barrels per day, further reducing the company s SOR, and reducing cash costs by $6 to $7 per barrel. 210,000 barrels per day MEG ENERGY 2016 ANNUAL REPORT 11

12 Our proven technology The benefits of emsagp The steam injected into the oil sands reservoir in the SAGD process helps bitumen flow in two ways reducing its viscosity by heating it, and maintaining pressure in the reservoir to facilitate bitumen flow. MEG s patented emsagp technology enhanced Modified Steam and Gas Push 1 - involves co-injecting a noncondensable gas, like natural gas, with the steam. Once there is sufficient heat in the reservoir, the non-condensable gas helps maintain pressure and frees up steam to be redeployed into new SAGD well pairs. Single collector wells called infill wells are also placed in the sweet spot between producing SAGD well pairs to collect bitumen that would otherwise be unrecoverable, increasing efficiency in the reservoir. To date, emsagp has been deployed at MEG s Phase 1 and 2 wells, which represent about 25% of the company s production, and has been very successful. The technology has enabled MEG to increase production without increasing steam generation capacity. Since employing emsagp, the company s overall steam-oil ratio (SOR) has been reduced to 2.3, and where implemented has led to an industry-leading range of 1.0 to Because emsagp requires less steam per barrel of oil, less capital is required to increase production, and as production grows we can spread our fixed costs over more barrels and reduce our per barrel costs further. emsagp is also tremendously flexible in terms of the pace that it can be implemented. MEG can expand the technology across a number of pads at one time or proceed on a well-by-well basis. MEG s work to expand emsagp during 2017 will consist primarily of drilling infill and SAGD wells, with minor debottlenecks at the central plant. As this expansion progresses we expect production to ramp up and exit the year at 86,000 to 89,000 barrels per day, with further production increases through 2018 and into Steam and Gas Push (SAGP) was invented by the late Dr. Roger Butler, who also invented the SAGD process. 12 Our proven technology
13 Innovative.


14 How emsagp works To date, emsagp has been deployed at MEG s Phase 1 and 2 wells and where implemented has enabled MEG to increase production while cutting the amount of steam we use in half.

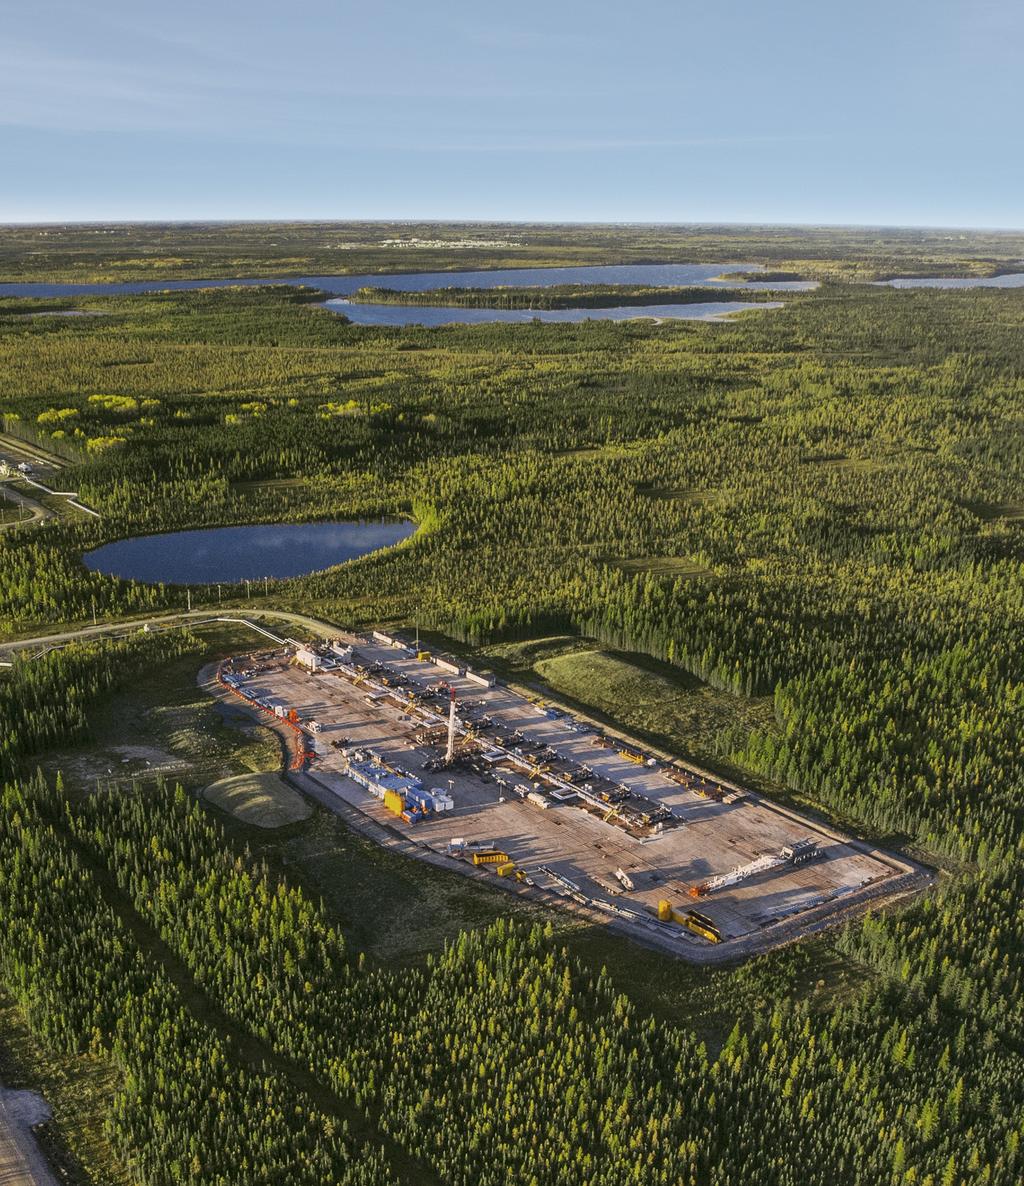
15 Protecting the environment MEG Energy incorporates environmental considerations into all phases of our projects through design, construction, operation and reclamation. We are investing in technology to minimize environmental impacts, increase efficiency and reduce costs. Our focus on technology has enabled MEG to reduce greenhouse gas (GHG) emissions and water use to significantly below the industry average, cut the amount of steam required to produce a barrel of oil by nearly half, and to provide cleaner power to Alberta s energy grid. MEG does not use surface water from streams, rivers or lakes. The water needed to provide steam for our SAGD operations comes from non-drinkable sources located deep underground. Christina Lake, Alberta

16 Sustainable.

17 Air MEG produces one of the lowest GHG intensity barrels in the oil sands industry. Our overall net GHG emissions intensity is currently 22% below the industry average, and has the potential to be reduced even further as we expand our emsagp technology. Over the past six years MEG has employed proprietary emsagp technology to develop our Phase 1 and 2 assets. Where implemented, the emsagp process has enabled us to increase production while using less steam and reduced the steam-oil ratio (SOR) by about 50% to an industryleading range of 1.0 to In 2017, we are beginning to apply emsagp to the remaining 75% of our assets and expect to see a further company-wide reduction in the steam that we use. A lower SOR means less steam, which means a lower energy requirement and lower GHG intensity. Cogeneration technology, the process of simultaneously producing steam and electricity, is another key to our GHG management. In MEG s operations, the steam is used for SAGD bitumen recovery, while the electricity is used to power the plant site, with excess power sold to Alberta s power grid. The electricity provided to the power grid has a lower carbon footprint than the provincial average, helping to reduce total GHG intensity for provincial consumers. NO X /SO 2 intensity* MEG has invested in low NO X burners and combustion control technologies to lower NO X emissions. We have reduced our nitrogen oxide per barrel intensity by 20% and our sulphur dioxide per barrel intensity by 33% since ** MEG SOR SO 2 intensity (kg/bbl) NO X intensity (kg/bbl) * MEG s NO X / SO 2 intensity data from has been third-party verified data is preliminary. ** Sulphur removal facility installed at central plant. Net GHG intensity performance 3,467 21,257 26,605 28,773 35,317 71,186 80,025 81,245 emsagp and cogeneration have enabled MEG to lower its GHG intensity 22% below the in situ industry average 2009* * Phase 1 Phase 2 Phase 2B Bitumen production (barrels per day) MEG net GHG intensity** (t CO 2 e/bbl) Industry average GHG intensity (t CO 2 e/bbl) Sources: MEG s net GHG data from has been third-party verified data is preliminary. In-situ industry average estimate is calculated based on the most recent reported data to Environment Canada, Alberta Energy Regulator, and Alberta Electric System Operator. * Phase start-up: higher steam requirements with low initial production ** Net GHG intensity includes the associated benefits of cogeneration MEG ENERGY 2016 ANNUAL REPORT 15


18 Since 2011, our emsagp process and optimization of recycling technology has enabled MEG to reduce our total water withdrawal intensity by Water In 2016, MEG recycled 90% of the water we utilized to produce steam. The ratio of water we use compared to the bitumen we develop is about 50% lower than the in situ industry average 53%* and significantly lower than the oil sands mining average. Our SAGD operations utilize no surface water from streams, rivers or lakes, and no water that has been used in our 88% 90% processes is discharged to the environment. The water needed to produce steam for MEG s SAGD operations comes from non-drinkable sources located deep under the ground. These sources include saline aquifers, unsuitable for human or agricultural use, located hundreds of metres below ground from the hydrocarbon-bearing Clearwater and McMurray formations. Because of their depths, withdrawal of water from these aquifers has minimal environmental impact. Our emsagp technology has enabled us to reduce our steam-oil ratio by about 50% to an industry-leading range of 1.0 to Less steam means less water used in our production Total water use (barrels of water used to produce a barrel of bitumen) Water recycling rate *MEG s total water withdrawal intensity data from has been third-party verified data is preliminary. In 2016, MEG recycled 90% of the water we utilized to produce steam Water testing near Christina Lake facility 16 Protecting the environment


19 Land We utilize available scientific and traditional knowledge of the land when planning, building and operating MEG facilities. The factors we take into account include water bodies, rare plants, sensitive wildlife habitats and historically or ecologically significant lands. We avoid areas of significance whenever practicable and take measures to mitigate impacts where necessary. MEG also builds on land previously used for access roads or exploration to minimize overall land disturbance when we can, and we share common corridors and roads with our industrial operators and local land users. Because MEG s oil extraction occurs deep below the surface, natural ecosystems, including wetlands, trees and lakes are protected. Oil and Water Central Processing Facility Depth in metres Steam Well Pad MEG s SAGD production facilities use only 10-15% of the land surface of a lease 320 Impermeable Cap Rock Steam Injector Well 380 Producer Well Steam Chamber Infill Well Schematic only. Not to scale. Wildlife At MEG, our complete Wildlife Monitoring and Mitigation Plan and dedicated Caribou Monitoring Mitigation Plan help us minimize any impacts on bears, caribou, moose, birds and fish. We limit new land disturbance and allow for wildlife movement in and around our project area. Wildlife crossings are strategically placed over our above-ground pipelines to help wildlife move as freely as possible without increasing risk from predators. These crossing locations are carefully selected using data collected on wildlife activity in the area. We also keep seismic lines narrow and limit straight clearing distances that can expose wildlife populations to predators and recreational hunters. When no longer required, MEG uses habitat restoration techniques to further reduce linear sightlines and MEG uses remote cameras to track wildlife movement. This photo was taken from a remote camera located near a wildlife crossing on the Christina Lake site. restores caribou habitat through treatments such as reforestation to promote the growth of naturally occurring vegetation. MEG s approach to managing wildlife at the Christina Lake Regional Project has been certified by the Wildlife Habitat Council. MEG ENERGY 2016 ANNUAL REPORT 17

20 From investment to cash flow Subsequent to the end of 2016, MEG Energy took the bold step of restructuring its debt, extending its debt maturities, reducing some restrictions around selling of its assets, and raised $518 million of equity capital to kickstart the implementation of its highly-economic growth projects. The key to the transactions was the availability of these highly-economic growth projects and the ability of the company to grow in the future at approximately half the cost it did previously. In addition, the compression of the time frame from investment to cash flow has made these projects particularly attractive. Once production is on stream, the low level of decline along with the low level of capital required to sustain and maintain the wells adds to their uniqueness. The end result is that less capital will be required to sustain production and can be directed to growth. Our growth projects provide a higher level of return because the capital required is much smaller than was needed previously. We expect our proprietary emsagp technology, applied to Phase 2B, will enable us to add 20,000 barrels per day to our production base by adding new infill and SAGD wells. The capital required, at $20,000 per flowing barrel, is about half of what the cost formerly was. In addition, the fact that the added barrels are being produced at our centralized location, which has primarily fixed costs, continues to drive our cost per barrel lower. We anticipate that once emsagp is fully implemented on Phase 2B and the incremental 20,000 barrels per day are realized, our overall cash costs will drop by approximately $4 to $5 per barrel. Each incremental phase of growth will continue to drop our cost per barrel even further. As we continue to implement new phases of growth all the way to 210,000 barrels per day and drop our cash costs even further, the business will be more resilient to the volatility we have been seeing in commodity prices. As we grow the business, we also expect our debt to be in the range of 3x to 4x on a net debt to EBITDA basis. As we implement further phases of our growth plan, these metrics will continue to improve. Finally, all of this has been planned on the basis of funding our growth utilizing the financial resources we have on hand and the cash flow generated at a WTI price in the mid to low $US fifties. 18 From investment to cash flow

21 Profitable. MEG ENERGY 2016 ANNUAL REPORT 19
22 Management s discussion and analysis This Management s Discussion and Analysis ( MD&A ) of the financial condition and performance of MEG Energy Corp. ( MEG or the Corporation ) for the year ended December 31, 2016 was approved by the Board of Directors on March 2, This MD&A should be read in conjunction with the Corporation s audited consolidated financial statements and notes thereto for the year ended December 31, 2016 and its most recently filed Annual Information Form ( AIF ). This MD&A and the audited consolidated financial statements and comparative information have been prepared in accordance with International Financial Reporting Standards ( IFRS ) as issued by the International Accounting Standards Board ( IASB ) and are presented in thousands of Canadian dollars, except where otherwise indicated. MD&A CONTENTS Overview Summary annual information Operational and financial highlights Results of operations Outlook Business environment Other operating results Summary of quarterly results Net capital investment Liquidity and capital resources Shares outstanding Contractual obligations and commitments Non-GAAP measures Critical accounting policies and estimates Transactions with related parties Off-balance sheet arrangements New accounting standards Risk factors Disclosure controls and procedures Internal controls over financial reporting Abbreviations Advisory Additional information Quarterly summaries Annual summaries
23 Overview MEG is an oil sands company focused on sustainable in situ oil sands development and production in the southern Athabasca oil sands region of Alberta, Canada. MEG is actively developing enhanced oil recovery projects that utilize steam-assisted gravity drainage ( SAGD ) extraction methods. MEG is not engaged in oil sands mining. MEG owns a 100% working interest in over 900 square miles of oil sands leases. For information regarding MEG s estimated reserves, please refer to the Corporation s most recently filed Annual Information Form ( AIF ), which is available on the Corporation s website at and is also available on the SEDAR website at The Corporation has identified two commercial SAGD projects; the Christina Lake Project and the Surmont Project. The Christina Lake Project has received regulatory approval for 210,000 barrels per day ( bbls/d ) of production and MEG has applied for regulatory approval for 120,000 bbls/d of production at the Surmont Project. The ultimate production rate and life of each project will be dependent on a number of factors, including the size, performance and development schedule for each expansion or phase in those projects. In addition, the Corporation holds other leases known as the May River Regional Project and the Growth Properties. On February 21, 2017, the Corporation filed regulatory applications with the Alberta Energy Regulator for the May River Regional Project. Management anticipates, consistent with the estimates contained in the GLJ Report, that the May River Regional Project can support an average of 164,000 bbls/d of bitumen production. The Growth Properties are in the resource definition and data gathering stage of development. The Corporation s first two production phases at the Christina Lake Project, Phase 1 and Phase 2, commenced production in 2008 and 2009, respectively. In 2012, the Corporation announced the RISER initiative, which is a combination of proprietary reservoir technologies, including enhanced Modified Steam And Gas Push ( emsagp ) and redeployment of steam and facilities modifications, including debottlenecking and expansions (collectively RISER ). Phase 2B commenced production in Bitumen production at the Christina Lake Project for the year ended December 31, 2016 averaged 81,245 bbls/d. The application of emsagp and cogeneration have enabled MEG to lower its greenhouse gas intensity below the in situ industry average calculated based on reported data to Environment Canada, the Alberta Energy Regulator and the Alberta Electric System Operator. MEG anticipates applying RISER, and specifically emsagp, to Phase 2B during The Surmont Project has an anticipated design capacity of approximately 120,000 bbls/d over multiple phases. The Surmont Project is located approximately 30 miles north of the Corporation s Christina Lake Project, and is situated along the same geological trend as the Christina Lake Project. The Corporation is actively pursuing regulatory approval. The May River Regional Project has an anticipated design capacity of approximately 164,000 bbls/d over multiple phases. The May River Regional Project is situated on 285 square miles of lands in the southern Athabasca oil sands region of Alberta. MEG ENERGY 2016 ANNUAL REPORT 21
24 MEG holds a 50% interest in the Access Pipeline, a dual pipeline system that connects the Christina Lake Project to a large regional upgrading, refining, diluent supply and transportation hub in the Edmonton, Alberta area. MEG s 50% interest of the capacity in the 42-inch blend line is approximately 200,000 bbls/d of blended bitumen. The Corporation continues to review options available to utilize its interest in the Access Pipeline to reduce the financial leverage of the Corporation. The potential monetization of MEG s 50% interest in the Access Pipeline continues to be a priority of the Corporation. In addition to the Access Pipeline, MEG holds a 100% interest in the Stonefell Terminal, located near Edmonton, Alberta, with a storage and terminalling capacity of 900,000 barrels. The Stonefell Terminal is connected to local and export markets by pipeline, in addition to being pipeline connected to a third party rail-loading terminal near Bruderheim, Alberta. This combination of facilities allows for the loading of bitumen blend for transport by rail. Effective January 1, 2016, MEG increased its transportation capacity on the Flanagan South and Seaway pipeline systems to U.S. Gulf Coast refineries. This pipeline system went into operation in late Summary annual information ($000s, except per share amounts) Revenue (1) 1,866,284 1,925,916 2,829,964 Net loss (428,726) (1,169,671) (105,538) Per share basic (1.90) (5.21) (0.47) Per share diluted (1.90) (5.21) (0.47) Total assets 8,921,224 9,400,269 9,930,108 Total non-current liabilities 5,271,277 5,474,106 4,700,771 (1) The total of Petroleum revenue, net of royalties and Other revenue as presented on the Consolidated Statement of Earnings (Loss) and Comprehensive Income (Loss). Revenue During 2016, revenue decreased 3% from 2015, primarily as a result of the year-over-year average decline in U.S. crude oil benchmark pricing. During 2015, revenue decreased 32% from 2014, primarily as a result of the significant decline in U.S. crude oil benchmark pricing, partially offset by an increase in production volumes from the Christina Lake Project. Net loss The decrease in the net loss in 2016 compared to the net loss in 2015 is primarily attributable to the change in value of the Canadian dollar relative to the U.S. dollar, which impacts the translation of the Corporation s U.S. dollar denominated debt and U.S. dollar denominated cash and cash equivalents. In 2016, the Corporation recognized an unrealized foreign exchange gain compared to an unrealized foreign exchange loss in The net loss for the year ended December 31, 2016 was impacted by lower bitumen realization, primarily as a result of the year-overyear average decline in U.S. crude oil benchmark pricing, an impairment charge related to the Northern Gateway pipeline, an unrealized loss on commodity risk management and other expenses primarily related to onerous contracts and severance. 22 Management s discussion and analysis
25 The net loss in 2015 increased from the net loss recorded in 2014 primarily due to higher unrealized foreign exchange losses attributable to a decrease in value of the Canadian dollar relative to the U.S. dollar, which impacts the translation of the Corporation s U.S. dollar denominated debt and U.S. dollar denominated cash and cash equivalents. In addition to higher unrealized foreign exchange losses in 2015, the net loss was impacted by lower bitumen realization, primarily as a result of the significant decline of U.S. crude oil benchmark pricing, higher transportation costs associated with transporting volumes from Edmonton to the U.S. Gulf Coast via the Flanagan-Seaway Pipeline, an increase in depletion and depreciation expense as a result of an increase in bitumen production volumes and an increase in interest expense due to the weakening Canadian dollar and its impact on U.S. dollar denominated interest expense. These factors were partially offset by an increase in bitumen sales volumes and lower royalties. Total assets Total assets as at December 31, 2016 decreased compared to December 31, 2015 primarily due to an increase in depletion and depreciation expense as a result of an increase in the estimated future development costs associated with the Corporation s proved reserves as well as an impairment charge of $80.1 million related to the Northern Gateway pipeline and a decrease in cash and cash equivalents. The depletion and depreciation expense in 2016 was in excess of capital investment incurred during 2016, as the Corporation has been focused on reducing capital spending until there is a sustained improvement in crude oil pricing. The cash and cash equivalents balance as at December 31, 2016 decreased compared to December 31, 2015 primarily due to the use of cash for interest and principal payments and payments relating to capital investing activity. Total assets as at December 31, 2015 decreased compared to December 31, 2014 primarily due to an increase in depletion and depreciation expense as a result of an increase in bitumen production volumes and a decrease in cash and cash equivalents. The depletion and depreciation expense in 2015 was in excess of capital investment incurred during 2015, as the Corporation has been focused on reducing capital spending until there is a sustained improvement in crude oil pricing. The cash and cash equivalents balance as at December 31, 2015 decreased compared to December 31, 2014 primarily due to the settlement of accounts payable related to 2014 capital investment activity. For a detailed discussion of the Corporation s investing activities, see LIQUIDITY AND CAPITAL RESOURCES Cash Flow Investing Activities. Total non-current liabilities Total non-current liabilities as at December 31, 2016 decreased compared to December 31, 2015 primarily due to the Corporation recognizing an unrealized foreign exchange gain on the translation of the U.S. dollar denominated debt as a result of strengthening of the Canadian dollar compared to the U.S. dollar by approximately 3% during the year ended December 31, In addition, the Corporation recognized a deferred income tax asset as at December 31, 2016 compared to a deferred income tax liability as at December 31, Total non-current liabilities as at December 31, 2015 increased compared to December 31, 2014 primarily due to the Corporation recognizing an unrealized foreign exchange loss on the translation of the U.S. dollar denominated debt as a result of weakening of the Canadian dollar compared to the U.S. dollar by approximately 19% during the year ended December 31, MEG ENERGY 2016 ANNUAL REPORT 23
26 Operational and financial highlights On January 27, 2017, the Corporation completed a comprehensive refinancing plan as outlined in the Capital Resources section of this MD&A. The ongoing global imbalance between supply and demand for crude oil continued to significantly impact the Corporation s operating and financial results. The C$/bbl WTI average price for the year ended December 31, 2016 decreased 8% compared to the same period in As a result of ongoing cost control initiatives in 2016, the Corporation has reduced non-energy operating costs per barrel by 14% compared to the year ended December 31, 2015 and has reduced general and administrative expense per barrel by 20% compared to the year ended December 31, During 2016, the Corporation implemented a strategic commodity risk management program to partially manage its exposure on blend sales prices and condensate purchases with the intent to increase the predictability of the Corporation s future cash flow as governed by the Corporation s Risk Management Committee. The following table summarizes selected operational and financial information of the Corporation for the years noted. All dollar amounts are stated in Canadian dollars ($ or C$) unless otherwise noted: ($ millions, except as indicated) Bitumen production - bbls/d 81,245 80,025 Bitumen realization - $/bbl Net operating costs - $/bbl (1) Non-energy operating costs - $/bbl Cash operating netback - $/bbl (2) Adjusted funds flow (3) (62) 49 Per share, diluted (3) (0.27) 0.22 Operating loss (3) (455) (374) Per share, diluted (3) (2.01) (1.67) Revenue (4) 1,866 1,926 Net loss (5) (429) (1,170) Per share, basic (1.90) (5.21) Per share, diluted (1.90) (5.21) Total cash capital investment (6) Cash and cash equivalents Long-term debt (7) 5,053 5, Management s discussion and analysis
27 (1) Net operating costs include energy and non-energy operating costs, reduced by power revenue. (2) Cash operating netback is calculated by deducting the related diluent expense, transportation, operating expenses, royalties and realized commodity risk management gains (losses) from proprietary blend revenues and power revenues, on a per barrel of bitumen sales volume basis. (3) Adjusted funds flow, Operating earnings (loss) and the related per share amounts do not have standardized meanings prescribed by IFRS and therefore may not be comparable to similar measures used by other companies. For the years ended December 31, 2016 and December 31, 2015, the non-gaap measure of adjusted funds flow is reconciled to net cash provided by (used in) operating activities and the non-gaap measure of operating loss is reconciled to net loss in accordance with IFRS under the heading NON-GAAP MEASURES and discussed further in the ADVISORY section. (4) The total of Petroleum revenue, net of royalties and Other revenue as presented on the Consolidated Statement of Earnings (Loss) and Comprehensive Income (Loss). (5) Includes a net unrealized foreign exchange gain of $148.2 million on the Corporation s U.S. dollar denominated debt and U.S. dollar denominated cash and cash equivalents for the year ended December 31, The net loss for the year ended December 31, 2015 includes a net unrealized foreign exchange loss of $785.3 million. (6) Defined as total capital investment excluding dispositions, capitalized interest, capitalized cash-settled stock-based compensation and non-cash items. (7) On December 8, 2016, Fitch Ratings ( Fitch ) assigned the Corporation a first-time Long-Term Issuer Default Rating of B, and assigned a rating of BB to the Corporation s covenant-lite revolving credit facility and term loan and a rating of B to the Corporation s Senior Unsecured Notes. On January 12, 2017, Fitch assigned a BB rating to the Corporation s new second lien secured notes (see the Capital Resources section of this MD&A). Fitch s rating outlook is negative. On January 12, 2017, Standard & Poor s Ratings Services ( S&P ) assigned a BB+ rating to the Corporation s new second lien secured notes. On January 12, 2017, Moody s Investors Service ( Moody s ) upgraded the Corporation s Corporate Family Rating to B3 from Caa2, the Probability of Default Rating to B3-PD from Caa2-PD and the Corporation s Senior Unsecured Notes rating to Caa2 from Caa3. Moody s Speculative Grade Liquidity Rating was raised to SGL-1 from SGL-2. Moody s also assigned a rating of Ba3 to the Corporation s covenant-lite revolving credit facility and refinanced term loan and a rating of Caa1 to the new second lien secured notes. Moody s rating outlook was changed to stable from negative. Results of operations Bitumen production and steam-oil ratio Bitumen production bbls/d 81,245 80,025 Steam-oil ratio (SOR) Bitumen production Bitumen production for the year ended December 31, 2016 averaged 81,245 bbls/d compared to 80,025 bbls/d for the year ended December 31, The increase in production volumes for the year ended December 31, 2016 is primarily due to the efficiency gains achieved through the continued implementation of emsagp at the Christina Lake Project. The implementation of emsagp has improved reservoir efficiency and allowed for redeployment of steam, thereby enabling the Corporation to place additional wells into production. Steam-oil ratio The Corporation continues to focus on sustaining production and maintaining efficiency of current production through a lower SOR, which is an important efficiency indicator that measures the average amount of steam that is injected into the reservoir for each barrel of bitumen produced. The SOR averaged 2.3 for the year ended December 31, 2016 compared to an average SOR of 2.5 for the year ended December 31, The decrease in SOR for the year ended December 31, 2016 is due to the continued implementation of emsagp. MEG ENERGY 2016 ANNUAL REPORT 25
28 Operating cash flow ($000) Petroleum revenue proprietary (1) $ 1,626,025 $ 1,799,154 Diluent expense (808,030) (893,995) 817, ,159 Royalties (8,581) (20,765) Transportation expense (209,864) (156,382) Operating expenses (253,758) (306,725) Power revenue 18,868 29,239 Transportation revenue 19,791 13, , ,350 Realized gain on risk management 2,359 - Operating cash flow (2) $ 386,810 $ 464,350 (1) Proprietary petroleum revenue represents MEG s revenue ( blend sales revenue ) from its heavy crude oil blend known as Access Western Blend ( AWB or blend ). Blend is comprised of bitumen produced at the Christina Lake Project blended with purchased diluent. (2) A non-gaap measure as defined in the NON-GAAP MEASURES section of this MD&A. Operating cash flow was $386.8 million for the year ended December 31, 2016 compared to $464.4 million for the year ended December 31, Operating cash flow decreased primarily due to lower blend sales revenue as a result of the year-over-year average decline in U.S. crude oil benchmark pricing, partially offset by a decrease in diluent expense. In addition, the Corporation realized a gain of $2.4 million on commodity risk management contracts in Blend sales revenue for the year ended December 31, 2016 was $1.6 billion compared to $1.8 billion for the year ended December 31, The decrease in blend sales revenue is primarily due to a 10% decrease in the average realized blend price. Diluent expense for the year ended December 31, 2016 was $808.0 million compared to $894.0 million for the year ended December 31, 2015, reflecting a decrease in condensate prices. 26 Management s discussion and analysis
29 Cash operating netback $/bbl $15.72 $(2.84) $0.83 $(0.35) $0.08 $0.92 $(1.64) $0.41 $ Bitumen realization Transportation Royalties Operating costs Operating costs Realized risk Power revenue - non-energy - energy management 2016 The following table summarizes the Corporation s cash operating netback for the years indicated: ($/bbl) Bitumen realization (1) $ $ Transportation (2) (6.46) (4.82) Royalties (0.29) (0.70) Operating costs non-energy (5.62) (6.54) Operating costs energy (3.01) (3.84) Power revenue Net operating costs (7.99) (9.39) Realized gain on risk management Cash operating netback $ $ (1) Blend sales revenue net of diluent expense. (2) Defined as transportation expense less transportation revenue. Transportation costs include rail, third-party pipelines and the Stonefell Terminal costs, as well as MEG s share of the operating costs for the Access Pipeline, net of third-party recoveries on diluent transportation arrangements. Cash operating netback for the year ended December 31, 2016 was $13.13 per barrel compared to $15.72 per barrel for the year ended December 31, The decrease in cash operating netback for the year ended December 31, 2016 was primarily due to a decrease in bitumen realization, as a result of the year-over-year average decline in U.S. crude oil benchmark pricing and an increase in transportation expense, partially offset by a decrease in net operating costs. MEG ENERGY 2016 ANNUAL REPORT 27
30 Bitumen realization Bitumen realization represents the Corporation s realized proprietary petroleum revenue ( blend sales revenue ), net of diluent expense, expressed on a per barrel basis. Blend sales revenue represents MEG s revenue from its heavy crude oil blend known as Access Western Blend ( AWB or blend ). AWB is comprised of bitumen produced at the Christina Lake Project blended with purchased diluent. The cost of blending is impacted by the amount of diluent required and the Corporation s cost of purchasing and transporting diluent. A portion of diluent expense is effectively recovered in the sales price of the blended product. Diluent expense is also impacted by Canadian and U.S. benchmark pricing, the timing of diluent inventory purchases and changes in the value of the Canadian dollar relative to the U.S. dollar. Bitumen realization averaged $27.79 per barrel for the year ended December 31, 2016 compared to $30.63 per barrel for the year ended December 31, The decrease in bitumen realization is primarily a result of the year-over-year average decline in U.S. crude oil benchmark pricing which resulted in lower blend sales revenue. For the year ended December 31, 2016, the Corporation s cost of diluent was $61.06 per barrel of diluent compared to $67.72 per barrel of diluent for the year ended December 31, The decrease in the cost of diluent is primarily a result of the year-over-year average decline in condensate benchmark pricing. Transportation The Corporation utilizes multiple facilities to transport and sell its blend to refiners throughout North America. In early 2016, the Corporation increased its transportation capacity on the Flanagan South and Seaway pipeline systems, thereby furthering the Corporation s strategy of broadening market access to world prices with the intention of improving cash operating netback. This improved cash operating netback requires additional transportation. Transportation costs averaged $6.46 per barrel for the year ended December 31, 2016 compared to $4.82 per barrel for the year ended December 31, Transportation expense increased primarily due to the cost of transporting higher blend volumes from Edmonton to the U.S. Gulf Coast via the Flanagan South and Seaway pipeline systems. Royalties The Corporation s royalty expense is based on price-sensitive royalty rates set by the Government of Alberta. The applicable royalty rates change dependent upon whether a project is pre-payout or post-payout, with payout being defined as the point in time when a project has generated enough net revenues to recover its cumulative costs. The royalty rate applicable to pre-payout oil sands operations starts at 1% of bitumen sales and increases for every dollar that the WTI crude oil price in Canadian dollars is priced above $55 per barrel, to a maximum of 9% when the WTI crude oil price is $120 per barrel or higher. All of the Corporation s projects are currently pre-payout. Royalties averaged $0.29 per barrel during the year ended December 31, 2016 compared to $0.70 per barrel for the year ended December 31, The decrease in royalties is primarily attributable to lower royalty rates as a result of lower realized prices. 28 Management s discussion and analysis
31 Net operating costs Net operating costs are comprised of the sum of non-energy operating costs and energy operating costs, which are reduced by power revenue. Non-energy operating costs represent production-related operating activities excluding energy operating costs. Energy operating costs represent the cost of natural gas for the production of steam and power at the Corporation s facilities. Power revenue is the sale of surplus power generated at the Corporation s cogeneration facilities at the Christina Lake Project. Net operating costs for the year ended December 31, 2016 averaged $7.99 per barrel compared to $9.39 per barrel for the year ended December 31, The decrease in net operating costs is attributable to a per barrel decrease in energy and non-energy operating costs and power revenue. Non-energy operating costs Non-energy operating costs averaged $5.62 per barrel for the year ended December 31, 2016 compared to $6.54 per barrel for the year ended December 31, The decrease in non-energy operating costs is primarily the result of efficiency gains and a continued focus on cost management resulting in lower operations staffing and materials and services costs. Energy operating costs Energy operating costs averaged $3.01 per barrel for the year ended December 31, 2016 compared to $3.84 per barrel for the year ended December 31, The decrease in energy operating costs on a per barrel basis is primarily attributable to the decrease in natural gas prices. The Corporation s natural gas purchase price averaged $2.53 per mcf during the year ended December 31, 2016 compared to $3.11 per mcf for the same period in Power revenue Power revenue averaged $0.64 per barrel for the year ended December 31, 2016 compared to $0.99 per barrel for the year ended December 31, The Corporation s average realized power sales price during the year ended December 31, 2016 was $18.74 per megawatt hour compared to $27.48 per megawatt hour for the same period in The decrease in the realized power sales price is primarily due to the overall surplus of power generation capacity in the province of Alberta. Commodity risk management gain The realized gain on commodity risk management averaged $0.08 per barrel for the year ended December 31, Refer to the RISK MANAGEMENT section of this MD&A for further details. MEG ENERGY 2016 ANNUAL REPORT 29
32 Adjusted funds flow year ended December 31, 2016 $ millions $49.5 $(87.2) $13.13 $(61.6) $12.2 $(47.5) $42.6 $(51.9) $28.8 $(30.4) $ Bitumen realization (1) Royalties Transportation(2) Net operating Interest, General and Net marketing costs (3) administrative activity (5) Other 2016 net (4) (1) Net of diluent expense. (2) Defined as transportation expense less transportation revenue. (3) Includes non-energy and energy operating costs, reduced by power revenue. (4) Defined as net interest expense in Note 21 of the Consolidated Financial Statements less amortization of debt issue costs as presented on the Consolidated Statement of Cash Flow. (5) A non-gaap measure defined in the NON-GAAP MEASURES section of this MD&A. Adjusted funds flow was $(61.6) million for the year ended December 31, 2016 compared to adjusted funds flow of $49.5 million for the year ended December 31, The decrease in adjusted funds flow was due to a decrease in bitumen realization and increases in net interest expense, transportation and other. These cash flow reductions were partially offset by decreases in net operating costs, net marketing activity, general and administrative expense and royalties. Adjusted funds flow decreased primarily due to lower bitumen realization. The decrease in bitumen realization is directly correlated to the year-over-year average decline in U.S. crude oil benchmark pricing. The increase in net interest expense is primarily due to the Corporation no longer capitalizing interest in 2016 as a result of the reduction in the Corporation s 2016 capital expenditures. During the fourth quarter of 2015 there was a termination of a marketing transportation contract that impacted net marketing activity. No expenses were incurred related to marketing and storage arrangements for the year ended December 31, Operating loss Operating loss is a non-gaap measure, as defined in the NON-GAAP MEASURES section of this MD&A, which the Corporation uses as a performance measure to provide comparability of financial performance between periods by excluding non-operating items. The Corporation recognized an operating loss of $455.1 million for the year ended December 31, 2016 compared to an operating loss of $374.4 million for the year ended December 31, The increase in the operating loss for the year ended December 31, 2016 was primarily due to lower bitumen realization as a result of the year-over-year average decline in U.S. crude oil benchmark pricing. 30 Management s discussion and analysis
33 Revenue Revenue represents the total of petroleum revenue, net of royalties and other revenue. Revenue for the year ended December 31, 2016 totalled $1.87 billion compared to $1.93 billion for the year ended December 31, Revenue for the year ended December 31, 2016 decreased primarily due to a decrease in blend sales revenue as a result of the year-over-year average decline in U.S. crude oil benchmark pricing. Net loss The Corporation recognized a net loss of $428.7 million for the year ended December 31, 2016 compared to a net loss of $1.2 billion for the year ended December 31, The net loss for the year ended December 31, 2016 was affected by lower bitumen realization, primarily as a result of the year-over-year average decline in U.S. crude oil benchmark pricing. The net loss for the year ended December 31, 2016 also included an $80.1 million impairment charge related to the Northern Gateway pipeline, an unrealized loss on commodity risk management of $30.3 million and other expenses primarily related to onerous contracts and severance totalling $64.1 million. These were partially offset by a net unrealized foreign exchange gain of $148.2 million on the Corporation s U.S. dollar denominated debt and U.S. dollar denominated cash and cash equivalents. The net loss for the year ended December 31, 2015 included a net unrealized foreign exchange loss of $785.3 million on U.S. dollar denominated debt and U.S. dollar denominated cash and cash equivalents. Total cash capital investment Total cash capital investment during the year ended December 31, 2016 totalled $137.2 million as compared to $257.2 million for the year ended December 31, Capital investment in 2016 was primarily directed towards sustaining capital activities as the Corporation had been focused on reducing capital spending until there is a sustained improvement in crude oil pricing. Outlook Summary of 2016 Guidance Guidance October 27, 2016 Annual Results Capital investment - $ millions $140 $137 Bitumen production - bbls/d 80,000 83,000 81,245 Non-energy operating costs - $/bbl $5.75 $6.50 $5.62 Cash capital investment incurred for 2016 was $137 million which was below the Corporation s most recent 2016 cash capital investment guidance of $140 million issued on October 27, Original capital guidance was issued December 4, 2015 for $328 million and reduced throughout 2016 as a result of continued focus on reducing capital spending until there was a sustained improvement in crude oil pricing. Annual bitumen production averaged 81,245 bbls/d, consistent with the Corporation s 2016 bitumen production guidance. MEG ENERGY 2016 ANNUAL REPORT 31
34 As a result of continued operating cost management and efficiency gains in 2016, annual non-energy operating costs were $5.62/bbl, representing a 2% reduction from the low end of the most recent 2016 guidance issued on October 27, Original guidance issued on December 4, 2015 had non-energy operating costs targeted to be in the range of $6.75 to $7.75 per barrel. Summary of 2017 Guidance Capital investment - $ millions $590 Bitumen production - bbls/d 80,000 82,000 Bitumen exit production - bbls/d 86,000 89,000 Non-energy operating costs - $/bbl $5.75 $6.75 On January 11, 2017, the Corporation announced a 2017 capital budget of $590 million of which approximately 55% is directed towards initiation of the emsagp growth project at Christina Lake Phase 2B, 35% towards sustaining and turnaround costs and the remainder towards supporting marketing, corporate and other initiatives. The Corporation expects to fund the 2017 capital program with net proceeds from the $518 million equity issuance completed on January 27, 2017, internally generated cash flow and $156 million of cash on hand as at December 31, The Corporation s 2017 annual bitumen production volumes are targeted to be in the range of 80,000 to 82,000 bbls/d. Exit production for 2017 is targeted to be in the range of 86,000 to 89,000 bbls/d. Non-energy operating costs are targeted to be in the range of $5.75 to $6.75 per barrel. 32 Management s discussion and analysis
35 Business environment The following table shows industry commodity pricing information and foreign exchange rates on a quarterly and year-to-date basis to assist in understanding the impact of commodity prices and foreign exchange rates on the Corporation s financial results: Year ended December Q4 Q3 Q2 Q1 Q4 Q3 Q2 Q1 Average Commodity Prices Crude oil prices Brent (US$/bbl) WTI (US$/bbl) WTI (C$/bbl) Differential Brent:WTI (US$/bbl) Differential Brent:WTI (%) 3.6% 9.0% 3.6% 4.3% 2.3% 4.7% 5.7% 9.3% 8.8% 11.8% WCS (C$/bbl) Differential WTI:WCS (US$/bbl) Differential WTI:WCS (C$/bbl) Differential WTI:WCS (%) 31.9% 27.7% 29.1% 30.0% 29.2% 42.6% 34.4% 28.8% 20.0% 30.2% Condensate prices Condensate at Edmonton (C$/bbl) Condensate at Edmonton as % of WTI 97.9% 96.6% 98.1% 95.9% 96.7% 102.8% 98.7% 95.2% 99.9% 93.8% Condensate at Mont Belvieu, Texas (US$/bbl) Condensate at Mont Belvieu, Texas as % of WTI 91.6% 92.7% 91.6% 91.6% 88.6% 95.8% 96.6% 88.9% 91.3% 94.6% Natural gas prices AECO (C$/mcf) Electric power prices Alberta power pool (C$/MWh) Foreign exchange rates C$ equivalent of 1 US$ - average C$ equivalent of 1 US$ - period end Crude oil pricing Brent crude is the primary world price benchmark for global light sweet crude oil. The Brent benchmark price averaged US$44.97 per barrel for the year ended December 31, 2016 compared to US$53.62 per barrel for the year ended December 31, Recent announcements arising out of a meeting between OPEC ( Organization of the Petroleum Exporting Countries ) and non-opec counterparties, held in the latter part of the fourth quarter of 2016, resulted in a slight increase in late fourth quarter prices. MEG ENERGY 2016 ANNUAL REPORT 33
36 The price of WTI is the current benchmark for mid-continent North American crude oil prices, at Cushing Oklahoma, and its Canadian dollar equivalent is the basis for determining royalties on the Corporation s bitumen sales. The WTI price averaged US$43.33 per barrel for the year ended December 31, 2016 compared to US$48.80 per barrel for the year ended December 31, Recent announcements arising out of a meeting between OPEC and non-opec counterparties, held in the latter part of the fourth quarter of 2016, resulted in a slight increase in late fourth quarter prices. The WCS benchmark reflects North American prices at Hardisty, Alberta. WCS is a blend of heavy oils, consisting of heavy conventional crude oils and bitumen, blended with sweet synthetic, light crude oil or condensate. WCS typically trades at a differential below the WTI benchmark price. The WTI:WCS differential averaged US$13.84 per barrel, or 31.9%, for the year ended December 31, 2016 compared to US$13.52 per barrel, or 27.7%, for the year ended December 31, In order to facilitate pipeline transportation, MEG uses condensate sourced throughout North America as diluent for blending with the Corporation s bitumen. Condensate prices, benchmarked at Edmonton, averaged $56.21 per barrel, or 97.9% of WTI, for the year ended December 31, 2016 compared to $60.30 per barrel, or 96.6% of WTI, for the year ended December 31, Condensate prices, benchmarked at Mont Belvieu, Texas, averaged US$39.68 per barrel, or 91.6% of WTI, for the year ended December 31, 2016 compared to US$45.23 per barrel, or 92.7% of WTI, for the year ended December 31, Natural gas prices Natural gas is a primary energy input cost for the Corporation, as it is used as fuel to generate steam for the SAGD process and to create electricity from the Corporation s cogeneration facilities. The AECO natural gas price averaged $2.25 per mcf for the year ended December 31, 2016 compared to $2.71 per mcf for the year ended December 31, Power prices Electric power prices impact the price that the Corporation receives on the sale of surplus power from the Corporation s cogeneration facilities. The Alberta power pool price averaged $18.19 per megawatt hour for the year ended December 31, 2016 compared to $33.40 per megawatt hour for the same period in The decline in the Alberta power pool price is primarily due to an overall surplus of power generation capacity in the province. Foreign exchange rates Changes in the value of the Canadian dollar relative to the U.S. dollar have an impact on the Corporation s blend sales revenue and diluent expense, as blend sales prices and diluent expense are determined by reference to U.S. benchmarks. Changes in the value of the Canadian dollar relative to the U.S. dollar also have an impact on principal and interest payments on the Corporation s U.S. dollar denominated debt. A decrease in the value of the Canadian dollar compared to the U.S. dollar has a positive impact on blend sales revenue and a negative impact on diluent expense and principal and interest payments. An increase in the value of the Canadian dollar has a negative impact on blend sales revenue and a positive impact on diluent expense and principal and interest payments. The Corporation recognizes net unrealized foreign exchange gains and losses on the translation of U.S. dollar denominated debt and U.S. dollar denominated cash and cash equivalents at each reporting date. As at December 31, 2016, the Canadian dollar, at a rate of , had increased in value by approximately 3% against the U.S. dollar compared to its value as at December 31, 2015, when the rate was Management s discussion and analysis
37 Other operating results Net marketing activity ($000) Petroleum revenue third party $ 205,790 $ 104,464 Purchased product and storage: Purchased product (202,135) (101,928) Marketing and storage arrangements - (27,687) (202,135) (129,615) Net marketing activity (1) $ 3,655 $ (25,151) (1) Net marketing activity is a non-gaap measure as defined in the NON-GAAP MEASURES section. Net marketing activity includes the Corporation s activities toward enhancing its ability to transport proprietary crude oil products to a wider range of markets in Canada, the United States and on tidewater. Accordingly, the Corporation has entered into marketing arrangements for rail, pipelines, transportation commitments and product storage arrangements. The intent of these arrangements is to maximize the value of all barrels sold into the marketplace. In the event that the Corporation is not utilizing these arrangements for proprietary purposes, MEG purchases and sells third-party crude oil and related products and enters into transactions to generate revenues to offset the costs of such marketing and storage arrangements. During the fourth quarter of 2015, the Corporation recognized a contract cancellation expense of $18.8 million primarily due to the termination of a marketing transportation contract. No expenses were incurred related to marketing and storage arrangements for the year ended December 31, Depletion and depreciation ($000) Depletion and depreciation expense $ 499,811 $ 467,422 Depletion and depreciation expense per barrel of production $ $ Depletion and depreciation expense for the year ended December 31, 2016 totalled $499.8 million compared to $467.4 million for the year ended December 31, Depletion and depreciation expense was $16.81 per barrel for the year ended December 31, 2016 compared to $16.00 per barrel for the year ended December 31, The increase in the depletion and depreciation expense per barrel was primarily due to an increase in the estimated future development costs associated with the Corporation s proved reserves and an increase in depreciable costs for the year ended December 31, 2016 compared to the year ended December 31, Impairment At December 31, 2016, the Corporation evaluated its investment in the right to participate in the Northern Gateway pipeline for impairment, in relation to the December 6, 2016 directive from the Government of Canada to the National Energy Board ( NEB ) to dismiss the project application. On June 18, 2014, Northern Gateway received certificates from the NEB permitting the construction of the oil pipeline subject to conditions. On June 30, 2016, the Federal Court of Appeal ( FCA ) quashed these certificates on the basis that the Crown s Phase IV Aboriginal MEG ENERGY 2016 ANNUAL REPORT 35
38 consultation process was inadequate. The FCA held that the hearing leading to the approved permits and the consultation conducted by Northern Gateway was properly done. On November 29, 2016, the Federal Government, rather than conducting further consultation with Aboriginal communities, announced that it would instruct the NEB to dismiss the application and on December 6, 2016, the NEB formalized this dismissal. As a result, the Corporation fully impaired its investment and has recognized an impairment charge of $80.1 million. Commodity risk management gain (loss) During the year ended December 31, 2016, the Corporation entered into commodity risk management contracts. The Corporation has not designated any of its commodity risk management contracts as hedges for accounting purposes. All commodity risk management contracts have been recorded at fair value with all changes in fair value recognized through net earnings (loss). Realized gains or losses on commodity risk management contracts are the result of contract settlements during the year. Unrealized gains or losses on commodity risk management contracts represent the change in the mark-to-market position of the unsettled commodity risk management contracts during the year ($000) Realized Unrealized Total Crude oil contracts (1) $ (9,888) $ (59,404) $ (69,292) Condensate contracts (2) 12,247 29,091 41,338 Commodity risk management gain (loss) $ 2,359 $ (30,313) $ (27,954) (1) Includes WTI fixed price, WTI collars and WCS fixed differential contracts. (2) Relates to condensate purchase contracts that effectively fix condensate prices at Mont Belvieu, Texas as a percentage of WTI (US$/bbl). The Corporation recognized an unrealized loss on commodity risk management contracts of $30.3 million and a realized gain on commodity risk management contracts of $2.4 million for the year ended December 31, Refer to the RISK MANAGEMENT section of this MD&A for further details. During 2015, the Corporation did not enter into any commodity risk management contracts. General and administrative ($000) General and administrative expense $ 96,241 $ 118,518 General and administrative expense per barrel of production $ 3.24 $ 4.06 General and administrative expense for the year ended December 31, 2016 was $96.2 million compared to $118.5 million for the year ended December 31, General and administrative expense was $3.24 per barrel for the year ended December 31, 2016 compared to $4.06 per barrel for the year ended December 31, General and administrative expense decreased primarily due to a reduction in staffing and the Corporation s continued focus on cost management in all areas of the business. 36 Management s discussion and analysis
39 Stock-based compensation ($000) Cash-settled $ 16,354 $ - Equity-settled 33,588 50,105 Stock-based compensation expense $ 49,942 $ 50,105 The fair value of compensation associated with the granting of stock options, restricted share units ( RSUs ), performance share units ( PSUs ) and directors share units (DSUs ) to officers, directors, employees and consultants is recognized by the Corporation as stock-based compensation expense. Fair values for equity-settled plans are determined using the Black-Scholes option pricing model. In June 2016, the Corporation granted RSUs and PSUs under a new cash-settled Restricted Share Unit Plan. RSUs generally vest over a three year period while PSUs generally vest on the third anniversary of the grant date, provided that the Corporation satisfies certain performance criteria identified by the Corporation s Board of Directors within a target range. Upon vesting of the RSUs and PSUs, the participants of the cash-settled RSU plan will receive a cash payment based on the fair value of the underlying share units at the vesting date. The cash-settled RSUs and PSUs are accounted for as liability instruments and are measured at fair value based on estimated vesting and the market value of the Corporation s common shares at each period end. Fluctuations in the fair value are recognized within stock-based compensation expense or capitalized to property, plant and equipment during the period in which they occur. Stock-based compensation expense for the year ended December 31, 2016 was $49.9 million compared to $50.1 million for the year ended December 31, Research and development ($000) Research and development expense $ 5,499 $ 7,497 Research and development expenditures related to the Corporation s research of crude quality improvement and related technologies have been expensed. Research and development expenditures were $5.5 million for the year ended December 31, 2016 compared to $7.5 million for the year ended December 31, MEG ENERGY 2016 ANNUAL REPORT 37
40 Foreign exchange loss (gain), net ($000) Unrealized foreign exchange loss (gain) on: Long-term debt $ (157,272) $ 852,422 Other 9,119 (67,112) Unrealized net loss (gain) on foreign exchange (148,153) 785,310 Realized loss (gain) on foreign exchange (3,242) 16,429 Foreign exchange loss (gain), net $ (151,395) $ 801,739 C$ equivalent of 1 US$ Beginning of year End of year The Corporation recognized a net foreign exchange gain of $151.4 million for the year ended December 31, 2016 compared to a net foreign exchange loss of $801.7 million for the year ended December 31, The net foreign exchange gain is primarily due to the translation of the U.S. dollar denominated debt as a result of strengthening of the Canadian dollar compared to the U.S. dollar by approximately 3% during the year ended December 31, During the year ended December 31, 2015, the Canadian dollar weakened in value by approximately 19%. Net finance expense ($000) Total interest expense $ 328,335 $ 313,411 Less capitalized interest - (56,449) Net interest expense 328, ,962 Debt extinguishment expense 28,845 - Accretion on provisions 7,150 5,663 Unrealized gain on derivative financial liabilities (1) (12,508) (13,289) Realized loss on interest rate swaps 4,548 5,858 Net finance expense $ 356,370 $ 255,194 Average effective interest rate (2) 5.8% 5.8% (1) Derivative financial liabilities include the 1% interest rate floor and interest rate swaps. (2) Defined as the weighted average interest rate applied to the U.S. dollar denominated senior secured term loan and senior unsecured notes outstanding, including the impact of interest rate swaps. Total interest expense, before capitalization, for the year ended December 31, 2016 was $328.3 million compared to $313.4 million for the year ended December 31, Total interest expense for the year ended December 31, 2016 was higher than the comparative 2015 period due to a weaker average Canadian dollar and its impact on U.S. dollar denominated interest expense. 38 Management s discussion and analysis
41 The Corporation capitalizes interest associated with qualifying assets. As a result of the reduction in the Corporation s 2016 capital expenditures, the Corporation did not capitalize interest during the year ended December 31, During the year ended December 31, 2015, the Corporation capitalized $56.5 million of interest. At December 31, 2016, the Corporation recognized $28.8 million of debt extinguishment expense associated with the planned redemption of the 6.5% Senior Unsecured Notes on March 15, 2017, under the comprehensive refinancing plan completed on January 27, 2017, as described in the Capital Resources section of this MD&A. The debt extinguishment expense is comprised of a redemption premium of $21.8 million and the associated remaining unamortized deferred debt issue costs of $7.0 million. Unrealized gain on derivative liabilities includes unrealized gains related to the change in fair value of the interest rate floor associated with the Corporation s senior secured term loan and the change in fair value of the Corporation s interest rate swap contracts. The Corporation recognized an unrealized gain on derivative financial liabilities of $12.5 million for the year ended December 31, 2016 compared to an unrealized gain of $13.3 million for the year ended December 31, The Corporation s interest rate swap contracts expired on September 30, The Corporation realized a loss on the interest rate swaps of $4.5 million for the year ended December 31, 2016 compared to a realized loss of $5.9 million for the year ended December 31, Other expenses ($000) Onerous contracts $ 47,866 $ 58,719 Severance and other 16,242 - Contract cancellation expense - 12,879 Other expenses $ 64,108 $ 71,598 The Corporation recognized other expenses of $64.1 million for the year ended December 31, 2016 compared to $71.6 million for the year ended December 31, For the year ended December 31, 2016, the Corporation recognized an onerous contracts expense of $47.9 million primarily due to a decrease in estimated future cash flow recoveries related to the onerous office lease provision. During the fourth quarter of 2015, the Corporation recognized $58.7 million relating to certain onerous Calgary office building lease contracts, determined as the difference between future lease obligations and estimated sublease recoveries. During the year ended December 31, 2016, severance and other expenses of $16.2 million were incurred. For the year ended December 31, 2015, the Corporation recognized contract cancellation expense of $12.9 million primarily relating to the termination of a marketing transportation contract, partially offset by a recovery of project cancellation costs recorded in the second quarter of MEG ENERGY 2016 ANNUAL REPORT 39
42 Income tax expense (recovery) ($000) Current income tax expense (recovery) $ 919 $ (1,200) Deferred income tax expense (recovery) (208,413) (90,733) Income tax expense (recovery) $ (207,494) $ (91,933) The Corporation recognized a current income tax expense of $0.9 million for the year ended December 31, 2016 relating to U.S. income tax associated with its operations in the United States. The Corporation s Canadian operations are not currently taxable. During the year ended December 31, 2015, the Corporation recognized a current income tax recovery of $1.2 million which was related to the refundable Alberta tax credit on Scientific Research and Experimental Development expenditures. The Corporation recognized a deferred income tax recovery of $208.4 million for the year ended December 31, 2016 compared to a deferred income tax recovery of $90.7 million for the year ended December 31, The Corporation s effective tax rate on earnings is impacted by permanent differences. The significant permanent differences are: The permanent difference due to the non-taxable portion of unrealized foreign exchange gains and losses arising on the translation of the U.S. dollar denominated debt. For the year ended December 31, 2016, the non-taxable gain was $78.6 million compared to a non-taxable loss of $426.2 million for the year ended December 31, Non-taxable stock-based compensation expense for equity-settled plans is a permanent difference. Stockbased compensation expense for equity-settled plans for the year ended December 31, 2016 was $33.6 million compared to $50.1 million for the year ended December 31, During the year ended December 31, 2016, a deferred tax recovery of $2.1 million was recognized relating to a tax deduction available for the fair market value of vested RSUs. During the year ended December 31, 2015, a deferred tax recovery of $5.5 million was recognized relating to a tax deduction available for the fair market value of vested RSUs. As at December 31, 2016, the Corporation had approximately $8.0 billion of available tax pools and $219.6 million of capital investment in respect of incomplete projects which will increase available tax pools upon completion of the projects. As at December 31, 2016, the Corporation has recognized a deferred income tax asset of $120.9 million, as estimated future taxable income is expected to be sufficient to realize the deferred income tax asset. As at December 31, 2016, the Corporation had not recognized the tax benefit related to $617.5 million of unrealized taxable capital foreign exchange losses. 40 Management s discussion and analysis
43 Summary of quarterly results The following table summarizes selected financial information for the Corporation for the preceding eight quarters: ($ millions, except per share amounts) Q4 Q3 Q2 Q1 Q4 Q3 Q2 Q1 Revenue (1) $ $ $ $ $ $ $ $ Net earnings (loss) (304.8) (108.6) (146.2) (297.3) (427.5) 63.4 (508.3) Per share basic (1.34) (0.48) (0.65) 0.58 (1.32) (1.90) 0.28 (2.27) Per share diluted (1.34) (0.48) (0.65) 0.58 (1.32) (1.90) 0.28 (2.27) (1) The total of Petroleum revenue, net of royalties and Other revenue as presented on the Consolidated Statement of Earnings (Loss) and Comprehensive Income (Loss). Revenue for the eight most recent quarters has been impacted by the significant fluctuations in blend sales pricing and increases in production. Net earnings (loss) during the periods noted was impacted by: increased blend sales volumes due to efficiency gains achieved through the continued implementation of emsagp at the Christina Lake Project during 2016, which has allowed additional wells to be placed into production; fluctuations in blend sales pricing due to significant changes in the price of WTI and the differential between WTI and the Corporation s AWB; changes in the value of the Canadian dollar relative to the U.S. dollar as blend sales prices are determined by reference to U.S. crude oil benchmark pricing; the cost of diluent due to Canadian and U.S. benchmark pricing, the timing of diluent inventory purchases and changes in the value of the Canadian dollar relative to the U.S. dollar; higher transportation expense due to the cost of transporting blend volumes from Edmonton to the U.S. Gulf Coast via the Flanagan-Seaway Pipeline; fluctuations in natural gas and power pricing; an increase in depletion and depreciation expense as a result of the increase in bitumen sales volumes, an increase in depreciable costs and higher estimated future development costs; an impairment charge related to the Corporation s investment in the right to participate in the Northern Gateway pipeline; foreign exchange gains and losses attributable to fluctuations in the rate of exchange between the Canadian and U.S. dollar in translating the Corporation s U.S. dollar denominated debt (net of U.S. dollar denominated cash and cash equivalents); fluctuations in interest expense due to fluctuations in the average Canadian dollar and its impact on U.S. dollar denominated interest expense; gains and losses on commodity risk management contracts entered into in 2016; and other expenses primarily related to changes in onerous contracts and severance costs. MEG ENERGY 2016 ANNUAL REPORT 41
44 Net capital investment ($000) Total cash capital investment $ 137,245 $ 257,178 Capitalized cash-settled stock-based compensation 2,491 - Capitalized interest - 56, , ,627 Dispositions - (41,827) Net capital investment $ 139,736 $ 271,800 Total cash capital investment for the year ended December 31, 2016 was $137.2 million, compared to $257.2 million for the year ended December 31, Total capital investment in 2016 was primarily directed towards sustaining capital activities, as the Corporation has been focused on reducing capital spending until there is a sustained improvement in crude oil pricing. During 2016, the Corporation began capitalizing the cost related to a new cash-settled stock-based compensation plan for employees directly involved in capital investing activities. During the year ended December 31, 2016, the Corporation capitalized $2.5 million of cash-settled stock-based compensation. The Corporation capitalizes interest associated with qualifying assets. As a result of the reduction in the Corporation s 2016 capital expenditures, the Corporation did not capitalize interest during the year ended December 31, During the year ended December 31, 2015, the Corporation capitalized $56.4 million of interest. During the fourth quarter of 2015, the Corporation divested of a non-core undeveloped oil sands asset for proceeds of $110.0 million. Liquidity and capital resources ($000) December 31, 2016 December 31, 2015 Cash and cash equivalents $ 156,230 $ 408,213 Senior secured term loan (December 31, 2016 US$1.236 billion; December 31, 2015 US$1.249 billion; due 2020) 1,658,906 1,727,924 US$2.5 billion revolver (due 2019) % senior unsecured notes (US$750.0 million; due 2021) 1,007,025 1,038, % senior unsecured notes (US$800.0 million; due 2023) 1,074,160 1,107, % senior unsecured notes (US$1.0 billion; due 2024) 1,342,700 1,384,000 Total debt (1),(2) $ 5,082,791 $ 5,257,124 (1) Total debt does not have a standardized meaning prescribed by IFRS and therefore may not be comparable to similar measures used by other companies. The Corporation uses this non-gaap measure to analyze leverage and liquidity. Total debt plus the debt redemption premium less current portion of the senior secured term loan, unamortized financial derivative liability discount and unamortized deferred debt issue costs is equal to longterm debt as reported in the Corporation s consolidated financial statements as at December 31, 2016 and the Corporation s consolidated financial statements as at December 31, Management s discussion and analysis
45 (2) On December 8, 2016, Fitch Ratings ( Fitch ) assigned the Corporation a first-time Long-Term Issuer Default Rating of B, and assigned a rating of BB to the Corporation s covenant-lite revolving credit facility and term loan and a rating of B to the Corporation s Senior Unsecured Notes. On January 12, 2017, Fitch assigned a BB rating to the Corporation s new second lien secured notes (see the Capital Resources section of this MD&A). Fitch s rating outlook is negative. On January 12, 2017, Standard & Poor s Ratings Services ( S&P ) assigned a BB+ rating to the Corporation s new second lien secured notes. On January 12, 2017, Moody s Investors Service ( Moody s ) upgraded the Corporation s Corporate Family Rating to B3 from Caa2, the Probability of Default Rating to B3-PD from Caa2-PD and the Corporation s Senior Unsecured Notes rating to Caa2 from Caa3. Moody s Speculative Grade Liquidity Rating was raised to SGL-1 from SGL-2. Moody s also assigned a rating of Ba3 to the Corporation s covenant-lite revolving credit facility and refinanced term loan and a rating of Caa1 to the new second lien secured notes. Moody s rating outlook was changed to stable from negative. Capital resources The Corporation s cash and cash equivalents balance totalled $156.2 million as at December 31, 2016 compared to $408.2 million as at December 31, The Corporation s cash and cash equivalents balance decreased primarily due to the use of cash for interest and principal payments and payments relating to capital investing activity. All of the Corporation s long-term debt is denominated in U.S. dollars. As a result of the increase in the value of the Canadian dollar relative to the U.S. dollar, long-term debt decreased to C$5.1 billion as at December 31, 2016 from C$5.2 billion as at December 31, On December 1, 2016, the Corporation filed a Canadian base shelf prospectus for common shares, debt securities, subscription receipts, warrants and units (together referred to as Securities ) in the amount of $1.5 billion. The Canadian base shelf prospectus allows for the issuance of these Securities in Canadian dollars or other currencies from time to time in one or more offerings. As at December 31, 2016, no Securities were issued under the Canadian base shelf prospectus. The Canadian base shelf prospectus expires on January 1, On January 27, 2017, the Corporation completed a comprehensive refinancing plan by way of the Corporation s Canadian base shelf prospectus dated December 1, The plan was comprised of the following four transactions: An extension of the maturity date on substantially all of the commitments under the Corporation s existing covenant-lite revolving credit facility from November 2019 to November The commitment amount of the five-year facility has been reduced from US$2.5 billion to US$1.4 billion. It has no financial covenants and is not subject to any borrowing base redetermination; The US$1.2 billion term loan has been refinanced to extend its maturity date from March 2020 to December The refinanced term loan will bear interest at an annual rate of LIBOR plus 3.5% with a LIBOR floor of 1%. The term loan was issued at a price equal to 99.75% of its face value; The existing US$750 million aggregate principal amount of 6.5% Senior Unsecured Notes, with a maturity date of March 2021, have been refinanced and replaced with new 6.5% second lien secured notes, issued at par, maturing January The existing 2021 notes will be redeemed with the proceeds from the second lien notes on March 15, 2017; and The Corporation raised C$518 million of equity, before underwriting fees and expenses, in the form of 66,815,000 subscription receipts at a price C$7.75 per subscription receipt on a bought deal basis from a syndicate of underwriters. As part of the closing, escrow release conditions for the subscription receipt offering have been satisfied and the subscription receipts have been converted into common shares. MEG ENERGY 2016 ANNUAL REPORT 43
46 In addition to the transactions noted above, on February 15, 2017, the Corporation extended the maturity date on the Corporation s current five-year guaranteed letter of credit facility, guaranteed by Export Development Canada, to November 2021 from November The guaranteed letter of credit facility has been reduced from US$500 million to US$440 million and as at December 31, 2016, US$318 million of letters of credit have been issued. Letters of credit under this facility do not consume capacity of the revolving credit facility. All of MEG s long-term debt, credit facility and the EDC facility are covenant-lite in structure, meaning they are free of any financial maintenance covenants and are not dependent on, nor calculated from, the Corporation s crude oil reserves. The first maturity of any of the Corporation s outstanding long-term debt obligations is in Management believes its current capital resources and its ability to manage cash flow and working capital levels will allow the Corporation to meet its current and future obligations, to make scheduled principal and interest payments, and to fund the other needs of the business for at least the next 12 months. However, no assurance can be given that this will be the case or that future sources of capital will not be necessary. The Corporation s cash flow and the development of projects are dependent on factors discussed in the RISK FACTORS section of this MD&A. The objectives of the Corporation s investment guidelines for surplus cash are to ensure preservation of capital and to maintain adequate liquidity to meet the Corporation s cash flow requirements. The Corporation only places surplus cash investments with counterparties that have an investment grade debt rating. The Corporation has experienced no material loss or lack of access to its cash in operating accounts, invested cash or cash equivalents. However, the Corporation can provide no assurance that access to its invested cash and cash equivalents will not be impacted by adverse conditions in the financial markets. While the Corporation monitors the cash balances in its operating and investment accounts according to its investment practices and adjusts the cash balances as appropriate, these cash balances could be impacted if the underlying financial institutions or corporations fail or are subject to other adverse conditions in the financial markets. Risk management Commodity price risk management Fluctuations in commodity prices and market conditions can impact the Corporation s financial performance, operating results, cash flows, expansion and growth opportunities, access to funding and the cost of borrowing. During 2016, the Corporation implemented a strategic commodity risk management program through the use of derivative financial instruments with the intent to increase the predictability of the Corporation s future cash flow. MEG s commodity risk management program is governed by a Risk Management Committee that follows guidelines and limits approved by the Board of Directors. The Corporation does not use financial derivatives for speculative purposes. To mitigate the Corporation s exposure to fluctuations in crude oil prices, the Corporation periodically enters into commodity risk management contracts to partially manage its exposure on blend sales and condensate purchases. The Corporation had the following commodity risk management contracts relating to crude oil sales outstanding: 44 Management s discussion and analysis
47 As at December 31, 2016 Volumes (bbls/d) Term Average Price (US$/bbl) Fixed Price: WTI Fixed Price 3,500 Jan 1, 2017 Jun 30, 2017 $ WTI Fixed Price 13,100 Jul 1, 2017 Dec 31, 2017 $ WCS Fixed Differential 18,000 Jan 1, 2017 Jun 30, 2017 $ (14.94) Collars: WTI Collars 49,250 Jan 1, 2017 Mar 31, 2017 $45.69 $54.76 WTI Collars 47,250 Apr 1, 2017 Jun 30, 2017 $45.71 $54.61 WTI Collars 28,000 Jul 1, 2017 Dec 31, 2017 $47.68 $58.53 The Corporation enters into commodity risk management contracts that effectively fix the average condensate prices at Mont Belvieu, Texas as a percentage of WTI (US$/bbl). The Corporation had the following commodity risk management contracts relating to condensate purchases outstanding: As at December 31, 2016 Volumes (bbls/d) Term Average % of WTI Mont Belvieu fixed % of WTI 15,150 Jan 1, 2017 Dec 31, % The Corporation has entered into the following commodity risk management contracts relating to crude oil sales subsequent to December 31, Subsequent to December 31, 2016 Volumes (bbls/d) Term Average Price (US$/bbl) Fixed Price: WTI Fixed Price 6,000 Mar 1, 2017 Jun 30, 2017 $ WTI Fixed Price 9,000 Jul 1, 2017 Dec 31, 2017 $ WCS Fixed Differential 26,943 Feb 1, 2017 Jun 30, 2017 $ (15.06) WCS Fixed Differential 28,000 Jul 1, 2017 Dec 31, 2017 $ (15.62) Collars: WTI Collars 2,500 Jul 1, 2017 Dec 31, 2017 $50.00 $59.00 Interest rate risk management During 2015 and during the first nine months of 2016 the Corporation had interest rate swap contracts in place to effectively fix the interest rate at approximately 4.4% on US$748.0 million of the $1.236 billion senior secured term loan. These interest rate swap contracts expired on September 30, MEG ENERGY 2016 ANNUAL REPORT 45
48 Cash flow summary ($000) Net cash provided by (used in): Operating activities $ (94,074) $ 112,158 Investing activities (131,111) (416,996) Financing activities (17,062) (17,020) Effect of exchange rate changes on cash and cash equivalents held in foreign currency (9,736) 73,974 Change in cash and cash equivalents $ (251,983) $ (247,884) Cash flow operating activities Net cash used in operating activities totalled $94.1 million for the year ended December 31, 2016 compared to net cash provided by operating activities of $112.2 million for the year ended December 31, The decrease in cash flow provided by operating activities is primarily due to lower bitumen realization, particularly in the first quarter of 2016, primarily as a result of the year-over-year average decline in U.S. crude oil benchmark pricing as well as the use of cash for quarterly interest payments. Cash flow investing activities Net cash used in investing activities was $131.1 million for the year ended December 31, 2016 compared to $417.0 million for the year ended December 31, The decrease in net cash used in investing activities is primarily due to a reduction of the Corporation s capital program in Cash flow financing activities Net cash used in financing activities was $17.1 million for the year ended December 31, 2016 compared to $17.0 million for the year ended December 31, Net cash used in financing activities is comprised of debt principal payments. Shares outstanding As at December 31, 2016, the Corporation had the following share capital instruments outstanding or exercisable: Outstanding Common shares 226,467,107 Convertible securities Stock options (1) 9,281,186 Equity-settled RSUs and PSUs 1,655,606 (1) 5,816,854 stock options were exercisable as at December 31, As at February 21, 2017, the Corporation had 293,282,107 common shares, 8,950,363 stock options and 1,559,986 equity-settled restricted share units and equity-settled performance share units outstanding and 5,663,650 stock options exercisable. The Corporation s common shares have increased as a result of the issuance of 66,815,000 common shares pursuant to the $518 million equity issuance which closed on January 27, 2017 as outlined in the Capital Resources section of this MD&A. 46 Management s discussion and analysis
49 Contractual obligations and commitments The information presented in the table below reflects management s estimate of the contractual maturities of the Corporation s obligations. These maturities may differ significantly from the actual maturities of these obligations. In particular, debt under the senior secured credit facilities may be retired earlier due to mandatory repayments or redemptions. ($000) Thereafter Long-term debt (1) $ 39,267 $ 17,455 $ 17,455 $ 1,606,541 $ 1,007,025 $ 2,416,860 Interest on long-term debt (1) 289, , , , , ,659 Decommissioning obligation (2) 3,097 6,252 7,795 7,956 2, ,029 Transportation and storage (3) 178, , , , ,293 2,997,998 Office lease rentals (4) 33,640 32,198 32,228 33,144 33, ,543 Diluent purchases (5) 189,721 20,725 20,725 20,782 20,725 37,986 Other commitments (6) 35,323 8,440 11,657 12,354 11,552 74,077 Total $ 769,620 $ 577,269 $ 571,344 $ 2,156,453 $ 1,519,470 $ 6,841,152 (1) This represents the scheduled principal repayments of the senior secured term loan and the senior unsecured notes, debt redemption premium and associated interest payments based on interest and foreign exchange rates in effect on December 31, (2) This represents the undiscounted future obligations associated with the decommissioning of the Corporation s crude oil, transportation and storage assets. (3) This represents transportation and storage commitments from 2017 to 2042, including various pipeline commitments which are awaiting regulatory approval. (4) This represents the future lease commitments for the Calgary Corporate office. (5) This represents the future commitments associated with the Corporation s diluent purchases. (6) This represents the future commitments associated with the Corporation s capital program and other operating and maintenance commitments. Non-GAAP measures Certain financial measures in this MD&A including: net marketing activity, funds flow, adjusted funds flow, operating loss and operating cash flow are non-gaap measures. These terms are not defined by IFRS and, therefore, may not be comparable to similar measures provided by other companies. These non-gaap financial measures should not be considered in isolation or as an alternative for measures of performance prepared in accordance with IFRS. Net marketing activity Net marketing activity is a non-gaap measure which the Corporation uses to analyze the returns on the sale of thirdparty crude oil and related products through various marketing and storage arrangements. Net Marketing Activity represents the Corporation s third-party petroleum sales less the cost of purchased product and related marketing and storage arrangements. Petroleum revenue third party is disclosed in Note 17 in the Notes to the Consolidated Financial Statements and purchased product and storage is presented as a line item on the Consolidated Statement of Earnings (Loss) and Comprehensive Income (Loss). MEG ENERGY 2016 ANNUAL REPORT 47
50 Funds flow and adjusted funds flow Prior to the fourth quarter of 2016, the Corporation reported cash flow from (used in) operations as a non-gaap measure. Beginning in the fourth quarter of 2016, the Corporation changed the label of this non-gaap measure to funds flow and adjusted funds flow. The Corporation believes that this labelling and presentation better distinguishes these measures from the IFRS measurement net cash provided by (used in) operating activities. Funds flow and adjusted funds flow, previously referred to as cash flow from (used in) operations, are non-gaap measures utilized by the Corporation to analyze operating performance and liquidity. Funds flow excludes the net change in non-cash operating working capital while the IFRS measurement net cash provided by (used in) operating activities includes these items. Adjusted funds flow excludes the net change in non-cash operating working capital, net change in other liabilities, contract cancellation expense and decommissioning expenditures while the IFRS measurement net cash provided by (used in) operating activities includes these items. Funds flow and adjusted funds flow are not intended to represent net cash provided by (used in) operating activities calculated in accordance with IFRS. Funds flow and adjusted funds flow are reconciled to net cash provided by (used in) operating activities in the table below. ($000) Net cash provided by (used in) operating activities $ (94,074) $ 112,158 Net change in non-cash operating working capital items 25,061 (77,991) Funds flow (69,013) 34,167 Adjustments: Net change in other liabilities 6, Contract cancellation expense - 12,879 Decommissioning expenditures 1,290 1,873 Adjusted funds flow $ (61,607) $ 49,460 Operating loss Operating loss is a non-gaap measure which the Corporation uses as a performance measure to provide comparability of financial performance between periods by excluding non-operating items. Operating loss is defined as net loss as reported, excluding unrealized foreign exchange gains and losses, unrealized gains and losses on derivative financial instruments, impairment charges, gains and losses on disposition of assets, unrealized gains and losses on risk management, debt extinguishment expense, contract cancellation expense, onerous contracts, insurance proceeds and the respective deferred tax impact on these adjustments. Operating loss is reconciled to Net loss, the nearest IFRS measure, in the table below. 48 Management s discussion and analysis
51 ($000) Net loss $ (428,726) $ (1,169,671) Adjustments: Unrealized net loss (gain) on foreign exchange (1) (148,153) 785,310 Unrealized gain on derivative financial instruments (2) (12,508) (13,289) Impairment charge 80,072 - Gain on disposition of assets (3) - (68,192) Unrealized loss on risk management (4) 30,313 - Debt extinguishment expense (5) 28,845 - Contract cancellation expense - 12,879 Onerous contracts expense (6) 47,866 58,719 Insurance proceeds (7) (4,391) - Deferred tax expense (recovery) relating to these adjustments (48,416) 19,870 Operating loss $ (455,098) $ (374,374) (1) Unrealized net foreign exchange gains and losses result from the translation of U.S. dollar denominated long-term debt and cash and cash equivalents using period-end exchange rates. (2) Unrealized gains and losses on derivative financial instruments result from the interest rate floor on the Corporation s long-term debt and interest rate swaps entered into to effectively fix a portion of its variable rate long-term debt. (3) A gain related to the sale of a non-core undeveloped oil sands asset in the fourth quarter of (4) Unrealized gains or losses on commodity risk management contracts represent the change in the mark-to-market position of the unsettled commodity risk management contracts during the period. (5) At December 31, 2016, the Corporation recognized $28.8 million of debt extinguishment expense associated with the planned redemption of the 6.5% Senior Unsecured Notes on March 15, 2017, under the comprehensive refinancing plan completed on January 27, (6) During 2016, onerous contracts expenses were recognized primarily due to changes in estimated future cash flows related to the onerous office lease provision. (7) Includes insurance proceeds related to the small fire that occurred during the first quarter of 2016, which caused damage to the Sulphur Recovery Unit at the Corporation s Christina Lake facility. Operating cash flow Operating cash flow is a non-gaap measure widely used in the oil and gas industry as a supplemental measure of a company s efficiency and its ability to fund future capital investments. The Corporation s operating cash flow is calculated by deducting the related diluent expense, transportation, field operating costs, royalties and realized commodity risk management gains or losses from proprietary blend sales revenue and power revenue. The per-unit calculation of operating cash flow, defined as cash operating netback, is calculated by deducting the related diluent expense, transportation, operating expenses, royalties and realized commodity risk management gains or losses from proprietary blend revenue and power revenue, on a per barrel of bitumen sales volume basis. MEG ENERGY 2016 ANNUAL REPORT 49
52 Critical accounting policies and estimates The Corporation s critical accounting estimates are those estimates having a significant impact on the Corporation s financial position and operations and that require management to make judgments, assumptions and estimates in the application of IFRS. Judgments, assumptions and estimates are based on historical experience and other factors that management believes to be reasonable under current conditions. As events occur and additional information is obtained, these judgments, assumptions and estimates may be subject to change. The following are the critical accounting estimates used in the preparation of the Corporation s consolidated financial statements. Property, plant and equipment Items of property, plant and equipment, including oil sands property and equipment, are measured at cost less accumulated depletion and depreciation and accumulated impairment losses. Capitalized costs associated with the Corporation s field production assets, including estimated future development costs, are depleted using the unit-of-production method based on estimated proved reserves. The Corporation s oil sands facilities are depreciated on a unit-of-production method based on the facilities productive capacity over their estimated remaining useful lives. The costs associated with the Corporation s interest in transportation and storage assets are depreciated on a straight-line basis over the estimated remaining useful lives of the assets. The determination of future development costs, proved reserves, productive capacity and remaining useful lives are subject to significant judgments and estimates. Exploration and evaluation assets Pre-exploration costs incurred before the Corporation obtains the legal right to explore an area are expensed. Exploration and evaluation costs associated with the Corporation s oil sands activities are capitalized. These costs are accumulated in cost centres pending determination of technical feasibility and commercial viability at which point the costs are transferred to property, plant and equipment. If it is determined that an exploration and evaluation asset is not technically feasible or commercially viable and the Corporation decides not to continue the exploration and evaluation activity, the unrecoverable costs are charged to expense. The technical feasibility and commercial viability of extracting a mineral resource is considered to be determinable when proved or probable reserves are determined to exist. The determination of proved or probable reserves is dependent on reserve evaluations which are subject to significant judgments and estimates. Impairments The carrying amounts of the Corporation s non-financial assets are reviewed at each reporting date to determine whether there is any indication of impairment. If any such indication exists, the asset s recoverable amount is estimated. An impairment test is completed each year for intangible assets that are not yet available for use. Exploration and evaluation assets are assessed for impairment when they are reclassified to property, plant and equipment or if facts and circumstances suggest that the carrying amount exceeds the recoverable amount. For the purpose of impairment testing, property, plant and equipment assets are grouped into cash-generating units ( CGUs ). The recoverable amount of an asset or a CGU is the greater of its value in use and its fair value less costs of disposal. Exploration and evaluation assets are assessed for impairment within the aggregation of all CGUs in that segment. 50 Management s discussion and analysis
53 In assessing value in use, the estimated future cash flows are discounted to their present value using a pre-tax discount rate that reflects current market assessments of the time value of money and the risks specific to the asset. In determining fair value less costs of disposal, recent market transactions are taken into account if available. In the absence of such transaction, an appropriate valuation model is used. An impairment loss is recognized if the carrying amount of an asset or its CGU exceeds its estimated recoverable amount. Impairment losses are recognized within net earnings during the period in which they arise. Impairment losses recognized in respect of CGUs are allocated to reduce the carrying amounts of the assets in the CGU on a pro-rata basis. Impairment losses recognized in prior years are assessed at each reporting date for any indication that the loss has decreased or no longer exists. An impairment loss is reversed if there has been a change in the estimate used to determine the recoverable amount. An impairment loss is reversed only to the extent that the asset s carrying amount does not exceed the carrying amount that would have been determined, net of depletion and depreciation, if no impairment loss had been recognized. Bitumen reserves The estimation of reserves involves the exercise of judgment. Forecasts are based on engineering data, estimated future prices, expected future rates of production and the cost and timing of future capital expenditures, all of which are subject to many uncertainties and interpretations. The Corporation expects that over time its reserves estimates will be revised either upward or downward based on updated information such as the results of future drilling, testing and production. Reserves estimates can have a significant impact on net earnings, as they are a key component in the calculation of depletion and depreciation and for determining potential asset impairment. The Corporation s reserves estimates are evaluated annually by independent qualified reserve evaluators. Joint operations Judgment is required to determine whether an interest the Corporation holds in a joint arrangement should be classified as a joint operation or joint venture. The determination includes an assessment as to whether the Corporation has the rights to the assets and obligations for the liabilities of the arrangement or the rights to the net assets. The Corporation holds an undivided interest in Access Pipeline. As a result, the Corporation presents its proportionate share of the assets, liabilities, revenues and expenses of Access Pipeline on a line-by-line basis in the consolidated financial statements. Decommissioning provision The Corporation recognizes an asset and a liability for any existing decommissioning obligations associated with the dismantling, decommissioning and restoration of property, plant and equipment and exploration and evaluation assets. The provision is determined by estimating the fair value of the decommissioning obligation at the end of the period. This fair value is determined by estimating expected timing and cash flows that will be required for future dismantlement and site restoration, and then calculating the present value of these future payments using a creditadjusted risk-free rate specific to the liability. Any change in timing or amount of the cash flows subsequent to initial recognition results in a change in the asset and liability, which then impacts the depletion and depreciation on the asset and accretion charged on the liability. Estimating the timing and amount of third party cash flows to settle these obligations is inherently difficult and is based on third party estimates and management s experience. MEG ENERGY 2016 ANNUAL REPORT 51
54 Onerous contracts The Corporation recognizes a provision for onerous contracts when the unavoidable costs of meeting the obligations under the contract exceed the economic benefits expected to be derived from the contract. The determination of when to record a provision for an onerous contract is a complex process that involves management judgment about outcomes of future events, and estimates concerning the nature, extent and timing of expected future cash flows and discount rates related to the contract. The provision is determined by estimating the present value of the minimum future contractual payments that the Corporation is obligated to make under the non-cancellable onerous contracts reduced by estimated recoveries. Deferred income taxes The Corporation follows the liability method of accounting for income taxes. Deferred income taxes are recognized in respect of temporary differences between the carrying amounts of assets and liabilities for financial reporting purposes and the amounts used for taxation purposes. Deferred income taxes are measured at the tax rates that are expected to be applied to temporary differences when they reverse, based on the laws that have been enacted or substantively enacted at the reporting date. The periods in which timing differences reverse are impacted by future earnings and capital expenditures. Rates are also affected by changes to tax legislation. Income taxes are recognized in net earnings except to the extent that they relate to items recognized directly in shareholders equity, in which case the income taxes are recognized in shareholders equity. The Corporation also makes interpretations and judgments on the application of tax laws for which the eventual tax determination may be uncertain. To the extent that interpretations change, there may be a significant impact on the consolidated financial statements. Stock-based compensation The fair values of equity-settled and cash-settled share-based compensation plans are estimated using the Black-Scholes options pricing model. These estimates are based on the share price at the date of grant and on several assumptions, including the risk-free interest rate, the future forfeiture rate, the expected volatility of the Corporation s share price and the future attainment of performance criteria. Accordingly, these estimates are subject to measurement uncertainty. Derivative financial instruments The Corporation may utilize derivative financial instruments to manage commodity price, foreign currency and interest rate exposures. These financial instruments are not used for trading or speculative purposes. The fair values of derivative financial instruments are estimated at the end of each reporting period based on expectations of future cash flows associated with the derivative instrument. Estimates of future cash flows are based on forecast commodity prices, interest rates and foreign exchange rates expected to be in effect over the remaining life of the contract. Any subsequent changes in these rates will impact the amounts ultimately recognized in relation to the derivative instruments. 52 Management s discussion and analysis
55 Transactions with related parties The Corporation did not enter into any significant related party transactions during the year ended December 31, 2016 and December 31, 2015, other than compensation of key management personnel. The Corporation considers directors and executive officers of the Corporation as key management personnel. ($000) Salaries and short-term employee benefits $ 9,117 $ 8,710 Share-based compensation 12,006 13,323 Termination benefits 1,617 - $ 22,740 $ 22,033 Off-balance sheet arrangements As at December 31, 2016 and December 31, 2015, the Corporation did not have any off-balance sheet arrangements. The Corporation has certain operating or rental lease agreements, as disclosed in the Contractual Obligations and Commitments section of this MD&A, which are entered into in the normal course of operations. Payments of these leases are included as an expense as incurred over the lease term. No asset or liability value had been assigned to these leases as at December 31, 2016 and December 31, New accounting standards There were no new accounting standards adopted during the year ended December 31, Accounting standards issued but not yet applied The IASB has issued the following standards which are not yet effective: On January 19, 2016, the IASB issued amendments to IAS 12, Income Taxes, relating to the recognition of deferred tax assets for unrealized losses. The amendments are effective for annual periods beginning on or after January 1, 2017, with early adoption permitted. Amendments to IAS 12 will be applied on a retrospective basis by the Corporation on January 1, The adoption of this amended standard is not expected to have a material impact on the Corporation s consolidated financial statements. On January 29, 2016, the IASB issued amendments to IAS 7, Statement of Cash Flows, as part of its disclosure initiative. The amendments require an entity to disclose changes in liabilities arising from financing activities. The amendments are effective for annual periods beginning on or after January 1, 2017, with early adoption permitted. Amendments to IAS 7 will be applied by the Corporation on January 1, The adoption of this amended standard will have required disclosure impacts that enable users of financial statements to evaluate changes in liabilities arising from financing activities on the Corporation s consolidated financial statements. On June 20, 2016, the IASB issued amendments to IFRS 2, relating to classification and measurement of particular share-based payment transactions. The amendments are effective for periods beginning on or after January 1, The Corporation is currently assessing the impact of the adoption of these amendments on the Corporation s consolidated financial statements. MEG ENERGY 2016 ANNUAL REPORT 53
56 In January 2016, the IASB issued IFRS 16 Leases, which will replace IAS 17 Leases. Under IFRS 16, a single recognition and measurement model will apply for lessees, which will require recognition of lease assets and lease obligations on the balance sheet. The standard eliminates the classification of leases as either operating leases or finance leases for lessees, essentially treating all leases as finance leases. Short-term leases and leases for low-value assets are exempt from recognition and will continue to be treated as operating leases. The accounting requirements for lessors is substantially unchanged and a lessor will continue to classify leases as either finance leases or operating leases, but disclosure requirements are enhanced. The standard is effective for annual periods beginning on or after January 1, 2019, with early adoption permitted if IFRS 15 has been adopted. The standard may be applied retrospectively or using a modified retrospective approach. IFRS 16 will be adopted by the Corporation on January 1, 2019 and the Corporation is currently assessing and evaluating the impact of the standard on the consolidated financial statements. In May 2014, the IASB issued IFRS 15 Revenue From Contracts With Customers, which will replace IAS 11 Construction Contracts and IAS 18 Revenue and the related interpretations on revenue recognition. IFRS 15 provides a comprehensive revenue recognition and measurement framework that applies to all contracts with customers. The new standard is effective for annual periods beginning on or after January 1, 2018 with early adoption permitted. IFRS 15 will be adopted by the Corporation on January 1, 2018 and the Corporation is currently assessing and evaluating the impact of the standard on the consolidated financial statements. In July 2014, the IASB issued IFRS 9 Financial Instruments, which is intended to replace IAS 39 Financial Instruments: Recognition and Measurement. IFRS 9 uses a single approach to determine whether a financial asset is measured at amortized cost or fair value, replacing the multiple rules in IAS 39. The accounting treatment of financial liabilities in IFRS 9 is essentially unchanged from IAS 39, except for financial liabilities designated at fair value through profit or loss, whereby an entity can recognize the portion of the change in fair value related to the change in the entity s own credit risk through other comprehensive income rather than net earnings. The standard also introduces a new expected credit loss impairment model for financial assets. In addition, IFRS 9 incorporates new hedge accounting requirements that more closely aligns with risk management activities. IFRS 9 is effective for annual periods beginning on or after January 1, 2018 with early adoption permitted. IFRS 9 will be adopted by the Corporation on January 1, 2018 and the Corporation is currently assessing and evaluating the impact of the standard on the consolidated financial statements. Risk factors The Corporation s primary focus is on the ongoing development and operation of its oil sands assets. In developing and operating these assets, the Corporation is and will be subject to many risks, including the risks which have been categorized below as construction risks, operations risks and project development risks. Further information regarding the risk factors which may affect the Corporation is contained in the most recently filed Annual Information Form ( AIF ), which is available on the Corporation s website at and is also available on the SEDAR website at 54 Management s discussion and analysis
57 Risks arising from construction activities Cost and schedule risk Additional phases of development of the Christina Lake Project and the development of the Corporation s other projects may suffer from delays, cancellation, interruptions or increased costs due to many factors, some of which may be beyond the Corporation s control, including: engineering, construction and/or procurement performance falling below expected levels of output or efficiency; denial or delays in receipt of regulatory approvals, additional requirements imposed by changes in Provincial and Federal laws or non-compliance with conditions imposed by regulatory approvals; labour disputes or disruptions, declines in labour productivity or the unavailability of skilled labour; increases in the cost of labour and materials; and changes in project scope or errors in design. If any of the above events occur, they could have a material adverse effect on the Corporation s ability to continue to develop the Christina Lake Project, the Corporation s facilities or the Corporation s other future projects and facilities, which would materially adversely affect its business, financial condition and results of operations. Risks arising from operations Operating risk The operation of the Corporation s oil sands properties and projects are and will continue to be subject to the customary hazards associated with recovering, transporting and processing hydrocarbons, such as fires, severe weather, natural disasters (including wildfires), explosions, gaseous leaks, migration of harmful substances, blowouts and spills. A casualty occurrence might result in the loss of equipment or life, as well as injury, property damage or the interruption of the Corporation s operations. The Corporation s insurance may not be sufficient to cover all potential casualties, damages, losses or disruptions. Losses and liabilities arising from uninsured or under-insured events could have a material adverse effect on the Corporation s business, financial condition and results of operations. Operating results The Corporation s operating results are affected by many factors. The principal factors, amongst others, which could affect MEG s operating results include: a substantial decline in oil, bitumen or electricity prices, due to a lack of infrastructure or otherwise; lower than expected reservoir performance, including, but not limited to, lower oil production rates and/or higher steam-to-oil ratios; a lack of access to, or an increase in, the cost of diluent; an increase in the cost of natural gas; the reliability and maintenance of the Access Pipeline, Stonefell Terminal and MEG s other facilities; the need to repair existing horizontal wells, or the need to drill additional horizontal wells; MEG ENERGY 2016 ANNUAL REPORT 55
58 the ability and cost to transport bitumen, diluent and bitumen diluent blends, and the cost to dispose of certain by-products; increased royalty payments resulting from changes in the regulatory regime; a lack of sufficient pipeline or electrical transmission capacity, and the effect that an apportionment may have on MEG s access to such capacity; the cost of labour, materials, services and chemicals used in MEG s operations; and the cost of compliance with existing and new regulations. Labour risk The Corporation depends on its management team and other key personnel to run its business and manage the operation of its projects. The loss of any of these individuals could adversely affect the Corporation s operations. Due to the specialized nature of the Corporation s business, the Corporation believes that its future success will also depend upon its ability to continue to attract, retain and motivate highly skilled management, technical, operations and marketing personnel. Project development risks Reliance on third parties The Christina Lake Project and the Corporation s future projects will depend on the successful operation and the adequate capacities of certain infrastructure owned and operated by third parties or joint ventures with third parties, including: pipelines for the transport of natural gas, diluent and blended bitumen; power transmission grids supplying and exporting electricity; and other third-party transportation infrastructure such as roads, rail, terminals and airstrips. The failure or lack of any or all of the infrastructure described above will negatively impact the operation of the Christina Lake Project and MEG s future projects, which in turn, may have a material adverse effect on MEG s business, results of operations and financial condition. Reserves and resources There are numerous uncertainties inherent in estimating quantities of in-place bitumen reserves and resources, including many factors beyond the Corporation s control. In general, estimates of economically recoverable bitumen reserves and resources and the future net cash flow therefrom are based upon a number of factors and assumptions made as of the date on which the reserve and resource estimates were determined, such as geological and engineering estimates which have inherent uncertainties, the effects of regulation by governmental agencies, and estimates of future commodity prices and operating costs, all of which may vary considerably from actual results. All such estimates are, to some degree, uncertain and classifications of reserves and resources are only attempts to define the degree of uncertainty involved. For these reasons, estimates of the economically recoverable bitumen, the classification of such reserves and resources based on risk of recovery and estimates of future net revenues expected therefrom, prepared by different engineers or by the same engineers at different times, may vary substantially. 56 Management s discussion and analysis
59 MEG retained GLJ Petroleum Consultants Ltd. as the Corporation s independent qualified reserve evaluator to evaluate and prepare a report on the Corporation s reserves with an effective date of December 31, 2016 and a preparation date of February 2, 2017 ( GLJ Report ). Although third parties have prepared the GLJ Report and other reviews, reports and projections relating to the viability and expected performance of the Christina Lake Project, the Surmont Project, the May River Regional Project and the Growth Properties, the GLJ Report, the reviews, reports and projections and the assumptions on which they are based may not, over time, prove to be accurate. Actual production and cash flow derived from the Corporation s oil sands leases may vary from the GLJ Report and other reviews, reports and projections. Financing risk Significant amounts of capital will be required to develop future phases of the Christina Lake Project, the Surmont Project and the Growth Properties. At present, cash flow from the Corporation s operations is largely dependent on the performance of a single project and a major source of funds available to the Corporation is the issuance of additional equity or debt. Capital requirements are subject to capital market risks, including the availability and cost of capital. There can be no assurance that sufficient capital will be available or be available on acceptable terms or on a timely basis, to fund the Corporation s capital obligations in respect of the development of its projects or any other capital obligations it may have. The Corporation may not generate sufficient cash flow from operations and may not have additional equity or debt available to it in amounts sufficient to enable it to make payments with respect to its indebtedness or to fund its other liquidity needs. In these circumstances, the Corporation may need to refinance all or a portion of its indebtedness on or before maturity. The Corporation may not be able to refinance any of its indebtedness on commercially reasonable terms or at all. Commodity price risk The Corporation s business, financial condition, results of operations and cash flow are dependent upon the prevailing prices of its bitumen blend, condensate, power and natural gas. Prices of these commodities have historically been extremely volatile and fluctuate significantly in response to regional, national and global supply and demand, and other factors beyond the Corporation s control. Declines in prices received for the Corporation s bitumen blend could materially adversely affect the Corporation s business, financial position, results of operations and cash flow. In addition, any prolonged period of low bitumen blend prices or high natural gas or condensate prices could result in a decision by the Corporation to suspend or reduce production. Any suspension or reduction of production would result in a corresponding decrease in the Corporation s revenues and could materially impact the Corporation s ability to meet its debt service obligations. If over-the-counter derivative structures are employed to mitigate commodity price risk, risks associated with such products, including counterparty risk, settlement risk, basis risk, liquidity risk and market risk, could impact or negate the hedging strategy, which would have a negative impact on the Corporation s financial position, earnings and cash flow. MEG ENERGY 2016 ANNUAL REPORT 57
60 Interest rate risk The Corporation has obtained certain credit facilities to finance a portion of the capital costs of the Christina Lake Project and to fund the Corporation s other development and acquisition activities. Variations in interest rates could result in significant changes to debt service requirements and would affect the financial results of the Corporation. If over-the-counter derivative structures are employed to mitigate interest rate risk, risks associated with such products, including counterparty risk, settlement risk, basis risk, liquidity risk and market risk, could impact or negate the hedging strategy, which would have a negative impact on the Corporation s financial position, earnings and cash flow. Foreign currency risk The Corporation s credit facilities and high yield notes are denominated in U.S. dollars and prices of the Corporation s bitumen blend are generally based on U.S. dollar market prices. Fluctuations in U.S. and Canadian dollar exchange rates may cause a negative impact on revenue, costs and debt service obligations and may have a material adverse impact on the Corporation. If over-the-counter derivative structures are employed to mitigate foreign currency risk, risks associated with such products, including counterparty risk, settlement risk, basis risk, liquidity risk and market risk, could impact or negate the hedging strategy, which would have a negative impact on the Corporation s financial position, earnings and cash flow. Regulatory and environmental risk The oil and gas industry in Canada, including the oil sands industry, operates under Canadian federal, provincial and municipal legislation and regulations. Future development of the Christina Lake Project, the Surmont Project, the May River Regional Project and the Growth Properties is dependent on the Corporation maintaining its current oil sands leases and licences and receiving required regulatory approvals and permits on a timely basis. The Government of Alberta has initiated a process to control cumulative environment effects of industrial development through the Lower Athabasca Regional Plan ( LARP ). While the LARP has not had a significant effect on the Corporation, there can be no assurance that changes to the LARP or future laws or regulations will not adversely impact the Corporation s ability to develop or operate its projects. The Corporation is committed to meeting its responsibilities to protect the environment and fully comply with all environmental laws and regulations. Alberta regulates emissions of carbon dioxide, methane, nitrous oxide and other greenhouse gases ( GHG ), and Canada s federal government has proposed significant extensions to its GHG regulatory requirements. The direct and indirect costs of the various regulations, existing, proposed and future, may adversely affect MEG s business, operations and financial results. The emission reduction compliance obligations required under existing and future federal and provincial industrial air pollutant and GHG emission reduction targets and requirements, together with emission reduction requirements in future regulatory approvals, may not be technically or economically feasible to implement for MEG s bitumen recovery and cogeneration activities. Any failure to meet MEG s emission reduction compliance obligations may materially adversely affect MEG s business and result in fines, penalties and the suspension of operations. 58 Management s discussion and analysis
61 Alberta Climate Leadership Plan The Corporation is subject to the Specified Gas Emitters Regulation (the SGER ), which imposes greenhouse gas emissions intensity limits and reduction requirements for owners of facilities that emit 100,000 tonnes or more per year of greenhouse gas. Recent amendments to the SGER have increased the maximum emission intensity reduction requirement for facility owners from 12% to 15% in 2016 and to 20% starting in Additionally, one of the options for complying with the SGER is for facility owners to purchase technology fund credits. In June 2016, the Government of Alberta increased the price for such credits from $15 per tonne to $20 per tonne for 2016 and to $30 per tonne beginning in In November 2015, the Government of Alberta announced its climate leadership plan (the Plan ) and released to the public the climate leadership report to the Minister of Environment and Parks (the Report ) that it commissioned from the Climate Change Advisory Panel and on which the Plan is largely based. The Plan highlights four key strategies that the Government of Alberta will implement to address climate change: (1) the complete phase-out of coal-fired sources of electricity by 2030; (2) implementing an Alberta economy-wide price on greenhouse gas emissions of $30 per tonne; (3) capping oil sands emissions to a province-wide total of 100 megatonnes per year (compared to current emissions of approximately 70 megatonnes per year), with certain exceptions for cogeneration power sources and new upgrading capacity; and (4) reducing methane emissions from oil and gas activities by 45% by Certain details regarding how the Plan will be implemented, for example, the carbon levy under the Climate Leadership Act, have been released. The Oil Sands Emissions Limit Act has been enacted but it does not obligate oil sands producers until a regulatory system is designed and implemented under the regulations. Many details regarding how the Plan will be implemented have not been released. No assurance can be given that environmental laws and regulations, including the implementation of the Plan, will not result in a curtailment of the Corporation s production or a material increase in the Corporation s costs of production, development or exploration activities or otherwise have a material adverse effect on the Corporation s results of operations, financial condition and prospects. The Corporation believes that it is reasonably likely that the trend towards stricter standards in environmental legislation will continue and anticipates that capital and operating costs may increase as a result of more stringent environmental laws. The legislated cap on oil sands greenhouse gas emissions could significantly reduce the value of the Corporation s assets. The Paris Agreement Canada and 195 other countries that are members of the United Nations Framework Convention on Climate Change met in Paris, France in December, 2015, and signed the Paris Agreement on climate change. The stated objective of the Paris Agreement is to hold the increase in global average temperature to well below 2 degrees Celsius above pre-industrial levels and to pursue efforts to limit the temperature increase to 1.5 degrees Celsius. Signatory countries agreed to meet every five years to review their individual progress on greenhouse gas emissions reductions and to consider amendments to individual country targets, which are not legally binding. Canada is required to report and monitor its greenhouse gas emissions, though details of how such reporting and monitoring will take place have yet to be determined. Additionally, the Paris Agreement contemplates that, by 2020, the parties will develop a new market-based mechanism related to carbon trading. It is expected that this mechanism will largely be based on the best practices and lessons learned from the Kyoto Protocol. The Government of Canada has stated that it will develop and announce a Canada-wide approach to implementing the Paris Agreement. MEG ENERGY 2016 ANNUAL REPORT 59
62 In October 2016, the Government of Canada announced that it would implement a national price on carbon (the Pan-Canadian Carbon Plan ) in response to the Paris Agreement. Under the Pan-Canadian Carbon Plan, the federal government is proposing a carbon pricing program that includes, at a minimum, a floor price on carbon emissions of $10 per tonne in 2018, rising by $10 per tonne each year to $50 per tonne in The Pan-Canadian Carbon Plan will allow provinces to implement either a carbon tax or use a broad market based mechanism, such as a cap-and-trade scheme. Alberta has already established a carbon pricing system that was referenced in the federal government announcement; therefore, in the short-term, the national price on carbon will likely have little additional impact. Mandatory emissions reduction requirements may result in increased operating costs and capital expenditures for oil sands producers. The Corporation is unable to predict the impact of emissions reduction legislation on the Corporation and it is possible that such legislation may have a material adverse effect on the Corporation s financial condition, results of operations and prospects. Royalty risk The Corporation s revenue and expenses will be directly affected by the royalty regime applicable to its oil sands development. The Government of Alberta implemented a new oil and gas royalty regime effective January 1, 2009 through which the royalties for conventional oil, natural gas and bitumen are linked to price and production levels. The royalty regime applies to both new and existing oil sands projects. Under the royalty regime, the Government of Alberta increased its royalty share from oil sands development by introducing price-sensitive formulas applied both before and after specified allowed costs have been recovered. The Government of Alberta has publicly indicated that it intends for the revised royalty regime to be further reviewed and revised from time to time. There can be no assurances that the Government of Alberta or the Government of Canada will not adopt new royalty regimes which may render the Corporation s projects uneconomic or otherwise adversely affect its business, financial condition or results of operations. On January 29, 2016, the Alberta government finalized results of a royalty review which commenced in September 2015 and announced that the current structure and royalty rates for oil sands will remain unchanged. There can be no assurances that the government of Alberta will not adopt new royalty regimes which may render the Corporation s projects uneconomic or adversely affect its results of operations, financial condition or prospects. An increase in royalties would reduce the Corporation s earnings and could make future capital investments or the Corporation s operations uneconomic and could make it more difficult to service and repay the Corporation s debt. Any material increase in royalties could also materially reduce the value of the Corporation s assets. Third party risks Aboriginal peoples have claimed aboriginal title and rights to a substantial portion of western Canada. Certain aboriginal peoples have filed a claim against the Government of Canada, the Province of Alberta, certain governmental entities and the Regional Municipality of Wood Buffalo (which includes the City of Fort McMurray, Alberta) claiming, among other things, aboriginal title to large areas of lands surrounding Fort McMurray, including the lands on which the Christina Lake Project, MEG s other projects and most of the other oil sands operations in Alberta are located. Such claims and other similar claims that may be initiated, if successful, could have a significant adverse effect on MEG and the Christina Lake Project and MEG s other projects. 60 Management s discussion and analysis
63 Disclosure controls and procedures The Corporation s Chief Executive Officer ( CEO ) and Chief Financial Officer ( CFO ) have designed, or caused to be designed under their supervision, disclosure controls and procedures to provide reasonable assurance that: (i) material information relating to the Corporation is made known to the Corporation s CEO and CFO by others, particularly during the period in which the annual filings are being prepared; and (ii) information required to be disclosed by the Corporation in its annual filings, interim filings or other reports filed or submitted by it under securities legislation is recorded, processed, summarized and reported within the time period specified in securities legislation. The CEO and CFO have evaluated, or caused to be evaluated under their supervision, the effectiveness of the Corporation s disclosure controls and procedures at the financial year end of the Corporation and have concluded that the Corporation s disclosure controls and procedures are effective at December 31, 2016 for the foregoing purposes. Internal controls over financial reporting The CEO and CFO have designed, or caused to be designed under their supervision, internal controls over financial reporting to provide reasonable assurance regarding the reliability of the Corporation s financial reporting and the preparation of financial statements for external purposes in accordance with IFRS. The CEO s and CFO s evaluation concluded that internal controls over financial reporting were effective as of December 31, The CEO and CFO are required to cause the Corporation to disclose any change in the Corporation s internal controls over financial reporting that occurred during the most recent interim period that has materially affected, or is reasonably likely to materially affect, the Corporation s internal controls over financial reporting. No changes in internal controls over financial reporting were identified during such period that have materially affected, or are reasonably likely to materially affect, the Corporation s internal controls over financial reporting. It should be noted that a control system, including the Corporation s disclosure and internal controls and procedures, no matter how well conceived, can provide only reasonable, but not absolute, assurance that the objectives of the control system will be met and it should not be expected that the disclosure and internal controls and procedures will prevent all errors or fraud. In reaching a reasonable level of assurance, management necessarily is required to apply its judgment in evaluating the cost/benefit relationship of possible controls and procedures. MEG ENERGY 2016 ANNUAL REPORT 61
64 Abbreviations The following provides a summary of common abbreviations used in this document: Financial and business environment Measurement AECO Alberta natural gas price reference location AIF Annual Information Form AWB Access Western Blend $ or C$ Canadian dollars DSU Deferred share units emsagp enhanced Modified Steam and Gas Push GAAP Generally Accepted Accounting Principles IFRS International Financial Reporting Standards LIBOR London Interbank Offered Rate MD&A Management s Discussion and Analysis OPEC Organization of the Petroleum Exporting Countries PSU Performance share units RSU Restricted share units SAGD Steam-Assisted Gravity Drainage SOR Steam-oil ratio U.S. United States US$ United States dollars WCS Western Canadian Select WTI West Texas Intermediate bbl bbls/d mcf mcf/d MW MW/h barrel barrels per day thousand cubic feet thousand cubic feet per day megawatts megawatts per hour Advisory Forward-looking information This document may contain forward-looking information including but not limited to: expectations of future production, revenues, expenses, cash flow, operating costs, steam-oil ratios, pricing differentials, reliability, profitability and capital investments; estimates of reserves and resources; anticipated reductions in operating costs as a result of optimization and scalability of certain operations; and anticipated sources of funding for operations and capital investments. Such forward-looking information is based on management s expectations and assumptions regarding future growth, results of operations, production, future capital and other expenditures, plans for and results of drilling activity, environmental matters, and business prospects and opportunities. By its nature, such forward-looking information involves significant known and unknown risks and uncertainties, which could cause actual results to differ materially from those anticipated. These risks include, but are not limited to: risks associated with the oil and gas industry, for example, results securing access to markets and transportation infrastructure; availability of capacity on the electricity transmission grid; uncertainty of reserve and resource estimates; uncertainty associated with estimates and projections relating to production, costs and 62 Management s discussion and analysis
65 revenues; health, safety and environmental risks; risks of legislative and regulatory changes to, amongst other things, tax, land use, royalty and environmental laws; assumptions regarding and the volatility of commodity prices, interest rates and foreign exchange rates, and, risks and uncertainties related to commodity price, interest rate and foreign exchange rate swap contracts and/or derivative financial instruments that MEG may enter into from time to time to manage its risk related to such prices and rates; risks and uncertainties associated with securing and maintaining the necessary regulatory approvals and financing to proceed with MEG s future phases and the expansion and/or operation of MEG s projects; risks and uncertainties related to the timing of completion, commissioning, and start-up, of MEG s future phases, expansions and projects; and the operational risks and delays in the development, exploration, production, and the capacities and performance associated with MEG s projects. Although MEG believes that the assumptions used in such forward-looking information are reasonable, there can be no assurance that such assumptions will be correct. Accordingly, readers are cautioned that the actual results achieved may vary from the forward-looking information provided herein and that the variations may be material. Readers are also cautioned that the foregoing list of assumptions, risks and factors is not exhaustive. Further information regarding the assumptions and risks inherent in the making of forward-looking statements can be found in MEG s most recently filed Annual Information Form ( AIF ), along with MEG s other public disclosure documents. Copies of the AIF and MEG s other public disclosure documents are available through the SEDAR website which is available at The forward-looking information included in this document is expressly qualified in its entirety by the foregoing cautionary statements. Unless otherwise stated, the forward-looking information included in this document is made as of the date of this document and MEG assumes no obligation to update or revise any forward-looking information to reflect new events or circumstances, except as required by law. Estimates of reserves For information regarding MEG s estimated reserves, please refer to MEG s AIF. Non-GAAP financial measures Certain financial measures in this MD&A do not have a standardized meaning as prescribed by IFRS including: net marketing activity, funds flow, adjusted funds flow, operating loss and operating cash flow. As such, these measures are considered non-gaap financial measures. These terms are not defined by IFRS and, therefore, may not be comparable to similar measures provided by other companies. These non-gaap financial measures should not be considered in isolation or as an alternative for measures of performance prepared in accordance with IFRS. These measures are presented and described in order to provide shareholders and potential investors with additional measures in understanding MEG s ability to generate funds and to finance its operations as well as profitability measures specific to the oil sands industry. The definition and reconciliation of each non-gaap measure is presented in the NON-GAAP MEASURES section of this MD&A. Additional information Additional information relating to the Corporation, including its AIF, is available on MEG s website at and is also available on SEDAR at MEG ENERGY 2016 ANNUAL REPORT 63
66 Quarterly summaries Unaudited Q4 Q3 Q2 Q1 Q4 Q3 Q2 Q1 FINANCIAL ($000 unless specified) Net earnings (loss) (1) (304,758) (108,632) (146,165) 130,829 (297,275) (427,503) 63,414 (508,307) Per share, diluted (1.34) (0.48) (0.65) 0.58 (1.32) (1.90) 0.28 (2.27) Operating loss (71,989) (87,929) (97,894) (197,286) (140,234) (86,769) (22,950) (124,421) Per share, diluted (0.32) (0.39) (0.43) (0.88) (0.62) (0.39) (0.10) (0.56) Adjusted funds flow 39,967 22,702 6,964 (131,240) (44,130) 23,877 99,243 (29,534) Per share, diluted (0.58) (0.20) (0.13) Cash capital investment (2) 63,077 19,203 19,990 34,975 54,473 32,139 90,465 80,101 Cash and cash equivalents 156, , , , , , , ,778 Working capital 96, , , , , , , ,130 Long-term debt 5,053,239 4,909,711 4,871,182 4,859,099 5,190,363 5,023,976 4,677,577 4,759,102 Shareholders equity 3,286,776 3,577,557 3,679,372 3,812,566 3,677,867 3,956,689 4,358,078 4,279,873 BUSINESS ENVIRONMENT WTI (US$/bbl) C$ equivalent of 1US$ - average Differential WTI:WCS ($/bbl) Differential WTI:WCS (%) 29.1% 30.0% 29.2% 42.6% 34.4% 28.8% 20.0% 30.2% Natural gas AECO ($/mcf) OPERATIONAL ($/bbl unless specified) Bitumen production bbls/d 81,780 83,404 83,127 76,640 83,514 82,768 71,376 82,398 Bitumen sales bbls/d 81,746 84,817 80,548 74,529 82,282 84,651 71,401 85,519 Steam-oil ratio (SOR) Bitumen realization Transportation net (6.05) (6.46) (6.66) (6.68) (5.35) (4.64) (4.57) (4.70) Royalties (0.51) (0.42) (0.27) 0.07 (0.25) (0.88) (0.90) (0.80) Operating costs non-energy (4.99) (5.32) (5.81) (6.45) (5.66) (5.98) (7.01) (7.57) Operating costs energy (4.12) (2.99) (1.97) (2.90) (3.58) (3.97) (3.71) (4.07) Power revenue Realized risk management gain (loss) (0.48) Cash operating netback (3.71) Power sales price (C$/MWh) Power sales (MW/h) Depletion and depreciation rate per bbl of production COMMON SHARES Shares outstanding, end of period (000) 226, , , , , , , ,847 Volume traded (000) 114, , , ,199 76,631 73,099 40,929 57,657 Common share price ($) High Low Close (end of period) (1) Includes net unrealized foreign exchange gains and losses on translation of U.S. dollar denominated debt and U.S. dollar denominated cash and cash equivalents. (2) Defined as total capital investment excluding dispositions, capitalized interest, capitalized cash-settled stock-based compensation and non-cash items. 64 Management s discussion and analysis
67 Annual summaries Unaudited FINANCIAL ($000 unless specified) Net earnings (loss) (1) (428,726) (1,169,671) (105,538) (166,405) 52,569 63,837 Per share, diluted (1.90) (5.21) (0.47) (0.75) Operating earnings (loss) (455,098) (374,374) 247, , ,255 Per share, diluted (2.01) (1.67) Adjusted funds flow (61,607) 49, , , , ,627 Per share, diluted (0.27) Cash capital investment (2) 137, ,178 1,237,539 2,111,824 1,567, ,292 Cash and cash equivalents 156, , ,097 1,179,072 1,474,843 1,495,131 Working capital 96, , ,534 1,045,606 1,655,915 1,475,245 Long-term debt 5,053,239 5,190,363 4,350,421 3,990,748 2,478,660 1,741,394 Shareholders equity 3,286,776 3,677,867 4,768,235 4,788,430 4,870,534 3,984,104 BUSINESS ENVIRONMENT WTI (US$/bbl) C$ equivalent of 1US$ - average Differential WTI:WCS ($/bbl) Differential WTI:WCS (%) 31.9% 27.7% 21.1% 25.7% 22.3% 18.0% Natural gas AECO ($/mcf) OPERATIONAL ($/bbl unless specified) Bitumen production bbls/d 81,245 80,025 71,186 35,317 28,773 26,605 Bitumen sales bbls/d 80,426 80,965 67,243 33,715 28,845 26,587 Steam-oil ratio (SOR) Bitumen realization Transportation net (6.46) (4.82) (1.38) (0.26) (0.31) (1.39) Royalties (0.29) (0.70) (4.36) (3.14) (2.46) (3.24) Operating costs non-energy (5.62) (6.54) (8.02) (9.00) (9.71) (10.32) Operating costs energy (3.01) (3.84) (6.30) (4.62) (3.46) (5.14) Power revenue Realized risk management gain (loss) Cash operating netback Power sales price (C$/MWh) Power sales (MW/h) Depletion and depreciation rate per bbl of production COMMON SHARES Shares outstanding, end of period (000) 226, , , , , ,472 Volume traded (000) 566, , , ,087 73, ,783 Common share price ($) High Low Close (end of period) (1) Includes net unrealized foreign exchange gains and losses on translation of U.S. dollar denominated debt and U.S. dollar denominated cash and cash equivalents. (2) Defined as total capital investment excluding dispositions, capitalized interest, capitalized cash-settled stock-based compensation and non-cash items. MEG ENERGY 2016 ANNUAL REPORT 65
68 Report of management Management s responsibility for the consolidated financial statements The accompanying consolidated financial statements of MEG Energy Corp. (the Corporation ) are the responsibility of Management. The consolidated financial statements have been presented and prepared within acceptable limits of materiality by Management in Canadian dollars in accordance with International Financial Reporting Standards ( IFRS ) as issued by the International Accounting Standards Board ( IASB ) and include certain estimates that reflect Management s best judgments. Financial information contained throughout the Annual Report is consistent with these consolidated financial statements. The Corporation maintains systems of internal accounting and administrative controls. These systems are designed to provide reasonable assurance that the financial information is relevant, reliable and accurate and that the Corporation s assets are properly accounted for and adequately safeguarded. Management s evaluation concluded that the Corporation s internal controls over financial reporting were effective as of December 31, The Corporation s Board of Directors has approved the consolidated financial statements. The Board of Directors fulfills its responsibility regarding the consolidated financial statements mainly through its Audit Committee, which is made up of three independent directors. The Audit Committee has a written mandate that complies with the current requirements of Canadian securities legislation. The Audit Committee meets with Management and the independent auditors at least on a quarterly basis to review and approve interim consolidated financial statements and management s discussion and analysis prior to their release as well as annually to review the annual consolidated financial statements and management s discussion and analysis and recommend their approval to the Board of Directors. PricewaterhouseCoopers LLP, an independent firm of auditors, has been engaged, as approved by a vote of the shareholders at the Corporation s most recent Annual General Meeting, to audit and provide their independent audit opinion on the Corporation s consolidated financial statements as at and for the year ended December 31, Their report, contained herein, outlines the nature of their audit and expresses their opinion on the consolidated financial statements. William (Bill) McCaffrey, P.Eng. President and Chief Executive Officer Eric L. Toews, CPA, CA Chief Financial Officer MARCH 2, Report of management
69 Independent auditor s report To the shareholders of MEG Energy Corp. We have audited the accompanying consolidated financial statements of MEG Energy Corp. and its subsidiaries, which comprise the consolidated balance sheet as at December 31, 2016 and December 31, 2015 and the consolidated earnings (loss), comprehensive income (loss), changes in shareholders equity and cash flow for the years then ended, and the related notes, which comprise a summary of significant accounting policies and other explanatory information. Management s responsibility for the consolidated financial statements Management is responsible for the preparation and fair presentation of these consolidated financial statements in accordance with International Financial Reporting Standards, and for such internal control as management determines is necessary to enable the preparation of consolidated financial statements that are free from material misstatement, whether due to fraud or error. Auditor s responsibility Our responsibility is to express an opinion on these consolidated financial statements based on our audits. We conducted our audits in accordance with Canadian generally accepted auditing standards. Those standards require that we comply with ethical requirements and plan and perform the audit to obtain reasonable assurance about whether the consolidated financial statements are free from material misstatement. An audit involves performing procedures to obtain audit evidence about the amounts and disclosures in the consolidated financial statements. The procedures selected depend on the auditor s judgment, including the assessment of the risks of material misstatement of the consolidated financial statements, whether due to fraud or error. In making those risk assessments, the auditor considers internal control relevant to the entity s preparation and fair presentation of the consolidated financial statements in order to design audit procedures that are appropriate in the circumstances, but not for the purpose of expressing an opinion on the effectiveness of the entity s internal control. An audit also includes evaluating the appropriateness of accounting policies used and the reasonableness of accounting estimates made by management, as well as evaluating the overall presentation of the consolidated financial statements. We believe that the audit evidence we have obtained in our audits is sufficient and appropriate to provide a basis for our audit opinion. Opinion In our opinion, the consolidated financial statements present fairly, in all material respects, the financial position of MEG Energy Corp. and its subsidiaries as at December 31, 2016 and December 31, 2015 and their financial performance and their cash flows for the years then ended in accordance with International Financial Reporting Standards. Chartered Professional Accountants MARCH 2, 2017 MEG ENERGY 2016 ANNUAL REPORT INDEPENDENT AUDITOR S REPORT 67
70 Consolidated balance sheet (Expressed in thousands of Canadian dollars) As at December 31 Note Assets Current assets Cash and cash equivalents 25 $ 156,230 $ 408,213 Trade receivables and other 5 236, ,042 Inventories 6 66,394 53, , ,334 Non-current assets Property, plant and equipment 7 7,639,434 8,011,760 Exploration and evaluation assets 8 547, ,421 Other intangible assets 9 16,111 84,142 Other assets , ,612 Deferred income tax asset ,944 - Total assets $ 8,921,224 $ 9,400,269 Liabilities Current liabilities Accounts payable and accrued liabilities 11 $ 292,340 $ 217,991 Current portion of long-term debt 12 17,455 17,992 Current portion of provisions and other liabilities 13 23,063 12,313 Commodity risk management 27 30, , ,296 Non-current liabilities Long-term debt 12 5,053,239 5,190,363 Provisions and other liabilities , ,274 Deferred income tax liability 14-87,469 Total liabilities 5,634,448 5,722,402 Shareholders equity Share capital 15 4,878,607 4,836,800 Contributed surplus 168, ,835 Deficit (1,795,067) (1,366,341) Accumulated other comprehensive income 34,983 35,573 Total shareholders equity 3,286,776 3,677,867 Total liabilities and shareholders equity $ 8,921,224 $ 9,400,269 Commitments and contingencies (note 30) The accompanying notes are an integral part of these Consolidated Financial Statements. These Consolidated Financial Statements were approved by the Corporation s Board of Directors on March 2, William (Bill) McCaffrey, Director Robert B. Hodgins, Director 68 Consolidated balance sheet
71 Consolidated statement of earnings (loss) and comprehensive income (loss) (Expressed in thousands of Canadian dollars, except per share amounts) Year ended December 31 Note Revenues Petroleum revenue, net of royalties 17 $ 1,823,234 $ 1,882,853 Other revenue 18 43,050 43,063 1,866,284 1,925,916 Expenses Diluent and transportation 19 1,017,894 1,050,377 Operating expenses , ,725 Purchased product and storage 202, ,615 Depletion and depreciation 7,9 499, ,422 Impairment charge 9 80,072 - Exploration expense 8 1,248 - General and administrative 23 96, ,518 Stock-based compensation 16 49,942 50,105 Research and development 5,499 7,497 Gain on disposition of assets 8 - (68,192) Interest and other income (1,133) (3,078) Commodity risk management loss 27 27,954 - Foreign exchange loss (gain), net 20 (151,395) 801,739 Net finance expense , ,194 Other expenses 22 64,108 71,598 Loss before income taxes (636,220) (1,261,604) Income tax recovery 14 (207,494) (91,933) Net loss (428,726) (1,169,671) Other comprehensive income (loss), net of tax Items that may be reclassified to profit or loss: Foreign currency translation adjustment (590) 22,358 Comprehensive loss $ (429,316) $ (1,147,313) Net loss per common share Basic 26 $ (1.90) $ (5.21) Diluted 26 $ (1.90) $ (5.21) The accompanying notes are an integral part of these Consolidated Financial Statements. MEG ENERGY 2016 ANNUAL REPORT CONSOLIDATED STATEMENT OF EARNINGS (LOSS) AND COMPREHENSIVE INCOME (LOSS) 69
72 Consolidated statement of changes in shareholders equity (Expressed in thousands of Canadian dollars) Note Share Capital Contributed Surplus Deficit Accumulated Other Comprehensive Income Total Shareholders Equity Balance as at December 31, 2015 $ 4,836,800 $ 171,835 $ (1,366,341) $ 35,573 $ 3,677,867 Stock-based compensation 16-38, ,225 RSUs vested and released 15 41,807 (41,807) Comprehensive income (loss) - - (428,726) (590) (429,316) Balance as at December 31, 2016 $ 4,878,607 $ 168,253 $ (1,795,067) $ 34,983 $ 3,286,776 Balance as at December 31, 2014 $ 4,797,853 $ 153,837 $ (196,670) $ 13,215 $ 4,768,235 Stock-based compensation 16-56, ,945 RSUs vested and released 15 38,947 (38,947) Comprehensive income (loss) - - (1,169,671) 22,358 (1,147,313) Balance as at December 31, 2015 $ 4,836,800 $ 171,835 $ (1,366,341) $ 35,573 $ 3,677,867 The accompanying notes are an integral part of these Consolidated Financial Statements. 70 Consolidated statement of changes in shareholders equity
73 Consolidated statement of cash flow (Expressed in thousands of Canadian dollars) Year ended December 31 Note Cash provided by (used in): Operating activities Net loss $ (428,726) $ (1,169,671) Adjustments for: Depletion and depreciation 7,9 499, ,422 Impairment charge 9 80,072 - Exploration expense 8 1,248 - Stock-based compensation 16 33,588 50,105 Gain on disposition of assets 8 - (68,192) Unrealized loss (gain) on foreign exchange 20 (148,153) 785,310 Unrealized gain on derivative financial liabilities 21 (12,508) (13,289) Unrealized loss on risk management 27 30,313 - Onerous contracts 22 47,866 58,719 Deferred income tax recovery 14 (208,413) (90,733) Amortization of debt issue costs 10,12 12,192 11,795 Debt extinguishment expense 12,21 28,845 - Other 2,258 5,115 Decommissioning expenditures 13 (1,290) (1,873) Net change in other liabilities (6,116) (541) Net change in non-cash working capital items 25 (25,061) 77,991 Net cash provided by (used in) operating activities (94,074) 112,158 Investing activities Capital investments: Property, plant and equipment 7 (120,828) (305,670) Exploration and evaluation 8 (2,265) (1,458) Other intangible assets 9 (16,643) (6,498) Proceeds on disposition of assets 8,10 3, ,015 Other 2,775 (930) Net change in non-cash working capital items 25 2,603 (212,455) Net cash provided by (used in) investing activities (131,111) (416,996) Financing activities Repayment of long-term debt 12 (17,062) (17,020) Net cash provided by (used in) financing activities (17,062) (17,020) Effect of exchange rate changes on cash and cash equivalents held in foreign currency 20 (9,736) 73,974 Change in cash and cash equivalents (251,983) (247,884) Cash and cash equivalents, beginning of year , ,097 Cash and cash equivalents, end of year 25 $ 156,230 $ 408,213 The accompanying notes are an integral part of these Consolidated Financial Statements. MEG ENERGY 2016 ANNUAL REPORT CONSOLIDATED STATEMENT OF CASH FLOW 71
74 Notes to consolidated financial statements Year ended December 31, 2016 (All amounts are expressed in thousands of Canadian dollars, unless otherwise noted.) 1. Corporate information MEG Energy Corp. (the Corporation ) was incorporated under the Alberta Business Corporations Act on March 9, The Corporation s shares trade on the Toronto Stock Exchange ( TSX ) under the symbol MEG. The Corporation owns a 100% interest in over 900 square miles of oil sands leases in the southern Athabasca oil sands region of northern Alberta and is primarily engaged in a steam-assisted gravity drainage oil sands development at its 80 section Christina Lake Project. The Corporation also holds a 50% interest in the Access Pipeline, a dual pipeline to transport diluent north from the Edmonton area to the Athabasca oil sands area and a blend of bitumen and diluent south from the Christina Lake Project into the Edmonton area. In addition to the Access Pipeline, the Corporation owns the Stonefell Terminal, located near Edmonton, Alberta, which offers 900,000 barrels of terminalling and storage capacity. The Stonefell Terminal is connected to the Access Pipeline and is also connected by pipeline to a third party rail-loading terminal. The corporate office is located at 520-3rd Avenue S.W., Calgary, Alberta, Canada. 2. Basis of preparation These consolidated financial statements have been prepared in accordance with International Financial Reporting Standards ( IFRS ) as issued by the International Accounting Standards Board. The consolidated financial statements have been prepared on the historical cost basis, except as detailed in the significant accounting policies disclosed in Note 3. These consolidated financial statements were approved by the Corporation s Board of Directors on March 2, Significant accounting policies (a) Principles of consolidation The consolidated financial statements of the Corporation comprise the Corporation and its wholly-owned subsidiary, MEG Energy (U.S.) Inc. Earnings and expenses of its subsidiary are included in the consolidated statement of earnings (loss) and comprehensive income (loss). All intercompany transactions, balances, income and expenses are eliminated on consolidation. The Corporation owns an undivided 50% working interest in Access Pipeline and is responsible for its proportionate ownership interest of all assets and liabilities and other obligations. Since the Corporation owns an undivided interest in Access Pipeline, it holds a proportionate share of the rights to the assets and obligations for the liabilities. As a result, the Corporation presents its proportionate share of the assets, liabilities, revenues and expenses of Access Pipeline on a line-by-line basis in the consolidated financial statements. 72 Notes to consolidated financial statements
75 (b) Operating segments The Corporation s operations are aggregated into one operating segment for reporting consistent with the internal reporting regularly provided to and reviewed by the chief operating decision-maker of the Corporation. (c) Foreign currency translation i. Functional and presentation currency Items included in the consolidated financial statements are measured using the currency of the primary economic environment in which the Corporation operates (the functional currency ). The consolidated financial statements are presented in Canadian dollars ($ or C$), which is the Corporation s functional currency. ii. Transactions and balances Foreign currency transactions are translated into Canadian dollars at exchange rates prevailing at the dates of the transactions. Monetary assets and liabilities denominated in a foreign currency are translated into Canadian dollars at rates of exchange in effect at the end of the period. Foreign currency differences arising on translation are recognized in earnings or loss. For the purposes of presenting consolidated financial statements, the assets and liabilities of the foreign subsidiary are translated into Canadian dollars at rates of exchange in effect at the end of the period. Revenue and expense items are translated at the average exchange rates prevailing at the dates of the transactions. Exchange differences arising, if any, are recognized in other comprehensive income (loss). (d) Financial instruments Financial assets and liabilities are recognized when the Corporation becomes a party to the contractual provisions of the instrument. Financial assets are derecognized when the rights to receive cash flows from the assets have expired or have been transferred and the Corporation has transferred substantially all risks and rewards of ownership. Financial liabilities are derecognized when the liability is extinguished. A substantial modification of the terms of an existing financial liability is recorded as an extinguishment of the original financial liability and the recognition of a new financial liability. The difference between the carrying amount of a financial liability extinguished and the consideration paid is recognized in earnings or loss. If the modification is not treated as an extinguishment, any costs or fees incurred adjust the carrying amount of the liability and are amortized over the remaining term of the modified liability. Financial assets and liabilities are offset and the net amount is reported on the balance sheet when there is a legally enforceable right to offset the recognized amounts and there is an intention to settle on a net basis, or realize the asset and settle the liability simultaneously. At initial recognition, the Corporation classifies its financial instruments in the following categories depending on the purpose for which the instruments were acquired: MEG ENERGY 2016 ANNUAL REPORT 73
76 i. Financial assets and liabilities at fair value through earnings or loss A financial asset or liability is classified in this category if acquired principally for the purpose of selling or repurchasing in the short term. The Corporation s investments in U.S. auction rate securities ( ARS ) were classified as fair value through earnings or loss. Derivative financial instruments are also included in this category unless they are designated for hedge accounting. The Corporation may periodically use derivative financial instruments to manage commodity price, foreign currency and interest rate exposures. The Corporation s derivative financial liabilities and commodity risk management contracts have been classified as fair value through earnings or loss. Financial instruments are recognized initially and subsequently at fair value. Transaction costs are expensed in the consolidated statement of earnings (loss) and comprehensive income (loss). Gains and losses arising from changes in fair value are recognized in net earnings (loss) in the period in which they arise. Financial assets and liabilities at fair value through earnings or loss are classified as current except for any portion expected to be realized or paid beyond twelve months from the balance sheet date. Derivative financial instruments are included on the balance sheet as either an asset or liability and are classified as current or non-current based on the contractual terms specific to the instrument. ii. Loans and receivables Loans and receivables are non-derivative financial assets with fixed or determinable payments that are not quoted in an active market. The Corporation s loans and receivables are comprised of cash and cash equivalents and trade receivables and other, and are included in current assets due to their shortterm nature. Loans and receivables are initially recognized at the amount expected to be received less any required discount to reduce the loans and receivables to fair value. Subsequently, loans and receivables are measured at amortized cost using the effective interest method less any provision for impairment. iii. Financial liabilities at amortized cost Financial liabilities at amortized cost include accounts payable and accrued liabilities and long-term debt. Accounts payable and accrued liabilities are initially recognized at the amount required to be paid less any required discount to reduce the payables to fair value. Long-term debt is recognized initially at fair value, net of any transaction costs incurred, and subsequently at amortized cost using the effective interest method. Financial liabilities are classified as current liabilities if payment is due within twelve months from the balance sheet date. Otherwise, they are presented as non-current liabilities. (e) Cash and cash equivalents Cash and cash equivalents include cash on hand, deposits held with banks, and other short-term highly liquid investments such as bankers acceptances, commercial paper, money market deposits or similar instruments, with a maturity of 90 days or less. 74 Notes to consolidated financial statements
77 (f) Trade receivables and other Trade receivables are recorded based on the Corporation s revenue recognition policy as described in Note 3(t). Other amounts include deposits and advances which include funds placed in escrow in accordance with the terms of certain agreements, funds held in trust in accordance with governmental regulatory requirements and funds advanced to joint operation partners. (g) Inventories Product inventories consist of crude oil products and are valued at the lower of cost and net realizable value on a weighted average cost basis. Costs include direct and indirect expenditures incurred in the normal course of business in bringing an item or product to its existing condition and location. Net realizable value is the estimated selling price less applicable selling expenses. If the carrying value exceeds net realizable value, a write-down is recognized. The write-down may be reversed in a subsequent period if the inventory is still on hand but the circumstances which caused the write-down no longer exist. (h) Exploration and evaluation assets Exploration and evaluation ( E&E ) expenditures, including the costs of acquiring licenses, technical studies, exploration drilling and evaluation and directly attributable general and administrative costs, including related borrowing costs, are initially capitalized as exploration and evaluation assets. Costs incurred prior to obtaining a legal right or license to explore are expensed in the period in which they are incurred. Exploration and evaluation assets are assessed for impairment if (i) sufficient data exists to determine technical feasibility and commercial viability, and (ii) facts and circumstances suggest that the carrying amount exceeds the recoverable amount. The technical feasibility and commercial viability of extracting a mineral resource is considered to be determinable when proved or probable reserves are determined to exist. Upon determination of proved or probable reserves, E&E assets attributable to those reserves are tested for impairment upon reclassification to property, plant and equipment. If it is determined that an E&E asset is not technically feasible or commercially viable or facts and circumstances suggest that the carrying amount exceeds the recoverable amount, and the Corporation decides to discontinue the exploration and evaluation activity, the unrecoverable costs are charged to expense. An E&E asset is derecognized upon disposal and any gains or losses from disposition are recognized in net earnings or loss. (i) Property, plant and equipment Property, plant and equipment ( PP&E ) is measured at cost less accumulated depletion and depreciation and accumulated impairment losses. Assets under construction are not subject to depletion and depreciation. i. Crude oil Crude oil assets consist of capitalized costs associated with the acquisition, construction, development and production of crude oil sands properties and reserves, including directly attributable overhead and administrative costs, related borrowing costs and estimates of decommissioning liability costs. MEG ENERGY 2016 ANNUAL REPORT 75
78 Field production assets are depleted using the unit-of-production method based on estimated proved reserves. Costs subject to depletion include estimated future development costs required to develop and produce the proved reserves. These estimates are reviewed by independent reserve engineers at least annually. Major facilities and equipment are depreciated on a unit-of-production basis over the total productive capacity of the facilities. When significant parts of an item of PP&E have different useful lives, they are accounted for as separate items (major components). Costs of planned major inspections, overhaul and turnaround activities that maintain PP&E and benefit future years of operations are capitalized and depreciated on a straight-line basis over the period to the next turnaround. Recurring planned maintenance activities performed on shorter intervals are expensed. Replacements outside of major inspection, overhaul or turnaround activities are capitalized when it is probable that future economic benefits will flow to the Corporation. ii. Transportation and storage Transportation and storage assets consist primarily of the Corporation s undivided 50% joint operations interest in the Access Pipeline and the Corporation s wholly-owned Stonefell Terminal and other transportation and storage assets. The net carrying values of transportation and storage assets are depreciated on a straight-line basis over their estimated 50 year useful lives. iii. Corporate assets Corporate assets consist primarily of office equipment, computer hardware and leasehold improvements. Depreciation of office equipment is provided over the useful life of the assets on the declining balance basis at 25% per year. Leasehold improvements are depreciated on a straight-line basis over the term of the lease. (j) Borrowing costs Borrowing costs incurred for the construction of a qualifying asset are capitalized when a substantial period of time is required to complete and prepare the asset for its intended use. The capitalization of borrowing costs is suspended during extended periods in which the Corporation suspends active development of the asset and ceases when the asset is in the location and condition necessary for its intended use. (k) Other intangible assets Other intangible assets acquired by the Corporation which have a finite useful life are carried at cost less accumulated depreciation. Subsequent expenditures are capitalized only to the extent that they increase the future economic benefits embodied in the asset to which they relate. The Corporation incurs costs associated with research and development. Expenditures during the research phase are expensed. Expenditures during the development phase are capitalized only if certain criteria, including technical feasibility and the intent to develop and use the technology, are met. If these criteria are not met, the costs are expensed as incurred. The cost associated with purchasing or creating software which is not an integral component of the related computer hardware is included within other intangible assets. The net carrying value of software is amortized over the useful life of the asset on the declining balance basis at 25% per year. 76 Notes to consolidated financial statements
79 (l) Other assets long-term pipeline linefill The Corporation has entered into agreements to transport bitumen blend and diluent on third-party pipelines for which it is required to supply linefill. As these pipelines are owned by third parties, the linefill is not considered to be a component of the Corporation s PP&E. The linefill is classified as either a current or long-term asset based on the term of the related transportation contract. The linefill is carried at the lower of cost or net realizable value. If the carrying value exceeds net realizable value, a write-down is recognized. The write-down may be reversed in a subsequent period if the circumstances which caused the writedown no longer exist. (m) Leased assets Leases where the Corporation assumes substantially all the risks and rewards of ownership are classified as finance leases within PP&E. Upon initial recognition, the leased asset is measured at an amount equal to the lower of its fair value and the present value of the minimum lease payments. All other leases are operating leases, which are recognized as an expense as incurred over the lease term. When lease inducements are received to enter into operating leases, such inducements are recognized as a deferred liability. The aggregate benefit of inducements is recognized as a reduction of the related lease expense on a straight-line basis, except where another systematic basis is more representative of the time pattern in which economic benefits from the leased asset are consumed. (n) Impairments i. Financial assets A financial asset is assessed at each reporting date to determine whether there is any objective evidence that it is impaired. A financial asset is considered to be impaired if objective evidence indicates that one or more events have had a negative effect on the fair value or estimated future cash flows of an asset. An impairment loss in respect of a financial asset measured at amortized cost is calculated as the difference between its carrying amount and the present value of the estimated future cash flows discounted at the original effective interest rate. Impairment losses are recognized in earnings or loss. An impairment loss is reversed if the reversal can be related objectively to an event occurring after the impairment loss was recognized. ii. Non-financial assets PP&E and E&E assets are reviewed at each reporting date to determine whether there is any indication of impairment. If any such indication exists, the asset s recoverable amount is estimated. Intangible assets that are not yet available for use are tested for impairment annually. E&E assets are assessed for impairment immediately prior to being reclassified to PP&E, as crude oil assets. MEG ENERGY 2016 ANNUAL REPORT 77
80 For the purpose of impairment testing, PP&E assets are grouped into cash-generating units ( CGU ). A CGU is the smallest group of assets that generates cash inflows from continuing use that are largely independent of the cash inflows of other assets or groups of assets. E&E assets are allocated to related CGU s, aggregated at the operating segment level, for impairment testing. The recoverable amount of a CGU is the greater of its value in use and its fair value less costs of disposal. Value in use is estimated as the discounted present value of the expected future cash flows to be derived from the continuing use of the asset or CGU. In determining fair value less costs of disposal, recent market transactions are taken into account if available. In the absence of such transaction, an appropriate valuation model is used. An impairment loss is recognized in earnings or loss if the carrying amount of an asset or its CGU exceeds its estimated recoverable amount. Impairment losses recognized in prior periods are assessed at each reporting date for any indication that the loss has decreased or no longer exists. An impairment loss is reversed if there has been a change in the estimate used to determine the recoverable amount. An impairment loss is reversed only to the extent that the asset s carrying amount does not exceed the carrying amount that would have been determined, net of depletion and depreciation, if no impairment loss had been recognized. (o) Government grants Government grants are recognized when there is reasonable assurance that the Corporation will receive the grant and comply with the conditions attached to the grant. When a grant relates to income, it is recognized in earnings or loss over the period in which the grant is intended to compensate. When a grant relates to an asset, it is recognized as a reduction of the carrying amount of the related asset. (p) Provisions i. General A provision is recognized if, as a result of a past event, the Corporation has a present legal or constructive obligation that can be estimated reliably, and it is probable that an outflow of economic benefits will be required to settle the obligation. Provisions are determined by discounting the expected future cash flows at a rate that reflects current market assessments of the time value of money and the risks specific to the liability. Provisions are not recognized for future operating losses. ii. Decommissioning provision The Corporation s activities give rise to dismantling, decommissioning and restoration activities. A provision is made for the estimated cost of decommissioning and restoration activities and capitalized in the relevant asset category. The decommissioning provision is measured at the present value of management s best estimate of the expenditure required to settle the present obligation at the balance sheet date. Subsequent to the initial measurement, the decommissioning provision is adjusted at the end of each period to reflect the passage of time and changes in the estimated future cash flows underlying the obligation as well 78 Notes to consolidated financial statements
81 as any changes in the discount rate. Increases in the decommissioning provision due to the passage of time are recognized as a finance expense whereas increases/decreases due to changes in the estimated future cash flows are capitalized. Actual costs incurred upon settlement of the obligations are charged against the decommissioning provision. iii. Onerous contracts A provision for an onerous contract is recognized when the unavoidable cost of meeting the obligations under the contract exceed the economic benefits expected to be derived from the contract. The provision is measured at the present value of the estimated future cash flows associated with the contract. Subsequent to the initial measurement, the provision is adjusted at the end of each period to reflect the passage of time and changes in the estimated future cash flows underlying the obligation as well as any changes in the discount rate. The net amount of actual costs incurred and sublease recoveries earned are charged against the onerous contract provision. iv. Emission obligations When required, emission liabilities are carried on the balance sheet using the estimated cost required to settle the obligation. Emission compliance costs are expensed when incurred. Emission allowances granted to or internally generated by the Corporation are recognized as intangible assets at a nominal amount. (q) Deferred income taxes Deferred income taxes are recognized in respect of temporary differences between the carrying amounts of assets and liabilities for financial reporting purposes and the amounts used for taxation purposes. Deferred taxes are not recognized on the initial recognition of assets or liabilities in a transaction that is not a business combination. Deferred taxes are measured at the tax rates that are expected to be applied to temporary differences when they reverse, based on the laws that have been enacted or substantively enacted as at the reporting date. Deferred tax assets and liabilities are offset if there is a legally enforceable right to offset, and they relate to income taxes levied by the same tax authority on the same taxable entity, or on different tax entities, but they intend to settle current tax liabilities and assets on a net basis or their tax assets and liabilities will be realized simultaneously. (r) A deferred tax asset is recognized to the extent that it is probable that future taxable income will be available against which the temporary difference can be utilized. Deferred tax assets are reviewed at each reporting date and are reduced to the extent that it is no longer probable that the related tax benefit will be realized. Share capital Common shares are classified as equity. Transaction costs directly attributable to the issuance of shares are recognized as a reduction of shareholders equity, net of any income tax. MEG ENERGY 2016 ANNUAL REPORT 79
82 (s) Share based payments The Corporation has a number of share-based compensation plans including both equity-settled awards and cash-settled awards. Compensation expense is recorded as stock based compensation expense or capitalized when the cost directly relates to exploration or development activities. i. Equity-settled The Corporation s Stock Option Plan and equity-settled Restricted Share Unit Plan allow for the granting of stock options, restricted share units ( RSUs ) and performance share units ( PSUs ) to directors, officers, employees and consultants. The grant date fair value of stock options, RSUs and PSUs granted is recognized as stock-based compensation expense, with a corresponding increase in contributed surplus, over the vesting period of the options, RSUs and PSUs, respectively. Each tranche in an award is considered a separate grant with its own vesting period and grant date fair value. Fair value is determined using the Black-Scholes option pricing model. A forfeiture rate is estimated on the grant date and is adjusted to reflect the actual number of options, RSUs and PSUs that vest. The Corporation s equity-settled RSU Plan allows the holder of an RSU or PSU to receive a cash payment or its equivalent in fully-paid common shares, at the Corporation s discretion, equal to the fair market value of the Corporation s common shares calculated at the date of such payment. The Corporation does not intend to make cash payments under the equity-settled RSU Plan and, as such, the RSUs and PSUs are accounted for within shareholders equity. On exercise of stock options, the cash consideration received by the Corporation is credited to share capital and the associated amount in contributed surplus is reclassified to share capital. ii. Cash-settled The Corporation s cash-settled RSU Plan allows for the granting of RSUs, including PSUs to directors, officers, employees and consultants. Cash settled RSUs and PSUs are accounted for as liability instruments and are measured at fair value based on the market value of the Corporation s common shares at each period end. The fair value is recognized as stock-based compensation over the vesting period. Fluctuations in the fair value are recognized within stock-based compensation in the period in which they occur. The Corporation s cash-settled RSU Plan allows the holder of an RSU or PSU to receive a cash payment, at the Corporation s discretion, equal to the fair market value of the Corporation s common shares calculated at the date of such payment. The Corporation s Deferred Share Unit Plan allows for the granting of deferred share units ( DSUs ) to directors of the Corporation. DSUs are accounted for as liability instruments and are measured at fair value based on the market price of the Corporation s common shares. The fair value of a DSU is recognized as stock-based compensation expense on the grant date and future fluctuations in the fair value are recognized as stock-based compensation expense in the period in which they occur. 80 Notes to consolidated financial statements
83 (t) Revenues i. Petroleum revenue and royalty recognition Revenue associated with the sale of proprietary and purchased crude oil and natural gas owned by the Corporation is recognized when title passes from the Corporation to its customers and collection is reasonably assured. Royalties are recorded at the time of production. ii. Other revenue recognition Revenue from power generated in excess of the Corporation s internal requirements is recognized when the power leaves the plant gate, at which point the risks and rewards are transferred to the customer. Revenue generated from the transportation of crude oil products is recognized in the period the product is delivered and the service is provided. (u) Diluent and transportation The costs associated with the transportation of crude oil, including the cost of diluent used in blending, are recognized when the product is sold. (v) Purchased product and storage Purchased product and storage costs include the cost of crude oil products purchased from third parties and associated transportation and storage costs. (w) Net finance expense Net finance expense is comprised of interest expense on borrowings, debt extinguishment expense, accretion of the discount on provisions, and gains and losses on derivative financial instruments and other assets. Borrowing costs incurred for the construction of qualifying assets are capitalized during the period of time required to complete and prepare the assets for their intended use. All other borrowing costs are recognized in finance expense using the effective interest method. (x) Net earnings (loss) per share (y) Basic earnings (loss) per share is calculated by dividing the net earnings (loss) for the period attributable to common shareholders of the Corporation by the weighted average number of common shares outstanding during the period. Diluted earnings (loss) per share is calculated by adjusting the weighted average number of common shares outstanding for dilutive instruments. The number of shares included with respect to options, RSUs and PSUs is computed using the treasury stock method. The Corporation s potentially dilutive instruments comprise stock options, RSUs and PSUs granted to directors, officers, employees and consultants. New accounting standards There were no new accounting standards adopted during the year ended December 31, MEG ENERGY 2016 ANNUAL REPORT 81
84 (z) Accounting standards issued but not yet applied The IASB has issued the following standards which are not yet effective: On January 19, 2016, the IASB issued amendments to IAS 12, Income Taxes, relating to the recognition of deferred tax assets for unrealized losses. The amendments are effective for annual periods beginning on or after January 1, 2017, with early adoption permitted. Amendments to IAS 12 will be applied on a retrospective basis by the Corporation on January 1, The adoption of this amended standard is not expected to have a material impact on the Corporation s consolidated financial statements. On January 29, 2016, the IASB issued amendments to IAS 7, Statement of Cash Flows, as part of its disclosure initiative. The amendments require an entity to disclose changes in liabilities arising from financing activities. The amendments are effective for annual periods beginning on or after January 1, 2017, with early adoption permitted. Amendments to IAS 7 will be applied by the Corporation on January 1, The adoption of this amended standard will have required disclosure impacts that enable users of financial statements to evaluate changes in liabilities arising from financing activities on the Corporation s consolidated financial statements. On June 20, 2016, the IASB issued amendments to IFRS 2, relating to classification and measurement of particular share-based payment transactions. The amendments are effective for periods beginning on or after January 1, The Corporation is currently assessing the impact of the adoption of these amendments on the Corporation s consolidated financial statements. In January 2016, the IASB issued IFRS 16 Leases, which will replace IAS 17 Leases. Under IFRS 16, a single recognition and measurement model will apply for lessees, which will require recognition of lease assets and lease obligations on the balance sheet. The standard eliminates the classification of leases as either operating leases or finance leases for lessees, essentially treating all leases as finance leases. Short-term leases and leases for low-value assets are exempt from recognition and will continue to be treated as operating leases. The accounting requirements for lessors is substantially unchanged and a lessor will continue to classify leases as either finance leases or operating leases, but disclosure requirements are enhanced. The standard is effective for annual periods beginning on or after January 1, 2019, with early adoption permitted if IFRS 15 has been adopted. The standard may be applied retrospectively or using a modified retrospective approach. IFRS 16 will be adopted by the Corporation on January 1, 2019 and the Corporation is currently assessing and evaluating the impact of the standard on the consolidated financial statements. In May 2014, the IASB issued IFRS 15 Revenue From Contracts With Customers, which will replace IAS 11 Construction Contracts and IAS 18 Revenue and the related interpretations on revenue recognition. IFRS 15 provides a comprehensive revenue recognition and measurement framework that applies to all contracts with customers. The new standard is effective for annual periods beginning on or after January 1, 2018 with early adoption permitted. IFRS 15 will be adopted by the Corporation on January 1, 2018 and the Corporation is currently assessing and evaluating the impact of the standard on the consolidated financial statements. 82 Notes to consolidated financial statements
85 In July 2014, the IASB issued IFRS 9 Financial Instruments, which is intended to replace IAS 39 Financial Instruments: Recognition and Measurement. IFRS 9 uses a single approach to determine whether a financial asset is measured at amortized cost or fair value, replacing the multiple rules in IAS 39. The accounting treatment of financial liabilities in IFRS 9 is essentially unchanged from IAS 39, except for financial liabilities designated at fair value through profit or loss, whereby an entity can recognize the portion of the change in fair value related to the change in the entity s own credit risk through other comprehensive income rather than net earnings. The standard also introduces a new expected credit loss impairment model for financial assets. In addition, IFRS 9 incorporates new hedge accounting requirements that more closely aligns with risk management activities. IFRS 9 is effective for annual periods beginning on or after January 1, 2018 with early adoption permitted. IFRS 9 will be adopted by the Corporation on January 1, 2018 and the Corporation is currently assessing and evaluating the impact of the standard on the consolidated financial statements. 4. Significant accounting estimates, assumptions and judgments The timely preparation of the consolidated financial statements requires that management make estimates and assumptions and use judgment regarding the reported amounts of assets and liabilities at the date of the consolidated financial statements and the reported amounts of revenues and expenses during the period. Such estimates primarily relate to unsettled transactions and events as of the date of the consolidated financial statements. The estimated fair value of financial assets and liabilities, by their very nature, are subject to measurement uncertainty. Accordingly, actual results may differ materially from estimated amounts as future confirming events occur. Significant judgments, estimates and assumptions made by management in the preparation of these consolidated financial statements are outlined below. (a) Property, plant and equipment Field production assets within PP&E are depleted using the unit-of-production method based on estimates of proved bitumen reserves and future costs required to develop those reserves. There are a number of inherent uncertainties associated with estimating reserves. By their nature, these estimates of reserves, including the estimates of future prices and costs, and related future cash flows are subject to measurement uncertainty, and the impact on the consolidated financial statements of future periods could be material. Amounts recorded for depreciation of major facilities and equipment and transportation and storage assets are based on management s best estimate of their useful lives. Accordingly, those amounts are subject to measurement uncertainty. In addition, management is required to make estimates and assumptions and use judgment regarding the timing of when major development projects are ready for their planned use, which also determines when these assets are subject to depletion and depreciation. (b) Exploration and evaluation assets The application of the Corporation s accounting policy for exploration and evaluation expenditures requires judgment in determining whether it is likely that future economic benefit exists when activities have not reached a stage where technical feasibility and commercial viability can be reasonably determined and when technical feasibility and commercial viability have been reached. Estimates and assumptions may change as new information becomes available. MEG ENERGY 2016 ANNUAL REPORT 83
86 (c) Bitumen reserves The estimation of reserves involves the exercise of judgment. Forecasts are based on engineering data, estimated future prices, expected future rates of production and the cost and timing of future capital expenditures, all of which are subject to many uncertainties and interpretations. The Corporation expects that over time its reserves estimates will be revised either upward or downward based on updated information such as the results of future drilling, testing and production. Reserves estimates can have a significant impact on net earnings, as they are a key component in the calculation of depletion and depreciation and for determining potential asset impairment. For example, a revision to the proved reserves estimates would result in a higher or lower depletion and depreciation charge to net earnings. Downward revisions to reserves estimates may also result in an impairment of PP&E carrying amounts. (d) Joint control Judgment is required to determine whether an interest the Corporation holds in a joint arrangement should be classified as a joint operation or joint venture. The determination includes an assessment as to whether the Corporation has the rights to the assets and obligations for the liabilities of the arrangement or the rights to the net assets. (e) Provisions i. Decommissioning provision Decommissioning costs are incurred when certain of the Corporation s tangible long-lived assets are retired. Assumptions, based on current economic factors which management believes are reasonable, have been made to estimate the future liability. However, the actual cost of decommissioning is uncertain and cost estimates may change in response to numerous factors including changes in legal requirements, technological advances, inflation and the timing of expected decommissioning and restoration. The impact to net earnings over the remaining economic life of the assets could be significant due to the changes in cost estimates as new information becomes available. In addition, management exercises judgment to determine the appropriate discount rate at the end of each reporting period. This discount rate, which is a credit-adjusted risk-free rate, is used to determine the present value of the estimated future cash outflows required to settle the obligation and may change in response to numerous market factors. ii. Onerous contracts A contract is considered to be onerous when the unavoidable costs of meeting the obligations under the contract exceed the economic benefits expected to be derived from the contract. The determination of when to record a provision for an onerous contract is a complex process that involves management judgment about outcomes of future events and estimates concerning the nature, extent and timing of expected future cash flows and discount rates related to the contract. 84 Notes to consolidated financial statements
87 (f) Impairments CGU s are defined as the lowest grouping of integrated assets that generate identifiable cash inflows that are largely independent of the cash inflows of other assets or groups of assets. The classification of assets into CGU s requires significant judgment and interpretations with respect to the integration between assets, the existence of active markets, external users, shared infrastructures, and the way in which management monitors the Corporation s operations. The recoverable amounts of CGU s and individual assets have been determined as the higher of the CGU s or the asset s fair value less costs of disposal and its value in use. These calculations require the use of estimates and assumptions and are subject to changes as new information becomes available including information on future commodity prices, expected production volumes, quantity of reserves and discount rates as well as future development and operating costs. Changes in assumptions used in determining the recoverable amount could affect the carrying value of the related assets and CGU s. (g) Stock-based compensation The fair values of equity-settled and cash-settled share-based compensation plans are estimated using the Black-Scholes options pricing model. These estimates are based on the share price at the date of grant and on several assumptions, including the risk-free interest rate, the future forfeiture rate, the expected volatility of the Corporation s share price and the future attainment of performance criteria. Accordingly, these estimates are subject to measurement uncertainty. (h) Deferred income taxes Tax regulations and legislation and the interpretations thereof in which the Corporation operates are subject to change. As such, income taxes are subject to measurement uncertainty. The Corporation follows the liability method of accounting for income taxes. Deferred income taxes are recognized in respect of temporary differences between the carrying amounts of assets and liabilities for financial reporting purposes and the amounts used for taxation purposes. Deferred income taxes are measured at the tax rates that are expected to be applied to temporary differences when they reverse, based on the laws that have been enacted or substantively enacted at the reporting date. The periods in which timing differences reverse are impacted by future earnings and capital expenditures. Rates are also affected by changes to tax legislation. Income taxes are recognized in net earnings except to the extent that they relate to items recognized directly in shareholders equity, in which case the income taxes are recognized in shareholders equity. The Corporation also makes interpretations and judgments on the application of tax laws for which the eventual tax determination may be uncertain. To the extent that interpretations change, there may be a significant impact on the consolidated financial statements. MEG ENERGY 2016 ANNUAL REPORT 85
88 (i) Derivative financial instruments The estimated fair values of financial assets and liabilities, by their very nature, are subject to measurement uncertainty due to their exposure to credit, liquidity and market risks. Furthermore, the Corporation may use derivative instruments to manage commodity price, foreign currency and interest rate exposures. The fair values of these derivatives are determined using valuation models which require assumptions concerning the amount and timing of future cash flows, and discount rates. Management s assumptions rely on external observable market data including quoted forward commodity prices and volatility, interest rate yield curves and foreign exchange rates. The resulting fair value estimates may not be indicative of the amounts realized or settled in current market transactions and as such are subject to measurement uncertainty. 5. Trade receivables and other As at December Trade receivables $ 219,054 $ 130,187 Deposits and advances 13,571 15,491 Current portion of deferred financing costs 4,364 4,364 $ 236,989 $ 150, Inventories As at December Diluent $ 17,859 $ 18,157 Bitumen blend 46,571 32,669 Materials and supplies 1,964 2,253 $ 66,394 $ 53,079 During the year ended December 31, 2016, a total of $0.8 billion ( $0.9 billion) in inventory product costs were charged to earnings through diluent and transportation expense. 86 Notes to consolidated financial statements
89 7. Property, plant and equipment Crude oil Transportation and storage Corporate assets Cost Balance as at December 31, 2014 $ 7,539,369 $ 1,560,314 $ 47,117 $ 9,146,800 Additions 254,586 54,515 3, ,060 Change in decommissioning liabilities (25,711) (2,344) - (28,055) Transfer to other assets (Note 10) - (6,938) - (6,938) Balance as at December 31, 2015 $ 7,768,244 $ 1,605,547 $ 51,076 $ 9,424,867 Additions 115,832 4,544 4, ,283 Derecognition (3,641) - - (3,641) Change in decommissioning liabilities (2,426) 27 - (2,399) Balance as at December 31, 2016 $ 7,878,009 $ 1,610,118 $ 55,983 $ 9,544,110 Accumulated depletion and depreciation Balance as at December 31, 2014 $ 883,723 $ 51,113 $ 16,474 $ 951,310 Depletion and depreciation 426,946 29,227 5, ,797 Balance as at December 31, 2015 $ 1,310,669 $ 80,340 $ 22,098 $ 1,413,107 Depletion and depreciation 459,681 30,493 5, ,210 Derecognition (3,641) - - (3,641) Balance as at December 31, 2016 $ 1,766,709 $ 110,833 $ 27,134 $ 1,904,676 Carrying amounts Balance as at December 31, 2015 $ 6,457,575 $ 1,525,207 $ 28,978 $ 8,011,760 Balance as at December 31, 2016 $ 6,111,300 $ 1,499,285 $ 28,849 $ 7,639,434 Total During the year ended December 31, 2016, the Corporation did not capitalize any interest and finance charges related to the development of capital projects (year ended December 31, $56.4 million). As at December 31, 2016, $547.9 million of assets under construction were included within property, plant and equipment (December 31, $663.8 million). Assets under construction are not subject to depletion and depreciation. As at December 31, 2016, no impairment has been recognized on property, plant and equipment as the net present value of future cash flows exceeded the carrying value of the respective CGUs. MEG ENERGY 2016 ANNUAL REPORT 87
90 8. Exploration and evaluation assets Cost Balance as at December 31, 2014 $ 588,526 Additions 1,458 Dispositions (41,827) Change in decommissioning liabilities (1,736) Balance as at December 31, 2015 $ 546,421 Additions 2,265 Exploration expense (1,248) Change in decommissioning liabilities 314 Balance as at December 31, 2016 $ 547,752 Exploration and evaluation assets consist of exploration projects which are pending the determination of proved or probable reserves. These assets are not subject to depletion, as they are in the exploration and evaluation stage, but are reviewed on a quarterly basis for any indication of impairment. If it is determined that the project is not technically feasible and commercially viable or if the Corporation decides not to continue the exploration and evaluation activity, the unrecoverable accumulated costs are expensed as exploration expense. As at December 31, 2016, these assets were assessed for impairment within the aggregation of all of the Corporation s CGUs and no impairment has been recognized on exploration and evaluation assets. In the fourth quarter of 2015, the Corporation completed a sale of a non-core undeveloped oil sands asset to an unrelated third party for gross proceeds of $110.0 million, resulting in a gain of $68.2 million. 88 Notes to consolidated financial statements
91 9. Other intangible assets Cost Balance as at December 31, 2014 $ 89,780 Additions 6,498 Balance as at December 31, 2015 $ 96,278 Additions 16,643 Balance as at December 31, 2016 $ 112,921 Accumulated depreciation Balance as at December 31, 2014 $ 6,690 Depreciation 5,446 Balance as at December 31, 2015 $ 12,136 Impairment 80,072 Depreciation 4,602 Balance as at December 31, 2016 $ 96,810 Carrying amounts Balance as at December 31, 2015 $ 84,142 Balance as at December 31, 2016 $ 16,111 At December 31, 2016, the Corporation evaluated its investment in the right to participate in the Northern Gateway pipeline for impairment in relation to the December 6, 2016, directive from the Government of Canada to the National Energy Board to dismiss the project application. As a result, the Corporation fully impaired its investment and has recognized an impairment charge of $80.1 million. As at December 31, 2016, other intangible assets consist of $16.1 million invested in software that is not an integral component of the related computer hardware. As at December 31, 2015, these assets included $63.6 million invested to maintain the right to participate in the Northern Gateway pipeline project and $20.5 million invested in software that is not an integral component of the related computer hardware. 10. Other assets As at December Long-term pipeline linefill (a) $ 129,733 $ 131,141 Deferred financing costs (b) 12,001 16,366 U.S. auction rate securities (c) - 3, , ,977 Less current portion of deferred financing costs (4,364) (4,365) $ 137,370 $ 146,612 MEG ENERGY 2016 ANNUAL REPORT 89
92 (a) The Corporation has entered into agreements to transport diluent and bitumen blend on third-party owned pipelines and is required to supply linefill for these pipelines. As these pipelines are owned by thirdparties, the linefill is not considered to be a component of the Corporation s property, plant and equipment. The linefill is classified as a long-term asset as these transportation contracts extend beyond the year As at December 31, 2016, no impairment has been recognized on these assets. (b) Costs associated with establishing the Corporation s revolving credit facility are deferred and amortized over the term of the credit facility. (c) In the fourth quarter of 2016, the Corporation disposed of these securities for proceeds of $3.2 million. 11. Accounts payable and accrued liabilities As at December Trade payables $ 2,971 $ 2,576 Accrued and other liabilities 217, ,331 Interest payable 71,945 74,084 $ 292,340 $ 217, Long-term debt As at December Senior secured term loan (December 31, US$1.236 billion; December 31, US$1.249 billion; due 2020) (a) $ 1,658,906 $ 1,727, % senior unsecured notes (US$750 million; due 2021) (b) 1,007,025 1,038, % senior unsecured notes (US$800 million; due 2023) (c) 1,074,160 1,107, % senior unsecured notes (US$1.0 billion; due 2024) (d) 1,342,700 1,384,000 5,082,791 5,257,124 Debt redemption premium (e) 21,812 - Less current portion of senior secured term loan (17,455) (17,992) Less unamortized financial derivative liability discount (11,143) (14,377) Less unamortized deferred debt issue costs (22,766) (34,392) $ 5,053,239 $ 5,190,363 The U.S. dollar denominated debt was translated into Canadian dollars at the year-end exchange rate of US$1 = C$ (December 31, 2015 US$1 = C$1.3840). All of the Corporation s long-term debt is covenant-lite in structure, meaning it is free of any financial maintenance covenants and is not dependent on, nor calculated from, the Corporation s crude oil reserves. 90 Notes to consolidated financial statements
93 (a) As at December 31, 2016, the senior secured credit facilities are comprised of a US$1.236 billion term loan and a US$2.5 billion revolving credit facility. The senior secured credit facilities are secured by substantially all the assets of the Corporation. The term loan bears a floating interest rate based on either U.S. Prime or LIBOR, at the Corporation s option, plus a credit spread of 175 or 275 basis points, respectively. The term loan also has an interest rate floor of 200 basis points based on U.S. Prime or 100 basis points based on LIBOR. The term loan is to be repaid in quarterly installment payments equal to US$3.25 million, with the balance due on March 31, These facilities have been amended through a comprehensive refinancing plan completed on January 27, 2017; refer to subsequent events (Note 32). Effective December 15, 2014, the Corporation entered into a five-year US$500.0 million guaranteed letter of credit facility guaranteed by Export Development Canada. The facility matures on November 5, Letters of credit issued under this facility do not consume capacity of the revolving credit facility. As at December 31, 2016, letters of credit of US$318.0 million had been issued under this facility. On February 15, 2017, this facility was amended and extended; refer to subsequent events (Note 32). (b) Effective March 18, 2011, the Corporation issued US$750.0 million in aggregate principal amount of 6.5% Senior Unsecured Notes, with a maturity date of March 15, Interest is paid semi-annually on March 15 and September 15. No principal payments are required until March 15, The 6.5% Senior Unsecured Notes have been refinanced and replaced with new 6.5% second lien secured notes through a comprehensive refinancing plan completed on January 27, 2017, along with the planned redemption of these notes on March 15, 2017; refer to subsequent events (Note 32). (c) Effective July 19, 2012, the Corporation issued US$800.0 million in aggregate principal amount of 6.375% Senior Unsecured Notes, with a maturity date of January 30, Interest is paid semi-annually on January 30 and July 30. No principal payments are required until January 30, (d) Effective October 1, 2013, the Corporation issued US$800.0 million in aggregate principal amount of 7.0% Senior Unsecured Notes, with a maturity date of March 31, On November 6, 2013 an additional US$200 million of 7.0% Senior Unsecured Notes were issued under the same indenture. Interest is paid semi-annually on March 31 and September 30. No principal payments are required until March 31, (e) The 6.5% senior unsecured notes have a prepayment option where the Corporation is required to make an estimate at each reporting date of the likelihood of the prepayment option being exercised. At December 31, 2016, it was determined that it was probable that the prepayment option would be exercised. As such, the Corporation recognized the 2.166% premium that will be payable on the planned redemption of these notes on March 15, 2017, under the comprehensive refinancing plan completed on January 27, 2017 (Note 32). The debt redemption premium of $21.8 million and the associated remaining unamortized deferred debt issue costs of $7.0 million have been recognized as debt extinguishment expense. Required debt principal repayments Thereafter $17,455 $17,455 $17,455 $1,606,541 $1,007,025 $2,416,860 MEG ENERGY 2016 ANNUAL REPORT 91
94 13. Provisions and other liabilities As at December Decommissioning provision (a) $ 133,924 $ 130,381 Onerous contracts provision (b) 100,159 58,178 Derivative financial liabilities (c) 3,714 16,223 Deferred lease inducements 3,304 3,805 Provisions and other liabilities 241, ,587 Less current portion (23,063) (12,313) Non-current portion $ 218,038 $ 196,274 (a) Decommissioning provision: The following table presents the decommissioning provision associated with the reclamation and abandonment of the Corporation s property, plant and equipment and exploration and evaluation assets: As at December Balance, beginning of year $ 130,381 $ 156,382 Changes in estimated future cash flows (91) 14,076 Changes in discount rates and settlement dates (6,117) (48,933) Liabilities incurred 4,123 5,066 Liabilities settled (1,290) (1,873) Accretion 6,918 5,663 Balance, end of year 133, ,381 Less current portion (3,097) (1,485) Non-current portion $ 130,827 $ 128,896 The decommissioning provision represents the present value of the estimated future costs for the reclamation and abandonment of the Corporation s property, plant and equipment and exploration and evaluation assets. The total undiscounted amount of the estimated future cash flows to settle the decommissioning obligations is $825.1 million (December 31, $816.4 million). The Corporation has estimated the net present value of the decommissioning obligations using a weighted average creditadjusted risk-free rate of 8.2% (December 31, %). As at December 31, 2016, a 1% increase in the credit-adjusted risk-free rate would result in a $13.0 million decrease in the present value of the decommissioning provision. The decommissioning provision is estimated to be settled in periods up to the year 2066 (December 31, 2015 periods up to the year 2064). 92 Notes to consolidated financial statements
95 (b) Onerous contracts provision: As at December Balance, beginning of year $ 58,178 $ - Changes in estimated future cash flows 40,499 - Changes in discount rates (1,478) - Liabilities incurred 8,845 58,719 Liabilities settled (6,116) (541) Accretion Balance, end of year 100,159 58,178 Less current portion (18,930) (1,993) Non-current portion $ 81,229 $ 56,185 As at December 31, 2016, the Corporation has recognized a total provision of $100.2 million related to certain onerous operating lease contracts (December 31, 2015 $58.2 million). The provision represents the present value of the difference between the minimum future payments that the Corporation is obligated to make under the non-cancellable onerous operating lease contracts and estimated recoveries. These cash flows have been discounted using a risk-free discount rate of 1.3% (December 31, %). This estimate may vary as a result of changes in estimated recoveries. (c) Derivative financial liabilities: As at December % interest rate floor $ 3,714 $ 11,740 Interest rate swaps (Note 27) - 4,483 Derivative financial liabilities 3,714 16,223 Less current portion (517) (8,316) Non-current portion $ 3,197 $ 7,907 The interest rate floor on the senior secured term loan has been recognized as an embedded derivative, as the floor rate exceeded the market rate of interest at the time that the debt was incurred. The Corporation is exposed to interest rate risk in relation to interest income earned on cash and cash equivalents and in relation to interest expense on floating rate long-term debt. To mitigate a portion of the risk of interest rate increases on long-term debt, the Corporation periodically enters into interest rate swap contracts to manage its floating to fixed interest rate mix on long-term debt. As at December 31, 2016, the Corporation does not have any outstanding interest rate swap contracts. MEG ENERGY 2016 ANNUAL REPORT 93
96 14. Income taxes The income tax provisions differ from results which would be obtained had the Corporation applied the combined federal and provincial statutory rates of 27% ( %) to earnings or loss before income taxes. The reasons for these differences are as follows: For the years ended December Expected income tax recovery $ (171,780) $ (328,017) Add (deduct) the tax effect of: Stock-based compensation 9,069 13,027 Non-taxable loss (gain) on foreign exchange (21,232) 110,815 Taxable capital loss (gain) not recognized (21,232) 110,815 Tax benefit of vested RSUs (2,133) (5,507) Rate change - 14,350 Rate variance 120 (3,908) Scientific research and experimental development input tax credits - (3,622) Other (306) 114 Income tax expense (recovery) $ (207,494) $ (91,933) Current income tax expense (recovery) $ 919 $ (1,200) Deferred income tax expense (recovery) (208,413) (90,733) Income tax expense (recovery) $ (207,494) $ (91,933) During the year ended December 31, 2016, the Corporation recognized a current income tax expense of $0.9 million relating to U.S. income tax associated with its operations in the United States. The Corporation s Canadian operations are not currently taxable. During the year ended December 31, 2015, the Corporation recognized a recovery of $1.2 million relating to the refundable Alberta tax credit on Scientific Research and Experimental Development expenditures. In June 2015, the Government of Alberta enacted an increase in the Alberta corporate income tax rate from 10% to 12%. As a result, the Corporation increased its 2015 opening deferred income tax liability by $14.4 million, with a corresponding increase to its 2015 deferred income tax expense. Based on the Corporation s independently evaluated reserve report, the Corporation has recognized a deferred tax asset. Future taxable income is expected to be sufficient to realize the deferred tax asset. The deferred tax asset is reviewed at each balance sheet date to assess whether it is probable that the related tax benefit will be realized. 94 Notes to consolidated financial statements
97 The analysis of deferred tax assets (liabilities) is as follows: As at December Deferred tax assets: Deferred tax assets to be recovered after more than 12 months $ 1,255,527 $ 1,000,382 Deferred tax assets to be recovered within 12 months 17,627 10,071 1,273,154 1,010,453 Deferred tax liabilities: Deferred tax liabilities to be recovered after more than 12 months (1,151,317) (1,097,922) Deferred tax liabilities to be recovered within 12 months (893) - (1,152,210) (1,097,922) Deferred tax asset (liabilities), net $ 120,944 $ (87,469) The net movement within the deferred tax assets (liabilities) is as follows: Balance as at January 1 $ (87,469) $ (178,196) Credited (charged) to earnings 208,413 90,733 Credited (charged) to other comprehensive income - (6) Balance as at December 31 $ 120,944 $ (87,469) The movements in deferred income tax assets and liabilities during the years are as follows: Deferred tax assets Tax losses Derivative financial liabilities Provisions Other Total Balance as at December 31, 2014 $ 685,505 $ 7,378 $ 1,152 $ 6,657 $ 700,692 Credited (charged) to earnings 288,160 (2,998) 1,115 23, ,767 Credited (charged) to other comprehensive income (6) (6) Balance as at December 31, 2015 $ 973,665 $ 4,380 $ 2,267 $ 30,141 $ 1,010,453 Credited (charged) to earnings 234,390 4,807 1,520 21, ,701 Balance as at December 31, 2016 $ 1,208,055 $ 9,187 $ 3,787 $ 52,125 $ 1,273,154 MEG ENERGY 2016 ANNUAL REPORT 95
98 Deferred tax liabilities Property, plant and equipment Other Total Balance as at December 31, 2014 $ (871,679) $ (7,209) $ (878,888) Credited (charged) to earnings (215,749) (3,285) (219,034) Balance as at December 31, 2015 $ (1,087,428) $ (10,494) $ (1,097,922) Credited (charged) to earnings (54,996) 708 (54,288) Balance as at December 31, 2016 $ (1,142,424) $ (9,786) $ (1,152,210) As at December 31, 2016, the Corporation had approximately $8.0 billion in available tax pools (December 31, $7.3 billion). Included in the tax pools are $4.5 billion of non-capital loss carry forward balances ($0.2 billion expiring in 2026; $0.2 billion expiring in 2027; $0.3 billion expiring in 2028; $0.5 billion expiring in 2029; $0.2 billion expiring in 2030 and $3.1 billion expiring after 2030). In addition, as at December 31, 2016, the Corporation had an additional $0.2 billion (December 31, $0.6 billion) of capital investment in incomplete projects which will serve to increase available tax pools upon completion of the projects. As at December 31, 2016, the Corporation had not recognized the tax benefit related to $0.6 billion of unrealized taxable capital foreign exchange losses (December 31, $0.7 billion). 15. Share capital Authorized: Unlimited number of common shares Unlimited number of preferred shares Changes in issued common shares are as follows: Year ended December Number Number of shares Amount of shares Amount Balance, beginning of year 224,996,989 $ 4,836, ,846,891 $ 4,797,853 Issued upon vesting and release of RSUs and PSUs 1,470,118 41,807 1,150,098 38,947 Balance, end of year 226,467,107 $ 4,878, ,996,989 $ 4,836,800 On January 27, 2017, the Corporation issued 66,815,000 common shares pursuant to a $518 million equity issuance; refer to subsequent events (Note 32). 96 Notes to consolidated financial statements
99 16. Stock-based compensation The Corporation has a number of stock-based compensation plans which include stock options, restricted share units ( RSUs ), performance share units ( PSUs ) and deferred share units ( DSUs ). Further detail on each of these plans is outlined below. (a) Cash-settled plans i. Restricted share units and performance share units: In June 2016, the Corporation granted RSUs and PSUs under a new cash-settled Restricted Share Unit Plan. RSUs generally vest over a three-year period while PSUs generally vest on the third anniversary of the grant date, provided that the Corporation satisfies certain performance criteria identified by the Corporation s Board of Directors within a target range. Upon vesting of the RSUs and PSUs, the participants of the cash-settled RSU plan will receive a cash payment based on the fair value of the underlying share units at the vesting date. The cash-settled RSUs and PSUs are accounted for as liability instruments and are measured at fair value based on the market value of the Corporation s common shares at each period end. Fluctuations in the fair value are recognized within stock-based compensation expense or capitalized to property, plant and equipment during the period in which they occur. RSUs and PSUs outstanding: Year ended December 31, 2016 Outstanding, beginning of year - Granted 6,132,701 Forfeited (119,691) Outstanding, end of year 6,013,010 ii. Deferred share units outstanding: The Deferred Share Unit Plan allows for the granting of DSUs to directors of the Corporation. A DSU represents the right for the holder to receive a cash payment equal to the fair market value of the Corporation s common shares calculated at the date of such payment or, at the election of the Corporation, its equivalent in fully-paid common shares purchased through a broker. DSUs vest immediately when granted and are redeemed on the third business day following the date on which the holder ceases to be a director. As at December 31, 2016, there were 163,954 DSUs outstanding (December 31, ,696 DSUs outstanding). As at December 31, 2016, the Corporation has recognized a liability of $19.2 million relating to the fair value of cash-settled RSUs, PSUs and DSUs. MEG ENERGY 2016 ANNUAL REPORT 97
100 (b) Equity-settled plans i. Stock options outstanding: The Corporation s Stock Option Plan allows for the granting of stock options to directors, officers, employees and consultants of the Corporation. Stock options granted are generally fully exercisable after three years and expire seven years after the grant date. Year ended December Weighted average Weighted average Stock options exercise price Stock options exercise price Outstanding, beginning of year 9,925,313 $ ,865,788 $ Granted 1,214, ,968, Forfeited (851,422) (531,473) Expired (1,007,005) (377,800) Outstanding, end of year 9,281,186 $ ,925,313 $ As at December 31, 2016 Range of exercise prices Options Outstanding Weighted average exercise price Weighted average remaining life (in years) Options Vested Weighted average exercise price Weighted average remaining life (in years) $ $ ,203,700 $ $ - - $ $ ,627, , $ $ , , $ $ ,736, ,241, $ $ , , ,281,186 $ ,816,854 $ The fair value of each option granted during the years ended December 31, 2016 and 2015 was estimated on the date of the grant using the Black-Scholes option pricing model with weighted average assumptions for grants as follows: Risk-free rate 0.57% 1.01% Expected lives 5 years 5 years Volatility 53% 40% Annual dividend per share $ nil $ nil Fair value of options granted $ 3.20 $ Notes to consolidated financial statements
101 ii. Restricted share units and performance share units: RSUs granted under the equity-settled Restricted Share Unit Plan generally vest annually over a threeyear period. PSUs granted under the equity-settled Restricted Share Unit Plan generally vest on the third anniversary of the grant date, provided that the Corporation satisfies certain performance criteria identified by the Corporation s Board of Directors within a target range. RSU and PSU grants made prior to June 2016 are captured under the equity-settled plan, whereby upon vesting, the holder receives the right to a cash payment equal to the fair market value of the Corporation s common shares calculated at the date of such payment or, at the election of the Corporation, its equivalent in fully-paid common shares. The Corporation does not intend to make cash payments under the equity-settled RSU plan. RSUs and PSUs outstanding: Year ended December Outstanding, beginning of year 3,280,112 2,745,439 Granted - 1,996,841 Vested and released (1,470,118) (1,150,098) Forfeited (154,388) (312,070) Outstanding, end of year 1,655,606 3,280,112 (c) Stock-based Compensation Year ended December Cash-settled $ 16,354 $ - Equity-settled 33,588 50,105 Stock-based compensation expense $ 49,942 $ 50, Petroleum revenue, net of royalties Year ended December Petroleum revenue (a) Proprietary $ 1,626,025 $ 1,799,154 Third-party (b) 205, ,464 Petroleum revenue 1,831,815 1,903,618 Royalties (8,581) (20,765) Petroleum revenue, net of royalties $ 1,823,234 $ 1,882,853 (a) The Corporation had four major customers each with revenue in excess of 10% of total petroleum revenue. Sales to major customers totaled $1.1 billion for the year ended December 31, 2016 (year ended December 31, $1.1 billion). (b) The Corporation purchases crude oil products from third-parties for marketing-related activities. These purchases and associated storage charges are included in the consolidated statement of earnings (loss) and comprehensive income (loss) under the caption Purchased product and storage. MEG ENERGY 2016 ANNUAL REPORT 99
102 18. Other revenue Year ended December Power revenue $ 18,868 $ 29,239 Transportation revenue 19,791 13,824 Insurance proceeds (a) 4,391 - Other revenue $ 43,050 $ 43,063 (a) Includes insurance proceeds related to the small fire that occurred during the first quarter of 2016, which caused damage to the Sulphur Recovery Unit at the Corporation s Christina Lake facility. 19. Diluent and transportation Year ended December Diluent expense $ 808,030 $ 893,995 Transportation expense 209, ,382 Diluent and transportation $ 1,017,894 $ 1,050, Foreign exchange loss (gain), net Year ended December Unrealized foreign exchange loss (gain) on: Long-term debt $ (157,272) $ 852,422 Other 9,119 (67,112) Unrealized net loss (gain) on foreign exchange (148,153) 785,310 Realized loss (gain) on foreign exchange (3,242) 16,429 Foreign exchange loss (gain), net $ (151,395) $ 801,739 C$ equivalent of 1 US$ Beginning of year End of year Notes to consolidated financial statements
103 21. Net finance expense Year ended December Total interest expense $ 328,335 $ 313,411 Less capitalized interest - (56,449) Net interest expense 328, ,962 Debt extinguishment expense (a) 28,845 - Accretion on provisions 7,150 5,663 Unrealized gain on derivative financial liabilities (12,508) (13,289) Realized loss on interest rate swaps 4,548 5,858 Net finance expense $ 356,370 $ 255,194 (a) At December 31, 2016, the Corporation recognized $28.8 million of debt extinguishment expense associated with the planned redemption of the 6.5% Senior Unsecured Notes on March 15, 2017, under the comprehensive refinancing plan completed on January 27, 2017 (Note 32). The debt extinguishment expense is comprised of a redemption premium of $21.8 million and the associated remaining unamortized deferred debt issue costs of $7.0 million. 22. Other expenses Year ended December Onerous contracts (a) $ 47,866 $ 58,719 Severance and other 16,242 - Contract cancellation - 12,879 Other expenses $ 64,108 $ 71,598 (a) During the year ended December 31, 2016, the Corporation recognized an expense of $47.9 million (December 31, $58.7 million) related to certain onerous Calgary office lease contracts (Note 13 (b) ). 23. Wages and employee benefits expense Year ended December Operating expense: Salaries and wages (1) $ 48,958 $ 57,130 Short-term employee benefits 5,928 6,101 General and administrative expense: Salaries and wages (1) 63,489 78,394 Short-term employee benefits 11,400 12,153 $ 129,775 $ 153,778 (1) Excludes severance included in other expenses (Note 22) MEG ENERGY 2016 ANNUAL REPORT 101
104 24. Transactions with related parties During the years ended December 31, 2016 and December 31, 2015, related party transactions include the compensation of key management personnel. The Corporation considers directors and officers of the Corporation as key management personnel. During the year ended December 31, 2015, the Corporation paid $0.3 million in costs on behalf of WP Lexington Private Equity B.V. ( WP Lex ). WP Lex is considered to be a related party of the Corporation as two managing directors of WP Lex also hold positions as members of the Board of Directors of the Corporation. Year ended December Salaries and short-term employee benefits $ 9,117 $ 8,710 Share-based compensation 12,006 13,323 Termination benefits 1,617 - $ 22,740 $ 22, Supplemental cash flow disclosures Year ended December Cash provided by (used in): (a) Trade receivables and other $ (83,601) $ 46,852 Inventories (13,524) 47,492 Accounts payable and accrued liabilities 74,667 (228,808) $ (22,458) $ (134,464) Changes in non-cash working capital relating to: Operating $ (25,061) $ 77,991 Investing 2,603 (212,455) $ (22,458) $ (134,464) Cash and cash equivalents: (b) Cash $ 156,230 $ 222,341 Cash equivalents - 185,872 $ 156,230 $ 408,213 Cash interest paid $ 286,983 $ 267,347 Cash interest received $ 1,046 $ 2,860 (a) The amounts for the year ended December 31, 2015 exclude non-cash working capital items primarily related to $52.2 million of inventory transferred to other assets. (b) As at December 31, 2016, C$102.8 million of the Corporation s total cash and cash equivalents balance was held in U.S. dollars. (December 31, C$277.1 million). The U.S. dollar cash and cash equivalents balance has been translated into Canadian dollars at the year end exchange rate of US$1 = C$ (December 31, US$1 = C$1.3840). 102 Notes to consolidated financial statements
105 26. Net loss per common share Year ended December Net loss $ (428,726) $ (1,169,671) Weighted average common shares outstanding (a) 225,982, ,579,249 Dilutive effect of stock options, RSUs and PSUs (b) - - Weighted average common shares outstanding - diluted 225,982, ,579,249 Net loss per share, basic $ (1.90) $ (5.21) Net loss per share, diluted $ (1.90) $ (5.21) (a) Weighted average common shares outstanding for the year ended December 31, 2016 includes 184,425 PSUs not yet released (year ended December 31, ,929 PSUs). (b) For the years ended December 31, 2016 and December 31, 2015, there was no dilutive effect of stock options, RSUs and PSUs due to the Corporation incurring a net loss. If the Corporation had recognized net earnings during the year ended December 31, 2016, the dilutive effect of stock options, RSUs and PSUs would have been 122,500 (year ended December 31, ,201) weighted average common shares. 27. Financial instruments and risk management The financial instruments recognized on the consolidated balance sheet are comprised of cash and cash equivalents, trade receivables and other, U.S. auction rate securities ( ARS ) included within other assets, commodity risk management contracts, accounts payable and accrued liabilities, derivative financial liabilities included within provisions and other liabilities, long-term debt and debt redemption premium liability included within long-term debt. As at December 31, 2016, commodity risk management contracts and the derivative financial liabilities were classified as held-for-trading financial instruments; cash and cash equivalents and trade receivables and other were classified as loans and receivables; and accounts payable and accrued liabilities were classified as other financial liabilities. Long-term debt was carried at amortized cost. The carrying value of cash and cash equivalents, trade receivables and other, and accounts payable and accrued liabilities included on the consolidated balance sheet approximate the fair value of the respective assets and liabilities due to the short-term nature of those instruments. MEG ENERGY 2016 ANNUAL REPORT 103
106 (a) Fair value measurement of ARS, long-term debt, derivative financial liabilities, commodity risk management contracts and debt redemption premium liability: As at December 31, 2016 Recurring measurements: Financial liabilities Fair value measurements using Carrying amount Level 1 Level 2 Level 3 Long-term debt (1) (Note 12) $ 5,082,791 - $ 4,768,344 - Derivative financial liabilities (Note 13) $ 3,714 - $ 3,714 - Commodity risk management contracts $ 30,313 - $ 30,313 - Debt redemption premium (Note 12) $ 21,812 - $ 21,812 - As at December 31, 2015 Fair value measurements using Carrying amount Level 1 Level 2 Level 3 Recurring measurements: Financial assets ARS (Note 10) $ 3,470 - $ 3,470 - Financial liabilities Long-term debt (1) (Note 12) $ 5,257,124 - $ 3,999,317 - Derivative financial liabilities (Note 13) $ 16,223 - $ 16,223 - (1) Includes the current and long-term portions. Level 1 fair value measurements are based on unadjusted quoted market prices. As at December 31, 2016, the Corporation did not have any financial instruments measured at Level 1 fair value. Level 2 fair value measurements are based on valuation models and techniques where the significant inputs are derived from quoted prices or indices. The estimated fair values of the ARS and long-term debt are derived using quoted prices in an inactive market from a third-party independent broker. The fair value of commodity risk management contracts and the derivative financial liabilities are derived using third-party valuation models which require assumptions concerning the amount and timing of future cash flows and discount rates. Management s assumptions rely on external observable market data including forward prices for commodities, interest rate yield curves and foreign exchange rates. The observable inputs may be adjusted using certain methods, which include extrapolation to the end of the term of the contract. 104 Notes to consolidated financial statements
107 Level 3 fair value measurements are based on unobservable information. As at December 31, 2016, the Corporation did not have any financial instruments measured at Level 3 fair value. The Corporation recognizes transfers into and transfers out of fair value hierarchy levels as of the date of the event or change in circumstances that caused the transfer. (b) Commodity price risk management: In 2016, the Corporation entered into derivative financial instruments to manage commodity price risk. The use of these commodity risk management contracts is governed by a Risk Management Committee that follows guidelines and limits approved by the Board of Directors. The Corporation does not use financial derivatives for speculative purposes. Commodity risk management contracts are measured at fair value, with gains and losses on re-measurement included in the consolidated statement of earnings (loss) and comprehensive income (loss) in the period in which they arise. The Corporation has the following commodity risk management contracts relating to crude oil sales outstanding as at December 31, 2016: As at December 31, 2016 Volumes (bbls/d) Term Average Price (US$/bbl) Fixed Price: WTI (1) Fixed Price 3,500 Jan 1, 2017 Jun 30, 2017 $52.54 WTI Fixed Price 13,100 Jul 1, 2017 Dec 31, 2017 $55.19 WCS (2) Fixed Differential 18,000 Jan 1, 2017 Jun 30, 2017 $(14.94) Collars: WTI Collars 49,250 Jan 1, 2017 Mar 31, 2017 $45.69 $54.76 WTI Collars 47,250 Apr 1, 2017 Jun 30, 2017 $45.71 $54.61 WTI Collars 28,000 Jul 1, 2017 Dec 31, 2017 $47.68 $58.53 (1) West Texas Intermediate ( WTI ) crude oil (2) Western Canadian Select ( WCS ) crude oil blend The Corporation has the following commodity risk management contracts relating to condensate purchases outstanding as at December 31, 2016: As at December 31, 2016 Volumes (bbls/d) Term Average % of WTI Mont Belvieu fixed % of WTI 15,150 Jan 1, 2017 Dec 31, % MEG ENERGY 2016 ANNUAL REPORT 105
108 The Corporation has entered into the following commodity risk management contracts relating to crude oil sales subsequent to December 31, As a result, these contracts are not reflected in the Corporation s Consolidated Financial Statements: Subsequent to December 31, 2016 Volumes (bbls/d) Term Average Price (US$/bbl) Fixed Price: WTI (1) Fixed Price 6,000 Mar 1, 2017 Jun 30, 2017 $54.82 WTI Fixed Price 9,000 Jul 1, 2017 Dec 31, 2017 $55.09 WCS (2) Fixed Differential 26,943 Feb 1, 2017 Jun 30, 2017 $(15.06) WCS Fixed Differential 28,000 Jul 1, 2017 Dec 31, 2017 $(15.62) Collars: WTI Collars 2,500 Jul 1, 2017 Dec 31, 2017 $50.00 $59.00 (1) West Texas Intermediate ( WTI ) crude oil (2) Western Canadian Select ( WCS ) crude oil blend The Corporation s commodity risk management contracts are subject to master agreements that create a legally enforceable right to offset, by counterparty, the related financial assets and financial liabilities on the Corporation s balance sheet in all circumstances. The following table provides a summary of the Corporation s unrealized offsetting commodity risk management positions: As at December 31, 2016 Asset Liability Net Gross amount $ - $ (165,740) $ (165,740) Amount offset - 135, ,427 Net amount $ - $ (30,313) $ (30,313) As at December 31, 2015 the Corporation did not have any commodity risk management contracts outstanding. The following table summarizes the commodity risk management gains and losses: For the year ended December Realized gain on commodity risk management $ (2,359) Unrealized loss on commodity risk management 30,313 Commodity risk management loss $ 27,954 As at December 31, 2015 the Corporation did not have any commodity risk management contracts outstanding. 106 Notes to consolidated financial statements
109 The following table summarizes the sensitivity of the earnings before income tax impact of fluctuating commodity prices on the Corporation s open commodity risk management positions in place as at December 31, 2016: Commodity Sensitivity Range Increase Decrease Crude oil commodity price + US$1.00 per bbl applied to WTI contracts $ (11,707) $ 9,523 Crude oil differential price (1) Condensate percentage + US$1.00 per bbl applied to WCS differential contracts $ 4,375 $ (4,375) + 1% in condensate price as a percentage of US$ WTI price per bbl applied to condensate contracts $ 3,203 $ (3,203) (1) As the WCS differential is expressed as a discount to WTI, an increase in the differential results in a lower WCS price and a decrease in the differential results in a higher WCS price. (c) Interest rate risk management: The Corporation is exposed to interest rate cash flow risk on its floating rate long-term debt and periodically enters into interest rate swap contracts to manage its floating to fixed interest rate mix on long-term debt. The Corporation does not have any outstanding interest rate swap contracts as at December 31, As at December 31, 2016, a 100 basis points increase in the LIBOR on the floating rate debt would have resulted in a $6.5 million decrease in net earnings before income taxes (December 31, $1.9 million, excluding the impact of capitalized interest). As at December 31, 2016, a 100 basis points decrease in LIBOR would have resulted in a $nil increase in net earnings before income taxes (December 31, $nil, excluding the impact of capitalized interest). (d) Foreign currency risk: Foreign currency risk is the risk that a variation in exchange rates between the Canadian dollar and foreign currencies will affect the fair value or future cash flows of the Corporation s financial assets or liabilities. The Corporation has U.S. dollar denominated long-term debt as described in Note 12. As at December 31, 2016, a $0.01 change in the U.S. dollar to Canadian dollar exchange rate would have resulted in a corresponding change in the carrying value of long-term debt of C$37.9 million (December 31, C$38.0 million). (e) Credit risk: Credit risk arises from the potential that the Corporation may incur a loss if a counterparty fails to meet its obligations in accordance with agreed terms. This credit risk exposure is mitigated through the use of credit policies governing the Corporation s credit portfolio and with credit practices that limit transactions according to counterparties credit quality. A substantial portion of accounts receivable are with investment grade customers in the energy industry and are subject to normal industry credit risk. All transactions with financial institutions are made with those that have investment grade credit ratings. At December 31, 2016, the Corporation s estimated maximum exposure to credit risk related to trade receivables, deposits and advances was $232.6 million. There were no significant trade receivables which were greater than 90 days as at December 31, MEG ENERGY 2016 ANNUAL REPORT 107
110 The Corporation s cash balances are used to fund the development of its oil sands properties. As a result, the primary objectives of the investment portfolio are low risk capital preservation and high liquidity. The cash balances are held in high interest savings accounts or are invested in high grade, liquid, shortterm instruments such as bankers acceptances, commercial paper, money market deposits or similar instruments. The cash and cash equivalents balance at December 31, 2016 was $156.2 million. None of the investments are past their maturity or considered impaired. The Corporation s estimated maximum exposure to credit risk related to its cash and cash equivalents is $156.2 million. (f) Liquidity risk: Liquidity risk is the risk that the Corporation will not be able to meet all of its financial obligations as they become due. Liquidity risk also includes the risk that the Corporation cannot generate sufficient cash flow from the Christina Lake Project or is unable to raise further capital in order to meet its obligations under its debt agreements. The lenders are entitled to exercise any and all remedies available under the debt agreements. The Corporation manages its liquidity risk through the active management of cash, debt and revolving credit facilities and by maintaining appropriate access to credit. The future undiscounted financial obligations of the Corporation are noted below: As at December 31, 2016 Total Less than 1 year 1-3 years 4-5 years More than 5 years Long-term debt $ 5,082,791 $ 17,455 $ 34,910 $ 2,613,566 $ 2,416,860 Interest on long-term debt 1,569, , , , ,659 Debt redemption premium 21,812 21, Commodity risk management contracts 30,313 30, Derivative financial liabilities 3, , Accounts payable and accrued liabilities 220, , $ 6,928,874 $ 580,432 $ 616,024 $ 3,029,899 $ 2,702,519 As at December 31, 2015 Total Less than 1 year 1-3 years 4-5 years More than 5 years Long-term debt $ 5,257,124 $ 17,992 $ 35,984 $ 1,673,948 $ 3,529,200 Interest on long-term debt 1,919, , , , ,966 Derivative financial liabilities 16,223 8,316 4,184 3,723 - Accounts payable and accrued liabilities 143, , $ 7,337,228 $ 469,609 $ 636,932 $ 2,225,521 $ 4,005, Notes to consolidated financial statements
111 28. Geographical disclosure As at December 31, 2016, the Corporation had non-current assets related to operations in the United States of $109.2 million (December 31, $111.1 million). For the year ended December 31, 2016, petroleum revenue related to operations in the United States was $664.2 million (year ended December 31, $541.5 million). 29. Joint operations The Corporation transports its bitumen blend volumes and diluent purchases on pipelines that are operated by Access Pipeline. The Corporation has an undivided 50% interest in this jointly controlled entity and presents its proportionate share of the assets, liabilities, revenues and expenses of the joint operation on a line-byline basis in the consolidated financial statements. As at December 31, 2016, the Corporation s proportionate interest in the joint operation s working capital balances was $2.9 million (December 31, $5.0 million) and its interest in related pipeline assets, recorded in property, plant and equipment, was $1.1 billion (December 31, $1.1 billion). Operating commitments of $13.3 million related to the joint operation are included within Commitments presented within Note 30 (a). 30. Commitments and contingencies (a) Commitments The Corporation had the following commitments as at December 31, 2016: Thereafter Transportation and storage $ 178,632 $ 202,913 $ 192,853 $ 232,719 $ 270,293 $ 2,997,998 Office lease rentals 33,640 32,198 32,228 33,144 33, ,543 Diluent purchases 189,721 20,725 20,725 20,782 20,725 37,986 Other operating commitments 17,827 8,440 11,657 12,354 11,552 74,077 Capital commitments 17, Commitments $ 437,316 $ 264,276 $ 257,463 $ 298,999 $ 336,112 $ 3,341,604 The Corporation s commitments have been presented on a gross basis. A portion of these committed amounts have been recognized on the balance sheet within provisions and other liabilities (Note 13 (b) ). (b) Contingencies The Corporation is involved in various legal claims associated with the normal course of operations. The Corporation believes that any liabilities that may arise pertaining to such matters would not have a material impact on its financial position. MEG ENERGY 2016 ANNUAL REPORT 109
112 31. Capital disclosures As at December 31, 2016, the Corporation s capital resources included $96.4 million of working capital, an additional undrawn US$2.5 billion syndicated revolving credit facility and a US$500.0 million guaranteed letter of credit facility under which US$318.0 million of letters of credit have been issued. Working capital is comprised of $156.2 million of cash and cash equivalents, offset by a non-cash working capital deficiency of $59.8 million. These facilities were amended on January 27, 2017 and February 15, 2017 respectively; refer to subsequent events (Note 32). The Corporation s cash is held in high interest savings accounts with a group of highly-rated financial institutions. The Corporation has also invested in high grade, liquid, short-term instruments such as bankers acceptances, commercial paper, money market deposits or similar instruments. To date, the Corporation has experienced no material loss or lack of access to its cash in operating accounts, invested cash or cash equivalents. However, the Corporation can provide no assurance that access to its invested cash and cash equivalents will not be impacted by adverse conditions in the financial markets. While the Corporation monitors the cash balances in its operating and investment accounts according to its investment policy and adjusts the cash balances as appropriate, these cash balances could be impacted if the underlying financial institutions or corporations fail or are subject to other adverse conditions in the financial markets. On December 1, 2016, the Corporation filed a Canadian base shelf prospectus for common shares, debt securities, subscription receipts, warrants and units (together referred to as Securities ) in the amount of $1.5 billion. The Canadian base shelf prospectus allows for the issuance of these Securities in Canadian dollars or other currencies from time to time in one or more offerings. As at December 31, 2016, no Securities were issued under the Canadian base shelf prospectus. The Canadian base shelf prospectus expires on January 1, Notes to consolidated financial statements
113 32. Subsequent events On January 27, 2017, the Corporation completed a comprehensive refinancing plan by way of the Corporation s Canadian base shelf prospectus dated December 1, The plan was comprised of the following four transactions: An extension of the maturity date on substantially all of the commitments under the Corporation s existing covenant-lite revolving credit facility from November 2019 to November The commitment amount of the five-year facility has been reduced from US$2.5 billion to US$1.4 billion. It has no financial covenants and is not subject to any borrowing base redetermination; The US$1.2 billion term loan has been refinanced to extend its maturity date from March 2020 to December The refinanced term loan will bear interest at an annual rate of LIBOR plus 3.5% with a LIBOR floor of 1%. The term loan was issued at a price equal to 99.75% of its face value; The existing US$750 million aggregate principal amount of 6.5% Senior Unsecured Notes, with a maturity date of March 2021, have been refinanced and replaced with new 6.5% second lien secured notes, issued at par, maturing January The existing 2021 notes will be redeemed with the proceeds from the second lien notes on March 15, 2017; and The Corporation raised C$518 million of equity, before underwriting fees and expenses, in the form of 66,815,000 subscription receipts at a price C$7.75 per subscription receipt on a bought deal basis from a syndicate of underwriters. As part of the closing, escrow release conditions for the subscription receipt offering have been satisfied and the subscription receipts have been converted into common shares. In addition to the transactions noted above, on February 15, 2017, the Corporation extended the maturity date on the Corporation s current five-year guaranteed letter of credit facility, guaranteed by Export Development Canada, to November 2021 from November The guaranteed letter of credit facility has been reduced from US$500 million to US$440 million. Letters of credit under this facility do not consume capacity of the revolving credit facility. MEG ENERGY 2016 ANNUAL REPORT 111
114 Directors and officers Board of directors Jeffrey J. McCaig (4) Chairman Alberta, Canada William (Bill) McCaffrey Alberta, Canada Boyd Anderson (1)(4) Alberta, Canada Harvey Doerr (3)(4) British Columbia, Canada Robert B. Hodgins (1)(2)(4) Alberta, Canada Timothy E. Hodgson (1)(4) Toronto, Ontario Peter R. Kagan (3)(4) New York, U.S.A. William R. (Bill) Klesse (4) San Antonio, Texas David B. Krieger (2)(4) New York, U.S.A. James D. McFarland (2)(3)(4) Alberta, Canada Diana J. McQueen (2)(4) Alberta, Canada Corporate officers William (Bill) McCaffrey President, Chief Executive Officer and Director Eric L. Toews Chief Financial Officer Don Moe Senior VP, Supply and Marketing Richard Sendall Senior VP, Strategy and Government Relations Chi-Tak Yee Senior VP, Reservoir and Geosciences Grant Borbridge VP, Legal, General Counsel and Corporate Secretary John Nearing VP, Finance and Controller John Rogers VP, Investor Relations and External Communications Chris Sloof VP, Projects Don Sutherland VP, Regulatory and Community Relations (1) Member of the Audit Committee. Mr. Hodgins is the Chairman of the Audit Committee. (2) Member of the Compensation Committee. Mr. McFarland is the Chairman of the Compensation Committee. (3) Member of the Governance and Nominating Committee. Mr. Doerr is the Chairman of the Governance and Nominating Committee. (4) Independent director. 112 Directors and officers
 564 6253 www.investorcentre.")
115 Information for shareholders MEG ENERGY CORP. SHARES ARE TRADED ON THE TORONTO STOCK EXCHANGE UNDER THE SYMBOL MEG Transfer Agent Computershare Investor Services 100 University Ave., 8th Floor Toronto, ON M5J 2Y1 Toll Free: (800) Auditor PricewaterhouseCoopers LLP Independent Reserve Evaluator GLJ Petroleum Consultants Head Office (mailing address) 8th Floor, 520 3rd Avenue SW Calgary, AB, CAN T2P 0R Annual Meeting of Shareholders May 25, 2017 Bow Glacier Room Centennial Place, West Tower 3rd Floor, 250 5th Street SW Calgary, AB Analyst and Investor Inquiries Helen Kelly Director, Investor Relations Further Information MEG s financial reports, annual regulatory filings and news releases are available at and on our website at Sign up to receive news releases and notifications of filings by clicking on the Sign-Up button on our website.
FIRST QUARTER 2018 Report to Shareholders for the period ended March 31, 2018
 FIRST QUARTER 2018 Report to Shareholders for the period ended March 31, 2018 MEG Energy Corp. reported first quarter 2018 operating and financial results on May 10, 2018. Highlights include: Record first
Management's Discussion and Analysis
 Management's Discussion and Analysis This Management's Discussion and Analysis ("MD&A") of the financial condition and performance of MEG Energy Corp. ("MEG" or the "Corporation") for the year ended December
SECOND QUARTER 2018 Report to Shareholders for the period ended June 30, 2018
 SECOND QUARTER 2018 Report to Shareholders for the period ended June 30, 2018 MEG Energy Corp. reported second quarter 2018 operating and financial results on August 2, 2018. Highlights include: Quarterly
ANNUAL REPORT
 2015 ANNUAL REPORT MEG Energy Corp. is a Canadian energy company focused on sustainable in situ development and production in the southern Athabasca oil sands region of Alberta. Strategic. Innovative.
FOURTH QUARTER 2017 Report to Shareholders for the period ended December 31, 2017
 FOURTH QUARTER 2017 Report to Shareholders for the period ended, 2017 MEG Energy Corp. reported fourth quarter and full-year 2017 operating and financial results on February 8, 2018. Highlights include:
YEAR AFTER YEAR 2014 ANNUAL REPORT
 YEAR AFTER YEAR 2014 ANNUAL REPORT c MEG Energy Corp. is a Canadian energy company focused on sustainable in situ development and production in the southern Athabasca oil sands region of Alberta. Operational
Investor Presentation February 2018
 Investor Presentation February 2018 Disclaimer This presentation is not, and under no circumstances is to be construed to be a prospectus, offering memorandum, advertisement or public offering of any securities
Investor Presentation
 Investor Presentation September 2018 Disclaimer This presentation is not, and under no circumstances is to be construed to be a prospectus, offering memorandum, advertisement or public offering of any
FOURTH QUARTER 2013 Report to Shareholders for the period ended December 31, 2013
 FOURTH QUARTER 2013 Report to Shareholders for the period ended, 2013 MEG Energy Corp. reported fourth quarter and full year 2013 operational and financial results on February 6, 2014. Highlights included:
A New Approach to the Oil Sands ANNUAL REPORT
 A New Approach to the Oil Sands 2017 ANNUAL REPORT MEG Energy Corp. is a Canadian energy company focused on sustainable in situ development and production in the southern Athabasca oil sands region of
Delivering Profitable Growth. Investor Presentation
 Delivering Profitable Growth Investor Presentation JANUARY 2012 Disclaimer This presentation is not, and under no circumstances is to be construed to be a prospectus, offering memorandum, advertisement
CONNACHER OIL AND GAS LIMITED MANAGEMENT S DISCUSSION AND ANALYSIS FOR THE THREE AND NINE MONTHS ENDED SEPTEMBER 30, 2015 OVERVIEW
 CONNACHER OIL AND GAS LIMITED MANAGEMENT S DISCUSSION AND ANALYSIS FOR THE THREE AND NINE MONTHS ENDED SEPTEMBER 30, 2015 This Management s Discussion and Analysis ( MD&A ) for Connacher Oil and Gas Limited
Cenovus Energy Inc. Management s Discussion and Analysis For the Period Ended June 30, 2010 (Canadian Dollars)
") Management s Discussion and Analysis For the Period Ended June 30, 2010 (Canadian Dollars) This Management s Discussion and Analysis ( MD&A ) for ( Cenovus, we, our, us or the Company ), dated July 28,
Management s Discussion and Analysis For the Period Ended June 30, 2010 (Canadian Dollars) This Management s Discussion and Analysis ( MD&A ) for ( Cenovus, we, our, us or the Company ), dated July 28,
THIRD QUARTER 2014 Report to Shareholders for the period ended September 30, 2014
 THIRDQUARTER2014 ReporttoShareholdersfortheperiodendedSeptember30,2014 MEGEnergyCorp.reportedthirdquarter2014operationalandfinancialresultsonOctober29,2014. Highlightsinclude: Record quarterlyproductionof76,471barrelsper
CREATING SUSTAINABLE. VALUE April Investor Presentation
 CREATING SUSTAINABLE VALUE April Investor Presentation Objectives & Priorities Focus on capital discipline and free cash flow generation Debt reduction and balance sheet strength Improve market access
Cenovus Energy Inc. Management s Discussion and Analysis For the Period Ended March 31, 2010 (Canadian Dollars)
") Management s Discussion and Analysis For the Period Ended March 31, 2010 (Canadian Dollars) This Management s Discussion and Analysis ( MD&A ) for ( Cenovus, we, our, us or the Company ), dated April 28,
Management s Discussion and Analysis For the Period Ended March 31, 2010 (Canadian Dollars) This Management s Discussion and Analysis ( MD&A ) for ( Cenovus, we, our, us or the Company ), dated April 28,
MANAGEMENT S RESPONSIBILITY FOR THE CONSOLIDATED FINANCIAL STATEMENTS
 REPORT OF MANAGEMENT MANAGEMENT S RESPONSIBILITY FOR THE CONSOLIDATED FINANCIAL STATEMENTS The accompanying consolidated financial statements of MEG Energy Corp. (the Corporation ) are the responsibility
Value Creation Opportunity For All Shareholders Better Together
 Value Creation Opportunity For All Shareholders Better Together Benefits to MEG Shareholders Benefits to Husky Shareholders 44% premium over MEG s 10-day volume-weighted average share price of $7.62 per
COMPANIES CREDITORS ARRANGEMENT ACT ( CCAA ) PROCEEDING AND STATUS
 PROCEEDING AND STATUS") CONNACHER OIL AND GAS LIMITED MANAGEMENT S DISCUSSION AND ANALYSIS FOR THE THREE MONTHS ENDED MARCH 31, 2018 This Management s Discussion and Analysis ( MD&A ) for Connacher Oil and Gas Limited ( Connacher
CONNACHER OIL AND GAS LIMITED MANAGEMENT S DISCUSSION AND ANALYSIS FOR THE THREE MONTHS ENDED MARCH 31, 2018 This Management s Discussion and Analysis ( MD&A ) for Connacher Oil and Gas Limited ( Connacher
MANAGEMENT S DISCUSSION AND ANALYSIS FOR THE YEAR ENDED DECEMBER 31, 2017
 MANAGEMENT S DISCUSSION AND ANALYSIS FOR THE YEAR ENDED DECEMBER 31, 2017 OVERVIEW OF CENOVUS... 2 2017 HIGHLIGHTS... 4 OPERATING RESULTS... 5 COMMODITY PRICES UNDERLYING OUR FINANCIAL RESULTS... 7 FINANCIAL
Athabasca Oil Corporation Announces 2018 Year end Results
 FOR IMMEDIATE RELEASE March 6, 2019 Athabasca Oil Corporation Announces 2018 Year end Results CALGARY Athabasca Oil Corporation (TSX: ATH) ( Athabasca or the Company ) is pleased to provide its 2018 year
First Quarter Report 2018
 First Quarter Report 2018 For the three month period ended March 31, 2018 MANAGEMENT S DISCUSSION AND ANALYSIS This Management s Discussion and Analysis ( MD&A ) should be read in conjunction with the
FIRST QUARTER 2015 Report to shareholders for the period ended March 31, DEC
 1MAR201212421404 FIRST QUARTER 2015 Report to shareholders for the period ended, 2015 23DEC201322403398 Suncor Energy reports first quarter results All financial figures are unaudited and presented in
Production & financial summary
 Cenovus has strong third-quarter operational performance Oil sands production increases; operating costs decline Calgary, Alberta (October 27, 2016) (TSX: CVE) (NYSE: CVE) continues to deliver safe and
Proposed Development Plan KIRBY IN-SITU OIL SANDS PROJECT
 Proposed Development Plan KIRBY IN-SITU OIL SANDS PROJECT Public Disclosure Document December 2006 About Canadian Natural Who We Are Canadian Natural Resources Limited (Canadian Natural) is a senior independent
MANAGEMENT S DISCUSSION AND ANALYSIS FOR THE YEAR ENDED DECEMBER 31, 2016
 MANAGEMENT S DISCUSSION AND ANALYSIS FOR THE YEAR ENDED DECEMBER 31, 2016 WHERE TO FIND: OVERVIEW OF CENOVUS... 2 2016 HIGHLIGHTS... 4 OPERATING RESULTS... 4 COMMODITY PRICES UNDERLYING OUR FINANCIAL RESULTS...
MANAGEMENT S DISCUSSION AND ANALYSIS
 MANAGEMENT S DISCUSSION AND ANALYSIS Management's discussion and analysis ( MD&A ) is dated May 2, 2018 and should be read in conjunction with the unaudited consolidated financial statements for the period
CANADIAN NATURAL RESOURCES LIMITED ANNOUNCES 2017 FOURTH QUARTER AND YEAR END RESULTS CALGARY, ALBERTA MARCH 1, 2018 FOR IMMEDIATE RELEASE
 CANADIAN NATURAL RESOURCES LIMITED ANNOUNCES FOURTH QUARTER AND YEAR END RESULTS CALGARY, ALBERTA MARCH 1, 2018 FOR IMMEDIATE RELEASE Commenting on the Company's results, Steve Laut, Executive Vice-Chairman
MANAGEMENT S DISCUSSION AND ANALYSIS FOR THE PERIOD ENDED MARCH 31, 2017
 MANAGEMENT S DISCUSSION AND ANALYSIS FOR THE PERIOD ENDED MARCH 31, 2017 WHERE TO FIND: OVERVIEW OF CENOVUS... 2 TRANSFORMATIONAL ACQUISITION... 3 QUARTERLY HIGHLIGHTS... 4 OPERATING RESULTS... 4 COMMODITY
MANAGEMENT S DISCUSSION AND ANALYSIS
 MANAGEMENT S DISCUSSION AND ANALYSIS Management's discussion and analysis ( MD&A ) is dated February 28, 2018 and should be read in conjunction with the audited consolidated financial statements for the
For Immediate Release Granite Oil Corp. Announces 2017 Record Year End Reserve Metrics and Operational Update
 For Immediate Release Granite Oil Corp. Announces 2017 Record Year End Reserve Metrics and Operational Update CALGARY, ALBERTA (Marketwired March 7, 2018) GRANITE OIL CORP. ( Granite or the Company ) (TSX:GXO)(OTCQX:GXOCF)
FOR THE THREE AND NINE MONTHS ENDED SEPTEMBER 30, 2018
 FOR THE THREE AND NINE MONTHS ENDED SEPTEMBER 30, 2018 Management s Discussion and Analysis This Management s Discussion and Analysis ( MD&A ) for PrairieSky Royalty Ltd. ( PrairieSky or the Company )
Tamarack Valley Energy Ltd. Announces Third Quarter 2018 Production and Financial Results Driven by Record Oil Weighting
 TSX: TVE Tamarack Valley Energy Ltd. Announces Third Quarter 2018 Production and Financial Results Driven by Record Oil Weighting Calgary, Alberta November 7, 2018 Tamarack Valley Energy Ltd. ( Tamarack
Driving New Growth TSX:PGF. Peters & Co Presentation September 11, 2018
 Driving New Growth Peters & Co Presentation September 11, 2018 Advisories Caution Regarding Forward Looking Information: This presentation contains forward-looking statements within the meaning of securities
Cenovus oil sands production climbs 44% in third quarter Cash flow rises 41% on strong refining results, increased oil production
 Cenovus oil sands production climbs 44% in third quarter Cash flow rises 41% on strong refining results, increased oil production Average oil sands production exceeded 95,000 barrels per day (bbls/d) net
Cenovus oil sands production increases 25% in 2014 Proved bitumen reserves up 7%
 Cenovus oil sands production increases 25% in 2014 Proved bitumen reserves up 7% Combined oil sands production averaged more than 128,000 barrels per day (bbls/d) net in 2014, up 25% from 2013. Non-fuel
BAYTEX REPORTS Q RESULTS
 BAYTEX REPORTS Q1 2015 RESULTS CALGARY, ALBERTA (May 5, 2015) - Baytex Energy Corp. ("Baytex")(TSX, NYSE: BTE) reports its operating and financial results for the three months ended March 31, 2015 (all
PENGROWTH ENERGY CORPORATION SECOND QUARTER RESULTS
 PENGROWTH ENERGY CORPORATION 2018 SECOND QUARTER RESULTS SUMMARY OF FINANCIAL & OPERATING RESULTS (monetary amounts in millions except per boe and per share amounts) As adjusted % Change As adjusted %
FOR THE THREE MONTHS ENDED MARCH 31, 2018
 FOR THE THREE MONTHS ENDED MARCH 31, 2018 Management s Discussion and Analysis This Management s Discussion and Analysis ( MD&A ) for PrairieSky Royalty Ltd. ( PrairieSky or the Company ) should be read
MANAGEMENT S DISCUSSION & ANALYSIS
 MANAGEMENT S DISCUSSION & ANALYSIS FOR THE YEARS ENDED DECEMBER 31, 2017 & 2016 FINANCIAL AND OPERATING HIGHLIGHTS (Expressed in thousands of Canadian dollars except per boe and share amounts) OPERATIONS
HIGHLIGHTS 10NOV
 Q3 2010 10NOV201017244082 HIGHLIGHTS Produced a quarterly record of 44,799 boe/d in Q3/2010 (an increase of 5% from Q3/2009 and 2% from Q2/2010); Generated funds from operations of $112.8 million in Q3/2010
MANAGEMENT S DISCUSSION AND ANALYSIS FOR THE PERIOD ENDED SEPTEMBER 30, 2017
 MANAGEMENT S DISCUSSION AND ANALYSIS FOR THE PERIOD ENDED SEPTEMBER 30, 2017 WHERE TO FIND: OVERVIEW OF CENOVUS... 2 FINANCING THE ACQUISITION... 4 QUARTERLY HIGHLIGHTS... 5 OPERATING RESULTS... 6 COMMODITY
Canadian Oil Sands Q2 cash flow from operations up 43 per cent
 Canadian Oil Sands Q2 cash flow from operations up 43 per cent All financial figures are unaudited and in Canadian dollars unless otherwise noted. TSX - COS Calgary, Alberta (July 26, 2011) Canadian Oil
Monthly oil sands production is available for purchase from the Alberta Energy
 July 04, 2018 This note is provided to analysts and associates that cover Cenovus and will be posted on the Cenovus website under Quarterly results in the Investors section. The company will announce its
PrairieSky Royalty Ltd. Management s Discussion and Analysis. For the three months ended March 31, PrairieSky Royalty Ltd.
 PrairieSky Royalty Ltd. Management s Discussion and Analysis For the three months ended, 2017 PrairieSky Royalty Ltd. Management s Discussion and Analysis This Management s Discussion and Analysis ( MD&A
Connacher Announces Q Results
 August 28, 2018 MEDIA RELEASE FOR IMMEDIATE RELEASE Connacher Announces Q2 2018 Results Calgary, Alberta - Connacher Oil and Gas Limited ( Connacher or the Company ) announces its financial and operating
Cenovus Energy Inc. Interim Consolidated Financial Statements (unaudited) For the Period Ended December 31, (Canadian Dollars)
 For the Period Ended December 31, (Canadian Dollars)") Cenovus Energy Inc. Interim Consolidated Financial Statements (unaudited) For the Period Ended December 31, 2017 (Canadian Dollars) CONSOLIDATED FINANCIAL STATEMENTS (unaudited) TABLE OF CONTENTS CONSOLIDATED
Cenovus Energy Inc. Interim Consolidated Financial Statements (unaudited) For the Period Ended December 31, 2017 (Canadian Dollars) CONSOLIDATED FINANCIAL STATEMENTS (unaudited) TABLE OF CONTENTS CONSOLIDATED
BAYTEX REPORTS Q RESULTS WITH CONTINUED STRONG EAGLE FORD PERFORMANCE
 BAYTEX REPORTS Q1 2018 RESULTS WITH CONTINUED STRONG EAGLE FORD PERFORMANCE CALGARY, ALBERTA (May 3, 2018) - Baytex Energy Corp. ("Baytex")(TSX, NYSE: BTE) reports its operating and financial results for
Canadian Oil Sands 2011 cash flow from operations up 54 per cent from 2010
 February 1, 2012 TSX: COS Canadian Oil Sands 2011 cash flow from operations up 54 per cent from 2010 All financial figures are unaudited and in Canadian dollars unless otherwise noted. Highlights for the
Cenovus oil sands production increases 33% Cash flow up 37% on higher volumes and prices
 Cenovus oil sands production increases 33% Cash flow up 37% on higher volumes and prices Combined oil sands production at Foster Creek and Christina Lake averaged almost 125,000 barrels per day (bbls/d)
Cenovus Energy Inc. Interim Consolidated Financial Statements (unaudited) For the Period Ended March 31, (Canadian Dollars)
 For the Period Ended March 31, (Canadian Dollars)") Cenovus Energy Inc. Interim Consolidated Financial Statements (unaudited) For the Period Ended March 31, 2016 (Canadian Dollars) CONSOLIDATED FINANCIAL STATEMENTS (unaudited) TABLE OF CONTENTS CONSOLIDATED
Cenovus Energy Inc. Interim Consolidated Financial Statements (unaudited) For the Period Ended March 31, 2016 (Canadian Dollars) CONSOLIDATED FINANCIAL STATEMENTS (unaudited) TABLE OF CONTENTS CONSOLIDATED
FINANCIAL AND OPERATING HIGHLIGHTS. Financial ($ millions, except per share and shares outstanding) Operational
 Operational") FINANCIAL AND OPERATING HIGHLIGHTS Year ended December 31, 2016 2015 Change Financial ($ millions, except per share and shares outstanding) Petroleum and natural gas revenue (1) 121.6 81.6 49% Funds flow
FINANCIAL AND OPERATING HIGHLIGHTS Year ended December 31, 2016 2015 Change Financial ($ millions, except per share and shares outstanding) Petroleum and natural gas revenue (1) 121.6 81.6 49% Funds flow
MANAGEMENT S DISCUSSION AND ANALYSIS FOR THE YEAR ENDED DECEMBER 31, 2018
 MANAGEMENT S DISCUSSION AND ANALYSIS FOR THE YEAR ENDED DECEMBER 31, 2018 OVERVIEW OF CENOVUS... 2 YEAR IN REVIEW... 3 OPERATING RESULTS... 4 COMMODITY PRICES UNDERLYING OUR FINANCIAL RESULTS... 6 FINANCIAL
The following is a summary of the abbreviations that may have been used in this document:
 BLACKPEARL RESOURCES INC. Management s Discussion and Analysis The following is Management s Discussion and Analysis (MD&A) of the operating and financial results of BlackPearl Resources Inc. ( BlackPearl
Cenovus Energy Inc. Interim Consolidated Financial Statements (unaudited) For the Period Ended June 30, (Canadian Dollars)
 For the Period Ended June 30, (Canadian Dollars)") Cenovus Energy Inc. Interim Consolidated Financial Statements (unaudited) For the Period Ended June 30, 2018 (Canadian Dollars) CONSOLIDATED FINANCIAL STATEMENTS (unaudited) TABLE OF CONTENTS CONSOLIDATED
Cenovus Energy Inc. Interim Consolidated Financial Statements (unaudited) For the Period Ended June 30, 2018 (Canadian Dollars) CONSOLIDATED FINANCIAL STATEMENTS (unaudited) TABLE OF CONTENTS CONSOLIDATED
CANADIAN NATURAL RESOURCES LIMITED ANNOUNCES 2018 FIRST QUARTER RESULTS
 CANADIAN NATURAL RESOURCES LIMITED ANNOUNCES FIRST QUARTER RESULTS Commenting on first quarter results, Steve Laut, Executive Vice-Chairman of Canadian Natural stated, "The strength of our well balanced
FINANCIAL AND OPERATING SUMMARY
 FINANCIAL AND OPERATING SUMMARY ($000s except per share amounts) December 31, Dec 31, 2017 Sep 30, 2017 % Change 2017 2016 % Change Financial highlights Oil sales 64,221 50,563 27 % 217,194 149,701 45
HARVEST ANNOUNCES 2012 YEAR END RESULTS AND RESERVES INFORMATION
 Press Release HARVEST ANNOUNCES 2012 YEAR END RESULTS AND RESERVES INFORMATION CALGARY, ALBERTA FEBRUARY 28, 2013: Harvest Operations Corp. (Harvest or the Company) (TSX: HTE.DB.E, HTE.DB.F and HTE.DB.G)
BELLATRIX EXPLORATION LTD. ANNOUNCES FOURTH QUARTER 2018 AND YEAR END FINANCIAL AND OPERATING RESULTS
 For Immediate Release TSX: BXE BELLATRIX EXPLORATION LTD. ANNOUNCES FOURTH QUARTER 2018 AND YEAR END FINANCIAL AND OPERATING RESULTS CALGARY, ALBERTA (March 14, 2019) - Bellatrix Exploration Ltd. ( Bellatrix,
CANADIAN NATURAL RESOURCES LIMITED ANNOUNCES 2015 THIRD QUARTER RESULTS CALGARY, ALBERTA NOVEMBER 5, 2015 FOR IMMEDIATE RELEASE
 CANADIAN NATURAL RESOURCES LIMITED ANNOUNCES THIRD QUARTER RESULTS CALGARY, ALBERTA NOVEMBER 5, FOR IMMEDIATE RELEASE Commenting on third quarter results, Steve Laut, President of Canadian Natural stated,
Liquids sales comprised 59 percent of total revenue and 40 percent of total sales volumes in the second quarter of 2015.
 PARAMOUNT RESOURCES LTD. ANNOUNCES SECOND QUARTER 2015 RESULTS; SALES VOLUMES INCREASE 107% TO 42,604 BOE/D; LIQUIDS SALES VOLUMES INCREASE 320% TO 16,877 BBL/D August 5, 2015 Calgary, Alberta OIL AND
Cenovus Energy Inc. Interim Consolidated Financial Statements (unaudited) For the Period Ended December 31, (Canadian Dollars)
 For the Period Ended December 31, (Canadian Dollars)") Cenovus Energy Inc. Interim Consolidated Financial Statements (unaudited) For the Period Ended December 31, 2016 (Canadian Dollars) CONSOLIDATED FINANCIAL STATEMENTS (unaudited) TABLE OF CONTENTS CONSOLIDATED
Cenovus Energy Inc. Interim Consolidated Financial Statements (unaudited) For the Period Ended December 31, 2016 (Canadian Dollars) CONSOLIDATED FINANCIAL STATEMENTS (unaudited) TABLE OF CONTENTS CONSOLIDATED
Financial Report Third Quarter 2018
 Financial Report Third Quarter www.eagleenergy.com EAGLE THIRD QUARTER REPORT Management s Discussion and Analysis November 8, This Management s Discussion and Analysis ( MD&A ) of financial condition
Cenovus oil production anticipated to grow 14% in 2013 Company continues to focus on execution of strategic plan
 Cenovus oil production anticipated to grow 14% in 2013 Company continues to focus on execution of strategic plan Calgary, Alberta (December 12, 2012) Cenovus Energy Inc. (TSX, NYSE: CVE) plans to make
MANAGEMENT S DISCUSSION AND ANALYSIS
 MANAGEMENT S DISCUSSION AND ANALYSIS Management's discussion and analysis ( MD&A ) is dated March 6, 2019 and should be read in conjunction with the audited consolidated financial statements for the year
Canadian Oil Sands 2010 cash from operating activities and net income more than doubles over 2009
 Canadian Oil Sands 2010 cash from operating activities and net income more than doubles over 2009 All financial figures are unaudited and in Canadian dollars unless otherwise noted. Financial information
Alberta s Industrial Heartland Life in the Heartland
 Alberta s Industrial Heartland May 7, 2014 Trev Ruberry MEG Energy Overview Alberta-based in-situ oil sands company with production at Christina Lake near Conklin Joint ownership of the Access Pipeline
PENGROWTH ANNOUNCES FIRST QUARTER 2018 RESULTS, SETTING THE STAGE FOR DOUBLE-DIGIT PRODUCTION GROWTH IN 2018
 NEWS RELEASE Stock Symbols: PGF - TSX PGH - NYSE PENGROWTH ANNOUNCES FIRST QUARTER 2018 RESULTS, SETTING THE STAGE FOR DOUBLE-DIGIT PRODUCTION GROWTH IN 2018 (Calgary, Alberta, May 1, 2018) Pengrowth Energy
The Oil Sands: What is Needed to Realize the Potential?
 The Oil Sands: What is Needed to Realize the Potential? National Buyer/Seller Forum March 25-27, 2008 Edmonton, Alberta Bob Dunbar Strategy West Inc. 1 Photo Source: Syncrude Canada Limited Presentation
Connacher Announces Q Results
 May 29, 2018 MEDIA RELEASE FOR IMMEDIATE RELEASE Connacher Announces Q1 2018 Results Calgary, Alberta - Connacher Oil and Gas Limited ( Connacher or the Company ) announces its financial and operating
Canadian Oil Sands announces second quarter 2012 financial results
 July 27, 2012 TSX: COS Canadian Oil Sands announces second quarter 2012 financial results All financial figures are unaudited and in Canadian dollars unless otherwise noted. Highlights for the three and
ST98: 2017 ALBERTA S ENERGY RESERVES & SUPPLY/DEMAND OUTLOOK. Executive Summary.
 ST98: 2017 ALBERTA S ENERGY RESERVES & SUPPLY/DEMAND OUTLOOK Executive Summary ST98 www.aer.ca Executive SummARY The Alberta Energy Regulator (AER) ensures the safe, however, will depend on the level
CONDENSED INTERIM BALANCE SHEET (UNAUDITED)
") CONDENSED INTERIM BALANCE SHEET (UNAUDITED) As at (Canadian dollars in thousands) Notes September 30, 2016 December 31, 2015 ASSETS CURRENT ASSETS Cash and cash equivalents $10,236 $47,235 Restricted cash
CONDENSED INTERIM BALANCE SHEET (UNAUDITED) As at (Canadian dollars in thousands) Notes September 30, 2016 December 31, 2015 ASSETS CURRENT ASSETS Cash and cash equivalents $10,236 $47,235 Restricted cash
Cenovus oil production growth continues with 14% increase Cash flow in the first quarter up 30% over last year at $904 million or $1.
 Cenovus oil production growth continues with 14% increase Cash flow in the first quarter up 30% over last year at $904 million or $1.19 per share Oil sands production at Foster Creek and Christina Lake
A SPRINGBOARD FOR GROWTH
 A SPRINGBOARD FOR GROWTH May 2011 1 TSX:PXX OMX:PXXS www.blackpearlresources.ca Cautionary Statements FORWARD LOOKING STATEMENTS This presentation contains certain forward looking statements and forward
Suncor Energy releases third quarter results
 23JUL200813594278 THIRD QUARTER 2008 Report to shareholders for the period ended September 30, 2008 Suncor Energy releases third quarter results All financial figures are unaudited and in Canadian dollars
29 th USAEE/IAEE North American Conference October 14, 2010 Calgary, Alberta. Presented by Glen Schmidt, Chairman
 29 th USAEE/IAEE North American Conference October 14, 2010 Calgary, Alberta Presented by Glen Schmidt, Chairman 1 Agenda Where will you get your oil? Drillable oil sands One of the best choices for crude
CANADIAN NATURAL RESOURCES LIMITED ANNOUNCES 2017 FIRST QUARTER RESULTS
 CANADIAN NATURAL RESOURCES LIMITED ANNOUNCES FIRST QUARTER RESULTS Commenting on the first quarter results, Steve Laut, President of Canadian Natural stated, The strength of our well balanced and diverse
CANADIAN NATURAL RESOURCES LIMITED ANNOUNCES RECORD QUARTERLY PRODUCTION AND 2012 SECOND QUARTER RESULTS
 CANADIAN NATURAL RESOURCES LIMITED ANNOUNCES RECORD QUARTERLY PRODUCTION AND SECOND QUARTER RESULTS Commenting on second quarter results, Canadian Natural s Vice-Chairman John Langille stated, Our strategy
Canadian Oil Sands Summit. Grizzly Oil Sands
 Canadian Oil Sands Summit February 2014 Forward-Looking Statements Certain statements, estimates and financial information contained in this presentation ("Estimates") constitute forwardlooking statements
2011 Annual Report DEEPENING OUR HORIZONS GROWING OUR VALUE
 2011 Annual Report DEEPENING OUR HORIZONS GROWING OUR VALUE Annual Report 2011 1 Financial and Operating Highlights Three months ended Year ended (000 s except per share amounts) December 31 December 31
BLACKPEARL RESOURCES INC. MANAGEMENT S DISCUSSION AND ANALYSIS, FINANCIAL STATEMENTS AND NOTES
 BLACKPEARL RESOURCES INC. MANAGEMENT S DISCUSSION AND ANALYSIS, FINANCIAL STATEMENTS AND NOTES FOR THE YEAR ENDED DECEMBER 31, 2011 Management s Discussion and Analysis The following is Management s Discussion
Financial Report First Quarter 2018
 Financial Report First Quarter 2018 www.eagleenergy.com Management s Discussion and Analysis May 10, 2018 This Management s Discussion and Analysis ( MD&A ) of financial condition and results of operations
PAN ORIENT ENERGY CORP.
 PAN ORIENT ENERGY CORP. 2008 MANAGEMENT S DISCUSSION AND ANALYSIS FOR THE NINE MONTHS ENDED SEPTEMBER 30, 2008 MANAGEMENT S DISCUSSION AND ANALYSIS The following Management s Discussion and Analysis (
CONDENSED INTERIM CONSOLIDATED FINANCIAL STATEMENTS
 CONDENSED INTERIM CONSOLIDATED FINANCIAL STATEMENTS Condensed Consolidated Balance Sheets (millions of Canadian dollars) (unaudited) Assets Current assets March 31, 2012 December 31, 2011 Cash and cash
Cenovus Energy Inc. Interim Supplemental Information (unaudited) For the period ended June 30, (Canadian Dollars)
 For the period ended June 30, (Canadian Dollars)") Cenovus Energy Inc. Interim (unaudited) For the period ended June 30, (Canadian Dollars) Financial Statistics ($ millions, except per share amounts) Revenues Gross Sales Upstream 1,747 1,003 744 4,739
Cenovus Energy Inc. Interim (unaudited) For the period ended June 30, (Canadian Dollars) Financial Statistics ($ millions, except per share amounts) Revenues Gross Sales Upstream 1,747 1,003 744 4,739
Oil sands key to building value
 Oil sands key to building value Harbir Chhina Executive Vice-President, Oil Sands Investor Day Calgary December 7, 211 Oil sands key to building value Maximizing value at producing properties improving
ALBERTA OIL SANDS: THE FACTS
 ALBERTA OIL SANDS: THE FACTS Oil sands are comprised of grains of sand surrounded by a film of water and bitumen. Bitumen, a heavy and viscous oil, is solid in colder temperatures IN 209, THE WORLD IS
MANAGEMENT S DISCUSSION AND ANALYSIS FOR THE YEAR ENDED DECEMBER 31, 2018
 MANAGEMENT S DISCUSSION AND ANALYSIS FOR THE YEAR ENDED DECEMBER 31, 2018 Management s Discussion and Analysis This Management s Discussion and Analysis ( MD&A ) for PrairieSky Royalty Ltd. ( PrairieSky
MANAGEMENT S DISCUSSION AND ANALYSIS
 MANAGEMENT S DISCUSSION AND ANALYSIS FINANCIAL AND OPERATIONAL HIGHLIGHTS (thousands of Canadian dollars, Three months ended September 30, Nine months ended September 30, except per share and per boe amounts)
April 30, 2013 TSX: COS Canadian Oil Sands announces first quarter financial results and a $0.35 per Share dividend
 April 30, 2013 TSX: COS Canadian Oil Sands announces first quarter financial results and a $0.35 per Share dividend All financial figures are unaudited and in Canadian dollars unless otherwise noted. Highlights
FIRST QUARTER REPORT 2014
 FIRST QUARTER REPORT 2014 HIGHLIGHTS ($ thousands, except per share and per unit amounts) 2014 2013 % Change Operating Petroleum and natural gas sales 40,893 32,201 27 Production: Oil (bbl/d) 1,337 1,727
Gibson Energy Inc. Condensed Consolidated Financial Statements September 30, 2011 and 2010 (Unaudited) (in thousands of Canadian dollars)
 (in thousands of Canadian dollars)") Condensed Consolidated Financial Statements 2011 and 2010 (in thousands of Canadian dollars) Consolidated Balance Sheet (tabular amounts in thousands of Canadian dollars) 2011 December 31, 2010 Assets
Condensed Consolidated Financial Statements 2011 and 2010 (in thousands of Canadian dollars) Consolidated Balance Sheet (tabular amounts in thousands of Canadian dollars) 2011 December 31, 2010 Assets
Canadian Natural Resources Limited UNAUDITED INTERIM CONSOLIDATED FINANCIAL STATEMENTS
 Canadian Natural Resources Limited UNAUDITED INTERIM CONSOLIDATED FINANCIAL STATEMENTS FOR THE THREE AND NINE MONTHS ENDED SEPTEMBER 30, AND CONSOLIDATED BALANCE SHEETS As at (millions of Canadian dollars,
Solid results, significant upside NOVEMBER 2016 INVESTOR PRESENTATION OSUM OIL SANDS CORP.
 Solid results, significant upside NOVEMBER 2016 INVESTOR PRESENTATION OSUM OIL SANDS CORP. Disclaimer Forward Looking Statements This presentation contains statements that may constitute "forward-looking
2014 Q2 FINANCIAL REPORT
 2014 Q2 FINANCIAL REPORT FINANCIAL AND OPERATING HIGHLIGHTS (unaudited) 2014 2013 Financial Three Months Ended June 30, Six Months Ended June 30, Percent Change 2014 2013 Percent Change Income and Investments
The Company generated operating netbacks of $44.78/boe on an unhedged basis and funds flow netbacks of $40.99/boe.
 MANAGEMENT S DISCUSSION AND ANALYSIS The following discussion and analysis as provided by the management of Raging River Exploration Inc. ( Raging River or the Company ) is dated May 14, 2018 and should
Oil Sands Outlook: How will the Challenges Facing the Industry affect Growth?
 Oil Sands Outlook: How will the Challenges Facing the Industry affect Growth? 4 th Annual Canadian Oil Sands Summit Insight Information Calgary, Alberta January 16-17, 2007 Bob Dunbar, P.Eng. Strategy
EXTRA HEAVY OILS IN THE WORLD ENERGY SUPPLY
 EXTRA HEAVY OILS IN THE WORLD ENERGY SUPPLY Ladislas Paszkiewicz Senior Vice President Americas CSR Field Trip Canada, June 2012 1 Increasing need for fossil energies by 2030 Energy mix scenario Mboe/d
Cenovus Energy Inc. Interim Consolidated Financial Statements (unaudited) For the Period Ended September 30, (Canadian Dollars)
 For the Period Ended September 30, (Canadian Dollars)") Cenovus Energy Inc. Interim Consolidated Financial Statements (unaudited) For the Period Ended September 30, 2017 (Canadian Dollars) CONSOLIDATED FINANCIAL STATEMENTS (unaudited) TABLE OF CONTENTS CONSOLIDATED
Cenovus Energy Inc. Interim Consolidated Financial Statements (unaudited) For the Period Ended September 30, 2017 (Canadian Dollars) CONSOLIDATED FINANCIAL STATEMENTS (unaudited) TABLE OF CONTENTS CONSOLIDATED