CHAPTER 3 RESOURCE MOBILIZATION BY PUBLIC AND PRIVATE SECTOR MUTUAL FUNDS
|
|
|
- Alexander Wheeler
- 6 years ago
- Views:
Transcription
1 CHAPTER 3 RESOURCE MOBILIZATION BY PUBLIC AND PRIVATE SECTOR MUTUAL FUNDS This chapter is divided into three sections. The first section deals with various phases of development of the public and private sector mutual funds before and after deregulation. Section II deals with the trends in the resource mobilization by mutual funds before and after the deregulation of mutual fund industry. Section III examines the institution wise break up of Assets Under Management, sales and redemptions of mutual funds and unit holding pattern. A client wise break-up of mutual fund assets and portfolio investment is also presented. SECTION-I Phases of Development The Mutual Fund Industry in India has passed through various phases of growth and hurdles. The long journey of more than four decades of the Mutual Fund Industry in India can be grouped under four phases. Phase I Monopoly of UTI (July 1964-November 1987): This period was dominated totally by the UTI, which prepared a ground for the future mutual fund industry. Unit Trust of India (UTI) was established in 1963 by 59
2 an Act of Parliament by the Reserve Bank of India (RBI) and functioned under its regulatory and administrative control 1. The UTI commenced its operations with an initial capital of Rs. 5 crore contributed by the RBI (Rs crore), State Bank of India (Rs.0.75 crore), Life Insurance Corporation of India (Rs crore), certain other scheduled banks and specified financial institutions (Rs. 1 crore) to its maiden Scheme US The first decade of the UTI ( ) was the formative period. The first product launched by the UTI was Unit-64 and later on the Unit Linked Insurance Plan in By the end of June 1974, UTI has six lakh unit holders. The Second Phase of operations ( ) was one of the consolidation and expansions. In 1978, UTI was de-linked from the RBI and the Industrial Development Bank of India (IDBI) took over the regulatory and administrative control in the place of RBI and Open-Ended growth funds were introduced. Six new schemes were launched during By the end of June 1984, the investible funds of the UTI crossed Rs. 1,000 crore and the number of unit holders reached 17 lakh 3. During , many innovative schemes like Children s Gift Growth Fund (1986), Master Share (1987), First Indian off shore fund, India Fund (1986) were 1 Pendharkar Viswanadh Gopal, Unit Trust of India: Retrospect and Prospect, UBS Publishers, New Delhi, 2003, p Bhatt R.S., Unit Trust of India and Mutual Funds- A study by the UTI Institute of Capital Markets, Mumbai, 1996, p Sadak H., Mutual Funds in India (Marketing Strategies and investment Practices) Response Books, New Delhi,2004 p
3 launched. By the end of June, 1987, the Unit capital of UTI was worth Rs. 3, crore and the investible funds totalled over Rs. 4,563 crore, while the unit holding accounts amounted to Rs lakh. Phase II- Public Sector Competition (November 1987-October 1993): Towards the end of 1980s, winds of change have started blowing across the Indian economy and this period was marked by the entry of non-uti public sector mutual funds into the market. Many public sector financial institutions established mutual funds in India. The first non-uti mutual fund, SBI Mutual Fund was launched by the State Bank of India in November This was followed by the Canbank Mutual Fund (December 1987), LIC Mutual Fund (June 1989), Indian Bank Mutual Fund (January 1990). The entry of public sector mutual funds attracted small investors and cumulative mobilization of resources went up from Rs. 4, crore in 1987 (mobilized by UTI alone) to Rs. 19, crore in 1990 (mobilized by all the above), a 319 per cent increase 4. Later on, Bank of India, General Insurance Corporation (GIC) and Punjab National Bank (PNB) entered into the mutual fund market and collections increased to Rs. 37,480.2 crore in However the UTI remains the dominant player in the market, though its share declined marginally from 87.9 per cent in to 84 per cent in Ibid 61
4 The year and showed a decline in collections by the public sector mutual funds because of two factors. Firstly, Securities Exchange Board of India (SEBI) had prohibited mutual funds from launching any scheme with an assured income and secondly, according to Mutual Fund Regulations 1993, Indian mutual funds were to form Asset Management Companies (AMC) pending which they could not launch any scheme. However, since the UTI was not under the preview of SEBI, and was not prohibited from launching schemes with assured incomes, its collections rose from Rs. 8,685.4 crore in to Rs. 11,057 crore in , and the total collections of all mutual funds stood at Rs. 13,021 crore in At the end of 1993, the mutual fund industry has Assets Under Management of Rs. 47,004 crores. 5 Before 1989, there were no regulatory guidelines for the mutual fund industry in India. Such guidelines were first issued by the RBI in October 1989 which were applicable to the mutual funds floated by banks and comprehensive guidelines were also issued by government of India in June They covered all the mutual funds and made registration with SEBI mandatory. They also set norms for registration, management, investment objectives, disclosure, pricing and valuation of securities and so on. These guidelines were revised and the Securities and Exchange Board of India (Mutual Funds) Regulations 1993 came into effect on 20 January RBI Report on Currency and Finance,
5 Phase III-Emergence of a Competitive Market: (October 1993 to January 2003): A new era in the mutual fund industry began in 1993 with the entry of private sector funds. Private sector funds have operational advantages like the best managerial talents, latest technology and experienced foreign asset management companies, which posed serious competition to the existing public sector funds. The first private sector mutual fund to launch a scheme was the Madras based Kothari Pioneer Mutual Fund (now merged with Franklin Templeton). It started the open ended Prima Fund in November During the year five private sector mutual funds-kothari Pioneer Mutual Fund, ICICI Mutual Fund, 20 th Century Mutual Fund, Morgan Stanley Mutual Fund and Taurus Mutual Fund launched seven schemes and mobilized an amount of Rs. 1, crore during the year During six other mutual funds like Apple Mutual Fund, JM Mutual Fund, Shriram Mutual Fund, CRB Mutual Fund, Alliance Mutual Fund and Birla Mutual Fund entered the market and mobilized Rs. 1,326.8 crores. The total mobilization by all mutual funds reached to Rs. 75, crore by March However in the year the total mobilization by all mutual funds, including UTI, fell drastically to Rs. 5,976.3 crore. As a result, cumulative mobilization increased slightly and stood at Rs. 81, crore by March As at the end of January 2003, there were 33 mutual funds with total assets of Rs. 63
6 1,21,805 crores. The Unit Trust of India with Rs. 44,541 crores of Assets Under Management was way ahead of other mutual funds 6. Phase IV-Bifurcation of Unit Trust of India (Since February 2003): In February 2003, following the repeal of the Unit Trust of India Act 1963, UTI was bifurcated into two separate entities. One is the specified undertaking of the Unit Trust of India with assets under management of Rs. 29,835 crores as at the end of January 2003, representing broadly, the assets of US-64 scheme, assured return and certain other schemes. The specified undertaking of the UTI, functioning under an administrator and under the rules framed by Government of India and does not come under the preview of the Mutual Fund Regulations 7. The second is the UTI Mutual Fund, sponsored by State Bank of India, Punjab National Bank, Bank of Baroda and Life Insurance Corporation of India. It is registered with the SEBI and functions under the Mutual Fund Regulations. With the bifurcation of the erstwhile UTI which had in March 2000 more than Rs. 76,000 crores of assets under management and with the setting up of the UTI Mutual Fund, conforming to the SEBI Mutual Fund Regulations, and with recent mergers taking place among different private sector funds, the mutual fund industry has entered its current phase of consolidation of growth. As at the end of March 2009, there were 35 funds, which manage assets of Rs. 4,17,300 crores under more than 1000 schemes 8. 6 AMFI Quarterly and Monthly Reports, June:
7 Figure 3.1 Assets Under Management (Phase Wise) (Rs. in Crores) Mar-65 Mar-87 Mar-93 Mar-03 Mar-03 Mar-03 Mar-04 Mar-05 Mar-06 Mar-07 Mar-08 Mar-09 Phase I Phase II Phase III Years Phase IV 65
8 Consequences of emergence of Competition: The emergence of competition following the free entry of private sector funds exposed several financial weaknesses in the Indian financial market like loose links in reforms process, lack of supervision skills and incomplete regulations. The SEBI initiated a number of measures from to to streamline the operations of mutual funds. The important developments are summarised as under 9 : SEBI revised the Mutual Fund Regulations and issued the revised SEBI (Mutual Funds) Regulations in SEBI issued standard offer documents and memoranda containing key information. A code of conduct of advertisement was issued by the SEBI. RBI issued revised guidelines for money market instruments. Assured return schemes failed to fulfill their promises. Fund managers proved incompetent, in terms of both planning and performance. Several funds witnessed management changes due to many mergers and takeovers. Non-Performance forced many funds to close down. The Indian Mutual Fund Industry caught up with the global trend and there emerged a strong market for open-ended funds. Many innovative schemes were launched and sector funds became very popular. 9 Sadak H., Op. Cit., p
9 SECTION-II Mutual Funds Resource Mobilization The concept of mutual funds was conceived to pool the resources from the different investors and deploy the same in the capital market. In this section, the trends and composition of resources mobilization of mutual funds of public and private sectors were analysed. Table 3.1 Sector-Wise Resource Mobilization of Mutual Funds (Rs. in crore) Public Sector Year UTI Other than UTI Total (2+3) Private Sector Total (4+5) (100) (100) (100) (100) (100) (100) (100) (100) (100) (100) - 1,261 (100) - 1,261(100) ,059 (89.13) 250 (10.87) 2,309 (100) - 2,309 (100) ,855 (92.34) 320 (7.66) 4,175(100) - 4,175 (100) ,584 (82.27) 1,203 (17.73) 6,787 (100) - 6,787 (100) ,553(60.64) 2,956 (39.36) 7,508 (100) - 7,508 (100) ,685(77.18) 2,567 (22.82) 11,253 (100) - 11,253(100) ,057(84.92) 1,964 (15.08) 13,021 (100) - 13,021(100) ,297(82.69) 387(3.44) 9,684 (86.12) 1,560(13.87) 11,243 (100) ,611(76.37) 1,342 (11.90) 9,953 (88.27) 1,322(11.73) 11,275(100) , , , , ,875(70.74) 440 (10.83) 3,315 (81.57) 749(18.43) 4,064(100) (6.31) 459 (17.03) 629 (23.34) 2,067(76.66) 2,695(100) ,548 (20.56) 631 (2.85) 5,179 (25.41) 16,937(76.59) 22,117(100) (2.89) 1,521(13.65) 1,843 (16.54) 9,292(83.46) 11,135(100) ,330-5,954 13,977 8, ,895-7,539 12,122 3, ,050 (2.20) 3,761(7.89) 4,811(10.09) 42,873(89.91) 47,684(100) ,677-5,399 7,600 2, ,424 (6.5) 6,378 (12.07) 9,802(18.57) 42,977(81.43) 52,779(100) ,326 (7.79) 7,621 (8.11) 14,947(15.90) 79,038(84.10) 93,985(100) ,677 (6.94) 9,821 (6.39) 20,498 (13.33) 1,33,304 (86.67) 1,53,802 (100) P P -28,297 *Correlation between public and private sector ) Figures in brackets are percentages 2) Source: The RBI Report on Currency and Finance, The RBI Annual Reports, Supplement to RBI Bulletin, Various Issues. 3) 4) P : Provisional 67
10 Figure 3.2 Figure
11 in Table 3.1. The trends in the resource mobilization of mutual funds sector-wise is given Resources mobilized by mutual funds increased sharply in the eighties and during the first two years of nineties. In the year , UTI alone mobilized Rs. 1,261 crore with an annual average growth rate of 382 per cent from The annual average growth rate of the UTI from to was 107 per cent. In the year itself public sector banks entered into the mutual fund market and mobilization of resources have been contributed by both the UTI and Public Sector Banks till In the total funds mobilized by both the players reached to Rs. 13,021 crore, out of which UTI alone accounts for Rs. 11,057 (84.92%) crore. Resources mobilized during the period from to grew at an annual average growth rate of 71 per cent aided mainly by the buoyant secondary market, setting up of new mutual funds in the second half of the eighties and tailor-made schemes introduced by them and the UTI. High or assured rate of returns offered by some mutual funds were other contributing factors. Resources mobilization by mutual funds in the nineties suffered a serious set back, although during the period many new mutual funds came into existence. The overall decline in resource mobilization by mutual funds in general could be ascribed to the depressed stock market conditions, and the decline during was due to redemption pressure faced by the UTI in respect of the US-64 69
12 Schemes. Despite these depressed stock market conditions, private sector mutual funds account for an annual growth rate of 86 per cent from to Resources mobilized by mutual funds increased sharply to as high as Rs. 47,684 crore during It is mainly due to a sharp rise in resources mobilized by the private sector mutual funds to an amount of Rs. 42,873 crore. Funds mobilized by mutual funds declined during due to net outflows recorded by the UTI and public sector mutual funds. There after a sharp rise has been noticed during the following three years due to bullish market and the funds reached to Rs. 1,53,802 crore for the year Of this 87 per cent is contributed by the private sector. Other factors for an alround growth of 63 per cent during the year are increase in geographical coverage and more and more household participators. Thereafter reflecting the financial Tsunami impacted the Indian economy and the resources mobilized were also declined from May 2008 and showed negative growth for the year Therefore it is significant to note that out of the total resource mobilization from the year , 87 per cent share has been accounted by the private sector mutual funds unlike in the past, when public sector mutual funds particularly the UTI dominated the industry. It is also evident from the Figure 3.2 and 3.3 and also proved by the negative correlation between the resources mobilized by the public and private sector. 70
13 Table 3.2 Sector-wise Mobilization of Resources by Mutual Funds and the Number of schemes. (Rs. Crores) Other Public Sector Private Sector Total Year No.of Schemes Amount Rs. No.of Schemes Amount Rs. No.of Schemes Amount Rs. No.of Schemes Amount Rs (33.00) (76.75) 20 (37.00) (11.86) 16 (30.00) (11.39) 54 (100) (100) (41.82) (29.09) (29.09) (100) (47.62) (14.29) (38.09) (100) (58.09) (64.11) 17 (12.50) (15.99) 40 (29.41) (19.90) 136 (100) (100) (45.80) (4.71) 23 (12.67) (25.54) 76 (41.53) (69.75) 183 (100) (100) N.A (20.70) 34 (22.08) (1.15) 120 (77.92) (78.15) 154 (100) (100) (28.34) (2.89) 57 (18.57) (13.66) 163 (53.09) (83.45) 307 (100) (100) (18.30) (18.81) (62.89) (100) (12.55) (15.75) (71.70) (100) (8.78) (2.20) 64 (13.70) (7.89) 362 (77.52) (89.91) 467 (100) (100) N.A N.A N.A (8.1) 3424 (6.5) 75 (12.67) 6379 (12.07) 469 (79.27) (8.06) (9.40) (7.79) (8.11) (82.54) (6.38) (9.10) (6.94) (6.39) (84.52) (5.28) - 92 (9.17) (85.55) (81.43) 592 (100) (100.0) (84.10) (100) (100.0) (100) (86.67) (100.0) (100) Correlation between UTI schemes and UTI Amounts Correlation between other than UTI Schemes and other than UTI Amount Correlation between private sector schemes and private sector amounts Net sales value with premium under all domestic schemes P-provisional Source: RBI Report on currency and finance, RBI Annual Report, Supplement to RBI Bulletin, Various issues. Value Research, Mutual Fund Insight, various issues. 71
14 Table 3.3 Correlation Values between schemes UTI Other than UTI Private UTI Other than UTI Private TABLE 3.4 ANOVA Source of Variation Between Groups Within Groups Total SS df MS F F crit Sector-wise Resources mobilization of Mutual Funds and the number of Schemes: Table 3.2 reveals sector-wise mobilization of resources by mutual funds and their schemes during and The share of Public Sector in terms of the number of schemes and the volume of funds have been gradually occupied by the private sector after deregulation. 72
15 In the year , there were 54 schemes in all sectors, which mobilized Rs. 11,274.8 crore. Out of this, 38 (70%) schemes are related to the UTI and the public sector. Because of innovative schemes introduced by the UTI and public sector banks, and the UTI s wide marketing net work, growing agency force and opening of more number of branch offices, funds mobilized by these schemes reached to Rs. 9,948 (88%). Though the number of mutual fund schemes had risen to 84 by , during , the overall performance of mutual fund industry was not encouraging due to depressed secondary market and the public sector (including UTI) shows net outflows. Where as in the case of private sector, the number of mutual fund schemes had gone up to 32 (38%) to the year which accounts for Rs crore. For the year number of mutual fund schemes operated by public sector (including UTI) has rised to 107 (58%) which accounts for Rs. 1,092 (30%) only. During the same period all the total 76 (42%) private sector mutual funds have mobilized Rs. 2,518.7 (70%) crore. In the year , the overall performance of mutual fund industry was quite encouraging and recorded more than six fold growth due to the spurt in resource mobilization led by the private sector mutual funds. This improvement in resource mobilization by mutual funds were brought about by two significant developments i.e., tax benefit announced in the union budget for ; 73
16 particularly those related to equity oriented schemes and bullish trend in the secondary market. For the years to , funds mobilized by public sector (including UTI) had declined and showed negative balance though the number of schemes for the same period had rised to a maximum of 144. This was due to the negative impact of announcement by the Finance Secretary on September 1, 2002 on one of the Private Channels that the UTI was being privatized 10. During the above period the number of private sector schemes reached to a maximum of 337 and contributed major part (77%) in funds mobilization aided mainly by the introduction of new schemes which are suited to the investors. For the years and the share of public sector has decreased further and reached to 10 per cent and it has been occupied by the private sector (90%). Surprisingly, for the years to a sudden rise had noticed in the number of schemes and funds mobilized both in the public and private sectors due to bullish market, introduction of many innovative schemes in the potential industry and redesigning and adopting suitable marketing strategies to reach out to more and more households. And for the year though the number of schemes crossed 1000, the industry witnessed for the first time since 2000, a net outflow of funds due to world-wide recession. 10 Murali, D UTI, Giri, Gaye? Businessline, September 2, 2002, p
17 Therefore, from the above analysis, it is clear that the share of public sector in terms of number of schemes and funds mobilization 70 per cent and 88 per cent respectively in had been gradually occupied by the private sector after deregulation of the mutual fund industry and reached to 15 per cent and 13 per cent respectively by the year It is also evident from the correlation analysis. The correlation between the resources mobilized and the number of schemes of private sector is highly positive, which shows that there is an increase in the resources mobilized with the increase in number of schemes. The negative correlation between the number of schemes and resource mobilization of UTI shows that though the number of schemes increased there was a decline in resource mobilization. And the correlation between the number of schemes of both UTI and private sector is highly positive. The calculated value of F ( ) is greater than the table value of F ( ). Hence it is also concluded that there is a significant difference between the number of schemes and resource mobilization. 75
18 Table. 3.5 Trends and Composition of Resources Mobilization by Mutual Funds (As a percentage of GDP) Period / Year Total Public Of Which UTI (at current market price) Private Total to to to to to to to to Correlation between public sector and private sector Source: Compiled from RBI Report on currency and Finance, various issues and National Income statistics, Centre for Monitoring Indian Economy. 76
19 Trends and Composition of Resource Mobilization by Mutual Funds As a percentage of GDP: Table 3.5 reveals the trends and composition of resource mobilization by mutual funds during and Resources mobilized as a percentage of GDP had increased during the past decade, particularly in the case of private sector. Since the UTI was only the mutual fund up to , the resources mobilized grew at a steady rate and continued till and stood at 1.59 per cent of the GDP. This is aided mainly by the setting up of new funds, introduction of tailormade schemes due to buoyant secondary market. The ratio stood at 1.15 per cent during the year with the composition of 0.88 per cent related to the private sector. There after, the percentage has declined and reached 0.07 for the year Where as in the case of public sector players, the ratio was negative in almost all the years due to outflows of the UTI and other public sector funds. And for the years to due to bullish trend in the secondary market, well positioned regulatory guidelines, product offerings, systems, procedures and service standards many investors were attracted towards mutual funds, thereby all the ratios turned positive with an increasing tendency. During the first eight months of , with downward trend in stock market and in view of the tight liquidity conditions precipitated by a variety of reasons 77
20 including advance tax outflows, suppliers credit withdrawal partly on account of freezing of external credit markets and drying of money market liquidity, the mutual fund industry faced unprecedented level of stress. The decline in the net resource mobilization was especially pronounced in the month of June, September, October 2008 and March From the above, it is clear that the share of resource mobilization by the public sector as a percentage of GDP has been decreasing phenomenally after deregulation. On the other hand, the percentage of the private sector has an increasing tendency. The combined effect of percentage of both the public and private sector mutual funds showed decline in tendency in the total resource mobilization by mutual funds as a percentage of GDP, except for the last three years. It is also evident by the correlation analysis. The correlation analysis also reveals negative relation between the resources mobilized as a per cent of GDP of Public and Private Sector. 11 RBI Annual Report p
21 SECTION-III Institution wise Break Up of Mutual Fund Assets, Sales and Redemptions: This section is mainly devoted to mutual fund Assets Under Management. In this section, institution wise break-up of mutual fund assets, sales and redemptions of public and private sector were presented for indepth analysis. For this purpose public sector is divided under two heads viz., a) Bank sponsored b) Institutions. Bank sponsored category is again shown under i) Joint venture predominantly Indian ii) Others. Private sector is shown under four categories a) Indian b) Foreign c) Joint Venture predominantly Indian d) Joint venture predominantly foreign 12. A comparative analysis of number of funds and assets under management, unit holding pattern and assets under management, client-wise breaking of mutual fund assets and client-wise portfolio investment is also presented
22 Public Sector A. Bank Sponsored Joint venture 7,842 predominantly Indian (6.94) Others 76,547 (67.74) B. Institu-tions 3,570 (3.16) Private Sector Indian 2,331 (2.06) Table No 3.6 Assets Under Management (year ended 31 st March) (Institution wise) (Rs. in Crore) ,333 (3.68) 58,017 (64.05) 3,507 (3.87) 3,370 (3.72) 3,970 (3.95) 51,434 (51.13) 4,237 (4.21) 5,177 (5.15) 3,220 (4.05) 14,787 (18.61) 5,935 (7.47) 10,114 (12.73) 5,202 (3.73) 22,883 (16.39) 6,539 (4.68) 19,885 (14.24) Foreign ,633 (2.60) Joint venture pre-dominantly 9,724 8,620 15,502 24,593 33,143 Indian (8.60) (9.51) (15.40) (30.95) (23.74) Joint venture pre-dominantly 12,991 13,740 20,277 20,815 48,331 Foreign (11.50) (15.17) (20.16) (26.19) (34.62) Total 1,13,005 90,587 1,00,594 79,464 1,39,616 (100.00) (100.00) (100.00) (100.00) (100.00) Source : AMFI Quarterly and Monthly Reports Figures in Brackets are Percentages. * Include Rs. 612 crore related to joint venture predominantly foreign 6,595 (4.41) 22,508 (1505) 3,010 (2.01) 28,890 (19.31) 13,186 (5.69) 31,933 (13.77) 5,229 (2.26) 50,602 (21.82) 16,807 (5.15) 37,763 (11.57) 9,643 (2.95) 80,157 (24.56) 28,669 (5.67) 48,478 (9.60) 12,384 (2.45) 1,52,795 (30.25) ,294 (6.00) 47,934 74,144 1,04,779 1,61,273 (32.04) (31.98) (32.10) (31.93) 40,663 56,768 77,239 71,259 (27.18) (24.48) (23.67) (14.10) 1,49,600 2,31,862 3,26,388 5,05,152 (100.00) (100.00) (100.00) (100.00) 26,758* (6.41) 37,801 (9.06) 17,825 (4.27) 1,30,148 (31.19) 31,290 (7.50) 1,53,262 (36.73) 20,216 (4.84) 4,17,300 (100.00) 80
23 Figure 3.4 Assets Under Management of Public Sector (Institution wise) Rupees in Crores Year (31st March) Joint Venture predominantly Indian Others Institutions Table 3.7 Correlation between different institutions of Public sector Joint Venture predominantly Indian Others Institutions Joint Venture predominantly Indian Others Institutions
24 Figure 3.5 Table 3.8 Correlation between different institutions of private sectors Indian Joint venture predominantly Indian Joint venture Predominantly Foreign Indian 1 Joint venture predominantly Indian Joint venture Predominantly Foreign
25 Assets Under Management : (Institution Wise) Table- 3.6 shows sector-wise Assets Under Management from March 2000 to March After deregulation, share of Indian mutual fund companies, Joint venture predominantly Indian companies related to private sector have increased their asset base manifold. Assets Under Management from all sectors of mutual funds on March 2000 accounted for Rs. 1,13,005 crore. It has decreased to Rs. 79,464 crore by March 2003 and again rised year by year and reached to as high as Rs. 4,17,300 crore by the March The period from 2001 to 2003 witnessed extreme volatility in the market and the equity index declined by 28 per cent and as a result the Assets Under Management too declined to Rs. 79,464 crore by the March Moreover, bifurcation of the UTI and exclusion of the assets of specified undertaking of the UTI is also an other effect. This is the first time in the last two decades that the industry had such a decline in the total Assets Under Management. Bank sponsored mutual funds include joint venture predominantly Indian and other mutual funds. Under joint venture, SBI mutual fund was only the mutual fund which had nearly 7 per cent of asset base in March 2000 decreased with fluctuations and reached to 6 per cent to March Share of assets of other bank sponsored mutual funds per cent include Bank of Baroda, Can Bank and UTI Mutual Funds. This was declined to per cent to March 2003 due 83
26 to bifurcation of the UTI and reached to per cent to the March Bank sponsored mutual funds though supported by strong financial institutions with large investor base and latest technology have failed because of the absence of will to adopt to the changes in the market and institutionalize the knowledge of the new economy. In the case of institutional mutual funds the share of only the mutual fund Jeevan Bima Sahayog Ltd (LIC Mutual Fund) is almost constant in all years. Due to inclusion of the GIC mutual fund and IDBI principal mutual fund for two years, the share has been rised in 2003 and Share of Indian private sector mutual funds in March 2000 was 2.06 per cent. It has constantly gone up to per cent to March 2009 due to rise in the assets of Tata AMC, Reliance Capital AMC and Kotak Mahendra Mutual Fund and opening up of some other Asset Management Companies under this category Joint venture predominantly Indian have also rised their share from 8.60 per cent to per cent. This is due to rise in the assets of Birla Sunlife mutual fund, DSP ML mutual fund, HDFC mutual fund and Pru ICICI mutual fund. Assets of joint venture predominantly foreign have also rised from per cent to per cent to the year March Due to competition with predominantly Indian companies and decrease in the net assets of principal PNB Asset Management Company Private Limited and conversion of Franklin Templeton Asset Management Company into foreign the percentage has decreased to 4.84 per cent to March
27 The above analysis reveals that the share of Indian mutual fund companies, Joint venture predominantly Indian companies had increased their asset base manifold. On the other hand, assets of bank sponsored mutual funds have decreased. Joint venture mutual funds predominantly foreign though increased are lagging behind when compared to the Indian and predominantly Indian mutual funds. This is evident by the correlation analysis. The correlation analysis between joint venture predominantly Indian and other categories in the case of public sector, and the correlation analysis between Indian and Joint venture predominantly foreign in the case of private sector is negative. Correlation between Joint venture predominantly Indian and Joint venture predominantly foreign though positive is not significant because it is
28 Table 3.9 Sector Wise Mutual Fund Sales (for the year ended 31 March ) Public Sector UTI A. Bank Sponsored 1. Joint Venture- Predominantly Indian (Rs. In Crores) ,536 (22.66) 1,828 (3.06) 12,413 (13.35) 2,181 (2.35) 4,643 (2.82) 4,242 (2.58) 7,062 (2.24) ,090 (3.52) 2. Others B. Institutions Private Sector 1. Indian 2,211 (3.70) 6,688 (11.19) 4,011 (4.31) 19,901 (21.41) 9,371 (5.70) 33,634 (20.44) (5.57) 83,351 (26.49) 2. Foreign Joint Venture- Predominantly Indian 4. Joint Venture- Predominantly foreign Total 15,548 (26.02) 19,937 (33.37) 59,748 (100.00) 20,796 (22.37) 33,655 (36.21) 92,957 (100.00) 48,396 (29.42) 64,237 (39.04) 1,64,523 (100.00) 71,513 (22.73) 1,24,122 (39.45) 3,14,673 (100.00) 46,661 (7.91) 21,897 (3.71) 1,43,050 (24.24) 30,995 (3.69) 59,451 (7.08) 12,800 (1.52) 2,42,428 (28.87) 48,167 (4.39) 89,059 (8.11) 46,220 (4.21) 2,56,761 (23.38) 52,512 (2.71) 1,61,501 (8.33) 1,24,607 (6.43) 4,79,754 (24.75) 21,089 (3.57) ,40,545 (23.81) 2,16,948 (36.76) 5,90,190 (100.00) 1,56,879 (18.69) 3,37,109 (40.15) 8,39,662 (100.00) 3,46,518 (31.55) 3,11,433 (28.36) 10,98,158 (100.00) 6,21,899 (32.08) 4,98,319 (25.71) 19,38,592 (100.00) 1,43,324 (3.21) 3,46,270 (7.76) 1,94,030 (4.35) 13,69,180 (30.67) 1,82,305 (4.08) 13,92,729 (31.20) 8,36,538 (18.73) 44,64,376 (100.00) 3,50,597* (6.46) 4,23,131 (7.80) 3,63,066 (6.69) 17,82,552 (32.85) 2,57,363 (4.74) 18,75,872 (34.57) 3,73,772 (6.89) 54,26,353 (100.00) Source : AMFI Quarterly and Monthly Reports * Include Rs. 3,192 crore related to Joint venture predominantly foreign 86
29 Figure 3.6 Mutual Fund Sales of Public Sector (Institution wise) Rupees in Crores UTI Joint Venture predominantly Indian Others Institutions year Table 3.10 Correlation between different institutions of Public Sector. UTI Joint Venture predominantly Indian Others Institutions UTI Joint Venture predominantly Indian Others Institutions
30 Figure Mutual Fund Sales of Private Sector (Institution Wise) Rupees in Crores Indian Joint venture predominantly Indian Joint venture predominantly Foreign Year Table 3.11 Correlation between different institutions of Private Sector. Indian Joint venture predominantly Indian Joint venture predominantly Foreign Indian 1 Joint venture predominantly Indian Joint venture predominantly Foreign
31 Sector wise mutual fund sales Table 3.9 reveals trends in the sales of mutual funds of public and private sector from March 2000 to The analysis reveals that the sales of private sector- Indian, Joint venture predominantly Indian and the institutions sales have increased. Total mutual fund sales from all schemes during the year March 2000 were Rs. 59,748 crore. It has gone up to Rs.54,26,153 crore by the March The sales of mutual funds in March 2000 were dominated by the Joint venture mutual funds particularly foreign companies and the UTI. Out of the total sales during March 2000, per cent was contributed by the UTI and due to competition with private sector and bifurcation of UTI this has fallen down to 2.24 per cent to March After bifurcation of the UTI in the year 2004 all bank sponsored under public sector have shown under two heads as joint venture predominantly indian and others. And SBI Mutual Fund was only the fund included in the first category. And in the second category BOB Mutual Fund, Can bank Mutual Fund and UTI Mutual Funds were included. Sales of joint venture predominantly indian (SBI MF) have increased to 6.46 per cent by the year And the sales of other mutual funds though increased, their share in the total sales was constant at 8 per cent from the year 2005 to The sales of institutions were 3.70 per cent in March 2000, which came down to 1.52 per cent in March 2005 mostly due to merger of the GIC Mutual Fund into Tata Mutual Fund. Due to the introduction of innovative schemes and buoyancy 89
32 of secondary market, it has gained strength and the share reached to 6.69 per cent by March The share of the Indian private sector mutual funds which was per cent in March 2000 had gradually increased to 32 per cent in 2009 due to opening of many innovative and investor friendly schemes by Tata Asset Management company, Reliance Capital and Kotak Mahendra. The share of sales of Joint Venture predominantly indian has increased from 26 per cent to 35 per cent between the years 2000 and 2009 due to out performance of Joint venture predominantly indian mutual funds like HDFC, Pru ICICI and DSP Merrill Lynch etc. The sales of joint venture predominantly foreign have decreased from per cent to nearly seven per cent for the above period. From the above it is evident that private sector Indian, Joint venture predominantly indian and institutions mutual fund sales of public sector have increased. On the other hand sales of bank sponsored and private sector joint venture predominantly foreign have decreased. It is proved by the negative correlation between the institutions and other categories (UTI and joint venture predominantly Indian) in the cases of public sector, and joint venture predominantly foreign with the other categories (Indian and Joint venture predominantly Indian) in the case of private sector. 90
33 Table 3.12 Sector Wise Mutual Fund Redemptions (for the year ended 31st March) (Rs. in crores) Public Sector UTI 9,663 (23.45) 12,090 (14.42) 11,927 (7.58) 7,246 (2.41) A. Bank Sponsored 1. Joint Venture- Predominantly Indian 1,744 (4.23) 4,125 (4.92) 3,329 (2.12) 10,536 (3.50) 43,183 (7.95) (3.56) 43,973 (4.21) 48,942 (2.65) 1,35,645 (3.15) 3,46,617* (6.35) 2. Others N.A. N.A. N.A. N.A. N.A (7.46) 85,562 (8.18) 1,54,351 (8.37) 3,35,629 (7.79) 4,26,790 (7.82) B. Institutions 1,864 (4.53) 3,147 (3.75) 8,550 (5.43) 16,121 (5.35) 19,796 (3.64) 16,183 (1.93) 44,108 (4.22) 1,20,381 (6.53) 1,91,851 (4.45) 3,57,112 (6.55) Private Sector 1. Indian 5,718 (13.88) 17,576 (20.98) 31,181 (19.82) 79,341 (26.34) 1,33,131 (24.50) 2,38,065 (22.77) 2,38,065 (22.77) 4,50,447 (24.42) 13,11,006 (30.41) 18,06,550 (33.12) 2. Foreign ,248 (3.54) ,75,937 (4.08) 2,63,674 (4.83) 3. Joint Venture- Predominantly Indian 10,641 (25.83) 18,353 (21.89) 43,239 (27.48) 68,333 (22.68) 1,27,280 (23.41) 3,29,429 (31.52) 3,29,429 (31.52) 5,91,457 (32.07) 13,41,120 (31.11) 18,65,948 (34.21) 4. Joint Venture- Predominantly foreign 11,574 (28.08) 28,538 (34.04) 59,122 (37.57) 1,19,648 (39.72) 2,00,743 (36.95) 3,04,245 (29.10) 3,04,245 (29.10) 4,78,934 (25.96) 8,19,387 (19.01) 3,87,959 (7.12) Total 41,204 (100.00) 83,829 (100.00) 1,57,348 (100.00) 3,01,225 (100.00) 5,43,381 (100.00) 10,45,382 (100.00) 10,45,382 (100.00) 18,44,512 (100.00) 43,10,575 (100.00) 54,54,650 (100.00) Source : AMFI Quarterly and Monthly Reports * It includes Rs related to joint venture predominantly foreign 91
34 Figure Mutual Fund Redemptions of Public Sector (Institution wise) Rupees in Crores UTI Joint Venture predominantly Indian Others Institutions Year Table 3.13 Correaltion between different institutions of Public Secor UTI UTI 1 Joint Venture predominantly Joint Venture predominantly Indian Indian Others Others Institutions Institutions
35 Figure Mutual Fund Redemptions of Private Sector (Institution wise) Rupees in Crores Indian Joint venture predominantly Indian Joint venture predominantly Foreign Year Table 3.14 Correlation between different institutions of Private Sector Indian Joint venture predominantly Indian Joint venture predominantly Foreign Indian 1 Joint venture predominantly Indian Joint venture predominantly Foreign
36 Sector-wise mutual fund redemptions Table 3.12 depicts sector-wise mutual fund redemptions from all schemes from March 2000 to After deregulation, redemptions of mutual funds have gone up with sales. Mutual fund redemptions from all schemes in March 2000 were Rs. 41,204 crore. This has increased to Rs. 54,54,650 crore to the year March Share of redemption of mutual fund schemes in March 2000 was dominated by joint venture predominantly foreign (28.08%) predominantly indian (25.83%) and the UTI (23.45%). Redemptions from the UTI have gradually decreased in accordance with sales and reached to 2.41 per cent in March Redemptions from bank sponsored schemes have gone up from 4.23 per cent in March 2000 to around eight per cent in March Thereafter with wide fluctuations it had reached to 6.35 per cent by the year Redemptions of institutions have gone up to 6.35 per cent by March Redemptions of Indian private sector mutual funds which were nearly 14 per cent in March 2000 have increased to more than 33 per cent by the March And redemptions of Joint venture mutual funds dominated by Indian share, which were 26 per cent in March 2000 have goneup to 34 per cent by the March And joint venture predominantly foreign though increased from 28 per cent to 40 94
37 per cent has decreased to 7.12 per cent by the March 2009 due to fluctuations in sales. What is significant is the fact that the industry managed well the net outflows of nearly rupees a lack crore due to economic recession during the month of September and October 2008 with the support initiated by SEBI, Government and extended by RBI. 13 It is evident that the mutual fund redemptions in the case of purely Indian, Joint venture predominantly Indian and institutions have increased. On the other hand redemptions of the joint venture predominantly foreign in the case of private sector have decreased. It is also proved by the correlation analysis. The correlation between Institutions and Joint venture predominantly Indian with other categories of public sector and the correlation of joint venture predominantly foreign with the Indian and Joint venture predominantly Indian in the case of private sector are negative
38 Table 3.15 Number of Funds and Assets Under Management (Sector-wise) (Rs. In Crore) At the end of March Public Sector (including UTI) No.of Assets Funds Under Manage ment 23,942* (27.27) (25.80) (20.69) (17.24) (16.67) (14.28) (14.28) (30.13) 32,120 (23.22) 31,977 (21.41) 50,348 (21.71) 64,213 (19.67) 89,531 (17.72) 82,384 (24.60) Private Sector No.of Funds 24 (72.73) 23 (74.20) 23 (79.31) 24 (82.76) 25 (83.36) 30 (85.72) 30 (85.72) Assets Under Manage ment 55,522 (69.87) 1,06,199 (76.78) 1,17,349 (78.75) 1,81,514 (78.29) 2,62,175 (80.33) 4,15,621 (82.28) 3,34,916 (75.40) No.of Funds 31 (100.0) 31 (100.0) 29 (100.0) 29 (100.0) 30 (100.0) 35 (100.0) 35 (100.0) Total Assets Under Manage ment 79,464 (100.0) 1,39,616 (100) 1,49,600 (100) 2,31,862 (100.0) 3,26,388 (100.0) 5,05,152 (100.0) 4,17,300 (100.0) (Figures exclude fund of funds) Correlation between Number of Funds and AUM of Public Sector Correlation between Number of Funds and AUM of Public Sector Source: 1) AMFI Update Vol. 1 Issue VII. 2) 3) RBI Report on currency and finance 4) AMFI Quarterly and monthly reports Note: Figures in brackets are percentages * UTI bifurcation. 96
39 Number of Funds And Assets Under Management (Sector-Wise) Table 3.15 shows sector-wise number of mutual funds and their Assets Under Management from March 2003 to After deregulation, public sector has weakened, in terms of number of players and Assets Under Management. Of the total Assets Under Management at the end of March 1998, the share of public sector was more than 94 per cent and the remaining share was related to the private sector. However, the public sector has a deteriorating performance where in its share had declined sharply to as low as 59 per cent by March On the other hand the share of private sector has gone up manifold and reached to Rs. 40,956 crore (41.%). By March 2003, there were 33 funds in mutual fund industry which had Assets Under Management of Rs. 79,464 crore. Out of which 9 funds related to public sector had constituted 30 per cent. Where as in the case of private sector, there were 24 mutual funds which had Assets Under Management to the tune of Rs. 55,522 crore or 70 per cent. Assets Under Management both in the case of private and public sector had an increasing tendency because of bullish secondary market and the support of the foreign institutional investors. And the UTI occupies 59 per cent of the public sector with an Assets Under Management of Rs. 48,754 crore as on 31 March And in the category of private sector Reliance Mutual Fund, HDFC Mutual 97
40 Fund and Franklin Templeton Mutual Fund were the biggest players and constitute an Assets Under Management of Rs. 80,963 crore Rs. 57,956 crore and Rs. 19,205 crore respectively as on 31 March The number of mutual funds under public sector has come down to five due to winding up of the PNB Mutual Fund in the year 2004 and the GIC Mutual Fund taken over by the Tata Mutual Fund. Two private funds ILFS Mutual Fund and Sun F&C Mutual Fund have been taken over by the UTI Mutual Fund and the IDBI Mutual Fund respectively. This number was compensated by the opening of two new funds i.e., Fidelity Mutual Fund and ABN Amro Mutual Fund. Number of funds and Assets Under Management of private sector for the year 2009 have further increased and reached to 30 and Rs. 3,34,916 (80.25%) respectively by opening of funds like Quantum AMC Private Limited, Taurus AMC Limited, AIG Global AMC, Mirae Asset Global Investment, Edelweiss AMC, FIL fund management. 98
41 Therefore from the above it is clear that after deregulation, public sector has weakened in terms of number of funds and Assets Under Management and has been occupied by the private sector. It is evident by the percentages of number of funds and Assets Under Management of both the public and private sectors. And it is also proved by the correlation analysis. The correlation between number of funds and Assets Under Management both in the case of public and private sector is positive, which shows the change in the number of funds (increase / decrease) causes the same degree of change (increase / decrease) both in the case of public and private sectors. 99
42 Table 3.16 Unit holding Pattern of Mutual Fund Industry as on Category Individuals No.of Investor Accounts* Net Assets (Rs. In crore) Public Private Total Public Private Total (35.84) (64.16) (100.00) (22.88) (77.12) (100.00) 1,50,58,231 2,69,56,482 4,20,14,713 42, ,44, ,87, (98.30) (96.08) (96.86) (48.50) (34.48) (36.93) (17.36) (82.64) (100.00) (9.02) (90.98) (100.00) NRIs 1,48,965 7,08,985 8,57,950 2, , , (0.97) (2.53) (1.98) (2.52) (5.36) (4.86) FIIs (81.37) (18.63) (100.0) (6.61) (93.39) (100.0) , , (0.00) (0.00) (0.00) (0.63) (1.87) (1.65) Corporates/ Institutional/ (22.38) (77.62) (100.00) (14.89) (85.11) (100.00) 1,12,235 3,89,364 5,01,599 42, ,44, ,87, Other (0.73) (1.39) (1.16) (48.35) (58.29) (56.55) (35.32) (64.68) (100.00) (17.42) (82.58) (100.00) Total 1,53,20,165 2,80,54,999 4,33,75,164 88,434,38 4,19, ,07, (100.00) (100.00) (100.00) (100.00) (100.00) (100.00) Correlation between Investor Accounts and Net Assets of Public Sector Correlation between Investor Accounts and Net Assets of Private Sector Source : sebi.gov.in/mf/unithold.html * There may be more than one folio of an investor which might have been counted more than once and actual number of investors would be less. 100
43 Unit holding pattern of Mutual Fund Industry Table 3.16 shows sector-wise unit holding pattern and net assets of mutual fund industry as on 31 March The result shows, that in the case of investor accounts private sector individual players and in the case of net assets private sector corporate players dominated the industry. Out of the total 4.34 crore unit holding accounts, as on 31 March 2008, 2.80 crore (64.68%) are relating to the accounts of private sector, which constitute Rs. 4,19,235 (82.58%) of net assets. And the balance 1.53 crore (35.32%) investor accounts are related to public sector constituting only Rs. 88,434 (17.42%) of total assets. It is surprising, that out of the total 4.34 crore investor accounts 4.20 crore (96.86%) are related to individuals and they constitute Rs. 1,87,464 of net assets (36.93%) only. Where as a small percentage of 1.16 (5 lakh) corporate and institutional investors constitute Rs. 2,87,108 (56.55%) because they had a very strong financial base and liquidity in the financial market. It is also interesting to note that private sector players have attracted the individuals and corporates than the public sector, with their latest technical and managerial talents. Out of the total 4.20 crore individual investor accounts, 2.69 crore (64.16%) are related to private sector, constituting Rs. 1,44,571 (77.12%) of net assets. And the remaining 1.50 crore (35.84%) investor accounts are related to public sector constituting Rs. 42,893 (22.88%). 101
44 In the same way out of the 5 lakh Corporate / Institutional investor accounts 3.89 lakh (77.12%) are related to private sector, constituting Rs. 2,44,350 (85.11%) of net assets. And the rest 1.12 lakh (22.38%) investor accounts are related to public sector, constituting Rs. 42,758 (14.89%) of net assets. Though share of NRIs among total investors is 8.58 lakh their contribution among total assets is less than 5 per cent. Number of accounts and net assets of FIIs is very less and does not effect the industry. It is evident that the private sector individual investors dominated the industry in the case of investor accounts and net assets. And number of private corporate investor accounts though very less, they have contributed more than half of the share in the total assets of the industry. Though the private sector individual players in the case of investor accounts, corporates in the case of net assets dominated the industry, the correlation between number of investor accounts and net assets of public sector is more positive than in the case of the private sector. It indicates that the increase in the net assets and investor accounts is more related in public sector than in the private sector. 102
45 Table 3.17 Break-up of Mutual Fund Assets-Client wise (as on ) (Rs. in crores) Sl.No. Client Amount Rs. % 1 Banks & FIs 19, Corporates 2,12, FIIs 4, High Networth Investors 91, Retail 88, Total 4,17, Source : Value Research, Mutual Fund Insight, VI(10) 15 June-14, July 2009 ETFs does not include Gold ETFs HNIs defined as investors investing over Rs.5 lakh 103
 of the share and stood first among all the players.")
46 Figure 3.10 Table 3.17 shows the client wise break-up of mutual fund assets as on 31 st March Out of the total assets under management as on 31 st March 2009, corporate players contributed more than half (50.92%) of the share and stood first among all the players. High networth investors and retail investors also contributed nearly 22 per cent each. And the total share of banks and Foreign Institutional Investors (FIIs) in the total assets is as low as six per cent. 104
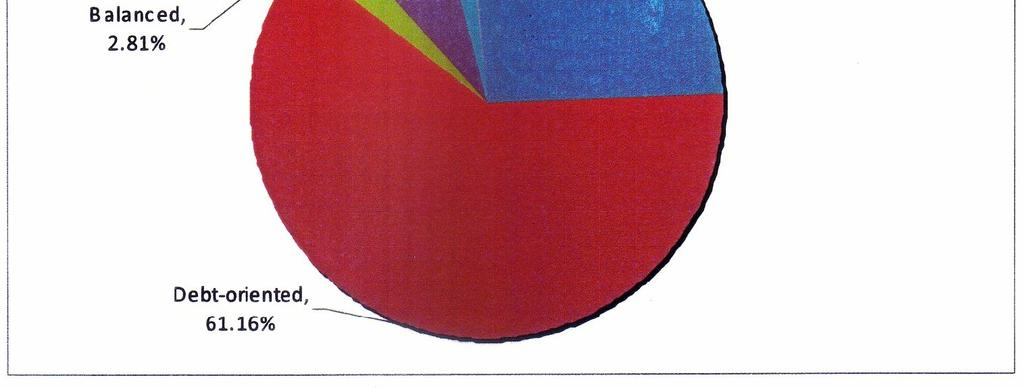
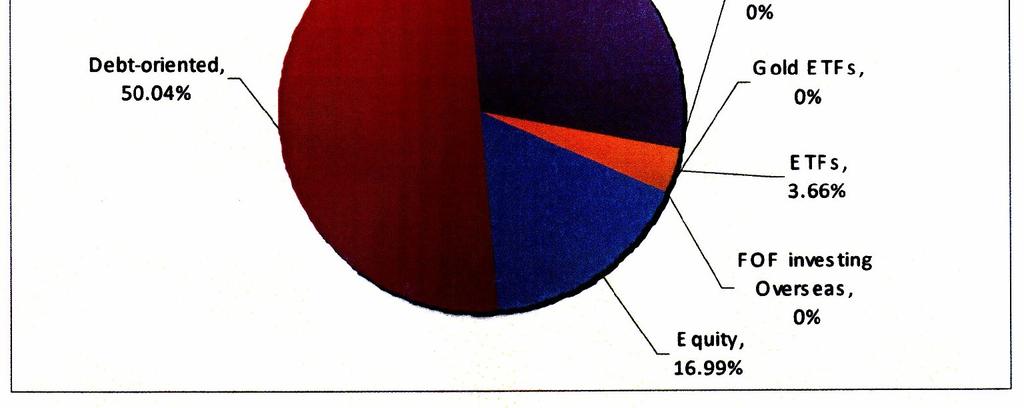
47 Table 3.18 Client-wise Portfolio Investment as on (Rs. In corres) S. No. Banks & FIs 1 Equity 1,856 (9.65) 2 Debt-oriented 2,661 (13.83) 3 Balanced 52 (0.27) 4 Liquid/ MM 14,496 (75.35) 5 Gilt 106 (0.55) 6 ETFs 4 (0.02) 7 Gold ETFs 25 (0.13) 8 FOF investing 38 overseas (0.20) Total 19,238 (100.00) Corporates FIIs HNIs Retail Total 13, ,514 70,768 1,09,141 (6.20) (16.99) (24.49) (79.73) (26.15) 1,27,387 2,443 56,225 8,042 1,96,758 (59.95) (50.04) (61.16) (9.06) (47.15) 1, ,583 7,917 11,615 (0.50) (0.02) (2.81) (8.92) (2.78) 66,084 1,430 7, ,745 (31.10) (29.29) (7.68) (0.76) (21.51) 3,698-1, ,947 (1.74) (2.08) (0.26) (1.42) (0.10) (3.66) (0.23) (0.07) (0.16) (0.17) (0.20) (0.20) (0.18) 510-1, ,678 (0.24) (1.35) (1.00) (0.65) 2,12,489 4,882 91,931 88,760 4,17,300 (100.00) (100.00) (100.00) (100.00) (100.00) Source : Value Research, Mutual Fund Insight, VI (10) 15 June- 14 July ETFs does not include gold ETFs HNIs defined as investors investing over Rs. 5 lakhs 105

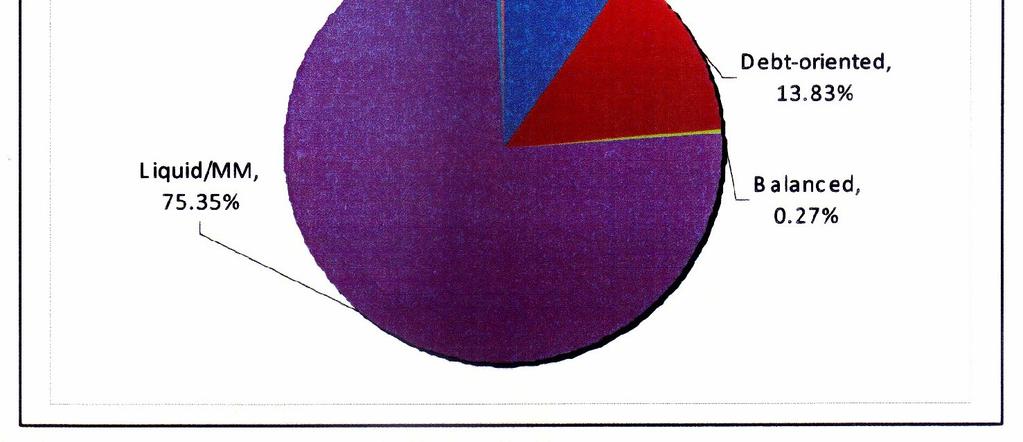
48 Figure 3.11 Figure
49 107


50 Figure
SUMMARY OF FINDINGS, CONCLUSION AND SUGGESTIONS
 CHAPTER-7 SUMMARY OF FINDINGS, CONCLUSION AND SUGGESTIONS This chapter is divided into three sections. The first section enumerates the objectives and methodology of the study, the second section puts
A Study on Performance of Mutual Funds
 Volume-6, Issue-1, January-February-2016 International Journal of Engineering and Management Research Page Number: 512-517 A Study on Performance of Mutual Funds Pritam Naik Post Graduation Department,
PERCEPTION OF INVESTOR IN MUTUAL FUND: INDIAN PERSPECTIVE
 PERCEPTION OF INVESTOR IN MUTUAL FUND: INDIAN PERSPECTIVE Peeyush Bangur- M.B.A (Financial Administration) Lecturer, Shri Vaishnav Institute of Management, Indore. Madhya Pradesh Pratima Jain- MBA (Finance)
MUTUAL FUND INDUSTRY OF INDIA AND MOBILISATION OF SAVINGS
 MUTUAL FUND INDUSTRY OF INDIA AND MOBILISATION OF SAVINGS Joseph M.A. Mobilisation of savings through mutual funds a study with special reference to Kerala Thesis. Department of Commerce and Management
Indian Mutual Fund Industry
 Indian Mutual Fund Industry Changing Paradigm Ashok Suvarna COO, Birla Sun Life Asset Management Company Limited July 21, 2012 Agenda History Competitors Mutual Funds Industry - Global Indian MF Industry
MUTUAL FUND DATA FOR THE QUARTER JULY - SEPTEMBER 2016 TABLE - 1 SALES - ALL SCHEMES. From Existing Schemes. Total for the Quarter
 ASSOCIATION OF MUTUAL FUNDS IN INDIA One Indiabulls Centre, Tower 2, Wing B, 701, 7th Floor, 841 Senapati Bapat Marg, Elphinstone Road, Mumbai 400013.* Tel. (022) 43346700 (32 lines) * Fax. (022) 43346712/
SALES - ALL SCHEMES. From Existing Schemes. Total for the month
 One Indiabulls Centre, Tower 2, Wing B, 701, 7th Floor, 841 Senapati Bapat Marg, Elphinstone Road, Mumbai 400013.* Tel. (022) 43346700 (32 lines) * Fax. (022) 43346712/ 722 * Website: http://www.amfiindia.com
THE FALL AND RISE OF MUTUAL FUNDS IN INDIA. Kaushal Shah & Associates Advocates, Solicitors and Legal Consultants
 THE FALL AND RISE OF MUTUAL FUNDS IN INDIA Kaushal Shah & Associates Advocates, Solicitors and Legal Consultants Corporate Office: 406, Peninsula Plaza, Fun Republic Lane, Off Andheri Link Rd, Andheri
Association of Mutual Funds in India
 MUTUAL FUND DATA FOR THE QUARTER APRIL - JUNE 2012 Vol. XII Issue I CATEGORY TABLE - 1 From New Schemes # No. SALES - ALL SCHEMES From Existing Schemes Total for the Quarter REDEMPTIONS ALL SCHEMES Total
MUTUAL FUND DATA FOR THE QUARTER APRIL - JUNE 2016 TABLE - 1 SALES - ALL SCHEMES. From New Schemes #
 ASSOCIATION OF MUTUAL FUNDS IN INDIA One Indiabulls Centre, Tower 2, Wing B, 701, 7th Floor, 841 Senapati Bapat Marg, Elphinstone Road, Mumbai 400013.* Tel. (022) 43346700 (32 lines) * Fax. (022) 43346712/
ASSOCIATION OF MUTUAL FUNDS IN INDIA
 ASSOCIATION OF MUTUAL FUNDS IN INDIA One Indiabulls Centre, Tower 2, Wing B, 701, 7th Floor, 841 Senapati Bapat Marg, Elphinstone Road, Mumbai 400013.* Tel. (022) 43346700 (32 lines) * Fax. (022) 43346712/
Recent Trends and Growth of Mutual Fund Industry in India
 IJA MH International Journal on Arts, Management and Humanities 3(2): 36-41(2014) Recent Trends and Growth of Mutual Fund Industry in India Naveen Sharma Research Scholar, Shimla, (Himachal Pradesh), INDIA
GROWTH OF RESOURCE MOBILISATION BY INDIAN MUTUAL FUND INDUSTRY: AN EMPIRICALANALYSIS
 Volume 118 No. 18 2018, 4357-4371 ISSN: 1311-8080 (printed version); ISSN: 1314-3395 (on-line version) url: http://www.ijpam.eu ijpam.eu GROWTH OF RESOURCE MOBILISATION BY INDIAN MUTUAL FUND INDUSTRY:
FROM THE CHAIRMAN'S DESK
 For private circulation only A Newsletter of The Association of Mutual Funds in India January - March, 2003 Vol : II. Issue : IV FROM THE CHAIRMAN'S DESK Mutual fund industry witnessed a major development
ASSOCIATION OF MUTUAL FUNDS IN INDIA
 ASSOCIATION OF MUTUAL FUNDS IN INDIA One Indiabulls Centre, Tower 2, Wing B, 701, 7th Floor, 841 Senapati Bapat Marg, Elphinstone Road, Mumbai 400013.* Tel. (022) 43346700 (32 lines) * Fax. (022) 43346712/
MUTUAL FUNDS IN INDIA CHANGES AND CHALLENGES
 Volume 6, Issue 8 (August, 2017) UGC APPROVED Online ISSN-2277-1166 Published by: Abhinav Publication Abhinav National Monthly Refereed Journal of Research in MUTUAL FUNDS IN INDIA CHANGES AND CHALLENGES
ASSOCIATION OF MUTUAL FUNDS IN INDIA
 ASSOCIATION OF MUTUAL FUNDS IN INDIA One Indiabulls Centre, Tower 2, Wing B, 701, 7th Floor, 841 Senapati Bapat Marg, Elphinstone Road, Mumbai 400013.* Tel. (022) 43346700 (32 lines) * Fax. (022) 43346712/
EVALUATION OF FINANCIAL PERFORMANCE OF INSURANCE COMPANIES VIS-A-VIS DISTRIBUTION CHANNELS
 CHAPTER VI EVALUATION OF FINANCIAL PERFORMANCE OF INSURANCE COMPANIES VIS-A-VIS DISTRIBUTION CHANNELS EVALUATION OF FINANCIAL PERFORMANCE OF INSURANCE COMPANIES VIS-A-VIS DISTRIBUTION CHANNELS Insurance
MUTUAL FUND DATA FOR THE QUARTER APRIL - JUNE 2014
 MUTUAL DATA FOR THE QUARTER APRIL - JUNE 2014 TABLE - 1 CATEGORY From New # No. SALES - ALL SCHEMES From Existing Total for the Quarter REDEMPTIONS ALL SCHEMES Total for the Quarter Average Assets Under
MUTUAL FUND DATA FOR THE QUARTER JANUARY - MARCH 2017 TABLE - 1 SALES - ALL SCHEMES. From Existing Schemes. Total for the Quarter
 ASSOCIATION OF MUTUAL FUNDS IN INDIA One Indiabulls Centre, Tower 2, Wing B, 701, 7th Floor, 841 Senapati Bapat Marg, Elphinstone Road, Mumbai 400013.* Tel. (022) 43346700 (32 lines) * Fax. (022) 43346712/
3. Collective Investment Vehicles
 43 Collective Investment Vehicles I S M R 3. Collective Investment Vehicles 3.1 Introduction A collective investment vehicle (CIV) allows many invesrs pool their money and invest. The pooled capital is
MUTUAL FUND IN INDIA PAST SCENARIO,PRESENT HURDELS AND FUTURE ACTIONS PLANES FOR TRANSFORMATIONAL GROWTH.
 MUTUAL FUND IN INDIA PAST SCENARIO,PRESENT HURDELS AND FUTURE ACTIONS PLANES FOR TRANSFORMATIONAL GROWTH. * Mohd Merajuddin Inamdar, Sr. Project Assistant, IT-Bombay, India. INTRODUCTION: Mutual fund is
International Journal of Informative & Futuristic Research ISSN:
 www.ijifr.com Volume 5 Issue 9 May 2018 International Journal of Informative & Futuristic Research ISSN: 2347-1697 Mutual Funds are Subject to Investment: Growth and Stand of Indian Mutual Fund Paper ID
Chapter 5. Conclusions, Findings and Suggestions
 Chapter 5 Conclusions, Findings and Suggestions 5.1 Introduction 5.2 Findings 5.3 Suggestions 5.4 Scope for Further Research 5.1 Introduction This chapter brings out major findings including problems and
The fourth quarter update also provides data for the year
 January - March 2007 Vol. VI Issue IV The fourth quarter update also provides data for the year 2006 07. The Mutual Fund industry continues to register robust growth with AUM posting 41 percent increase
Mutual Fund Screener For the quarter ended Mar-18
 Mutual Fund Screener For the quarter ended Mar-18 Mutual Fund Screener What s Inside 01 Industry 02 Investor 03 Inflow Outflow 04 Sector Size Trends Analysis Update 05 Category Performance 06 Industry
Performance Evaluation of Gilt Mutual Fund Schemes in India
 DOI : 10.18843/ijms/v5i2(6)/04 DOI URL :http://dx.doi.org/10.18843/ijms/v5i2(6)/04 Performance Evaluation of Gilt Mutual Fund Schemes in India Kamalpreet Kaur, Research Scholar, Department of Commerce,
Mutual Fund Screener For the quarter ended Sep-17
 Mutual Fund Screener For the quarter ended Sep-17 Mutual Fund Screener What s Inside 01 Industry Size 02 Investor Trends 03 Inflow Outflow Analysis 04 Sector Update 05 Category Performance 06 Industry
Mutual Fund Screener For the quarter ended Jun -18
 Mutual Fund Screener For the quarter ended Jun -18 Mutual Fund Screener What s Inside 01 Industry Size 02 Investor Trends 03 Inflow Outflow Analysis 04 Sector Update 05 Category Performance 06 Industry
October December 2010 Vol. X Issue III
 October December 2010 Vol. X Issue III The metamorphosis in the Mutual Fund Industry, post game-changing regulations appear to be complete. The Fund Houses, the Distributors, the R&T agents and the Investors
CHAPTER -3. REOSURCE MOBILIZATION PATTERNS AND PROJECTIONS FOR MUTUAL FUND INDUSTRY IN INDIA Contents: 3.0. Introduction 72
 CHAPTER 3 REOSURCE MOBILIZATION PATTERNS AND PROJECTIONS OR MUTUAL UND INDUSTRY IN INDIA Contents: 3.0. Introduction 72 3.1. of Resource Mobilization 73 3.2. Overview of Resource Mobilization in India
Mutual Fund Monthly Newsletter
 Mutual Fund Monthly Newsletter MAR 217 Know what you own, and know why you own it. - Peter Lynch 1 MUTUAL FUND INDUSTRY SYNOPSIS MUTUAL FUNDS SEE RS 3, CR INFLOW IN FEB; RS 3.98 LAKH CR IN 11 MONTHS MUTUAL
India : Building scale and leadership. Pankaj Razdan Prudential Corporation Asia 1 December 2006
 India : Building scale and leadership Pankaj Razdan Prudential Corporation Asia 1 December 2006 India : Economic Overview Rising affluence Wealth generation is driven by strong economic and market capitalisation
Role of Insurance Regulatory and Development Authority in Indian Insurance Sector: A Study
 Role of Insurance Regulatory and Development Authority in Indian Insurance Sector: A Study P.J.Prakash, Lecturer in Commerce, Govt. Degree college Mandapet, East Godavari Dt. 1. Introduction The IRDA Act,
MUTUAL FUNDS AN AVENUE TO INVESTORS
 MUTUAL FUNDS AN AVENUE TO INVESTORS. M.Sudha Madhavi I/C Principal & Associate Professor Saanvi P.G. College for Women Hyderabad-500058 Email : smakella@gmail.com ABSTRACT Mutual funds have become one
Mutual Fund Monthly Newsletter
 Mutual Fund Monthly Newsletter SEPTEMBER 2017 CHANGE YOUR SAVING HABIT TO EARN MORE - START INVESTING IN MUTUAL FUND MUTUAL FUND INDUSTRY SYNOPSIS MUTUAL FUND INDUSTRY AUM MUTUAL FUNDS SEE RS 62,000 CR
AMFI INVESTOR AWARENESS PROGRAMMES In the current financial year till June 2013, 32 AMCs have conducted 2994 Investor
 Vol. XIII Issue I April-June 2013 CIRCULARS ISSUED BY SEBI Infrastructure Debt Fund SEBI vide its Circular No.CIR/IMD/ DF/7/2013 dated April 23, 2013 has permitted the Asset Management Companies to launch
Morningstar Ratings. Overview. Investor Benefits. How Does It Work?
 s Overview The (TM) for funds, often called the star rating, debuted in 1985 and was quickly embraced by investors and advisors. Using a scale of one to five stars, the original rating allowed investors
From the Chairman s Desk
 For private circulation only A Newsletter of The Association of Mutual Funds in India January - March, 2002 Vol : I. Issue : XV From the Chairman s Desk Looking back, the fiscal year ending March 2002
2. Concept of Mutual Fund
 portfolio to manage risk. Investing and liquidating investment process is quite easy in case of mutual funds. different schemes by fund managers are invested in equity and debt market for the corporate
Mutual Fund Monthly Newsletter
 Mutual Fund Monthly Newsletter Aug, 2016 Put not your trust in money, But put your money in trust. - Oliver Wendell Holmes 1 MUTUAL FUND INDUSTRY SYNOPSIS Equity MF assets base at record high of Rs 4.5
Morningstar Ratings. Overview. Investor Benefits. How Does It Work?
 s Overview The (TM) for funds, often called the star rating, debuted in 1985 and was quickly embraced by investors and advisors. Using a scale of one to five stars, the original rating allowed investors
Morningstar Ratings. Overview. Investor Benefits. How Does It Work?
 s Overview The (TM) for funds, often called the star rating, debuted in 1985 and was quickly embraced by investors and advisors. Using a scale of one to five stars, the original rating allowed investors
Morningstar Ratings. Overview. Investor Benefits. How Does It Work?
 s Overview The (TM) for funds, often called the star rating, debuted in 1985 and was quickly embraced by investors and advisors. Using a scale of one to five stars, the original rating allowed investors
Morningstar Ratings. Overview. Investor Benefits. How Does It Work?
 s Overview The (TM) for funds, often called the star rating, debuted in 1985 and was quickly embraced by investors and advisors. Using a scale of one to five stars, the original rating allowed investors
PERFORMANCE AND PROSPECTS OF MUTUAL FUNDS WITH SPECIAL REFERENCE TO LARGE CAPITAL EQUITY ORIENTED SCHEMES
 Volume 6, Issue 8 (August, 2017) UGC APPROVED Online ISSN-2277-1166 Published by: Abhinav Publication Abhinav National Monthly Refereed Journal of Research in PERFORMANCE AND PROSPECTS OF MUTUAL FUNDS
Mutual Fund Monthly Newsletter
 Mutual Fund Monthly Newsletter Dec, 216 Risk comes from not knowing what you re doing. - Warren Buffett 1 MUTUAL FUND INDUSTRY SYNOPSIS Indian Mutual Fund industry s Avg. Assets under Management (AAUM)
CHAPTER - V INFORMATION TECHNOLOGY IN BANKING: NATURE AND TRENDS
 84 CHAPTER - V INFORMATION TECHNOLOGY IN BANKING: NATURE AND TRENDS In the recent years, the utilization of information technology has magnificently increased in service industry, particularly in the banking
CHAPTER -VIII FINDINGS AND SUGGESTIONS
 CHAPTER -VIII FINDINGS AND SUGGESTIONS Introduction Primary capital market provides opportunity to corporate entities to raise the required funds from different categories of investors through issue of
Role of Corporate Securities in Household Saving and Private Corporate Sector Financing during Eighties - Some Empirical Observations.
 Role of Corporate Securities in Household Saving and Private Corporate Sector Financing during Eighties - Some Empirical Observations Alok Puranik Institute for Studies in Industrial Development New Delhi
Mutual Fund Screener For the quarter ended Dec-17
 Mutual Fund Screener For the quarter ended Dec-17 Mutual Fund Screener What s Inside 01 Industry Size 02 Investor Trends 03 Inflow Outflow Analysis 04 Sector Update 05 Category Performance 06 Industry
Chapter 5 Collection of Secondary Data
 Chapter 5 Collection of Secondary Data 116 CHAPTER 5 COLLECTION OF SECONDARY DATA In the Research Methodology, the initial stage of the researcher was to collect the secondary data of various open-ended
GROWTH, FINANCE AND REGULATION
 ISSN 1804-0519 (Print), ISSN 1804-0527 (Online) www.academicpublishingplatforms.com GROWTH, FINANCE AND REGULATION INVESTORS PERCEPTION ON MUTUAL FUNDS WITH REFERENCE TO CHIDAMBARAM TOWN JEL Classifications:
Fund Characteristics and its Impact on the Performance of Mutual Funds
 CHAPTER 5 Fund Characteristics and its Impact on the Performance of Mutual Funds Chapter 5 Fund Characteristics & its Impact on the Performance Page 100 FUND CHARACTERISTICS AND ITS IMPACT ON THE PERFORMANCE
JANUARY KEY INDICES. 3 Months JANUARY SECTORAL INDICES. 3 Months
 FEBRUARY 2018 HIGHLIGHTS The year 2018 started on a positive note for the global equity markets with most of them advancing in January, backed by widespread positive macroeconomic data. Emerging markets
Chapter - VI COMPARATIVE STUDY OF SELECTED MUTUAL FUNDS
 Chapter - VI COMPARATIVE STUDY OF SELECTED MUTUAL FUNDS CHAPTER - VI COMPARATIVE STUDY OF SELECTED MUTUAL FUNDS After evaluating the performance of selected mutual fund schemes in last chapter, a comparative
Raising Funds from the Capital Market: Challenges for the Private Sector
 Raising Funds from the Capital Market: Challenges for the Private Sector R H Patil In this Perspectives piece, R H Patil, a specialist on capital markets and stock exchanges, analyses the challenging task
CHAPTER 5 Growth and Pattern of Revenue of the Central Government
 CHAPTER 5 Growth and Pattern of Revenue of the Central Government In order to perform it s functions-social, economic and general-government needs funds which have to be garnered from a variety of sources
180 Days 1 Year 3 Years 5 Years 10 Years 15 Years
 31 July 2018 To remove this notice, visit: EQUITY FUNDS - LARGECAP Axis Bluechip Fund - Gr * UTI Equity Fund - Gr * Kotak India EQ Contra Fund - Gr * Edelweiss Large Cap Fund - Gr * Quant Plan G Invesco
PERFORMANCE EVALUATION OF PUBLIC AND PRIVATE SECTOR MUTUAL FUNDS
 PERFORMANCE EVALUATION OF PUBLIC AND PRIVATE SECTOR MUTUAL FUNDS A. Rama krishna 1 1 Student, University College of commerce & Business Management, Osmania University, Telangana, India ABSTRACT In this
From the Chairman s Desk
 For private circulation only A Newsletter of The Association of Mutual Funds in India July - September, 2000 Vol : I. Issue : IX From the Chairman s Desk In many countries mutual fund is positioned as
CRISIL - AMFI Liquid Fund Performance Index. Factsheet December 2017
 CRISIL - AMFI Liquid Fund Performance Index Factsheet December 2017 Table of Contents About the Index...3 Features and Characteristics...3 Methodology...3 CRISIL - AMFI Liquid Fund Performance Index: Constituent
CRISIL - AMFI Equity Fund Performance Index. Factsheet March 2018
 CRISIL - AMFI Equity Fund Performance Index Factsheet March 2018 Table of Contents About the Index...3 Features and Characteristics...3 Methodology...3 CRISIL - AMFI Equity Fund Performance Index: Constituent
GROWTH OF MUTUAL FUNDS INDUSTRY IN DISTRICT MEERUT
 GROWTH OF MUTUAL FUNDS INDUSTRY IN DISTRICT MEERUT During the past one decade, the mutual funds industry has witnessed major transformation. The industry has grown several folds not only in terms of the
E-Wealth QUICK AND EASY INVESTMENT ANYTIME - ANY WHERE - ONLINE SIP - PAPERLESS - DIGITAL GO- E-WEALTH - PAPER - SIGNATURE NO- FORM FILLING PURCHASE
 DECEMBER 2018 PURCHASE REDEEM EWealth Account Account WEALTH ON YOUR FINGERTIPS MUTUAL FUNDS INVESTMENT MADE EASY SWITCH SIP PAPER SIGTURE NO FORM FILLING QUICK AND EASY INVESTMENT ANYTIME ANY WHERE ONLINE
CONTENTS Industry & Fund Update New Fund Offers Performance of Equity Funds Performance of Balanced Funds Performance of Debt Funds
 CONTENTS Industry & Fund Update 1 New Fund Offers 2 Performance of Equity Funds 3 Performance of Balanced Funds 4 Performance of Debt Funds 5 Performance of Fund Of Funds 6 8th January, 2018 INDUSTRY &
CIRCULARS ISSUED BY SEBI
 Vol. XIII Issue II July-September 2013 CIRCULARS ISSUED BY SEBI Investment by Qualified Foreign Investors (QFIs) in to be listed Indian Corporate Debt Securities SEBI vide its Circular No. CIR/IMD/ FIIC/13/2013
Equity Linked Saving Schemes (ELSS): A Rewarding Investment Option Under Section 80C for a Common Man
: A Rewarding Investment Option Under Section 80C for a Common Man") Equity Linked Saving Schemes (ELSS): A Rewarding Investment Option Under Section 80C for a Common Man Narendra Singh Research Scholar --- JJT University, Rajasthan Abstract: In the growth of Indian economy
Equity Linked Saving Schemes (ELSS): A Rewarding Investment Option Under Section 80C for a Common Man Narendra Singh Research Scholar --- JJT University, Rajasthan Abstract: In the growth of Indian economy
Mutual Funds. Fortune Equity Brokers (India) Ltd.
 Ltd.") Mutual Funds A simple tool to achieve financial i goals.. What is Mutual Funds? Passed back to Generates Returns = Investor Pools money with Fund House Fund Managers invest in Capital Market Types of Mutual
Mutual Funds A simple tool to achieve financial i goals.. What is Mutual Funds? Passed back to Generates Returns = Investor Pools money with Fund House Fund Managers invest in Capital Market Types of Mutual
An Analysis of Gap between the Public and Private Sector Mutual Funds in India
 International Journal of Business Management and Economics Research. ISSN 2349-2333 Volume 1, Number 1 (2014), pp. 57-68 International Research Publication House http://www.irphouse.com An Analysis of
CRISIL - AMFI Money Market Fund Performance Index. Factsheet March 2018
 CRISIL - AMFI Money Market Fund Performance Index Factsheet March 2018 Table of Contents About the Index...3 Features and Characteristics...3 Methodology...3 CRISIL - AMFI Money Market Fund Performance
We chose 12 liquid mutual funds. Liquid Mutual Funds. If low risk and high liquidity work best for you. In the News BFSI
 Liquid Mutual Funds If low risk and high liquidity work best for you Higher returns as against a, say, savings account interest rate, easy and fast redemption of invested money, devoid of lock-in period
COMPARATIVE STUDY OF SELECTED LARGE CAP EQUITY MUTUAL FUNDS
 COMPARATIVE STUDY OF SELECTED LARGE CAP EQUITY MUTUAL FUNDS Dr. Sunil M. Adhav 1, Mr. Anoop Waghmare 2 1 Manangement, MAEER s MIT School of Management, Pune (India) 2 Management, MAEER s MIT School of
CRISIL - AMFI Diversified Equity Fund Performance Index. Factsheet September 2017
 CRISIL - AMFI Diversified Equity Fund Performance Index Factsheet September 2017 Table of Contents About the Index... 3 Features and Characteristics... 3 Methodology... 3 CRISIL - AMFI Diversified Equity
Chapter 3 Mutual Funds in India since Liberalization
 Chapter 3 Mutual Funds in India since Liberalization 3.1 Introduction 3.2 Changing Economic Environment in India due to Liberalization 3.3 Evolution of Mutual Funds Industry in India 3.4 The Role of Association
Market Timing Ability and Stock Selection Skills of the Fund Manager
 CHAPTER 6 Market Timing Ability and Stock Selection Skills of the Fund Manager Chapter 6 Market Timing Ability of the Fund Manager Page 148 MARKET TIMING ABILITY AND STOCK SELECTION SKILLS 6.1 Introduction
JULY KEY INDICES JULY SECTORAL INDICES
 AUGUST 2016 Equity Market HIGHLIGHTS Global equity markets exhibited volatility at the beginning of the month as concerns regarding impact of Britain's decision to leave the European Union (EU) resurfaced.
Visit from your mobile browser
 MARCH 2014 Visit www.njwealth.in from your mobile browser Equity Market HIGHLIGHTS Indian equity markets retraced lost ground in the month of February on the back of better than expected Q3 earnings momentum
E-Wealth QUICK AND EASY INVESTMENT ANYTIME - ANY WHERE - ONLINE SIP - PAPERLESS - DIGITAL GO- E-WEALTH - PAPER - SIGNATURE NO- FORM FILLING PURCHASE
 SEPTEMBER 2018 PURCHASE REDEEM EWealth Account Account WEALTH ON YOUR FINGERTIPS MUTUAL FUNDS INVESTMENT MADE EASY SWITCH SIP PAPER SIGTURE NO FORM FILLING QUICK AND EASY INVESTMENT ANYTIME ANY WHERE ONLINE
Volume-3, Issue-6, November-2016 ISSN No:
 VOLATILITY AND MUTUAL FUND RETURNS: A STUDY OF INDIAN EQUITY DIVERSIFIED SCHEMES Kalava Ramesh Research Scholar, School of Management Studies University of Hyderabad India kalavaramesh@uohyd.ac.in Dr.
AUGUST KEY INDICES. 3 Months CNX Nifty S&P BSE S&P BSE CNX
 SEPTEMBER 2015 Equity Market HIGHLIGHTS Globally, the issue of interest rate hike by the US Federal Reserve continued to be shrouded in uncertainty. The eurozone's GDP growth slowed to 0.3% quarteronquarter
CHAPTER - IV PERFORMANCE EVALUATION OF MUTUAL FUNDS
 CHAPTER - IV PERFORMANCE EVALUATION OF MUTUAL FUNDS Chapter - IV PERFORMANCE EVALUATION OF MUTUAL FUNDS Mutual Fund is one of the most preferred investment alternatives for the small investors as it offers
SHORT RUN PERFORMANCE OF INITIAL PUBLIC OFFERINGS IN INDIA
 CHAPTER 5 SHORT RUN PERFORMANCE OF INITIAL PUBLIC OFFERINGS IN INDIA It is a pervasive feature of markets, the world over, those investors who subscribed to initial public offerings, on the offer day,
1 Year 3 Years 5 Years 10 Years 15 Years
 28 October 2016 EQUITY FUNDS Dividend 180 Days 1 Year 3 Years 5 Years 10 Years 15 Years MF NEWS Sundaram Rural India Fund - Gr * SBI Magnum COMMA Fund - Div * Birla Sun Life Small and Midcap Fund - Gr
Shabd Braham E ISSN
 A Comparative Study on the Financial Performance of Selected Mutual Fund Schemes Shiji Shukla (Asst. Professor) Prof. (Dr.) Babita Kadakia, Principal Idyllic Institute of Managements Indore, Madhya Pradesh,
OCTOBER KEY INDICES. 3 Months NIFTY S&P BSE S&P BSE NIFTY
 NOVEMBER 2016 Equity Market HIGHLIGHTS Global equity markets displayed mixed performance in October. In the earlier part of the month, equity markets were volatile as US Fed's September meeting minutes
CONTENTS Industry & Fund Update New Fund Offers Performance of Equity Funds Performance of Balanced Funds Performance of Debt Funds
 CONTENTS Industry & Fund Update 1 New Fund Offers 2 Performance of Equity Funds 3 Performance of Balanced Funds 4 Performance of Debt Funds 5 Performance of Fund Of Funds 6 18th February, 2019 INDUSTRY
MF SCHEME PERFORMANCE AS ON 15TH OCTOBER 2018
 15 OCTOBER 2018 MF SCHEME PERFORMANCE AS ON 15TH OCTOBER 2018 Large Cap Fund Axis Bluechip Fund - Gr * Edelweiss Large Cap Fund - Gr * UTI Master Share - Gr * Canara Robeco Bluechip Equity Fund - Gr *
PERCEPTION TOWARDS MUTUAL FUNDS- AN EMPIRICAL STUDY OF CHANDIGARH CITY
 14 GJBM ISSN: 0973-8533 Vol. 3 No. 2, December 2009 PERCEPTION TOWARDS MUTUAL FUNDS- AN EMPIRICAL STUDY OF CHANDIGARH CITY Vijay Kumar Kaushal* and Gitanjali Upadhaya** ABSTRACT Mutual fund industry has
180 Days 1 Year 3 Years 5 Years 10 Years 15 Years
 28 March 2018 EQUITY FUNDS - LARGECAP Invesco India Fund - Gr * Escorts Plan G Edelweiss Large & Mid Cap Fund - Regular Gr * Axis Equity Fund - Gr * Kotak Classic Equity Fund - Gr * Motilal Oswal MOSt
CONTENTS Industry & Fund Update New Fund Offers Performance of Equity Funds Performance of Balanced Funds Performance of Debt Funds
 CONTENTS Industry & Fund Update 1 New Fund Offers 2 Performance of Equity Funds 3 Performance of Balanced Funds 4 Performance of Debt Funds 5 Performance of Fund Of Funds 6 2nd July, 2018 INDUSTRY & FUND
Accounts Across Investor Types
 Accounts Across Investor Types There are 50,559,495 accounts in the mutual fund industry as at September 2016, of which 99% is accounted for by individual investors. There were: 47,986,325 retail investor
CONTENTS 22nd May 2017
 CONTENTS Industry & Fund Update 2 Dividend Declared 3 New Fund Offers 4 Performance of Equity Funds 5 Performance of Balanced Funds 6 Performance of Debt Funds 7 Performance of Fund Of Funds 8 22nd May
CRISIL - AMFI GILT Fund Performance Index. Factsheet December 2017
 CRISIL - AMFI GILT Fund Performance Index Factsheet December 2017 Table of Contents About the Index...3 Features and Characteristics...3 Methodology...3 CRISIL - AMFI GILT Fund Performance Index: Constituent
Skilling India for an Inclusive Growth
 s Knowledge Partner INDUS EDUTRAIN Pvt. Ltd. Partner N.S.D.C Corporate Office Address: AD 76, Sec I,Salt Lake City, Kolkata - 700064 www.indusedutrain.com Promoted by: Indus Integrated Information Management
CRISIL - AMFI Hybrid Fund Performance Index. Factsheet September 2017
 CRISIL - AMFI Hybrid Fund Performance Index Factsheet September 2017 Table of Contents About the Index...3 Features and Characteristics...3 Methodology...3 CRISIL - AMFI Hybrid Fund Performance Index:
1 Year 3 Years 5 Years 10 Years 15 Years
 13 January 2017 EQUITY FUNDS Dividend 180 Days 1 Year 3 Years 5 Years 10 Years 15 Years MF NEWS SBI Magnum COMMA Fund - Div * Sundaram Rural India Fund - Gr * Sahara Midcap Fund - Gr Tata Equity P/E Fund
180 Days 1 Year 3 Years 5 Years 10 Years 15 Years
 30 June 2017 EQUITY FUNDS - LARGECAP JM Multi Strategy Fund - Option * IDFC Focused Equity Fund - Regular Plan - Gr * JM Basic Fund - Option * JM Core 11 Fund - Series 1 - Option * Kotak Opportunities
As at March 31, As at March 31, (Cost) '000. (No. of Units)
 '000. (No. of Units)") 20. The details of investments required as per Schedule VI of the Companies Act 1956 are provided below. a) Details of Investments held as at March 31, 2010 t 2010 (No. of Units) 2010 (Cost) '000 2009
20. The details of investments required as per Schedule VI of the Companies Act 1956 are provided below. a) Details of Investments held as at March 31, 2010 t 2010 (No. of Units) 2010 (Cost) '000 2009
Keywords: Large Cap, Small& Mid Cap, Diversified Cap Mutual Funds, Risk, Return, and Assets under Management (AUM)
") An Empirical Study on Performance of Equity Mutual Funds (With Special Reference to Large Cap, Mid Cap Funds And Diversified Funds) #Dr. Partap Singh Chahal Associate Professor, Deptt. of Management Studies,
An Empirical Study on Performance of Equity Mutual Funds (With Special Reference to Large Cap, Mid Cap Funds And Diversified Funds) #Dr. Partap Singh Chahal Associate Professor, Deptt. of Management Studies,