Year Ended March 31, 2018
|
|
|
- Aldous Walton
- 6 years ago
- Views:
Transcription
1 Year Ended March 31, 2018 Corporate Communications Group Tel: Fax: Stock Code: 4536
2 Contents Financial highlights Consolidated financial summary 2 Consolidated balance sheets summary 2 Consolidated financial indexes 2 Exchange rates 2 Consolidated information Consolidated statements of income and comprehensive income ( and Core basis) 4 Consolidated statements of income and comprehensive income () 5 Net sales/revenue details 6 Net sales/revenue by business segment 6 Overseas net sales/revenue by region 6 Overseas profit contribution 6 Net Sales/Revenue of major pharmaceuticals 7 Consolidated statement of financial position 8 Assets 8 Equity and liabilities 8 Consolidated statements of cash flows 9 Other consolidated information 10 R&D expenses 10 Capital expenditures 10 Depreciation and amortization 10 Amortization on intangible assets associated with products 10 Additional information of statement of financial position 10 Number of employees 10 Reference information Research & development 11 Pipeline of prescription pharmaceuticals (Clinical stage) 11 Changes from Q3 FY17 (February 6, 2018) 12 Pharmaceutical market in Japan 13 Revision of National Health Insurance (NHI) drug prices 13 Market shares in prescription ophthalmics 13 Market shares by therapeutic area - prescription ophthalmics 13 Stock information 14 Stock price (Tokyo Securities Exchange 1st market) 14 Major shareholders (top 10) 14 Major stock information 14 Breakdown of shareholding by number of shares 15 Breakdown of shareholding by number of shareholders 15 Consolidated subsidiaries 16 News releases 17 Santen group has unified the accounting period from the fiscal year ended March 31, 2014, for voluntary adoption of International Financial Reporting Standards () from the fiscal year ending March 31, In this data book, performance for the unification of accounting period is noted as (*), and financial results for the previous 12 month period are shown as [12month]. Financial results before the fiscal year ended March 31, 2013 are based on the previous 12 month performance. Results contained in the column marked 2014[12month] provide precise and comparable 12 month results including for subsidiaries using different fiscal year periods. The company implemented a 5-for-1 stock split on April 1, Figures in the column [] are adjusted assuming the new, post-split number of shares for comparison purposes. s in this report are based on the currently available information. s in this report are based on the currently available information. Actual results may differ materially depending on a number of factors including adverse economic conditions etc. Actual results may differ materially depending on a number of factors including adverse economic conditions, delays in new products launch, currency exchange rate, legislative and regulatory developments
3 Financial highlights Consolidated financial summary Year ended March * % Change Net sales/revenue 148, , , , , , ,000 Operating income/profit 27,414 29,878 35,374 80,180 32,479 38, ,700 Net income/net profit for the year 17,109 19,718 24,032 53,373 21,724 35, ,400 Dividends per share (yen) # Dividend payout ratio (%) (38.9) 34.6 Notes: The company implemented a 5-for-1 stock split on April 1, Dividends per share have been retrospectively adujusted to reflect the impact of the share split.. Core operating profit - 30,403 39,088 43,067 39,687 45, ,000 Core net profit for the year - 19,813 25,948 29,163 29,125 33, ,300 Consolidated statement of financial position summary Year ended March * % Change Total assets 231, , , , , , Total equity 181, , , , , , Interest-bearing debt ,161 22,484 16,963 7,618 (55.1) Consolidated financial indexes Year ended March * 2014 [12month] % Change EPS (yen) BPS (yen) #1 2, , Debt equity ratio (times) (60.1) PER (times) (34.9) PBR (times) (4.9) ROE (%) # ROA (%) Equity ratio(%) # Free cash flows (millions of yen) #2 21,172-20,807 (41,054) 13,433 1,342 32,906 2,351.1 EBITDA (millions of yen) #3 29,812-22,565 22,660 38,596 42,832 49, #1 BPS (equity per share), ROE (return on equity) and equity ratios are based on the inputs of equity per share attributable to owners of the company, net profit attributable to owners of the company, Core net profit attributable to owners of the company and equity attributable to owners of the company ratio. #2 Free cash flows = (Net cash flows from operating activities)-(capital expenditures/payments for acquisition of property, plant and equipment, and intangible assets) #3 EBITDA = : (Income before income taxes) + (Interest expense) + (Depreciation and amortization) Exchange rates : (Core profit for the year) + (Interest expense) + (Depreciation and amortization) Year ended March * [12month] Exchange rate: US dollar : Euro : CNY (Yen) - 2 -
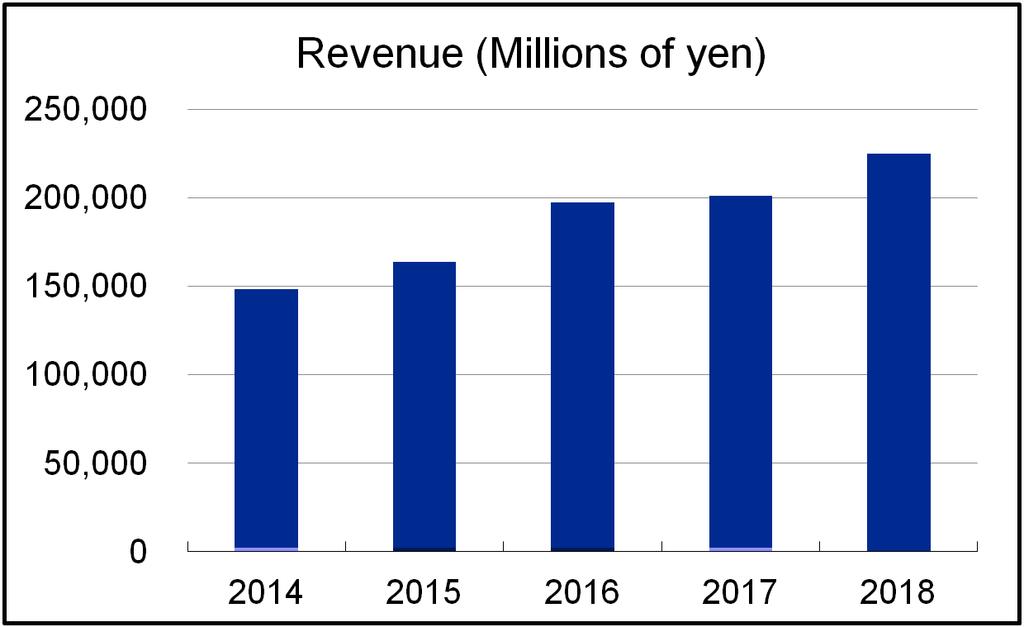
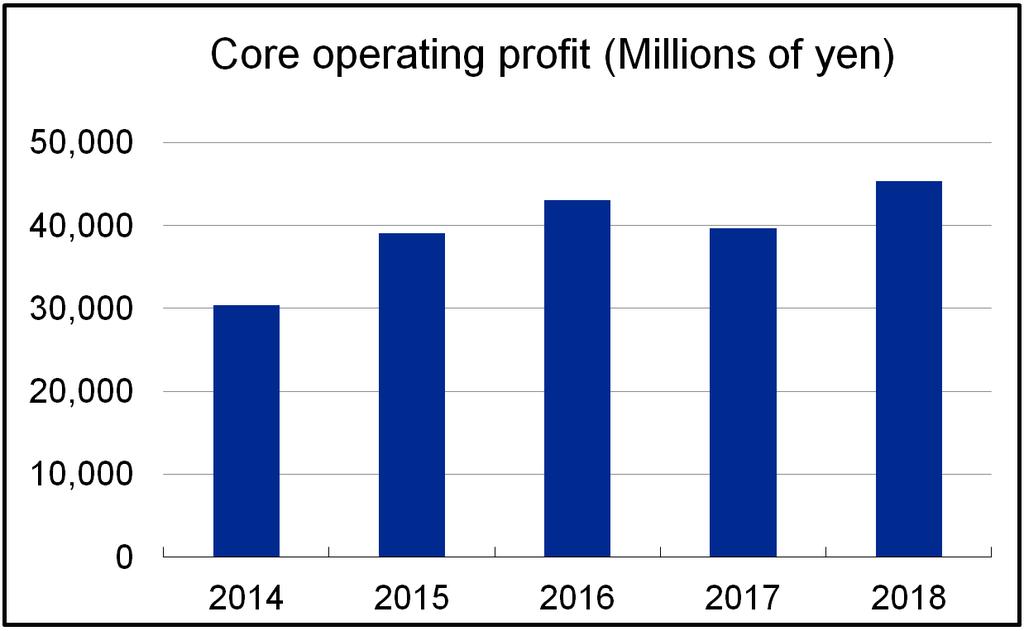
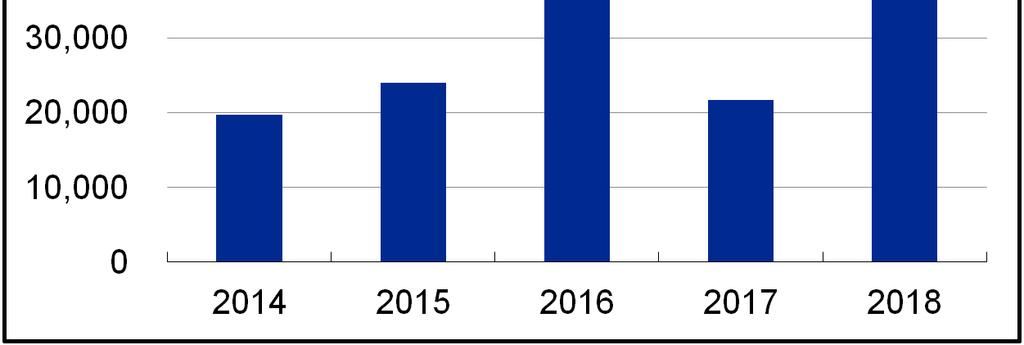
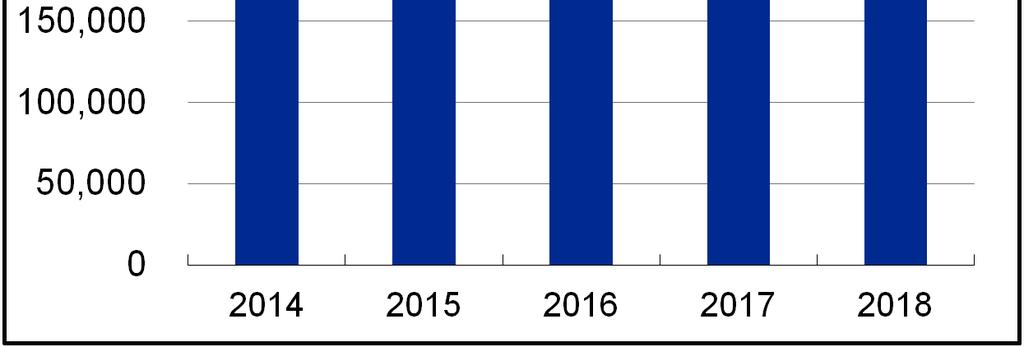
4 Financial highlights Consolidated Financial summary (Graph) - 3 -
5 Consolidated statements of income and comprehensive income Year ended March % Change 2018/2017 Revenue 161, , , , Cost of sales (56,373) (72,829) (74,966) (86,378) 15.2 (Percent of revenue) 34.8% 37.3% 37.7% 38.4% - Gross profit 105, , , , (Percent of revenue) 65.2% 62.7% 62.3% 61.6% - Selling, general and administrative expenses (48,893) (59,406) (62,193) (68,788) 10.6 (Percent of revenue) 30.2% 30.4% 31.2% 30.6% - Research and development expenses (17,477) (19,990) (22,786) (24,398) 7.1 (Percent of revenue) 10.8% 10.2% 11.4% 10.8% - Amortization on intangible assets associated with products (3,979) (6,205) (6,412) (6,740) 5.1 (Percent of revenue) 2.5% 3.2% 3.2% 3.0% - Other income , (10.9) Other expenses (458) (1,681) (728) (364) (50.0) Operating profit 35,374 80,180 32,479 38, (Percent of revenue) 21.9% 41.1% 16.3% 17.2% - Finance income ,105 1,004 (9.2) Finance expenses (279) (1,492) (3,529) (434) (87.7) Profit before tax 35,863 79,470 30,055 39, (Percent of revenue) 22.2% 40.7% 15.1% 17.5% - Income tax expenses (11,831) (26,097) (8,331) (4,000) (52.0) Net profit for the year 24,032 53,373 21,724 35, (Percent of revenue) 14.9% 27.3% 10.9% 15.7% - ROE (%) (Core basis) Year ended March % Change 2018/2017 Revenue 161, , , , Cost of sales (56,373) (72,879) (74,966) (86,378) 15.2 (Percent of revenue) 34.8% 37.3% 37.7% 38.4% - Gross profit 105, , , , (Percent of revenue) 65.2% 62.7% 62.3% 61.6% - Selling, general and administrative expenses (48,893) (59,406) (61,657) (68,788) 10.6 (Percent of revenue) 30.2% 30.4% 31.0% 30.6% - Research and development expenses (17,477) (19,990) (22,786) (24,398) 7.1 (Percent of revenue) 10.8% 10.2% 11.4% 10.8% - Operating profit 39,088 43,067 39,687 45, (Percent of revenue) 24.2% 22.1% 19.9% 20.2% - Profit before tax 39,088 43,067 39,687 45, (Percent of revenue) 24.2% 22.1% 19.9% 20.2% - Income tax expenses (13,140) (13,904) (10,562) (11,920) 12.9 Net profit for the year 25,948 29,163 29,125 33, (Percent of revenue) 16.0% 14.9% 14.6% 14.9% - ROE (%)
6 Consolidated statements of income and comprehensive income Year ended March * 2014 [12month] 2015 % Change 2016/2015 Net sales 148, , , Cost of sales 58,104 57,171 56,423 (1.3) (Percent of net sales) 39.1% 39.2% 34.9% - Gross profit 90,558 88, , (Percent of net sales) 60.9% 60.8% 65.1% - Selling, general and administrative expenses 63,144 60,006 71, (Percent of net sales) 42.5% 41.1% 44.4% - R&D expenditures 19,040 18,235 18,062 (0.9) (Percent of net sales) 12.8% 12.5% 11.2% - Operating income 27,414 28,835 33, (Percent of net sales) 18.4% 19.7% 20.7% - Non-operating income , Non-operating expenses (26.8) Ordinary income 27,924 29,332 34, (Percent of net sales) 18.8% 20.1% 21.3% - Extraordinary gain (67.2) Extraordinary loss 1,504 1, (66.1) Income before income taxes 26,893 28,792 34, (Percent of net sales) 18.1% 19.7% 21.2% - Income taxes - current 11,762 11,255 12, Income taxes - deferred (1,978) (1,385) (843) (39.1) Income before minority interests 17,109 18,922 22, Net income 17,109 18,922 22, (Percent of net sales) 11.5% 13.0% 13.9% - Income before minority interests 17,109 18,922 22, Other comprehensive income 8,269 10,188 8,708 (14.5) Comprehensive income 25,378 29,111 31,
7 Net sales/revenue details Net sales/revenue by business segment Year ended March * 2014 [12month] % Change Prescription pharmaceuticals 139, , , , , , % 214,716 Ophthalmics 127, , , , , , % 213,572 Anti-rheumatics 10,251 10,251 9,629 3, Other pharmaceuticals 1,610 1,569 6,868 5,510 1,610 1,099 (31.1)% 1,144 OTC pharmaceuticals 6,455 6,453 6,706 11,004 12,553 14, % 16,498 Medical devices 2,678 2,678 2,313 2,394 2,536 2, % 2,953 Others % 2,833 Total net sales/revenue 148, , , , , , % 237,000 [Japan] Year ended March * 2014 [12month] % Change Prescription pharmaceuticals 112, , , , , , % 139,755 Ophthalmics 101, , , , , , % 139,439 Anti-rheumatics 10,162 10,162 9,568 3, Other pharmaceuticals % 315 OTC pharmaceuticals 6,417 6,417 6,638 10,918 12,421 14, % 16,144 Medical devices 2,625 2,625 2,269 2,323 2,514 2, % 2,746 Others % 2,652 Total net sales/revenue 122, , , , , , % 161,296 (Japan sales/total sales) 82.1% 83.6% 77.1% 72.6% 73.0% 70.5% % [Overseas] Year ended March * 2014 [12month] % Change Prescription pharmaceuticals 26,459 23,843 36,884 53,271 53,451 65, % 74,962 Ophthalmics 25,616 23,010 30,714 48,379 52,265 65, % 74,132 Anti-rheumatics Other pharmaceuticals ,109 4,892 1, (62.3)% 829 OTC pharmaceuticals % 355 Medical devices % 207 Others (69.8)% 181 Total net sales/revenue 26,550 23,931 36,995 53,442 53,738 66, % 75,704 (Overseas sales/total sales) 17.9% 16.4% 22.9% 27.4% 27.0% 29.5% % Overseas net sales/revenue by region Year ended March * % Change North America 1,073 1,016 6,169 5,265 1, (74.1)% 476 EMEA #1 12,302 11,527 14,377 25,674 28,657 35, % 39,093 Asia 13,173 11,645 16,450 22,504 23,647 30, % 36,134 Total overseas net sales/revenue 26,550 24,188 36,995 53,442 53,738 66, % 75,704 Overseas profit contribution Year ended March % Change North America - (1,662) (2,033) (2,197) (3,424) (4,627) 35.1% (4,523) EMEA #1 - (81) (734) 4,781 3,514 5, % 8,794 Asia - 1,087 3,181 5,088 4,912 7, % 9,565 Total overseas profit - (656) 414 7,672 5,001 8, % 13,836 #1 Europe, the Middle East and Africa - 6 -
8 Net sales/revenue details Net sales/revenue of major pharmaceuticals Brand name Generic name/formulation Cravit levofloxacin/ophthalmic solution Tarivid ofloxacin/ophthalmic solution Tapcom tafluprost-timolol maleate/ combination ophthalmic solution Tapros tafluprost/ophthalmic solution Cosopt dorzolamide hydrochloride-timolol maleate/combination ophthalmic solution Timoptol timolol maleate/ ophthalmic solution Timoptol XE timolol maleate/ long-acting ophthalmic solution Trusopt dorzolamide hydrochloride/ ophthalmic solution Rescula isopropyl unoprostone/ ophthalmic solution Alesion epinastine hydrochloride/ ophthalmic solution Flumetholon fluorometholone/ ophthalmic solution Kary Uni pirenoxine/ ophthalmic solution Oftan Catachrom cytochrome C, adenosine, nicotinamide/ ophthalmic solution Opegan Hi sodium hyaluronate/ adjuvant for ophthalmic operations Eylea aflibercept/ soulution for intravitreal injection Therapeutic category Bacterial conjunctivitis Bacterial conjunctivitis Glaucoma Glaucoma Glaucoma Glaucoma Glaucoma Glaucoma Glaucoma Allergy Inflammation Senile cataract Senile cataract Adjuvant for ophthalmic operations Intravitreal VEGF inhibitor Region 2014* % Change 2017/2016 Total 14,210 13,584 13,399 14,250 12,884 14, ,443 Japan 8,175 8,175 6,498 5,918 4,660 4,105 (11.9) 3,415 Asia 4,670 4,139 5,423 7,001 6,980 9, ,154 EMEA 1,364 1,267 1,478 1,331 1,245 1, ,874 Total 2,040 1,924 1,910 1,761 1,541 1, ,467 Japan (9.2) 418 Asia 1, ,147 1, , ,049 Total ,534 2,798 3, ,880 Japan ,381 2,256 2, ,454 Asia EMEA , ,208 Total 12,731 12,516 12,330 15,633 16,406 17, ,883 Japan 8,957 8,957 8,329 9,168 9,592 9, ,686 Asia ,097 1,227 1, ,026 EMEA 3,221 3,040 3,185 5,368 5,587 6, ,171 Total 11,846 11,846 12,478 20,583 22,164 24, ,202 Japan 11,846 11,846 10,689 11,214 11,366 11, ,957 Asia ,493 2,669 3, ,317 EMEA ,876 8,128 9, ,928 Total 1,185 1,185 1,267 1,930 1,509 1,451 (3.8) 990 Japan 1,185 1,185 1,216 1, (18.7) 470 Asia (2.7) 112 EMEA Total 1,931 1,931 1,984 2,463 2,382 2,221 (6.8) 1,976 Japan 1,931 1,931 1,918 1,886 1,614 1,407 (12.9) 1,203 Asia EMEA Total - - 1,853 4,561 4,343 4, ,547 Japan - - 1,545 2,125 1,731 1,641 (5.2) 1,446 Asia EMEA ,990 2,342 2, ,639 Total 2,147 2,147 1,935 1,845 1,633 1,467 (10.1) 1,256 Japan 2,147 2,147 1,935 1,845 1,633 1,467 (10.1) 1,256 Total 2,103 2,103 6,698 9,483 12,235 16, ,727 Japan 2,103 2,103 6,698 9,483 12,235 16, ,727 Total 3,973 3,899 3,811 3,775 3,347 3, ,141 Japan 3,075 3,075 2,844 2,655 2,224 2,113 (5.0) 1,652 Asia ,120 1,123 1, ,490 Total 4,060 3,978 3,909 4,187 4,124 4, ,398 Japan 3,162 3,162 2,908 2,900 2,833 2,741 (3.2) 2,644 Asia ,001 1,287 1,291 1, ,755 Total - 1,605 1,850 1,870 2,224 2, ,800 EMEA - 1,605 1,850 1,870 2,224 2, ,800 Total 2,868 2,868 2,574 2,568 2,285 2, ,109 Japan 2,868 2,868 2,574 2,568 2,285 2, ,109 Total 18,757 18,757 24,886 39,988 45,155 51, ,473 Japan 18,757 18,757 24,886 39,988 45,155 51, ,473 Total 21,823 21,416 19,611 19,864 17,595 18, ,708 Hyalein sodium hyaluronate/ophthalmic solution Dry eye Japan 18,179 18,179 15,316 14,491 11,852 10,772 (9.1) 8,541 Asia 3,645 3,237 4,295 5,372 5,743 7, ,167 Total 7,938 7,938 7,895 9,631 11,940 14, ,087 Diquas Dry eye Japan 7,831 7,831 7,419 8,880 11,016 12, ,463 diquafosol sodium/ophthalmic solution Asia , ,625 Ikervis ciclosporin/ophthalmic solution Cationorm OTC pharmaceuticals Dry eye Dry eye Total ,303 2, ,880 Asia EMEA ,301 1, ,553 Total ,453 1,835 2, ,116 Asia EMEA ,141 1,439 1, ,713 North (20.4) 230 America Total 6,455 6,440 6,705 11,004 12,553 14, ,498 Japan 6,418 6,404 6,638 10,918 12,421 14, ,144 Asia Year ended March * Exchange rates : US dollar : Euro : CNY Nots: s in this report are based on the currently available information. Actual results may differ materially depending on a number of factors including adverse economic conditions, etc. (Yen) - 7 -
9 Consolidated statement of financial position Year ended March % % % % Assets Non-current assets Property, plant and equipment 29, , , , Intangible assets 84, , , , Financial assets 34, , , , Deferred tax assets 2, , , , Other non-current assets 2, , , , Total non-current assets 153, , , , Current assets Inventories 20, , , , Trade and other receivables 61, , , , Other financial assets Other current assets 2, , , , Cash and cash equivalents 65, , , , Total current assets 150, , , , Total assets 304, , , , Equity and liabilities Equity Share capital 7, , , , Capital surplus 8, , , , Treasury shares (18) (0.0) (24) (0.0) (10) (0.0) (11) (0.0) Retained earnings 178, , , , Other components of equity 17, , , , Total equity attributable to owners 211, , , , of the company Non-controlling interests , Total equity 211, , , , Liabilities Non-current liabilities Financial liabilities 25, , , , Net defined benefit liabilities 5, , , , Provisions 1, , , , Deferred tax liabilities 2, , , , Other non-current liabilities , , , Total non-current liabilities 36, , , , Current liabilities Trade and other payables 20, , , , Other financial liabilities 19, , , , Income tax payable 6, , , , Provisions 1, , , , Other current liabilities 8, , , , Total current liabilities 56, , , , Total liabilities 92, , , , Total equity and liabilities 304, , , ,
10 Consolidated statements of cash flows Year ended March Ⅰ. Cash flows from operating activities: Net profit for the year 24,032 53,373 21,724 35,261 Depreciation and amortization 6,958 9,338 9,882 10,896 Impairment losses Finance income and expenses (529) (545) 983 (327) Income tax expenses 11,831 26,097 8,331 4,000 Gain on disposal of disposal groups - (44,477) - - Decrease (increase) in trade and other receivables (7,701) (4,799) (5,489) (7,116) Decrease (increase) in inventories (521) (5,388) (4,120) (1,435) Increase (decrease) in trade and other payables 1,251 4,376 (425) 5,697 Increase (decrease) on net defined benefit liabilities 761 (3,974) (200) 285 Other 2, ,877 1,706 Subtotal 38,926 35,049 34,039 49,117 Interest received Dividends received Interest paid (82) (98) (52) (27) Income tax paid (14,087) (13,067) (23,900) (6,990) Net cash flows from (used in) operating activities 25,386 22,525 10,843 42,843 Ⅱ. Cash flows from investing activities: Payments into time deposits (84) (21) - - Proceeds from withdrawal of time deposits Payments for acquisition of investments (114) (2,210) (478) (565) Proceeds from sale and redemption of investments 4,149 2,682 1,364 2,879 Increase (decrease) through acquisition of subsidiary - - (19,064) - Payments for acquisition of property, plant and equipment (2,972) (4,299) (4,145) (3,984) Proceeds from sales of property, plant and equipment Payments for acquisition of intangible assets (63,468) (4,793) (5,355) (5,953) Proceeds on disposal of disposal groups - 45, Other (60) (25) (545) (636) Net cash flows from (used in) investing activities (61,709) 37,052 (28,201) (8,259) Ⅲ. Cash flows from financing activities: Proceeds from short-term loans payable 35, Repayments of short-term loans payable (35,000) Proceeds from long-term loans payable 40, ,000 - Repayments of long-term loans payable (2,970) (15,133) (9,524) (8,316) Acquisition of treasury shares - - (12,380) (1) Proceeds from contributions of non-controlling interests Dividends paid (8,264) (9,923) (10,751) (10,559) Other Net cash flows from (used in) financing activities 28,960 (24,066) (28,657) (17,631) Ⅳ. Net increase (decrease) in cash and cash equivalents (7,363) 35,510 (46,015) 16,953 Ⅴ. Cash and cash equivalents at the beginning of year 72,397 65,923 99,798 52,282 Ⅵ. Effect of exchange rate changes on cash and cash equivalents 889 (1,636) (1,501) 48 Ⅶ. Cash and cash equivalents at the end of period 65,923 99,798 52,282 69,
11 Other consolidated information R&D expenses Year ended March * Consolidated 19,040 17,477 19,990 22,786 24,398 25,000 Percent of net sales/revenue 12.8% 10.8% 10.2% 11.4% 10.8% 10.5% Capital expenditures Year ended March * Consolidated 3,155 5,383 4,474 5,216 5,445 7,480 Depreciation and amortization Year ended March * Manufacturing cost 1,330 1,446 1,445 1,515 1,950 2,040 Selling, general and administrative expenses ,035 1,246 1,453 1,520 R&D expenses Consolidated total 2,612 2,979 3,133 3,470 4,155 4,260 Note: Excluding amortization of intangible assets and long-term advance expense Amortization on intangible assets associated with products Year ended March * Intangible assets (Merck products) - 3,734 5,186 5,357 5,592 5,810 Intangible assets (Ikervis) Other Consolidated total - 3,979 6,205 6,412 6,740 6,930 Additional information of statement of financial position Year ended March * In-process research and development - 16,145 11,363 54,818 54,311 Investment securities 21,739 33,634 43,413 28,615 34,713 Inventories 20,031 20,133 24,996 28,502 30,636 Notes and accounts receivable 52,086 59,611 63,954 68,829 76,318 Notes and accounts payable #1 14,270 14,330 17,225 17,883 22,471 #1 Including electronically recorded monetary liabilities Number of employees Year ended March * Japan 1,903 1,923 1,915 1,975 2,015 North America EMEA # Asia Consolidated 3,072 3,230 3,463 3,667 3,805 #2 Europe, the Middle East and Africa
12 Research & development Pipeline of prescription pharmaceuticals (clinical stage) As of May 9, 2018 Generic name Dev. code Indication Original/Licensor Region P1 P2 P3 NDA Filed Approved Launched Merck Sharp & diquafosol sodium DE-089 Dry eye Dohme Corp. (U.S.) China Oct-17 A dry eye treatment which stimulates secretion of mucin and aqueous components from the corneal and conjunctival epithelium. Its mechanism of action is different from existing treatments. Launched in December 2010 in Japan. Acquired import drug license in China in October Launched in October 2013 in Korea. Launched in Vietnam in February Launched in Thailand in April Currently seeking sequential approvals for marketing in Asia. Generic name Dev. code Indication Original/Licensor Region P1 P2 P3 NDA Filed Approved Launched sirolimus DE-109 Uveitis Original U.S. Japan Europe An intravitreal injection with immunosuppressive effect, anti-angiogenic effect, etc. Planning an additional clinical trial in the U.S. NDA filed in Asia in April Generic name Dev. code Indication Original/Licensor Region P1 P2 P3 NDA Filed Approved Launched epinastine Nippon Boehringer DE-114A Allergic conjunctivitis Japan hydrochloride Ingelheim An H₁ receptor antagonist with membrane-stabilizing function, as treatment for allergic conjunctivitis. High dose drug. Started Phase 3 in Japan in May Generic name Dev. code Indication Original/Licensor Region P1 P2 P3 NDA Filed Approved Launched U.S. omidenepag Glaucoma/ Co-development DE-117 Japan Nov-17 isopropyl Ocular hypertension with Ube Industries Asia An EP2 receptor agonist with a new mechanism of action. Completed Phase 2b in the U.S. in February Filed for manufacturing and marketing approval in Japan in November Started Phase 3 in Asia in December Generic name Dev. code Indication Original/Licensor Region P1 P2 P3 NDA Filed Approved Launched Wet Age-related TRACON carotuximab DE-122 U.S. (Phase 2a) macular degeneration Pharmaceuticals An intravitreal injection of anti-endoglin antibody. Started Phase 2a in July 2017 for development in the U.S. Generic name Dev. code Indication Original/Licensor Region P1 P2 P3 NDA Filed Approved Launched Glaucoma/ ONO U.S. (Phase 2b) sepetaprost DE-126 Ocular hypertension PHARMACEUTICAL Japan (Phase 2b) A prostaglandin analogue eye drop drug product with a novel mode of action that is both FP and EP3 receptors dual agonist for the treatment of glaucoma and ocular hypertension. Started Phase 2b in the U.S. and Japan in July Generic name Dev. code Indication Original/Licensor Region P1 P2 P3 NDA Filed Approved Launched atropine sulfate DE-127 Myopia Singapore Health Services, Nanyang Technological University Muscarinic antagonist which reduces juvenile myopia progression. Started Phase 2 in Asia in November Asia Asia Apr-15 - Dev. code Indication Original/Licensor Region P1 P2 P3 NDA Filed Approved Launched - DE-128 (InnFocus Glaucoma Original U.S. (Phase 2/3) MicroShunt) Europe In August 2016, acquired InnFocus, developer of InnFocus MicroShunt. MicroShunt is a drainage implant device designed to lower and sustain intraocular pressure (IOP) for the treatment of primary open-angle glaucoma through the drainage of aqueous humor. Generic name Dev. code Indication Original/Licensor Region P1 P2 P3 NDA Filed Approved Launched DE-076B Severe keratitis in U.S. ciclosporin Original (Cyclokat) patients with dry eye Asia Dec-17 An ophthalmic emulsion to treat severe keratitis in adult patients with dry eye through an immunosuppressive effect. Cationic emulsion technology has enhanced ocular tissue absorption. Launched in Germany and England in July 2015 with successive launches following in European countries. Currently seeking sequential approvals for marketing in Asia and launched in Thailand in December Received a Notice of Non-compliance (NON) from Health Canada in April
13 Generic name Dev. code Indication Original/Licensor Region P1 P2 P3 NDA Filed Approved Launched DE-076C Vernal ciclosporin Original Europe Dec-16 (Vekacia) Keratoconjunctivitis An ophthalmic emulsion which improves vernal keratoconjunctivitis by immunosuppressive effect. Cationic emulsion technology has enhanced ocular tissue absorption. NDA filed and granted Priority Review status in Europe in December In July 2017, the Committee for Human Medicinal Products of the European Medicines Agency adopted a positive opinion, recommending the marketing authorization. Generic name Dev. code Indication Original/Licensor Region P1 P2 P3 NDA Filed Approved Launched DE-130A Glaucoma/ latanoprost Original Europe (Catioprost) Ocular hypertension An ophthalmic emulsion of a prostaglandin F2α derivative, for the treatment of glaucoma and ocular hypertension. Changes from Q3 FY17 (February 6, 2018) Dev. Code Changes DE-076B (Cyclokat) Received a Notice of Non-compliance (NON) from Health Canada in April

14 Pharmaceutical market in Japan Revision of National Health Insurance (NHI) drug prices # Industry average - mid -6% % % % # % Ophthalmic drugs - early -3% - mid -4% - high -1% - early -6% - mid -5% Santen - mid -5% - high -5% - high -1% - early -7% #2 - mid -4% (Compiled by Santen) #1 Excluding market expansion re-pricing -0.9% #2 Mid -4% price cut in 2016 excluding its impact of Eylea Revision of NHI drug prices: In Japan, drug prices are generally revised every two years to reflect their market price. The drugs marketed at lower market prices will bear larger reduction margins at the revision. Market shares in prescription ophthalmics Excluding consumption tax impact 2014 Industry average -5.6% Ophthalmic drugs high -4% Santen high -4% (Billions of yen) Year ended March Share 39.4% 40.1% 44.0% 45.5% 46.2% Market Source: Copyright 2018 IQVIA. Notes: On an NHI drug price basis. IMS-JPM ; Santen analysis based on IQVIA data. Reprinted with permission Market shares by therapeutic area - prescription ophthalmics # Source: Copyright 2018 IQVIA. IMS-JPM ; Santen analysis based on IQVIA data. Reprinted with permission (Billions of yen) Year ended March Glaucoma treatments Share 30.5% 32.1% 32.6% 32.2% 31.2% Market Corneal disease Share 70.5% 65.6% 63.4% 62.7% 62.2% treatments Market Anti-infective Share 58.5% 54.0% 49.8% 44.1% 40.0% Market Anti-allergy Share 21.2% 32.0% 36.3% 42.9% 47.9% Market Anti-VEGF Share 48.7% 48.8% 65.7% 72.4% 71.8% Market Notes: On an NHI drug price basis. *Including co-promoted product of Bayer Yakuhin, Ltd. (MAH) (Anti-VEGF Eylea) Source: Copyright 2018 IQVIA. IMS-JPM ; Santen analysis based on IQVIA data. Reprinted with permission
15 Stock information Stock price (Tokyo Securities Exchange 1st market) (Yen and thousand shares) Apr-17 May-17 Jun-17 Jul-17 Aug-17 Sep-17 Oct-17 Nov-17 Dec-17 Jan-18 Feb-18 Mar-18 Stock price: End of month 1,567 1,525 1,524 1,557 1,706 1,773 1,799 1,712 1,771 1,781 1,720 1,715 Volume 39,666 38,446 33,846 24,796 25,667 24,556 24,350 27,355 30,660 20,312 23,774 25,095 Major shareholders (top 10) As of March 31, 2018 Name Number of shares held Percent of investment Thousand shares % State Street Bank and Trust Company , Japan Trustee Service Bank, Ltd.(Trust Account) 31, The Master Trust Bank of Japan, Ltd.(Trust Account) 22, RBC IST 15 PCT Lending Account - Client Account 11, Nippon Life Insurance Company 10, The Bank of Tokyo-Mitsubishi UFJ, Ltd. 10, ONO PHARMACEUTICAL Co.,Ltd. 9, Development Bank of Japan Inc. 8, State Street Bank West Client - Treaty , Japan Trustee Service Bank, Ltd.(Trust Account 5) 7, Major stock information Year ended March Issued shares (thousands) 82,582 82, , , ,848 Treasury stock (thousands) Market Capitalization (million) 378, , , , ,731 A purchased amount of money (millions of yen) ,310 - The number of the purchased stocks (thousand shares) ,284 - Notes: The Company has conducted a 5-for-1 stock split with an effective date of April 1,
 Thousand shares Proportion (%) Thousand shares Proportion (%) Financial institutions 28,971 35.1 30,049 36.4 146,963 35.5 152,090 37.4 148,006 36.4 City & regional banks 2,270 2.8 2,262 2.")
 15,192-16,333-86,474-90,732-93,483 - Life and non-life insurance 4,290 5.2 4,196 5.1 21,016 5.1 21,455 5.3 15,810 3.9 Other financial institutions 4,829 5.8 4,862 5.")
16 Stock information Breakdown of shareholding by number of shares Year ended March # Thousand shares Proportion (%) Thousand shares Proportion (%) Thousand shares Proportion (%) Thousand shares Proportion (%) Thousand shares Proportion (%) Financial institutions 28, , , , , City & regional banks 2, , , , , Trust banks 17, , , , , (concerned in trust works) 15,192-16,333-86,474-90,732-93,483 - Life and non-life insurance 4, , , , , Other financial institutions 4, , , , , Securities firms , , , Other institutions 7, , , , , Foreign investors 37, , , , , Individual investors 7, , , , , Treasury Stock Total 82, , , , , Notes: The Company has conducted a 5-for-1 stock split with an effective date of April 1, Breakdown of shareholding by number of shareholders Year ended March Number of Proporshareholders tion (%) Number of shareholders Proportion (%) Number of shareholders Proportion (%) Number of shareholders Proportion (%) Number of shareholders Proportion (%) Financial institutions City & regional banks Trust banks Life and non-life insurance Other financial institutions Securities firms Other institutions Foreign investors Individual investors 7, , , , , Treasury stock Total 7, , , , ,
17 Consolidated subsidiaries Japan As of March 31,2018 Company name Main business Location Paid-in capital Equity owned Claire Co., Ltd. Cleaning of antidust and sterilized clothing Japan 90 million yen 100% Santen Business Services Co., Ltd. Support of indirect operations Japan 10 million yen 100% Santen Eye Care Co., Ltd. Production and marketing of pharmaceuticals Japan 10 million yen 100% North America Company name Main business Location Paid-in capital Equity owned Santen Holdings U.S. Inc. Santen Inc. Advanced Vision Science, Inc. InnFocus, Inc. Holding company for North American businesses Clinical development and business development of pharmaceuticals Development, production and marketing of medical devices Development, production of devices for glaucoma U.S.A. U.S.A. 24,784 thousand US$ 8,765 thousand US$ 100% 100% #1 U.S.A. 10 thousand US$ 100% #1 U.S.A. 2 thousand US$ 100% Santen Ventures, Inc. Investment in ventures U.S.A. 10 thousand US$ 100% #1 EMEA Company name Main business Location Paid-in capital Equity owned Santen Holdings EU B.V. Santen Oy Santen S.A.S. Santen GmbH Holdings company for EMEA business operation Clinical development, contract manufacturing, production and marketing of pharmaceuticals Clinical development and marketing of pharmaceuticals Marketing of pharmaceuticals and business development Netherlands 50 thousand euros 100% Finland France 20,000 thousand euros 1,976 thousand euros 100% #2 100% #2 Germany 25 thousand euros 100% #2 SantenPharma AB Marketing support of pharmaceuticals Sweden 500 thousand SEK 100% #2 Santen SA Headquarter of EMEA business, production and marketing of pharmaceuticals Switzerland 12,065 thousand Swiss franc 100% #2 Santen Italy S.r.l. Marketing of pharmaceuticals Italy 10 thousand euros 100% #2 2,300 thousand Santen UK Limited Marketing of pharmaceuticals UK 100% pounds #2 Santen Pharmaceutical Spain, S.L. Marketing of pharmaceuticals Spain 3 thousand euros 100% #2 SANTEN LIMITED LIABILITY COMPANY Asia Marketing support of pharmaceuticals Russia 10 thousand RUB 100% #2 Company name Main business Location Paid-in capital Equity owned Santen Pharmaceutical (China) Co., Clinical development, production and Ltd. marketing of pharmaceuticals China 3,800 million yen 100% Santen Pharmaceutical Sales and 35,000 thousand Marketing of pharmaceuticals China Marketing (Suzhou) Co., Ltd. CNY 100% #3 Chongqing Santen Kerui 200,000 thousand Production and marketing of pharmaceuticals China Pharmaceutical Co., Ltd CNY 49% #4 Santen Pharmaceutical Korea Co., Ltd. Taiwan Santen Pharmaceutical Co., Ltd. Santen India Private Limited Santen Pharmaceutical Asia Pte. Ltd. Clinical development and marketing of pharmaceuticals Marketing of pharmaceuticals Market research and clinical development of pharmaceuticals Headquarter of ASEAN business, production and marketing of pharmaceuticals Korea Taiwan India Singapore SANTEN (THAILAND) CO., LTD. Marketing of pharmaceuticals Thailand SANTEN PHARMA MALAYSIA SDN. BHD. Marketing of pharmaceuticals Malaysia SANTEN PHILIPPINES INC. Marketing of pharmaceuticals Philippines SANTEN PHARMACEUTICAL (HONG KONG) LIMITED Marketing of pharmaceuticals Hong Kong #1 Indirect investment through Santen Holdings U.S. Inc. #2 Indirect investment through Santen Holdings EU B.V. #3 Indirect investment through Santen Pharmaceutical (China) Co., Ltd. #4 Indirect investment through Santen Pharmaceutical (China) Co., Ltd., Chongqing Kerui Pharmaceutical (Group) Co., Ltd. hold 51% of share. #5 Indirect investment through Santen Pharmaceutical Asia Pte. Ltd. 29,000,000 thousand won 42,000 thousand Taiwan dollars 48,500 thousand India rupees 20,500 thousand Singapore dollars 110,000 thousand Thai baht 4,000 thousand Malaysian ringgit 43,309thousand Philippine peso 7,600 thousand HKD 100% 100% 99.9%, 0.1% #1 100% 100% #5 100% #5 100% #5 100% #5-16 -
18 News releases News releases during April 2017-March 2018 For details, please refer to our Website ( Apr Santen Announces Strategic Investment in Regenerative Patch Technologies LLC Santen announced that Santen has made an investment in Regenerative Patch Technologies LLC ( RPT ) RPT has developed proprietary technologies that can produce and subsequently deliver a monolayer of stem cell-derived retinal pigment epithelial cells on a scaffold through a minimally invasive surgical approach. 25-Apr Santen Announces U.S. FDA Filing Acceptance of New Drug Application (NDA) for Intravitreal Sirolimus (DE-109) in the Treatment of Non-Infectious Uveitis of the Posterior Segment Santen announced that the U.S. Food and Drug Administration (FDA) has accepted for review the New Drug Application (NDA) for intravitreal (IVT) sirolimus (440 µg), development code DE-109, for the treatment of non-infectious uveitis of the posterior segment (NIU-PS). The FDA has set an action date of December 24, 2017 to complete its review of the IVT sirolimus NDA, per the Prescription Drug User Fee Act (PDUFA). IVT sirolimus was granted orphan drug designation by the FDA and the European Commission (EC) in May Santen to Establish a Corporate Venture Capital Fund in the United States Santen announced plans to establish a corporate venture capital fund ( fund ) to be based in Emeryville, California, United States. The purpose of the fund is to create valuable synergies with early stage companies developing differentiated technologies as ophthalmic treatments in order to enhance Santen s R&D pipeline and contribute to our goal of improving the quality of life of patients suffering from eye diseases. 18-Jul Santen Donates to Northern Kyushu Area Disaster Relief Efforts 26-Jul Santen Receives Positive CHMP Opinion in Europe for Ciclosporin eye drops for the Treatment of Paediatric Patients with Severe Vernal Keratoconjunctivitis Santen announced that the Committee for Human Medicinal Products (CHMP) of the European Medicines Agency (EMA) has adopted a positive opinion, recommending the marketing authorization for ciclosporin 1mg/mL eye drops, emulsion, for the treatment of severe vernal keratoconjunctivitis (VKC) in paediatric populations1. 26-Jul Santen and TRACON Announce Initiation of a Phase 2a Study of DE-122 for the Treatment of Wet Age -Related Macular Degeneration Santen and TRACON Pharmaceuticals, Inc. (NASDAQ:TCON, TRACON) today announced that Santen has initiated a Phase 2a clinical study of DE-122 in patients with wet age-related macular degeneration (AMD).The initiation of the Phase 2a study triggers a US$7 million milestone payment from Santen to TRACON. 1-Aug Santen to Grant Subscription Rights to New Shares as Stock Options for Stock-Linked Remuneration 1-Sep Notice on Details of Subscription Rights to New Shares (Stock Options for Stock-Linked Remuneration) 19-Sep Santen Selected as a Member of Dow Jones Sustainability Asia Pacific Index, an Index for Socially Responsible Investment Santen announced that Santen has been selected for the Dow Jones Sustainability Asia Pacific Index (DJSI Asia Pacific), the Asia Pacific version of the Dow Jones Sustainability Indices (DJSI), one of the world s foremost indices for socially responsible investment (SRI)
19 Oct Santen to Launch on October 18 of Sante Beautéye Contact, a New OTC Eye Drop 26-Oct Santen to Participate in UN Global Compact Santen Pharmaceutical signed the UN Global Compact (UNGC) and became a registered participant on October 23, As a member of global society, Santen intends to support and practice the ten principles of the UNGC in the four areas of human rights, labour, environment, and anti-corruption in pursuit of a sustainable society. 1-Nov Santen Announces Approval of Diquas for the Treatment of Dry Eye in China November 1, 2017, Santen Pharmaceutical received an import drug license of Diquas Ophthalmic Solution (generic name: ;; hereinafter Diquas ) for the treatment of dry eye in China on October 20, Diquas was shown to improve dry eye signs. No serious ocular or systemic adverse drug reactions were found during the clinical trials. 27-Nov Santen Files for Manufacturing and Marketing Approval of Glaucoma and Ocular Hypertension Drug Candidate DE-117 (JAN: Omidenepag Isopropyl) November 27, 2017, Santen Pharmaceutical and Ube Industries, Ltd. (hereinafter, Ube Industries) filed for manufacturing and marketing approval of glaucoma and ocular hypertension treatment DE-117 (JAN: Omidenepag Isopropyl) to the Japanese Ministry of Health, Labour and Welfare on November 22, Santen and Ube Industries entered into a license and collaboration agreement with DE-117, and codeveloped DE-117 ophthalmic solution as a treatment for glaucoma and ocular hypertension. 21-Dec Santen Receives Complete Response Letter from U.S. FDA for Intravitreal Sirolimus (DE-109) December 21, 2017, the U.S. Food and Drug Administration (FDA) has issued a complete response letter for the New Drug Application (NDA) for intravitreal (IVT) sirolimus (DE-109). IVT sirolimus is an investigational therapy developed as a potential treatment for adults with noninfectious uveitis of the posterior segment, a leading cause of preventable blindness in working-age adults Feb Santen Announces Appointment of New President At the meeting of the Board of Directors held on February 20, 2018, Akira Kurokawa was selected as Representative Director, Chairman and Chief Executive Officer, and Shigeo Taniuchi as Representative Director, President and Chief Operating Officer. They all assumed their offices. 20-Feb Santen Awarded for Corporate Governance The Corporate Governance of the Year awards, established by the Japan Association of Corporate Directors in 2015, honors the companies which have achieved and maintained long term profitability by implementing good corporate governance with the ultimate goal of revitalizing the Japanese economy. 23-Feb Santen to Conduct a Public Awareness Campaign for Glaucoma During World Glaucoma Week March
20
Santen Reports Fiscal 2016 Consolidated Performance
 Santen Reports Fiscal 2016 Consolidated Performance May 10, 2017 Santen Pharmaceutical Co., Ltd. (Osaka, JAPAN, Tokyo Stock Exchange Code 4536) (Santen) today announced consolidated performance for FY16,
Third quarter dividends per share (yen) Second quarter dividends per share (yen)
 Second quarter dividends per share (yen)") [ Disclaimer : The following is meant to be an accurate translation from the original Financial Report of Santen Pharmaceutical Co., Ltd., written in Japanese, and is prepared for the information disclosure
[ Disclaimer : The following is meant to be an accurate translation from the original Financial Report of Santen Pharmaceutical Co., Ltd., written in Japanese, and is prepared for the information disclosure
(Figures are rounded down to the nearest million yen) 1. Consolidated Performance for the three months ended June 30, 2013
 1. Consolidated Performance for the three months ended June 30, 2013") [ Disclaimer: The following is meant to be an accurate translation from the original Financial Report of Santen Pharmaceutical Co., Ltd., written in ese, and is prepared for the information disclosure
[ Disclaimer: The following is meant to be an accurate translation from the original Financial Report of Santen Pharmaceutical Co., Ltd., written in ese, and is prepared for the information disclosure
(Figures are rounded down to the nearest million yen) 1. Consolidated Performance for the nine months ended December 31, 2013
 1. Consolidated Performance for the nine months ended December 31, 2013") [ Disclaimer: The following is meant to be an accurate translation from the original Financial Report of Santen Pharmaceutical Co., Ltd., written in Japanese, and is prepared for the information disclosure
[ Disclaimer: The following is meant to be an accurate translation from the original Financial Report of Santen Pharmaceutical Co., Ltd., written in Japanese, and is prepared for the information disclosure
Half Year Ended September 30, 2014 Contact:
 Half Year Ended September 30, 2014 Contact: Corporate Communication Group Tel: 06-4802-9360 Fax: 06-6359-3827 E-mail: ir@santen.co.jp Stock Code: 4536 Financial highlights 2 Consolidated financial summary
Investor Meeting on Q2 FY2017 Results
 Investor Meeting on FY2017 Results Akira Kurokawa President & CEO November 2, 2017 Copyright 2017 Santen Pharmaceutical Co., Ltd. All rights reserved. 1 Santen s Values By focusing on ophthalmology, Santen
Conference Call on Q3 FY2018 Results
 Conference Call on FY2018 Results Shigeo Taniuchi President and Chief Operating Officer February 5, 2019 Copyright 2019 Santen Pharmaceutical Co., Ltd. All rights reserved. 2 Santen s Values and Mission
Investor Meeting on FY2015 Results and FY2016 Forecast
 Investor Meeting on FY2015 Results and FY2016 Forecast Akira Kurokawa President & CEO May 12, 2016 Copyright 2016 Santen Pharmaceutical Co., Ltd. All rights reserved. Santen s Corporate Values By focusing
Investor Meeting on Q3 FY2017 Results
 Investor Meeting on FY2017 Results February 6, 2018 Copyright 2018 Santen Pharmaceutical Co., Ltd. All rights reserved. Today s Agenda 1. FY2017 Financial Results Kazuo Koshiji Senior Corporate Officer
Santen Investor Meeting FY2015 First Half Results Akira Kurokawa
 Santen Investor Meeting FY2015 First Half Results Akira Kurokawa President & CEO November 5, 2015 Santen s Corporate Values 天機に参与する Tenki ni sanyo suru By focusing our efforts on ophthalmology and related
Investor Meeting on FY2015 Third Quarter Results and Revised FY2015 Forecasts Kazuo Koshiji
 Investor Meeting on FY2015 Third Quarter Results and Revised FY2015 Forecasts Kazuo Koshiji Senior Corporate Officer Chief Financial Officer Head of Finance Division February 2, 2016 Santen s Corporate
Investor Meeting on FY 2015 First Quarter Results Kazuo Koshiji
 Investor Meeting on FY 2015 First Quarter Results Kazuo Koshiji Senior Corporate Officer Chief Financial Officer (CFO) Head of Finance Division August 4, 2015 Santen s Corporate Values 天機に参与する Tenki ni
FY 2013 Third Quarter Results. February 4, 2014 Santen Pharmaceutical Co., Ltd
 FY 2013 Third Quarter Results February 4, 2014 Santen Pharmaceutical Co., Ltd 0 Financial Results for the FY2013 Third Quarter; Financial Forecast for the FY2013; Kazuo Koshiji Corporate Officer, Head
Investor Meeting on Q1 FY2017 Results
 Investor Meeting on FY2017 Results Kazuo Koshiji Senior Corporate Officer Chief Financial Officer (CFO) Head of Finance Division August 1, 2017 Copyright 2017 Santen Pharmaceutical Co., Ltd. All rights
Investor Meeting on Q2 FY2016 Results
 Investor Meeting on Q2 FY2016 Results Akira Kurokawa President & CEO November 2016 Copyright 2016 Santen Pharmaceutical Co., Ltd. All rights reserved. Santen s Corporate Values By focusing on ophthalmology,
FY 2013 First Quarter Results. August 6, 2013 Santen Pharmaceutical Co., Ltd
 FY 2013 First Quarter Results August 6, 2013 Santen Pharmaceutical Co., Ltd 0 Consolidated Results FY2013 First Quarter Kazuo Koshiji Corporate Officer, Head of Finance & Administration Division 1 Med-term
Investor Meeting on FY2017 Results and FY2018 Forecasts
 Copyright 2018 Santen Pharmaceutical Co., Ltd. All rights reserved. Investor Meeting on FY2017 Results and FY2018 Forecasts Akira Kurokawa Chairman & Chief Executive Officer (CEO) Shigeo Taniuchi President
Investor Meeting on FY2016 First Quarter Results and FY2016 Forecasts
 Investor Meeting on FY2016 First Quarter Results and FY2016 Forecasts Kazuo Koshiji Senior Corporate Officer Chief Financial Officer (CFO) Head of Finance Division August 2, 2016 Copyright 2016 Santen
FY 2011 Third Quarter Results. February 7, 2012 Santen Pharmaceutical Co., Ltd
 FY 2011 Third Quarter Results February 7, 2012 Santen Pharmaceutical Co., Ltd 1 Consolidated Results FY2011 Third Quarter Satoshi Harada Corporate Officer Head of Administration Division 2 Medium-term
FY 2008 First Quarter Results. August 4, 2008 Santen Pharmaceutical Co., Ltd
 FY 2008 First Quarter Results August 4, 2008 Santen Pharmaceutical Co., Ltd 1 FY 2008 First Quarter Consolidated Financial Results Chief Financial Officer Yoshihiro Noutsuka Forward-looking statements:
Report and Analysis of Operating Results and Financial Condition 50 Risk Related to Our Business 54 Eleven-year Summary of Selected Financial Data 56
 Report and Analysis of Operating Results and Financial Condition 50 Risk Related to Our Business 54 Eleven-year Summary of Selected Financial Data 56 Consolidated Balance Sheets 58 Consolidated Statements
Innovation. Annual Report 2011
 Vision and Innovation Annual Report 2011 Year Ended March 31, 2011 Santen s Values Contents Consolidated Financial Highlights 6 A Message from the President and CEO 8 Special Feature: Fulfilling Unmet
Advanced and Emerging Economies Two speed Recovery
 Advanced and Emerging Economies Two speed Recovery 23 November 2 Bauhinia Foundation Research Centre Masaaki Shirakawa Governor of the Bank of Japan Slide 1 Japan s Silver Yen and Hong Kong s Silver Yuan
Driven by Core Competencies Santen is emphasizing strong fundamentals to enhance its market position and expand its product portfolio.
 ANNUAL REPORT 2003 Year ended March 31, 2003 Driven by Core Competencies Santen is emphasizing strong fundamentals to enhance its market position and expand its product portfolio. Profile Santen Pharmaceutical
1Q of FY ending December 31, (0.2) (1.9) 11.3 (0.2) (0.2) (0.2) (0.2) (1.2) (89.2) 0.1
 (1.9) 11.3 (0.2) (0.2) (0.2) (0.2) (1.2) (89.2) 0.1") August 6, ISEKI & CO., LTD. Supplementary Information to Consolidated Financial Results (April 1, June 30, ) I. Consolidated business results for the three months ended June 30, (Billions of yen, %) Year-on
August 6, ISEKI & CO., LTD. Supplementary Information to Consolidated Financial Results (April 1, June 30, ) I. Consolidated business results for the three months ended June 30, (Billions of yen, %) Year-on
Consolidated Financial Results for the Interim Period ended September 30, Consolidated Financial Forecasts for the Year ending March 2005
 Consolidated Financial Results for the Interim Period ended September 30, 2004 Consolidated Financial Forecasts for the Year ending March 2005 Ichiro Otokozawa Corporate Officer Head of Corporate Development
Aerie Pharmaceuticals Reports Third Quarter 2018 Financial Results and Provides Business Update
 Aerie Pharmaceuticals Reports Third Quarter 2018 Financial Results and Provides Business Update November 6, 2018 Conference Call and Webcast Today, November 6 th, at 5:00 p.m. ET DURHAM, N.C.--(BUSINESS
11-Year Consolidated Financial Highlights
 11-Year Consolidated Financial Highlights As of March 31, 2017 2007.3 2008.3 2009.3 2010.3 Net Sales ( million) 1,376,958 1,487,496 1,660,162 1,415,718 Operating Profit ( million) 162,315 70,048 65,204
FY2018 First Quarter Results
 FY First Quarter Results May 15, * Please be reminded that the figures shown in this presentation may be different from those shown in the financial statements as this presentation has been prepared for
:
 Financial Results for (April 1, 2008 through March 31, 2009) English Translation of the Original Japanese-Language Document May 11, 2009 Company name : ISUZU MOTORS LIMITED Stock exchange on which the
Flash Report for the Fiscal Year ended December 31, 2013 [Japan GAAP] (on a consolidated basis)
![Flash Report for the Fiscal Year ended December 31, 2013 [Japan GAAP] (on a consolidated basis)](/thumbs/91/106826542.jpg "Flash Report for the Fiscal Year ended December 31, 2013 [Japan GAAP] (on a consolidated basis)") Flash Report for the Fiscal Year ended December 31, [Japan GAAP] (on a consolidated basis) January 31, 2014 Company Name: OPT, Inc. Stock exchange listing: Tokyo Stock Code: 2389 URL http://www.opt.ne.jp/
Flash Report for the Fiscal Year ended December 31, [Japan GAAP] (on a consolidated basis) January 31, 2014 Company Name: OPT, Inc. Stock exchange listing: Tokyo Stock Code: 2389 URL http://www.opt.ne.jp/
FY2018 Third Quarter Results
 FY Third Quarter Results Yushin Soga Director and Executive Officer November 14, * Please be reminded that the figures shown in this presentation may be different from those shown in the financial statements
Financial Results for the First Six Months of the Fiscal Year Ending March 31, 2019 [J-GAAP] (Consolidated)
![Financial Results for the First Six Months of the Fiscal Year Ending March 31, 2019 [J-GAAP] (Consolidated)](/thumbs/93/113324390.jpg "Financial Results for the First Six Months of the Fiscal Year Ending March 31, 2019 [J-GAAP] (Consolidated)") Company Name: Stock exchange listed on: Financial Results for the First Six Months of the Fiscal Year Ending March 31, 2019 [J-GAAP] (Consolidated) Kintetsu World Express, Inc. (KWE) Tokyo Stock Exchange
Company Name: Stock exchange listed on: Financial Results for the First Six Months of the Fiscal Year Ending March 31, 2019 [J-GAAP] (Consolidated) Kintetsu World Express, Inc. (KWE) Tokyo Stock Exchange
Summary of Consolidated Third Quarter Financial Results for Fiscal 2007 (the Year Ending March 2008)
") Summary of Consolidated Third Quarter Financial Results for Fiscal 2007 (the Year Ending March 2008) February 14, 2008 The following statements are an English-language translation of the original Japanese-language
Summary of Consolidated Third Quarter Financial Results for Fiscal 2007 (the Year Ending March 2008) February 14, 2008 The following statements are an English-language translation of the original Japanese-language
Financial Results for FY2007 (April 1, 2006 through March 31, 2007) English Translation of the Original Japanese-Language Document
 English Translation of the Original Japanese-Language Document") Financial Results for (April 1, 2006 through March 31, 2007) English Translation of the Original Japanese-Language Document Company name : Isuzu Motors Ltd. Stock exchange on which the shares are listed
Financial Results for (April 1, 2006 through March 31, 2007) English Translation of the Original Japanese-Language Document Company name : Isuzu Motors Ltd. Stock exchange on which the shares are listed
Six months of FY ending December 31, (0.4) (1.9) 22.5 (0.4) (0.3) (0.4) (0.1) (0.4) (0.7) (2.0) 0.9 (1.
 (1.9) 22.5 (0.4) (0.3) (0.4) (0.1) (0.4) (0.7) (2.0) 0.9 (1.") November 11, ISEKI & CO., LTD. Supplementary Information to Consolidated Financial Results (April 1, September 30, ) I. Consolidated business results for the six months ended September 30, (Billions of
November 11, ISEKI & CO., LTD. Supplementary Information to Consolidated Financial Results (April 1, September 30, ) I. Consolidated business results for the six months ended September 30, (Billions of
:
 Financial Results for (April 1, 2007 through March 31, 2008) English Translation of the Original Japanese-Language Document May 12, 2008 Company name : ISUZU MOTORS LIMITED Stock exchange on which the
Consolidated Financial Statements
 Consolidated Financial Statements Consolidated Balance Sheets March 31, 18 and 17 Assets 18 17 18 Current assets: Cash and cash equivalents 47,414 41,18 $ 44,291 Notes and accounts receivable - trade Unconsolidated
Flash Report (Year ended March 31, 2006)
") April 28, 2006 Murata Manufacturing Co., Ltd. Listing Code : 6981 http://www.murata.com/ Flash Report (Year ended March 31, 2006) Selected Financial Data Years ended March 31, 2006 and 2005 / as of March
April 28, 2006 Murata Manufacturing Co., Ltd. Listing Code : 6981 http://www.murata.com/ Flash Report (Year ended March 31, 2006) Selected Financial Data Years ended March 31, 2006 and 2005 / as of March
4.1 Foreign Exchange Average Rates Pak Rupees per US Dollar
 4.1 Foreign Exchange Average Rates Pak Rupees per US Dollar PERIOD Jul. Aug. Sep. Oct. Nov. Dec. Jan. Feb. 1990-91 21.7944 21.8083 21.7944 21.8440 21.9107 21.9099 22.1296 22.2054 1991-92 24.6281 24.7185
Financial Results for the First Six Months of the Fiscal Year Ending March 31, 2017 [J-GAAP] (Consolidated)
![Financial Results for the First Six Months of the Fiscal Year Ending March 31, 2017 [J-GAAP] (Consolidated)](/thumbs/86/93348926.jpg "Financial Results for the First Six Months of the Fiscal Year Ending March 31, 2017 [J-GAAP] (Consolidated)") Company Name: Stock exchange listed on: Financial Results for the First Six Months of the Fiscal Year Ending March 31, 2017 [J-GAAP] (Consolidated) Kintetsu World Express, Inc. (KWE) Tokyo Stock Exchange
Company Name: Stock exchange listed on: Financial Results for the First Six Months of the Fiscal Year Ending March 31, 2017 [J-GAAP] (Consolidated) Kintetsu World Express, Inc. (KWE) Tokyo Stock Exchange
FY ended March 31, 2015 Restated *1. Year-on year change. Difference (forecast/ actual) FY ended December 31, December 31, 2015 Forecast *2
 FY ended December 31, December 31, 2015 Forecast *2") February 12, 2016 ISEKI & CO., LTD. Supplementary Information to Consolidated Financial Results (April 1, ) I. Consolidated business results for the fiscal year ended (Billions of yen, %) March 31, Restated
February 12, 2016 ISEKI & CO., LTD. Supplementary Information to Consolidated Financial Results (April 1, ) I. Consolidated business results for the fiscal year ended (Billions of yen, %) March 31, Restated
Forward-Looking Statements. Consolidated Financial Results for the 3rd Quarter of Fiscal Year François-Xavier Roger Chief Financial Officer
 Consolidated Financial Results for the 3rd Quarter of Fiscal Year 2014 François-Xavier Roger Chief Financial Officer February 5, 2015 Forward-Looking Statements This presentation contains forward-looking
Executive Summary of Consolidated Financial Results for the year ended March 31,2018. Yakult Honsha Co., Ltd.
 Executive Summary of Consolidated Financial Results for the year ended March 31,2018 Yakult Honsha Co., Ltd. May 10 th 2018 General outline of Consolidated financial results Total Increase in sales and
Financial Results for FY2010 (April 1, 2009 through March 31, 2010) English Translation of the Original Japanese-Language Document May 11, 2010
 English Translation of the Original Japanese-Language Document May 11, 2010") Financial Results for (April 1, 2009 through March 31, 2010) English Translation of the Original Japanese-Language Document May 11, 2010 Company name : ISUZU MOTORS LIMITED Stock exchange on which the
Financial Results for (April 1, 2009 through March 31, 2010) English Translation of the Original Japanese-Language Document May 11, 2010 Company name : ISUZU MOTORS LIMITED Stock exchange on which the
As of Mar As of Mar As of Mar As of Mar As of Mar As of Mar As of Mar.
 1. (1) Consolidated Balance Sheet / Assets (Millions of yen) 2018 2017 2016 2015 2014 2013 2012 2011 2010 2009 2008 2007 2006 2005 2004 2003 2002 2001 Cash and deposits 151,788 132,030 121,846 120,349
Notes to Consolidated Financial Statements
 1. Basis of Presenting Consolidated Financial Statements The accompanying consolidated financial statements of CASIO COMPUTER CO., LTD. ( the Company ) and its consolidated subsidiaries have been prepared
ECONOMIC BULLETIN - No. 41, NOVEMBER Statistical tables
 ECONOMIC BULLETIN - No. 41, NOVEMBER 2005 APPENDIX Appendix Statistical tables The world economy Table a1 GDP at constant prices a2 Industrial production a3 Consumer prices a4 External current account
FINANCIAL SUMMARY FOR THE FIRST QUARTER ENDED JUNE 30, 2009
 Company Name: ANRITSU CORPORATION (Code Number:6754) Listed at : Tokyo Stock Exchange URL http://www.anritsu.co.jp/ Representative: Hiromichi Toda ; President and Director Contact Person: Tetsuo Kawabe
Deutsche Global Infrastructure Fund (TOLLX)
") Global Infrastructure Fund (TOLLX) A step beyond MLPs Important risk information Any fund that concentrates in a particular segment of the market will generally be more volatile than a fund that invests
Global Infrastructure Fund (TOLLX) A step beyond MLPs Important risk information Any fund that concentrates in a particular segment of the market will generally be more volatile than a fund that invests
Overview of Principal Group Companies and Bases
 Overview of Principal Group Companies and Bases Operations in Japan Principal Established ORIX Business (Acquired) Ownership Corporate Financial Services Leasing, Lending, Other Financial Services Apr.
Financial Results for the Fiscal Year Ended March 31, 2018 [J-GAAP]
![Financial Results for the Fiscal Year Ended March 31, 2018 [J-GAAP]](/thumbs/83/87456247.jpg "Financial Results for the Fiscal Year Ended March 31, 2018 [J-GAAP]") Company Name: Stock exchange listed on: Financial Results for the Fiscal Year Ended March 31, 2018 [J-GAAP] Kintetsu World Express, Inc. (KWE) Tokyo Stock Exchange (First Section) May 11, 2018 Company
Company Name: Stock exchange listed on: Financial Results for the Fiscal Year Ended March 31, 2018 [J-GAAP] Kintetsu World Express, Inc. (KWE) Tokyo Stock Exchange (First Section) May 11, 2018 Company
B-GUIDE: Economic Outlook
 Aug-12 Apr-13 Dec-13 Aug-14 Apr-15 Dec-15 Aug-16 Apr-17 Jul-15 Nov-15 Mar-16 Jul-16 Nov-16 Mar-17 Jul-17 Quarterly Economic Outlook: Quarter 4 2017 4 January 2018 B-GUIDE: Economic Outlook The economy
Presentation for Institutional Investors (FY16 1 st Half)
") Nippon Paint Holdings Co., Ltd. Presentation for Institutional Investors (FY16 1 st Half) November 17, 2016 Nippon Paint Holdings Co., Ltd. Tetsushi Tado, President & CEO Table of Contents 1.Financial
Nippon Paint Holdings Co., Ltd. Presentation for Institutional Investors (FY16 1 st Half) November 17, 2016 Nippon Paint Holdings Co., Ltd. Tetsushi Tado, President & CEO Table of Contents 1.Financial
As of Mar As of Mar As of Mar As of Mar As of Mar As of Mar As of Mar.
 1. (1) Consolidated Balance Sheet / Assets (Millions of yen) 2015 2014 2013 2012 2011 2010 2009 2008 2007 2006 2005 2004 2003 2002 2001 Cash and deposits 120,349 110,081 90,576 79,119 88,837 85,903 66,352
Flash Report for the Fiscal Year Ended December 31, 2016 [Japan GAAP] (on a consolidated basis) February 13, 2017
![Flash Report for the Fiscal Year Ended December 31, 2016 [Japan GAAP] (on a consolidated basis) February 13, 2017](/thumbs/95/123620510.jpg "Flash Report for the Fiscal Year Ended December 31, 2016 [Japan GAAP] (on a consolidated basis) February 13, 2017") Flash Report for the Fiscal Year Ended December 31, 2016 [Japan GAAP] (on a consolidated basis) February 13, 2017 Company Name: OPT Holding, Inc. Stock Exchange Listing: Tokyo Stock Code: 2389 URL http://www.opt.ne.jp/english/holding/
Flash Report for the Fiscal Year Ended December 31, 2016 [Japan GAAP] (on a consolidated basis) February 13, 2017 Company Name: OPT Holding, Inc. Stock Exchange Listing: Tokyo Stock Code: 2389 URL http://www.opt.ne.jp/english/holding/
NASDAQ Global Index. More information about the Index can be found at
 NASDAQ Global Index The NASDAQ Global Index is a float adjusted market capitalization-weighted index designed to track the performance of global equities covering over 98% of the entire listed market capitalization
FTSE Global Equity Index Series
 FTSE Global Equity Index Series THE FTSE GLOBAL EQUITY INDEX SERIES With an unparalleled record of flexibility, transparency, consistent accuracy and the ability to meet any mandate, FTSE indices are already
Consolidated Settlement of Accounts for the Nine Months Ended December 31, 2009
 The figures for these Financial Statements are prepared in accordance with the accounting principles based on Japanese law. Accordingly, they do not necessarily match the figures in the Annual Report issued
Real Effective Exchange Rate based on CPI as Price Index for India*
 Real Effective Exchange Rate based on CPI as Price Index for India ARTICLE Real Effective Exchange Rate based on CPI as Price Index for India* Effective exchange rates are summary indicators of movements
Five-year Financial Summary (Consolidated)
") Five-year Financial Summary (Consolidated) Years ended March 31 Fiscal Year Millions of yen FY212 FY213 FY214 FY215 FY216 (Ended March 213) (Ended March 214) (Ended March 215) (Ended March 216) (Ended
Five-year Financial Summary (Consolidated) Years ended March 31 Fiscal Year Millions of yen FY212 FY213 FY214 FY215 FY216 (Ended March 213) (Ended March 214) (Ended March 215) (Ended March 216) (Ended
: Isuzu Motors Ltd. :
 FY2007 First Half Consolidated Financial Results (For the Six months ended September 30, 2006 English Translation from the Original Japanese-Language Document November 13, 2006 Company name : Isuzu Motors
Translation. Code number: 1963 Representative Title: Chairman and Chief Executive Officer Tel:
 Translation The following statements are an English-language translation of the original Japanese-language document. (All financial information has been prepared in accordance with accounting principles
Quarterly Investment Update First Quarter 2017
 Quarterly Investment Update First Quarter 2017 Market Update: A Quarter in Review March 31, 2017 CANADIAN STOCKS INTERNATIONAL STOCKS Large Cap Small Cap Growth Value Large Cap Small Cap Growth Value Emerging
CMIC HOLDINGS Co., Ltd. Consolidated Financial Results
 (Note) This translation is prepared and provided for readers' convenience only. In the event of any discrepancy between this translated document and the original Japanese document, the original document
Interim report January March 2009
 Interim report January March 2009 Vitrolife AB (publ) Strong conclusion to a record quarter Sales increased by 22 percent to SEK 71.8 (58.7) million. Calculated in local currencies growth was 4 percent.
Third Quarter of the Fiscal Year Ending December 31, 2016 Unicharm Presentation Materials for Investor Meeting
 Third Quarter of the Fiscal Year Ending December 31, 2016 Unicharm Presentation Materials for Investor Meeting November 4, 2016 Takahisa Takahara President and CEO Unicharm Corporation Projections stated
Summary of Consolidated Financial Statements for Second Quarter of Fiscal Year Ending March 31, 2019(Japan GAAP)
") Summary of Consolidated Financial Statements for Second Quarter of Fiscal Year Ending March 31, 2019(Japan GAAP) November 9, 2018 Listed Exchanges: TSE Name of Listed Company: Ishihara Sangyo Kaisha, Ltd.
Summary of Consolidated Financial Statements for Second Quarter of Fiscal Year Ending March 31, 2019(Japan GAAP) November 9, 2018 Listed Exchanges: TSE Name of Listed Company: Ishihara Sangyo Kaisha, Ltd.
Nicox 2015 Half-Year Highlights
 Nicox 2015 Half-Year Highlights Michele Garufi Sandrine Gestin Gavin Spencer Chief Executive Officer Finance Director EVP Corporate Development August 28 th, 2015 This presentation contains certain forward-looking
Selected Interest & Exchange Rates
 (51/517) Selected Interest & Exchange Rates Weekly Series of Charts May 1,199 Prepared by the FINANCIAL MARKETS SECTION DIVISION OF INTERNATIONAL FINANCE BOARD OF GOVERNORS FEDERAL RESERVE SYSTEM Washington,
2.Non-Consolidated Operating Results
 2.Non-Consolidated Operating Results (1) Results and Forecasts for Major Financial Indicators (Billions of yen) 2008.11 YOY 2009.2 Total net sales 1,144.9 107.6% 1,506.3 107.4% 1,127.6 98.5% 1,497.0 99.4%
Overview of Consolidated Financial Results for the 9 months ended December 31 st, 2012 and Full-term Forecasts for FY 3/2013
 Overview of Consolidated Financial Results for the 9 months ended December 31 st, and Full-term s for FY 3/2013 CFO and Executive Vice President Naohiro Minami *Please be reminded that the figures shown
Power. Schroder Asian Income. your way to higher yields. p.a.
 Schroder Asian Income POTENTIAL PAYOUTS 6% PAID MONT HLY* p.a. Power your way to higher yields * It is Schroder Investment Management (Singapore) Ltd s (the Manager s ) current intention to declare distributions
Ellex Medical Lasers. Investor Presentation for six months ended 31 December (prepared 17 March 2014) Tom Spurling, CEO
 Tom Spurling, CEO") Ellex Medical Lasers Investor Presentation for six months ended 31 December 2013 (prepared 17 March 2014) Tom Spurling, CEO Ellex develops, manufactures and markets lasers, ophthalmic implants and diagnostic
Ellex Medical Lasers Investor Presentation for six months ended 31 December 2013 (prepared 17 March 2014) Tom Spurling, CEO Ellex develops, manufactures and markets lasers, ophthalmic implants and diagnostic
: Yes. Net sales Operating income Ordinary income Net income. Million Yen % Million Yen % Million Yen % Million Yen %
 This document is an English translation of the original Japanese document. If there are any discrepancies between this document and the original Japanese document, the original Japanese document prevails.
1. Consolidated results for the 2nd Quarter 2009 (from April 1, 2008, to September 30, 2008) Net income per share after dilution
 Net income per share after dilution") November 14, 2008 Summary of Financial Statements Company name: Sodick Co., Ltd. Stock exchange: Tokyo Stock Exchange, 2 nd Section Code number: 6143 URL: http://www.sodick.co.jp Representative: Kazuo
November 14, 2008 Summary of Financial Statements Company name: Sodick Co., Ltd. Stock exchange: Tokyo Stock Exchange, 2 nd Section Code number: 6143 URL: http://www.sodick.co.jp Representative: Kazuo
Summary of First Quarter Business Results and Financial Report / FY2019
 Summary of First Quarter Business Results and Financial Report / Balance Sheets Page 1 Balance Sheets (Quarterly Trend) Page 2 Statements of Income Page 3 Statements of Income (Quarterly Trend) Page 4
Briefing on Financial Statements for the First Half of the Year Ending March 2016
 Briefing on Financial Statements for the First Half of the Year Ending March 216 November 12, 215 http://www.tsugami.co.jp Copyright 215 TSUGAMI CORPORATION All rights reserved. 1. Business performance
Net sales Operating income Ordinary income (27.6)
") Financial Results for the December 31, 2017 (Japanese Accounting Standards) (Consolidated) February 8, 2018 Company name : Nissan Motor Co., Ltd. Code no : 7201 (URL http://www.nissan-global.com/en/ir/)
Financial Results for the December 31, 2017 (Japanese Accounting Standards) (Consolidated) February 8, 2018 Company name : Nissan Motor Co., Ltd. Code no : 7201 (URL http://www.nissan-global.com/en/ir/)
Aerie Pharmaceuticals, Inc.
 UNITED STATES SECURITIES AND EXCHANGE COMMISSION Washington, D.C. 20549 FORM 10-Q ý QUARTERLY REPORT PURSUANT TO SECTION 13 OR 15(d) OF THE SECURITIES EXCHANGE ACT OF 1934 For the quarterly period ended
Consolidated Financial Results For the Second Quarter of the Fiscal Year Ending March 31, 2019 (For the First Six Months Ended September 30, 2018)
") Consolidated Financial Results For the Second Quarter of the Fiscal Year Ending March 31, 2019 (For the First Six Months Ended September 30, 2018) Prepared in Conformity with Generally Accepted Accounting
Consolidated Financial Results For the Second Quarter of the Fiscal Year Ending March 31, 2019 (For the First Six Months Ended September 30, 2018) Prepared in Conformity with Generally Accepted Accounting
First Quarter of the Fiscal Year Ending December 31, 2015 Unicharm Presentation Materials for Investor Meeting
 First Quarter of the Fiscal Year Ending December 31, 2015 Unicharm Presentation Materials for Investor Meeting May 8, 2015 Takahisa Takahara President and CEO Unicharm Corporation Projections stated herein
Quarterly Investment Update First Quarter 2018
 Quarterly Investment Update First Quarter 2018 Dimensional Fund Advisors Canada ULC ( DFA Canada ) is not affiliated with [insert name of Advisor]. DFA Canada is a separate and distinct company. Market
May Domestic Exports Imports. Volume Tonnes SW. MAT May-14 4, ,960 38, ,
 May 2014 Overview Table 1.1 Overview trends for Domestic, Export and Import trade Domestic Exports Imports Month Slaughter Pigmeat (Tonnes) Volume Tonnes SW Value $AUD (Million) Volume Tonnes SW Value
FY2017 Earnings Presentation. February 15, 2018 DENTSU INC.
 FY Earnings Presentation February 15, 2018 DENTSU INC. FY Annual Results Yushin Soga Director and Executive Officer February 13, 2018 * Please be reminded that the figures shown in this presentation may
Summary of Consolidated Financial Statements for the First Half of the 102th Term (Six months ended September 30, 2003)
") Summary of Consolidated Financial Statements for the First Half of the 102th Term (Six months ended September 30, 2003) November 20, 2003 Company name : Isuzu Motors Ltd. Stock exchanges on which the shares
Summary of Consolidated Financial Statements for the First Half of the 102th Term (Six months ended September 30, 2003) November 20, 2003 Company name : Isuzu Motors Ltd. Stock exchanges on which the shares
Consolidated Financial Results for the 1st Quarter of the Fiscal Year Ending March 31, 2009
 NIHON KOHDEN CORPORATION (6849) August 6, 2008 Consolidated Financial Results for the 1st Quarter of the Fiscal Year Ending March 31, 2009 Stock Exchange Listing: Head Office: Representative: Contact:
Brief Interim Consolidated Financial Report for the Year Ending March 31, 2008
 October 31, 2007 Brief Interim Consolidated Financial Report for the Year Ending March 31, 2008 Listed company name: Ariake Japan Co., Ltd. Code No.: 2815 Listing Exchanges: Tokyo, 1st Section URL: http://www.ariakejapan.com/
Power of Travel Promotion Evolution
 Power of Travel Promotion Evolution Promotion More Important than Ever Power of Promotion $7 million Median state = marketing budget FY 2014-15 OR 45 seconds worth of Super Bowl ads $100 million = Presidential
FY2017 SECOND QUARTER FINANCIAL RESULTS BRIEFING
 FY2017 SECOND QUARTER FINANCIAL RESULTS BRIEFING Nov 20, 2017 Page.01 FY2017 SECOND QUARTER FINANCIAL RESULTS BRIEFING 1. Status of the Kansai Paint Group 2. Financial Results & Forecasts 3. Regional Overview
Financial Results for Fiscal Year 2017 (Consolidated) May 9, 2018 Name of Listed Company: SHIONOGI & CO., LTD.
 May 9, 2018 Name of Listed Company: SHIONOGI & CO., LTD.") r Fiscal Year 2017 (Consolidated) May 9, 2018 Name of Listed Company: TD. Listed Exchanges: Section I of Tokyo Code: 4507 URL: http://www.shionogi.co.jp Representative: Isao Teshirogi, President and CEO
r Fiscal Year 2017 (Consolidated) May 9, 2018 Name of Listed Company: TD. Listed Exchanges: Section I of Tokyo Code: 4507 URL: http://www.shionogi.co.jp Representative: Isao Teshirogi, President and CEO
Financial Results for the Three Months Ended June 30, 2017 (Japanese Accounting Standards) (Consolidated) July 27, 2017
 (Consolidated) July 27, 2017") Financial Results for the Three Months Ended June 30, 2017 (Japanese Accounting Standards) (Consolidated) July 27, 2017 Company name : Nissan Motor Co., Ltd. Code no : 7201
Financial Results for the Three Months Ended June 30, 2017 (Japanese Accounting Standards) (Consolidated) July 27, 2017 Company name : Nissan Motor Co., Ltd. Code no : 7201
Consolidated Financial Statements for The 2nd Quarter of FY2018 (April 1, September 30, 2018)
") Second Quarter Report Period Ended September 30, 2018 Consolidated Financial Statements for The 2nd Quarter of FY2018 (April 1, 2018 - September 30, 2018) Consolidated Balance Sheets FY2017 as of Mar.
Second Quarter Report Period Ended September 30, 2018 Consolidated Financial Statements for The 2nd Quarter of FY2018 (April 1, 2018 - September 30, 2018) Consolidated Balance Sheets FY2017 as of Mar.
Financial Results for the First Quarter Ended June 30, 2015
 July 29, 2015 Company name : Nissan Motor Co., Ltd. Code no : 7201 (URL http://www.nissan-global.com/en/ir/) Representative : Carlos Ghosn, President Contact person : Joji
Selected Interest & Exchange Rates
 (51/51) Selected Interest & Exchange Rates Weekly Series of Charts February,1995 j Prepared by the FINANCIAL MARKETS SECTION DIVISION OF INTERNATIONAL FINANCE BOARD OF GOVERNORS FEDERAL RESERVE SYSTEM
Summary of Consolidated Financial Statements for Second Quarter of Fiscal Year Ending March 31, 2018(Japan GAAP)
") Summary of Consolidated Financial Statements for Second Quarter of Fiscal Year Ending March 31, 2018(Japan GAAP) November 10, 2017 Listed Exchanges: TSE Name of Listed Company: Ishihara Sangyo Kaisha,
Summary of Consolidated Financial Statements for Second Quarter of Fiscal Year Ending March 31, 2018(Japan GAAP) November 10, 2017 Listed Exchanges: TSE Name of Listed Company: Ishihara Sangyo Kaisha,
BIS International Locational Banking Statistics and International Consolidated Banking Statistics in Japan (end-june 2018)
") FOR RELEASE 8:5 A.M. September 14, 218 BIS International Locational Banking Statistics and International Consolidated Banking Statistics in Japan (end-june 218) I. BIS International Locational Banking
FOR RELEASE 8:5 A.M. September 14, 218 BIS International Locational Banking Statistics and International Consolidated Banking Statistics in Japan (end-june 218) I. BIS International Locational Banking
Supplemental Documents for Fiscal Year May 15, 2015 Nippon Suisan Kaisha, Ltd.
 Supplemental Documents for Fiscal Year 214 May 15, 215 Nippon Suisan Kaisha, Ltd. Overview of FY214 Both revenue and income increased in Marine Products and Food Products. Revenue and income decreased
A Global Economic and Market Outlook
 A Global Economic and Market Outlook Presented by Dr Chris Caton December 2008 US Housing starts and Permits 2.3 (Millions) Permits Starts 2.1 1.9 1.7 1.5 1.3 1.1 0.9 0.7 96 97 98 99 00 01 02 03 04 05
Japan growing with Asia's development - Asia-Pacific framework toward
 Chapter 2 sustainable growth growing with 's development - -Pacific framework toward Section 3 Expansion of n consumer market. Targeting to be a quality market. The section 2 confirmed while is gaining