INVESTOR PRESENTATION. March 2018
|
|
|
- Branden Daniel
- 6 years ago
- Views:
Transcription

1 INVESTOR PRESENTATION March 2018
2 DISCLAIMER Certain statements contained in this document are forward-looking statements (including objectives and trends), which address our vision of the financial condition, results of operations, strategy, expected future business and financial performance of Lagardère SCA. These data do not represent forecasts regarding Lagardère SCA results or any other performance measure, but rather trends or targets, as the case may be. When used in this document, words such as anticipate, believe, estimate, expect, may, intend, predict, hope, can, will, should, is designed to, with the intent, potential, plan and other words of similar import are intended to identify forward-looking statements. Such statements include, without limitation, projections for improvements in process and operations, revenues and operating margin growth, cash flow, performance, new products and services, current and future markets for products and services and other trend projections as well as new business opportunities. Although Lagardère SCA believes that the expectation reflected in such forward-looking statements are reasonable, such statements are not guarantees of future performance. Actual results may differ materially from the forward-looking statements as a result of a number of risks and uncertainties, many of which are outside our control, including without limitations: general economic conditions; legal, regulatory, financial and governmental risks related to the businesses; certain risks related to the media industry (including, without limitation, technological risks); the cyclical nature of some of the businesses. Please refer to the most recent Reference Document (Document de référence) filed by Lagardère SCA with the French Autorité des marchés financiers for additional information in relation to such factors, risks and uncertainties. No representation or warranty, express or implied, is made as to, and no reliance should be placed upon, the fairness, accuracy, completeness or correctness of such forward-looking statements and Lagardère SCA, as well as its affiliates, directors, advisors, employees and representatives accept no responsibility in this respect. Accordingly, we caution you against relying on forward-looking statements. The forward-looking statements abovementioned are made as of the date of this document and neither Lagardère SCA nor any of its subsidiaries undertake any obligation to update or review such forward-looking statements whether as a result of new information, future events or otherwise. Consequently neither Lagardère SCA nor any of its subsidiaries are liable for any consequences that could result from the use of any of the above statements. 2
3 TABLE OF CONTENT GROUP PROFILE slide 4 GROUP STRATEGY slide 8 slide 14 slide 18 slide 22 slide 25 GROUP PERFORMANCE slide 28 Appendix slide 38 3
4 GROUP PROFILE


")

5 A FAST-CHANGING GLOBAL ENVIRONMENT SHAPED BY 4 KEY GROWTH DRIVERS Nomadism, globalisation of travel: increase in PAX Mobility Glocalisation International offering adjusted to local specificities: shops, sport events, medias and entertainment Digital is a growth driver for content consumption (multibinge-viewing) Digitalisation Consumption Consommation Creation of a worldwide middle class, happy to travel and experience worldwide cultural products 5


6 GROUP LONG-TERM GROWTH BASED ON WORLDWIDE INCLINATION TOWARDS EXPERIENCE: TRAVEL AND CULTURE EXPERIENCES Growth in air passengers travel [in %, ] CAGR: 4.9 % Discretionary categories are showing the fastest growth North America +2.8% Europe +3.7% Middle East and Asia +7.7% Asia- Pacific +6.2% Latin America +4.6% Africa +4.2% Source: Lagardère, ACI, 2016 World Airport Traffic Forecasts. Assemblée Générale du 4 mai 2017 Travel is key for millenials & BRICs Source: Airbnb travel report


 A multi-segment")
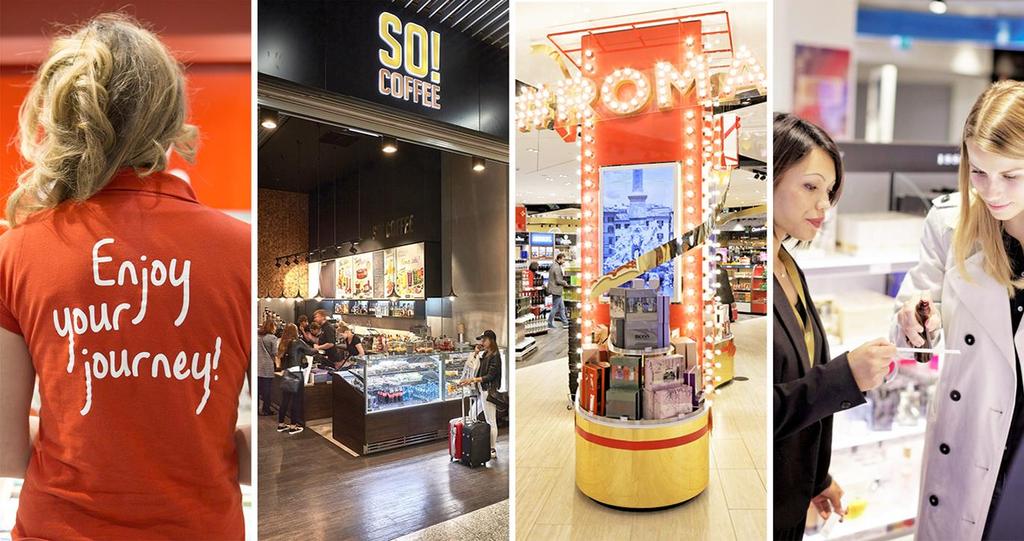
7 A DIVERSIFIED GROUP WITH LEADING BRANDS AND MARKET POSITIONS 2017 revenue breakdown by division 2017 revenue breakdown by region No. 1 in scripted TV Production in France One of France's leading Internet and mobile media groups Major player in Press and Radio in France 12% 7% Leader in football in Africa, Asia and Europe Major player in sponsorship and media rights globally Leader in golf talent management 48% 33% Latin America, Africa, Asia- Middle East Pacific 3% 9% No. 4 worldwide in Travel Retail Robust expertise in three business lines No. 3 worldwide (Trade) A multi-segment publisher A major player in the digital sector US and Canada 20% France 32% Europe 36% 7
8 GROUP STRATEGY


9 OUR STRATEGY IS FOCUSED ON LONG-TERM VALUE CREATION 1 Successful business portfolio overhaul focused on growth 2 Strategic plan focused on profitability and cash generation 3 A well-balanced, prudent financial strategy 9


10 1 SUCCESSFUL OVERHAUL OF OUR PORTFOLIO Revenue by division Major disposals Major acquisitions 7% Distribution In Hungary % 33% Distribution in Belgium and Spain Distribution in Switzerland and the US French magazines % Books 8% Lagardère Active Broadcast 5% EADS 36% * 7.4% of 20% of 25% of Le Monde Interactif International magazines Retail 2003 Press 16% French regional dailies, Virgin Megastore 2007 *Proportionate consolidation of EADS at 15.04%. Lagardère Media Distribution Services 35% 7.5% of Distribution in Germany


11 1 A BALANCED PORTFOLIO SET UP FOR GROWTH AND SUSTAINABLE CASH GENERATION Growth engine Cash generation today Low High 11


 and")

12 2 STRATEGIC PLAN FOCUSED ON PROFITABILITY AND CASH GENERATION Main factors/measures to increase profitability Cash generation fuelled by high level of investments Cost control discipline. Office and warehouse space optimized in France, in the UK and in the US. Cost synergies resulting from acquisitions. Restructuring of declining activities. Shift in business portfolio to focus on TV Production. Revenue diversification. Improved product mix and purchase conditions. Synergies resulting from acquisitions. Restructuring of the premium media rights business in Europe. Portfolio rationalization. Operating efficiency drive Operating cash flow and allocation m 68 47%: capex 12%: financial investments Consolidated recurring EBIT ( m) and operating margin (%) (6) %: ordinary dividend 11%: other* % 5.7% Lagardère Publishing Lagardère Travel Retail Lagardère Active Lagardère Sports and Entertainment Other activities *Includes mainly translation adjustments, payments of taxes and interests, dividend paid to minorities and debt variance. 12
 500m Headroom Ordinary")


13 3 A WELL BALANCED, PRUDENT FINANCIAL STRATEGY A tight rein on debt providing 500 million in investment capacity A stable dividend 3x Historical dividends ( /share) 500m Headroom Ordinary dividend per share ( ) Extra dividend per share ( ) 1,389m 1,368m ,4%** 2.2x 2.2x 31/12/ /12/2017 Leverage Ratio Net debt*/ Recurring EBITDA* *Alternative Performance Measure (APM) See Definitions on slides 50 and ,3 1,3 1, Ordinary dividend stable over the long term ( per share). Large payouts to shareholders following the one-off sale of non-strategic shareholdings. Attractive ordinary dividend yield given the current climate of low interest rates. **Dividend yield based on closing price on 06/03/

14
15 SUCCESSFUL PORTFOLIO OF PUBLISHING BUSINESSES WITH SOLID LEADING POSITIONS IN CORE MARKETS 2017 revenue by geographic area 2017 revenue by activity Other 19% France 29% Other 16% Education 16% Spain 6% Partworks 12% Illustrated Books 13% US & Canada 27% UK & Australia 19% General Literature 43% Top 3 Consumer book publishers worldwide Based on 2016 pro-forma turnover ( m) (Consumer: Trade & Education including Higher Education) 4,860 3,361 2,264 Ranking in core markets * #1 #2 #3 #4 #2 * Consumer (trading and education). Based on 2016 average exchange rates. Revenues from STM, professional markets and other activities than book publishing have been excluded when it could be isolated. Sources: Annual reports, Internal estimates, lpsos, Nielsen Bookscan. 15
 and cash flow from operations before")
 Revenue Cash flow")

16 GROWTH FUELLED BY ACQUISITION AND INTERNATIONAL DEVELOPMENT Revenue evolution ( m) and cash flow from operations before changes in working capital ( ) 2, Growth fuelled by acquisitions ( ) Revenue Cash flow from operations before changes in working capital A

17 RIDING THE DIGITAL WAVE E-books E-publishing E-books contribution to Lagardère Publishing's overall revenue: 7.9% in Reinforcing leadership: Bookouture / acquisition of Britain s leading independent e-publisher. Mobile apps Exploring new opportunities: UK mobile gaming startups acquisitions for cross-fertilization with all imprints (Neon Play / Brainbow - Peak). E-education Spearheading new educational practices: from the digital multi-support version of a textbook to enhanced classroom content including game-changing self-assessment, solutions: acquisition of Rising Stars. 17
18

 41% France 25% Duty Free & Fashion 39% * IFRS revenue, excluding")


19 HIGH GROWTH BUSINESS WITH LEADING POSITIONS IN ITS 3 SEGMENTS 2017 revenue * by geographic area 2017 revenue by activity North America 22% Asia- Pacific 12% Foodservice 17% Travel Essentials 44% EMEA (excl. France) 41% France 25% Duty Free & Fashion 39% * IFRS revenue, excluding Distribution. Top 10 Travel Retail operators worldwide Ranking in core markets bn, Duty Free & Fashion Foodservice #4 #1 Top 10 # Travel Essentials Foodservice Travel Essentials Core Duty Free Fashion in Europe Sources: Companies reports, The Moodie Report, Lagardère Travel Retail estimates 19
20 DIVERSIFIED GROWTH PATHS A strong development mainly driven by organic growth Organic Growth Gain of new concessions Late 2017 Shangai, Beijing, Wuhan: Duty Free & Fashion, Foodservice Late 2017 Dakar: Duty Free and Travel Essentials [Bridge sales growth ( m, )] 325 (94%) (6%) 20 Existing concessions 4,507 +8% May 2017 March 2017 End 2016 November 2016 December 2015 Late 2017 February 2017 Hong Kong: Liquor & Tobacco (with China Duty Free Group) Geneva: Duty Free Riyad, Dammam, Djeddah: Duty Free Poland: master concession won at Gdansk airport Abu Dhabi: Duty Free & Foodservice Expansion of existing concessions Auckland: opening of a new Duty Free store Prague: Take-over of 9 additional Duty Free stores 147 New concessions * December 2016 Rome: Food & Duty Free in Avancorpo Terminal 4,162 September 2015 Nice: opening of new T1 with an innovative food concept 2016A sales Organic growth External growth 2017A sales External Growth June 2017 Poland: acquisition of Inflight Service activities in Poland *Net of contracts terminated over the period. October 2015 US: acquisition of Paradies (present in more than 76 airports) 20


21 IMPROVEMENT OF CASH GENERATION BACKED BY A RESILIENT BUSINESS MODEL Travel Retail Cash Flow from Operations * Breakdown of Capex ** % ,8% ,3% 4,4% 4,0% ,0% 3,0% 2,0% 1,0% Growth CAPEX Renewal CAPEX % of revenue 0,0% *Travel Retail perimeter only (excluding Distribution) Cash Flow from Operations before working capital. **Capex Travel Retail, excluding Distribution. 21

22


23 A DIVERSIFIED BUSINESS MIX WITH SOLID LEADING POSITIONS 2017 revenue by geographic area 2017 revenue by activity Rest of World 17% Radio 22% Press 39% Spain 6% France 77% TV 32% Pure digital & BtoB 7% Peers Radio + TV + Internet Sound market positions #1 #1 #3 #1 Magazine publisher in France Scripted TV production in France Internet in France Youth and family TV channels in France 23


24 SUSTAIN PROFITABILITY AND DEVELOP PROMISING GROWTH DRIVERS Secure a profitable development Reinforce audiovisual activity Employment protection plan in Voluntary redundancy plan in % margin Recurring EBIT CAGR % % margin Acquisition of Grupo Boomerang TV in Spain Acquisition of Aito Media Group in Finland International development Keewu in Senegal Diffa* Vibe Radio in Abidjan LVMG in Cambodia Gulli Bil Arabi in 18 countries Focus on the strongest print media brands and diversify their sources of revenue Accelerate the development of digital through content and services e-health development *Distribution Internationale de Films Africains / International Distribution of African Movies. 24

25


26 A GLOBAL NETWORK COMBINING INTERNATIONAL EXPERTISE WITH LOCAL MARKET KNOWLEDGE 2017 revenue by geographic area 2017 revenue by activity Rest of World 24% France 20% Other 34% Media rights 20% Asia & Australia 15% Germany 22% Rest of Europe 11% UK 8% Marketing rights 46% Competitive Landscape Leading Positions #1 #1 #1 In football in Africa, Asia and Europe In sponsorship and media rights globally In golf talent management 26


 Focus on AFC & CAF next cycles Leverage our Media and Sponsorship sales network to create value for rights holders Develop our Olympic Games and")

27 A SUCCESSFUL RECOVERY PLAN TO PREPARE FOR GROWTH PRESERVING LONG TERM PARTNERSHIPS STRENGHTENING CORE SALES ACTIVITIES DEVELOPING BRAND CONSULTING AND DIGITAL SERVICES Division returned to profitability in 2014 n.m. 5.2% (33) Long-term partnerships YEARS 22 of continuous partnership with CAF > Contract until 2028 YEARS 21 of continuous partnership with AFC > Contract until 2020 Tailored partnerships 70 EUROPEAN FOOTBALL & RUGBY CLUBS Consolidate and expand comprehensive business on existing territories in Football Europe including new services (Virtual Advertising etc.) Focus on AFC & CAF next cycles Leverage our Media and Sponsorship sales network to create value for rights holders Develop our Olympic Games and major events business through long term partnerships Launch of Lagardère Plus, a global agency with a mission to transform traditional brand sponsorships into highly inventive and impactful marketing platforms: - partnership exploratory and strategy; - comprehensive digital strategies; - production & management of digital content; - mobile and tablet apps for rights-holders; - social apps & activations for rights-holders and brands; - data analysis. 27
28 GROUP PERFORMANCE IN 2017
 (1,368) -4.")
29 HIGHLIGHTS Very strong organic growth momentum in Travel Retail Solid performance from Publishing Improved Group recurring EBIT and operating margin ( m) Revenue 7,391 7,069 Group recurring EBIT* Group operating margin* 5.3% 5.7% Profit Group share Adjusted profit Group share* Free cash flow* /** Net debt* at end of year (1,389) (1,368) -4.4% consolidated +4.0% like-for-like* + 8m +0.4pts *Alternative Performance Measure (APM) See Definitions on slides 50 and 51. **Including positive impacts of 48m and 66m respectively in 2016 and 2017 attributable to interest paid/received following a change in presentation of the consolidated statement of cash flows (see note 1.1 to the consolidated financial statements for the six months ended 30 June 2017). 29
 and operating margin (%) 9.2% 9.2% 208 210 *% of revenue in 2016. 2016 2017 30")
30 LAGARDÈRE PUBLISHING: ACTIVITY 2017 revenue by geographic area 2017 revenue by activity Other 19% 17%* Spain 6% 6%* France 29% 28%* Other 16% 15%* Partworks 12% 11%* Education 16% 17%* Illustrated Books 13% 13%* US & Canada 27% 27%* UK & Australia 19% 22%* General Literature 43% 44%* Change in recurring EBIT ( m) and operating margin (%) 9.2% 9.2% *% of revenue in


")


31 LAGARDÈRE TRAVEL RETAIL: ACTIVITY 2017 revenue by geographic area 2017 revenue by activity Eastern Europe 18% 17%* US & Canada 22% 21%* Other Western Europe Italy 10% 10% 8%* 8%* Asia-Pacific 12% 10%* Spain 2% 3%* Middle East 1% 0%* France 25% 22%* Belgium 0% 11%* Travel Essentials 44% 39%* Wholesale Distribution 0% 15%* Change in recurring EBIT ( m) and operating margin (%) Foodservice 17% 14%* Duty Free & Fashion 39% 32%* 3.3% 2.9% Travel Retail Distribution 3.0% % *% of revenue in


32 LAGARDÈRE ACTIVE: ACTIVITY 2017 revenue by geographic area 2017 revenue by activity Spain 6% Rest of World 17% 7%* 17%* France 77% 76%* Radio 22% 22%* Press 39% 38%* TV 32% 32%* Change in recurring EBIT ( m) and operating margin (%) 8.5% 8.0% Pure Players & BtoB 7% 8%* *% of revenue in


 and")

33 LAGARDÈRE SPORTS AND ENTERTAINMENT: ACTIVITY 2017 revenue by geographic area 2017 revenue by activity Rest of World 24% 21%* France 20% 21%* Other 34% 35%* Media rights 20% 21%* Asia & Australia 15% 18%* Rest of Europe 11% 14%* UK 8% 8%* Germany 22% 18%* Change in recurring EBIT ( m) and operating margin (%) 5.2% Marketing rights 46% 44%* 3.9% *% of revenue in
 (261) Disposals of property, plant & equipment and intangible assets 211 160 Free cash flow*/** 464")
34 CONSOLIDATED STATEMENT OF CASH FLOWS ( m) Cash flow from operations before changes in working capital Changes in working capital 26 (90) Income taxes paid (77) (89) Net cash from operating activities* Purchases of property, plant & equipment and intangible assets (253) (261) Disposals of property, plant & equipment and intangible assets Free cash flow*/** Purchases of investments (108) (68) Disposals of investments*** Net cash from operating and investing activities Dividend paid and other (279) (143) Interest paid (54) (70) Change in net debt Net debt (1,389) (1,368) Negative change in working capital attributable to Lagardère Publishing Continued investments especially in Travel Retail Disposal of property asset *Including positive impacts of 48m and 66m respectively in 2016 and 2017 attributable to interest paid/received following a change in presentation of the consolidated statement of cash flows (see note 1.1 to the consolidated financial statements for the six months ended 30 June 2017). **Alternative Performance Measure (APM) See Definitions on slides 50 and 51. ***Including 6m of interest received in 2016 and 4m in 2017 (see note 1.1 to the consolidated financial statements for the six months ended 30 June 2017). 34

35 FINANCING POLICY Delivering a stable leverage ratio of 2.2x thanks to tight rein on debt and the favourable impact of recurring EBITDA. Strong liquidity and well distributed debt repayment schedule Leverage ratio Net debt/recurring EBITDA* 1,551m Authorised credit lines**: 1,250m 2.4x ** 1,389m 1,368m 2.2x 2.2x Cash*: 546m 375m 531m 501m 302m 499m*** 496m*** 161m 54m 297m*** 11m 31/12/ /12/ /12/2017 Available cash *Alternative Performance Measure (APM) See Definitions on slides 50 and 51. *Short-term investments and cash, excluding 21m of derivative assets. **Undrawn Group credit facility excluding authorised credit lines at divisional level. ***Bonds. 35
36 GUIDANCE
37 2018 GUIDANCE The Lagardère group expects Group recurring EBIT in 2018 to remain stable versus 2017*, at constant exchange rates. *Restated IFRS
38 APPENDIX: BUSINESS UPDATES


39 PERSEUS ACQUISITION Date of creation: 1996 Date of acquisition: 1 st April revenue: 90m Activities: Non-fiction / Backlist publishing programs 9 imprints: Avalon Books, Basic Books, DACapo Press, Public Affairs, Running Press Market Positionning: Major general trade publisher in the US Markets: US + UK EXPANSION OF NON-FICTION AND BACKLIST PUBLISHING PROGRAMS Synergies: The synergies for us will come to finding our own way out of the global Perseus infrastructure and running the business through our own infrastructure, which will take about 18 months. 39
40 KEY FEATURES AND RATIOS OF TENDER OFFERS IN THE AIRPORT TRAVEL RETAIL ENVIRONMENT Contracts are awarded through tender offer processes where travel retail operators answer RFPs on packages depending on the retail space location and / or the product line targeted Main ratios (1) Business Line Duty Free & Fashion Travel Essentials Foodservice Surface (sqm) , Capex ( /sqm) 3,000 5,000 (incl. brand contrib.) 1,000 3,000 2,000 5,000 (incl. kitchen) Length (years) Rent (% of sales) Exclusivity Most of the time supported by a Minimum Guaranteed (2) Rare (de facto in some cases) 1) Ratios 90% within standard deviation from the mean 2) MG could be fixed, indexed on traffic and/or inflation, monthly or annual Source: Lagardère Travel Retail estimates. 40
41 TRAVEL RETAIL ORGANIC GROWTH DRIVERS A favourable product mix evolution [in m, revenue@100% ] Liquor CAGR +12% CAGR +12% 2.3bn 2.9bn 3.6bn CAGR +16% 4.2bn CAGR +8.3% 4.5bn 6% 6% 6% 5% 6% Tobacco Gourmet food & confectionary Perfume & Cosmetics Fashion Food & Beverage Print 25% 24% 9% 9% 15% 16% 5% 6% 7% 10% 16% 14% 19% 17% 17% 10% 9% 9% 16% 14% 14% 10% 10% 11% 15% 20% 21% 10% 10% 8% Other 1) 17% 15% 14% 15% 14% *Other mainly includes: travel accessories, gifts & souvenirs and convenience products (phone cards, lottery, ). 41
42 GROWTH HAS BEEN DRIVEN BY THE AWARD OF MAJOR TENDER OFFERS IN ALL THREE BUSINESSES Focus on major airport tender offers won since 2014 Award date Reykjavik Krakow Hong Kong Phoenix Geneva Dakar Melbourne T4 Auckland Luxembourg Gdansk Prague Gold Coast Warsaw T1 Abu Dhabi Riyadh & Dammam & Jeddah Hong Kong 42

43 AND BY SELECTIVE M&A OPERATIONS Focus on M&A operations performed from 2014 to 2017 Paradies Closed in October PoS located in 75 airports Operations in the 3 businesses Annual sales: 480m Coffee Fellows Closed in January PoS in German train stations Operations in Foodservice Annual sales: 10m Gerzon Closed in January PoS in Schiphol airport Operations in Fashion Annual sales: 55m Saveria Closed in April PoS located at JFK T4 Operations in Fashion & Conf. Annual sales: 20m Inflight Service activities in Poland and Northern Ferries Closed in June PoS in airports and seaport Operations in Duty Free Annual sales: 20m Airest Closed in April PoS in 11 countries Operations mainly in Foodservice Annual sales: 200m 43


44 PARADIES LAGARDÈRE: CREATING A REGIONAL LEADER Overview of Paradies Lagardère Paradies Lagardère 2017 key figures #3 in North America 98 airports 6,000 employees $852m revenue A new entity managed by an experienced leadership team A brand portfolio tailor made for the North American market A unique and complementary North American footprint A strong and long-lasting relationship with landlords Source: Paradies internal data. 44
45 ABU DHABI INTERNATIONAL AIRPORT: A MAJOR STEP IN MIDDLE-EAST Overview of Abu Dhabi contract awarded Key figures 10-year contract on core duty free categories, confectionery and fine foods 13 PoS over 3,000 sqm 10-year estimated cumulated revenue: 3bn 9 Food and Beverage contracts awarded in April /50 joint venture created to bid and run operations Source: Lagardère Travel Retail internal data. Multi-category shops Le Club iconic shop 45

46 46


47 2018 SPORTS EVENTS CALENDAR st Quarter 2 nd Quarter 3 rd Quarter 4 th Quarter CHAN 2018 AFCON 2019 QUALIFIERS FOOTBALL AFRICA WOMEN AFCON SUPER CUP CHAMPIONS LEAGUE & CONFEDERATION CUP FOOTBALL EUROPE FIFA WORLD CUP 2018 AFC CHAMPIONS LEAGUE + AFC CUP FOOTBALL ASIA AFC U23 AFC WOMEN AFC U16 / U19 AFC FUTSAL AFF 2018 GOLF SINGAPORE OPEN NORDEA MASTER AUSTRALIA OPEN TENNIS ATP + WTA BASTAD & CITI OPEN WTA FINALS SINGAPORE & STOCKHOLM OPEN OLYMPIC GOLD COAST 2018 COMMONWEALTH GAMES 47

48 APPENDIX: FINANCIAL UPDATES
49 AN EXCELLENT SHAREHOLDER RETURN OVER THE LAST 5 YEARS Shareholder return* Indexes based (100 at January, 6 th 2012) Lagardère share: +108% CAC 40: +67% STOXX Europe 600 Media: +65% Lagardere CAC 40 STOXX Europe 600 Media *Source: Nasdaq IR. 49
50 DEFINITIONS (1/2) Lagardère uses alternative performance measures which serve as key measures of the Group's operating and financial performance. These indicators are tracked by the Executive Committee in order to assess performance and manage the business, as well as by investors in order to monitor the Group's operating performance, along with the financial metrics defined by the IASB. These indicators are calculated based on elements taken from the consolidated financial statements prepared under IFRS and a reconciliation with those accounting items is provided either in this presentation or in the full-year 2017 results press release. The like-for-like change in revenue is calculated by comparing: Revenue for the period adjusted for companies consolidated for the first time during the period and revenue for the prior-year period adjusted for consolidated companies divested during the period; Revenue for the prior-year period and revenue for the current period adjusted based on the exchange rates applicable in the prior-year period. Recurring EBIT. The Group's main performance indicator is recurring operating profit of fully consolidated companies (Group recurring EBIT), which is calculated as follows: Profit before finance costs and tax excluding: Gains (losses) on disposals of assets; Impairment losses on goodwill, property, plant and equipment, intangible assets and investments in equity-accounted companies; Net restructuring costs; Items related to business combinations: - Acquisition-related expenses; - Gains and losses resulting from purchase price adjustments and fair value adjustments due to changes in control; - Amortisation of acquisition-related intangible assets. Specific major disputes unrelated to the Group's operating performance; Income (loss) from equity-accounted companies before impairment losses. 50
51 DEFINITIONS (2/2) Operating Margin is calculated by dividing Recurring EBIT of fully consolidated companies (Group recurring EBIT) by revenue. Recurring EBITDA over a rolling 12-month period is calculated as recurring EBIT of fully consolidated companies (Group recurring EBIT) plus dividends received from equity-accounted companies, less amortisation and depreciation charged against intangible assets and property, plant and equipment. Adjusted profit Group share is calculated on the basis of profit - Group share, excluding non-recurring/non-operating items, net of tax and minority interests, as follows: Profit - Group share excluding: Gains (losses) on disposals of assets; Impairment losses on goodwill, property, plant and equipment, intangible assets and investments in equity-accounted companies; Net restructuring costs; Items related to business combinations: - Acquisition-related expenses; - Gains and losses resulting from purchase price adjustments and fair value adjustments due to changes in control; - Amortisation of acquisition-related intangible assets. Specific major disputes unrelated to the Group's operating performance; Tax effects of the above items, including the tax on dividends paid in France; Non-recurring changes in deferred taxes. Free cash flow is calculating as cash flow from operations plus net cash flow relating to acquisitions and disposals of intangible assets and property, plant and equipment. Net debt is calculated as the sum of the following items: Short-term investments and cash and cash equivalents, Financial instruments designated as hedges of debt, Non-current debt and Current debt. 51
52 LAGARDÈRE IR TEAM AND CALENDAR IR team details Calendar (all time is CET) Florence Lonis Chief of Investor Relations Tel: flonis@lagardere.fr Dounia Amouch Investor Relations Officer Tel: damouch@lagardere.fr 2017 General Meeting 3 May 2018 at 10:00 a.m. Publication of Q revenue 17 May 2018 at 8:00 a.m. Publication of H financial results 26 July 2018 at 5:35 p.m. Sophie Reille Assistant Tel: sreille@lagardere.fr Address: 42 rue Washington Paris - France Tickers: Bloomberg (MMB FP), Reuters (LAGA.PA) 52
INVESTOR PRESENTATION APRIL 2019
 INVESTOR PRESENTATION APRIL 2019 DISCLAIMER Certain statements contained in this document are forward-looking statements (including objectives and trends), which address our vision of the financial condition,
2017 GENERAL MEETING. Arnaud Lagardère General and Managing Partner. 4 May 2017
 2017 GENERAL MEETING Arnaud Lagardère General and Managing Partner 4 May 2017 CONTENTS 1 2 3 4 OUR MARKETS AND TRENDS OUR GROUP TODAY OUR VALUE CREATION STRATEGY OUR PERFORMANCE 5 OUR OUTLOOK 2 OUR MARKETS
Q REVENUE. 17 May 2018
 Q1 2018 REVENUE 17 May 2018 DISCLAIMER Certain statements contained in this document are forward-looking statements (including objectives and trends), which address our vision of the financial condition,
INVESTOR DAY INTRODUCTION 28 MAY 2014
 INVESTOR DAY INTRODUCTION 28 MAY 2014 INVESTOR DAY PURPOSE Over the past years, we ve been building the foundations of a better growth profile Streamlining our portfolio, with the disposal of major non-core
The Lagardère group confirms its recurring EBIT target (2) for 2018
 for 2018") Revenue up 5% like-for-like (1)/(2) to 1,555 million The Lagardère group confirms its recurring EBIT target (2) for 2018 Paris, 17 May 2018 The Lagardère group delivered 5% growth in revenue for first-quarter
Revenue up 5% like-for-like (1)/(2) to 1,555 million The Lagardère group confirms its recurring EBIT target (2) for 2018 Paris, 17 May 2018 The Lagardère group delivered 5% growth in revenue for first-quarter
Sustained revenue growth in 2017: 7,069 million, up 4.0% like-for-like (1)/(2) Fourth-quarter 2017: up 3.3% like-for-like at 1,911 million
/(2) Fourth-quarter 2017: up 3.3% like-for-like at 1,911 million") Sustained revenue growth in 2017: 7,069 million, up 4.0% like-for-like (1)/(2) up 3.3% like-for-like at 1,911 million Lagardère confirms its recurring EBIT growth target (2) for 2017 Full-year 2017: Paris,
Sustained revenue growth in 2017: 7,069 million, up 4.0% like-for-like (1)/(2) up 3.3% like-for-like at 1,911 million Lagardère confirms its recurring EBIT growth target (2) for 2017 Full-year 2017: Paris,
Sharp rise in Group recurring EBIT (1) : up 6.7% (2) to 403 million
 : up 6.7% (2) to 403 million") Sharp rise in Group recurring EBIT (1) : up 6.7% (2) to 403 million Operating margin up to 5.7% from 5.3% in 2016 Solid financial position Proposed ordinary dividend unchanged at 1.30 per share 2018 Group
Sharp rise in Group recurring EBIT (1) : up 6.7% (2) to 403 million Operating margin up to 5.7% from 5.3% in 2016 Solid financial position Proposed ordinary dividend unchanged at 1.30 per share 2018 Group
GENERAL MEETING 3 MAY Arnaud Lagardère General and Managing Partner
 GENERAL MEETING 3 MAY 2018 Arnaud Lagardère General and Managing Partner CONTENTS 1 OUR MARKETS AND THEIR TRENDS 2 OUR GROUP TODAY 3 OUR STRATEGIC VISION AND AMBITION 2 OUR MARKETS AND OUR GROUP TODAY
Lagardère revises upwards its recurring EBIT (1) for 2016: growth expected around 13% compared to 2015 (2)
 for 2016: growth expected around 13% compared to 2015 (2)") Lagardère revises upwards its recurring EBIT (1) for 2016: growth expected around 13% compared to 2015 (2) 2016 revenue: 7,391 million versus 7,193 million in 2015, up 2.5% like-for-like (3), up 2.7% on
Lagardère revises upwards its recurring EBIT (1) for 2016: growth expected around 13% compared to 2015 (2) 2016 revenue: 7,391 million versus 7,193 million in 2015, up 2.5% like-for-like (3), up 2.7% on
2017 GENERAL MEETING. Gérard Adsuar Chief Financial Officer. 4 May 2017
 2017 GENERAL MEETING Gérard Adsuar Chief Financial Officer 4 May 2017 CONTENTS 1 2 3 4 5 KEY FIGURES FOR THE GROUP 2016 PERFORMANCE BY DIVISION 2016 GROUP FINANCIAL RESULTS FINANCIAL POSITION GUIDANCE
ANNUAL GENERAL MEETING OF SHAREHOLDERS. 6 May 2014
 ANNUAL GENERAL MEETING OF SHAREHOLDERS 6 May 2014 SIGNIFICANT STRATEGIC PROGRESS IN 2013 6 May 2014 2013, A YEAR MARKED BY SIGNIFICANT STRATEGIC PROGRESS Successful disposal of minority interests in good
Sustained revenue growth, up 5.4% like-for-like. Confirmation of recurring EBIT growth target (1) for 2017 at between 5% and 8% (2).
 for 2017 at between 5% and 8% (2).") Sustained revenue growth, up 5.4% like-for-like. Confirmation of recurring EBIT growth target (1) for 2017 at between 5% and 8% (2). Revenue up 5.4% like-for-like (3) at 3,306 million Strong growth in
Sustained revenue growth, up 5.4% like-for-like. Confirmation of recurring EBIT growth target (1) for 2017 at between 5% and 8% (2). Revenue up 5.4% like-for-like (3) at 3,306 million Strong growth in
Credit Investor Presentation
 Credit Investor Presentation October 2012 Disclaimer (1/2) Certain of the statements contained in this document are not historical facts but rather are statements of future expectations and other forward-looking
2012 FULL-YEAR RESULTS. A solid financial position. Proposal to maintain dividend at 1.30 per share
 2012 FULL-YEAR RESULTS 2012 Recurring EBIT from Media activities (1) slightly above announced guidance Stable net sales: 7,370 million Recurring EBIT from Media activities: 358 million Net income - Group
Ten years of. transformation. Cliquez et modifiez le. titre
 2003-2013 Cliquez et modifiez le Ten years of titre transformation 3 May 2013 Summary 1- Exit from activities stemming from Matra 2- Transformation of Lagardère Publishing and Lagardère Services divisions
2013 FIRST-HALF RESULTS. Guidance maintained for 2013 recurring Media EBIT (1) Strong increase in recurring Media EBIT. A stronger financial situation
 Strong increase in recurring Media EBIT. A stronger financial situation") 2013 FIRST-HALF RESULTS Guidance maintained for 2013 recurring Media EBIT (1) Strong increase in recurring Media EBIT Net sales: 3,406 million, stable on a like-for-like basis (2) Growth in recurring Media
2013 FIRST-HALF RESULTS Guidance maintained for 2013 recurring Media EBIT (1) Strong increase in recurring Media EBIT Net sales: 3,406 million, stable on a like-for-like basis (2) Growth in recurring Media
Fourth quarter 2015: 2,043 million, +3.5% on a like-for-like basis and +7.4% on a reported basis
 Strong growth in 2015 with Group recurring EBIT (1) expected above target (2) 2015 sales: 7,193 million, +3.0% on a like-for-like (3) and +0.3% on a reported Fourth quarter 2015: 2,043 million, +3.5% on
2009 FULL-YEAR RESULTS
 2009 FULL-YEAR RESULTS Recurring EBIT before associates (excluding Lagardère Active) ahead of our March 2009 guidance Significant debt reduction Proposal to maintain dividend at 1.30 per share Consolidated
UPGRADE TO FULL-YEAR GUIDANCE
 2010 first-half results UPGRADE TO FULL-YEAR GUIDANCE Consolidated net sales stable: 3,716m, down 2.7% on a like-for-like basis Media recurring EBIT before associates: 183m, up 0.6%, or down 1.8% at constant
Agenda. 1. Highlights FY 2012 Results. 2. Operational Performance Priorities for Financials. 5. Conclusion
 1MARCH 2013 Legal Disclaimer Information in this presentation may involve guidance, expectations, beliefs, plans, intentions or strategies regarding the future. These forward-looking statements involve
MAISONS DU MONDE: FULL-YEAR 2018 RESULTS
 PRESS RELEASE MAISONS DU MONDE: FULL-YEAR 2018 RESULTS Strong performance in line with targets Continued solid momentum in online and international sales Focus on strategic pillars to deliver further profitable
9M 2017 Results. Ongoing strong growth and acceleration of cash flow generation. October 31, 2017
 9M 2017 Results Ongoing strong growth and acceleration of cash flow generation October 31, 2017 Legal Disclaimer Information in this presentation may involve guidance, expectations, beliefs, plans, intentions
163,28,22 230,203,96 191,191,191 0,51,153 26,173, ,219, ,64, ,160,98
 1 Legal Disclaimer Information in this presentation may involve guidance, expectations, beliefs, plans, intentions or strategies regarding the future. These forward-looking statements involve risks and
Quarterly Information. First-quarter 2013 net sales up noticeably: 1,627m, up 2.3% on a like-for-like basis (1)
") Quarterly Information First-quarter 2013 net sales up noticeably: 1,627m, up 2.3% on a like-for-like basis (1) Recurring EBIT target for Media activities (2) in 2013 maintained Paris, 14 May 2013 Strong
Quarterly Information First-quarter 2013 net sales up noticeably: 1,627m, up 2.3% on a like-for-like basis (1) Recurring EBIT target for Media activities (2) in 2013 maintained Paris, 14 May 2013 Strong
Full Year Results 2014
 Legal disclaimer Information in this presentation may involve guidance, expectations, beliefs, plans, intentions or strategies regarding the future. These forward-looking statements involve risks and uncertainties.
published % % % %
 Synergies from the Sagem Monetel merger greater than expected PRESS RELEASE 2009 ANNUAL RESULTS Solid results in 2009: Reduction of operating expenses in line with cost savings plan 15.0% EBITDA 1 margin
Pierre-Jean SIVIGNON
 AUGUST 29 th, 2013 Georges PLASSAT Pierre-Jean SIVIGNON H1 2013 Preliminary Remarks Business The Group continued to reorganize and strengthen its partnerships in Turkey, the Middle East and Africa Reorganization
HY 2017 Results. Strong growth and cash generation. July 31, 2017
 HY 2017 Results Strong growth and cash generation July 31, 2017 Legal Disclaimer Information in this presentation may involve guidance, expectations, beliefs, plans, intentions or strategies regarding
ELIOR GROUP FY RESULTS
 FY 2017-2018 RESULTS DISCLAIMER This document was prepared by Elior Group for the sole purpose of this presentation. This presentation includes only summary information and does not purport to be comprehensive.
FINAL RESULTS ANNOUNCEMENT FOR THE YEAR ENDED 31 MARCH 2010 FINANCIAL HIGHLIGHTS. Own stores number reached 764, increased by 11.
 Hong Kong Exchanges and Clearing Limited and The Stock Exchange of Hong Kong Limited take no responsibility for the contents of this announcement, make no representation as to its accuracy or completeness
Q Results. Organic growth accelerates further. May 2, 2017
 Q1 2017 Results Organic growth accelerates further May 2, 2017 Legal Disclaimer Information in this presentation may involve guidance, expectations, beliefs, plans, intentions or strategies regarding the
Strategic Review ELIOR GROUP Develop, Innovate, Accelerate. September 24, 2015
 Strategic Review 2016-2020 ELIOR GROUP 2020 Develop, Innovate, Accelerate September 24, 2015 EXECUTIVE SUMMARY 2020 STRATEGY: Develop, Innovate, Accelerate 1 2 3 ELIOR A successful growth story Track record
HY 2018 Results. Record EBITDA & free cash flow generation. August 3, 2018
 HY 2018 Results Record EBITDA & free cash flow generation August 3, 2018 Legal Disclaimer Information in this presentation may involve guidance, expectations, beliefs, plans, intentions or strategies regarding
Board of Directors Zurich, 24 March, 2009 Dufry Presentation - Full Year 2009 Results
 Dufry Presentation - Full Year 2009 Results March 2010 1 Legal Disclaimer Information in this presentation may involve guidance, expectations, beliefs, plans, intentions or strategies regarding the future.
ROADSHOW POST-Q2 & H RESULTS. September 2016
 ROADSHOW POST-Q2 & H1 2016 RESULTS September 2016 1. COMPANY OVERVIEW Rexel at a glance : Strategic partner for suppliers and customers Energy Providers Suppliers Customers Endusers Economies of scale
Full-year results Cologne, 10 March Entertain. Inform. Engage.
 Full-year results 2015 Cologne, 10 March 2016 Entertain. Inform. Engage. Agenda 1 2 3 4 2016 Full-year 2015 highlights Group financials Business update Strategy & Outlook 2016 2 Highlights 2015 in a nutshell
Agenda. 1. Highlights 9M 2013 Results. 2. Financials. 3. Conclusion
 1November 2013 Legal Disclaimer Information in this presentation may involve guidance, expectations, beliefs, plans, intentions or strategies regarding the future. These forward-looking statements involve
ACQUISITION OF HOJEIJ BRANDED FOODS. August 2018
 ACQUISITION OF HOJEIJ BRANDED FOODS August 2018 DISCLAIMER Certain statements contained in this document are forward-looking statements (including objectives and trends), which address our vision of the
Shaping our future. René Hooft Graafland. Member of the Executive Board/ CFO
 New York 6 March 2012 Disclaimer This presentation contains forward-looking statements with regard to the financial position and results of HEINEKEN s activities. These forward-looking statements are subject
REXEL. Q3 & 9-month 2009 results. November 12, 2009
 REXEL Q3 & 9-month 2009 results November 12, 2009 Q3 2009 & 9-month results Q3 and 9-month 2009 at a glance Financial review Outlook 3 Q3 & 9-month 2009 at a glance Q3 & 9-month 2009 highlights: Quarter-on-quarter
AXA. Henri de Castries. Chairman & CEO. London - October 2, Sanford C. Bernstein Strategic Decisions Conference
 AXA Henri de Castries Chairman & CEO London - October 2, 2013 Sanford C. Bernstein Strategic Decisions Conference Cautionary note concerning forward-looking statements Certain statements contained herein
MAISONS DU MONDE: FIRST-HALF 2018 RESULTS
 PRESS RELEASE MAISONS DU MONDE: FIRST-HALF 2018 RESULTS A solid first half in a challenging environment Updated full-year 2018 targets Sales up 11% to 507m including Modani, and up 9.8% at constant scope
2005 FULL YEAR RESULTS. March / April 2006
 2005 FULL YEAR RESULTS March / April 2006 DISCLAIMER Safe Harbour Statement This presentation contains forward-looking statements (made pursuant to the safe harbour provisions of the Private Securities
LafargeHolcim makes good progress in 2017; Strategy 2022 to drive growth. EPS 11.9% up on prior year excluding impairment and divestments
 Zurich, 07:00, March 2, 2018 LafargeHolcim makes good progress in 2017; Strategy 2022 to drive growth 4.7% growth in Net Sales on like-for-like basis Recurring EBITDA up 6.1% on like-for-like basis EPS
2018, another strong year: double digit growth in sales and adj. 1 EBITDA 16.9% of adj. EBITDA margin, in line with guidance
 2018 Full Year Results Press Release Paris, March 21 st, 2019 2018, another strong year: double digit growth in sales and adj. 1 EBITDA 16.9% of adj. EBITDA margin, in line with guidance Double-digit sales
2015 First-Half Results. July 30, 2015
 Certain statements contained in this document are forward-looking statements (including objectives and trends), which address our vision of the financial condition, results of operations, strategy, expected
John Menzies plc. Interim Results Presentation 14 August 2018
 John Menzies plc Interim Results Presentation 14 August 2018 Results Overview Highlights Underlying operating profit at 33.9m, up 18% at constant currency Profit progression John Menzies plc H1 underlying
Property & Casualty: Accelerating Profitable Growth
 Investor Day December 4, 2013 Property & Casualty: Accelerating Profitable Growth Jean-Laurent Granier CEO, AXA Global P&C Cautionary note concerning forward-looking statements Certain statements contained
2 August Company Announcements Office Australian Securities Exchange Limited 20 Bridge Street Sydney NSW By electronic lodgment
 2 August 2016 Company Announcements Office Australian Securities Exchange Limited 20 Bridge Street Sydney NSW 2000 By electronic lodgment Total Pages: 9 (including covering letter) Dear Sir / Madam APPENDIX
MAISONS DU MONDE: FULL-YEAR 2017 RESULTS
 PRESS RELEASE MAISONS DU MONDE: FULL-YEAR 2017 RESULTS Very good performance across the board, in line with targets Solid sales growth and profitability Excellent free cash flow generation and strong deleveraging
(Incorporated in Luxembourg with limited liability) (Stock code: 1910)
 (Stock code: 1910)") (Incorporated in Luxembourg with limited liability) (Stock code: 1910) Samsonite International S.A. Announces 2014 Final Results Double-digit Revenue and EBITDA Growth for the Fifth Consecutive Year Net
(Incorporated in Luxembourg with limited liability) (Stock code: 1910) Samsonite International S.A. Announces 2014 Final Results Double-digit Revenue and EBITDA Growth for the Fifth Consecutive Year Net
H1 08 H1 08 pro forma
 PRESS RELEASE H1 2009 RESULTS Neuilly sur Seine August 26, 2009 Strong increase in gross margin 1 to 39.2% of revenue in H1 09 (+2.5 points) Operating expenses under control Adjusted operating margin 2
New Debt Issue Investor Presentation. September 2007
 Carrefour Group Representatives Eric Reiss Chief Financial Officer Jean-Brieuc Le Tinier Director of Corporate Treasury 2 Summary Group Overview Business Strategy Financial overview Key credit strengths
Agenda. 1. Highlights FY 2013 Results. 2. Financials. 3. Conclusion
 1 March 2014 Legal Disclaimer Information in this presentation may involve guidance, expectations, beliefs, plans, intentions or strategies regarding the future. These forward-looking statements involve
Third Quarter 2017 Results: Europcar delivers strong revenue growth, notably in the leisure segment, and closes the acquisition of Buchbinder
 Note: This press release contains unaudited consolidated financial figures established under IFRS by Europcar Group s Management Board and reviewed by the Supervisory Board. Third Quarter 2017 Results:
Accelerating Performance IN THE HUMAN AGE
 Accelerating Performance IN THE HUMAN AGE Investor Presentation Forward-Looking Statement This presentation includes forward-looking statements which are subject to known and unknown risks and uncertainties.
FULL-YEAR 2017 RESULTS. 8 March 2018
 FULL-YEAR 2017 RESULTS 8 March 2018 DISCLAIMER Certain statements contained in this document are forward-looking statements (including objectives and trends), which address our vision of the financial
AEGIS GROUP PLC 2008 ANNUAL RESULTS. 19 March 2009
 AEGIS GROUP PLC 2008 ANNUAL RESULTS 19 March 2009 AGENDA OVERVIEW OF RESULTS John Napier FINANCIAL REVIEW Alicja Lesniak OUTLOOK John Napier Q&A Aegis Group plc Page 2 OVERVIEW OF RESULTS John Napier,
Elis 2017 annual results MARCH 7, 2018
 Elis 2017 annual results MARCH 7, 2018 Forward looking statements This document may contain information related to the Group s outlook. Such outlook is based on data, assumptions and estimates that the
Agenda. 1. Transaction summary and highlights. 2. Overview of Nuance. 3. Business Combination (Dufry + Nuance)
") 14 June 2014 Legal disclaimer Information in this presentation may involve guidance, expectations, beliefs, plans, intentions or strategies regarding the future. These forward-looking statements involve
14 June 2014 Legal disclaimer Information in this presentation may involve guidance, expectations, beliefs, plans, intentions or strategies regarding the future. These forward-looking statements involve
Strategy 2013 highlights. Business. segments
 1 1 2 3 4 2014 Full-year Group Business Outlook 2014 Strategy 2013 highlights financials segments update 2 1 2 3 4 Revenue Cash conversion rate YoY growth: +6.9% EBITA Margin YoY growth: +4.7% Reported
First-quarter 2018 revenue
 PRESS RELEASE First-quarter 2018 revenue - Like-for-like revenue growth of + 6.7% - 24 th straight quarter of at least + 5% growth - 2018 guidance confirmed PARIS, APRIL 24, 2018 Teleperformance, the worldwide
Q order intake and sales 19 October 2017
 Q3 2017 order intake and sales 19 October 2017 www.thalesgroup.com Q3 order intake and sales Update on implementation of IFRS 15 standard 2017 outlook Q3 2017 highlights New London underground signaling
2013 INTERIM FINANCIAL REPORT
 2013 INTERIM FINANCIAL REPORT CONTENTS 1-2013 INTERIM MANAGEMENT REPORT 1.1 SIGNIFICANT EVENTS OF THE FIRST HALF OF 2013 1.1.1 has taken legal action against Vivendi and Groupe Canal+ for the restitution
Adjusted revenue up +1.5% to 1,641.4 million. Adjusted organic revenue up +0.4%, with an accelerating Q2 at +1.5%
 H1 2017 Results Adjusted revenue up +1.5% to 1,641.4 million Adjusted organic revenue up +0.4%, with an accelerating Q2 at +1.5% Adjusted operating margin of 255.0 million, down -3.6% Adjusted EBIT, before
For personal use only
 ASX / Media release 14 February 2017 COCHLEAR FINANCIAL RESULTS FOR THE SIX MONTHS ENDED DECEMBER 2016 Positive momentum continues across all markets Net profit of $111.4m, up 19% Cochlear implant units
W W E Q 4 A N D F U L L Y E A R R E S U LT S F E B R U A R Y 8,
 W W E Q 4 A N D F U L L Y E A R 2 0 7 R E S U LT S F E B R U A R Y 8, 2 0 8 Forward-Looking Statements This presentation contains forward-looking statements pursuant to the safe harbor provisions of the
METRO QUARTERLY STATEMENT 9M/Q3 2017/18
 CONTENT 2 Overview 4 Sales, earnings and financial position 5 Earnings position of the sales lines 5 8 Real 9 Others 10 Outlook 11 Store network 12 Income statement 13 Balance sheet 15 Cash flow statement
Q Results: Stable sales at constant exchange rates Adjusted EBITDA penalized by raw material prices and currency effects
 Q1 2018 Results: Stable sales at constant exchange rates Adjusted EBITDA penalized by raw material prices and currency effects Highlights Paris, April 24, 2018 Slight organic growth of 0.1% (1), reported
Full-Year 2016 Results
 7 Full-Year 2016 Results This version published on March 24 th, 2017 solves a printing problem on page 8 of the version dated March 2 nd, 2017 and put online at this date Adjusted revenue up +5.8% to 3,392.8
Board of Directors Zurich, 24 March, 2009 Dufry Presentation 1Q10 Results
 Dufry Presentation 1Q10 Results May 2010 1 Legal Disclaimer Information in this presentation may involve guidance, expectations, beliefs, plans, intentions or strategies regarding the future. These forward-looking
Adjusted revenue down -0.5% to 1,643.3 million. Adjusted organic revenue up +4.0%, with an accelerating Q2 at +4.9%
 H1 2018 results Adjusted revenue down -0.5% to 1,643.3 million Adjusted organic revenue up +4.0%, with an accelerating Q2 at +4.9% Adjusted operating margin of 214.4 million, down -15.9% Adjusted EBIT,
FIRST-HALF 2017 RESULTS. 27 July 2017
 FIRST-HALF 2017 RESULTS 27 July 2017 Disclaimer FORWARD LOOKING STATEMENTS This presentation contains certain statements that constitute "forward-looking statements", including but not limited to statements
INTERIM REPORT FOURTH QUARTER 2017 PANDORA REPORTS 15% REVENUE GROWTH IN LOCAL CURRENCY FOR 2017 AND 37.3% EBITDA MARGIN
 PANDORA A/S Havneholmen 17-19 DK-1561 Copenhagen V Denmark Tel. +45 3672 0044 www.pandoragroup.com CVR: 28 50 51 16 No. 431 COMPANY ANNOUNCEMENT 6 February 2018 INTERIM REPORT FOURTH QUARTER 2017 PANDORA
Orange financial results
 H1 2016 Orange financial results Stéphane Richard Chairman and CEO Ramon Fernandez Deputy CEO, Chief Financial and Strategy Officer 23 February 2017 FY Disclaimer This presentation contains forward-looking
Q results. April 27, 2018
 Q1 2018 results April 27, 2018 Consolidated financial statements as of March 31, 2018 were authorized for issue by the Board of Directors held on April 26, 2018. Q118 KEY HIGHLIGHTS Q1 2018 in line with
Q results. July 28, Financial statements at June 30, 2010 were reviewed by the Supervisory Board held on July 27, 2010.
 Q2 2010 results July 28, 2010 Financial statements at June 30, 2010 were reviewed by the Supervisory Board held on July 27, 2010. 1. Q2 2010 at a glance Q2 2010 highlights Organic sales growth in Q2 (+2.3%)
Order book at 30 September 1, , %
 Press release of 26 November 2015 FAIVELEY TRANSPORT ANNOUNCES ITS 2015/16 HALF-YEAR RESULTS: SALES GROWTH: 9.5% ADJUSTED GROUP OPERATING PROFIT (a) UP 9.5% SIGNIFICANT INCREASE IN FREE CASH FLOW ANNUAL
FINANCIAL RESULTS PIERRE-JEAN SIVIGNON
 FINANCIAL RESULTS PIERRE-JEAN SIVIGNON 2 FURTHER PROFIT GROWTH IN FIRST-HALF 2015 (in m) H1 2014 (1) H1 2015 (2) Variation at constant exch. rates Variation at current exch. rates Net sales 35,870 37,739
2018 Half year results 20 July 2018
 2018 Half year results 20 July 2018 www.thalesgroup.com H1 2018 business environment Aerospace Ground transportation Defence & Security Aeronautics: positive dynamics for cockpit avionics and in-flight
For personal use only
 FY16 RESULTS BRIEFING H U G H M A R K S C H I E F E X E C U T I V E O F F I C E R G R E G B A R N E S C H I E F F I N A N C I A L O F F I C E R M I C H A E L S T E P H E N S O N C H I E F S A L E S O F
2018 Second Quarter Results. August 3, 2018
 2018 Second Quarter Results August 3, 2018 1 Disclaimer This presentation contains forward-looking statements within the meaning of the Private Securities Litigation Reform Act of 1995 (Reform Act). Forward-looking
Amundi to Consolidate its Position as European Leader with Acquisition of Pioneer Investments. Press Conference 12 December 2016
 Amundi to Consolidate its Position as European Leader with Acquisition of Pioneer Investments Press Conference 12 December 2016 Disclaimer This press release and the information contained herein do not
technicolor.com 7 JUNE 2018
 technicolor.com 7 JUNE 2018 COUNTRIES SITES REVENUES Connected Home 57% 57% 2017 2016 16% 1% 26% Production Services 18% DVD Services 24% North America 53% 2017 2016 25% 16% 52% 7% Europe, Middle-East
SPREADING PARISIAN CHIC ACROSS THE WORLD. December, 2017
 SPREADING PARISIAN CHIC ACROSS THE WORLD December, 2017 TODAY S TEAM Daniel Lalonde President & CEO Philippe Gautier CFO & Operations Director / 2 OUR INTERNATIONAL SUCCESS STORY #1 CREATION OF SANDRO
Q Results: Europcar starts the year with accelerating revenue growth, in line with the Group s strategic ambitions
 Note: this press release includes non-audited consolidated results under IFRS, as approved by the management board and reviewed by the supervisory board on May 14 th 2018 Q1 2018 Results: Europcar starts
Dynamic organic growth EBITDA margin supported by selling price increases in a context of significant purchasing cost inflation
 Third quarter 2018 results: Dynamic growth EBITDA margin supported by selling price increases in a context of significant purchasing cost inflation Press release Tarkett Group Paris, October 23, 2018 Highlights
Reception by Lagardère SCA of a binding offer for its international magazines. January 31 st, 2011
 Reception by Lagardère SCA of a binding offer for its international magazines January 31 st, 2011 1 Disclaimer Certain of the statements contained in this document are not historical facts but rather are
QUARTERLY STATEMENT Q3 / 9M 2016 / 17
 QUARTERLY STATEMENT Q3 / 9M 2016 / 17 2 3 Split of METRO GROUP completed 3 About us 3 Acquisition of around 24% of FNAC DARTY S.A. 3 Positive sales and profit performance in Q3 4 Overview 5 INTERIM GROUP
1Q 2013 INVESTOR PRESENTATION
 1Q 2013 INVESTOR PRESENTATION APRIL 2013 FORWARD-LOOKING STATEMENTS The following discussion contains forward-looking statements, including those about Nielsen s outlook and prospects, in the meaning of
PRESENTATION OF 2017 ANNUAL RESULTS
 PRESENTATION OF 2017 ANNUAL RESULTS Paris, 19 February 2018 Delivering Transformation. Together. DISCLAIMER This presentation contains forward-looking information subject to certain risks and uncertainties
GROSS PROFIT 4,500 4,000 3,500 3,000 2,500 2,000 1,500 1,000 6M 2017 FY 2013 IN MILLIONS OF CHF FY M 2017
 SIX MONTHS REPORT 2017 DUFRY AT A GLANCE TURNOVER GROSS PROFIT MARGIN 9,000 8,000 7,000 6,000 5,000 4,000 3,000 2,000 1,000 0 2013 2014 2015 2017 4,500 4,000 3,500 3,000 2,500 2,000 1,500 1,000 500 0 2013
Strengthening the economic model
 Strengthening the economic model Cécile CABANIS Executive Vice President, Chief Financial Officer Strategy and Information Systems DISCLAIMER This document is presented by Danone. It contains certain forward-looking
AMPLIFON: THE PATH OF STRONG GROWTH AND IMPROVING
 AMPLIFON: THE PATH OF STRONG GROWTH AND IMPROVING PROFITABILITY CONTINUES DOUBLE DIGIT GROWTH IN REVENUES AND SIGNIFICANT INCREASE IN PROFITABILITY STRONG CONTRIBUTION FROM ACQUISITIONS, PARTICULARLY IN
THIRD QUARTER 2017 OCTOBER 2017
 THIRD QUARTER 2017 OCTOBER 2017 DISCLAIMER Certain information contained in this document, other than historical information, may constitute forward-looking statements or unaudited financial forecasts.
2016 FULL YEAR RESULTS. February 28th, 2017
 2016 FULL YEAR RESULTS February 28th, 2017 INTRODUCTORY MATERS Forward-Looking Information This document contains certain forward-looking statements which speak only as of the date on which they are made.
For personal use only
 Click to edit Master text styles IDP Education FY16 Results Presentation Twelve months to 30 June 2016 11 February 2016 Important notice and disclaimer Click Disclaimer to edit Master text styles The material
Following is a copy of the Presentation of Results for the financial half-year ended 29 December 2012.
 20 February 2013 Company Announcements Office Australian Securities Exchange Limited 20 Bridge Street Sydney NSW 2000 By electronic lodgment Total Pages: 27 (including covering letter) PRESENTATION OF
2017 Year-End Results. March 15 th, 2018
 2017 Year-End Results March 15 th, 2018 Disclaimer This presentation contains forward-looking statements within the meaning of the Private Securities Litigation Reform Act of 1995 (Reform Act). Forward-looking
FIRST-HALF 2016 KEY FIGURES
 FIRST-HALF 2016 KEY FIGURES (in m) H1 2015 H1 2016 (1) Variation at constant exch. rates Variation at current exch. rates Net sales 37,739 36,289 +2.2% -3.8% Net sales excluding petrol 34,337 33,243 +3.2%